Concentrations of Pesticides and Pesticide Degradates … · Concentrations of Pesticides and...
20
Concentrations of Pesticides and Pesticide Degradates in the Croton River Watershed in Southeastern New York, July-September 2000 U.S. DEPARTMENT OF THE INTERIOR WRIR 02-4063 U.S. GEOLOGICAL SURVEY SEPTEMBER 2002 T hirty-seven pesticides and (or) pesticide degradates were detected in baseflow samples collected from 47 stream sites in the Croton River Watershed (374 square miles) in southeastern New York in the summer of 2000. The Croton Reservoir provides about 10 percent of New York City’s water supply. Maximum concentrations of most pesticides detected did not exceed 0.1 µg/L (micrograms per liter). This study, by the U. S. Geological Survey in cooperation with the New York State Department of Environmental Conservation, was conducted from July through September 2000 and entailed analysis of the samples for more than 150 pesticides and their degradates. Nine compounds were detected at a concentration greater than 0.10 µg/L; three of these were insecticides (diazinon, carbaryl, and imidacloprid), one was a fungicide (mycobutanil), and five were herbicides (simazine, 2,4-D, diuron, hexazinone, and 2,4-D methyl esther). Only two of these compounds (simazine and 2,4-D) were detected at a concentration exceeding 1 µg/L; the simazine concentration exceeded the New York State surface-water standard of 0.5 µg/L. Two insecticides (diazinon and azinphos-methyl) exceeded aquatic-life-protection standard in one sample each. Concentrations of three insecticides (chlorpyrifos, carbaryl, and malathion) were more than 50 percent of the aquatic-life-protection standards in one sample each. By Patrick J. Phillips and Robert W. Bod e
Transcript of Concentrations of Pesticides and Pesticide Degradates … · Concentrations of Pesticides and...

Concentrations of Pesticides and Pesticide Degradates in the Croton River Watershed in Southeastern New York, July-September 2000
U.S. DEPARTMENT OF THE INTERIOR WRIR 02-4063U.S. GEOLOGICAL SURVEY SEPTEMBER 2002
Thirty-seven pesticides and (or) pesticide degradates were detected in baseflow samples collected from 47 stream sites in the Croton River Watershed (374 square miles) in southeastern New York in the summer of 2000. The Croton
Reservoir provides about 10 percent of New York City’s water supply. Maximum concentrations of most pesticides detected did not exceed 0.1 µg/L (micrograms per liter). This study, by the U. S. Geological Survey in cooperation with the New York State Department of Environmental Conservation, was conducted from July through September 2000 and entailed analysis of the samples for more than 150 pesticides and their degradates. Nine compounds were detected at a concentration greater than 0.10 µg/L; three of these were insecticides (diazinon, carbaryl, and imidacloprid), one was a fungicide (mycobutanil), and five were herbicides (simazine, 2,4-D, diuron, hexazinone, and 2,4-D methyl esther). Only two of these compounds (simazine and 2,4-D) were detected at a concentration exceeding 1 µg/L; the simazine concentration exceeded the New York State surface-water standard of 0.5 µg/L. Two insecticides (diazinon and azinphos-methyl) exceeded aquatic-life-protection standard in one sample each. Concentrations of three insecticides (chlorpyrifos, carbaryl, and malathion) were more than 50 percent of the aquatic-life-protection standards in one sample each.
By Patrick J. Phillips and Robert W. Bode

2 3
Total concentrations of insecticides and herbicides (the sum of the concentrations, whereby all concentrations below the detection limit were set to zero), and the concentrations of the herbicide prometon and the insecticide diazinon, were highest in samples from watersheds with population densities greater than 510 per square mile (21 sites); therefore, the presence of these compounds is attributable to urban, residential, and other developed land uses.
The data obtained in this study are useful for making general comparisons among watersheds with differing land uses, but the concentrations represent baseflow conditions and, thus, are probably lower than the annual maximum concentrations in these streams. A July baseflow sample had total insecticide and fungicide concentrations of less than 0.03 µg/L, whereas a stormflow sample collected at the same site 2 weeks later had a corresponding concentration greater than 0.10 µg/L. Total herbicide concentrations for the July baseflow and stormflow samples were around 0.03 µg/L, but that for a stormflow sample collected at the same site 2 months later was greater than 20 µg/L.
INTRODUCTION
The Croton River Watershed (374 mi2 [square miles]) in southeastern New York lies directly north of New York City (fig. 1) and supplies about 10 percent of New York City’s water supply. The watershed is predominantly forested (69 percent) and about 14 percent urban, residential, commercial or industrial. Concern has arisen as to whether pesticides from the urban, residential, commercial, and industrial, and other areas are entering local streams. In 2000, the U.S. Geological Survey (USGS), in cooperation with the New York State Department of Environmental Conservation (NYSDEC), began a long-term surface-water-monitoring program to assess the presence of pesticides in streams of the Croton River Watershed and in three streams within the adjacent 13.3-mi2 Kensico watershed (fig.1). The Kensico Reservoir serves as a terminal receiving reservoir for the upstate New York City aqueducts and dominates the Kensico watershed. The three streams that drain to the Kensico Reservoir do not drain to the Croton River but were included because they are representative of general land-use conditions within the Croton River Watershed. Subsequent references to the Croton River Watershed include data from the three Kensico watershed streams.
Past research on pesticides in New York surface waters generally has focused on streams that drain agricultural lands (Phillips and others, 1998; 2000a, b; Eckhardt and Burke, 2000). Pesticides are used in agricultural
and non-agricultural lands for a variety of purposes, including control of weeds, insects, and other organisms. In nonagricultural areas pesticides are applied to lawns, gardens, golf courses, roads, parking lots, power stations, right-of-ways, railways, and buildings. Because many streams in the Croton River Watershed drain areas with urban, residential, industrial, commercial, transportation, and other developed areas, one objective of this study was to assess the presence of pesticides in streams throughout the watershed during baseflow conditions and to identify the land-use category of watersheds in which the pesticide concentrations were highest.
The study entailed sampling at 47 streams sites (fig. 1) once in July, August or September 2000. Baseflow sampling was done because it allows comparison of the overall effect of land use on pesticide concentrations among watersheds with differing land uses, and is far less costly and difficult than monitoring of pesticides at all 47 sites during stormflow conditions. A disadvantage of baseflow sampling rather than monitoring during stormflow conditions, however, is that baseflow conditions usually contain neither the maximum annual pesticide concentrations, nor the maximum number of pesticides that are potentially present in a stream. A site on the Kisco River (site 41 in table 1, fig. 1) was also sampled during stormflow conditions in late July and September, 2000. Samples from all sites were analyzed by the SH2010 (Zaugg and others, 1995) analytical method, and about half were analyzed by two newly developed methods, LC9060 (Furlong and others, 2001) and LC9002 (Sandstrom and others, 2001). The analytic methods used, population, watershed type, and land use characteristics of each site are summarized in table 1.
The study addressed a larger number of pesticides and degradates using far lower analytical detection limits than are typically used in routine pesticide monitoring. The analyses included many pesticides (including insecticides and fungicides) that are commonly used in nonagricultural settings, as well as degradation products of commonly used pesticides. The study was coordinated with a NYSDEC study of aquatic wildlife that included sampling for diatoms, macroinvertebrates, and fish at 40 of the 47 sites sampled in this study.
This report relates the occurrence and concentrations of pesticides and their degradates in summer baseflow samples from the 47 selected sites to Federal and State water-quality standards and the land-use characteristics of the corresponding watersheds. Also the report (1) evaluates which of the pesticides and pesticide degradates that can be detected by the two newly developed analytical methods are present in streams of the Croton River Watershed,

2 3
�� ������������
�������
�����������
���������������
��������
��
��
����������
���
����������
��������
��������
����������������
�������������
���
����
����������� ���� ������� ����
������
������
��������������������������������������������������������������
���������
������������
�����������
�����������
����������
���������������������
������������������
�������������
�
�
��
�
�
�
��
��
��
��
�� ��
��
��
��
��
������
����
����
��
��
��
��
����
����
����
��
��
��
��
��
��
��
�
��
�� �
��
��
������
�������
��������
��������
Figure 1. Locations of stream-sampling sites in the Croton River Watershed, N. Y., July through September 2000.

4 5
�
��������
�
��������������������������������������������������������������������������������������������������������������������������
�
�
�
������������������������������������
�
�
�
�����������
�
�
�
�����������
�
�
�
������������������������������������������������������������������������������������������������������������������������������������������������������������������������������������������������������������������������������������������������������������������
� ������������������������������������������������������������������������������������ ��������������������������������������������������������������������������������������� �����������������������������������������������������������������������������������
�
������������������
��������������������� �����������
�������������������
�����������������
�
�
�
����������
������������������
�
�
�
�
��������������������������������������������������
���������� ������������ ������
� �������� ������������������ � ���� ��� ��� ���� ��� ����� �������� ����������������� ��� ���� ��� ��� ���� ��� ����� �������� ����������������������� ��� ���� ��� ��� ���� ��� ����� �������� ������������ ����� ���� ��� ��� ��� ���� ����� �������� ��������������� � ���� ��� �� ��� ����� ����� ���������� ������������ � ���� ��� ��� ��� ���� ����� ���������� ������������� � ���� ��� ��� ��� ��� ����� ���������� ���������������������� � ���� ��� ��� ��� ��� ����� ���������� ���������������������������� � ���� ��� ��� ���� ��� ������ ���������� �������������������������� � ���� ��� ���� ���� � ������ ���������� ������������������ ��� ���� ��� ���� ���� ��� ������ ���������� ������������������������� � ���� ��� ��� ��� ���� ������ ���������� ����������������� ����� ���� ��� ��� ���� ���� ������ ���������� �������������� ����� ���� ��� ���� ���� ��� ������ �������� ������������� � ���� ��� ��� ���� ���� ����
�� ���������� ���������������������������������������� � ��� ��� ��� ��� ��� ����
�� �������� ������������������������ � ���� ��� ��� ���� ��� ������ �������� ������������������ ����� ���� ��� ��� ��� ��� ������ �������� ������������������ ����� ���� ��� ��� ��� ��� ������ ���������� �������������������������� � ���� ��� ��� ��� ��� ������ ���������� ������������������������������������ � ���� ��� ��� ���� ��� ������ �������� ���������������������������� ����� ���� ��� ��� ����� ��� ����
�� �������� ��������������������������������������������� ����� ���� ��� ��� ���� ��� ����
�� �������� �������������� � ���� ��� ��� ���� ��� ������ �������� �������������������������������������� ����� ���� ��� ��� ���� ���� ������ �������� ����������������������������� ����� ���� ��� ��� ���� ���� ������ �������� ������������ � ���� ��� ��� ��� ��� ������ �������� �������������������������������� � ���� ��� ��� ���� ���� ������ �������� ��������������������������� ����� ���� ��� ���� ���� ��� ����� �������� ����������� ����� ���� ��� ���� ����� ��� ������ �������� ������������ � ����� ��� ��� ���� ��� ������ �������� ����������������� ��� ����� ��� ��� ��� ��� ������ �������� ����������� � ���� ��� ��� ���� ���� ������ �������� ��������������������� ����� ���� ��� ���� ���� ��� ������ �������� ������������������������������� ����� ���� ��� ��� ���� ��� ������ �������� ����������������������������������� ����� ���� ��� ��� ���� ��� ������ �������� �������������������� ����� ���� ��� ���� ����� ��� ������ �������� ���������������� � ���� ��� ��� ����� ���� ������ ���������� ��������������������������� ����� ���� ��� ��� ����� ���� ������ �������� ������������������������ � ���� ��� ��� ���� ��� ������ �������� ���������������������������� ����� ���� ��� ��� ���� ��� ������ �������� ������������� ����� ���� ��� ��� ���� ��� ������ ���������� �������������������������������� ����� ���� ��� ��� ����� ��� ������ ���������� �������������� ����� ���� ��� ��� ����� ��� ������ ���������� ���������������������������� ����� ���� ��� ��� ���� ��� ������ �������� ������������� ����� ���� ��� ���� ���� ��� ������ �������� ���������������������� � ��� ��� ��� ����� ��� ����

4 5
and (2) compares the concentrations of pesticides in a selected baseflow sample with those in stormflow samples collected at the same site.
STUDY METHODS
All sites were sampled once from July through September 2000 by methods described in Shelton (1994); the samples were analyzed at the USGS National Water Quality Laboratory in Denver, Colo., by the three analytical procedures mentioned previously (table 2). Two additional samples were collected during stormflow conditions at Site 41 (table 1, figure 1) on July 27, and September 19 to allow comparison between baseflow and stormflow samples.
The method SH2010 method was used for 47 pesticides and degradates (47 sites, table 2A), the LC9060 method was used for 64 pesticides and degradates (25 sites, table 2B), and the LC9002 method was used for 76 pesticides and degradates (23 sites, table 2C). The SH2010 and LC9002 methods use gas chromatography/mass spectrometry, and are described in Zaugg and others (1995) and Sandstrom and others (2001), respectively; the LC9060 method uses liquid chromatography/mass spectrometry and is described by Furlong and others (2001). Each of these methods uses a 1-liter filtered sample extracted on a solid-phase cartridge; thus, the values represent dissolved pesticide and pesticide-degradate concentrations. The detection limits provided by the three analytical methods range from 0.001 to nearly 0.2 µg/L (table 2). This range is much lower than that obtained by methods typically used in routine monitoring programs and these methods provide much higher rates of detection than would be possible with the less sensitive methods.
Land-use characteristics for the watersheds above each sampling site were identified through satellite-imagery data collected in 1994 (U.S. Geological Survey, 1998). Population density data were obtained from 1990 U.S. Census data (U.S. Bureau of the Census, 1991a, b).
Each watershed was assigned to one of three land-use categories (developed, agricultural, or undeveloped) to assess the effect of land use on pesticide occurrence. The “developed” category comprises the 21 watersheds with a population density of greater than 510/mi2. The “agricultural” category comprises the 10 watersheds that are more than 10 percent agricultural and whose population density is less than 510/mi2. The “undeveloped” category comprises the 16 watersheds that are less than 10 percent agricultural land and whose population density is less than 510/mi2. The population-density criterion of 510/ mi2 was chosen because it has been indicated to be typical of currently developing suburban areas with 5-acre lots (Hoffman and others, 2000). The 10-percent criterion for the agricultural category was used to indicate watersheds whose streams might show the effects of agriculture, no matter how small, even though urban land represents a far greater percentage of the Croton watershed area than agricultural land.
Median concentrations for each of the three land use categories were compared among watersheds categories through nonparametric analyses of variance tests, including Kruskal-Wallace and Tukey tests. Correlations between pesticide concentrations and population density were computed through nonparametric Spearman rank correlations. Nonparametric statistical techniques were used because they are more appropriate than parametric techniques for censored data and data that are not normally distributed (Helsel and Hirsch, 1992).
Four types of total concentrations were calculated in this study: the first three (SH2010 method) pertain respectively, to insecticides, herbicides and all compounds combined; the fourth (all three methods combined) pertains to all compounds addressed by these methods. 1. Total insecticide concentrations (SH2010): these concentration values were calculated as the sum of the
concentrations of all target insecticides and insecticide degradates measured in the SH2010 analysis.2. Total herbicide concentrations (SH2010): these concentration values were calculated as the sum of the
concentrations of all target herbicide and herbicide degradates measured in the SH2010 analysis. 3. The total concentration of all compounds (SH2010): these concentration values were calculated as the sum of the
total insecticide, herbicide, and pesticide degradate concentrations for all compounds measured in the SH2010 analysis.
4. Total concentrations (SH2010, LC9060, and LC9002): these concentration values were calculated as the sum of all targeted herbicide, insecticide, fungicide, and degradate compounds measured in the SH2010, LC9060, and LC9002 analyses. Values could be computed only for the 22 sites for which all three of these methods were used. Caffeine, which was measured in the LC9060 analyses, was not included in the total pesticide calculations because it is not used as a pesticide.Concentrations of analytes reported as not detected were assigned a value of zero for all four types of total
concentrations.

6 7
�
�������
�
������������������������������������������������������������������������������������������������������������������������������������������������������������������������������������������������������������������������������������
�
��������������������������������������������������� ����������������� �����������������
������������������� ������������������� ����������������������
����������������� ������������� ����������������
������������������ ���������������������� �����������������
����������������� ������������������� ������������������
������������������������ ���������������� �������������������
������������������� ���������������� �����������������
������������������ ���������������� �������������������
����������������� ������������������ �����������������
������������������� ������������������������� ��������������������
��������������������� �������������������� �����������������
����������������������� ������������������� �����������������
������������������ ����������������� ���������������������
������������� �������������������� ������������������
������������������������� ����������������� �������������������
����������������� ������������������ �
�
��������������������������������������� ������������������� ������������������
��������������������������� ���������������� ����������������
��������������� ���������������������� ����������������������
���������������������������������������� ������������������������� ������������������
��������������������������� ���������������������������� ���������������
������������������������� ���������������������������������� ��������������������
������������������ ��������������� ������������������
���������������� ������������������ ����������������
����������������������� ��������������� ��������������
�������������������������� ������������������ ��������������������
������������������� �������������� ����������������
���������������� ��������������� ���������������
�������������������� ������������������� ���������������������
���������������� ������������������� ����������������
���������������� ���������������������� ���������������
������������������ ���������������� ����������������������
������������������ ������������������� ��������������������
����������������� ������������������� ������������������
�������������������� ���������������� ������������������
������������������������������ ������������ ����������������
������������������������� ������������
���������������������� �����������������
�����������������������������������������������������������������������������������������������������������������������������������������

6 7
�
������������������������
������������������������� ��������������������������������������������������
������������������������ ������������������� ������������������
�������������������������� �������������������� ���������������
������������������ ������������������ ����������������������
�������������������������������������������� ������������������� ��������������������
��������������������������� ������������������ ���������������
��������������������������������������������������� �������������������������� ��������������������
������������������������������������ ���������������������������� ������������������
��������������������������������������� ������������������������ �����������������
������������������������������� �������������������������� ��������������������
��������������������������� �������������� �����������������
��������������������������� ���������������������� �����������������
������������������������������� ������������������ ��������������������������
������������������������������� �������������������������� ���������������������
�������������������������������������� ���������������������������� ��������������������������
��������������������������������� ���������������� �����������������
������������������������������� �������������������������� ���������������������������������������
������������������������������������ ������������������� ���������������������������������������
������������������������ �������������������� ����������������
���������������������������� ������������������ ������������������������������
����������������������� ����������������� ����������������������
������������������ ������������������ ��������������������������������������������������������������������������������
������������������������� ���������������� ���������������������������
�������������������������������������������������������������������������������� �������������������� �����������������
������������������������� �������������������� �������������������
����������������� ��������������������
������������������������������������������������������������������������������������������������������������������������������������������������������������������������������������������������������������������������������������������������������������
�
�������
�
�������������������������������������������������������������������������������������������������������������������������������������������������������������������������
Blank and replicate samples were collected during the study for quality control. The blanks (three for SH2010 analysis, two for LC9060, and two for LC9002) showed no detections of the target analytes. Replicate samples were collected at two sites for analysis by all three methods. The field and replicate samples contained detectable concentrations of the same compound in 13 instances. The concentrations were low
and ranged from less than 0.001 µg/L to 0.060 µg/L. The differences between the field- and replicate-sample concentrations ranged from 1 to 22 percent; the difference for most compounds was less than 10 percent. Three compounds were detected in one sample but not in the corresponding field or replicate sample; the concentrations in each instance were just at or below the detection limit.

8 9
CONCENTRATIONS OF PESTICIDES AND PESTICIDE DEGRADATES
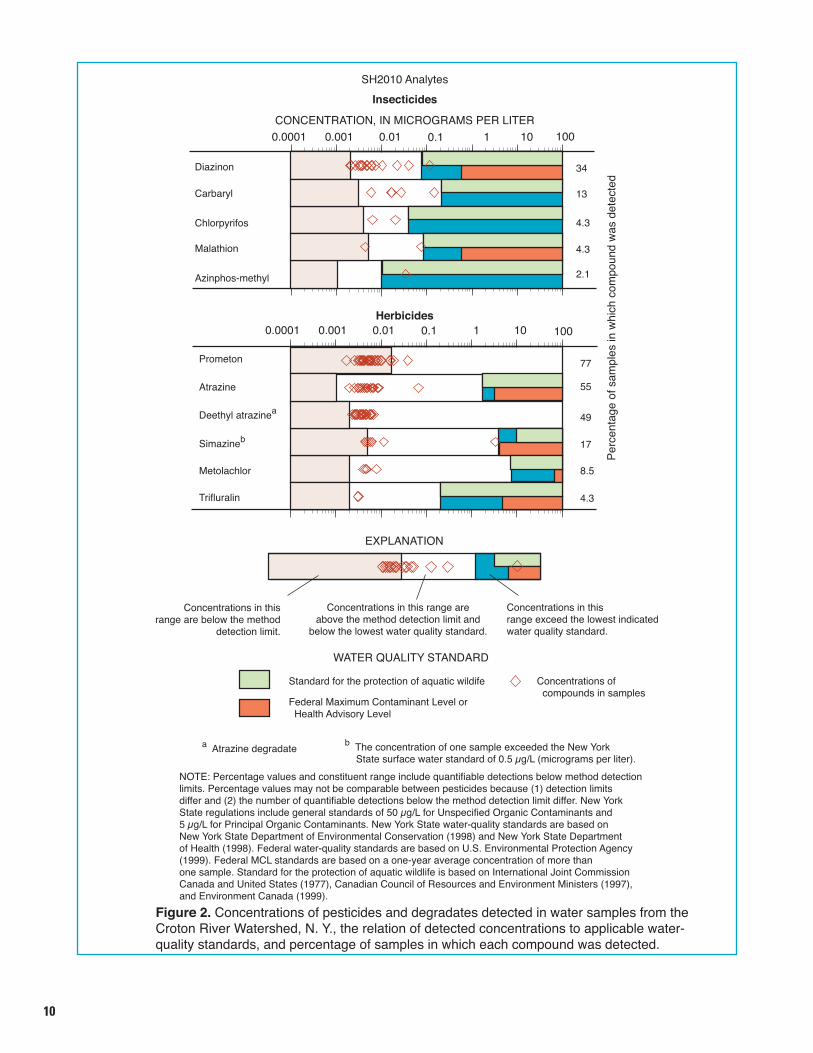
Of the more than 150 pesticides and pesticide degradates for which the samples were analyzed, 37 were detected; 23 of these were herbicides or herbicide degradates, 8 were insecticides or insecticide degradates, and 6 were fungicide or fungicide degradates. Pesticide and degradate concentrations are summarized in relation to Federal and State water-quality standards in figure 2. The concentrations of most pesticides and degradates were low; only two of these compounds had a concentration exceeding 1 µg/L.
Of the 37 compounds detected, 29 (79 percent) were detected at a concentration greater than 0.01 µg/L, and 9 (25 percent) were detected at a concentration greater than 0.10 µg/L in at least one sample (fig. 3). Of the nine compounds detected at concentrations greater than 0.10 µg/L, three were insecticides (diazinon, carbaryl, and imidacloprid), one was a fungicide (mycobutanil), and five were herbicides (simazine, 2,4-D, diuron, hexazinone, and 2,4-D methyl ester). Only the herbicides simazine and 2,4-D were detected at concentrations exceeding 1 µg/L.
Only 8 of the 45 compounds analyzed by the SH2010 method were detected at concentrations greater than 0.01 µg/L in one or more samples; the concentrations of three of these (simazine, diazinon, and carbaryl) exceeded 0.10 µg/L in one or more samples (fig. 3A). The insecticides analyzed in the SH2010 method were detected at concentrations greater than 0.01 µg/L just as frequently as the herbicides analyzed by this method (fig. 3A), even though the overall detection frequencies for certain herbicides, such as atrazine, prometon, and deethylatrazine, were higher than those for the insecticides (fig. 3A).
Some of the insecticides and herbicides detected in the tributaries also were detected at site 47, which represents the outflow from the Croton watershed below the new Croton Dam. The sample from this site contained three herbicides (atrazine, simazine and metolachlor), one herbicide degradate (deethylatrazine), and an insecticide (diazinon). This sample was analyzed only by the SH2010 method. The concentrations of these compounds were less than 0.01 µg/L, yet the total pesticide concentration calculated for this sample (0.027 µg/L) exceeded the total found in 36 of the 47 (77 percent) samples collected in this study. This indicates that pesticides present in the tributaries can reach the Croton Reservoir, even though various factors, including chemical and biological degradation, can retard their downstream movement.
In contrast to the results described above, 21 of the approximately 100 compounds analyzed by the new (LC9060 and LC9002) methods were detected at concentrations greater than 0.01 µg/L, and 6 of these were detected at concentrations above 0.1 µg/L (fig. 3B). The presence of many compounds detected only with the LC9060 and LC9002 methods, and their frequent occurrence at concentrations above 0.01 µg/L, confirms that these two methods are more useful than the SH2010 method alone for evaluating the presence of pesticides in streams in developed watersheds.
PESTICIDE CONCENTRATIONS IN RELATION TO FEDERAL AND STATE WATER-QUALITY STANDARDS
Three compounds exceeded a water-quality standard during this study, and each was detected in a separate sample. Two of these three compounds exceeded an aquatic-life-protection standard, and one exceeded a New York State surface-water standard. One of these samples was from site 34 (Stone Hill Tributary, fig. 1), and had a diazinon concentration of 0.116 µg/L, which exceeded the aquatic-life-protection standard of 0.08 µg/L for this compound. The second sample, from site 32, (Stone Hill River), had a simazine concentration of 3.4 µg/L, which exceeded the New York State surface-water standard of 0.50 µg/L for simazine. The third sample, from site 12 (East Branch of the Croton River), had an azinphos-methyl concentration of 0.0343 µg/L, which exceeded the aquatic-life-protection standard of 0.01 µg/L for this compound.
Two samples contained insecticides in concentrations that were more than 50 percent of the aquatic-life standard. The sample from site 29 (Lake Lincolndale Tributary) had a chlorpyrifos concentration of 0.0204 µg/L, which is about half of the aquatic-life protection standard of 0.041 µg/L for this compound, and the sample from site 34 (Stone Hill Tributary) had a carbaryl concentration of 0.145 µg/L and a malathion concentration of 0.075 µg/L; these concentrations are more than 50 percent of the aquatic-life-protection standards of 0.20 µg/L and 0.10 µg/L for these two compounds, respectively. Of the four sites with insecticide or herbicide concentrations approaching or exceeding aquatic-life or human health standards (sites 12, 29, 32, and 34, table 1), two sites (29 and 34) were classified as developed, one (site 12) as agricultural, and one (site 32) as undeveloped. Few water-quality standards were exceeded in the 47 samples, yet no standards have been established for many of the compounds detected in this study.

8 9
RELATION OF PESTICIDE CONCENTRATIONS TO LAND USE
A comparison of total herbicide and total insecticide concentration (SH2010 data) by land-use category indicates that insecticide concentrations were significantly higher (at an alpha of 0.05 based on the Tukey statistical test) in samples from developed watersheds than in those from agricultural or undeveloped watersheds. Total herbicide concentrations were less closely correlated with land use (fig. 4). The median total insecticide concentrations for developed land use category watersheds are significantly higher than those for the other two watershed categories, whereas the total herbicide concentrations for developed land use category watersheds are significantly higher than those for undeveloped watersheds (fig. 4). Median total
herbicide and insecticide concentrations for agricultural watersheds do not differ significantly from those for undeveloped watersheds.
Detailed analysis of the five most frequently detected compounds (SH2010 data) indicates that the median concentrations of prometon (an herbicide) and diazinon (an insecticide) for developed watershed are higher than those for agricultural or undeveloped watersheds, but the median concentrations of the herbicides simazine, atrazine, and the herbicide degradate deethylatrazine do not differ significantly among the three watershed categories (fig. 5), nor do median concentrations of prometon and diazinon differ significantly between agricultural and undeveloped watersheds.
The above observations are largely consistent with results from similar studies in the United States and New York State as outlined below:1. A national study of pesticides in streams (Larson and others, 1998) generally detected two herbicides (simazine
and prometon) and four insecticides (diazinon, carbaryl, chlorpyrifos, and malathion) more frequently and at higher concentrations in streams draining urban areas than in streams draining agricultural or mixed land-use areas. Although the detections of carbaryl, chlorpyrifos, and malathion in the present study were insufficient to relate their concentrations to land use, the elevated total insecticide concentrations for samples from developed watersheds are similar to those obtained by Larson and others (1998).
2. A survey of streams throughout New York State (Phillips and others, 1998) detected diazinon more frequently in streams draining urban watersheds than in those draining nonurban watersheds. Related studies of pesticides in New York (Phillips and others, 2000a, b; Eckhardt and Burke, 2000) have indicated that herbicides, but not insecticides, are commonly detected in reservoirs that drain agricultural areas. In contrast, the results of the present study indicate that the concentrations of insecticides, particularly diazinon, generally are higher in developed watersheds than in agricultural or undeveloped watersheds under summer baseflow conditions. This finding is consistent with those from a national survey (Templeton and others, 1998), which indicated that homeowner use of insecticides exceeds that of herbicides.
3. A study of the effect of population density on pesticide concentrations in eight urban streams across the United States (Hoffman and others, 2000), found that herbicide and insecticide yields (mass of compound transported per year) increased with increasing population density. Although pesticide yields for the 47 sites sampled in this study could not be calculated, graphs of selected pesticide concentrations in relation to population density (fig. 6) show a similar correlation—the highest total insecticide and herbicide concentrations were in samples from watersheds with population densities greater than 510 per square mile. The Spearman correlations for the relation between prometon concentration and population density, and between diazinon concentration and population density, were significant in this study, but those between population density and atrazine and simazine concentrations were not significant. These results indicate that concentrations of insecticides and an herbicide restricted to nonagricultural use (prometon) are closely related to population density.
The total pesticide concentration, obtained through the combined SH2010, LC9060, and LC9002 analyses, also increases with increasing population density (fig. 7A); this indicates that, in general, the concentrations of these pesticides and (or) pesticide degradates are related to residential land use or similar types of development. Concentrations of caffeine (which, although not a
pesticide, was included in the LC9060 method and can be used as indicator of wastewater input to streams) also increases with increasing population density (fig. 7B).
An effort was made to identify sites or regions with elevated pesticide concentrations—those that may warrant future sampling. All sites were classified according to total pesticide concentration in the sample
10 11
���
������ ����� ���� ��� � �� ���
������ ����� ���� ��� � ��
������������
��������������������������������������
���������������
��������������������������
���������������
�����������
��������
�����������������
��������
���������
�����������
�����������
��������
���������
��������
������������
���������������
����������
��
��
��
��
��
��
���
���
���
���
���
�����������
������������������������������������������������
����������������
��������������������������������������������������������������������������������
������������������������������������������������������������������������������������������������������������
�����������������������������������������������������������
����������������������������������������������
����������������������
����������������������������������������
���������������������
����������������������������������������������������������������������������������������������������������������������������
�������������������������������������������������������������������������������������������������������������������������������������������������������������������������������������������������������������������������������������������������������������������������������������������������������������������������������������������������������������������������������������������������������������������������������������������������������������������������������������������������������������������������������������������������������������������������������������������������������������������������������������������������������������������������������������������������������������������������������������������������������������������������������������������������������������������������������������������������������������������������������������������������������������������������������������������������������������������������������������������������������������������������������������
Figure 2. Concentrations of pesticides and degradates detected in water samples from the Croton River Watershed, N. Y., the relation of detected concentrations to applicable water-quality standards, and percentage of samples in which each compound was detected.

10 11
�����������
������������������������������������������������
����������������
�����������������������������������
���������
�����������������������
����������������������
������������������������������������������������
�����������������������
�������������������������������������������������������������
�������������������������
����������������������������������������������������������������������������������������������������������������������������������������
�������������������������������������������������������������������������������������������������������������������������������������������������������������������������������������������������������������������������������������������������������������������������������������������������
����������������������������������������
��������������������������������������������������������������������
����������������������������������������
������������
�������������
���������������������
������������
��������������������
��������������
��������������
�������
���������
������ ����� ���� ��� � �� �������������
������ ����� ���� ��� � �� ���
������������
��������������������������������������
��������������������������
��
�
���
��
���
���
���
���
��� ����������������������������������������������������
Figure 2. (continued) Concentrations of pesticides and degradates detected in water samples from the Croton River Watershed, N. Y., the relation of detected concentrations to applicable water-quality standards, and percentage of samples in which each compound was detected.

12 13
������������������������������������������������������������������������������������������������������������������������������������������������������������������������������������������������������������������������������������������������������������������������������������������������������������������������������������������������������������������������������������������������������������������������������������������������������������������������������������������������������������������������������������������������������������������������������������������������������������������������������������������������������������������������������������������������������������������������������������������������������������������������������������������������������������������������������������������������������������������������������������������������������������������������������������������������������������������������������������������������������������������������������������������������������������
���������������������������������������������������������������
������������������������������������������������
����������������
���������������������������������������������������������������������������������
��������������������������������������������������������������������
����������������������������������������
�����������
����������������������
�����������������������������������������������������������
�����������������������������������������������
������ ����� ���� ��� � �� ���
����������
��������������������������������������
��������������������������
����������������������������������������������������
������
�����������
������������
���������
����������������������������������������������� ���
����������������������������
����������������������
�����
�����������������
������������������
����������
��������������������
�������
���������������������
��������
����
���������
��
��
��
��
���
���
���
���
���
���
���
���
���
���
���
���
���
Figure 2. (continued) Concentrations of pesticides and degradates detected in water samples from the Croton River Watershed, N. Y., the relation of detected concentrations to applicable water-quality standards, and percentage of samples in which each compound was detected.

12 13
���������
������������
�������������������
�����
��
����������
����
������������
����������
������
�����������
�������������������
�������������������
�����������������������
�������������������
�����
����������������
������������������
�������������������
�����
��
��������������������
��������
���������
��������������������
�����������
�����������������������
��������������������
�����������
�����������������������
��������
��������
������������
���������
�������
��������
��������
��������
��������
������������������
�����������������������������
������������ ����������
�������������
��������������������
����������������������������������������������������
������������������������
������������������������
�
�
�
��
��
��
�
�
�
��
��
��
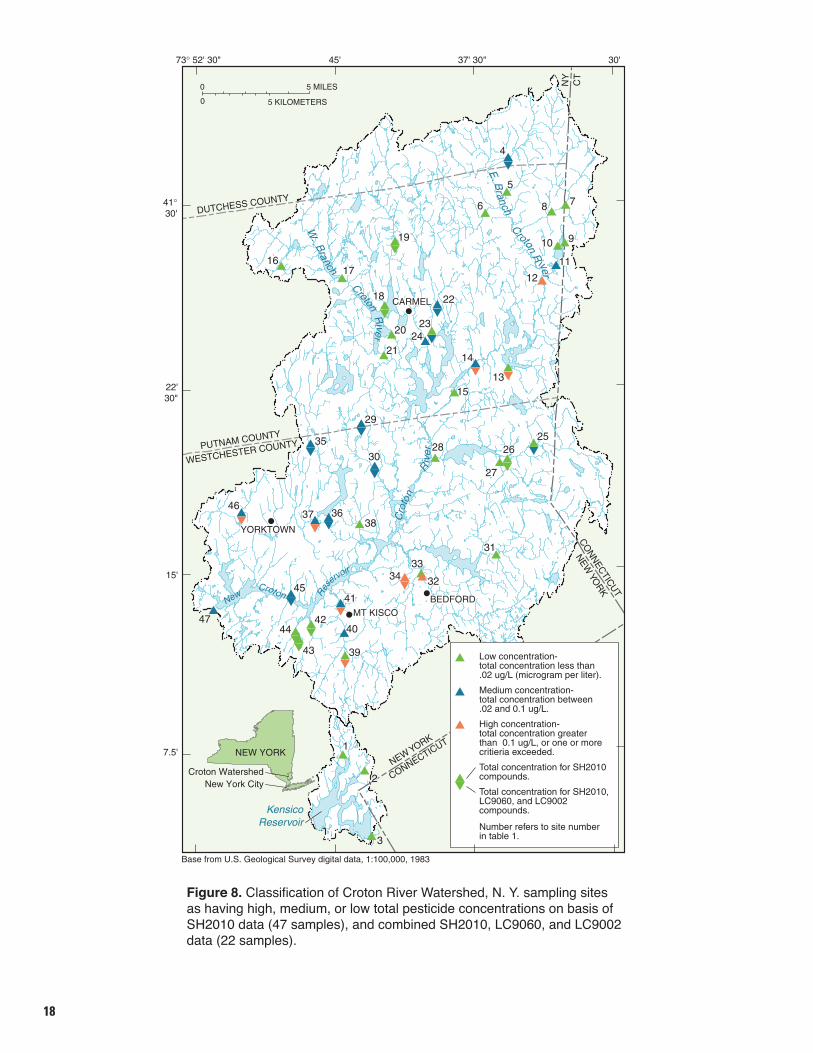
and whether the concentration approached or exceeded any water-quality standard. Sites were classified in relation to two criteria—total concentration for all 47 sites (SH2010 data only), and total concentration for the 22 sites with data from all three analytical methods (fig. 8). Low-concentration sites are those whose total concentrations were less than or equal to 0.02 µg/L; medium-concentration sites are those whose total concentrations were greater than 0.02 µg/L but less than or equal to 0.10 µg/L, and high-concentration sites were those whose samples total concentrations
exceeded 0.10 µg/L, or had a compound that was detected at a concentration exceeding at least one water-quality standard.
SH2010 data: Three (6.4 percent) of the 47 sites were indicated by the SH2010 analysis as high-concentration sites, and 14 (30 percent) as medium-concentration sites. Of the 21 sites from developed watersheds, 13 (62 percent) were indicated to be medium or high-concentration sites, whereas only 2 (20 percent) of the 10 agricultural sites, and 3 (19 percent) of the 16 undeveloped sites, were so indicated.
Figure 3. Percentage of samples in which a pesticide or pesticide degradate concentration exceeded 0.01 and 0.10 µg/L (microgram per liter) in samples from the Croton River Watershed, N.Y., July-September 2000. (Compounds detected at concentrations not exceeding 0.01 µg/L are not listed). A. SH2010 analyses. B. LC9060 and 9002 analyses. (Analytes for each method are listed in table 2.)

14 15
����������
����������������������������
�����
����
���
���������
������������
�����������
���������
������������
�����������
����������������������
�
�
�
����
�
���������������
���������������������������������������������������������������������������������������������������������α ������
���������������
���������������
���������������
���������������
�
�����������
SH2010, LC9060, and LC9002 data: Of the 22 sites with concentration data from all three analyses, 7 (31 percent) were indicated as high-concentration sites, and 9 (40 percent) as medium-concentration sites (fig. 9). Six (43 percent) of the 14 developed sites, but only 1 (25 percent) of the 4 agricultural sites and none of the 4 undeveloped sites, had high total-pesticide concentrations. The percentage of sites with high total concentrations, as calculated from the combined analyses, cannot be directly compared with the percentage calculated from the SH2010 analyses alone because many of the sites chosen for the combined analyses were expected to have high total pesticide concentrations. Nevertheless, the total concentrations from the combined analyses are useful for indicating areas that contain pesticides not addressed by the SH2010 method.
Many of the sites indicated to have a high or medium total pesticide concentration by the SH2010 method, and nearly all of the sites indicated to have a high total concentration by the three methods combined are in the southern part of the Croton River Watershed, which contains six sites—sites 41 ( Kisco River below Mt. Kisco), 39 ( Kisco River East tributary ), 32 (Stone Hill River), 34 (Stone Hill Tributary), 37 (Hallocks Mill Brook), and 46 (Hunter Brook). The highest total concentration obtained in the SH2010 analysis was at site 32, Stone Hill River (greater than 3.0 µg/L); this site is the only undeveloped site at which any water-quality standard was exceeded. The elevated concentrations at these six sites indicates that this southern part of the Croton River Watershed may warrant additional study for pesticides and pesticide degradates.
BASEFLOW CONCENTRATIONS IN RELATION TO STORMFLOW CONCENTRATIONS
Pesticide concentrations in the stormflow samples collected at site 41 (Kisco River below Mt. Kisco) on July 27, 2000 were much higher than in the sample collected at that site during baseflow conditions on July 11. This indicates that the baseflow samples collected during this study probably do not represent the annual maximum concentrations for the sites sampled.
The July 11 baseflow samples and the July 27 stormflow samples from this location (site 41) were analyzed by all three methods; therefore, the values referred to in this discussion are the sum of the concentrations obtained by all three methods.
Figure 4. Total concentration of herbicides, insecticides, and degradates (SH2010 data) calculated for streams in the Croton River Watershed, N.Y., by land-use category, July through September 2000.

14 15
���������������
���������������������������������������������������������������������������������������������������������α ������
���������������
���������������
���������������
���������������
�
�����������
�
�
�
�
�������
�
��
�
���������
������������
�����������������
����
���
���������������� ����������������
����������������
���������
������������
������������
���������
������������
�����������
���������
������������
������������
���������
������������
�����������
Total insecticide and fungicide concentrations for the baseflow samples were less than 0.03 µg/L, and those for the stormflow sample were greater than 0.10 µg/L—nearly 4 times the baseflow values (fig. 9). Total herbicide concentrations for the baseflow sample differed little from those for the stormflow sample, but a later stormflow sample collected at this site
on September 19 had a total herbicide concentration greater than 20 µg/L, nearly 100 times that of the July baseflow sample. This indicates, again, that the baseflow concentrations of pesticides and pesticide degradates discussed in this report are not representative of the highest annual concentrations, which are likely to occur during stormflows.
Figure 5. Concentrations of selected pesticides and pesticide degradates in streamwater from the Croton River Watershed, N. Y., by watershed land-use category, July-September 2000.

16 17
�������� ��������
����������������
����������������
�����
�����
�����
�����
�����
�����
��������������������������������������
�����
�����
�����
�����
�����
�����
�����
�����
����������� �����������
��������������������������
�� ��� ����� ����� �� ��� ����� �����
�������������������������������������������������������������������������������������������������������
�����������
���������������������������� ������������������������������
����������������������
Figure 6. Concentrations of selected pesticides and total herbicide and insecticide concentration (SH2010 data) in relation to population density in Croton River Watershed, N. Y., July-September 2000.

16 17
��������������������������
��
��
��
��
����
����
���
���
��
��
��
��
���
���
�
��
��
��
��
����
����
���
���
��
��
��
��
���
���
�
�� ��� ����� �����
�
�����
����
���
��
��������������������������
�����
����
���
�
����
�� ��� ����� �����
������������������� �����������
�������
SUMMARY
Baseflow samples were collected from 47 sites within the Croton River Watershed from July through September 2000 to assess which pesticides are present in these streams. Objectives of the study by the U.S. Geological Survey in cooperation with the New York State Department of Environmental Conservation, were to (1) relate the occurrence and concentrations of pesticides and their degradates to Federal and State water-quality standards and land-use characteristics of the watersheds, (2) evaluate whether the pesticides and pesticide degradates that are included in two newly developed analytical methods are present in these streams, and (3) compare the concentrations of pesticides in a July 11 baseflow sample with stormflow samples from the same site.
Samples from the 47 sites were analyzed for more than 150 pesticides and pesticide degradates; 37 compounds were detected. Maximum concentrations of most pesticides were low (less than 0.1 µg/L) and did not exceed 1.0 µg/L, except for the herbicides simazine and 2,4-D. Concentrations of three compounds (diazinon, azinphos methyl and simazine) exceeded a water-quality standard in one sample each. Concentrations of three other insecticides
(chlorpyrifos, carbaryl and malathion) were greater than half the aquatic life-protection standard in one sample.
Total insecticide and herbicide concentrations were highest in samples from watersheds with high population densities; therefore the presence of these compounds can be attributed to urban, residential, industrial, commercial, transportation, and other land uses associated with development. The concentrations of the pesticides and pesticide degradates that were detected in this study probably are lower than maximum annual concentrations that occur in these streams because the summed insecticide and fungicide concentrations in a stormflow sample collected on July 27 were greater than 0.10 µg/L, nearly 4 times greater than the concentration (less than 0.03 µg/L) in a representative baseflow sample collected at the same site 2 weeks earlier, during the period when most of the samples were collected. Total herbicide concentrations for both the July baseflow and stormflow samples were approximately 0.03 µg/L, but that in a second stormflow sample collected at the same site in late September was greater than 20 µg/L. Thus, the concentrations of some compounds during stormflows in developed watersheds can be from 4 to 100 times greater than the concentrations during baseflow conditions.
Figure 7. Concentrations of compounds detected in stream-water samples from Croton River Watershed, N. Y., in relation to population density, July-September 2000: A. Total concentration of pesticide and pestcide degradates detected in SH2010, LC9060, and LC9002 analyses. B. Caffeine.
18 19
�
� ������������
�������
��������� �
��
������
���
���
���
��
��
������
������
�����
�� �
������
������
����
����������������
�������������
��
������
�����
���
�����
������
��
����
�����
��
��
��
����
�����
��
������
��
������������
�
��������������
����
�����������������������������������������������������������������
�������������������������������������������������������������������������������������������������
������������������������������������������������������������������������������
����������������������������������������
�����������������������������������������������������������
���������������������������������������
�
�
��
�
�
�
��
��
��
��
����
����
����
��
����
���� ��
��
����
��
��
����
����
����
����
��
��
��
����
�
� �
�� �
��
��
��������
�����������������������������
���
����
��°�������� ���� ������� ����
��°���
������
��������������������������������������������������������������
������
�������
��������
��������
Figure 8. Classification of Croton River Watershed, N. Y. sampling sites as having high, medium, or low total pesticide concentrations on basis of SH2010 data (47 samples), and combined SH2010, LC9060, and LC9002 data (22 samples).

���
��
���
���
�
��
��
����
��
��
��
����
��
��� �
��
��
��
��
���
���
����
���
���
��
��
��
��
����
��
����
���
��
��
��
���
���
���
�
���
��
���
���
�
��
��
����
��
��
��
����
��
����
��
��
��
��
���
���
���
��
���
���
�
��
��
����
��
��
��
����
��
����
��
��
��
��
���
���
����
���
���
����
���
���������������������
�������������������
��
��
��
��
����
��
����
���
��
��
��
���
���
���
��
��
��
��
���
���
���
����
��
��
��
���
��
����
��
������������������
�������������������
������������������
�������������������
Figure 9. Total concentration of all detected insecticides, fungicides, herbicides and their degradates in baseflow sample and stormflow samples from site 41 (Kisco River below Mount Kisco), July 2000. (Location is shown in fig. 1).
18 19
REFERENCES CITED
Canadian Council of Resource and Environment Ministers, 1997, Canadian water quality guidelines (rev. ed.): Ottawa, Ontario, Task Force on Water Quality Guidelines, Canadian Council of Resource and Environment Ministers, loose-leaf (originally published 1987), 23 appendixes, unpaginated.
Eckhardt, D. A., and Burke, Sarah, 2000, Pesticide residues in Hemlock and Canadice Lakes and their tributaries in western New York, 1997-98: U.S. Geological Survey Water-Resources Investigations Report 99-4271, 10 p.
Environment Canada, 2000, Canadian water quality guidelines for the protection of aquatic life, Summary tables (http://www.ec.gc.ca/ceqg-rcqe), accessed on June 23, 1999.
Furlong, E. T., Anderson, B. D., Werner, S. L., Soliven, P. P., Coffey, L. J., and Burkhardt, M. R., 2001,
Methods of analysis by the U.S. Geological Survey National Water Quality Laboratory—Determination of pesticides in water by graphitized carbon-based solid-phase extraction and high-performance liquid chromatography/mass spectrometry: U. S. Geological Survey Water-Resources Investigations Report 01-01-4134, 73 p.
Helsel, D. R., and Hirsch, R. M., 1992, Statistical methods in water resources: New York, Elsevier, 552 p.
Hoffman, R. S., Capel, P. D., and Larson, S. J., 2000, Comparison of pesticides in eight U.S. urban streams, Environmental Toxicology and Chemistry, v. 19 p. 2249-2258.
International Joint Commission Canada and United States, 1977, New and revised Great Lakes water quality objectives, Volume II, An IJC report to the governments of the United States and Canada: Windsor, Ontario, International Joint Commission (http://www.ijc.org/agree/quality.html#art5).
Larson, S. J., Gilliom, R. J., and Capel, P. D., 1998, Pesticides in streams of the United States—Initial results from the National Water-Quality Assessment Program: U.S. Geological Survey Water-Resources Investigations Report 98-4222, 99 p.
New York State Department of Environmental Conservation: 1998, Water quality regulations for surface and groundwaters; Title 6 chapter X (Parts 703.5, Table 1), 10 NYCRR Subpart 5-1: Albany, New York.
New York State Department of Health, 1998, Public Water Systems Regulations effective March 12, 1998: Albany, New York.
Phillips, P. J., Wall, G. R., Eckhardt, D. A., Freehafer, D. A., and Rosenmann, Larry, 1998, Pesticide concentrations in surface waters of New York State in relation to land use - 1997: U.S. Geological Survey Water-Resources Investigations Report 98-4104, 10 p.
Phillips, P. J., Eckhardt, D. A., and Rosenmann, Larry, 2000, Pesticides and their metabolites in three small public water-supply reservoir systems, western New York, 1998-99: U.S. Geological Survey Water-Resources Investigations Report 99-4278, 20 p.
Phillips, P. J., Eckhardt, D. A., Smith, M. A., and Rosenmann, Larry, 2000, Pesticides and their metabolites in selected surface-water public supplies in New York State, 1999: U.S. Geological Survey Water-Resources Investigations Report 00-4119, 17 p.
Sandstrom, M. W., Stroppel, M. E., Foreman, W. T., and Schroeder, M. P., 2001, Methods of analysis by the U.S. Geological Survey National Water Quality Laboratory—Determination of moderate-use pesticides

20
and selected degradates in water by C-18 solid-phase extraction and gas chromatography/mass spectrometry: U.S. Geological Survey Water-Resources Investigations Report 01-4098, 70 p.
Shelton, L. R., 1994, Field guide for collecting and processing stream-water samples for the National Water Quality Assessment Program: U.S. Geological Survey Open-File Report 94-455, 42 p.
Templeton, S. R., Zilberman, David, and Yoo, S. J., 1998, An economic perspective on outdoor residential pesticide use: Environmental Science and Technology, v. 32, p. 417A-423A.
U.S. Census Bureau, 1991a, Census of population and housing, 1990: Public Law 94-171, data [machine-readable data files]: Washington, D.C., 20233.
_____1991b, Census of population and housing, 1990: Public Law 94-171 data, technical documentation: Washington, D.C., 20233.
U.S. Environmental Protection Agency, 1999, Compilation of national recommended water quality criteria and EPA’s process for deriving new and revised criteria: Washington, D.C., USEPA Office of Water. (http://www.epa.gov/OST/standards/wqcriteria.html), accessed on May 25, 1999.
U.S. Geological Survey, 1998, Digital map file of land cover for the U.S. Environmental Protection Agency Region II, Version 98-07: Sioux Falls, S. D., EROS Data Center, 1:100,000-scale, 1 sheet.
Zaugg, S. D., Sandstrom, M. W., Smith, S. G., and Fehlberg, K. M., 1995, Methods of analysis by the U.S. Geological Survey National Water Quality Laboratory—Determination of pesticides in water by C-18 solid-phase extraction and capillary-column gas chromatography with selective-ion monitoring: U.S. Geological Survey Open-File Report 95-181, 49 p.
For more information contact:
District ChiefU.S. Geological Survey425 Jordan RoadTroy, NY 14850
Copies of this report can be purchased from:
Branch of Information ServicesU.S. Geological SurveyBox 25286Denver, CO 80225
This report and additional earth science information can be found on the World Wide Web at: http://ny.usgs.gov