Computer simulation model development and validation for radio frequency
8
Computer simulation model development and validation for radio frequency (RF) heating of dry food materials G. Tiwari a , S. Wang a , J. Tang a,⇑ , S.L. Birla b a Department of Biological Systems Engineering, Washington State University, 213 LJ Smith Hall, Pullman, WA 99164-6120, USA b Department of Biological Systems Engineering, University of Nebraska, Lincoln, NE 68583, USA article info Article history: Received 8 May 2010 Received in revised form 13 January 2011 Accepted 15 January 2011 Available online 21 January 2011 Keywords: RF heat treatment Computer simulation Wheat flour Dielectric properties Heating uniformity abstract Radio frequency (RF) heat treatment has been identified as a novel pasteurization and non-chemical quarantine method for dry food materials. But the major obstacle of this treatment is non-uniform heat- ing in these food materials. The objective of this study was to help understand RF heating process by developing a computer simulation model. A finite element based commercial software FEMLAB was used to develop the computer model for a 12 kW, 27.12 MHz parallel plate RF system. Wheat flour was selected as a model food to represent dry food materials. Dielectric properties of wheat flour were mea- sured using an open-ended coaxial probe connected with impedance analyzer, whereas thermal proper- ties were determined using a duel needle probe method. Simulated and experimented temperature profiles (°C) of wheat flour were compared in four different horizontal layers after 3 min of RF heating, with a fixed electrode gap of 155 mm. Both, simulated and experimental results showed that temperature values were higher at the mid layers followed by top and bottom layers. Corners were more heated than centers in each layer. Sensitivity analysis showed that temperature uniformity in the sample was most affected by top electrode voltage and sample dielectric properties. The developed model can further be used to study the effect of some important parameters such as sample size, position, shape, and dielectric properties on RF heating of dry food materials. Ó 2011 Elsevier Ltd. All rights reserved. 1. Introduction Dry products such as grains (cereals, oil seeds, and legumes), nuts, herbs, spices, bakery products, and infant formulas are gener- ally regarded as shelf stable foods and can be stored for a long time due to their low moisture contents. Presence of pathogens and in- sect pests, nevertheless, may cause considerable qualitative and quantitative losses in these products. For example, in lentils, if not stored properly, losses can be reached as high as 50% due to in- sect damages (Ghosh et al., 2007). Wheat flour infested with Rhyz- opertha dominica greatly affects baking and rheological properties of bread made by the flour (Sánchez-Mariñez et al., 1997). Interna- tional trade of dry nuts such as walnuts and almonds may require complete elimination of targeted insect pests in these commodities in certain countries such as Japan, South Korea, and European countries (Wang et al., 2007a,b). Contamination of pathogens Enterobacter sakazakii and Salmonella spp. in infant formulas (Breeuwer et al., 2003; Friedemann, 2007), and Bacillus cereus and Clostridium perfringens in spices (Banerjee and Sarkar, 2003) may even pose a serious threat to consumer health. Radio frequency (RF) heat treatment has been explored to investigate its potential applications in dry food products and to control targeted pathogens and insects in several dry products, such as disinfestations of navel orangeworm (Amyelois transitella), codling moth (Cydia pomonella), Indianmeal moth (Plodia inter- punctella) and red flour beetle (Tribolium castaneum) in in-shell walnuts (Wang et al., 2001a, 2002, 2007a,b), grain borers and Angoumois grain moth in rice (Lagunas-Solar et al., 2007), and Sal- monella spp. and Escherichia coli O157: H57 in fishmeal (Lagunas- Solar et al., 2005). But the major hurdle for RF heating technology to be commercially applicable is its non-uniform heating. Severe uneven heating has been reported for several dry agricultural com- modities, such as alfalfa seeds (Yang et al., 2003), walnuts (Wang et al., 2007a,b), and legumes (Wang et al., 2010). Non-uniform temperature distribution may cause quality loss or insect/patho- gen survival due to either over or under heating in different parts of a food product. To make this technology commercially feasible, it is essential to understand the complex mechanism of RF heating. Computer simulation has been effectively used to help under- stand RF heating process. Neophytu and Metaxas (1998, 1999) used finite element method to simulate electric field inside RF applicators by solving both wave and Laplace equations. Yang et al. (2003) modeled RF heating of alfalfa and radish seeds packed inside rectangular polypropylene boxes in a 1 kW RF system using 0260-8774/$ - see front matter Ó 2011 Elsevier Ltd. All rights reserved. doi:10.1016/j.jfoodeng.2011.01.016 ⇑ Corresponding author. Tel.: +1 509 335 2140; fax: +1 509 335 2722. E-mail address: [email protected] (J. Tang). Journal of Food Engineering 105 (2011) 48–55 Contents lists available at ScienceDirect Journal of Food Engineering journal homepage: www.elsevier.com/locate/jfoodeng
Transcript of Computer simulation model development and validation for radio frequency

Journal of Food Engineering 105 (2011) 48–55
Contents lists available at ScienceDirect
Journal of Food Engineering
journal homepage: www.elsevier .com/locate / j foodeng
Computer simulation model development and validation for radio frequency(RF) heating of dry food materials
G. Tiwari a, S. Wang a, J. Tang a,⇑, S.L. Birla b
a Department of Biological Systems Engineering, Washington State University, 213 LJ Smith Hall, Pullman, WA 99164-6120, USAb Department of Biological Systems Engineering, University of Nebraska, Lincoln, NE 68583, USA
a r t i c l e i n f o
Article history:Received 8 May 2010Received in revised form 13 January 2011Accepted 15 January 2011Available online 21 January 2011
Keywords:RF heat treatmentComputer simulationWheat flourDielectric propertiesHeating uniformity
0260-8774/$ - see front matter � 2011 Elsevier Ltd. Adoi:10.1016/j.jfoodeng.2011.01.016
⇑ Corresponding author. Tel.: +1 509 335 2140; faxE-mail address: [email protected] (J. Tang).
a b s t r a c t
Radio frequency (RF) heat treatment has been identified as a novel pasteurization and non-chemicalquarantine method for dry food materials. But the major obstacle of this treatment is non-uniform heat-ing in these food materials. The objective of this study was to help understand RF heating process bydeveloping a computer simulation model. A finite element based commercial software FEMLAB was usedto develop the computer model for a 12 kW, 27.12 MHz parallel plate RF system. Wheat flour wasselected as a model food to represent dry food materials. Dielectric properties of wheat flour were mea-sured using an open-ended coaxial probe connected with impedance analyzer, whereas thermal proper-ties were determined using a duel needle probe method. Simulated and experimented temperatureprofiles (�C) of wheat flour were compared in four different horizontal layers after 3 min of RF heating,with a fixed electrode gap of 155 mm. Both, simulated and experimental results showed that temperaturevalues were higher at the mid layers followed by top and bottom layers. Corners were more heated thancenters in each layer. Sensitivity analysis showed that temperature uniformity in the sample was mostaffected by top electrode voltage and sample dielectric properties. The developed model can further beused to study the effect of some important parameters such as sample size, position, shape, and dielectricproperties on RF heating of dry food materials.
� 2011 Elsevier Ltd. All rights reserved.
1. Introduction
Dry products such as grains (cereals, oil seeds, and legumes),nuts, herbs, spices, bakery products, and infant formulas are gener-ally regarded as shelf stable foods and can be stored for a long timedue to their low moisture contents. Presence of pathogens and in-sect pests, nevertheless, may cause considerable qualitative andquantitative losses in these products. For example, in lentils, ifnot stored properly, losses can be reached as high as 50% due to in-sect damages (Ghosh et al., 2007). Wheat flour infested with Rhyz-opertha dominica greatly affects baking and rheological propertiesof bread made by the flour (Sánchez-Mariñez et al., 1997). Interna-tional trade of dry nuts such as walnuts and almonds may requirecomplete elimination of targeted insect pests in these commoditiesin certain countries such as Japan, South Korea, and Europeancountries (Wang et al., 2007a,b). Contamination of pathogensEnterobacter sakazakii and Salmonella spp. in infant formulas(Breeuwer et al., 2003; Friedemann, 2007), and Bacillus cereusand Clostridium perfringens in spices (Banerjee and Sarkar, 2003)may even pose a serious threat to consumer health.
ll rights reserved.
: +1 509 335 2722.
Radio frequency (RF) heat treatment has been explored toinvestigate its potential applications in dry food products and tocontrol targeted pathogens and insects in several dry products,such as disinfestations of navel orangeworm (Amyelois transitella),codling moth (Cydia pomonella), Indianmeal moth (Plodia inter-punctella) and red flour beetle (Tribolium castaneum) in in-shellwalnuts (Wang et al., 2001a, 2002, 2007a,b), grain borers andAngoumois grain moth in rice (Lagunas-Solar et al., 2007), and Sal-monella spp. and Escherichia coli O157: H57 in fishmeal (Lagunas-Solar et al., 2005). But the major hurdle for RF heating technologyto be commercially applicable is its non-uniform heating. Severeuneven heating has been reported for several dry agricultural com-modities, such as alfalfa seeds (Yang et al., 2003), walnuts (Wanget al., 2007a,b), and legumes (Wang et al., 2010). Non-uniformtemperature distribution may cause quality loss or insect/patho-gen survival due to either over or under heating in different partsof a food product. To make this technology commercially feasible,it is essential to understand the complex mechanism of RF heating.
Computer simulation has been effectively used to help under-stand RF heating process. Neophytu and Metaxas (1998, 1999)used finite element method to simulate electric field inside RFapplicators by solving both wave and Laplace equations. Yanget al. (2003) modeled RF heating of alfalfa and radish seeds packedinside rectangular polypropylene boxes in a 1 kW RF system using

G. Tiwari et al. / Journal of Food Engineering 105 (2011) 48–55 49
commercial software TLM-FOOD HEATING based on transmissionline and finite different time domain method. Chan et al. (2004)solved wave equations to simulate electric field patterns in 1% car-boxymethyl cellulose (CMC) solution, placed in a 6 kW, 27.12 MHzRF system using finite element method. They compared simulatedelectric field patterns with the experimentally determined temper-ature patterns in CMC solutions using five load positions and con-tainer sizes. Marra et al. (2007) successfully simulated thetemperature distribution and heating uniformity inside a cylindri-cal meat roll subjected to a 600 W RF heating using a commerciallyavailable finite element based software FEMLAB. They reported dif-ferences in temperature uniformity inside a meat roll sample atdifferent power levels. A computer simulation using FEMLAB wasalso successfully performed to study various factors causingheating non uniformity in fresh fruits, when subjected to RF heat-ing inside a 12 kW, 27.12 MHz RF system (Birla et al., 2008a,b).Simulation results showed that dielectric properties, shape, andposition of fruit inside the RF applicator greatly influenced heatinguniformity of fresh fruits. Romano and Marra (2008) studied the ef-fect of regular sample shapes (cube, cylinder, and sphere) and theirorientations on RF heating behavior in meat samples using a com-puter model and predicted that cubes should have better heatinguniformity than cylinders and spheres. Wang et al. (2008) simu-lated and validated a computer model to study the influence ofdielectric properties of mashed potato and circulating water onthe electric field distribution, heating rate, and temperature distri-bution in a 6 kW RF system. Simulation results confirmed that in-crease in salt content (loss factor) did not guarantee increase in RFpower density.
Very few studies on the computer simulation of the RF heatingof dry food products are reported in the literature. Yang et al.(2003) simulated the RF heating of alfalfa and radish seeds. But thisstudy was based on a small RF cavity and reported discrepancies intemperature distributions between simulation and experimentalresults. Therefore, it is necessary to systematically study the RFheating characteristics in dry food materials and design parame-ters to improve the RF heating uniformity in these materials, basedon the validated computer simulation model.
The overall objective of this study was to investigate the behav-ior of RF heating in dry food materials using computer simulationmodel. Specific objectives were to (1) determine the dielectric andthermal properties of the wheat flour as a representative of dryfood products, (2) develop a computer simulation model for a12 kW, 27.12 MHz RF system using commercial finite element soft-ware FEMLAB, and (3) validate the computer model by comparingwith the transient experimental temperature profiles of wheatflour.
2. Materials and methods
2.1. Material selection
Hard red spring wheat flour, bronze chief, was selected as a rep-resentative dry food material. The selection of wheat flour wasbased on its better structural uniformity and consistency as com-pared to other dry food materials, such as food grains, legumes,and bakery products. The flour was procured from Wheat Montanafarms, Three Forks, Montana, USA and stored at room temperatureprior to RF experiments. The initial moisture content of wheat flourwas 8.8% on wet basis (w.b.).
2.2. Dielectric and thermal properties measurement
Dielectric properties (DPs) of wheat flour samples at a normalbulk density (without further compression) of 800 kg m�3 were
measured with an open-ended coaxial-line probe (HP 85070B)connected to an impedance analyzer (HP 4291B, Hewlett PackardCorp., Santa Clara, CA, USA). This normal bulk density of wheatflour was similar to that (785 kg m�3) reported by Rahman(1995). Sample was placed in a cylindrical test cell, with circulatingethylene glycol and water solution through the jacket of the testcell. The circulating ethylene glycol and water solution was usedto raise the sample temperature from 20 to 70 �C in every 10 �Cincrement. The details of the measurement system and procedurecan be found elsewhere (Wang et al., 2003; Guo et al., 2008). Theselected temperature range is practically applicable for the heatdisinfestations of dry food materials without affecting theirquality.
Thermal properties (thermal conductivity and specific heat), ata bulk density of 800 kg m�3 were measured by a dual needleprobe method (KD2 Pro, Decagon Devices, Pullman, WA, USA) atevery 10 �C interval from 20 to 70 �C.
2.3. Development of computer model
2.3.1. Physical modelA 12 kW, 27.12 MHz parallel plate RF heating system (Strayfield
Fastran with E-200, Strayfield International Limited, Wokingham,UK) was used in this study. The RF system included metallic enclo-sure, generator, and RF applicator with a pair of RF electrodes. Aschematic diagram of the RF applicator is shown in Fig. 1. The bot-tom electrode is the integral part of metallic enclosure. Top elec-trode position could be changed with the help of adjustablescrews. RF power from the generator was fed in the middle oftop electrode. A dielectric material (wheat flour) in a containerwas placed on the bottom (ground) electrode.
2.3.2. Governing equationsQuasi static approximation for the RF electric field is a valid
assumption inside the RF cavity due to its long wavelength(�11 m) compared to cavity size (1.8 � 1.4 � 1.0 m). Wave lengthof a wave in a non-magnetic homogeneous dielectric material(km) can be expressed as:
km ¼ k=ffiffiffiffiffiffie0m
pð1Þ
where e0m is the material dielectric constant and k is the wavelength(m) in air (Besser and Gilmore, 2003). Since dry food materials havelow dielectric constant values, assumption of quasi-static RF electricfield inside dry food materials should also be valid. Quasi-staticelectric field inside the RF cavity can be obtained by solving Laplaceequation:
rðrþj2pf eoemÞrV ¼ 0 ð2Þ
where j ¼ffiffiffiffiffiffiffi�1p
, V is the voltage between the two electrodes (V), re-lated to the electric field (E ¼ �rV), f is the frequency (Hz), eo is thepermittivity of free space (8.86 � 10�12 F m�1), r and em are theelectrical conductivity (S m�1) and the complex relative permittiv-ity of the material, respectively. The complex relative permittivityem can be expressed in terms of dielectric constant e0m and loss factore00m of the material (em ¼ e0m � j�e00m). When a dielectric material isplaced inside the RF applicator, RF power density (Q , W m�3) inthe material is governed by:
Q ¼ 2pf eoe00mjEj2 ð3Þ
The RF power density acts as a heat source and results in un-steady conductive heat transfer inside the material. The unsteadyheat transfer equation is governed by Fourier Eq.:
@T@t¼ rarT þ Q
qCpð4Þ

Fig. 1. Schematic diagram of 12 kW, 27.12 MHz radio frequency system.
50 G. Tiwari et al. / Journal of Food Engineering 105 (2011) 48–55
where T is the material temperature (�C), t is the time (s), q, a, andCp are the density (kg m�3), thermal diffusivity (m s�2) and specificheat (J kg�1 �C�1) of the material, respectively.
2.3.3. Initial and boundary conditionsIt was difficult to consider all details of RF systems in simulation
as it required excessive computer resources. Only one quarter partof the RF machine, sample, and container was modeled to availadvantages of system geometric symmetry. Dimensions of thesample, container, and RF system along with electrical and thermalboundary conditions are shown in Fig. 2. Electrical insulation(rE ¼ 0) was assigned to symmetrical planes of the RF applicator,coincided with the symmetrical planes of sample and container. Inreality, voltage on top electrode varies all over the surface of topelectrode. Voltage has its minimum value at the feed point andgoes on increasing as we move away from the feed point. Barber(1983) reported if top electrode dimensions were less than 30%of the RF wave length, voltage can be assumed uniform in all partsof the top electrode. In the present RF system, top electrode dimen-sions (1.05 � 0.8 m2) with feed point at its center (Fig. 1) were suf-ficiently small compared to 30% of RF wave length (�3.3 m),therefore, electric voltage on the top electrode was considered uni-form in the simulation. Top electrode voltage was also assumedconstant during the RF heat treatment, as voltage in typical indus-trial-scale RF systems varies only 7% between standbys to full loadposition (Metaxas, 1996). It was difficult to measure top electrodevoltage in an operating RF system, therefore, preliminary simula-tions were run by considering different values of top electrodevoltage. Based on the comparison between preliminary simulation
Fig. 2. Geometry and boundary conditions of one quadrant of 12 kW, 27.12 MHzradio frequency systems used in simulation (dimensions are in mm).
results and experimental results, value of top electrode voltage wasconsidered as 13,000 V for the final simulation. The similar ap-proach for the evaluation of top electrode voltage has been re-ported (Marshall and Metaxas, 1998; Birla et al., 2008a). RFcavity walls along with bottom electrode were grounded, thereforevoltage (V = 0 V) was set for these boundaries. Convective heattransfer (h = 20 W m�2 �C�1) was assumed on the top exposed sur-face of the sample in the RF cavity (Wang et al., 2001b). Other outersurfaces of the plastic container were considered as thermallyinsulated (rT = 0). Initial temperature was set at 23 �C based onthe experimental room conditions.
2.3.4. Solution procedureFinite element method based commercial software, FEMLAB
(V3.4, COMSOL Multiphysics, Burlington, MA, USA) was used tosolve coupled electromagnetic and heat transfer equations. InbuiltFEMLAB modules (AC/DC quasi-static) and heat transfer by con-duction with transient analysis were selected to solve Eqs. (2)–(4). Various modeling steps involved in model development areshown in Fig. 3. The unstructured mesh consisting Lagrange-Qua-dratic element was generated in the entire domain of RF cavity.Relatively fine meshes were created near the sharp edges and cor-ners of the sample and the container to increase the accuracy ofsolution. Coupled equations were solved and obtained sample tem-perature values were saved. The mesh system was refined sequen-tially until the difference in sample temperature values betweentwo sequential sets of meshes was less than 0.1%. The solution atthis stage was considered mesh independent and converged. Thefinal mesh system consisted of 145,781 domain elements (tetrahe-dral), 11,192 boundary elements (triangular), 633 edge elements(linear) and 26 vertex elements. The direct linear system solverUMFPACK was used, with a relative tolerance and an absolute tol-erance of 0.01 and 0.001, respectively. Initial and maximum timesteps were set as 0.001 and 1 s. All computer simulations were per-formed on a Dell 670 workstation with two Dual Core, 2.80 GHzXEON processors, and 12 GB RAM running on a Windows XP 64bit operating system. Another set of simulations was run to per-form a sensitivity analysis of input parameters on the simulatedtemperature uniformity (STU, �C). The model input parametersnamely – top electrode voltage, sample DPs, thermal conductivity,and heat transfer coefficient of air were varied within their allow-able limits. Top electrode voltage was varied between ±5 percentfrom its nominal value of 13,000 V. DPs of wheat flour (3.27-j0.23) at 20 �C were varied ±20%. Thermal conductivity of wheatflour was changed between 0.1 and 0.3 W m�1 �C�1 with its nom-inal value of 0.2. Heat transfer coefficient under still air conditionwas varied between 0 and 20 W m�2 �C�1. STU was defined as:
STU ¼ 1Vvol
ZVvol
ffiffiffiffiffiffiffiffiffiffiffiffiffiffiffiffiffiffiffiffiffiffiðT � TavÞ2
qdVvol ð5Þ

Fig. 3. Flow chart of modeling using FEMLAB 3.4.
Table 1Dielectric and thermal properties of hard red spring wheat flour at a bulk density of800 kg m�3 and moisture content of 8.8% w.b. The data represent the mean of tworeplicates.
Temperature(T, �C)
Dielectricconstant(e0m)
Loss factor(e00m)
Thermalconductivity(k, W m�1 �C�1)
Specific heat(Cp, J kg�1 �C�1)
20 3.27 ± 0.03 0.23 ± 0.01 0.12 ± 0.003 1229.37 ± 36.2330 3.34 ± 0.03 0.31 ± 0.00 0.14 ± 0.005 1644.38 ± 38.0040 3.49 ± 0.02 0.31 ± 0.02 0.15 ± 0.003 1661.25 ± 35.2350 3.73 ± 0.06 0.31 ± 0.01 0.17 ± 0.006 1823.75 ± 60.1060 4.09 ± 0.01 0.34 ± 0.01 0.20 ± 0.007 1950.64 ± 13.2570 4.77 ± 0.10 0.42 ± 0.01 0.27 ± 0.004 2188.75 ± 21.21
Table 2Dielectric and thermo-physical properties of wheat flour, polypropylene and air usedin computer simulation as a function of temperature (T, �C).
Wheat flour Polypropylene Air
Dielectric constant (e0m) 3.72�0.0345T + 0.0007T2 2 1Loss factor (e00m) 0.33 0.0023 0Specific heat
(Cp, J kg�1 �C�1)23T + 757 1800 –
Thermal conductivity 1.36 � 10�4T2� 0.2 –(k, W m�1 �C�1) 0.0094T + 0.2819Density (q, kg m�3) 800 900 –
G. Tiwari et al. / Journal of Food Engineering 105 (2011) 48–55 51
where T and Tav are local and average temperatures (�C) inside thedielectric material over the volume (Vvol, m3), respectively. Subdo-main integration scheme of FEMLAB was used to integrate Eq. (5).The results were expressed by ratio of percentage change in STUto the corresponding percent change in input parameters.
2.4. Model validation
2.4.1. Container material selectionThree trays of polypropylene (each having inner dimension
300 � 220 � 20 mm3) stacked one over other to form a container
Fig. 4. Simulated temperature (�C) profiles of one quadrant wheat flour sample (150 � 1bottom (b) four different vertical layers (0, 36, 72, and 110 mm) from the vertical centetemperature 23 �C.
for holding wheat flour. This was designed to facilitate tempera-ture mapping at multiple layers. The bottoms of the top two trayswere made of polypropylene mesh (thickness 2 mm with meshopening of 6 mm). The purpose of using mesh as a bottom wasto minimize air gap between two adjacent trays, when stakedone above another. The lower tray bottom and side walls of thetrays were made of 7 mm thick polypropylene sheet.
2.4.2. Experimental procedureAbout one kg wheat flour was filled in each tray to maintain
bulk density of 800 kg m�3 in experiments as used in simulation.A very thin polypropylene film was placed on the perforated bot-tom of each tray, prior to loading flour into trays. This was doneto prevent flour particles falling, while taking out the trays for ther-mal imaging. The container (stacked trays) was put at the center ofthe bottom electrode. The wheat sample was subjected to 3 min RFheating in 155 mm electrodes gap. Immediately after heating, thecontainer was removed and the surface temperatures of all threetrays were recorded using an infra-red image camera (Therma-CAMTM Researcher 2001, FL-IR Systems, Portland, OR, USA) withan accuracy ±2 �C, starting from the top to the bottom tray. Finally,wheat flour of the third (bottom) tray was carefully overturned onanother polypropylene sheet to record the bottom surface
10 � 60 mm3) at (a) four different horizontal layers (0, 20, 40, and 60 mm) from ther plane of sample after 3 min RF heating with an electrode gap 155 mm and initial

Fig. 5. Simulated electric field distribution (a) and RF power density distribution (W m�3) of one quadrant wheat flour sample (150 � 110 � 60 mm3) after 3 min RF heatingwith an electrode gap of 155 mm.
Fig. 6. Experimental (a) and simulated (b) temperature distributions (�C) of hard red spring wheat flour in top and first mid layers (60 and 40 mm from the bottom of sample)placed in a polypropylene container (300 � 220 � 60 mm3) on the top of the bottom electrode with the comparison of the temperature profiles (c) along the line LL0 , after3 min RF heating with an initial temperature of 23 �C and a fixed electrode gap of 155 mm.
52 G. Tiwari et al. / Journal of Food Engineering 105 (2011) 48–55
temperature of the sample. All the four thermal imaging recordingswere completed within 30 s. A fiber-optic sensor (UMI, FISO Tech-
nologies Inc., Quebec, Canada) was also inserted 40 mm from thebottom of the container to measure the temperature profile at

Fig. 7. Experimental (a) and simulated (b) temperature distributions (�C) of hard red spring wheat flour in second mid and bottom layers (20 and 0 mm from the bottom ofsample) placed in a polypropylene container (300 � 220 � 60 mm3) on the top of the bottom electrode with the comparison of the temperature profiles (c) along the line LL0
after 3 min RF heating with an initial temperature of 23 �C and a fixed electrode gap of 155 mm.
Fig. 8. Experimental and simulated temperature–time histories of hard red springwheat flour at the center of first mid layer (40 mm) from the bottom of sample(300 � 220 � 60 mm3), placed in a polypropylene container on the top of groundedelectrode during 3 min RF heating with an electrode gap of 155 mm.
G. Tiwari et al. / Journal of Food Engineering 105 (2011) 48–55 53
the center of the second tray during 3-min RF heating. Experimen-tal and simulated surface temperature distributions were com-pared at four different heights (0, 20, 40, and 60 mm) from thebottom of the container.
3. Results and discussions
3.1. Dielectric and thermal properties of wheat flour
Table 1 shows the temperature dependent dielectric and ther-mal properties of wheat flour at 27.12 MHz. Both, dielectric con-stant and loss factor increased slightly with an increase intemperature. Nelson and Trabelsi (2006) also reported slight in-crease in dielectric properties of hard red winter flour at moisturecontent of 11% d.b. within the temperature range from 5 to 55 �C.Thermal conductivity and specific heat of wheat flour also in-creased with increasing temperature. Increases in thermal
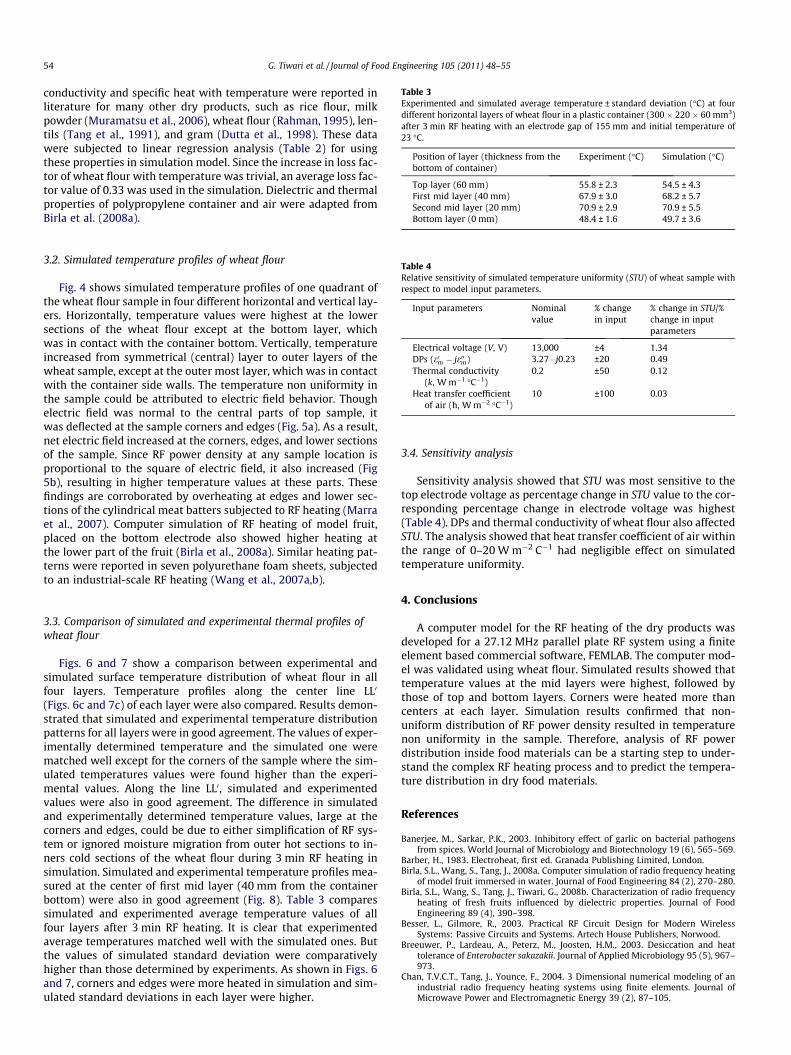
Table 3Experimented and simulated average temperature ± standard deviation (�C) at fourdifferent horizontal layers of wheat flour in a plastic container (300 � 220 � 60 mm3)after 3 min RF heating with an electrode gap of 155 mm and initial temperature of23 �C.
Position of layer (thickness from thebottom of container)
Experiment (�C) Simulation (�C)
Top layer (60 mm) 55.8 ± 2.3 54.5 ± 4.3First mid layer (40 mm) 67.9 ± 3.0 68.2 ± 5.7Second mid layer (20 mm) 70.9 ± 2.9 70.9 ± 5.5Bottom layer (0 mm) 48.4 ± 1.6 49.7 ± 3.6
54 G. Tiwari et al. / Journal of Food Engineering 105 (2011) 48–55
conductivity and specific heat with temperature were reported inliterature for many other dry products, such as rice flour, milkpowder (Muramatsu et al., 2006), wheat flour (Rahman, 1995), len-tils (Tang et al., 1991), and gram (Dutta et al., 1998). These datawere subjected to linear regression analysis (Table 2) for usingthese properties in simulation model. Since the increase in loss fac-tor of wheat flour with temperature was trivial, an average loss fac-tor value of 0.33 was used in the simulation. Dielectric and thermalproperties of polypropylene container and air were adapted fromBirla et al. (2008a).
Table 4Relative sensitivity of simulated temperature uniformity (STU) of wheat sample withrespect to model input parameters.
Input parameters Nominalvalue
% changein input
% change in STU/%change in inputparameters
Electrical voltage (V, V) 13,000 ±4 1.34DPs (e0m � je00m) 3.27�j0.23 ±20 0.49Thermal conductivity
(k, W m�1 �C�1)0.2 ±50 0.12
Heat transfer coefficientof air (h, W m�2 �C�1)
10 ±100 0.03
3.2. Simulated temperature profiles of wheat flour
Fig. 4 shows simulated temperature profiles of one quadrant ofthe wheat flour sample in four different horizontal and vertical lay-ers. Horizontally, temperature values were highest at the lowersections of the wheat flour except at the bottom layer, whichwas in contact with the container bottom. Vertically, temperatureincreased from symmetrical (central) layer to outer layers of thewheat sample, except at the outer most layer, which was in contactwith the container side walls. The temperature non uniformity inthe sample could be attributed to electric field behavior. Thoughelectric field was normal to the central parts of top sample, itwas deflected at the sample corners and edges (Fig. 5a). As a result,net electric field increased at the corners, edges, and lower sectionsof the sample. Since RF power density at any sample location isproportional to the square of electric field, it also increased (Fig5b), resulting in higher temperature values at these parts. Thesefindings are corroborated by overheating at edges and lower sec-tions of the cylindrical meat batters subjected to RF heating (Marraet al., 2007). Computer simulation of RF heating of model fruit,placed on the bottom electrode also showed higher heating atthe lower part of the fruit (Birla et al., 2008a). Similar heating pat-terns were reported in seven polyurethane foam sheets, subjectedto an industrial-scale RF heating (Wang et al., 2007a,b).
3.3. Comparison of simulated and experimental thermal profiles ofwheat flour
Figs. 6 and 7 show a comparison between experimental andsimulated surface temperature distribution of wheat flour in allfour layers. Temperature profiles along the center line LL0
(Figs. 6c and 7c) of each layer were also compared. Results demon-strated that simulated and experimental temperature distributionpatterns for all layers were in good agreement. The values of exper-imentally determined temperature and the simulated one werematched well except for the corners of the sample where the sim-ulated temperatures values were found higher than the experi-mental values. Along the line LL0, simulated and experimentedvalues were also in good agreement. The difference in simulatedand experimentally determined temperature values, large at thecorners and edges, could be due to either simplification of RF sys-tem or ignored moisture migration from outer hot sections to in-ners cold sections of the wheat flour during 3 min RF heating insimulation. Simulated and experimental temperature profiles mea-sured at the center of first mid layer (40 mm from the containerbottom) were also in good agreement (Fig. 8). Table 3 comparessimulated and experimented average temperature values of allfour layers after 3 min RF heating. It is clear that experimentedaverage temperatures matched well with the simulated ones. Butthe values of simulated standard deviation were comparativelyhigher than those determined by experiments. As shown in Figs. 6and 7, corners and edges were more heated in simulation and sim-ulated standard deviations in each layer were higher.
3.4. Sensitivity analysis
Sensitivity analysis showed that STU was most sensitive to thetop electrode voltage as percentage change in STU value to the cor-responding percentage change in electrode voltage was highest(Table 4). DPs and thermal conductivity of wheat flour also affectedSTU. The analysis showed that heat transfer coefficient of air withinthe range of 0–20 W m�2 C�1 had negligible effect on simulatedtemperature uniformity.
4. Conclusions
A computer model for the RF heating of the dry products wasdeveloped for a 27.12 MHz parallel plate RF system using a finiteelement based commercial software, FEMLAB. The computer mod-el was validated using wheat flour. Simulated results showed thattemperature values at the mid layers were highest, followed bythose of top and bottom layers. Corners were heated more thancenters at each layer. Simulation results confirmed that non-uniform distribution of RF power density resulted in temperaturenon uniformity in the sample. Therefore, analysis of RF powerdistribution inside food materials can be a starting step to under-stand the complex RF heating process and to predict the tempera-ture distribution in dry food materials.
References
Banerjee, M., Sarkar, P.K., 2003. Inhibitory effect of garlic on bacterial pathogensfrom spices. World Journal of Microbiology and Biotechnology 19 (6), 565–569.
Barber, H., 1983. Electroheat, first ed. Granada Publishing Limited, London.Birla, S.L., Wang, S., Tang, J., 2008a. Computer simulation of radio frequency heating
of model fruit immersed in water. Journal of Food Engineering 84 (2), 270–280.Birla, S.L., Wang, S., Tang, J., Tiwari, G., 2008b. Characterization of radio frequency
heating of fresh fruits influenced by dielectric properties. Journal of FoodEngineering 89 (4), 390–398.
Besser, L., Gilmore, R., 2003. Practical RF Circuit Design for Modern WirelessSystems: Passive Circuits and Systems. Artech House Publishers, Norwood.
Breeuwer, P., Lardeau, A., Peterz, M., Joosten, H.M., 2003. Desiccation and heattolerance of Enterobacter sakazakii. Journal of Applied Microbiology 95 (5), 967–973.
Chan, T.V.C.T., Tang, J., Younce, F., 2004. 3 Dimensional numerical modeling of anindustrial radio frequency heating systems using finite elements. Journal ofMicrowave Power and Electromagnetic Energy 39 (2), 87–105.

G. Tiwari et al. / Journal of Food Engineering 105 (2011) 48–55 55
Dutta, S.K., Nema, V.K., Bhardwaj, R.K., 1998. Thermal properties of gram. Journal ofAgricultural Engineering Research 39 (4), 269–275.
Friedemann, M., 2007. Enterobacter sakazakii in food and beverages (other thaninfant formula and milk powder). International Journal of Food Microbiology116 (1), 1–10.
Ghosh, P.K., Jayas, D.S., Srivastava, C., Jha, A.N., 2007. Drying and Storing Lentils:Engineering and Entomological Aspects in Lentil: An Ancient Crop for ModernTimes. Springer, Netherlands (pp. 385–414).
Guo, W., Tiwari, G., Tang, J., Wang, S., 2008. Frequency, moisture and temperature-dependent dielectric properties of chickpea flour. Biosystems Engineering 101(2), 217–224.
Lagunas-Solar, M.C., Pan, Z., Zeng, N.X., Truong, T.D., Khir, R., Amaratunga, K.S.P.,2007. Application of radiofrequency power for non-chemical disinfestation ofrough rice with full retention of quality attributes. Applied Engineering inAgriculture 23 (5), 647–654.
Lagunas-Solar, M.C., Zeng, N.X., Essert, T.X., Truong, T.D., Pina, C., Cullor, J.S., Smith,W.L., Larrain, R., 2005. Disinfection of fishmeal with radiofrequency heating forimproved quality and energy efficiency. Journal of the Science of Food andAgriculture 85, 2273–2280.
Marra, F., Lyng, J., Romano, V., McKenna, B., 2007. Radiofrequency heating offoodstuff: solution and validation of a mathematical model. Journal of FoodEngineering 79 (3), 998–1006.
Marshall, M.G., Metaxas, A.C., 1998. Modeling of the radio frequency electric fieldstrength developed during the RF assisted heat pump drying of particulates.Journal of Microwave Power and Electromagnetic Energy 33 (3), 167–177.
Metaxas, A.C., 1996. Foundations of electroheat–A unified approach, first ed. JohnWiley & Sons, New York.
Muramatsu, Y., Tagawa, A., Kasai, T., 2006. Effective thermal conductivity of riceflour and whole and skim milk powder. Journal of Food Science 70 (4), 279–287.
Nelson, S.O., Trabelsi, S., 2006. Dielectric spectroscopy of wheat from 10 MHz to1.8 GHz. Measurement Science and Technology 17 (8), 2294–2298.
Neophytu, R.I., Metaxas, A.C., 1998. Combined 3D FE and circuit modeling of radiofrequency heating systems. Journal of Microwave Power and ElectromagneticEnergy 33 (4), 243–262.
Neophytu, R.I., Metaxas, A.C., 1999. Combined tank and applicator design of radiofrequency heating systems. IEE Proceedings – Microwaves Antennas andPropagation 146 (5), 311–318.
Rahman, S., 1995. Food properties handbook. CRC Press, Florida.
Romano, V., Marra, F., 2008. A numerical analysis of radio frequency heating ofregular shaped foodstuff. Journal of Food Engineering 84 (3), 449–457.
Sánchez-Mariñez, R.I., Cortez-Rocha, M.O., Ortega-Dorame, F., Morales-Valdes, M.,Silveira, M.I., 1997. End-use quality of flour from Rhyzopertha Dominica infestedwheat. Cereal Chemistry 74 (4), 481–483.
Tang, J., Sokhansanj, S., Yannacopoulos, S., Kasap, S.O., 1991. Specific heat capacityof lentil seeds by differential scanning calorimetry. Transactions of the ASAE 34(2), 517–522.
Wang, J., Olsen, R.G., Tang, J., Tang, Z., 2008. Influence of mashed potato dielectricproperties and circulating water electric conductivity on radio frequency at27 MHz. Journal of Microwave Power and Electromagnetic Energy 42 (2), 31–46.
Wang, S., Ikediala, J.N., Tang, J., Hansen, J.D., Mitcham, E., Mao, R., Swanson, B.,2001a. Radio frequency treatments to control codling moth in in-shell walnuts.Postharvest Biology and Technology 22 (1), 29–38.
Wang, S., Monzon, M., Johnson, J.A., Mitcham, E.J., Tang, J., 2007a. Industrial-scaleradio frequency treatments for insect control in walnuts: I. Heating uniformityand energy efficiency. Postharvest Biology and Technology 45 (2), 240–246.
Wang, S., Monzon, M., Johnson, J.A., Mitcham, E.J., Tang, J., 2007b. Industrial-scaleradio frequency treatments for insect control in walnuts. II: Insect mortality andproduct quality. Postharvest Biology and Technology 45 (2), 247–253.
Wang, S., Tang, J., Cavalieri, R.P., 2001b. Modeling fruit internal heating rates for hotair and hot water treatments. Postharvest Biology and Technology 22 (3), 257–270.
Wang, S., Tang, J., Cavalieri, R.P., Davies, D.C., 2003. Differential heating of insects indried nuts and fruits associated with radio frequency and microwavetreatments. Transactions of the ASAE 46 (4), 1175–1182.
Wang, S., Tang, J., Johnson, J.A., Mitcham, E., Hansen, J.D., Cavalieri, R., Bower, J.,Biasi, B., 2002. Process protocols based on radio frequency energy to controlfield and storage pests in in-shell walnuts. Postharvest Biology and Technology26 (3), 265–273.
Wang, S., Tiwari, G., Jiao, S., Johnson, J.A., Tang, J., 2010. Developing postharvestdisinfestation treatments for legumes using radio frequency energy. BiosystemsEngineering 105 (3), 341–349.
Yang, J., Zhao, Y., Wells, J.H., 2003. Computer simulation of capacitive radiofrequency (RF) dielectric heating on vegetable sprout seeds. Journal of FoodProcess Engineering 26 (3), 239–263.