Computer Science Sakai and Wei, J Comput Sci Syst … · automatic algorithms, such as the...
6
Volume 6(3): 112-117 (2013) - 112 J Comput Sci Syst Biol ISSN:0974-7230 JCSB, an open access journal Research Article Open Access Sakai and Wei, J Comput Sci Syst Biol 2013, 6:3 http://dx.doi.org/10.4172/jcsb.1000108 Research Article Open Access Computer Science Systems Biology Keywords: Electrocardiogram; Fractal dimension; Short-duration TWA; Sudden cardiac death; T-wave alternans Introduction Microvolt T-wave alternans T o assess the risk of Sudden Cardiac Death (SCD), several electrocardiograms (ECG)-based predictors have been proposed in [1]. Among these, T-wave alternans (TWA) is one of the most promising predictors of SCD [2,3], which is defined as a beat-to-beat change in the amplitude of the T-wave that repeats once every other beat. Because visible TWA is rarely found in clinical diagnoses, effective computerized methods are necessary to detect invisible TWA or Microvolt TWA (MTWA) [4]. Previous research on quantification of T-wave alternans Of the various automatic algorithms to detect or quantify MTWA that are currently available, two algorithms are considered to be mainstream for MTWA analysis. e first one, which is regarded as the gold-standard algorithm, is based on the periodogram proposed in Smith et al. (1988) [5,6]. In this method, ST-T segments of 128 beats are aligned, and the periodogram-based cycle per beat (cpb) frequency analysis is performed for each sample. en, the value of an aggregate spectrum at 0.5 cpb is compared with the noise level to determine the presence of TWA. is algorithm has been included in the commercial equipment such as CH2000 Cardiac Diagnostic System of Cambridge Heart. e other mainstream technique is the Modified Moving Average (MMA) method [7]. e MMA method is based on a time-domain analysis procedure that consists of computing a recursive running average of odd and even beats. is algorithm has been specially improved for the measurement of ambulatory ECG. Measuring equipment that uses the MMA method has also been implemented in the “CASE-8000” Stress System of GE Medical Systems. Martinez and Olmos [8] have reviewed various other MTWA analysis methods. ey have defined a unified methodological framework of TWA analysis to compare 12 methods with one other, including complex demodulation [9], KL transform [10], Poincaré mapping [11], periodicity transforms [12], the Laplacian likelihood ratio [13], the correlation method [14], and the capon filtering method [15]. In more recent years, Boix et al. presented the TWA detection method in a continuous wavelet component [16] using simulated TWA dataset. ey suggested TWA detection at the level of wavelet decomposition j=9. Rajabi and Ghassemian [17] proposed the Lyapunov exponents-based method but this algorithm was not effective unless TWA value was sufficiently large (>100 μV). In addition, Goldberger et al proposed a nonnegative matrix factorization (NMF) algorithm for detection of beat-to-beat T-wave change [18]. However, as we will discuss later, this algorithm also has a limitation in relation to a required number of T-wave. Quantification of short-duration t-wave alternans and the fractal dimension algorithm TWA is classified as sustained or long-duration TWA (LDTWA), which is derived from 64 or more consecutive heartbeats, or as non- sustained variation, which is defined as a short-duration TWA (SDTWA) derived from 16 or fewer consecutive heartbeats [18]. Approximately 3.0% of patients who succumbed to SCD were identified in clinical studies [19] using either LDTWA or SDTWA. On the other hand, the identification rate increased to approximately 6.0% when both LDTWA and SDTWA were used simultaneously. is result indicates a significant improvement in accuracy when both LDTWA and SDTWA are used simultaneously to assess the risk of SCD. *Corresponding author: Motoki Sakai, Tokyo Denki University, School of Information Environment, 2-1200 Muzai Gakuendai Inzai City, Chiba Prefecture, 270-1382, Japan, E-mail: [email protected] Received May 13, 2013; Accepted June 17, 2013; Published June 20, 2013 Citation: Sakai M, Wei D (2013) Fractal-Dimension-Based Method for Quantification of T-Wave Alternans Using Short Time Series. J Comput Sci Syst Biol 6: 112-117. doi:10.4172/jcsb.1000108 Copyright: © 2013 Sakai M, et al. This is an open-access article distributed under the terms of the Creative Commons Attribution License,which permits unrestricted use, distribution, and reproduction in any medium, provided the original author and source are credited. Abstract The presence of T-Wave Alternans (TWA) in an electrocardiogram (ECG) has been certified as an important predictor for the risk of sudden cardiac death (SCD). TWA is a beat-to-beat change in the amplitude of a T-wave, but is rarely visible to the naked eye. Thus, automatic detection and quantification of TWA are desirable. While several automatic algorithms, such as the periodogram method or the modified moving average method (MMA), have been developed to detect or quantify TWA, most conventional methods do not effectively measure short-duration TWA (SDTWA) (<16 beats). In this paper, we proposed a fractal dimension based SDTWA quantification method, and evaluated it with simulated ECG signals with SDTWA episodes (<16 beats) based on the European ST-T database. In the evaluation, the proposed method was applied to ECG signals with TWA amplitude of 5, 15, 30, 45, 60 and 75 μV. Sensitivity and positive predictivity of over or closed to 90% were obtained except for the 5 μV SDTWA episodes. Even for 5 μV SDTWA episodes, the sensitivity reached 75%. We believe that proposed s fractal dimension based method is a promising method for SDTWA analysis. Fractal-Dimension-Based Method for Quantification of T-Wave Alternans Using Short Time Series Motoki Sakai 1 * and Daming Wei 2 1 Tokyo Denki University, School of Information Environment, 2-1200 Muzai Gakuendai Inzai City, Chiba Prefecture, 270-1382, Japan 2 Tohoku University Graduate School of Medicine, Sendai City, Japan, and School of Computer Science, Shanghai University, China
Transcript of Computer Science Sakai and Wei, J Comput Sci Syst … · automatic algorithms, such as the...

Volume 6(3): 112-117 (2013) - 112 J Comput Sci Syst Biol ISSN:0974-7230 JCSB, an open access journal
Research Article Open Access
Sakai and Wei, J Comput Sci Syst Biol 2013, 6:3http://dx.doi.org/10.4172/jcsb.1000108
Research Article Open Access
Computer Science
Systems Biology
Keywords: Electrocardiogram; Fractal dimension; Short-duration TWA; Sudden cardiac death; T-wave alternans
IntroductionMicrovolt T-wave alternans
To assess the risk of Sudden Cardiac Death (SCD), several electrocardiograms (ECG)-based predictors have been proposed in [1]. Among these, T-wave alternans (TWA) is one of the most promising predictors of SCD [2,3], which is defined as a beat-to-beat change in the amplitude of the T-wave that repeats once every other beat. Because visible TWA is rarely found in clinical diagnoses, effective computerized methods are necessary to detect invisible TWA or Microvolt TWA (MTWA) [4].
Previous research on quantification of T-wave alternans
Of the various automatic algorithms to detect or quantify MTWA that are currently available, two algorithms are considered to be mainstream for MTWA analysis. The first one, which is regarded as the gold-standard algorithm, is based on the periodogram proposed in Smith et al. (1988) [5,6]. In this method, ST-T segments of 128 beats are aligned, and the periodogram-based cycle per beat (cpb) frequency analysis is performed for each sample. Then, the value of an aggregate spectrum at 0.5 cpb is compared with the noise level to determine the presence of TWA. This algorithm has been included in the commercial equipment such as CH2000 Cardiac Diagnostic System of Cambridge Heart. The other mainstream technique is the Modified Moving Average (MMA) method [7]. The MMA method is based on a time-domain analysis procedure that consists of computing a recursive running average of odd and even beats. This algorithm has been specially improved for the measurement of ambulatory ECG. Measuring equipment that uses the MMA method has also been implemented in the “CASE-8000” Stress System of GE Medical Systems.
Martinez and Olmos [8] have reviewed various other MTWA analysis methods. They have defined a unified methodological framework of TWA analysis to compare 12 methods with one other, including complex demodulation [9], KL transform [10], Poincaré
mapping [11], periodicity transforms [12], the Laplacian likelihood ratio [13], the correlation method [14], and the capon filtering method [15].
In more recent years, Boix et al. presented the TWA detection method in a continuous wavelet component [16] using simulated TWA dataset. They suggested TWA detection at the level of wavelet decomposition j=9. Rajabi and Ghassemian [17] proposed the Lyapunov exponents-based method but this algorithm was not effective unless TWA value was sufficiently large (>100 μV). In addition, Goldberger et al proposed a nonnegative matrix factorization (NMF) algorithm for detection of beat-to-beat T-wave change [18]. However, as we will discuss later, this algorithm also has a limitation in relation to a required number of T-wave.
Quantification of short-duration t-wave alternans and the fractal dimension algorithm
TWA is classified as sustained or long-duration TWA (LDTWA), which is derived from 64 or more consecutive heartbeats, or as non-sustained variation, which is defined as a short-duration TWA (SDTWA) derived from 16 or fewer consecutive heartbeats [18]. Approximately 3.0% of patients who succumbed to SCD were identified in clinical studies [19] using either LDTWA or SDTWA. On the other hand, the identification rate increased to approximately 6.0% when both LDTWA and SDTWA were used simultaneously. This result indicates a significant improvement in accuracy when both LDTWA and SDTWA are used simultaneously to assess the risk of SCD.
*Corresponding author: Motoki Sakai, Tokyo Denki University, School of Information Environment, 2-1200 Muzai Gakuendai Inzai City, Chiba Prefecture, 270-1382, Japan, E-mail: [email protected]
Received May 13, 2013; Accepted June 17, 2013; Published June 20, 2013
Citation: Sakai M, Wei D (2013) Fractal-Dimension-Based Method for Quantification of T-Wave Alternans Using Short Time Series. J Comput Sci Syst Biol 6: 112-117. doi:10.4172/jcsb.1000108
Copyright: © 2013 Sakai M, et al. This is an open-access article distributed under the terms of the Creative Commons Attribution License,which permits unrestricted use, distribution, and reproduction in any medium, provided the original author and source are credited.
AbstractThe presence of T-Wave Alternans (TWA) in an electrocardiogram (ECG) has been certified as an important
predictor for the risk of sudden cardiac death (SCD). TWA is a beat-to-beat change in the amplitude of a T-wave, but is rarely visible to the naked eye. Thus, automatic detection and quantification of TWA are desirable. While several automatic algorithms, such as the periodogram method or the modified moving average method (MMA), have been developed to detect or quantify TWA, most conventional methods do not effectively measure short-duration TWA (SDTWA) (<16 beats). In this paper, we proposed a fractal dimension based SDTWA quantification method, and evaluated it with simulated ECG signals with SDTWA episodes (<16 beats) based on the European ST-T database. In the evaluation, the proposed method was applied to ECG signals with TWA amplitude of 5, 15, 30, 45, 60 and 75 μV. Sensitivity and positive predictivity of over or closed to 90% were obtained except for the 5 μV SDTWA episodes. Even for 5 μV SDTWA episodes, the sensitivity reached 75%. We believe that proposed s fractal dimension based method is a promising method for SDTWA analysis.
Fractal-Dimension-Based Method for Quantification of T-Wave Alternans Using Short Time SeriesMotoki Sakai1* and Daming Wei2
1Tokyo Denki University, School of Information Environment, 2-1200 Muzai Gakuendai Inzai City, Chiba Prefecture, 270-1382, Japan2Tohoku University Graduate School of Medicine, Sendai City, Japan, and School of Computer Science, Shanghai University, China

Citation: Sakai M, Wei D (2013) Fractal-Dimension-Based Method for Quantification of T-Wave Alternans Using Short Time Series. J Comput Sci Syst Biol 6: 112-117. doi:10.4172/jcsb.1000108
Volume 6(3): 112-117 (2013) - 113 J Comput Sci Syst Biol ISSN:0974-7230 JCSB, an open access journal
Application of the TWA to the prediction of ventricular tachycardia revealed that prominent TWA followed the onset of torsade de pointes ventricular tachycardia, but that it was intermittent and appeared only for a short time series [20]. This type of TWA can be regarded as an SDTWA.
Most existing methods, such as the periodgram method as an example, require a large number of beats, and usually are not suitable for SDTWA. On the other hands, the Nonnegative Matrix Factorization (NMF) based method is designed for beat-to-beat analysis; it needs a decomposition procedure [18], which still requires a large number of beats to decompose T-wave time series in time-frequency area. It is therefore a fact that an appropriate method is required for detection of SDTWA in the exactly sense of short time ECG series.
In this paper, we propose a fractal-dimension-based method [21] for SDTWA, because it can be calculated from short time series. Furthermore, the fractal dimension is often used for the analysis of Heart Rate Variability (HRV), being effective to quantify a fluctuation of bio-signal. For example, literature [22] showed that the fractal dimension could distinguish fluctuations of HRV between normal and stroke subjects.
Methods are described and evaluation using European ST-T database is presented in the following sections. It will be shown that fractal dimension is identified to be able to quantify the fluctuation of ECG time series, and is promising for our goal.
MethodsThree-stage unified framework for MTWA analysis
A generic framework for TWA analysis was described by Martinez and Olmos [8]. This framework is composed of three stages: preprocessing, data reduction, and TWA analysis, and each stage have been further subdivided into several steps.
The preprocessing stage consists of linear filtering, baseline wander removal, QRS detection, beat rejection, segmentation window, alignment, and segment matrix filtering. The first three of these steps, linear filtering, baseline wander removal, and QRS detection, are common to all other ECG-based diagnosis techniques. In the beat rejection, ectopic beats or unstable R-R interval periods are rejected using the following procedure. The rejection is performed for pairs of odd and even beats. To calculate the TWA value using the following steps, the segment where the TWA value is computed must be determined in advance. In most studies, a T, ST or ST-T segment (say “window”) is selected with a fixed length L. In the alignment step, M beats of the ECG signal are mapped onto a L M× segment matrix
0 1, , MX x x − =
, where [0], , [ 1]T
i i ix x x L = −
is the ith segment. In the segment matrix filtering step, row-or column-wise filtering is performed for the aligned segment matrix X .
The data reduction stage does not directly affect the accuracy of TWA detection and quantification. In this step, L is reduced to a small number in such a way as to decrease computational cost. For example, it can be implemented using the decimation [8]. However, this step is not performed in this research.
In the TWA analysis stage, the presence or absence of TWA is estimated, and then the TWA value is calculated by a method such as the periodogram method or MMA.
In the present paper, we follow the above framework to introduce our method for the calculation of the TWA value.
Fractal-dimension-based TWA analysis method
Figure 1 shows the processing flow of the proposed method. In our method, linear filtering, beat rejection, and data reduction are not performed.
Baseline wander removal: In the proposed method, the baseline wander removal is achieved by fast Fourier transformation (FFT). First, the raw ECG signal is transformed into the frequency domain, and then the low-frequency bands are set to zero. Finally, inverse FFT is performed so that the ECG signal is obtained without baseline wander. The FFT-based baseline removal was also used in the program that achieved the highest score (0.911) in the competition of PhysioNet and Computers in Cardiology [23].
QRS detection: In this study, the wavelet transform was employed for QRS detection in time-frequency area [8].
Segmentation window and alignment: To calculate the TWA value, only peak values of the T-wave is considered in this study. In this case, we considered the length of segment L=1, and the segment matrix and 1 M× matrix (a series of T-wave amplitudes). The peak of the T-wave is detected as the peak value between location of the k-th QRS peak plus 20 samples and that of the (k+1)th QRS peak minus 20 samples.
Segment matrix filtering: In this research, row-wise segmentation matrix filtering is applied. This filtering has two steps: the correction of outlier beats and detrending of the segment matrix. The correction of outlier beats was inspired by the robust statistics [24] as described below.
As its name suggests, the magnitude of MTWA is microvolt-order. Therefore, a change of more than millivolt-order can be regarded not as a fluctuation due to TWA but as the outlier beat for TWA analysis. For general robust statistics, outliers are corrected using a threshold value that is calculated using information from all the beats. In this research, threshold values are separately calculated for odd and even beats because it is expected that amplitudes of odd and even T-waves would be different if TWA occurs. In a period containing TWA, averages of odd and even T-wave amplitudes differ from each other, because a magnitude relation between odd and even beats must become conspicuous. Thus, it makes sense to separately calculate threshold
Figure 1: Processing flow.

Citation: Sakai M, Wei D (2013) Fractal-Dimension-Based Method for Quantification of T-Wave Alternans Using Short Time Series. J Comput Sci Syst Biol 6: 112-117. doi:10.4172/jcsb.1000108
Volume 6(3): 112-117 (2013) - 114 J Comput Sci Syst Biol ISSN:0974-7230 JCSB, an open access journal
values for odd and even beats. Noting that Xodd is the segment matrix for odd beats and Xeven is that for even beats, Eq. (1) defines a particular standard deviation oddMAD for the odd beat segment matrix Xodd that is expected to be unaffected by outliers.
(| ( ) |) / 0.6745odd odd oddMAD median X median X= − (1)
evenMAD is calculated in a similar fashion in terms of the even beat segment matrix evenX . The scale factor 0.6745 makes the estimate unbiased for the normal distribution [24].
The correction of outlier beats for the segment matrix of odd beats is performed as follows:
( ) ( )( ) ( )
odd odd odd odd
odd odd odd odd odd
Sodd
median X if X median X c MAD
X median X if X median X c MAD
X else
> + ×= < − ×
(2)
Where c is a constant set to 10, the segment matrix of even beats is corrected similarly. Figure 5 is an example showing results of outlier beats correcting.
After the correction of outlier beats, the segment matrices for odd and even beats are united into single segment matrix.
To detrend, an approximative straight line of corrected segment matrix is estimated using a least squares approximation polynomial, then subtracted from corrected segment matrix to obtain detrended segment matrix.
TWA Analysis
The fractal dimension, an index to measure the irregularity of signals, is proposed be the TWA value. We use here the algorithm of Higuchi [21], which is a straightforward method to extract the fractal dimension of time series data, as follows.
Suppose that we have time series,
( ) ( 1, , )X i i N=
, (3)
Where N (<M) is the number of beats from which the fractal dimension is computed. For SDTWA detection in this study, N=16 is selected. With respect to )(iX , the length of the curve ( )( 1, , )mL k m k=
is calculated as
[ ]( ) /
1
1 1( ) ( ) ( ( 1) )N m k
m N mi k
NL k X m ik X m i kk k
−
−=
− = + − + − ∑ , (4)
Where [ ] denotes Gaussian notation and m and k indicate the initial time and the interval time, respectively. In this research, k was set to 6 because scores were typically high for all N. The length of the curve for time interval k is defined by
1
1( ) ( )k
mm
L k L kk =
= ∑ . (5)
If the curve has fractal properties, )(kL will be proportional toDk − , where D is the fractal dimension. This can be determined from
a log-log plot of )(kL against k , which gives a straight line with slope –D. In particular, the fractal dimension D is calculated as the coefficient –D of primary expression ))(log(kP to ))(log( kL by the least squares approximation.
An example of calculation of the fractal dimension is shown in Figure 2.
Presence/Absence estimation: After calculation of D, a threshold method is performed to estimate presence of SDTWA episode. Concretely, the fractal dimension D is compared to a threshold level. If D is larger than the threshold level, it can be estimated that SDTWA episode is present. A procedure for determining threshold level will be described below.
Presentation of ResultsSimulation of signals with SDTWA using European ST-T database
To evaluate the proposed method, simulated ECG signals with SDTWA episode were generated because of lack of databases containing actual ECG signal with SDTWA. For generation of simulated ECG signal, European ST-T database [25] was adopted.
The European ST-T database was developed for evaluation of algorithms for analysis of ST and T-wave changes. It contains 79 subjects, aged from 30 to 84. Each record is of two hours in duration. Each ECG signal was sampled at 250 samples per second with 12-bit resolution over a nominal 20 mV input range.
To generate simulated ECG signals, nine healthy subjects’ data were selected by reference to annotation files. Selected nine data contain approximately 77000 beats in total.
SDTWA episode was generated by adding pseudo TWA to selected subjects’ data. As shown in Figure 3, pseudo T-wave changes were simulated using a Hanning window that has been added to T-wave segments. In this study, T-wave changes in amplitude were set to 5, 15, 30, 45, 60 and 75 μV, respectively. In each amplitude, 2700 simulated SDTWA episodes were added, whose duration ranged from 10 to 16 beats.
Determination of threshold level
As described previously, the presence/absence estimation is carried out with threshold of fractal dimension value. To do this, we firstly investigated histograms of fractal dimension calculated from 16 beats T-wave time series to determine the threshold level. Figure 4a illustrates histogram of fractal dimension of T-wave time series without TWA episode (normal). It can be seen that a mean of fractal dimension is approximately 2.2. Figure 4b and Figure 4c show histograms of those with 5 and 75 μV SDTWA, respectively. As shown in these figures, the mean of fractal dimension tended to be proportional to the amplitude
Figure 2: Pseudo source code for calculation Eqs. (4) and (5): variables such as k, m, I and N correspond to those of Eqs. (4) and (5). L[k] and Lk[k] mean left-hand sides in Eqs. (4) and (5), respectively.

Citation: Sakai M, Wei D (2013) Fractal-Dimension-Based Method for Quantification of T-Wave Alternans Using Short Time Series. J Comput Sci Syst Biol 6: 112-117. doi:10.4172/jcsb.1000108
Volume 6(3): 112-117 (2013) - 115 J Comput Sci Syst Biol ISSN:0974-7230 JCSB, an open access journal
detdet
number of correctly ected episodePtotal number of ected episode
+ = (7)
Results of evaluation
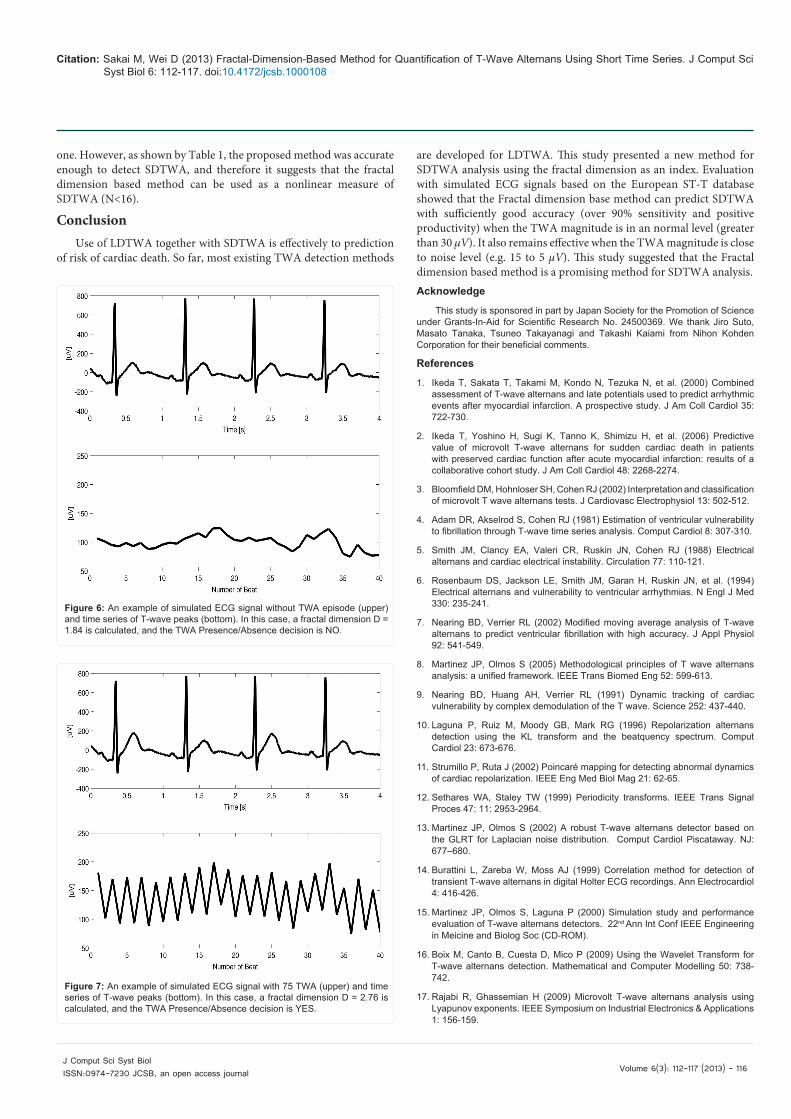
Table 1 gives an overall performance using fractal dimension based method as described above when applied to simulated ECG signals with different amplitudes of SDTWA (5, 15, 30, 45, 60 and 75 μV). Figure 6 and Figure 7 show two examples of simulated ECG and corresponding results of TWA prediction. The evaluation is discussed in the next section.
DiscussionTable 1 shows that in the cases where TWA has amplitudes
from 30 to 75 μV, both S and P+achieve over 90%. For case of TWA amplitude of 75 μV, a 100% prediction is achieved. That means that the performance of fractal dimension based method is good enough when the TWA amplitude is sufficiently large. On the other hand, when the TWA amplitude becomes lower, the S and P+become lower, but keep 87% for TWA amplitude of 15 Vµ and 75% for TWA amplitude of 5 μV. This means that the fractal dimension based method remains effective even when the TWA amplitude is close to the noise level.
While the theoretical range of the fractal dimension D of a one-dimensional time series is 21 << D , fractal dimensions computed for this research were larger than 2, which can be explained by the short lengths of time series. It has been reported [21] that calculations with large values of N bring the fractal dimension close to the theoretical
Figure 3: Simulated ECG signal with short duration TWA.
Figure 4: Histograms of the fractal dimension calculated from 16 beats T-wave amplitudes, (a), (b) and (c) show histograms calculated from data without TWA, and with 5 μV and 75 μV TWA episodes, respectively.
Figure 5: An example to show the correction of outlier beats using the robust statistics-like method. Left: original series of T-wave amplitudes. Right: the processed series.
SDTWA amplitude ( Vµ ) S (%) P+(%)
5 75 75
15 87 87
30 95 95
45 92 92
60 97 97
75 100 100
Table 1: Result of Sdtwa Detection.
of SDTWA, implying that the mean of fractal dimension of T-wave time series without SDTWA might be smaller than those with SDTWA, and the lager the strength of SDTWA is, the larger the mean of fractal dimension is. Therefore, we determined the threshold level around 2.2 for presence/absence estimation. As a result, an empirical threshold level was set to 2.3 through a trial and error process.
Evaluation
In this paper, sensitivity (S) and positive predictivity (P+) are used as indexes of performance for SDTWA detection, which are defined by equations (6) and (7) [17].
detnumber of correctly ected episodeStotal number of simulated episode
= (6)
Citation: Sakai M, Wei D (2013) Fractal-Dimension-Based Method for Quantification of T-Wave Alternans Using Short Time Series. J Comput Sci Syst Biol 6: 112-117. doi:10.4172/jcsb.1000108
Volume 6(3): 112-117 (2013) - 116 J Comput Sci Syst Biol ISSN:0974-7230 JCSB, an open access journal
one. However, as shown by Table 1, the proposed method was accurate enough to detect SDTWA, and therefore it suggests that the fractal dimension based method can be used as a nonlinear measure of SDTWA (N<16).
ConclusionUse of LDTWA together with SDTWA is effectively to prediction
of risk of cardiac death. So far, most existing TWA detection methods
are developed for LDTWA. This study presented a new method for SDTWA analysis using the fractal dimension as an index. Evaluation with simulated ECG signals based on the European ST-T database showed that the Fractal dimension base method can predict SDTWA with sufficiently good accuracy (over 90% sensitivity and positive productivity) when the TWA magnitude is in an normal level (greater than 30 μV). It also remains effective when the TWA magnitude is close to noise level (e.g. 15 to 5 μV). This study suggested that the Fractal dimension based method is a promising method for SDTWA analysis.Acknowledge
This study is sponsored in part by Japan Society for the Promotion of Science under Grants-In-Aid for Scientific Research No. 24500369. We thank Jiro Suto, Masato Tanaka, Tsuneo Takayanagi and Takashi Kaiami from Nihon Kohden Corporation for their beneficial comments.
References
1. Ikeda T, Sakata T, Takami M, Kondo N, Tezuka N, et al. (2000) Combined assessment of T-wave alternans and late potentials used to predict arrhythmic events after myocardial infarction. A prospective study. J Am Coll Cardiol 35: 722-730.
2. Ikeda T, Yoshino H, Sugi K, Tanno K, Shimizu H, et al. (2006) Predictive value of microvolt T-wave alternans for sudden cardiac death in patients with preserved cardiac function after acute myocardial infarction: results of a collaborative cohort study. J Am Coll Cardiol 48: 2268-2274.
3. Bloomfield DM, Hohnloser SH, Cohen RJ (2002) Interpretation and classification of microvolt T wave alternans tests. J Cardiovasc Electrophysiol 13: 502-512.
4. Adam DR, Akselrod S, Cohen RJ (1981) Estimation of ventricular vulnerability to fibrillation through T-wave time series analysis. Comput Cardiol 8: 307-310.
5. Smith JM, Clancy EA, Valeri CR, Ruskin JN, Cohen RJ (1988) Electrical alternans and cardiac electrical instability. Circulation 77: 110-121.
6. Rosenbaum DS, Jackson LE, Smith JM, Garan H, Ruskin JN, et al. (1994) Electrical alternans and vulnerability to ventricular arrhythmias. N Engl J Med 330: 235-241.
7. Nearing BD, Verrier RL (2002) Modified moving average analysis of T-wave alternans to predict ventricular fibrillation with high accuracy. J Appl Physiol 92: 541-549.
8. Martinez JP, Olmos S (2005) Methodological principles of T wave alternans analysis: a unified framework. IEEE Trans Biomed Eng 52: 599-613.
9. Nearing BD, Huang AH, Verrier RL (1991) Dynamic tracking of cardiac vulnerability by complex demodulation of the T wave. Science 252: 437-440.
10. Laguna P, Ruiz M, Moody GB, Mark RG (1996) Repolarization alternans detection using the KL transform and the beatquency spectrum. Comput Cardiol 23: 673-676.
11. Strumillo P, Ruta J (2002) Poincaré mapping for detecting abnormal dynamics of cardiac repolarization. IEEE Eng Med Biol Mag 21: 62-65.
12. Sethares WA, Staley TW (1999) Periodicity transforms. IEEE Trans Signal Proces 47: 11: 2953-2964.
13. Martinez JP, Olmos S (2002) A robust T-wave alternans detector based on the GLRT for Laplacian noise distribution. Comput Cardiol Piscataway. NJ: 677–680.
14. Burattini L, Zareba W, Moss AJ (1999) Correlation method for detection of transient T-wave alternans in digital Holter ECG recordings. Ann Electrocardiol 4: 416-426.
15. Martinez JP, Olmos S, Laguna P (2000) Simulation study and performance evaluation of T-wave alternans detectors. 22nd Ann Int Conf IEEE Engineering in Meicine and Biolog Soc (CD-ROM).
16. Boix M, Canto B, Cuesta D, Mico P (2009) Using the Wavelet Transform for T-wave alternans detection. Mathematical and Computer Modelling 50: 738-742.
17. Rajabi R, Ghassemian H (2009) Microvolt T-wave alternans analysis using Lyapunov exponents. IEEE Symposium on Industrial Electronics & Applications 1: 156-159.
Figure 6: An example of simulated ECG signal without TWA episode (upper) and time series of T-wave peaks (bottom). In this case, a fractal dimension D = 1.84 is calculated, and the TWA Presence/Absence decision is NO.
Figure 7: An example of simulated ECG signal with 75 TWA (upper) and time series of T-wave peaks (bottom). In this case, a fractal dimension D = 2.76 is calculated, and the TWA Presence/Absence decision is YES.

Citation: Sakai M, Wei D (2013) Fractal-Dimension-Based Method for Quantification of T-Wave Alternans Using Short Time Series. J Comput Sci Syst Biol 6: 112-117. doi:10.4172/jcsb.1000108
Volume 6(3): 112-117 (2013) - 117 J Comput Sci Syst Biol ISSN:0974-7230 JCSB, an open access journal
18. Ghoraani B, Krishnan S, Selvaraj RJ, Chauhan VS (2011) T wave alternans evaluation using adaptive time-frequency signal analysis and non-negative matrix factorization. Med Eng Phys 33: 700-711.
19. Rowlandson GI, Kaiser W, Slawnych M, Xue JQ, Exner D (2011) Method and system for detecting T-wave alternans. USA.
20. Armoundas AA, Nanke T, Cohen RJ (2000) Images in cardiovascular medicine. T-wave alternans preceding torsade de pointes ventricular tachycardia. Circulation 101: 2550.
21. Higuchi T (1988) Approach to an irregular time series on the basis of the fractal theory. Physica D 31: 277-283.
22. D’Addio G, Corbi G, Accardo A, Russo G, Ferrara N, et al. (2009) Fractal behaviour of heart rate variability reflects severity in stroke patients. Stud Health Technol Inform 150: 794-798.
23. Detecting and Quantifying T-Wave Alternans. A challenge from PhysioNet and Computers in Cardiology 2008.
24. Analytical Methods Committee (1989) Robust statistics–how not to reject outliers. Part 1. Basic concepts. Analyst 114: 1693-1697.
25. Goldberger AL, Amaral LA, Glass L, Hausdorff JM, Ivanov PC, et al. (2000) PhysioBank, PhysioToolkit, and PhysioNet: components of a new research resource for complex physiologic signals. Circulation 101: E215-E220.
Citation: Sakai M, Wei D (2013) Fractal-Dimension-Based Method for Quantification of T-Wave Alternans Using Short Time Series. J Comput Sci Syst Biol 6: 112-117. doi:10.4172/jcsb.1000108
Submit your next manuscript and get advantages of OMICS Group submissionsUnique features:
• Userfriendly/feasiblewebsite-translationofyourpaperto50world’sleadinglanguages• AudioVersionofpublishedpaper• Digitalarticlestoshareandexplore
Special features:
• 250OpenAccessJournals• 20,000editorialteam• 21daysrapidreviewprocess• Qualityandquickeditorial,reviewandpublicationprocessing• IndexingatPubMed(partial),Scopus,DOAJ,EBSCO,IndexCopernicusandGoogleScholaretc• SharingOption:SocialNetworkingEnabled• Authors,ReviewersandEditorsrewardedwithonlineScientificCredits• Betterdiscountforyoursubsequentarticles
Submityourmanuscriptat:http://www.editorialmanager.com/systemsbiology