Classification of Mental Task for Brain Computer … · Classification of Mental Task for Brain...
9
DOI : 10.23883/IJRTER.2017.3058.XDMNO 145 Classification of Mental Task for Brain Computer Interface Using Artificial Neural Network Mohammad Naushad 1 , Mohammad Waseem Khanooni 2 , Nicky Ballani 3 1,2,3 Department of Electronics and Telecommunication Engineering,S. B Jain Institute of Technology Management & Research, Katol Road, Nagpur, India Abstract: This paper deals with classification of mental task using PSD and ANN. In this work feature is extracted by using different PSD methods such as periodogram method, Welch method etc. After extracting the features signal is given to Neural Network for classification. In this work Back Propagation Algorithm has been used to train the Neural Network. The two task left hand and right hand real movement and left hand and right hand imaginary movement have been classified, and the comparison between real and imaginary movement has been discussed. The EEG signal is recorded using B-Alert system and also EEG data have been taken from BCI data base (BCI competition III data set V). Keywords: Power Spectral Density (PSD), Artificial Neural Network (ANN) Electroencephalogram (EEG), Brain Computer Interface (BCI). I. INTRODUCTION A BCI is a computer-based system that acquires brain signals, analyzes them, and translates them into commands that are relayed to an output device to carry out a desired action. In recent years mental tasks have been studied by many researchers and their study shows that BCI is useful for physically challenged individual. Such individuals who have lost their entire voluntary actions can only rely on their cognitive actions to interact with others BCI is useful for them [1]. An electroencephalogram (EEG) is the basic building block for Brain-Computer Interfaces. The Electroencephalogram (EEG) is used to measure the brain signals pertaining to various activities like imagining hand movements leg movement etc. The EEG recognition procedure mainly involves feature extraction from EEG signal and classification of mental task. The useful EEG signals contain huge data of brain signals. Numerous methods have been used to extract feature vectors from the EEG signals. The different PSD methods have used to extract the feature. The Fourier presented his famous method for representing signals in the frequency domain; life scientists have employed his transform in order to determine cyclical events in nature. The PSD is a powerful method for the identification of repetitive and correlated events, and was first refined by Schuster in the late 1800s, in order to accurately quantify natural phenomena for lunar and sunspot-induced earthquake predictions. Known as the periodogram, the resulting PSD is formed by averaging many Fourier spectra in order to improve signal to noise, and preserve frequency resolution. Since that time, signal processing has blossomed in the field of communications and biometric measurements. Non-parametric estimation methods involve simple averaging techniques of multiple spectra, which is well within the capabilities of even modest computing equipment. In addition to the basic periodogram, methods by Bartlett and Welch offer more advanced forms involving pre-filtering, and data windowing. Recent approaches involve developing parameterized models, whereby the PSD is represented by a high-order mathematical equation, instead of a simple running average. The extracted feature vectors are then classified using machine learning techniques like neural networks, linear discriminate analysis, support vector machines (SVM), common spatial pattern, etc.
Transcript of Classification of Mental Task for Brain Computer … · Classification of Mental Task for Brain...
DOI : 10.23883/IJRTER.2017.3058.XDMNO 145
Classification of Mental Task for Brain Computer Interface Using
Artificial Neural Network
Mohammad Naushad1, Mohammad Waseem Khanooni2, Nicky Ballani3 1,2,3 Department of Electronics and Telecommunication Engineering,S. B Jain Institute of Technology
Management & Research, Katol Road, Nagpur, India
Abstract: This paper deals with classification of mental task using PSD and ANN. In this work feature
is extracted by using different PSD methods such as periodogram method, Welch method etc. After
extracting the features signal is given to Neural Network for classification. In this work Back
Propagation Algorithm has been used to train the Neural Network. The two task left hand and right
hand real movement and left hand and right hand imaginary movement have been classified, and the
comparison between real and imaginary movement has been discussed. The EEG signal is recorded
using B-Alert system and also EEG data have been taken from BCI data base (BCI competition III
data set V).
Keywords: Power Spectral Density (PSD), Artificial Neural Network (ANN) Electroencephalogram
(EEG), Brain Computer Interface (BCI).
I. INTRODUCTION
A BCI is a computer-based system that acquires brain signals, analyzes them, and translates them into
commands that are relayed to an output device to carry out a desired action. In recent years mental
tasks have been studied by many researchers and their study shows that BCI is useful for physically
challenged individual. Such individuals who have lost their entire voluntary actions can only rely on
their cognitive actions to interact with others BCI is useful for them [1]. An electroencephalogram
(EEG) is the basic building block for Brain-Computer Interfaces. The Electroencephalogram (EEG) is
used to measure the brain signals pertaining to various activities like imagining hand movements leg
movement etc. The EEG recognition procedure mainly involves feature extraction from EEG signal
and classification of mental task. The useful EEG signals contain huge data of brain signals. Numerous
methods have been used to extract feature vectors from the EEG signals. The different PSD methods
have used to extract the feature. The Fourier presented his famous method for representing signals in
the frequency domain; life scientists have employed his transform in order to determine cyclical events
in nature. The PSD is a powerful method for the identification of repetitive and correlated events, and
was first refined by Schuster in the late 1800s, in order to accurately quantify natural phenomena for
lunar and sunspot-induced earthquake predictions. Known as the periodogram, the resulting PSD is
formed by averaging many Fourier spectra in order to improve signal to noise, and preserve frequency
resolution. Since that time, signal processing has blossomed in the field of communications and
biometric measurements. Non-parametric estimation methods involve simple averaging techniques of
multiple spectra, which is well within the capabilities of even modest computing equipment. In
addition to the basic periodogram, methods by Bartlett and Welch offer more advanced forms
involving pre-filtering, and data windowing. Recent approaches involve developing parameterized
models, whereby the PSD is represented by a high-order mathematical equation, instead of a simple
running average. The extracted feature vectors are then classified using machine learning techniques
like neural networks, linear discriminate analysis, support vector machines (SVM), common spatial
pattern, etc.

International Journal of Recent Trends in Engineering & Research (IJRTER) Volume 03, Issue 03; Month - 2017 [ISSN: 2455-1457]
@IJRTER-2017, All Rights Reserved 146
II. METHODOLOGY
The classification of mental task involves, EEG recording or EEG data from data base then the feature
extraction and finally classification.
2.1 Design Flow The EEG signals have been used for mental task classification, however the EEG signals are often
corrupted by power line interference noise and EMC induced noise. These artifacts strongly influence
the utility of recorded EEGs and need to be removed for better classification of mental task. Therefore
the signals were preprocessed and then used to extract the feature. The EEG signals are obtained from
B-Alert experimental setup for two subjects and also from BCI data base (BCI Competition III data
set V for three subjects). Then the different PSD methods have been employed for feature extraction.
The final step involves classification of mental task which has been done by using neural network
based on Back Propagation Algorithm.
Figure 1: Design Flow
2.2 Experimental paradigm
2.2.1 BCI Data set This dataset contains data from 3 normal subjects during 4 non-feedback sessions. The subjects sat in
a normal chair, relaxed arms resting on their legs. There are 3 tasks:
• Imagination of repetitive self-paced left hand movements, (left, class 2),
• Imagination of repetitive self-paced right hand movements, (right, class 3),
All 4 sessions of a given subject were acquired on the same day, each lasting 4 minutes with 5-10
minutes breaks in between them. The subject performed a given task for about 15 seconds and then
switched randomly to another task at the operator's request. EEG data is not splitted in trials since the
subjects are continuously performing any of the mental tasks. The algorithm should provide an output
every 0.5 seconds using the last second of data (see clarification in the paragraph 'Requirements and
Evaluation'.).
Data are provided in two ways:
• Raw EEG signals. Sampling rate was 512 Hz.
• Precomputed features. The raw EEG potentials were first spatially filtered by means of a
surface Laplacian. Then, every 62.5 ms --i.e., 16 times per second-- the power spectral density (PSD)
in the band 8-30 Hz was estimated over the last second of data with a frequency resolution of 2 Hz for
the 8 centro-parietal channels C3, Cz, C4, CP1, CP2, P3, Pz, and P4. As a result, an EEG sample is a
96dimensional vector (8 channels times 12 frequency components).
International Journal of Recent Trends in Engineering & Research (IJRTER) Volume 03, Issue 03; Month - 2017 [ISSN: 2455-1457]
@IJRTER-2017, All Rights Reserved 147
2.2.2 B-Alert Experimental Setup. The S.B. Jain Institute of Technology Management and Research has got grand from Research
Promotion Scheme (RPS) of AICET for BCI research work, under this scheme college has provided
us the two EEG recording system RMS EEG machine and B-Alert X10-Standard system. Here we
have discussed about B-Alert system.
B-Alert X10-Standard system is a wireless EEG data acquisition system. The data has been recorded
using B-Alert X10-Standard system. The experiment was done on two subjects. The subjects were
given to perform two different tasks left hand and right hand real and imaginary movement. For left
hand and right hand real movement data was recorded for around 3 minutes where as for left hand and
right hand imaginary movement recording was done for 2 minutes with sampling frequency of 256
Hz. X10-Standard system is a ten channels system the ten channels are ECG, F3, Fz, F4, C3, CZ, C4,
P3, POz and P4. In this 8 channels have been considered which are F3, Fz, F4, C3, CZ, C4, P3 and
POz.
2.3 Feature extraction: The EEG signals are used to classify the mental tasks; the feature is first extracted before classification.
The different PSD methods are used here to extract the features.
2.3.1 PSD Using FFT method: Power spectral density (PSD) is computed by performing Fast Fourier Transform (FFT) on a segment
of data that is of interest, and calculating the amplitudes of the sinusoidal components for designated
frequency bins. Input variables to this transformation are an EEG segment for which PSD is to be
computed, and its length; output variables include PSD amplitudes. Frequency domain variables are
based on the power spectral density derived after application of a 50% overlapping window, and a
FFT with and without application of a Kaiser window is calculated from 8Hz to 30 Hz for each EEG
channel that are logged to obtain a Gaussian distribution.
The 8 channels are (Poz, Fz, Cz, C3, C4, F3, F4, F3 and F3) used to calculate the PSD. The 12
components are calculated for each channel in 8Hz to 30 Hz band there by providing 96 components
for 8 channels. Both sets of PSD output files apply a 50% overlapping window which averages the
PSD across three x one-second overlays to smooth the data. The illustration below shows that overlays
0, 1, and 2 are averaged (each overlay containing 256 data points with 128 data points being shared
for each overlay) to provide the PSD values for epoch n:
Figure 2: Overlap Segment
International Journal of Recent Trends in Engineering & Research (IJRTER) Volume 03, Issue 03; Month - 2017 [ISSN: 2455-1457]
@IJRTER-2017, All Rights Reserved 148
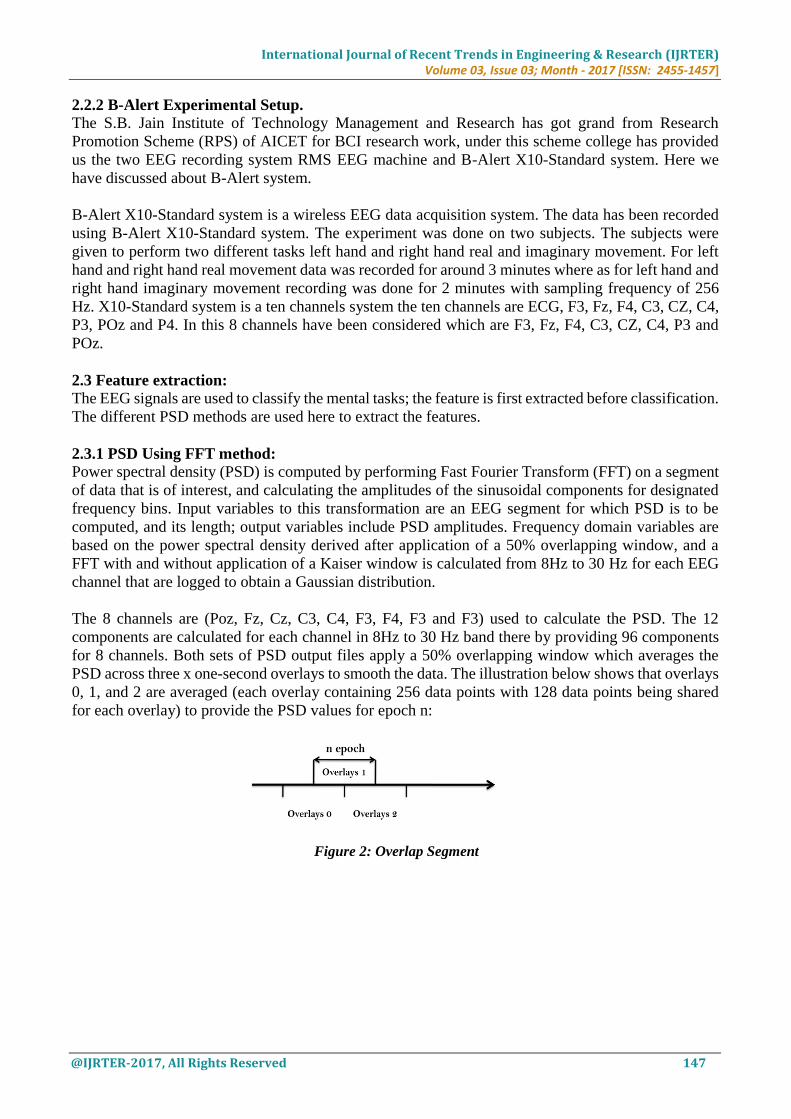
Figure 3: Plot for PSD estimated using FFT Method
Figure 4: Plot for PSD estimated using FFT Method with Kaiser Window
2.3.2 Periodogram Method. The well-know known form of the PSD is called periodogram. It was originally introduced by Schuster
(1898) to detect and measure “hidden periodicities” in data. The periodogram is given as. [30]
The periodogram Pxx(f) can be computed by use of DFT, which in turn in efficiently computed by an
FFT algorithm. If we have N data points, we compute as a minimum the Npoint DFT. For example,
the computation yields samples of the periodogram
k= 0, 1, 2 …… N-1.
at the frequencies f = k/N
Samples of the periodogram at fk = k=N, k =0, 1, : : : ,N ¡1 can be computed efficiently with the use
of the fast Fourier transform (FFT) algorithm while values at the other frequencies are evaluated by
either zero padding or interpolation.
International Journal of Recent Trends in Engineering & Research (IJRTER) Volume 03, Issue 03; Month - 2017 [ISSN: 2455-1457]
@IJRTER-2017, All Rights Reserved 149
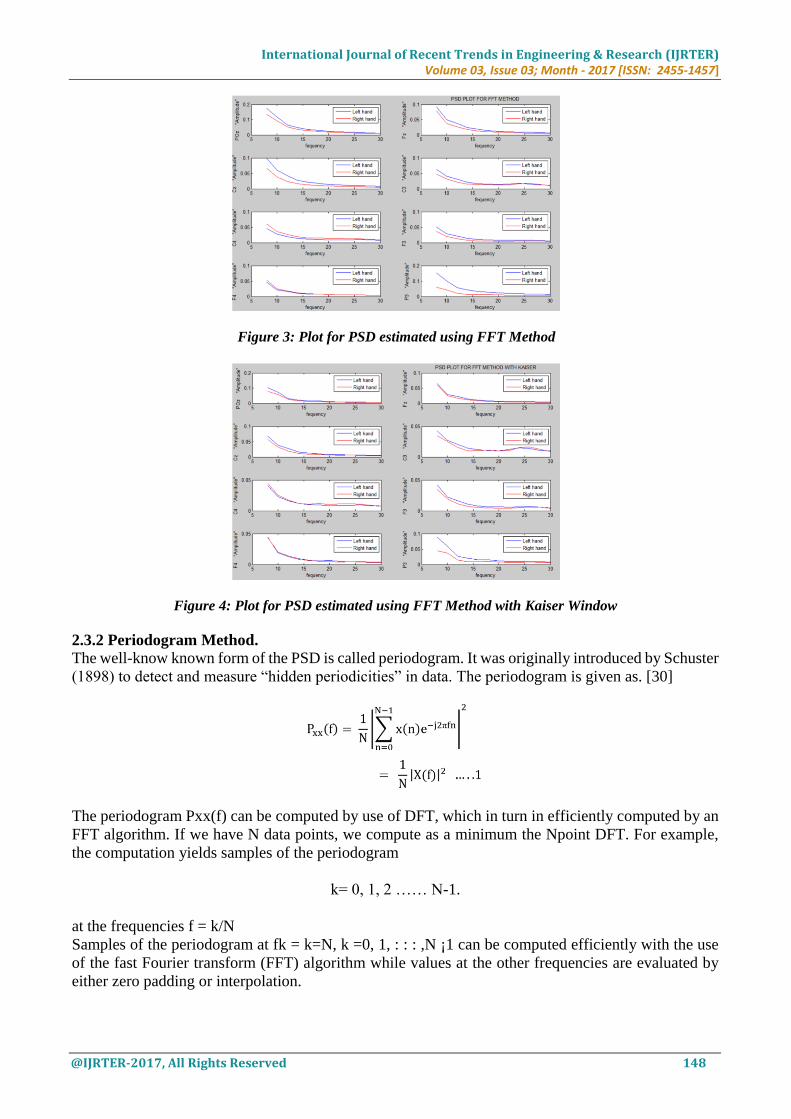
In this work Power spectral density (PSD) is computed by calculating periodogram without and with
hamming window for segment of data that is of interest. The periodogram is calculated till the last
epoch where each epoch consists of sequence of 256 samples.
Figure 5: Plot for PSD estimated using periodogram
2.3.3 Welch Method.
Power Spectral Estimate (PSE) is most important application area in Digital Signal Welch method
have two basic modifications to the Bartlett method. These are allowed the data length to overlap. The
data segment can be represented as
Where U is a normalization factor for the power
The Welch power spectrum estimate is the average of modified periodgram, is
Where iD is the starting point for the ith sequence. If D = M, the segment do not overlap and the L
of data sequence is identical to the data segment of Bartlett method. The second change in Welch
method is to window the data segments prior to computing the periodogram.
xx N

International Journal of Recent Trends in Engineering & Research (IJRTER) Volume 03, Issue 03; Month - 2017 [ISSN: 2455-1457]
@IJRTER-2017, All Rights Reserved 150
Mean value of Welch estimate
The resolution of estimated power estimation is determine by the spectral resolution of each segment
which is of length L. it is window dependent.
Welch allows the data segments to overlap and window the data segments prior to computing
preiodogram. Here the 256 point sequence is subdivided into 8 overlapping segments with 50%
overlap; each segment is windowed by hamming window. The again the PSD is calculated in same
frequency band 8 Hz to 30 Hz, 12 PSD components are calculated for each channel. Therefore for 8
channels 96 PSD components will be obtained.
Plot for PSD estimated using Welch Method
2.4 Classifier. In this work two task left hand and right hand real and imaginary movement has been classified using
Artificial Neural Network with different number of hidden layers and neurons. The back propagation
algorithm is used to train the neural network.
III. RESULT
In this work two task left hand and right hand real and imaginary movement has been classified using
Back propagation neural network with different number of hidden layers and neurons, where as the
feature is extracted using FFT method, Periodogram method, and Welch Method. The different result
i.e. classification accuracy has been obtained as shown in table below.
Table1. Comparative results for real hand movement for B-Alert data
Sr.
No.
No. of hidde n
layers
Neurons in each
layer
PSD Method
%
Accuracy
1 3 8 16 10 Periodogram 62
2 2 8 16 Periodogram 58
3 3 8 16 10 Periodogram with Hamming
window
74

International Journal of Recent Trends in Engineering & Research (IJRTER) Volume 03, Issue 03; Month - 2017 [ISSN: 2455-1457]
@IJRTER-2017, All Rights Reserved 151
4 2 16 10 Periodogram with Hamming
window
74
5 3 8 16 10 FFT method 92
6 2 8 10 FFT method 82
7 3 8 16 10 FFT method with Kaiser 88
8 2 8 16 FFT method
with Kaiser
66
9 3 8 16 10 Welch method 92.33
10 2 8 16 Welch method 86
Table2. Comparative results for Imaginary hand movement for B-Alert data
Sr.
No.
No. of hidden
layers
Neurons in
each
layer
PSD Method
%
Accuracy
1 3 8 16 10 Periodogram 53
2 2 8 16 Periodogram 54
3 3 8 16 10 Periodogram with Hamming
window
56.66
4 2 8 16 Periodogram with Hamming
window
46
5 3 8 16 10 FFT method 70
6 2 8 16 FFT method 50
7 3 8 16 10 FFT method with
Kaiser
70
8 2 8 16 FFT method with
Kaiser
63
9 3 8 16 10 Welch method 71
10 2 8 16 Welch method 62
Table3. Comparative results for Imaginary hand movement for BCI data
Sr.
No.
No. of hidden
layers
Neurons in each
layer
PSD Method
%
Accuracy
1 3 8 16 10 Periodogram 50
2 2 8 16 Periodogram 54
3 3 8 16 10 Periodogram with
Hamming window
74
4 2 8 16 Periodogram with
Hamming window
72

International Journal of Recent Trends in Engineering & Research (IJRTER) Volume 03, Issue 03; Month - 2017 [ISSN: 2455-1457]
@IJRTER-2017, All Rights Reserved 152
5 3 8 16 10 FFT method 80
6 2 8 16 FFT method 73.33
7 3 8 16 10 FFT method with Kaiser 100
8 2 8 16 FFT method with Kaiser 100
9 3 8 16 10 Welch method 100
10 2 8 16 Welch method 66
From above tables it can be seen that the accuracy of neural network increases as increase the number
of hidden layers but the complexity and computation time is also increased. The table below shows
the comparative results with different PSD techniques in term of maximum accuracy obtained.
Table4. Comparative results for real hand movement for
B-Alert data
Sr.
No.
PSD Method
%
Accuracy
1 Periodogram 62
2 Periodogram with Hamming window 74
3 FFT method 88
4 FFT method with Kaiser 92
5 Welch method 92.33
Table5. Comparative results for Imaginary hand movement for B-Alert data
Sr. No.
PSD Method
%
Accuracy
1 Periodogram 50
2 Periodogram with Hamming window 56.6
3 FFT method 70
4 FFT method with Kaiser 70
5 Welch method 71
For BCI competition III data set V, for subject 1 the two trials has been taken to calculate
classification accuracy the average classification accuracy is shown in table below.
Table6. Comparative results for Imaginary hand movement for BCI data base.
Sr. No.
PSD Method
%
Accuracy with
Trail1
%
Accuracy with
Trail2
%
Averag e
accurac y
1 Periodogram 50 50 50
2
Periodogram with
Hamming window 46 74 65
3 FFT method 60 80 70
4
FFT method
with Kaiser 100 100 100
5 Welch method 100 60 80

International Journal of Recent Trends in Engineering & Research (IJRTER) Volume 03, Issue 03; Month - 2017 [ISSN: 2455-1457]
@IJRTER-2017, All Rights Reserved 153
IV. CONCLUSION In this work the two task left hand and right real and imaginary movement have been classified for
which the EEG data has been recorded using B-Alert X10 standard wireless system on two subjects.
The comparative results for real hand movement for B-Alert data is given in table 4 and the
comparative results for imaginary hand movement for BAlert data is given in table 5. It is found that
the classification accuracy is found to be better in case of real hand movement.
The classification is also done for BCI competition III data set V, the classification accuracy for two
trials is shown in table 6. In which the accuracy with FFT method is found to be 100%.
The classification accuracy has also been calculated with different number of layers in neural network
and different number of neurons in each layer the as shown in table 1, table 2 and table 3. It can be
seen from table 1, table 2 and table 3 that the on an average the classification accuracy increases as we
increase the number of layer and neuron in the neural network.
REFERENCES 1. Padmanabh Mahesh Lanke, Prof. R. K. Shastri, Prof. S. D. Biradar “EEG Signal Processing Techniques for Mental
Task Classification ,” International Journal of Advanced Computing and Electronics Technology (IJACET),
ISSN(PRINT):2394-3408, (ONLINE):2394-3416,VOLUME-2,ISSUE-1,2015
2. Yang Zong-chang,” Establishing Structure for Neural Networks Based-on Fractal. Journal of Theoretical and Applied
Information Technology 10th March 2013. Vol. 49 No.1, ISSN: 1992-8645, E-ISSN: 1817-3195 p. 342_347
3. H. C. So, Y. T. Chan “Comparison of Various Periodograms for Sinusoid Detection and Frequency Estimation”,
IEEE Transactions on Aerospace and Electronic system VOL. 35, NO. 3 pp. 945-952 JULY 1999
4. Soosan Beheshti “Mean-Square Error in Periodogram Approaches with Adaptive Windowing” IEEE Transaction on
signal processing VOL. 59, NO. 3 .pp.923-935, March 2011.
5. Sem a Arslan, Gulay T ezel, and Ha kan Islk, “EEG Signals Classification Using a Hybrid Structure of ANN and
PSO”, International Journal of Future Computer and Communication, Vol. 1, No. 2, August 2012
6. Hansa Rani Gupta, Rajesh Mehra, “Power Spectrum Estimation using Welch Method for various Window
Techniques”, International Journal of Scientific Research Engineering & Technology (IJSRET) Volume 2 Issue 6 pp
389-392 September 2013, ISSN 2278 – 0882
7. Mythra H V, Veenakumari H M, Sanjeev Kubakaddi ., “ Multi-Class EEG Classification for Brain Computer
Interface”, International Journal of Scientific & Engineering Research, Volume 4, Issue 9, September-2013 p. 2304-
2307
8. Shaik.Jakeer Husain and K.Srinivasa.Rao “Epileptic Seizures Classification from EEG Signals using Neural
Networks”, 2012 International Conference on Information and Network Technology (ICINT 2012) IPCSIT vol. 37 p
269-273 (2012) © (2012) IACSIT Press, Singapore