COMPREHENSIVE SOLID WASTE MANAGEMENT PLAN
177
CITY OF DANVILLE VIRGINIA COMPREHENSIVE SOLID WASTE MANAGEMENT PLAN ORIGINAL PLAN – JUNE 1991 PLAN UPDATED – JUNE 1997 PLAN SUBMITTED TO DEQ – JULY 2004 PLAN REVISED – MAY 2005 FINAL REPORT
Transcript of COMPREHENSIVE SOLID WASTE MANAGEMENT PLAN

CITY OF DANVILLEVIRGINIA
COMPREHENSIVE SOLID WASTEMANAGEMENT PLAN
ORIGINAL PLAN – JUNE 1991PLAN UPDATED – JUNE 1997PLAN SUBMITTED TO DEQ – JULY 2004PLAN REVISED – MAY 2005
FINALREPORT

City of Danville, Public Works Department 1990 Comprehensive Solid Waste Management Plan – 2004 UPDATE REVISED
City of Danville COMPREHENSIVE SOLID WASTE MANAGEMENT PLAN
BRIEF SUMMARY
1.0 Introduction
1.1 Purpose of Plan
1.2 Planning Process
1.3 Solid Waste Advisory Committee
1.4 Public Hearing and Plan Approval Process
1.5 Danville Solid Waste Management Goals and Objectives
2.0 Background
2.1 Description of Danville
2.2 Solid Waste Generation
3.0 Current Solid Waste Management Practices
3.1 Collection
3.2 Disposal
3.3 Reuse/Recycling
3.4 Public Education and Promotion of Recycling
3.5 Regional Waste Management Activities
4.0 Source Reduction and Materials Reuse
4.1 Introduction
4.2 Source Reduction Strategy
4.3 Education
4.4 Incentives
4.5 In-house Source Reduction/Reuse

City of Danville, Public Works Department 1990 Comprehensive Solid Waste Management Plan – 2004 UPDATE REVISED
City of Danville COMPREHENSIVE SOLID WASTE MANAGEMENT PLAN
5.0 Recycling
5.1 Methods of Achieving Commonwealth Goals
5.2 Non-household Recyclable Materials
5.3 Household Recyclable Materials
5.4 Recycling Education and Promotion Strategies
6.0 Special Waste Management
6.1 Introduction
6.2 Strategies for Implementation
7.0 Composting
7.1 Introduction
7.2 Role of Composting in Managing Danville’s Waste Stream
7.3 Compostable Fraction of the Waste Stream
7.4 Implementation Strategy for Composting
8.0 Consideration of Waste-to-Energy/Incineration
9.0 Volume Reduction and Landfilling
9.1 Landfill Existing Conditions
9.2 Future Capacity Requirements
9.3 Evaluation of Transfer Station
10.0 Implementation of Plan Components
10.1 Implementation Schedule and Milestones for Achieving State Goals
10.2 Recycling Calculation Methodology
10.3 Funding & Construction Schedules
10.4 Financing Mechanism
10.5 Conclusion

City of Danville, Public Works Department 1990 Comprehensive Solid Waste Management Plan – 2004 UPDATE REVISED
City of Danville COMPREHENSIVE SOLID WASTE MANAGEMENT PLAN
Appendices
Appendix A ........... Advisory Committee
Appendix B ........... City Council Resolution Adopting Plan and Public Participation
Appendix C ............ Virginia Solid Waste Management Regulations
Appendix D............ Marketing
Appendix E ............ Current Budget
Appendix F ............ 1997 Plan Update
Appendix G............ Method of Tracking Waste Generation
Appendix H............ Danville Transfer Station Agreement

City of Danville, Public Works Department 1990 Comprehensive Solid Waste Management Plan – 2004 REVISED
BRIEF SUMMARY The following Comprehensive Solid Waste Management Plan for the City of Danville was
adopted in 1991, updated in 1997 and again in June 2004 as required by the amended Solid
Waste Regulations. The 2004 plan update extends the current planning period 20-years
through 2024. Since 1990, the City has made significant progress in its reduce, reuse, and
recycle efforts. Some of the more significant accomplishments are as follows:
RECYCLING • 100% of the arboreal material has been removed from the waste stream and is
currently being processed by the Danville Composting Facility. The facility is
processing approximately 10,700 tons of loose leaves, yard waste, grass clippings, etc.
per year into compost and is providing it free to area residents. The facility’s compost
is in high demand during spring and fall and hundreds of pickup trucks per week can
be seen picking up compost and mulch. In addition, the facility maintains a firewood
stock pile which also is free to area residents and is very busy during winter months.
• Drop-off Recycling Program DISPOSAL • The City’s long-term disposal has been addressed by closing the landfill, adjacent to
the airport, and entering a long-term contract with Waste Management for operation
of a local Transfer Station for solid waste. At a cost of $6.00 per ton in 1990, the
annual tonnage at the landfill was 113,168 tons. At the Transfer Station cost of
$33.89 per ton in 1994, the amount disposed of dropped dramatically to 68,728 tons.
It is anticipated that most of the decreased tonnage was reduced, reused, or recycled.
The current cost per ton at he Transfer Station is $42.87.
• The City implemented weekly curbside collection of yard waste. Yard waste is
collected separately and is recycled at the Compost Facility into compost/mulch.
• The City has also created innovative recycling programs such as the curbside white
goods collection that has diverted 100% of the white goods from the Transfer Station.
• The corrugated cardboard collection program which was started by the City and then
transferred to First Piedmont as a private enterprise.

City of Danville, Public Works Department 1990 Comprehensive Solid Waste Management Plan – 2004 REVISED
FUNDING • The long-term funding and financing of the City’s Solid Waste Program was
established when the Solid Waste Enterprise Fund was created in 1990. The fund
established the Solid Waste fee which is charged on each residential utility bill. The
fee has been amended over the years to cover 100% of the Solid Waste costs for all
collection, disposal, and recycling operating and capital costs. It is reviewed annually
for accuracy. • In 1990, the Comprehensive Solid Waste Management Plan has guided the City to
successfully meet the 25% recycling requirement.
MISCELLANEOUS • Comprehensive Litter Collection Program

City of Danville, Public Works Department 1990 Comprehensive Solid Waste Management Plan – 2004 REVISED
1.0 Introduction 1.1 Purpose of Plan
Effective July 1, 1989, the Virginia General Assembly enacted Section 10.1-1411 of the
Virginia Waste Management Act which mandated the development and
implementation of local solid waste management plans. These regulations required
each local government to recycle 10 percent of the solid waste stream by December
31, 1991; 15 percent by the end of 1993; and 25 percent by the end of 1995.
Pursuant to this legislative action, the Virginia Department of Waste Management
adopted regulations specifying waste management program and plan requirements.
Effective August 1, 2001, the Virginia Waste Management Board amended the
Regulations for Solid Waste Management Planning to require additional plan items
such as consideration of the Waste Management Hierarchy, updated Recycling
Program Activities, and a Methodology to monitor the amount of Solid Waste of each
type produced and recycled within the area of the Solid Waste Management Plan.
A complete revised Solid Waste Management Plan in compliance with the 2001
revisions is required to be submitted to the department no later than July 1, 2004.
In addition to demonstrating how the Virginia recycling mandates will be met, each
plan must include:
1. An integrated waste management strategy giving preference to alternatives in the
following order of priority: source reduction, reuse, recycling, waste-to-energy
incineration, incineration for volume reduction, landfilling;
2. Discussion as to how the plan will be implemented;
3. Solid waste management objectives;
4. A description of stages of progress toward meeting the objectives and a schedule
for their accomplishment;
5. A description of funding and resources necessary;
6. A strategy for providing the necessary funds and resources;

City of Danville, Public Works Department 1990 Comprehensive Solid Waste Management Plan – 2004 REVISED
7. A strategy for public education and information on recycling;
8. Consideration of public / private partnerships and private sector participation, with
existing private recycling operations incorporated in the plan and their expansion
encouraged;
9. Describe how 25% recycling rate requirement will be met or exceeded, including
calculations methodology;
10. Recycling calculation methodology;
11. All known solid waste disposal sites; and
12. Methodology to monitor amount of each types of waste.
In response to these legal and regulatory requirements and to ensure sound waste
management decision-making, the City of Danville developed the 1990 comprehensive
waste management plan. The plan was revised in 1997 and again in 2004. The plan
will be utilized as a road map for updating existing and developing new solid waste
management services, facilities, and programs for the current planning period which
extends 20-years to 2024.
1.2 Planning Process
To assist the City of Danville in developing the original plan, the City Public Works
Department engaged Hazen and Sawyer, P.C., an environmental engineering and
consulting firm, to evaluate available waste management alternatives, assess their
appropriateness for implementation in Danville, and to prepare the waste
management plan draft and final reports. Input from Danville City staff and
representatives from the general public and business community was obtained
throughout the course of this project to revise the original plan.
1.3 Solid Waste Advisory Committee
To provide for citizen input in the planning process and to give the City guidance and
assistance in implementing recycling, the City established the Solid Waste Advisory
Committee. The Committee is comprised of representatives from business and
industry, non-profit organizations, and private citizens. The Committee was directed
to help City officials make sound decisions on solid waste management issues and to

City of Danville, Public Works Department 1990 Comprehensive Solid Waste Management Plan – 2004 REVISED
provide recommendations for current and future solid waste management programs.
A listing of Advisory Committee members and their affiliations is provided in Appendix
A.
Copies of the first draft of the Waste Management Plan were distributed to all Advisory
Committee members. The Committee met to discuss the plan and make
recommendations for its revision. The revised plan incorporating Committee input was
distributed for additional Committee member review. This draft was approved by the
Committee for submittal to the Danville City Council. The Council met to approve the
draft for public review and comment. A copy of the City Council Resolution adopting
the revised plan is in Appendix B.
1.4 Public Hearing and Plan Approval Process
In accordance with the Virginia Regulations for the Development of Solid Waste
Management Plans and City of Danville policy, a public meeting on the draft waste
management plan was held. The public meeting was publicized in accordance with
Danville policy, with copies of the plan made available to all who requested them. A
copy of the Public Notice and the public input and comments can be found in
Appendix B.
In addition, the entire plan was posted on the City of Danville website at
www.danville-va.gov for input and review by the public.
Despite the extensive publicity on the plan and the public meeting, no public
comments were received on the plan during the comment period. Documentation
concerning the public meeting and a copy of the City Council resolution are included in
Appendix B.
1.5 Danville Solid Waste Management Goals and Objectives
One of the first steps in the planning process was to identify goals and objectives for
solid waste management in Danville. The City of Danville will continue to evaluate
available waste management alternatives and assess their appropriateness for

City of Danville, Public Works Department 1990 Comprehensive Solid Waste Management Plan – 2004 REVISED
implementation in Danville. The goals and objectives for the June 2004 Plan update
are as follows:
1. Establish the framework for effective long-range programs.
2. Manage waste in a fashion that balances cost-effectiveness with conserving
resources and protecting the environment.
3. Involve the private sector in implementing waste management services wherever
practical.
4. Utilize waste management practices that best conserve resources and protect the
environment.
5. Provide the public with desired services at the appropriate service levels.
6. Implement effective short-range programs.
7. Take a creative, as opposed to traditional, approach.
8. Manage waste in the most cost-effective fashion.
9. Participate in regional efforts.
The following additional objectives were considered as requirements and therefore
were not subjected to the ranking process:
• Comply with regulations of the Virginia Waste Management Board.
• Establish a program for management of waste according to the State hierarchy.
• Meet Virginia’s recycling goals.
It was also decided that meeting the minimum legal requirements was not to be
included among the selected objectives. All solid waste management facilities and
programs shall be designed and operated to meet or exceed the requirements
specified in all federal, state, and local environmental regulations as well as building,
zoning, and all other applicable regulations.
Provided in the following chapter is a description of Danville and an overview of
current waste generation and management practices.

City of Danville, Public Works Department 1990 Comprehensive Solid Waste Management Plan – 2004 REVISED
2.0 Background 2.1 Description of Danville
The City of Danville, Virginia is located on the Dan River, 200 miles from the eastern
seaboard on the North Carolina / Virginia border and encompasses 44.5 square miles.
Danville which is centrally located between Martinsville, Roanoke, Lynchburg, and
South Boston, Virginia had an estimated population of 53,000 in 1990 and was
expected to experience a decline of 1,000 people by the year 2010. The 2000 census
however showed a decline of almost 5,000 people to a population of 48,411 (See U.S.
Bureau Table DP-1). The population was estimated to be 47,597 in 2002 and is
expected to continue to decrease slightly by the year 2024.
As reflected in the West Piedmont Planning District employment projections presented
in Table 2-1, Danville is a community with a strong manufacturing base, employing
approximately 37 percent of its work force. Major Danville manufacturers produce
textiles, tobacco products, tires, glass, fiber board, food products and other durable
and non-durable goods. The remaining 63 percent of the work force is employed by
government and non-manufacturing businesses; primarily service, wholesale, and
retail trade enterprises.
Total employment was estimated to be 29,485 in 1990 and was expected to increase
to 31,233 by the year 2024. The employment picture since 1990, however, has gone
in the other direction. Total employment was estimated to be 23,990 in 1995 and was
21,895 in the 2000 census (See U.S. Census Bureau Table DP-3). It is expected to
decrease slightly by the year 2010. Unemployment in Danville has averaged between
seven and ten percent and the median family income for 2000 was estimated to be
$26,900 (See U.S. Census Bureau Table DP-3).
Largely due to its extensive manufacturing activities, Danville’s transportation
infrastructure is well developed for moving freight into and out of the City. From a
waste management perspective, this will be particularly advantageous for transporting
recyclables to outlying markets. Major transportation routes to Danville include

City of Danville, Public Works Department 1990 Comprehensive Solid Waste Management Plan – 2004 REVISED

City of Danville, Public Works Department 1990 Comprehensive Solid Waste Management Plan – 2004 REVISED

City of Danville, Public Works Department 1990 Comprehensive Solid Waste Management Plan – 2004 REVISED

City of Danville, Public Works Department 1990 Comprehensive Solid Waste Management Plan – 2004 REVISED

City of Danville, Public Works Department 1990 Comprehensive Solid Waste Management Plan – 2004 REVISED

City of Danville, Public Works Department 1990 Comprehensive Solid Waste Management Plan – 2004 REVISED
Highways 86 and 29, running north-south and Highways 58 and 360, running east-
west. At least nineteen motor freight carriers serve the Danville region. Norfolk
Southern Railway Company maintains rail lines which traverse the City in an east-west
direction and north-south, just east of downtown. Primary freight yards for all rail
lines are located on both sides of the Dan River, east of the Worsham Street Bridge.
Twenty-one to twenty-two trains travel through Danville each day, including two
passenger trains. Eleven working trains operate daily in the City, moving cargo to and
from the freight yards. Danville’s rail lines connect the City directly to Potomac Yards,
VA; New Orleans, LA; Kansas City, KA: East St. Louis, MO; North Hagerstown, MD:
and Chicago, IL. The Danville Municipal Airport, located on the east side of town,
maintains three paved runways ranging in length from 4,046 to 5,000 feet. The
runways have been lengthened and significant increases in hangar space and airport
facilities have been undertaken.
Urban concentration and growth
As can be seen on the attached Long-range Comprehensive Use Plan, the areas
designated for commercial/industrial expansion are located primarily in the east and
south quadrants of the City. The north and west quadrants are primarily
residential/retail concentration.
2.2 Solid Waste Generation
In 1990, Danville’s citizens, businesses, and institutions produced and disposed of an
estimated 310 tons of solid waste per day or 113,168 tons per year. On a per capita
basis, that averaged 11.7 pounds per day. An additional 14,300 tons per year of
material was estimated to be generated by Danville sources and recycled. If added to
the total waste stream, the new total would be 127,468 tons. The 2004 estimate of
disposal is 70,564 tons per year. A description of the materials handled through each
management method is provided in Chapter 3 on current waste management
practices.

City of Danville, Public Works Department 1990 Comprehensive Solid Waste Management Plan – 2004 REVISED
Upon approval of the revised Solid Waste Plan, the City will begin a more
comprehensive method of tracking and recording of waste generated within the plan
area. This method is outlined in Appendix G of the plan.
Table 2-2 and Figure 2-1 provide population and solid waste tonnage projections
through the year 2024. Tonnage projections were based on a per capita generation
rate of 11.7 derived from Danville landfill tipping fee records for population projections
developed by the City Planning Department and the West Piedmont Planning District
Commission. Figures are also provided showing the per capita generation rate
increasing one percent per year as projected by Franklin Associates (1988) in their
study entitled “Characterization of Municipal Solid Waste in the United States,”
prepared for the EPA. An analysis of commercial and industrial development trends
indicated that no significant changes in business activity are expected over the next 20
years. Therefore, business activity did not affect the projections provided in Table 2-
2. Current industrial scrap materials recycled were omitted from these calculations
since their classification as waste is highly questionable and since this plan addresses
increasing recycling and the disposal of remaining wastes.
2.2.1 Residential Waste Generation
As reported in the previous section, the total amount of waste generated and
managed by the City Sanitation Division on a per capita is approximately 11.7 in 1990
and 8.2 in 2004. It is projected to remain flat in the planning period. Of that amount,
an estimated 26 percent is collected from City residences by Sanitation Division crews,
while an estimated additional 16 percent is yard waste collected curbside by recycling
crews. The total portion of the waste stream coming from the residential sector is 42
percent or 28,762 tons in 1995.
As of the 1990 census, the City of Danville had approximately 23,297 residential units.
The 2000 census reflects approximately 23,108 total housing units. Table 2-3 shows
the residential waste stream broken down on a per household basis, while Table 2-4
shows the total annual household waste generated compared to all waste generated

City of Danville, Public Works Department 1990 Comprehensive Solid Waste Management Plan – 2004 REVISED
within the City. Figure 2-2 indicates the residential waste breakdown and compares
this with the total amount of non-residential waste.
2.2.2 Non-residential Waste Generation
Due in part to the fact that Danville has over a third of its work force in the
manufacturing industrial sector, a large portion of the waste stream is generated by
manufacturing firms. Based on Transfer Station scale data, the portion of the waste
stream being disposed of at the Transfer Station and coming from non-residential
sources comprises approximately 68 percent of the waste stream. Table 2-5 shows
projections of the residential and non-residential waste stream through the year 2024,
assuming no new major generators come on-line or existing ones go out of business
during that time period. Figure 2-3 shows the percentages of major sources or types
of waste generated within the City. A more detailed characterization of residential and
non-residential waste is provided in Section 10.0.

City of Danville, Public Works Department 1990 Comprehensive Solid Waste Management Plan – 2004 REVISED
YearEstimatedPopulation
Per CapitaGeneration
DailyTonnage
AnnualTonnage
Per CapitaGeneration
DailyTonnage
AnnualTonnage
1990 53,000 11.7 310 113,168 11.7 310 113,1681991 52,900 11.7 309 112,955 11.8 313 114,0841992 52,800 11.7 309 112,741 11.9 315 114,0991993 52,700 11.7 308 112,528 12.1 318 115,6991994 52,600 11.7 308 112,314 12.2 320 116,9411995 52,500 7.2 188 68,728 7.1 188 68,7281996 52,400 7.2 188 68,728 7.2 190 69,4151997 52,300 7.2 188 68,728 7.3 192 70,1091998 52,200 7.2 188 68,728 7.4 194 70,8101999 52,100 7.2 188 68,728 7.5 196 71,5182000 48,411 8.0 193 70,564 8.2 198 72,2232001 48,000 8.0 193 70,564 8.3 199 72,9562002 47,596 8.1 193 70,564 8.5 201 73,6852003 47,000 8.2 193 70,564 8.6 203 74,4222004 47,000 8.2 193 70,564 8.6 205 75,1662005 47,000 8.2 193 70,809 8.7 207 75,9182006 47,000 8.2 193 70,809 8.8 209 76,6772007 47,000 8.2 193 70,809 8.9 211 77,4432008 47,000 8.2 193 70,809 9.0 213 78,2182009 47,000 8.2 193 70,809 9.1 215 79,0002010 47,000 8.2 193 70,902 9.2 217 79,7902015 47,000 8.2 193 70,902 9.2 217 79,7902020 47,000 8.2 193 70,902 9.2 217 79,7902024 47,000 8.2 193 70,902 9.2 217 79,790
2004 UPDATEREVISED
(0% Increase per Year) (1% Increase per Year)
TABLE 2-2City of Danville
20-Year Waste Generation Projections

City of Danville, Public Works Department 1990 Comprehensive Solid Waste Management Plan – 2004 REVISED
FIGURE 2-1City of Danville Tonnage Projections
20-Year Estimates
20242020
2015
In 1994* Landfill closed / Transfer Station
opened19931992
19911990
19951996 1997
1998 19992000
2001 2002 2003 2004 2005 2006 2007 2008 20092010
0
50
100
150
200
1990 1991 1992 1993 1994 1995 1996 1997 1998 1999 2000 2001 2002 2003 2004 2005 2006 2007 2008 2009 2010 2015 2020 2024
Thou
sand
s
YEAR
Estim
ated
Ann
ual T
onna
ge
0% 1%

City of Danville, Public Works Department 1990 Comprehensive Solid Waste Management Plan – 2004 REVISED
Year Population
TotalPer Capita
WasteGeneration
(lbs/day)
TotalWaste
Generated(tons/year)
Per HouseholdResidential
RefuseGeneration (1)
(tons/year)
Number ofHouseholds
TotalGeneratedHousehold
Refuse(tons/year)
Percentof
Total
1990 53,000 11.7 113,168 0.918 23,297 21,378 191991 52,900 11.8 114,084 0.927 23,253 21,551 191992 52,800 11.9 114,099 0.936 23,209 21,725 191993 52,700 12.1 115,699 0.945 23,165 21,901 191994 52,600 12.2 116,941 0.955 23,121 22,078 191995 52,500 6.4 68,724 0.780 23,077 18,000 262000 48,411 7.1 70,564 0.780 23,108 18,000 262005 47,000 7.3 70,809 0.780 23,108 18,000 262010 47,000 7.3 70,902 0.780 23,108 18,000 262015 47,000 7.3 70,902 0.780 23,108 18,000 262020 47,000 7.3 70,902 0.780 23,108 18,000 262024 47,000 7.3 70,902 0.780 23,108 18,000 26
1-CALCULATED BY AMOUNT ACROSS WEIGHT SCALE AT TRANSFER STATION BY CITY CREWS STARTING IN 1995.- DOES NOT INCLUDE YARD WASTE
REVISED 2004 UPDATE
TABLE 2-3City of Danville
Residential Waste Generation

City of Danville, Public Works Department 1990 Comprehensive Solid Waste Management Plan – 2004 REVISED
FIGURE 2-2RESIDENTIAL VS. NON-RESIDENTIAL WASTE
Yard Waste16%
Non-Residential58%
Residential Household Waste26%
*1995 Totals 2004 UPDATE

City of Danville, Public Works Department 1990 Comprehensive Solid Waste Management Plan – 2004 REVISED
YearHousehold
RefuseBulky
MaterialsYard
Waste
TotalResidential
WasteNon-Residential
Total
TotalWaste
Generated
1990 21,378 6,790 7,922 36,090 77,079 113,168
1991 21,551 6,845 7,986 36,382 77,703 114,084
1992 21,725 6,900 7,143 35,768 78,331 114,099
1993 21,901 6,956 7,878 36,735 78,965 115,699
1994 22,078 7,012 8,250 37,340 79,603 116,941
1995 18,000 10,672 28,762 40,056 68,728
2000 18,000 10,672 28,672 41,892 70,564
2005 18,000 10,700 28,700 42,109 70,809
2010 18,000 10,700 28,700 42,202 70,902
2015 18,000 10,700 28,700 42,202 70,902
2020 18,000 10,700 28,700 42,202 70,9022024 18,000 10,700 28,700 42,202 70,902
REVISED 2004 UPDATE
Bulky Material included in Household Waste after 1994.
TABLE 2-4Waste Projections by Source Category

City of Danville, Public Works Department 1990 Comprehensive Solid Waste Management Plan – 2004 REVISED
Category of Waste 1990 1991 1992 1993 1994 1995 2000 2005 2010 2015 2020 2024
RESIDENTIAL 36,090 36,382 35,768 36,735 37,340 28,672 28,672 28,700 28,700 28,700 28,700 28,700
COMMERCIAL 9,089 9,144 9,199 9,254 9,309 9,365 9,646 9,907 9,966 9,966 9,966 9,966
INDUSTRIAL 18,553 18,432 18,311 18,190 18,070 23,605 24,956 24,695 24,636 24,636 24,636 24,636
STREET SWEEPING 3,395 3,442 3,490 3,538 3,586 3,586 3,590 3,600 3,650 3,650 3,650 3,650
SEWAGE SLUDGE (Dry Tons) 20,370 20,655 20,941 21,229 21,519 3,500 3,700 3,907 3,950 3,950 3,950 3,950
BOILER ASH 6,790 6,885 6,980 7,076 7,173
TOBACCO DUST 4,187 4,246 4,305 4,364 4,423
WOODY WASTE 10,185 10,327 10,471 10,615 10,759
OTHER 4,508 4,571 4,634 4,698 4,762
TOTAL 113,167 114,084 114,099 115,699 116,941 68,728 70,564 70,809 70,902 70,902 70,902 70,902REVISED 2004 UPDATE
* Sewer sludge in dry tons after 1994. * After 1994: Tobacco Dust, Boiler Ash, Woody Waste, and other is combined with Industrial.
YEAR
TABLE 2-5City of Danville Waste Projections by Source (Tons)

City of Danville, Public Works Department 1990 Comprehensive Solid Waste Management Plan – 2004 REVISED
Figure 2-3WASTE SOURCE CHARACTERIZATION
Commercial14%
Residential42%
Industrial34%
Sewage Sludge5%
Street Sweeping5%
*1995 TotalsSewer sludge in dry tons.Tobacco Dust, Boiler Ash, Woody Waste, and other combined with Industrial.Residential includes yard waste and household waste. 2004 UPDATE

City of Danville, Public Works Department 1990 Comprehensive Solid Waste Management Plan – 2004 REVISED
3.0 Solid Waste Management System 3.1 Collection 3.1.1 Residential
(A) Residential solid waste collection is provided to City residents by the
Danville Public Works Department. The service is funded through a monthly fee
applied to each dwelling’s utility bill. The fee is currently $13.80 per household per
month. The residential services include garbage / trash / bulky items / debris
collection, yard waste, recycling, loose leaf collection, recycling drop off centers, and
operation of a composting facility. Additional collection services such as trailer rentals
and collection of appliances are available at additional fees.
(B) Household garbage collection service is provided to the City residents
(single-family to three-family dwelling) by the Danville Public Works Department as
part of the monthly fee. Four-family dwellings or more, apartment buildings, or trailer
parks have the option of using City services or contracting with a private firm.
Garbage and trash are collected once per week and residents must provide their own
20-32 gallon waste containers. The containers are collected either in the back yard or
at the curb. Currently, collections are made using seven rear-loader garbage trucks
(plus one spare) staffed by a driver and two collectors. Approximately 18,800
residential units are collected each week by City crews. Apartment complexes and
trailer parks of 4 units or more have the option to contract with private firms.
(C) Large bulky items and smaller debris, which is placed at the curb on the
regular residential pick up day, is also collected by the garbage rear-loaders.
(D) Yard waste collection service is provided to the City residents by the Danville
Public Works Department on a weekly basis. Yard waste, which is placed at the curb
on collection day, is collected using four rear-load garbage trucks staffed by a driver
and a collector. Yard waste is collected separately and taken to the City’s Compost
and Mulch facility for reuse and recycling. Care is taken during collection to avoid

City of Danville, Public Works Department 1990 Comprehensive Solid Waste Management Plan – 2004 REVISED
contamination of the yard waste with plastic bags, garbage or other debris which
would impact the quality of the composted and mulched final product.
(E) Loose leaf collection service is provided to the City residents between
October 1 and January 31 by the Danville Public Works Department. Six trailer-
mounted leaf vacuums and six tow-behind leaf vacuums are utilized to collect 3,000 to
4,000 tons of loose leaves annually. The leaves are deposited at the compost and
mulch facility for use in the final facility product.
(F) Litter control - Between 1990 to 2000, the City of Danville maintained a
three-person crew to collect litter on a five days per week basis from major
thoroughfares. The Danville City Beautiful Coordinator handled complaints about litter
and illegal dumping and worked with the generators to remedy problems that arise.
In 2001, the three-person crew was divided into three separate crews which uses
Danville Adult Detention inmates to staff the collection crews. See Table 3-1 for
collection quantities and projections.
The City of Danville is committed to continuing operation of three full-time Litter
Collection Crews. Trucks and equipment have been dedicated to this task. Education
of elementary school age children will continue to be addressed. The City’s future
Litter Program will consist of the existing three litter collection crews and will continue
to utilize Adult Detention Labor wherever possible. The litter collected is not now nor
will it be sorted or treated, other than disposal as refuse.

City of Danville, Public Works Department 1990 Comprehensive Solid Waste Management Plan – 2004 REVISED
TABLE 3-1
Litter Pick Up Collection Report
Year No. of Bags Collected Year No. of Bags
Collected
2001 14,992 2008 11,568
2002 13,701 2009 11,452
2003 12,164 2010 11,337
2004 12,042 2015 10,780
2005 11,922 2020 10,241
2006 11,803 2024 9,729
2007 11,685
3.1.2 Business
All businesses as well as owners and occupants of residential dwellings containing
more than four units per building are responsible for making their own solid waste
collection arrangements. Numerous private solid waste commercial collection firms
are available to choose from.
3.1.3 Industrial
All industries are responsible for making their own solid waste collection
arrangements. Numerous private solid waste commercial collection firms are available
to choose from.
3.1.4 Evaluation of Solid Waste Collection
A. Residential
Annually as part of the City’s budget process, an evaluation of the adequacy of the
number of collection routes for household refuse, yard waste, bulky debris, loose
leaves, litter, white goods, and drop-off recycling will be reviewed by the Public
Works Department and the results of the evaluation will be reflected in the annual
request for manpower, equipment, and funds for operation.

City of Danville, Public Works Department 1990 Comprehensive Solid Waste Management Plan – 2004 REVISED
B. Business / Commercial / Industrial
Since the City does not collect the waste for business/commercial/industrial, the
evaluation will consist of monitoring the availability of private collections and
disposal for the area’s business/commercial/industrial. The results of the
monitoring will be noted in the periodic updates of this Solid Waste Plan.
3.2 Disposal
The City currently collects and files documents concerning all known solid waste
disposal sites per 130-120-D, closed, inactive, and active within the area of the Solid
Waste Management Plan. The central archive authorized to receive and record
information on known active and closed disposal sites will be the Public Works office at
998 South Boston Road. A copy of all documentation is forwarded to the Director of
DEQ. All new sites will be recorded at the same location and documentation
forwarded to the director of DEQ.
The following waste disposal sites are located within the solid waste plan area:
(A) The Danville Landfill (Permit #122) located adjacent to the Danville Regional
Airport, opened in 1974 and received its last solid waste in August 1993. It was
closed and capped by September 1994 pursuant to subtitle “D” regulations. The 100-
acre landfill, which was scheduled to be expanded in the 1990s, was closed due to
impacts on the nearby airport and the lack of current technology such as leachate
collection and impervious liner. The 1990 Solid waste Management Plan was amended
June 24, 1997 to reflect the modification. Post closure monitoring and maintenance
has been ongoing since 1994 and a Corrective Action Plan (CAP) for Groundwater
contamination has been submitted to DEQ on June 10, 2004.
In addition to the closed landfill at the airport, a pre-1970 landfill is located at the end
of Sanitary Road.
(B) The Danville Transfer Station (PBR# 15) located on Gypsum Road replaced
the Danville landfill in 1993. The Transfer Station was constructed by Waste

City of Danville, Public Works Department 1990 Comprehensive Solid Waste Management Plan – 2004 REVISED
Management of the Piedmont as a result of an agreement executed between Waste
Management and the City on February 3, 1993. It has a capacity of 500 tons per day
and is owned and operated by Waste Management of the Piedmont under a 25-year
contract with the City of Danville (15 years initially and two 5-year extensions). The
Danville Transfer Station (DTS) receives acceptable privately collected, residential,
commercial, and industrial waste in addition to the residential garbage / trash and
debris collected by Danville Public Works. Area residents also have the option to
dispose of waste at DTS for the per ton fee. Solid waste from DTS is transported to
the Maplewood Recycling and Waste Disposal Facility (Permit #540) located in Amelia
County, VA. The expected life of this landfill is 30 years.
(C) The Danville Compost Facility (PBR# 10) accepts yard waste collected by
private haulers, tree services, and the Public Works Department and is free of charge.
All yard waste, loose leaves, and arboreal material collected by Danville Public Works
has been diverted from the landfill to the recycling compost facility. See more
information under Recycling.
(D) Sanitary Road Closed Municipal Landfill
This landfill was closed and capped in 1971. It is located adjacent to the Danville
Expressway at Sanitary Road.
3.3 Reuse/Recycle
The City of Danville has initiated a number of recycling programs in progressing
towards achieving the state mandate of recycling 25% by 1995. The City’s recycling
efforts have consistently exceeded the 25% since that time.
A pilot program for the collection of aluminum cans and glass containers was initiated
in the Grove Park neighborhood on January 5, 1990. Two-hundred Seventy (270)
homes were provided with weekly curbside collection service by the Public Works
Sanitation Division. The City Beautiful Committee and two of the local garden clubs
assist in promoting participation in the program. In May 1990, the pilot program was
expanded to four more neighborhoods bringing the number of homes on line to

City of Danville, Public Works Department 1990 Comprehensive Solid Waste Management Plan – 2004 REVISED
approximately 985. The collected recyclables are donated to Goodwill Industries.
Participation in the program has been averaging 50-60 percent, with the weekly set-
out rate equaling approximately 25 percent. An average of 6,279 lbs. of glass and
483 pounds of aluminum per week are collected, which is equivalent to 6.4 lbs. of
glass and .5 lbs. of aluminum, or 6.9 lbs. of material per week / per household served.
The cost of this program to the City is estimated to be approximately $1.40 per
household / per month. Based on this recovery rate, an average of 63.4 tons per
week or 3,297 tons per year of materials would be collected if the program were to be
expanded to all 1-4 unit residential dwellings in Danville. This tonnage equates to 2.9
percent of the total solid waste now being landfilled. The City opted to pursue drop-
off centers as a method of encouraging residential recycling rather than curbside.
In addition to the above programs in Danville, the Danville Register and Bee
newspaper publisher has initiated a pilot drop-off center for newspapers, and Goodwill
Industries operates five drop-off centers for glass and aluminum cans. Goodwill also
collects glass and aluminum from selected Danville taverns. Despite the participation
levels achieved in Goodwill’s programs, a decline in the value of glass and volatile
aluminum markets have prompted Goodwill Industries to refrain from further program
expansions.
A number of Danville businesses are involved in recycling some of their office package
and/or manufacturing waste. Such programs range from the recovery and shipment
of a single type of high value material to comprehensive programs involving extensive
efforts to reduce, reuse and recycle as much waste as is economically and technically
feasible. Currently, program details and tonnage figures are known for only a few of
these businesses. In an attempt to better identify existing business waste recycling
practices underway in Danville, the City conducted a survey of major waste generating
businesses. Due to the low response rate, Danville Solid Waste Advisory Committee
members and City staff are pursuing other avenues to obtain this type of information.
Some businesses are being interviewed directly while others are being encouraged to
report their activities to City staff. The difficulty in obtaining tonnage information on

City of Danville, Public Works Department 1990 Comprehensive Solid Waste Management Plan – 2004 REVISED
the amount of waste being recycled hampers the City’s ability to account for such
recycling levels in this solid waste management plan.
3.3.1 Current Recycling
As of July 1, 2004, the following recycling programs have been implemented:
1. Drop-off Recycling Facilities
Currently, the City of Danville operates three drop-off recycling centers.
Items collected in these centers include newsprint, mixed paper, and OCC,
plastic, glass, aluminum and steel cans. The roll-off boxes are taken to a
Materials Recovery Facility in Greensboro, North Carolina for processing of
the recyclable materials.
2. White Goods Collection
The City operates a curbside white goods collection program. The residents
or business calls the City for a scheduled pickup. The City will collect the
appliance from curbside and take it to a local scrap yard for recycling.
3. Scrap Metal Collection
The City maintains a scrap metal roll-off box located at the Public Works
Motorpool Complex. All metal items from the operation of the Motorpool
and other City departments are deposited in this box for recycling. In
addition, the Solid Waste Department collects recyclable metal items which
are placed curbside and deposits them in the scrap metal box. Every effort
is made to eliminate all recyclable metal bulk debris such as swing sets, car
parts, and other miscellaneous metals from the waste stream. The City’s
Motorpool recycles all metal products in addition to oil and antifreeze.
4. Curbside Yard Waste Recycling
All residential yard waste is collected curbside by City crews. It is kept
separate from the waste stream for recycling.
5. Compost Facility
All yard waste and arboreal material collected by the City crews from
residential locations is deposited at the compost site for processing. City
tree crews and contractors also deposit wood waste at the Compost Facility.
Firewood is offered free to the public for its use as firewood.

City of Danville, Public Works Department 1990 Comprehensive Solid Waste Management Plan – 2004 REVISED
3.3.2 Reuse
• The City annually receives the asphalt millings from its resurfacing programs and
reuses the asphalt millings for aggregate base in its trail program. It is also used for
parking lots and access roads. It is a reuse of construction materials.
• Mulch and compost are reused by area residents fro the Compost Facility.
• Tires from the Motorpool are recapped and reused.
• Sludge from the City’s Wastewater Treatment Plant is dried and land applied.
• Millings from the Resurfacing Program are reused for new asphalt.
3.4 Public Education and Promotion of Recycling
Danville’s waste management and recycling education program is coordinated by the
City Beautiful Committee. It has addressed civic groups, clubs, schools, and other
organizations. Presentations are made on subjects ranging from the construction,
design and cost of landfills to how to recycle. Danville’s elementary and middle school
children receive instruction on litter control and recycling.
Danville’s local media helps to promote recycling and cover news events. Large
cleanup events and recycling promotions are also frequently covered by Channel 13 in
Lynchburg, Virginia. The City plans to broaden its education efforts as described in
Section 3.0 of this plan.
3.5 Regional Waste Management Activities
Danville has limited suitable space available for landfill expansions or new landfill
development. Danville officials recognize that it will be necessary to look beyond the
City limits for long-range solid waste disposal capacity. City staff and officials will stay
involved in discussions with representatives of neighboring municipalities and counties
to keep abreast of developments within the regional and explore opportunities for
regional cooperation in solid waste management planning and facility development.
Currently, the City’s solid waste is being disposed of at the Maplewood Recycling &
Waste Disposal Facility which has a projected life of 30 years.

City of Danville, Public Works Department 1990 Comprehensive Solid Waste Management Plan – 2004 REVISED
3.5.1 West Piedmont Planning District
The West Piedmont Planning District (WPPD) is comprised of Franklin, Henry, Patrick,
and Pittsylvania Counties and the municipalities within the geographic boundaries
which they define. The West Piedmont Planning District Commission (WPPDC),
located in Martinsville, Virginia, has the capability of assisting member local
governments with planning efforts and providing technical assistance as requested.
The WPPDC prepared a Regional Solid Waste Management Plan update in 1989 which
was financed in part through a grant from the Virginia Department of Waste
Management. The Commission is not playing a direct role in solid waste management
planning at this time other than serving as a source of planning data and a
clearinghouse on regional activities.

City of Danville, Public Works Department 1990 Comprehensive Solid Waste Management Plan – 2004 REVISED
4.0 Source Reduction and Materials Reuse
4.1 Introduction
At the top of Danville and Virginia’s hierarchy of preferred waste management options
is source reduction followed by materials reuse. Source reduction involves changing
purchasing practices, manufacturing processes, and housekeeping and materials
management practices to reduce the amount or toxicity of waste generated. Materials
reuse involves utilizing discarded products or materials for the same or new purpose
without their undergoing a physical change (for example, refilling beverage containers
versus crushing the glass to make new containers).
4.2 Source Reduction Strategy
The City of Danville views both source reduction and recycling to be critically
important in managing its solid waste stream. Important as they are however, local
government is limited in its capability to change the waste generation practices of
other organizations and individuals. Danville plans to take an active role in promoting
waste reduction and reuse by conducting the following on going activities:
• Informing waste generators about waste reduction and reuse benefits,
opportunities, and techniques;
• Providing incentives for source reduction and reuse; and
• Practicing source reduction and reuse in City government operations, thereby
serving as a model for others.
Often, individuals and businesses alike are simply not conscious of their wasteful
behavior. As clearly evidenced by the impact of Earth Day 1990, public awareness
campaigns can markedly change consumer purchasing habits and recycling behavior.
This in turn impacts private sector manufacturing and public relations activities, as
well as the decisions of elected officials. Frequently, a simple change in perspective
on waste as misplaced resources rather than useless materials is all that is needed to
trigger business managers to implement successful waste reduction/reuse programs.

City of Danville, Public Works Department 1990 Comprehensive Solid Waste Management Plan – 2004 REVISED
This is particularly true for larger corporations with significant in house resources to
investigate waste generation and management alternatives.
4.3 Education
Danville will initiate a number of source reduction/reuse educational activities
targeting both the general public and businesses. The objectives of these efforts will
be to:
• Inform businesses and individuals of the costs and difficulties associated with
waste disposal in Danville;
• Describe the wasteful nature of American society in light of other countries;
• Provide information on methods and programs available to institute waste
reduction programs and modifying consumer habits; and
• Provide information on the potential savings and other benefits that can be
achieved when less waste is produced.
Some of the activities planned for implementation include the following:
• Development and distribution of printed materials outlining waste reduction/reuse
tips for the general consumer and businesses;
• Development of a waste audit and source reduction handbook for use by Danville
businesses and institutions;
• Organizing and hosting seminars and discussion forums for business
representatives;
• Development of educational fliers or worksheets for distribution to school children;
and
• Establishment of backyard composting education program in conjunction with
organizations such as 4-H and the Virginia Agriculture and Consumer Services
Department.

City of Danville, Public Works Department 1990 Comprehensive Solid Waste Management Plan – 2004 REVISED
These and other public awareness and educational activities will be integrated with
recycling promotion activities to ensure that both topics are appropriately and cost
effectively addressed. Communications strategies are discussed further in Section 5.0.
4.4 Incentives
While many individuals and businesses will continue to practice source reduction/reuse
and recycling once motivated to implement such practices over an initial period, others
will need incentives on an on-going basis; and a small minority may never be
motivated to change their practices unless doing so is required and enforced.
Incentives planned for implementation by Danville are:
• Establishment of a waste collection and disposal fee system that reflects the true
costs of implementing Danville’s comprehensive waste management program; and
• Establishment of an awards program to recognize outstanding recycling programs
and individual efforts.
4.5 In-house Source Reduction/Reuse
The City of Danville clearly recognizes that in order to motivate residents and
businesses to change their waste generation and management behavior, the City must
“practice what it preaches”. Therefore, the City will establish a Waste Reduction and
Recycling Task Force comprised of representatives from the Office of the City
Manager, Public Works Department, Sanitation and Buildings and Grounds Divisions,
Office of Purchasing, City schools, and other key City government offices to identify
and implement waste reduction measures, to expand the existing recycling program to
include collection of additional materials, and to modify City procurement procedures
to encourage purchase of products which generate less waste, are easier to recycle
and/or are made from recyclable materials.
There are numerous educational publications prepared by State and national
organizations and selected communities which are generic (e.g. not location – specific)
in nature. Many of these are available free of charge and are suitable for distribution
in Danville as is. Danville will seek the assistance of the Virginia Waste Minimization

City of Danville, Public Works Department 1990 Comprehensive Solid Waste Management Plan – 2004 REVISED
Program in obtaining such materials and in guiding Danville in its outreach and in-
house programs development. For all education, awareness and promotion activities,
Danville will draw heavily upon the publications and activities of other communities in
developing its programs.

City of Danville, Public Works Department 1990 Comprehensive Solid Waste Management Plan – 2004 REVISED
5.0 Recycling
5.1 Methods of Achieving Commonwealth Goals
To continue to achieve the mandated recycling levels specified by the Commonwealth
of Virginia and to meet the City’s own recycling objectives. Danville will need to
continue its existing recycling programs, establish new programs, and increase public
education regarding the benefits and methods of recycling. Cost however is of high
concern to Danville officials and residents, due to current local economic conditions
and the nationwide recession. Consequently, programs which would be desirable from
a convenience standpoint should be delayed if their implementation would prevent
Danville from establishing programs which are likely to achieve higher tonnage
diversion levels.
Keeping these issues and conclusions in mind, Danville, with the assistance of its
consultants, evaluated the full range of recycling options and identified strategies felt
to best achieve both City and Commonwealth Waste Management objectives.
Danville’s approach toward expanding recycling involves targeting the most prevalent,
easily recoverable materials in the waste stream to achieve recycling mandates,
namely, yard wastes and selected recyclable materials generated by businesses, while
providing the opportunity for all residents to recycle household materials through a
cost-effective city-wide drop-off center program. Later phases will involve pursuing
the recycling of materials which are more difficult to recover or have less waste
reduction impact and providing incentives to further increase residential and business
participation in recycling. These recycling strategies are described in the following
sections and are grouped by source and type of materials targeted for recovery.
Recovery estimates and calculation methods are presented in Chapter 10.
5.2 Non-household Recyclable Materials
As presented in Chapter 2, it is estimated that approximately 58 percent of Danville’s
waste stream is generated by non-household sources. While several of Danville’s
larger businesses and institutions including City government have initiated in-house

City of Danville, Public Works Department 1990 Comprehensive Solid Waste Management Plan – 2004 REVISED
recycling programs, a large amount of potentially recyclable material is still being
landfilled.
In the absence of legal incentives, non-household waste recycling is driven by
economics, convenience, and knowledge of recycling opportunities. Factors limiting
non-household recycling activities in Danville to date include little economic incentive
(Danville’s tip fee was low relative to other localities in 1990) lack of local processors
for some materials, particularly high grade office paper and corrugated containers,
and lack of awareness of recycling benefits, opportunities and procedures (First
Piedmont started paper and OCC recycling in 1996).
5.2.1 Role of City of Danville
The City of Danville’s approach to increasing business and institutional waste recycling
is to stimulate additional private-sector activity while minimizing City involvement in
handling non-residential materials directly. Residential solid waste will be recycled by
City crews whenever possible; especially yard waste, white goods, and steel/metal
debris.
Danville views the role of the City most appropriately to be as follows:
• Provide technical information and assistance on recycling methods and
opportunities;
• Serve as a catalyst for expansion of the existing collection, processing and
marketing infrastructure;
• Continue setting waste collection and disposal fees to reflect the true costs of solid
waste management services; and
• Serve as model by expanding its in-house recycling efforts to include all feasible
materials and offices.
• Recycle materials such as yard waste and white goods.
• Operate drop-off recycling sites of mixed paper, glass, aluminum, newsprint, OCC,
tin cans, plastic, etc.

City of Danville, Public Works Department 1990 Comprehensive Solid Waste Management Plan – 2004 REVISED
In the event that efforts in the above areas are insufficient to continue to meet state
goals, the City of Danville will evaluate the need for instituting mandatory recycling
ordinances and/or bans on the disposal of selected recyclable materials, assuming that
adequate alternative outlets for those materials exist. Danville will consider
developing processing facilities, thereby serving as a market of last resort, if private
sector alternatives cannot be identified.
In light of having limited resources, Danville will target its efforts initially on large
quantity, high quality recyclables generators. Other criteria for selecting target
recipients of City assistance include demonstrated management commitment for
implementing recycling and serviceability of the generator’s facilities. Danville will also
work with businesses and trade organizations to provide information, printed
materials, and guidance on how they, in turn, can assist the smaller quantity
generators. In the following section, target materials and their sources are presented
along with programs for addressing them.
5.2.2 Priority Non-household Waste Recycling Programs
Process – Specific
In Danville, the process-specific wastes currently being landfilled that are most
prevalent and in a relatively clean form are boiler ash, textile scraps, tobacco dust,
and construction debris. Many of these wastes are on a downward trend due to the
weakening of textiles and tobacco industries. The incoming industries are generally
less waste producers such as telecommunications, shipping warehouses,
woodworking, etc.

City of Danville, Public Works Department 1990 Comprehensive Solid Waste Management Plan – 2004 REVISED
In light of the fact that large quantities of these materials are generated by just a few
sources, technical assistance or incentives provided by the City could have a significant
impact on reducing the quantity of waste now being landfilled. Hence, the City will
make this activity a priority, starting with conversion of the marketing information in
Appendix D to a directory of market outlets for recyclable materials to be distributed
to Danville businesses.
Paper
In 1990, Danville lacked local processors for high grade paper and old
corrugated containers (OCC). Therefore, a large amount of these materials
were being landfilled even though they were relatively easy for the generator to
recover and had a relatively high value in the secondary materials market. This
is particularly true for generators of small to moderate volumes of OCC and
large quantity generators of high grade paper, although several large volume
OCC generators are also still sending this material to the landfill. The City
worked with First Piedmont to create a waste paper dealer in Danville. Using
traditional business development incentives and commitment on the part of the
City to assist with promoting paper and OCC recycling, along with the recycling
of other materials, First Piedmont was encouraged to begin newsprint and OCC
recycling. Attraction of a waste paper dealer that accepts newspaper and
mixed paper as well as high grades and OCC has further increased recycling
opportunities for City residents, institutions, and businesses.
Danville will explore the potential for prospective waste paper dealer(s) to
establish a “dump and sort” operation for mixed non-residential waste loads
containing high quantities of uncontaminated OCC and possibly other materials.
Plans are for a tipping fee to be charged for handling such loads which is lower
than the landfill tipping fee, thereby giving waste generators and haulers an
economic incentive to utilize this facility in lieu of the Transfer Station.
Provision of additional processing infrastructure, paired with economic
incentives and program promotion should significantly reduce the amount of

City of Danville, Public Works Department 1990 Comprehensive Solid Waste Management Plan – 2004 REVISED
non-residential paper and OCC going to the Transfer Station. Once this system
is on line, banning the disposal of OCC from the Transfer Station will be feasible
if doing so is determined to be necessary because of poor voluntary
participation.
Commercial Glass and Cans
The potential exists to recover significant quantities of glass containers and
aluminum and bi-metal beverage cans from Danville area restaurants, hotels,
taverns and other food and beverage service establishments. Due to the
tonnage generated, pick-up service is usually needed in order for such facilities
to participate in the recovery and recycling of these materials. Danville plans to
encourage and support private operations such as Goodwill Industries who offer
collection service by publicizing service availability, encouraging participation,
and publicly recognizing businesses that have established recycling programs.
If independent private collection services are determined to be inadequate to
serve potential program participants, then Danville will consider contracting
with a private hauler, recycling firm or using City crews to provide this as a City
service on a regularly-scheduled basis.
Plastics
As is true nationwide, plastic packaging products are utilized by Danville
businesses and institutions at a rapidly increasing rate. Many of these materials
are recyclable and have a high per-ton value relative to other secondary
products. However, plastic grades must often be kept separated, and
contaminant allowances are typically low. These factors coupled with the high
volume-to-weight ratio of plastics makes these materials more difficult to
recycle than other material types.
No plastics processors are located in Danville, however, several market outlets
are within an acceptable range, assuming adequate shipping quantities of
plastics can be recovered. The City of Danville plans to work directly with large
quantity plastic waste generators to identify site-specific recycling options, and

City of Danville, Public Works Department 1990 Comprehensive Solid Waste Management Plan – 2004 REVISED
will provide general information and guidance concerning plastics recycling
opportunities.
Scrap Metal
Danville has a well established scrap metal industry which is already recovering
the majority of available scrap metals in the City’s waste stream. Danville’s role
here is to promote diversion of as much scrap metal as possible through
existing local outlets.
5.3 Household Recyclable Materials
As described in Section 3.0, recycling programs are now underway that collect some of
the newspapers, glass containers, aluminum cans, textiles and scrap metal generated
by Danville residences. These materials are collected primarily through Reynolds
Aluminum and Goodwill Industries drop-off and buy-back center operations,
newspaper collections sponsored by the Danville Register and Bee, and the City of
Danville drop-off facility collection program. Factors that have limited expansion of
household waste recycling to date include limited public funding and lack of local
processors for selected materials including paper, plastic containers, and steel food
cans.
In expanding household waste recycling, Danville plans to continue promoting the use
of existing recycling centers and to consider establishing additional centers. These
centers will be unstaffed and equipped initially to receive newspapers, glass
containers, aluminum and bi-metal beverage cans, and PET and HDPE plastic
containers. Other materials such as old corrugated containers and steel food cans will
be considered for addition in later implementation phases. The centers will be located
in highly visible frequent use areas whenever possible such as at shopping centers or
parks and recreation areas.
The 1990 curbside pilot program was phased out to direct resources toward
implementing recycling programs determined to better meet Danville’s recycling
City of Danville, Public Works Department 1990 Comprehensive Solid Waste Management Plan – 2004 REVISED
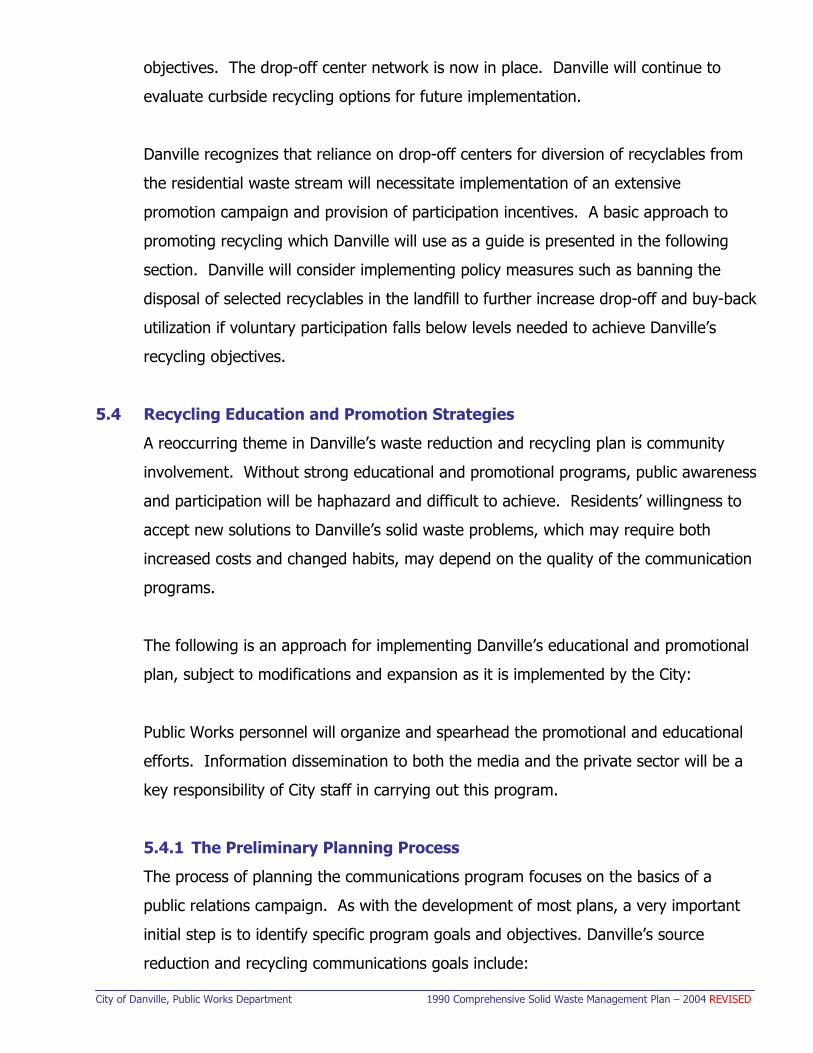
objectives. The drop-off center network is now in place. Danville will continue to
evaluate curbside recycling options for future implementation.
Danville recognizes that reliance on drop-off centers for diversion of recyclables from
the residential waste stream will necessitate implementation of an extensive
promotion campaign and provision of participation incentives. A basic approach to
promoting recycling which Danville will use as a guide is presented in the following
section. Danville will consider implementing policy measures such as banning the
disposal of selected recyclables in the landfill to further increase drop-off and buy-back
utilization if voluntary participation falls below levels needed to achieve Danville’s
recycling objectives.
5.4 Recycling Education and Promotion Strategies
A reoccurring theme in Danville’s waste reduction and recycling plan is community
involvement. Without strong educational and promotional programs, public awareness
and participation will be haphazard and difficult to achieve. Residents’ willingness to
accept new solutions to Danville’s solid waste problems, which may require both
increased costs and changed habits, may depend on the quality of the communication
programs.
The following is an approach for implementing Danville’s educational and promotional
plan, subject to modifications and expansion as it is implemented by the City:
Public Works personnel will organize and spearhead the promotional and educational
efforts. Information dissemination to both the media and the private sector will be a
key responsibility of City staff in carrying out this program.
5.4.1 The Preliminary Planning Process
The process of planning the communications program focuses on the basics of a
public relations campaign. As with the development of most plans, a very important
initial step is to identify specific program goals and objectives. Danville’s source
reduction and recycling communications goals include:

City of Danville, Public Works Department 1990 Comprehensive Solid Waste Management Plan – 2004 REVISED
• Educating the public about the role of waste reduction and recycling in the
management of solid waste;
• Informing the public about Danville’s drop-off and business recycling programs
and services, as well as all other available recycling options; and
• Promoting active public involvement and participation in recycling. In addressing these goals, communications objectives will be developed that identify
measurable accomplishments to be achieved in specified time intervals.
5.4.2 Themes and Messages
The next step in the planning process will be to identify key source reduction and
recycling themes and general messages which will communicate them. Effective
promotion of source reduction and recycling in Danville will address the following
themes to the extent that resources are available:
• Packaging reduction
• Process waste reduction
• Reduction of toxicity of the waste stream
• Resource conservation
• Products reuse
• Special waste management
• Recycling benefits
• Recycling opportunities and procedures
• Materials markets
• Solid waste collection ordinances
• Solid waste disposal regulations and ordinances
Simple, well-presented messages to promote each theme will clarify the information to
be communicated and the actions desired on the part of the audience.

City of Danville, Public Works Department 1990 Comprehensive Solid Waste Management Plan – 2004 REVISED
5.4.3 Target Audiences
Choosing target audiences for each message will increase the probability of
participation among different groups. Targeted groups likely to receive the focused
messages include:
• School children
• Manufacturing firms
• Industry
• Small businesses
• Residential participants
• Institutions
• Government employees
• News and editorial media
• Environmental, neighborhood and civic groups.
Opinion leaders will also be identified in the public and private sector. Danville Public
Works will obtain their support and assistance in implementing the communications
program through Chamber of Commerce and Danville Development Council meetings,
business activities and direct contact.
5.4.4 Implementation Strategies
The next phase of the planning process will involve developing specific implementation
strategies to achieve the communication objectives. These strategies will address one
or more of the following needs:
• Capturing the attention of each target audience;
• Effectively delivering each communication message in the target audiences own
“language”;
• Motivating the audience to take action;
• Providing feedback and reinforcing behaviors; and
• Receiving useful input-feedback from participants at appropriate intervals.

City of Danville, Public Works Department 1990 Comprehensive Solid Waste Management Plan – 2004 REVISED
Danville will work to select the techniques which will most effectively accomplish each
objective within the available resource limits. Danville will attempt to expand
resources through effective coordination of activities with that of other organizations
involved in promoting recycling and by obtaining volunteer assistance where
appropriate. Additionally, private sector contributions toward printed materials,
advertisements, and other such products will be pursued. Once specific
implementation strategies are identified, the strategies will be collectively assessed to
determine an overall schedule and budget for implementation.
5.4.5 Media Usage
In tackling the issue of media coverage, Danville has determined that the most cost-
effective strategy for the City’s communication program is to seek extensive free
media coverage such as news stories, editorials, and public service announcements
(PSA) rather than involving significant use of paid advertisements. Although the size
of the communication budget has dictated choosing the free media coverage option,
there are three major drawbacks of relying on free media coverage: the inability to
fully control the informational content released; the extent to which media coverage is
provided; and the time such coverage is released. Danville will address these
drawbacks by implementing the following strategy:
• Conduct periodic media briefings with the news and editorial staff of each
medium in the Danville area. Information packets for the media
representatives will be distributed that include pertinent facts and figures to be
communicated plus a listing of ways in which the media could provide ongoing
assistance.
• Identify and cultivate relationships with media representatives interested in
recycling and solid waste management.
• Issue periodic news releases when events or decisions likely to elicit media
coverage occur. Special events will be developed such as opening ceremonies
and demonstration projects to attract media coverage.
• Working with Danville Register and Bee to develop a special advertising section,
the cost of which is to be borne by private sector advertisers. Such a section
will enable Danville to publish a large amount of information yet retain control

City of Danville, Public Works Department 1990 Comprehensive Solid Waste Management Plan – 2004 REVISED
over the final wording and layout without creating concerns over Danville’s
buying advertising space directly.
• Enlist the support of radio. In addition to public service announcements radio
stations will often promote good causes to increase their community service air
time and as a means of demonstrating their support for their listeners’
community.
5.4.6 Direct and Indirect Mail
The distribution of mail either directly or indirectly (for example: newspaper inserts),
will enable Danville to select the exact product to be delivered, as well as target
audiences who will receive it. The use of mail, as well as door hangers, is particularly
appropriate when the audience is a portion of the community at large and the general
public would be an inappropriate audience.
The production of take-home items such as brochures, booklets, flyers, grocery bags,
refrigerator magnets and other printed material can be very valuable in promoting and
ensuring proper participation if carefully designed and effectively distributed. It is not
uncommon for such materials to become out-of-date before all supplies are
distributed. Danville solid waste staff plan to prepare a realistic, detailed distribution
plan and timetable in advance of publishing printed materials to keep content current
throughout the distribution period and verify that the appropriate quantity will be
printed.
5.4.7 Direct Contact
Direct, one-on-one communication is vital when two-way exchange of information is
required. One-on-one communication is highly effective in gaining individual support
and motivating individuals to take action. However, one-on-one communication is
time consuming and labor intensive. In light of Danville’s limited personnel resources,
care must be taken to limit such communications to only those situations which are
clearly necessary and beneficial. This is especially difficult in light of the high public
interest in recycling. Mistakes commonly made in this regard are excessive publication
of one’s telephone number and creation unrealistic expectations concerning the type

City of Danville, Public Works Department 1990 Comprehensive Solid Waste Management Plan – 2004 REVISED
and degree of assistance that can be received. Both of these errors result in
circumstances where demand for service exceeds the response capabilities of the
service provider. These circumstances result in over taxation of personnel resources
as well as frustration on the part of those desiring service. Such situations can not
always be avoided, but Danville will use the following strategies to alleviate the
problem:
• Exercise caution prior to publicizing address and telephone information.
Danville will make sure that the information requested by respondents is
available for distribution and adequate distribution resources are available.
• Prepare printed materials whenever possible to meet information needs shared
by a large number of inquirers. Danville will inform and train personnel in
advance to handle changes in the nature and/or quantity of information
requests expected. Information distributed in printed form allows for more
personnel capable of processing the information requests, and fewer number of
personnel needed.
• Establish a speakers’ bureau comprised of trained volunteers to make
presentations to neighborhoods, environmental and civic groups. This will free
Danville staff and enable speakers to reach groups of people instead of
addressing their information needs on an individual basis. Speakers bureaus
can be very effective if the speakers are properly trained and equipped. Fact
sheets can assist the speakers in fielding questions after the presentations.

City of Danville, Public Works Department 1990 Comprehensive Solid Waste Management Plan – 2004 REVISED
6.0 Special Waste Management
6.1 Introduction
Some components of the waste stream present special problems and do not lend
themselves well to traditional waste management options. Though usually requiring
some type of special attention, the handling of these special waste materials is
typically integrated into the overall waste management system. These materials
comprise a small, yet potentially harmful and problematic component of the solid
waste stream. The most notable of these special waste materials and those
addressed in this section are the following:
• Scrap tires • Lead acid batteries • Waste motor oil • White goods • Land clearing and construction debris • Sludges • Septage • Boiler ash • Mining and agricultural waste • Spill residues • Needles and other sharps
Improper disposal of special wastes is often attributed to a lack of acceptable
alternatives, inadequate knowledge of proper disposal methods, and in some cases,
simple carelessness.
6.2 Strategies for Implementation
The objectives of the City’s special waste management program is to establish an
efficient, cost-effective, environmentally-sound means of collection, storage, reuse,
recycling, and/or proper disposal. Following are the City’s current and proposed
management strategies for each type of special waste material.
6.2.1 Scrap Tires
A rule-of-thumb used for estimating the magnitude of the scrap tire problem is that
approximately 0.65 tires are generated per capita per year weighing an average of 20

City of Danville, Public Works Department 1990 Comprehensive Solid Waste Management Plan – 2004 REVISED
pounds each. Therefore, approximately 34,450 tires or 345 tons of waste tires are
generated each year in Danville which require special management.
Whole tires disposed of in landfills have a tendency to “float” back to the surface.
Exposed tires provide cover and nesting space for vectors such as rats. The tendency
of tires to trap water produces noxious odors and provides breeding grounds for
disease transmitting mosquitoes and bacteria. Scrap tire piles have caught fire, and
under these conditions – or if burned in solid waste incinerators without proper air
emission control equipment – produce an average of 138 pounds of particulates per
ton of tires.
Currently in Danville, tires are disposed of in the Solid Waste Transfer Station in whole
or split form. Split tires are accepted for $42.87 per ton and whole tires for $5.00 per
tire. This economic differential has prompted tire dealers to have their waste tires
split prior to disposal.
The City’s three Litter Crews collect illegally dumped tires in the right-of-way
immediately when discovered. This discourages the build-up of illegal tire dump sites.
Tires collected are sliced and disposed of at the Transfer Station.
To improve the management of scrap tires, the City of Danville plans to:
1. Slice all City collected tires prior to their disposal, until acceptable markets can be
identified.
2. Recycle and recap all City Motorpool generated waste tires.
3. Educate tire retailers, wholesalers, manufacturers and re-manufacturers on
appropriate scrap tire collection, storage and disposal procedures as well as
marketing opportunities which are identified.
4. Regulate all sites in the City where used tires are stored, collected, or accumulated
on a regular basis to prevent conditions which promote the breeding of pests (e.g.,
standing water in tires) or present a fire hazard.

City of Danville, Public Works Department 1990 Comprehensive Solid Waste Management Plan – 2004 REVISED
5. Work to identify and upgrade existing scrap the storage sties to conform to
procedures developed for preventing environmental, health and/or safety hazards.
6. Take all feasible steps to establish markets for recovered tires.
7. Continue to charge a per tire fee which adequately covers all aspects of the City’s
tire management program.
6.2.2 Lead Acid Batteries
Lead acid batteries should not be disposed of in the landfill due to their toxic heavy
metals content which could be released to the environment. Currently, the City
prohibits the disposal of auto batteries at the Transfer Station.
Lead acid batteries enjoy a favorable market and fairly well established infrastructure
for collection and recovery. Advance Auto purchases automobile batteries in Danville,
and all auto battery retailers are required to accept old batteries in exchange for the
purchase of new ones. Management problems revolve around the do-it-yourself
mechanics and small service shops lacking direct access to collection infrastructure
and with “backyard” battery recyclers who recover the lead, but dump gallons of lead-
saturated acid and lead-contaminated casings on the ground.
The following strategy will be implemented to improve the management of lead acid
batteries in Danville:
1. Recycle all lead acid batteries used by City Motorpool or found illegally dumped on
right-of-way.
2. Identify enterprises which are purchasing batteries for lead recovery and determine
if each operation is environmentally suitable.
3. Provide educational literature to local battery wholesalers and retailers outlining
recycling options and proper storage and transportation methods.
4. Actively support state requirement that all distributors of lead acid batteries accept
used batteries returned for recycling by customers who purchase new batteries.
5. Require that all facilities for collection and storage of lead acid batteries be
designed to prevent leakage to the environment.

City of Danville, Public Works Department 1990 Comprehensive Solid Waste Management Plan – 2004 REVISED
6. Encourage all retailers to participate in a publicity program to inform consumers of
available battery exchange programs.
7. Encourage all retailers to charge a deposit on batteries, refundable upon exchange.
6.2.3 Waste Motor Oil
Motor oil can lead to surface water, groundwater, and air pollution when improperly
discarded. Crankcase oil drainings have been reported to account for more than 40
percent of the total oil pollution of our nation’s harbors and waterways. The
Association of Government Oil Recycling Officials estimates that recycling used oil
could reduce U.S. petroleum imports by 25.5 million barrels of oil per year. Recycled
oil is typically burned as a source of recoverable energy, or can be re-refined into
lubricants of comparable quality to virgin oil products.
Currently, the City provides no used oil collection services. However, all used motor
oil and hydraulic fluid generated by the City garage is recovered for collection by a
contractor for processing into fuel. To improve used motor oil management practices
in Danville, the City plans to:
1. Recycle all material from City Motorpool applications.
2. Solicit the cooperation of local high-volume vehicle lubricating centers in providing
drop-off facilities for used motor oil brought in by the public.
3. Evaluate the need for additional collection sites to be provided by the City once
participating vehicle service centers have been identified.
4. Work with the media and Danville service stations to promote use of the City-wide
private drop-offs, including the posting of signs notifying customers of oil collection
sites as required by the Commonwealth.
5. Consider procurement of re-refined used oil for use in all technically feasible
lubricating applications.
6. Consider requiring that all vehicle service centers in the City offer used oil collected
at their facility for recovery through acceptable market outlets.

City of Danville, Public Works Department 1990 Comprehensive Solid Waste Management Plan – 2004 REVISED
6.2.4 White Goods
White goods, or large worn out and discarded appliances, are problematic to dispose
of due to their high bulk and relatively poor compatibility and the potential for PCBs to
be contained in their capacitors. These expended durable goods generally contain a
high percentage of recyclable ferrous metal.
Recovery of white goods from the waste stream ahs the potential of adding to the
tonnage diversion overall and reducing operational problems and space requirements
associated with bulky items. Approximately 23.5 lbs/capita of white goods are
generated each year. This would amount to approximately 624 tons in the City of
Danville. The City of Danville currently contracts with a local scrap metal dealer to
recycle white goods collected curbside by the City. Over 11 tons of white goods are
collected each month, or approximately 21 percent of the projected amount of white
goods available. To improve the management of white goods, the City of Danville will
encourage the disposal option at the time of purchase of a new appliance. This option
is the most efficient since the appliance is collected at the time a new one is delivered.
It is then recycled by the business. White goods are not accepted at the Transfer
Station for disposal.
6.2.5 Land Clearing and Construction Debris
Land clearing and construction debris, because of its relatively inert nature, can be
buried in landfills specifically designed for that purpose which are less environmentally
restrictive than municipal solid waste landfills. Therefore, the primary concern with its
disposal in municipal solid waste landfills is the space consumed by this material. The
City of Danville does not operate a construction and demolition debris landfill.
Construction and demolition debris generated in Danville can be taken to the
Construction and Demolition Landfill operating in Pittsylvania County by the First
Piedmont Corporation. It is estimated that construction and demolition waste and
land clearing debris comprises of 10-15 percent of the non-household waste stream
now being disposed of in Danville.

City of Danville, Public Works Department 1990 Comprehensive Solid Waste Management Plan – 2004 REVISED
Large land clearing debris is generally burned on site instead of being transported to a
landfill. To improve the management of land clearing; smaller wood waste taken to
the City compost site will be segregated at a receiving area near the Compost Facility
gate. Material will be processed as follows:
1. Trees of suitable type and size are presently being cut into cartable length and
offered free as firewood to the public. Danville will continue with this program.
2. Trees unsuitable for firewood will be shredded. This material will be offered to the
public as mulch and compost.
3. Danville will investigate the diversion of salvageable scrap lumber and other
building supplies to Habitat for Humanity or similar organizations or offer it to the
public.
4. Danville will investigate the use of a portable or permanent air curtain incinerator
to burn land clearing and wood construction debris.
5. Inert soils, rock, asphalt, and other clean rubble will be stockpiled for use in City
construction and grading projects.
6. The City will encourage salvage of wood from demolition of buildings or barns.
6.2.6 Sludge
The Danville Wastewater Treatment Plant is currently operated for the City by
American Water Services, Inc. (DEQ Permit No. VA0060593). The sludge generated
from the Wastewater Treatment Plant is the only sludge known to be generated in the
plan area. It is disposed of by drying and land-applying pursuit to the plant’s VPDES
permit. No other sludge is anticipated within the plan area within the duration of this
plan.
6.2.7 Septage
Danville currently has a policy to prohibit the disposal of any waste containing free
liquids in the Transfer Station or Compost Facility.

City of Danville, Public Works Department 1990 Comprehensive Solid Waste Management Plan – 2004 REVISED
6.2.8 Boiler Ash
Boiler ash is currently generated by only one industry, which is Dan River Inc. The
ash is disposed of through a private hauler and is available for recycling if the
appropriate use can be found.
6.2.9 Mining and Agricultural Waste
There are no significant quantities of mining or agricultural waste generated in
Danville, and none is received at the Transfer Station with the exception of small
volumes of nursery or vegetable garden/greenhouse waste. Agricultural waste, when
received, will be included in the yard waste composting program, assuming the
material does not contain significant pesticide residues.
6.2.10 Spill Residues
The Transfer Station receives spill residues only when they are generated by municipal
operations and only if they have been absorbed by the use of an absorbent material
and are non-hazardous. The City has a contract with a nearby hazardous waste
management firm (Dishman Inc.) to clean up any hazardous spills.
Spills from private operations and trucking companies are the responsibility of those
companies for contracting with a spill response unit. In the event that the responsible
party cannot do so in an expedient manner, the City will contract for the remediation
and charge the responsible party. Waste from private party spill clean-up will not be
accepted by the City and must be disposed of at an appropriate facility. Most non-
hazardous spill residues are received by First Piedmont Corporation.

City of Danville, Public Works Department 1990 Comprehensive Solid Waste Management Plan – 2004 REVISED
6.2.11 Special Waste
Special waste, generated from residential customers, is handled on a case by case
basis. If a resident finds special waste in a house or storage building, they may call
the Public Works Department for proper disposal. The waste is picked up by a
supervisor and a chemist from Waste Water Treatment is used to determine if it is
hazardous waste. Hazardous waste is disposed of by a licensed hazardous waste
disposal firm.
6.2.12 Medical Sharps Waste
The City has implemented a Sharps Container Program to minimize the danger of solid
waste collectors being injured by medical needles disposed of improperly by residential
generators. The City will drop off an empty sharps container to a household which
requests one and collect the filled container for proper disposal. This program is free
of charge and has resulted in significant reduction of injured solid waste collectors.

City of Danville, Public Works Department 1990 Comprehensive Solid Waste Management Plan – 2004 REVISED
YEAR Tires Oil Oil Filters Antifreeze Refrigerant Batteries SludgeLand Clearing
Stumps, Debris
1995 (Actual) 5,000 267 N/A N/A N/A 272 N/A N/A
2005 5,500 294 1 26 1 299 3,600 N/A
2010 6,050 323 2 30 1.5 329 3,600 N/A
2015 6,655 355 3 35 2 362 3,600 N/A
2020 7,321 391 4 40 2 398 3,600 N/A
2024 8,053 430 5 40 2 438 3,600 N/AREVISED 2004 UPDATE
TABLE 6-1City of Danville Special Waste Projections In Tons

City of Danville, Public Works Department 1990 Comprehensive Solid Waste Management Plan – 2004 REVISED
7.0 Composting
7.1 Introduction
Composting of the organic fraction of the solid waste stream is an integral component
of Danville’s Comprehensive Solid Waste Management Plan. This section discusses the
role of composting in Danville’s integrated solid waste management program,
describes the compostable fraction of the waste stream, identifies strategies which
have been selected for composting implementation, and illustrates the potential for
these strategies to divert a significant portion of the waste stream from the landfill.
7.2 Role of Composting in Managing Danville’s Waste Stream
Segregation and composting of selected organic materials of the waste stream is
viewed by the City of Danville as fundamental to achieving the recycling mandates of
the Commonwealth. Composting of these materials significantly reduces the volume
of waste requiring landfilling, produces material with the potential to be marketed as a
soil additive, and produces a stable material suitable for beneficial reuse as mulch
and/or compost. Due to problems which frequently result from the landfilling of fresh
or organic materials (such as subsidence and the formation of leachate and landfill
gas), diversion of these materials from the sanitary landfill has a direct positive effect
on landfill operations, landfill closure and post-closure use of municipal landfill sites.
7.3 Compostable Fraction of the Waste Stream
The types of waste to be included in the composting program for the City of Danville
are primarily, but not exclusively, organic materials derived as by-products from
agriculture, gardening, lawn and tree care, and allied forest product industries. The
City will continue evaluating the waste stream in search of non-traditional materials
which may be added on the basis of known desirable properties, such as
macronutrient and micronutrient content, as well as the lack of undesirable
constituents such as heavy metals, toxics, flammable, reactive or corrosive properties,
or dusts and vapors which may be hazardous to workers. Materials suspected of
potential pathogenic activity will also be subject to careful examination.

City of Danville, Public Works Department 1990 Comprehensive Solid Waste Management Plan – 2004 REVISED
In addition to the physical and chemical composition of a material under
consideration, there are other factors which will be evaluated prior to the material’s
inclusion in the composting program. These factors include the ease with which the
material can be segregated from the rest of the waste stream, quantity of the
material, continuity of supply of the material, and any special processing or handling
requirements.
Table 7-1 identifies materials which are present in the waste stream in high volumes
and have already been determined potentially suitable for composting and/or co-
composting. As can be seen from the table, full-scale implementation of a composting
program can result in a 15 percent or greater reduction in the waste stream.
TABLE 7-1
AVAILABLE COMPOSTABLE MATERIALS
MATERIAL ANNUAL GENERATION
IN TONS
PERCENT OF WASTE
STREAM
SEASONAL VARIABILITY*
MAXIMUM DIVERSION RATE (%)
Sawdust 550 0.5 N 100
Yard Waste 10,700 16.0 Y 100
Tobacco Dust 4,200 3.7 Y 100
Sludge 3,900 5.0 N 100
TOTALS ** 16,550 25.2 380
* Up to 50% seasonal variability ** Projected annual tonnage available by the year 2010 = 16,550
7.4 Implementation Strategy for Composting
The City of Danville Sanitation Division will separate collection of residential arboreal
wastes as appropriate, and will encourage separation of bulk loads of wastes by
incoming haulers. Any clean loads of suitable arboreal materials will be stockpiled in a
designated location at the existing compost facility. Residential loads of segregated
yard waste and brush will be de-bagged as necessary and stockpiled at the same
location.

City of Danville, Public Works Department 1990 Comprehensive Solid Waste Management Plan – 2004 REVISED
The existing facility operations will consist of segregation of selected organic wastes,
pre-processing of bulky materials, mulch production and windrow composting. Pre-
processing of bulky materials will be achieved through the use of the rotary shear
grinder at the Compost Facility. Chipping equipment will be used to make mulch from
wood waste. Firewood and other useable wood will be available for sale to the public.
A diversion rate of 5.6 percent of the solid waste stream is expected initially from
windrow composting of yard waste. Additional tonnages will be diverted from the
distribution of firewood and mulch.
Finished product from the full-scale composting facility will be offered free to the
public or the Virginia Department of Transportation in bulk, used as needed for
Utilities, Public Works or other City operations.
Since beginning operation in 1991, the City’s composting facility has successfully
diverted 100% of the residential yard waste from the Transfer Station. The facility is
constantly re-evaluating the availability of arboreal and organic materials which may
be available from the community to add to the compost facility. Approximately 10,000
tons are processed annually and 100% of it is returned to the residents and area
businesses in the region.
The compost and mulch produced is of a good quality and in high demand in the
spring and fall of each year.

City of Danville, Public Works Department 1990 Comprehensive Solid Waste Management Plan – 2004 REVISED
8.0 Consideration of Waste-to-Energy/Incineration
A variety of waste-to-energy technologies exists, some more proven than others. All involve
the production of refuse-developed fuel and/or the combustion of municipal solid waste
(MSW) to make steam and/or electricity. Benefits of these technologies include pathogen and
organic materials destruction, significant volume reduction of the incoming waste stream,
and conversion of discarded material into a valuable energy product for public use.
Potential drawbacks to these technologies include the relatively high capital and O & M costs,
perceived public impressions of incineration, stringent air pollution control requirements and
current regulatory uncertainties about ash management.
Based upon a review of the technologies available, the total solid waste stream and recycling
projections, and planning and implementation issues, it is concluded that waste-to-energy
technology is not appropriate for implementation by the City of Danville at this point in time.
This conclusion is supported by the following reasons:
• Interest in promoting and establishing programs for increased reduction, reuse,
recycling, and composting of solid waste in the City of Danville as the top priority;
• The need to allow the time necessary to determine the success of these preferred
management methods prior to sizing and pursuing the establishment of waste-to-
energy facility; and thereby avoiding the risks and problems associated with facility
over or undersizing;
• Concerns about the comparative cost of waste-to-energy to other options; and
• Interest in investigating the possibility that other nearby communities (e.g. counties,
towns) may be receptive to exploring a regional approach to solid waste management
with the City of Danville.
Danville officials are aware, however, that the solid waste industry is rapidly changing as
demonstrated by the significant changes that have already occurred in terms of technical
achievement, environmental impacts, regulatory compliance and system economics.
Therefore, the City of Danville will continue to stay abreast of changes in waste-to-energy

City of Danville, Public Works Department 1990 Comprehensive Solid Waste Management Plan – 2004 REVISED
and incineration technologies and the factors affecting their feasibility. Additionally, City staff
and officials will continue to explore opportunities for regional cooperation in the
establishment of waste-to-energy and other regional waste management facilities.
Danville will explore the possibility of incineration of land clearing waste and construction
debris through the use of an air curtain incinerator pit or mobile unit.
Currently, the City is aware of no incineration of waste within the plan area and there is no
historical data available to provide for past incineration if any occurred. Current projections
of incineration quantities are zero for the full span of the solid waste plan time/area.

City of Danville, Public Works Department 1990 Comprehensive Solid Waste Management Plan – 2004 REVISED
9.0 Waste Management Disposal Needs
9.1 Landfill Existing Conditions
The City of Danville closed its municipal landfill in 1993 in compliance with subtitle D
Regulations. Although the landfill had significant land space available, the landfill
waste was a negative impact on the adjacent Danville Regional Airport. The landfill
attracted significant numbers of birds which the FAA routinely expressed concern
about.
In addition, the landfill did not have current Subtitle D technology, such as water and
gas monitoring and impervious liners.
9.2 Future Capacity Requirements
The City replaced its municipal landfill by entering into a long-term agreement with
Waste Management of the Piedmont to acquire the necessary property and construct
a 300-ton per day Transfer Station (See Table 9-1 for tonnage projections). The
contract which was executed was for a term of 15 years and included construction and
operation of the Transfer Station and disposal of the waste at a waste management
facility. The current location for disposal is Maplewood Recycling & Waste Disposal
Facility (Permit No. 540) located in Amelia County, Virginia. The expectant life at this
landfill is 30 years. The Waste Management Agreement has an initial term of 15
years, which expires in 2007, and two five-year extensions, which will accommodate
waste transfer disposal until the year 2017. After 2017, the City anticipates rebidding
the Transfer Station agreement with continued disposal at Maplewood Recycling &
Waste Disposal Facility or a similar Subtitle D Waste Disposal Site within the region.
9.3 Evaluation of Transfer Station
The Danville Transfer Station, which is privately owned and operated by Waste
Management, has a capacity of 300 tons per day. It is currently being operated at a
rate of 110 tons per day. The Station has a capacity three times the current rate.
The waste generation for the plan area is projected to be flat. The volume of waste
through the Transfer Station will be evaluated at each extension period for the

City of Danville, Public Works Department 1990 Comprehensive Solid Waste Management Plan – 2004 REVISED
Transfer Station Agreement or rebidding. By Public Works to ensure adequate transfer
capacity for the plan area.

City of Danville, Public Works Department 1990 Comprehensive Solid Waste Management Plan – 2004 REVISED
Year EstimatedPopulation Per Capita
GenerationDaily
Tonnage
AnnualTonnage
(Actual to Landfill or Transfer Station)
1990 53,000 11.7 310 113,1681991 52,900 11.8 313 114,0841992 52,800 11.9 315 115,0071993 52,700 12.1 318 115,937*1994 52,600 12.2 320 116,875*1995 52,500 5.3 139 50,7911996 52,400 5.4 142 51,6711997 52,300 5.6 146 53,4451998 52,200 5.6 147 53,6561999 52,100 5.5 144 52,5582000 48,411 6.0 144 52,6022001 48,000 5.5 133 48,5992002 47,596 5.1 122 44,3732003 47,000 4.8 114 41,575*2004 47,000 3.5 82 29,9792005 47,000 3.3 78 28,5502006 47,000 3.3 78 28,5502007 47,000 3.3 78 28,5502008 47,000 3.3 78 28,5502009 47,000 3.3 78 28,5502010 47,000 3.3 78 28,5502015 47,000 3.3 78 28,5502020 47,000 3.3 78 28,5502024 47,000 3.3 78 28,550
2004 REVISEDReason for decrease in annual tonnage:* Danville Landfill closed in 1994. * Transfer Station opened in 1995.* First Piedmont opened private transfer station in 2004 in adjacent jurisdiction.
TABLE 9-1City of Danville
20-Year Landfill and Transfer Station Tonnage Projections

City of Danville, Public Works Department 1990 Comprehensive Solid Waste Management Plan – 2004 REVISED
10.0 Implementation of Plan Components
10.1 Implementation Schedule and Milestones for Achieving State Goals
In previous chapters, Danville’s waste management plan components were identified.
This section describes how these components will be implemented over the 20-year
planning period. In Figure 10-1, a detailed implementation schedule is provided,
showing how Danville plans to achieve the Virginia recycling mandates. Figure 10-2
shows key milestones for implementing the planned waste management services and
facilities through the year 2024. As shown in these Figures, high-priority source
reduction, recycling and composting strategies were initiated in 1991. In 2005 - 2010,
materials recovery programs initiated in earlier years will be evaluated, fine tuned, and
expanded, while some new programs will be established. Evaluations needed prior to
implementing additional new programs will be performed and decisions made
regarding the degree to which policy initiatives, such as source separation ordinances
and materials bans, will be needed.
The tonnage diversions potential of recovery programs fully on line will be enhanced
through the provision of additional participation incentives and the inclusion of more
materials in the recovery system as technologies and markets for them improve.

Figure 10-1: Danville Source Reduction / Recycling / Composting Implementation Schedule
2004 UPDATE
Management Option
2005 - 2010
2010 - 2015 2015 - 2020
2020 - 2024
Source Reduction
• Expand in-house programs.
Non-household Materials Recycling
• Work with Danville
Development Council to attract recycling dealers to Danville, providing incentives as necessary.
• Poll business and industry to
track recycling amounts.
• Identify target generators
and initiate technical assistance program.
• Evaluate need to establish
additional infrastructure. • Consider need for glass
recycling route for business and commercial.
• Begin office paper recycling
route and pass on to private hauler as a public private partnership.
Household Recyclable Materials Collection
• Continue to operate three drop-
off recycling locations.
• Evaluate pros, cons, and
options for expanding drop-off program and initiate expansion as deemed appropriate.
• Make system improvements,
collect additional materials as determined feasible.
• Evaluate potential for
expansion use of Adult Detention inmates as a recycling resource.

Management Option
2005 - 2010
2010 - 2015 2015 - 2020
2020 - 2024
Tires Recovery
• Work with tire manufacturers
and distributors to ensure use of environmentally sound collection and storage methods.
• Establish additional tire
management regulations if needed.
• Educate and encourage consumers to dispose of tires at vendor where new ones are purchased.
Lead Acid Batteries Recycling
• Identify safe handling methods
and acceptable market outlets.
• Educate retailers/ wholesalers
on preferred management options.
• Encourage retailers/
wholesalers to inform customers about battery exchange opportunities.
• Evaluate need for City to
provide additional collection sites.
• Educate consumers on current disposal options for batteries.
Used Motor Oil Recovery
• Identify market outlets and
solicit cooperation of lube centers in serving as public drop points.
• Encourage waste oil handlers to
send oil to an acceptable recovery outfit.
• Educate consumers about proper recycling of motor oil at auto stores.

Management Option
2005 - 2010
2010 - 2015 2015 – 2020 2020 - 2024
White Goods Recycling
• Continue to recover and sell white goods to a local buyer. • Explore cooperative marketing opportunities. • Modify and expand programs as needed.
• Continue to educate consumers on proper disposal of white goods. • Continue to operate curbside collection recycling of white goods.
Land clearing and Construction Debris Management
• Assess waste quantity and
characteristics. Develop recovery plan and divert clean wood items for reuse.
• Evaluate means of improving
firewood cutting and distribution program.
• Educate contractors and property owners to incinerate waste wood rather than bury waste wood.
• Continue to operate free firewood pile. • Investigate incineration of land clearing and demolition debris.
Sludge
• Continue land application of sludge.
Special Waste
• Continue pick-up and delivery
service for sharps containers.

Management Option
2005 - 2010
2010-2015 2015-2020
2020-2024
Composting
• Continue operating composting
facility. Use compost/mulch in City operations wherever practical.
• Continue separate collection of
yard wastes from residences. • Publicize availability of recycled
mulch/compost free to area residents
• Publicize availability of free
firewood. • Continue diverting 100% of yard
waste from landfill to compost facility.
• Continue curbside collection of
separate yard waste. • Continue to develop compost
markets.
• Expand capability of
composting components.
Reduction / Recycling / Composting Education and Promotion
• Promote existing source
reduction and recycling programs and opportunities.
• Educate the residents on use of
compost and mulch. • Evaluate success of initial
efforts and further expand program.
• Develop communications
plan. • Expand program as outlined
in plan. • Utilize coordinating groups
of industry for combining the recycling power or purchasing power.
• Encourage industry to apply
for State environmental excellence award.

City of Danville, Public Works Department 1990 Comprehensive Solid Waste Management Plan – 2004 REVISED
10.2 Recycling Calculation Methodology The City of Danville has met or exceeded the mandated recycling rate for each responding
period to the Virginia DEQ. Amended Regulations for the Development of Solid Waste
Management Plans (9 VAC 20-130-10 et seq.) became effective on August 1, 2001. The
amended regulations require that Regions as well as each city, county, and town not part of
a designated Region in the Commonwealth develop complete, revised solid waste
management plans. Section 9 VAC 20-130-120 B & C of the Regulations requires that a
minimum recycling rate of 25% of the total municipal solid waste generated annually in each
city, county, town, or region be maintained. It also requires that the plan describe how this
rate shall be met or exceeded and requires that the calculation methodology be included in
the plan. Section 9 VAC 20-130-165 D establishes that every city, county, and town in the
Commonwealth, or solid waste management planning region shall submit to the department
by April 20 of each year, the data and calculations required in 9 VAC 20-130-120 B & C for
the preceding calendar year.
Approved calculation methods are outlined in the rules and provide plan submitters with a
choice of using weight or volume estimates. The City of Danville has opted to use weight
estimates based on actual scale data of solid waste received weight estimates for materials
recycled derived from the best available data and information sources. Provided in this
section is a description of the methodology utilized to develop projections of the source, type
and quantity of materials expected to be recycled through the implementation of the
programs outlined in this plan. These projections were developed using the DEQ calculation
procedures to the extent feasible. The basic formula for calculating recycling rates to be
used for final estimates, as provided by the Virginia Department of Environmental Quality, is
as follows:
Calculated Recycling Rate
Part I - Principal Recyclable Material (PRM): PRMs include paper, metal (except automobile
bodies), plastic, glass, commingled, yard waste, waste wood, and textiles taken from the
MSW generation. The total weight in tons of all PRMs collected for recycling represents the
letter “P” in the Recycling Rate Calculation.
[P + S] / [P + S + M] X 100 = Recycling RateP = Principal Recyclable Material S = Supplemental Recyclable Material M = Total Municipal Solid Waste

City of Danville, Public Works Department 1990 Comprehensive Solid Waste Management Plan – 2004 REVISED
Part II – Supplemental Recyclable Material (SRM): Recycled SRMs include waste tires, used
oil, used oil filters, used antifreeze, abandoned automobiles removed, batteries, sludge
(composted), electronics, and large diameter tree stumps (>6” diameter) taken from the
MSW generation. For a material to classify as “reused” a solid waste material must be
separated from the municipal solid waste stream and used, without processing or changing
its form, for the same or another end use. Reused SRMs include construction waste,
demolition waste, debris waste and ash from non-industrial sources. The total weight in tons
of all SRMs collected for recycling and/or reuse represents the letter “S” in the Recycling
Rate Calculation.
Vegetative and Yard Waste Material may only be counted towards the recycling rate if they
are being mulched or composted, and used for agricultural or landscaping purposes. Sludge
that is de-watered and then land applied is not included as a SRM.
Part III – Total Municipal Solid Waste (MSW) Disposed: Use the total amount in tons of MSW
that was disposed of during the reporting period for each of the source categories
(Household, Commercial, Institutional, and Other). “Disposed” means delivery to a permitted
sanitary landfill or waste incinerator for disposal and excludes industrial wastes. Totals for
each of these categories should include only the amount of MSW generated by and then
disposed of by the reporting jurisdiction(s). Industrial waste and by-products should not be
included in the MSW calculation. The total weight in tons of MSW disposed of represents the
letter “M” in the Recycling Rate Calculation.
10.2.1 Household Recyclables
Presented in Tables 10-1 through 10-7 are projections of household recyclables to be
recovered through the programs outlined in Sections 5.0 – 7.0. As explained in the
tables, estimates for total tons of each material generated are derived from estimates
of per household generation rates from the Virginia Market Development Study, from
estimates prepared by Franklin Associates or Danville Sanitation Division estimates
based on truck volumes and landfill scale data. Recovery rate estimates were
provided by the City’s solid waste management planning consultant and are based on
knowledge of recovery levels achieved from existing programs comparable to those
planned for Danville plus City of Danville and Danville non-profit organization recycling

City of Danville, Public Works Department 1990 Comprehensive Solid Waste Management Plan – 2004 REVISED
program recovery levels. Recovered Percent of Total figures provided in the shaded
columns reflect the percentage of the total waste stream that would be diverted by
achieving the projected recovery rates. These values are provided simply to
demonstrate the impact of implementing activities targeting each material and are not
used in final calculations of household waste recycling levels which are presented in
Table 10-8. This summary table shows projected recovered tonnages by material type
for each year of the planning period and the estimated percentage of the total
household waste stream which they comprise. The total per year recycled tonnage
estimates are repeated in the final calculations presented in Table 10-13.
10.2.2 Commercial Non-household Recyclables
Tables 10-9 through 10-12 present projections of the tonnage of principal recyclable
materials (PRMs) from non-household sources generated and expected to be
recovered through the year 2024 as well as an estimate of industrial recyclables
known to have been recycled in 1990. Table 10-9 provides a breakdown of the
sources of commercial waste based on employment projections and estimated per
employee waste generation levels for Danville. Producing these projections provided
the opportunity to apply estimated commercial waste characterization data to the
waste tonnage estimates for each class of business to generate tonnage estimates for
PRMs from commercial sources. Assuming that the primary target materials and
sources are corrugated containers and high-grade paper from offices, corrugated and
computer printout from retail businesses, and glass and aluminum beverage
containers and corrugated containers from restaurants, the commercial PRM recovery
levels shown in the final column are projected. The total recovered PRM tonnage
estimates from this table are entered in the final calculations (Table 10-13).
10.2.3 Industrial Non-household Recyclables
The quantity of industrial non-household PRMs could not be based on regional, state
or national date, since the nature of industrial operations varies dramatically from
location to location and with it the nature of industrial waste. In order to avoid
making projections on the composition of industrial waste that had the potential to be

City of Danville, Public Works Department 1990 Comprehensive Solid Waste Management Plan – 2004 REVISED
YearNumber of
Households
TotalGenerated
(tons)*
RecoveryRates
(percent)Material Recovered
(tons)
RecoveredPercent ofTotal (%)
1990 23,297 3,047 9 274 0.76
1991 23,253 3,041 11 338 1.07
1992 23,209 3,036 2 70 0.20
1993 23,165 3,030 4 128 0.34
1994 23,121 3,024 10 300 0.80
1995 23,077 3,018 11 324 1.13
2000 23,108 3,022 9 276 1.00
2005 23,108 3,022 9 276 1.00
2010 23,108 3,022 9 276 1.00
2015 23,108 3,022 9 276 1.00
2020 23,108 3,022 9 276 1.002024 23,108 3,022 9 276 1.00
REVISED 2004 UPDATE* source: VA MARKET DEVELOPMENT STUDY using the value of 5.03 pounds/household/week
TABLE 10-1City of Danville Recyclables Projections
MATERIAL: OLD NEWSPAPERS

City of Danville, Public Works Department 1990 Comprehensive Solid Waste Management Plan – 2004 REVISED
YearNumber of
Households
TotalGenerated
(tons*)
RecoveryRates
(percent)Material Recovered
(tons)
RecoveredPercent ofTotal (%)
1990 23,297 1,296 3 37 0.03
1991 23,253 1,294 4 52 0.05
1992 23,209 1,291 8 100 0.28
1993 23,165 1,289 1 16 0.07
1994 23,121 1,286 2 33 0.08
1995 23,077 1,284 3 33 0.10
2000 23,108 1,286 4 47 0.13
2005 23,108 1,286 4 48 0.15
2010 23,108 1,286 4 48 0.18
2015 23,108 1,286 4 48 0.18
2020 23,108 1,286 4 48 0.182024 23,108 1,286 4 48 0.18
REVISED 2004 UPDATE* source: VA MARKET DEVELOPMENT STUDY using the value of 2.14 pounds/household/week
TABLE 10-2City of Danville Recyclables Projections
MATERIAL: GLASS CONTAINERS

City of Danville, Public Works Department 1990 Comprehensive Solid Waste Management Plan – 2004 REVISED
YearNumber of
Households
TotalGenerated
(tons*)
RecoveryRate
(percent)Material Recovered
(tons)
RecoveredPercent ofTotal (%)
1990 23,297 285 1 2 0.00
1991 23,253 284 3 9 0.03
1992 23,209 284 2 1.5 0.00
1993 23,165 284 3 10 0.03
1994 23,121 282 4 11 0.03
1995 23,077 282 5 12 0.03
2000 23,108 282 4 10 0.03
2005 23,108 282 4 10 0.03
2010 23,108 282 4 10 0.03
2015 23,108 282 4 10 0.03
2020 23,108 282 4 10 0.032024 23,108 282 4 10 0.03
REVISED 2004 UPDATE* source: VA MARKET DEVELOPMENT STUDY using the value of 0.47 pounds/household/week
TABLE 10-3City of Danville Recyclables Projections
MATERIAL: ALUMINUM CANS

City of Danville, Public Works Department 1990 Comprehensive Solid Waste Management Plan – 2004 REVISED
YearNumber of
Households
TotalGenerated
(tons*)
RecoveryRate
(percent)Material Recovered
(tons)
RecoveredPercent ofTotal (%)
1990 23,297 224 0 0 0.00
1991 23,253 224 2 5 0.00
1992 23,209 224 15 33 0.09
1993 23,165 224 8 17 0.05
1994 23,121 222 8 16 0.05
1995 23,077 222 8 17 0.07
2000 23,108 222 8 17 0.07
2005 23,108 222 9 20 0.07
2010 23,108 222 9 20 0.07
2015 23,108 222 9 20 0.07
2020 23,108 222 9 20 0.072024 23,108 222 9 20 0.07
REVISED 2004 UPDATE* source: VA MARKET DEVELOPMENT STUDY using the value of 0.37 pounds/household/week
TABLE 10-4City of Danville Recyclables Projections
MATERIAL: HDPE/PET CONTAINERS

City of Danville, Public Works Department 1990 Comprehensive Solid Waste Management Plan – 2004 REVISED
YearNumber of
Households
TotalGenerated
(tons*)
RecoveryRate
(percent)Material Recovered
(tons)
RecoveredPercent ofTotal (%)
1990 23,297 7,922 1 79 0.21
1991 23,253 7,986 20 1,597 4.39
1992 23,209 7,143 100 7,143 100
1993 23,165 7,878 100 7,878 100
1994 23,121 8,250 100 8,250 100
1995 23,077 10,672 100 10,672 100
2000 23,108 10,672 100 10,672 100
2005 23,108 10,700 100 10,700 100
2010 23,108 10,700 100 10,700 100
2015 23,108 10,700 100 10,700 100
2020 23,108 10,700 100 10,700 1002024 23,108 10,700 100 10,700 100
REVISED 2004 UPDATE
* source: DANVILLE SANITATION DIVISION ESTIMATES using the value of 13.08 pounds/household/week until 1994. Using actual weight scale amount in 1994 and 1995.
TABLE 10-5City of Danville Recyclables Projections
MATERIAL: YARD WASTE

City of Danville, Public Works Department 1990 Comprehensive Solid Waste Management Plan – 2004 REVISED
YearNumber of
Households
TotalGenerated
(tons*)
RecoveryRate
(percent)Material Recovered
(tons)
RecoveredPercent ofTotal (%)
1990 23,297 273 0 0 0.00
1991 23,253 275 2 5 0.00
1992 23,209 277 2 2 0.00
1993 23,165 279 5 3 0.00
1994 23,121 281 7 4 0.00
1995 23,077 284 29 81 0.28
2000 23,108 270 30 80 0.28
2005 23,108 270 33 88 0.30
2010 23,108 270 33 90 0.31
2015 23,108 270 33 90 0.31
2020 23,108 270 33 90 0.312024 23,108 270 33 90 0.31
REVISED 2004 UPDATE* source: VA MARKET DEVELOPMENT STUDY using the value of 0.45 pounds/household/week
TABLE 10-6City of Danville Recyclables Projections
MATERIAL: ALL STEEL / TIN

City of Danville, Public Works Department 1990 Comprehensive Solid Waste Management Plan – 2004 REVISED
YearNumber of
Households
TotalGenerated
(tons*)
RecoveryRate
(percent)Material Recovered
(tons)
RecoveredPercent ofTotal (%)
1990 23,297 624 1 6 0.01
1991 23,253 623 20 126 0.3
1992 23,209 622 22 136 0.4
1993 23,165 621 33 208 0.6
1994 23,121 620 22 126 0.3
1995 23,077 618 32 200 0.7
2000 23,108 618 49 300 1.0
2005 23,108 618 49 300 1.0
2010 23,108 618 49 300 1.0
2015 23,108 618 49 300 1.0
2020 23,108 618 49 300 1.02024 23,108 618 49 300 1.0
REVISED 2004 UPDATE* source: FRANKLIN ASSOCIATES using the value of 1.03 pounds/household/week
TABLE 10-7City of Danville Recyclables Projections
MATERIAL: WHITE GOODS

City of Danville, Public Works Department 1990 Comprehensive Solid Waste Management Plan – 2004 REVISED
YearRecycled
NewspaperRecycled
GlassRecycledAluminum
RecycledPlastic
RecycledYard Waste
RecycledSteel / Tin
RecycledWhite Goods
TotalRecycled
ResidentialRecyclingRate (%)*
1990 274 37 2 0 79 0 6 398 1
1991 338 52 9 5 1,597 5 126 2,132 6
1992 700 100 1.0 33 7,143 2 136 8,115 23
1993 128 16 10 17 7,878 3 208 8,260 23
1994 300 33 11 16 8,250 4 126 8,380 23
1995 324 33 12 17 10,672 81 200 11,339 39
2000 276 47 10 17 10,672 80 300 11,402 39
2005 276 48 10 20 10,700 88 300 11,442 39
2010 276 48 10 20 10,700 90 300 11,464 39
2015 276 48 10 20 10,700 90 300 11,464 39
2020 276 48 10 20 10,700 90 300 11,464 392024 276 48 10 20 10,700 90 300 11,464 39
REVISED 2004 UPDATE* AS PERCENTAGE OF TOTAL RESIDENTIAL WASTE GENERATION
TABLE 10-8City of Danville Residential Recyclables Projections
(TONS/YEAR)

City of Danville, Public Works Department 1990 Comprehensive Solid Waste Management Plan – 2004 REVISED
Year
TotalWaste
Generated
Office LightIndustry
Retail Restaurant TotalCommercial
Waste
1990 113,168 2,232 481 2,277 4,099 9,089
1991 114,084 2,245 484 2,291 4,124 9,144
1992 114,099 2,259 487 2,304 4,149 9,199
1993 115,699 2,272 490 2,318 4,174 9,254
1994 116,941 2,286 493 2,332 4,199 9,309
1995 68,724 2,300 496 2,346 4,224 9,365
2000 70,564 2,369 511 2,417 4,351 9,646
2005 70,809 2,432 524 2,482 4,468 9,907
2010 70,902 2,447 527 2,497 4,495 9,966
2015 70,902 2,447 527 2,497 4,495 9,966
2020 70,902 2,447 527 2,497 4,495 9,9662024 70,902 2,447 527 2,497 4,495 9,966
REVISED 2004 UPDATE
TABLE 10-9DANVILLE COMMERCIAL WASTE PROJECTIONS
(TONS/YEAR)

City of Danville, Public Works Department 1990 Comprehensive Solid Waste Management Plan – 2004 REVISED
Material OfficesLight
Industry Retail Restaurants
Container Glass 0.7 0.0 0.8 9.2
Aluminum Cans 0.9 0.0 0.4 0.3
Steel Cans 0.1 0.0 0.0 0.0
Newspaper 8.2 3.9 0.0 0.0
Corrugated 15.8 0.0 41.9 12.5
Computer Printout 13.5 0.0 7.2 0.0
Office Ledger 17.3 5.9 5.3 1.3
Mixed Paper (1) 40.8 34.8 29.2 5.4
Plastic Bottles 0.0 0.0 0.0 0.3
Ferrous Scrap 0.4 0.0 0.6 1.4
Non-Ferrous Scrap 0.0 0.0 0.0 0.1
Food Waste (1) 0.0 0.7 3.4 56.3
Yard Waste 0.0 0.0 0.7 0.0
Textiles 0.0 0.0 0.7 0.0
NEC (1,2) 2.3 54.7 10.5 13.2
Principal Recyclables 56.9 9.8 57.6 25.1Per Employee Rate (3) 0.2 0.4 0.5 2.3
2004 UPDATE REVISEDNOTE: (1) DO NOT COUNT AS "PRINCIPAL RECYCLABLE MATERIALS" (2) NEC = Not Elsewhere Classified (3) TONS PER YEAR PER FULL TIME EMPLOYEE
TABLE 10-10CALCULATIONS: COMMERCIAL WASTE GENERATION
GENERATION RATE BY CLASS OF BUSINESS (%)

City of Danville, Public Works Department 1990 Comprehensive Solid Waste Management Plan – 2004 REVISED
YearTotal
Waste
Non-ResidentialWaste
Generated
PrincipalRecyclablesGenerated
PrincipalRecyclables
Recycled
PRM RecyclingRate (%)*
1990 113,168 77,079 6,728 113 1.7
1991 114,084 77,703 6,768 228 3.4
1992 114,099 78,331 6,809 345 5.1
1993 115,699 78,965 6,850 580 8.5
1994 116,941 79,603 6,891 818 11.9
1995 68,728 40,056 3,485 1,296 18.7
2000 70,564 41,892 3,645 1,472 20.6
2005 70,809 42,109 3,663 1,676 22.9
2010 70,902 42,202 3,672 1,843 25.0
2015 70,902 42,202 3,672 1,843 25.0
2020 70,902 42,202 3,672 1,843 25.02024 70,902 42,202 3,672 1,843 25.0
REVISED 2004 UPDATE* AS PERCENTAGE OF COMMERCIALLY GENERATED RECYCLABLES
TABLE 10-11NON-RESIDENTIAL RECYCLING PROJECTIONS
(TONS PER YEAR)

City of Danville, Public Works Department 1990 Comprehensive Solid Waste Management Plan – 2004 REVISED
Target MaterialsBaseline
Recycling
AdditionalMaterial
Landfilled
TotalTarget
MaterialRecyclingRate (%)*
Corrugated Containers 27 6,197 6,224 0.4
Textiles 573 1,299 1,872 30.6
Plastic 0 1,521 1,521 0.0
Ferrous Metals ** 5,000 519 5,519 90.6
Non-Ferrous Metals 700 482 1,182 59.2
Other PRM 0 4,267 4,267 0.0TOTAL 6,300 10,019 16,319 38.6
2004 UPDATE REVISED* AS PERCENTAGE OF TOTAL INDUSTRY GENERATED RECYCLABLES
TABLE 10-12ESTIMATED INDUSTRIAL TARGET RECYCLABLES (TONS)
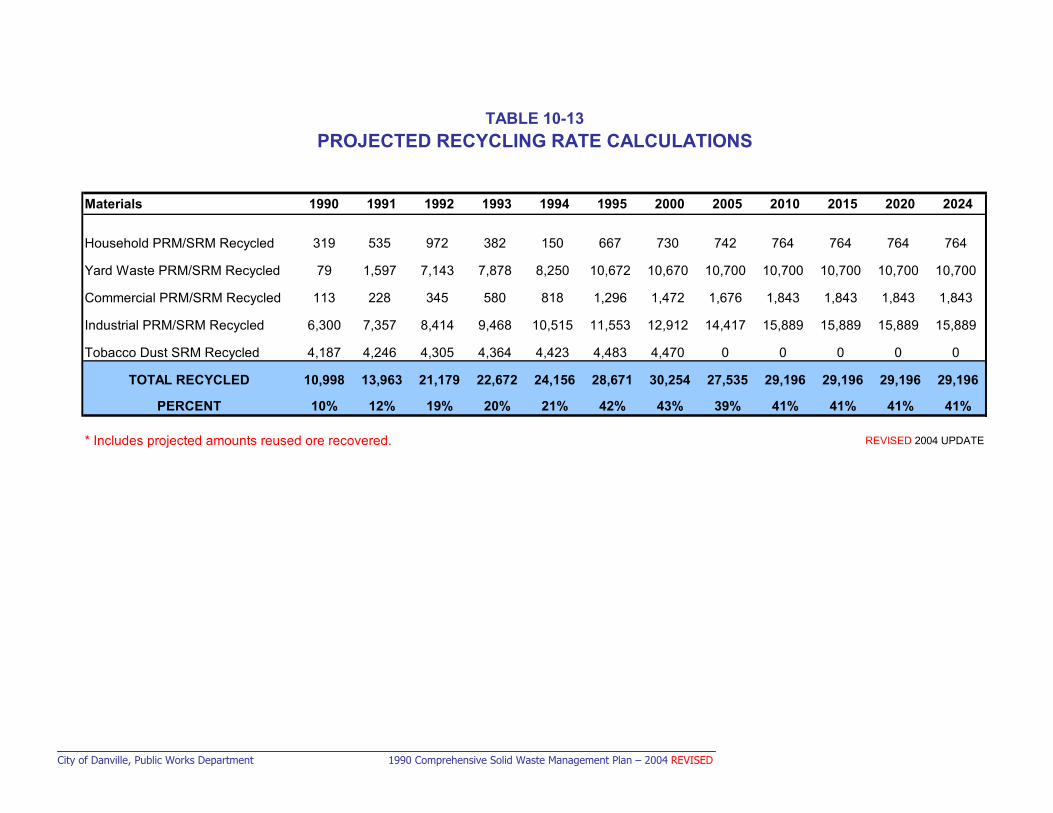
City of Danville, Public Works Department 1990 Comprehensive Solid Waste Management Plan – 2004 REVISED
Materials 1990 1991 1992 1993 1994 1995 2000 2005 2010 2015 2020 2024
Household PRM/SRM Recycled 319 535 972 382 150 667 730 742 764 764 764 764
Yard Waste PRM/SRM Recycled 79 1,597 7,143 7,878 8,250 10,672 10,670 10,700 10,700 10,700 10,700 10,700
Commercial PRM/SRM Recycled 113 228 345 580 818 1,296 1,472 1,676 1,843 1,843 1,843 1,843
Industrial PRM/SRM Recycled 6,300 7,357 8,414 9,468 10,515 11,553 12,912 14,417 15,889 15,889 15,889 15,889
Tobacco Dust SRM Recycled 4,187 4,246 4,305 4,364 4,423 4,483 4,470 0 0 0 0 0
TOTAL RECYCLED 10,998 13,963 21,179 22,672 24,156 28,671 30,254 27,535 29,196 29,196 29,196 29,196
PERCENT 10% 12% 19% 20% 21% 42% 43% 39% 41% 41% 41% 41%
* Includes projected amounts reused ore recovered. REVISED 2004 UPDATE
PROJECTED RECYCLING RATE CALCULATIONSTABLE 10-13

City of Danville, Public Works Department 1990 Comprehensive Solid Waste Management Plan – 2004 REVISED
highly inaccurate, tonnage estimates were developed for the PRMs to be targeted for
recovery based on the following sources:
Sanitation Division estimates of those materials entering the landfill;
• Industry interviews and survey questionnaires; and
• A survey of secondary materials buyers in Danville known to be handling target
PRMs from Danville sources.
Target PRMs enter the landfill in a relatively clean, often-segregated form; hence their
quantity was relatively easy to estimate in comparison to other waste materials. Since
the remainder of the industrial fraction could not be characterized, a middle-of-the-
road assumption was made that 50 percent of this balance was principal recyclable
materials, none of which would be recycled.
The assumptions and approaches described above form the basis for the figures
presented in Figure 10-12. A baseline recycling column was added to account for
existing Danville industrial waste recycling tonnages which have been documented to
date.
10.2.4 Total Recycling Rate
Table 10-13 reflects the results of entering the projected Danville household and non-
household recycling rates into the Department of Waste Management recycling rate
formula presented at the beginning of this section. Included in the formula numerator
are projected tonnages of household, commercial non-household and industrial non-
household PRMs plus supplemental recyclable material and wood waste, which
Danville is composting as discussed in Section 7.0. Included in the formula
denominator are total household waste tonnage projections plus total non-household
PRM tonnage projections. As can be seen by the resultant recycling rate percent
figures, the City of Danville is expected to exceed minimum State recycling mandates
through full implementation of this plan.

City of Danville, Public Works Department 1990 Comprehensive Solid Waste Management Plan – 2004 REVISED
10.3 Funding & Construction Schedules
Continued effective implementation and operation of the programs and facilities
described in this plan does require significant operating funds as well as administrative
and field personnel. No significant capital projects are anticipated after 2004. The
Composting Facility, Transfer Station, and Landfill Closure have all been accomplished
prior to 2004. All future operating and capital costs will be funded through the
monthly Solid Waste fee charged to households and businesses. This fee is reviewed
annually for adequacy.
10.3.1 Capital Costs
Table 10-14 summarizes the estimated capital costs of planned solid waste
management facilities through the year 2024.
TABLE 10-14 Projected Capital Costs for
Danville Solid Waste Management Facilities
Yard waste composting/mulch production facility ....................................... Complete
Existing landfill closure ............................................................................. Complete
Construct Transfer Station........................................................................ Complete
10.3.2 Current Operating Costs
Current annual budget amounts for FY 2004-2005 (see attached budget in Appendix
E) are as follows:
Recycling Drop-off Sites, White Goods Collection .............. $99,971.
Recycling Composting Site Operation................................ $95,567.
Yard Waste Recycling Collection Costs .............................$464,511.
Leaf Recycling Collection Costs........................................$242,414.
Post Closure Landfill Maintenance....................................$110,818.
Waste and Debris Collection and Disposal ..................... $2,154,538.

City of Danville, Public Works Department 1990 Comprehensive Solid Waste Management Plan – 2004 REVISED
10.3.3 Transfer Station Tipping Fees
The Danville landfill was closed in 1993 and replaced by the Danville Transfer Station.
Table 10-15 shows the costs of disposal since inception. The costs are adjusted
annually by the Consumer Price Index and have averaged 2.3% in the past 10 years.
The current cost is $42.87 per ton. Waste Management of the Piedmont has a 25-
year disposal contract with the City.
TABLE 10-15
Transfer Station Costs
Year Cost Per Ton Consumer Price Index
Increase
1994 $33.89 2.7%
1995 $34.81 2.7%
1996 $35.72 2.6%
1997 $36.65 2.1%
1998 $37.41 1.9%
1999 $38.11 1.5%
2000 $39.10 2.6%
2001 $40.43 3.4%
2002 $41.20 1.9%
2003 $42.11 2.2%
2004 $42.87 1.8%
Average percent of increase: 2.3%

City of Danville, Public Works Department 1990 Comprehensive Solid Waste Management Plan – 2004 REVISED
10.4 Financing Mechanisms
In 1990, the City established a Solid Waste Enterprise Fund and established a monthly
user fee which now covers all costs of collection, recycling, disposal, and capital
improvements. The monthly fee which is charged on residential and commercial
electric bills is $13.80 per month (residential) and $2.00 per month (commercial). The
following Residential Solid Waste Programs are in effect in 2004:
• Back Yard Residential Refuse Collection
• Curbside Yard Waste Collection (Recycling)
• Loose Leaf Collection in Fall (Recycling)
• Compost / Mulch Facility Operation (Recycling)
• Closed Landfill Post-closure Costs
• Recycling Drop-off Sites (Recycling)
• Disposal of Residential Waste at Transfer Station
• Free Sharps Container Collection for Residents
This fee is evaluated annually for adequacy to fund all solid waste services and is
adjusted if needed.
10.5 Conclusion
As demonstrated by this Solid Waste Management Plan, the City of Danville is
embarking on an aggressive and progressive strategy for reducing, recycling and
composting solid waste and disposing of the remainder in a manner that is
environmentally sound. The successful implementation of plan components should
result in recycling levels that significantly exceed minimum requirements of the
Commonwealth of Virginia. While implementation of this plan marks a significant
change in the way Danville solid wastes are managed, the end result should be cost-
effective and equitable for all waste management system users. The City of Danville
will continue to seek public involvement in evaluating and fine-tuning its waste
management programs to ensure high public acceptance and the proper management
of solid waste.

COMPREHENSIVE SOLID WASTE
MANAGEMENT PLAN
2004 UPDATE - REVISED
City of Danville, Public Works Department 1990 Comprehensive Solid Waste Management Plan – 2004 UPDATE REVISED
Appendix A ADVISORY COMMITTEE

City of Danville, Public Works Department 1990 Comprehensive Solid Waste Management Plan – 2004 REVISED
APPENDIX A
2004 DANVILLE SOLID WASTE ADVISORY COMMITTEE
Members and Their Affiliations
Name Affiliation Stuart Sutphin ..............................Virginia Extension Service
H.I. Slayton...................................Citizen Representative
Lee Robertson..............................City Beautiful Committee
Mark Stegall .................................Goodwill Industries
Darren Conner .............................Dewberry
Don Nodtvedt ...............................Nestle USA
Richard Turner .............................Industrial Development Authority
Scott Thompson ...........................Thompson’s Inc.
City Staff:
Richard Drazenovich....................Director of Public Works
Thomas Spicer .............................Sanitation Division Director

March 22, 2005 – Solid Waste Advisory Committee Meeting
DANVILLE SOLID WASTE ADVISORY COMMITTEE March 22, 2005
A meeting of the Danville Solid Waste Advisory Committee was held on Tuesday, March 22, 2005 in the City of Danville, Public Works Conference Room. Those in attendance are as follows:
Richard Drazenovich, Public Works Director Richard Turner, Industrial Development Authority Stuart Sutphin, Virginia Extension Service Mark Stegall, Director of Goodwill Industries Lee Robertson, City Beautiful Committee Tom Spicer, Sanitation Division Director, Public Works Don Nodtvedt, Nestle Scott Thompson, Thompson’s Inc. H.I. Slayton, Citizen Representative Denise Tatum, Secretary, Public Works Richard Drazenovich opened the meeting and welcomed everyone. Those in attendance introduced themselves. SOLID WASTE MANAGEMENT PLAN OVERVIEW The original Comprehensive Solid Waste Management Plan, adopted in 1991, was recommended to City Council by the Advisory Committee, which consists of citizen representation from contractors, businesses and other interested parties. Each 2004 Solid Waste Advisory Committee member was sent a draft of the revised plan for review in advance of the meeting. Comments/recommendations will be incorporated into this plan and sent to City Council pending any modifications. Public citizen input, representatives and public notice would also be included in this revision. This plan has been placed on the City’s main web page for review. The web page address is: www.danville-va.gov . Rick stated that we had the option of re-doing the whole plan or amending the plan. Some accomplishments have included closing the landfill, opening the Transfer Station and Compost facility, recycling drop-off, and resolution of the white goods issue. The main purpose of this plan is to comply with the amended Solid Waste Regulations that requires we revise the plan. The focus is on existing services rather than adding a lot of new costs into the systems. RECYCLING Rick noted that we have met the 25% recycling requirement because of the Compost facility. The drop-off containers have not really helped much due to the fact that there is not a lot of recycling industry in town. Greensboro is the nearest Material Recovery Facility (MRF) where it can be separated out and then recycled. Our asphalt millings from the resurfacing contracts are reused as crushed stone base in our parking lots and trails. This has been included as a reuse material in our

March 22, 2005 – Solid Waste Advisory Committee Meeting
recycling report. Richard Turner asked if the 25% recycling would change. Rick responded that he did not anticipate changes in the near future. Discussed recyclable product income for the products that we generate. We are saving landfill space, as well as $42.00 per ton for the landfill. These are offsetting costs, but there are no incoming revenues. The mulch is given back to the residents. Don Nodtvedt added that Nestle has a cost avoidance of $1.8 million. Mark Stegall added that their aluminum recycling is through Anhauser Busch. The clothing that cannot be sold in the stores ends up in salvage that is sold by a broker. This plan centers on keeping service up and costs down as well as educating the public of environmental issues, such as litter and recycling and proper disposal of special waste, such as motor oil and batteries. PLAN REVISIONS The State Regulations require a plan for tracking disposed waste generated and recycling within the plan area. This includes polling the industries as to what they generate and what they recycle. Tom Spicer added that we would poll industries such as Nestle, Goodwill, Corning and Goodyear who are doing recycling. Rick added that polling businesses would allow us to exchange information. Solid waste generation, upon closure of the landfill, was approximately 113,000 to 120,000 tons of waste. This dropped to 45,000 tons after closure. This indicated that numerous industries that were disposing at the landfill are now recycling or reusing. Sludge is now being dried and land applied. Residential solid waste is $13.80 per month, which covers refuse/bulk debris/yard waste/loose leaves/drop-off centers as well as the operation of the Compost facility. Three City drivers are maintaining litter control with the assistance of inmate crews. The main roads are picked up on a weekly basis. Rick noted that the plan is not proposing any changes in our current systems. Public Notification will be published on March 23, 2005 to allow a 15-day comment period on this plan. A public meeting is scheduled for March 30, 2005 at the Public Works Office. RECOMMENDATIONS Tom suggested that in the future, recycling of electronics could be added to this plan. Don suggested partnering with Habitat for Humanity for the recycling of aluminum cans. Suggestions from the Solid Waste Advisory Committee:
1. Utilize coordinating groups of industry for combining the recycling power or purchasing power.
2. Encourage industry to apply for the State Environmental Excellence Award. 3. Evaluate potential for expansion use of Adult Detention inmates as a recycling resource.

DANVAPPA.RPT A-1 HAZEN AND SAWYER, P.C.
APPENDIX A
1990 DANVILLE SOLID WASTE ADVISORY COMMITTEE
Members and Their Affiliations Name Affiliation F.W. Townes, III (Chairman) Townes Funeral Home
James Wrenn Goodyear Tire & Rubber Co.
Robert Thompson President, John W. Daniel Co.
Mrs. L.M. Weringo Girl Scout Recycling Coordinator
Mark Stegall Director, Goodwill Industry
Mrs. Susan Hoffman Averett College
Mrs. Sharon Scott Averett College
Joseph Kauffman Insurance Broker
John Gayk Danville Development Council
Ken Parrish Dan River Mills
Mrs. Joanne Ezell City Beautiful Committee
Joe Bloomer Memorial Hospital
H.I. Slayton Citizen Representative
City Staff
Charles F. Church City Manager
W.V. Cousins Director of Public Works
Thomas M. Spicer Sanitation Division Director
Stephen Hudson Purchasing Director
John Sweeney Director of Utilities

COMPREHENSIVE SOLID WASTE
MANAGEMENT PLAN
2004 UPDATE - REVISED
City of Danville, Public Works Department 1990 Comprehensive Solid Waste Management Plan – 2004 UPDATE REVISED
Appendix B CITY COUNCIL RESOLUTION
ADOPTING PLAN and PUBLIC PARTICIPATION


March 30, 2005 - Solid Waste Management Plan – PUBLIC MEETING
City of Danville, Virginia COMPREHENSIVE SOLID WASTE MANAGEMENT PLAN
PUBLIC MEETING March 30, 2005
Pursuant to the Virginia Waste Management Regulations 9 VAC 20-130130, the City of Danville, Public Works Director, Richard Drazenovich, called the public meeting to order at 5:00 p.m. on Wednesday, March 30, 2005 at the Public Works Office, 998 South Boston Road, Danville, Virginia. Those in attendance at the meeting:
Richard Drazenovich, Director of Public Works Thomas Spicer, Sanitation Division Director of Public Works Richard Turner, 2004 Danville Solid Waste Advisory Committee Member Mark Wilson, TELvista Co. David Allen, TELvista Co. Denise Wyatt, Senior Secretary of Public Works
Notice of the Public Meeting had been duly published in the Danville Register and Bee on Wednesday, March 23, 2004. Those in attendance gave no public input or comments. The meeting was adjourned.
PUBLIC COMMENT PERIOD March 23, 2005 – April 7, 2005
Notice of a 15-day comment period for the 2004 Comprehensive Solid Waste Management Plan was published in the Danville Register and Bee on Wednesday, March 23, 2004. The Plan was made available at the City of Danville Public Works Office and through the City’s web page. There were no public comments received during the 15-day comment period between March 23 and April 7, 2005 either in person, in writing, or via email.


COMPREHENSIVE SOLID WASTE
MANAGEMENT PLAN
2004 UPDATE - REVISED
City of Danville, Public Works Department 1990 Comprehensive Solid Waste Management Plan – 2004 UPDATE REVISED
Appendix C VIRGINIA SOLID WASTE
MANAGEMENT REGULATIONS

Virginia Waste Management Board9 VAC 20-130-10 et seq. Regulations for Solid Waste Management Planning, Amendment 1Effective Date: August 1, 2001
1 of 18
9 VAC 20-130-10. Definitions.
The following words and terms when used in this chapter shall have the following meaning, unlessthe context clearly indicates otherwise:
"Abandoned material" means any material that is: disposed of; burned or incinerated; oraccumulated, stored or treated (but not recycled) before or instead of being abandoned by beingdisposed of, burned or incinerated.
"Agricultural waste" means all solid waste produced from farming operations, or relatedcommercial preparation of farm products for marketing.
"Board" means the Virginia Waste Management Board.
"Commercial waste" means all solid waste generated by establishments engaged in businessoperations other than manufacturing or construction. This category includes, but is not limited to,solid waste resulting from the operation of stores, markets, office buildings, restaurants andshopping centers.
"Composting" means the manipulation of the natural aerobic process of decomposition of organicmaterials to increase the rate of decomposition.
"Construction waste" means solid waste that is produced or generated during construction,remodeling, or repair of pavements, houses, commercial buildings, and other structures.Construction wastes include, but are not limited to, lumber, wire, sheetrock, broken brick, shingles,glass, pipes, concrete, paving materials, and metal and plastics if they are part of the constructionmaterial or empty containers for such materials. Paints, coatings, solvents, asbestos-containingmaterial, any liquid, compressed gases, or semi-liquids and garbage are not construction wastes.
"Contamination" means the degradation in quality of naturally occurring water, air, or soilresulting either directly or indirectly from human activity.
"Debris waste" means waste resulting from land clearing operations. Debris wastes include, butare not limited to, stumps, wood, brush, leaves, soil, and road spoils.
"Demolition waste" means solid waste produced by destruction of structures and their foundationsand includes the same materials as construction wastes.
"Department" means the Department of Environmental Quality.
"Director" means the Director of the Department of Environmental Quality or his designee.
"Discarded material" means a material that is: (i) abandoned material as defined in this chapter; (ii)recycled material as defined in this chapter; or (iii) considered inherently waste-like.

Virginia Waste Management Board9 VAC 20-130-10 et seq. Regulations for Solid Waste Management Planning, Amendment 1Effective Date: August 1, 2001
2 of 18
"Disposal" means the discharge, deposit, injection, dumping, spilling, leaking or placing of anysolid waste into or on any land or water so that such solid waste or any constituent of it may enterthe environment or be emitted into the air or discharged into any waters.
"Facility" means solid waste management facility unless the context clearly indicates otherwise.
"Friable asbestos" means any material containing more than 1.0% asbestos by weight that, whendry, may be crumbled, pulverized or reduced to powder by hand pressure and regulated as a specialwaste.
"Garbage" means readily putrescible discarded materials composed of animal, vegetable or otherorganic matter.
"Groundwater" means any water below the land surface in the zone of saturation.
"Hazardous waste" means a "hazardous waste" as defined by the Virginia Hazardous WasteManagement Regulation, 9 VAC 20-60-12 et seq.
"Household waste" means any waste material, including garbage, trash and refuse, derived fromhouseholds. Households include single and multiple residences, hotels and motels, bunkhouses,ranger stations, crew quarters, campgrounds, picnic grounds and day-use recreation areas.Household wastes do not include sanitary waste in septic tanks (septage), which is regulated by otherstate agencies.
"Incineration" means the controlled combustion of solid waste for disposal.
"Incinerator" means a facility or device designed for the treatment for volume reduction of solidwaste by combustion.
"Industrial waste" means any solid waste generated by manufacturing or industrial process that isnot a regulated hazardous waste. Such waste may include, but is not limited to, waste resulting fromthe following manufacturing processes: electric power generation; fertilizer/agricultural chemicals;food and related products/byproducts; inorganic chemicals; iron and steel manufacturing; leather andleather products; nonferrous metals manufacturing/foundries; organic chemicals; plastics and resinsmanufacturing; pulp and paper industry; rubber and miscellaneous plastic products; stone, glass,clay, and concrete products; textile manufacturing; transportation equipment; and water treatment.This term does not include mining waste or oil and gas waste.
"Industrial waste landfill" means a solid waste landfill used primarily for the disposal of a specificindustrial waste or a waste that is a byproduct of a production process.
"Institutional waste" means all solid waste emanating from institutions such as, but not limited to,hospitals, nursing homes, orphanages, and public or private schools. It can include regulatedmedical waste from health care facilities and research facilities that must be managed as an regulatedmedical waste.

Virginia Waste Management Board9 VAC 20-130-10 et seq. Regulations for Solid Waste Management Planning, Amendment 1Effective Date: August 1, 2001
3 of 18
"Integrated waste management plan" means a governmental plan that considers all elements ofwaste management during generation, collection, transportation, treatment, storage, disposal, andlitter control and selects the appropriate methods of providing necessary control and services foreffective and efficient management of all wastes. An "integrated waste management plan" mustprovide for source reduction, reuse and recycling within the jurisdiction and the proper funding andmanagement of waste management programs.
"Jurisdiction" means a local governing body; city, county or town; or any independent entity, suchas a federal or state agency, which join with local governing bodies to develop a waste managementplan.
"Landfill" means a sanitary landfill, an industrial waste landfill, or a construction/demolition/debris landfill.
"Large diameter tree stumps" means tree stumps larger than six inches in diameter.
"Litter" means all waste material disposable packages or containers, but not including the wastesof the primary processes of mining, logging, farming, or manufacturing.
"Mulch" means woody waste consisting of stumps, trees, limbs, branches, bark, leaves and otherclean wood waste that has undergone size reduction by grinding, shredding, or chipping, and isdistributed to the general public for landscaping purposes or other horticultural uses.
"Municipal solid waste" means waste that is normally composed of residential, commercial, andinstitutional solid waste and residues derived from the combustion of these wastes.
"Open dump" means a site on which any solid waste is placed, discharged, deposited, injected,dumped or spilled so as to create a nuisance or present a threat of a release of harmful substancesinto the environment or present a hazard to human health. Such a site is subject to the open dumpcriteria in 9 VAC 20-80-180.
"Permit" means the written permission of the director to own, operate or construct a solid wastemanagement facility.
"Person" means an individual, corporation, partnership, association, a governmental body, amunicipal corporation or any other legal entity.
"Principal recyclable materials" means paper, metal (except automobile bodies), plastic, glass,yard waste, wood, and textiles. "Principal recyclable materials" does not include large diameter treestumps.
"Recycled material" means a material that is derived from recycling.

Virginia Waste Management Board9 VAC 20-130-10 et seq. Regulations for Solid Waste Management Planning, Amendment 1Effective Date: August 1, 2001
4 of 18
"Recycling" means the process of separating a given waste material from the waste stream andprocessing it so that it may be used again as a raw material for a product, which may or may not besimilar to the original product. For the purpose of this chapter, recycling shall not include processesthat only involve size reduction.
"Refuse" means all solid waste products having the character of solids rather than liquids and thatare composed wholly or partially of materials such as garbage, trash, rubbish, litter, residues fromclean up of spills or contamination, or other discarded materials.
"Regional boundary" means the boundary defining an area of land that will be a unit for thepurpose of developing a waste management plan, and is established in accordance with 9 VAC 20-130-180 through 9 VAC 20-130-220.
"Regulated medical waste" means solid wastes so defined by the Regulated Medical WasteManagement Regulations (9 VAC 20-120-10 et seq.) as promulgated by the Virginia WasteManagement Board.
"Residential waste" means household waste.
"Resource recovery system" means a solid waste management system that provides for collection,separation, recycling and recovery of energy or solid wastes, including disposal of nonrecoverablewaste residues.
"Reuse" means the process of separating a given solid waste material from the waste stream andusing it, without processing or changing its form, other than size reduction, for the same or anotherend use.
"Rubbish" means combustible or slowly putrescible discarded materials that include but are notlimited to trees, wood, leaves, trimmings from shrubs or trees, printed matter, plastic and paperproducts, grass, rags and other combustible or slowly putrescible materials not included under theterm "garbage."
"Sanitary landfill" means an engineered land burial facility for the disposal of solid waste that is solocated, designed, constructed and operated to contain and isolate the solid waste so that it does notpose a substantial present or potential hazard to human health or the environment.
"Scrap metal" means bits and pieces of metal parts such as bars, rods, wire, or metal pieces thatmay be combined together with bolts or soldering that are discarded material and can be recycled.For the purposes of this chapter, this definition includes the reclaimable metal parts of white goods.
"Site" means all land and structures, other appurtenances, and improvements on them used fortreating, storing, and disposing of solid waste. This term includes adjacent land within the facilityboundary used for the utility systems such as repair, storage, shipping or processing areas, or otherareas incident to the management of solid waste. (Note: This term includes all sites whether they areplanned and managed facilities or open dumps.)

Virginia Waste Management Board9 VAC 20-130-10 et seq. Regulations for Solid Waste Management Planning, Amendment 1Effective Date: August 1, 2001
5 of 18
"Sludge" means any solid, semisolid or liquid wastes with similar characteristics and effectsgenerated from a public, municipal, commercial or industrial waste water treatment plant, watersupply treatment plant, air pollution control facility, or any other waste producing facility.
"Solid waste" means any garbage, refuse, sludge and other discarded material, including solid,liquid, semisolid or contained gaseous material, resulting from industrial, commercial, mining andagricultural operations, or community activities but does not include (i) solid or dissolved material indomestic sewage, (ii) solid or dissolved material in irrigation return flows or in industrial dischargesthat are sources subject to a permit from the State Water Control Board, or (iii) source, specialnuclear, or byproduct material as defined by the Federal Atomic Energy Act of 1954, as amended.
"Solid waste management facility ('SWMF')" means a site used for planned treating, storing, ordisposing of solid waste. A facility may consist of several treatment, storage, or disposal units.
"Source reduction" means any action that reduces or eliminates the generation of waste at thesource, usually within a process. Source reduction measures include process modifications,feedstock substitutions, improvements in feedstock purity, improvements in housekeeping andmanagement practices, increases in the efficiency of machinery, and recycling within a process.
"Source separation" means separation of materials from the waste stream by the waste generator ofmaterials that are collected for use, reuse, or recycling.
"Special wastes" means solid wastes that are difficult to handle, require special precautionsbecause of hazardous properties or the nature of the waste creates waste management problems innormal operations.
"Supplemental recyclable material" means waste tires, used oil, used oil filters, used antifreeze,automobile bodies, construction waste, demolition waste, debris waste, batteries, ash, sludge or largediameter tree stumps, or material as may be authorized by the director.
"Transfer station" means any solid waste storage or collection facility at which solid waste istransferred from collection vehicles to haulage vehicles for transportation to a central solid wastemanagement facility for disposal, incineration or resource recovery.
"Trash" means combustible and noncombustible discarded materials and is used interchangeablywith the term rubbish.
"Used or reused material" means a material which is either:
1. Employed as an ingredient (including use as an intermediate) in a process to make a product,excepting those materials possessing distinct components that are recovered as separate endproducts; or
2. Employed in a particular function or application as an effective substitute for a commercialproduct or natural resources.

Virginia Waste Management Board9 VAC 20-130-10 et seq. Regulations for Solid Waste Management Planning, Amendment 1Effective Date: August 1, 2001
6 of 18
For purposes of these regulations, "used or reused material" means a given solid waste materialthat is separated from the waste stream and used, without processing or changing its form, for thesame or another end use.
"Vegetative waste" means decomposible materials generated by yard and lawn care or land-clearing activities and includes, but is not limited to, leaves, grass trimmings, and woody wastessuch as shrub and tree prunings, bark, limbs, roots, and stumps.
"Waste exchange" means any system to identify sources of wastes with potential for reuse,recycling or reclamation and to facilitate its acquisition by persons who reuse, recycle or reclaim it,with a provision for maintaining confidentiality of trade secrets.
"White goods" means any stoves, washers, hot water heaters or other large appliances. For thepurposes of this chapter, this definition also includes, but is not limited to, such Freon-containingappliances as refrigerators, freezers, air conditioners, and dehumidifiers.
"Yard waste" means decomposable waste materials generated by yard and lawn care and includesleaves, grass trimmings, brush, wood chips, and shrub and tree trimmings. Yard waste shall notinclude roots or stumps that exceed six inches in diameter.
9 VAC 20-130-20. Authority for regulations.
These regulations are promulgated pursuant to Chapter 14 (§ 10.1-1400 et seq. and specifically §§10.1-1402, 10.1-1411 and 10.1-1413.1) of Title 10.1 of the Code of Virginia, which authorizes theVirginia Waste Management Board to promulgate and enforce such regulations as may be necessaryto carry out its duties and powers and the intent of the Virginia Waste Management Act and thefederal acts.
9 VAC 20-130-30. Policy.
It is the policy of the Virginia Waste Management Board to require each region designatedpursuant to 9 VAC 20-130-180 through 9 VAC 20-130-220, as well as each city, county and townnot part of such a region, to develop comprehensive and integrated solid waste management plansthat, at a minimum, consider and address all components of the following hierarchy:
1. Source reduction;2. Reuse;3. Recycling;4. Resource recovery (waste-to-energy);5. Incineration; and6. Landfilling.
9 VAC 20-130-40. Purpose of regulations.
The purpose of these regulations is to:

Virginia Waste Management Board9 VAC 20-130-10 et seq. Regulations for Solid Waste Management Planning, Amendment 1Effective Date: August 1, 2001
7 of 18
1. Establish minimum solid waste management standards and planning requirements forprotection of the public health, public safety, the environment, and natural resources throughoutthe Commonwealth; promote local and regional planning that provides for environmentallysound and compatible solid waste management with the most effective and efficient use ofavailable resources;
2. Establish procedures and rules for designation of regional boundaries for solid wastemanagement plans;
3. Establish state, local government, regional or area served by the plan responsibility formeeting and maintaining the minimum recycling rates of 25%;
4. Establish the requirement in compliance with the Virginia Waste Management Act, §§ 10.1-1411 and 10.1-1408.1 D 1 (vi) of the Code of Virginia, for withholding issuance of permits forsolid waste management facility;
5. Provide for reasonable variance and exemptions; and
6. Provide for reporting and assessment of solid waste management in the Commonwealth inaccordance with the Virginia Waste Management Act, § 10.1-1413.1 of the Code of Virginia.
9 VAC 20-130-50. Administration of regulations.
The director is authorized and directed to administer and enforce these regulations in accordancewith the Virginia Waste Management Act, §§ 10.1-1400 through 10.1-1457 of the Code of Virginia.
9 VAC 20-130-60. Applicability of regulations.
A. This chapter applies to all cities, counties, towns, designated regions (under 9 VAC 20-130-180) and permitted solid waste facilities. Any county and town within that county may mutuallyagree to unite for the purpose of solid waste management planning, and upon joint writtennotification to the director, shall be deemed to be a single unit for development of a local solid wastemanagement plan.
B. Any cities, counties, and towns may be represented by a planning district, public serviceauthority, or designated region that has been adopted under 9 VAC 20-130-90 B.
C. The plan may (subject to statutory authority) specify that all solid waste must be recycled at therate established by the plan regardless of the point of origin of the solid waste. Solid wastes fromboth public and private sources shall be subject to such requirement.
9 VAC 20-130-70. Enforcement and appeal.
A. All administrative enforcement and appeals taken from actions of the director relative to theprovisions of this chapter shall be governed by the Virginia Administrative Process Act (§ 9-6.14:1
Virginia Waste Management Board9 VAC 20-130-10 et seq. Regulations for Solid Waste Management Planning, Amendment 1Effective Date: August 1, 2001
8 of 18
et seq. of the Code of Virginia). Enforcement of this chapter will be in accord with §§ 10.1-1186,10.1-1411 and 10.1-1455 of the Code of Virginia.
B. After July 1, 2000, no permit for a solid waste management facility shall be issued unless thelocal or regional applicant has a plan approved in accordance with this chapter and the permitcomplies with the statutory requirements of the Virginia Waste Management Act, §§ 10.4-1411 and10.1-1408.1 D 1 (iv) of the Code of Virginia.
9 VAC 20-130-80. (Repealed.)
9 VAC 20-130-90. Relationship to other bodies of regulation.
A. This chapter is a solid waste management regulation that specifies minimum standards andplanning requirements for solid waste management in the Commonwealth, including solid wastemanagement planning by regional or local governmental entities of the Commonwealth andassessment of solid waste management in the Commonwealth. If there is a mutually exclusiveconflict between this chapter and other adopted nonhazardous solid waste management regulationsof this agency, the provisions of this chapter are superior. In any detail where there exists nomutually exclusive conflict between this chapter and other regulations of the board, compliance withall regulations is required.
B. Multi-jurisdictional plans developed in fulfillment of the requirements of this chapter must beadopted under authority of the Regional Cooperation Act (Chapter 42 (§ 15.2-4200 et seq.) of Title15.2 of the Code of Virginia), the Virginia Water and Waste Authorities Act (Chapter 51 (§ 15.2-5100 et seq.) of Title 15.2 of The Code of Virginia), the provisions of the Code of Virginiagoverning joint exercise of powers by political subdivisions (§ 15.2-1300), or other authority asapplicable.
C. If there is a mutually exclusive conflict between this chapter and the Virginia Hazardous WasteManagement Regulations, the provisions of the hazardous waste regulations are superior. In anydetail where no such mutually exclusive conflict exists, compliance with all regulations is required.
9 VAC 20-130-100. (Reserved.)
9 VAC 20-130-110. Schedule for plan development.
A. Every city, county and town in the Commonwealth shall develop a solid waste managementplan or amend an existing solid waste management plan and submit it for approval in accordancewith this chapter. Existing plans may be amended by addendum of items such as consideration ofthe waste management hierarchy, the recycling program implementation activities and otherrequirements of this chapter that are not a part of the existing plan. A local jurisdiction participatingin an authorized regional solid waste management plan is not required to develop a separate plan.
B. A complete, revised solid waste management plan in compliance with this chapter shall beprovided to the department no later than July 1, 2004.
Virginia Waste Management Board9 VAC 20-130-10 et seq. Regulations for Solid Waste Management Planning, Amendment 1Effective Date: August 1, 2001
9 of 18
C. The department shall review and approve or return comments on the deficiencies in each plansubmitted in accordance with 9 VAC 20-130-110 A no later than 90 days from the date the plans arereceived. In the event the department is unable to complete its review within 90 days, the applicantwill be notified and given a date as to when the review will be completed.
D. Each submitter who receives comments on its solid waste management plan under subsection Cof this section shall submit a corrected solid waste management plan to the department no later than90 days following receipt of notification of deficiencies.
E. Plans approved without alteration shall become effective upon notification. If after review ofthe corrected plan submitted pursuant to subsection D of this section, the department cannot approvethe corrected solid waste management plan because it finds the plans not to be in accordance withthis chapter, it will issue a notice of intent to disapprove to the submitter. The notice of intent todisapprove shall set forth (i) the reason for the disapproval, (ii) what is required for approval, and(iii) the right of the submitter to an informational proceeding under Article 3 of the VirginiaAdministrative Process Act (§ 9-6.14:1 et seq. of the Code of Virginia). The department will givepriority consideration for review of corrected plans where the local or regional body has a pendingpermit application for a solid waste management facility.
F. The director may revoke the approval of any plan or require its revision and resubmittal if thereis evidence that there has been significant deviation from the plan. The department will issue anotice of intent to revoke or require revision and resubmittal of a plan. The notice of intent shall setforth (i) whether the department intends to revoke or require revision and resubmittal of the plan, (ii)the reason the department intends to take the action, and (iii) the right of the submitter of the plan toan informational proceeding under Article 3 of the Virginia Administrative Process Act (§ 9-6.14:1et seq. of the Code of Virginia).
9 VAC 20-130-120. Mandatory plan contents.
A. The solid waste management plan shall include:
1. An integrated waste management strategy;
2. A discussion as to how the plan will be implemented;
3. Objectives for solid waste management within the jurisdiction;
4. Definition of incremental stages of progress toward the objectives and schedule for theirimplementation;
5. Descriptions of the funding and resources necessary, including consideration of fees dedicatedto future facility development;
6. Strategy for the provision of necessary funds and resources;

Virginia Waste Management Board9 VAC 20-130-10 et seq. Regulations for Solid Waste Management Planning, Amendment 1Effective Date: August 1, 2001
10 of 18
7. Strategy for public education and information on source reduction, reuse, and recycling; and
8. Consideration of public and private sector partnerships and private sector participation inexecution of the plan. Existing private sector recycling operations should be incorporated in theplan and the expansion of such operations should be encouraged.
B. A minimum recycling rate of 25% of the total municipal solid waste generated annually in eachcity, county, town or region shall be maintained. The plan shall describe how this rate shall be metor exceeded.
C. Calculation methodology shall be included in the plan.
1. The plan shall describe the method of calculating the rate of recyclng. The following formulashall be used:
Rate = (Recycled/Total) X 100%
Where, "Recycled" equals the amount of principal recyclable material received during theprevious 12 months for recycling and "Total" is the amount of municipal solid waste generatedwithin the jurisdiction during the previous 12 months.
The amounts may be expressed in the following units:
a. The actual weight of each component.b. The volume of each component.c. The estimated weight of each component based on the most accurate survey or estimatedper capita weight.
2. The amount of supplemental recyclable material that is reused or recycled may be added intoboth the "Recycled" and "Total" amounts in each calculation method.
3. Any local government or regional solid waste management body that is participating in theused tire management program sponsored by the department may add the amount of those tiresto both the "Recycling" and "Total" amounts in the recycling rate calculation.
4. Any local government or regional solid waste management body may include mulched yardwaste in both the "Recycled" and "Total" amounts simultaneously for the required recycling ratecalculations if it can be demonstrated that the finished mulch will be marketed or otherwise usedproductively. In addition, any local government or regional solid waste management body mayinclude composted yard waste in both the "Recycled" and "Total" amounts simultaneously forthe required recycling rate calculations if it can be demonstrated that the finished compost willbe marketed or otherwise used productively.

Virginia Waste Management Board9 VAC 20-130-10 et seq. Regulations for Solid Waste Management Planning, Amendment 1Effective Date: August 1, 2001
11 of 18
5. Any local government or regional solid waste management body may include used oil, usedoil filters, and used antifreeze in the "Recycled" and "Total" amounts if it can be demonstratedthat the oil, used oil filters and used antifreeze will be marketed or used productively.
6. Where a source reduction of any municipal solid waste material or reuse of a principalrecyclable material is documented to have occurred, is accurately quantified and is requested as apetition for a variance in accordance with 9 VAC 20-130-230, the director may issue a credit forthe amount to be added into the "Recycled" and "Total" amounts in each calculation method.The credit may be for a part of the source reduction or reuse amount if the director finds that tobe more appropriate. The director shall grant such a credit only where an effective recyclingprogram is being implemented. The director shall not grant the credit if the minimum recyclingrate of 25% is being achieved.
7. These regulations shall permit a credit, to be added into the "Recycled" and "Total" amountsin each calculation method, of one ton for each ton of recycling residue generated in Virginiaand deposited in a landfill permitted under subsection M of § 10.1-1408.1 of the Code ofVirginia. The total annual credits shall not exceed one-fifth of the 25% required recycling rate.
D. All known solid waste disposal sites, closed, inactive and active, within the area of the solidwaste management plan shall be documented and recorded at a centralized archive authorized toreceive and record information and a copy shall be sent to the director. All new sites shall berecorded at the same central data source.
E. A methodology shall be utilized to monitor the amount of solid waste of each type producedwithin the area of the solid waste management plan and to record the annual production by solidwaste types at a centralized archive and a copy shall be sent to the director. Waste types include butare not limited to broad classes such as municipal solid waste, construction/demolition/debris,industrial, regulated medical waste, white goods, friable asbestos, petroleum contaminated soil andthe major categories of principle and supplemental recyclable materials.
9 VAC 20-130-130. Public participation.
A. Prior to submission of a solid waste management plan or a major amendment to the plan to thedepartment, the submitter shall publish a notice and hold a public hearing on the plan in accordancewith the procedures of the local government or regional planning agency. A record of the publichearing, a copy of all written comments and the submitter's response to all comments received shallbe submitted with the plan.
B. Plan developers shall, in accordance with their own rules and procedures, provide for extensiveparticipation by the public through the use of citizen advisory committees and public meetingsduring the development of the plan.

Virginia Waste Management Board9 VAC 20-130-10 et seq. Regulations for Solid Waste Management Planning, Amendment 1Effective Date: August 1, 2001
12 of 18
9 VAC 20-130-140. Plan objectives.
Every solid waste management plan shall be a fully integrated waste management plan thatconsiders all elements of waste management. The plan shall:
1. Include consideration of the hierarchy defined in 9 VAC 20-130-30 giving preference toalternatives in the following order of priority: source reduction, reuse, recycling, resourcerecovery, incineration, and landfilling;2. Clearly and explicitly demonstrate the manner in which the goals of the mandatory objectivesdefined in 9 VAC 20-130-120 shall be accomplished;
3. Include, when developed locally, a copy of the local governing body's resolution adopting theplan; and
4. Include, when developed regionally, a copy of the resolution approving the plan adopted inaccordance with the Virginia Area Development Act, the Virginia Water and Waste AuthoritiesAct, the provisions of the Code of Virginia governing joint exercise of powers by politicalsubdivisions § 15.2-1300 of the Code of Virginia, or other authority as applicable.
9 VAC 20-130-150. Incorporated data.
The local government or regional solid waste management plan shall include data and analyses ofthe following type for each jurisdiction. Each item below shall be in a separate section and labeledas to content:
1. Population information and projections for 20 years of population growth and developmentpatterns;
2. Urban concentrations, geographic conditions, economic growth and development, markets forthe reuse and recycling of materials, transportation conditions, and related factors;
3. Estimates of solid waste generation from households, commercial institutions, industries andother types of sources, including the amounts reused, recycled, recovered as a resource,incinerated and landfilled. Estimates should identify special waste to include, at least, thefollowing: stumps, land-clearing debris and construction wastes, motor vehicle tires, waste oil,batteries, sludges, mining wastes, septage, agricultural wastes and spill residues;
4. A listing of existing and planned solid waste collection, storage, treatment, transportation,disposal and other management facilities, their projected capacities, expected life and systemsfor their use;
5. All milestones in the implementation of the solid waste management plan over the 20-yearprojection and the parties responsible for each milestone;

Virginia Waste Management Board9 VAC 20-130-10 et seq. Regulations for Solid Waste Management Planning, Amendment 1Effective Date: August 1, 2001
13 of 18
6. A description of programs for solid waste reduction, reuse, recycling, resource recovery,incineration, storage, treatment, disposal and litter control;
7. A description of outreach programs for waste exchange, public education and publicparticipation;
8. The procedures for and results of evaluating solid waste collection, including transfer stations;and
9. The assessment of all current and predicted needs for solid waste management for a period of20 years and a description of the action to be taken to meet those needs.
9 VAC 20-130-160. (Repealed.)
9 VAC 20-130-165. Waste information and assessment program.
A. The owners or operators of all permitted facilities that treat, store, or dispose of solid wasteshall report by March 31 of each year the amount of solid waste, by weight or volume, received andmanaged in the Commonwealth during the preceding calendar year. The report shall identify solidwaste by the following categories: (i) municipal solid waste; (ii) construction and demolition debris;(iii) industrial waste; (iv) regulated medical waste; (v) vegetative and yard waste; (vi) incineratorash; (vii) sludge other than sludge that is land applied in accordance with § 32.1-164.5 of the Codeof Virginia; (viii) tires; (ix) white goods; (x) friable asbestos; (xi) petroleum contaminated soil; and(xii) other special waste. For each such category the report shall include an estimate of the amountthat was generated outside of the Commonwealth and the jurisdictions where such waste originated.
The report shall also estimate the amount of solid waste managed or disposed of by each of thefollowing methods: (i) recycling; (ii) composting; (iii) landfilling; (iv) incineration (v) sending offsite for further management; and (vi) stored on site on December 31 of the reporting year. Thissection shall not apply to captive waste management facilities. The report is to be sent to thedepartment regional office for the facility's location.
Information on the available capacity and expected life of the facilities at the disposal ratessubmitted in this subsection shall be included in the annual report required by this section.
B. At the option of the facility owner, the data collected may include an accounting of the facility'seconomic benefits to the locality where the facility is located including the value of disposal andrecycling facilities provided to the locality at no cost or reduced cost, direct employment associatedwith the facility, and other economic benefits resulting from the facility during the preceding calendaryear.
C. No facility shall be required pursuant to this section to provide information that is a trade secret asdefined in § 59.1-336 of the Code of Virginia.

Virginia Waste Management Board9 VAC 20-130-10 et seq. Regulations for Solid Waste Management Planning, Amendment 1Effective Date: August 1, 2001
14 of 18
D. Every city, county and town in the Commonwealth, or solid waste management planning regionapproved pursuant to 9 VAC 20-130-180, shall submit to the department by April 30 of each year, thedata and calculations required in 9 VAC 20-130-120 B and C.
9 VAC 20-130-170. (Repealed.)
9 VAC 20-130-175. Amendments to plans.
A. Amendments to the plans shall be classified as major or minor. These classifications aredescribed in this section below.
1. Major amendments shall include any addition, deletion, or cessation of operation of any solidwaste facility; any increase in landfill capacity; any change that moves toward implementation ofa waste management strategy that is lower in the waste management hierarchy; and any changeto membership in the approved area.
2. Minor amendments shall include any change that moves toward implementation of a wastemanagement strategy that is higher in the waste management hierarchy and any nonsubstantiveadministrative change such as a change in name.
B. Any amendments to the plans shall be approved by the department prior to implementation.
C. Major amendments shall require the same public participation as detailed in 9 VAC 20-130-130before being submitted to the department for approval.
D. Minor amendments shall be submitted directly to the department for approval.
E. The department shall review amendments and approve or return comments on the deficienciesin each amendment submitted in accordance with this section no later than 90 days from the date theplans are received. In the event the department is unable to complete its review within 90 days, theapplicant will be notified and given a date as to when the review will be completed.
F. Each submitter who receives comments on his solid waste management plan under subsection Eof this section shall submit a corrected amendment to the department no later than 90 days followingnotification of deficiencies.
G. Amendments approved without alteration shall become effective upon notification. If afterreview of the corrected amendment submitted pursuant to subsection F of this section, thedepartment cannot approve the corrected amendment because it finds the amendment not to be inaccordance with this chapter, it will issue a notice of intent to disapprove to the submitter. Thenotice of intent to disapprove shall set forth (i) the reason for the disapproval, (ii) what is requiredfor approval, and (iii) the right of the submitter to an informational proceeding under Article 3 of theVirginia Administrative Process Act (§ 9-6.14:1 et seq. of the Code of Virginia). The departmentwill give priority consideration for review of corrected amendments when the local or regional bodyhas a pending permit application for a solid waste management facility.

Virginia Waste Management Board9 VAC 20-130-10 et seq. Regulations for Solid Waste Management Planning, Amendment 1Effective Date: August 1, 2001
15 of 18
9 VAC 20-130-180. Designation of regions.
The director has been authorized by the Governor to designate regional boundaries defining areasand jurisdictions to be considered for joint development of solid waste management plans. Onlythose regions meeting the standards established in this chapter will be considered. Any group ofjurisdictions may petition the director for designation as a region, and, if the proposed region meetsthe standards established for designation, the director shall approve the request.
9 VAC 20-130-190. Development of designated regions.
A. At least 14 days prior to designating a regional boundary for solid waste management planning,the director shall place a notice of the proposed regional boundary and an opportunity to comment inthe Virginia Register of Regulations and in a newspaper of general circulation within the proposedregion.
B. If, as a result of the notices required by subsection A of this section, the director feels asignificant need exists to hold a public hearing on the issues, a public hearing shall be held in theproposed region prior to the designation. At least 14 days prior to the public hearing, a notice of theproposed public hearing shall appear in the same publications as the notice under subsection A ofthis section.
9 VAC 20-130-200. Considerations in designating a regional boundary.
A. The following shall be considered in designating regional boundaries:
1. Geographic areas or jurisdictions which have a history of cooperating to solve problemsin environmental or other related matters;
2. Existing regional management systems, authorities or similar institutions;
3. The size, configuration and location of the regional areas should have sufficient solidwaste contribution and market availability to support the solid waste management system;
4. Solid waste types within areas and mutuality of solid waste management interests;
5. Geologic, hydrologic, soil and groundwater conditions; availability of land and soils; andnatural barriers and ecosystems; and
6. Existing planning areas established for purposes other than solid waste managementincluding the existence of informational databases containing data related to that needed forsolid waste management planning.
B. Areas included within a planning boundary may be local or regional.

Virginia Waste Management Board9 VAC 20-130-10 et seq. Regulations for Solid Waste Management Planning, Amendment 1Effective Date: August 1, 2001
16 of 18
1. A local area may include a city, town or county and any towns within the county thatthrough mutual agreement join with the county for the purpose of developing a plan.
2. A regional area may include:
a. The jurisdictions with existing regional planning district boundaries;
b. Any combination of local governments formally joined to form a region orservice authority, or
c. Existing waste management or public service authorities.
9 VAC 20-130-210. Criteria for designating a regional planning agency.
A. The director may authorize an official committee or public body as authorized to develop, adoptand promulgate the solid waste management plan.
B. Prospective regional planning agencies shall have:
1. Demonstrated ability to plan, manage or operate solid waste management services; or
2. Completed planning that resulted in successful implementation of solid wastemanagement facilities or services.
C. An entity designated as responsible for developing a regional solid waste management planshall:
1. Be an organization that represents the executive boards of jurisdictions within the region;
2. Have planning authority for the regional area;
3. Be capable of readily starting the plan development work tasks;
4. Have an established methodology for resolving conflicts, making planning decisions andproviding public participation in the development of the plan;
5. Have experience in environmental planning and have a staff experienced in the worktasks involved in such planning;
6. Have established a methodology and authority sufficient to implement the plan once it iscomplete and approved; and
7. Have access to informational resources within the region.

Virginia Waste Management Board9 VAC 20-130-10 et seq. Regulations for Solid Waste Management Planning, Amendment 1Effective Date: August 1, 2001
17 of 18
9 VAC 20-130-220. Amendment of regional boundary.
The director may amend a regional boundary based on an application from the governing body orbodies of the region. Along with the application, each locality (within the original region and anylocality being added) must submit a letter acknowledging the change in the boundary.
9 VAC 20-130-230. Petitioning for variance or exemption.
A. Any person regulated by this chapter may petition the director to grant a variance or anexemption from any requirement of this chapter subject to the provisions of this section. Anypetition submitted to the director is also subject to Article 3 of the Virginia Administrative ProcessAct (§ 9-6.14:1 et seq. of the Code of Virginia).
B. The petition shall be submitted to the director by certified mail and shall include:
1. The petitioner's name and address;
2. A statement of petitioner's interest in the proposed action;
3. A description of desired action and a citation of the regulation from which a variance isrequested;
4. A description of need and justification for the proposed action, including impacts fromexisting operations and market conditions (if, based on the evidence submitted in a petition,the director determines that market conditions within a county, city, town or region makeunreasonable the mandatory recycling rates specified in this chapter and that the marketconditions are beyond the control of the county, city, town or region, a variance from thoserates may be issued);
5. The duration of the variance, if applicable;
6. The potential impact of the variance on public health or the environment;
7. Other information believed by the applicant to be pertinent; and
8. The following statement signed by the petitioner or authorized representative:"I certify that I have personally examined and am familiar with the information submittedin this petition and all attached documents, and that, based on my inquiry of thoseindividuals immediately responsible for obtaining the information, I believe that thesubmitted information is true, accurate, and complete. I am aware that there are significantpenalties for submitting false information, including the possibility of fine andimprisonment."

Virginia Waste Management Board9 VAC 20-130-10 et seq. Regulations for Solid Waste Management Planning, Amendment 1Effective Date: August 1, 2001
18 of 18
9 VAC 20-130-240. (Repealed.)
FORMS
Form DEQ 50-25, Solid Waste Information and Assessment Program – Reporting Table (rev. 6/00).
Form DEQ 50-30, Locality Recycling Rate Report (rev. 4/01).

COMPREHENSIVE SOLID WASTE
MANAGEMENT PLAN
2004 UPDATE - REVISED
City of Danville, Public Works Department 1990 Comprehensive Solid Waste Management Plan – 2004 UPDATE REVISED
Appendix D MARKETING

City of Danville, Public Works Department 1990 Comprehensive Solid Waste Management Plan – 2004 REVISED
2004 Recyclable Materials Markets Assessment Current Market Conditions 2004 The markets for potentially recyclable materials, such as old newspapers,
corrugated containers, metals, and arboreal materials, in the Danville solid waste
stream for are relatively stable at the present time. The Danville area is served
by a number of local and regional scrap dealers which should ensure a relatively
healthy market, ferrous metals. Local waste collection firm accepts old
corrugated containers, and ONP grades of paper. Lack of a mixed waste paper
dealer in Danville, however, does limit recycling opportunities in this area . Glass
and plastics offer a particular challenge due to the lack of a nearly market.
In order for Danville waste generators to access existing and future markets for
ONP and other recyclables, materials which are collected in recycling programs
must be processed according to specifications of the market for that material. In
effect, the buyer of the materials is the customer, the collected and prepared
materials are products to be promoted, and the waste generator is the sales
agent competing with all other programs attempting to access the same market.
If materials collection, handling, processing, and storage are viewed from this
perspective, rather than the traditional perspective of managing waste for
disposal, recyclables processing and manufacturing enterprises will grow to
regard Danville generators as preferred suppliers of secondary materials. The
following should be considered when marketing all materials collected for
recycling:
1. Recyclables end-users require a constant flow of materials in the quantity
that meets their process demands.
2. End-users have high quality requirements to assure that contaminants will
not interfere with manufacturing process and/or final product integrity.
APPENDIX D

City of Danville, Public Works Department 1990 Comprehensive Solid Waste Management Plan – 2004 REVISED
3. End-users have differing transportation and handling specifications to
match their specific materials handling capabilities. The following
specifications determine whether a buyer will take materials, and how
much they are willing to pay:
a. Physical dimensions
b. Densities
c. Container and bale tying requirements
d. Point of delivery (Danville docks or theirs)
Danville can anticipate stabilizing existing markets for materials, and
enabling the entrance into new markets, provided they can demonstrate
consistent adherence to requirements of the materials users. Failure to
meet requirements can result in rejection of a load, reduced prices on
subsequent loads, or in some instances refusal to do any further business
with the supplier. In nearly all recycling programs and for most materials,
finding and maintaining markets for the materials is the limiting factor. To
hedge Danville’s standing in the secondary materials marketplace, all
materials handling, and processing systems should be designed in order to
meet the most stringent specifications, and yet be flexible enough to meet
requirements of multiple markets and changing conditions over time.
Recyclable material prices vary widely. A summary of research findings
for recyclable materials follows which describes prices, conditions of the
markets, and transportation requirements. Changes in any one of these
three categories may impact the other two. Recyclable materials markets
may pay for goods, take materials without payment or may charge to haul
the materials away.

City of Danville, Public Works Department 1990 Comprehensive Solid Waste Management Plan – 2004 REVISED
(A) Paper
Over 45 different grades of waste paper are bought and sold in the United
States. Regarding post-consumer sources, three general grade categories are
particularly important:
Low grade: Newspaper
Corrugated containers
High grade: White ledger
Computer paper
Mixed: Many types of paper have a very low resale value
According to the Virginia Department of Waste Management, paper markets as a
whole are growing while markets for some types of paper, such as old
newspaper (ONP) are depressed. In general, while market outlets for most
paper grades remain constant, the prices paid for secondary paper products
fluctuate and are dependent upon world economies, and the rise and fall of
supply and demand.
The American Paper Institute estimates that 20.877 million tons of waste paper
were used by domestic mills in 1989 with a growth of 20% over the next three
years. As de-inking facilities continue to come on line during the next year, ONP
capacity will increase by approximately 400,000 tons/year. Mill capacity should
jump 19% by 1992, and increase of 633,000 tons/year. ONP is the main grade
of waste paper collected from residences. ONP can be recycled into newsprint,
insulation, packing and building materials or shredded for animal bedding.
Old corrugated containers (OCC) are presently recycled, nationally, at a rate of
approximately 50 percent. Increases in collection could bring the total to 60
percent by 1995. As the largest source of waste paper collected for recycling,
OCC will grow 2.32 million tons/year by 1992, up 22.1% from 1989 levels.

City of Danville, Public Works Department 1990 Comprehensive Solid Waste Management Plan – 2004 REVISED
Recycled mixed paper demand in the United States has decreased 18 percent in
the last 10 years. A major stumbling block is the widespread use of laser
printers which makes the de-inking process more difficult.
The Commonwealth of Virginia is presently in an over-supply situation for paper.
As technology catches up with supply, demand will increase and push prices and
market availability higher. In all cases, the long-term markets for each type of
paper will depend upon the price of using virgin materials and demand for
recycled paper products.
Due to currently low prices, transportation costs may result in a net loss of
revenue for mixed and old newspaper. However, funds from other types of
paper and savings resulting from avoided disposal costs may offset the losses.
PAPER MARKETS
Dealers Materials handled
FCR Corporation..............................OCC, newsprint, mixed paper Greensboro, NC
First Piedmont Corp.........................Newsprint, OCC Chatham, VA
(B) Plastics
All plastics are either thermosets or thermoplastics. Thermosets comprise
approximately 13 percent of U.S. plastics sales. They cannot be remelted and
are unlikely to be recyclable into a product of the same type. Thermoplastics can
be remelted and remolded into new plastic products. Resin types most prevalent
in the waste stream and some of their typical uses are:
Polyethylene teraphthalate (PET): Soft drink and liquor bottles, fiber fill,
industrial strapping
High density polyethylene (HDPE): Milk jugs, detergent bottles, motor oil
containers

City of Danville, Public Works Department 1990 Comprehensive Solid Waste Management Plan – 2004 REVISED
Low density polyethylene (LDPE): Film products such as grocery and trash
bags
Polypropylene (PP): Battery cases, furniture, conduit
Polystyrene (PS): Styrofoam, prescription bottles, clear
food trays
Polyvinyl chloride (PVC): Pipe, conduit, gutters, siding, flooring
Three types of post-consumer scrap plastics have the most well-developed
market potential: PET and HDPE containers and, with growing potential, LDPE
film. A variety of pre-consumer scrap plastics (scrap generated in-plant by
plastic product manufacturers) has strong market potential when source-
separated and kept free of contamination. As reliable supplies of reclaimed
plastic become available due to increased collection activities, increasing
numbers of plastic product manufacturers will seek scrap plastics to feed their
industrial processes. Markets for polyethylene scrap have been growing, in part
due to a shortage of ethylene monomers, the raw material source of
polyethylene.
The market for goods which can be produced from recycled plastic is growing;
however, products manufactured from batches of single polymers require pure
ingredients. Landscaping materials, “plastic lumber” and other products can be
produced from mixed plastic resins.
PLASTIC MARKETS
Dealers Materials handled
FCR Corp........................................Mixed plastics Greensboro, NC
(C) Container Glass
Although container glass faces competition from aluminum and plastic
containers, environmental and recycling concerns have helped glass retain its

City of Danville, Public Works Department 1990 Comprehensive Solid Waste Management Plan – 2004 REVISED
share of the market. The U.S. Department of Commerce reported that product
shipments of glass containers rose 1.3 percent in 1989 with additional growth
predicted over the next five years.
In the Danville market region, glass must be separated by color: amer, green,
and flint. Flint, or clear glass, brings the highest price of the three. Labels, lids
and caps usually can be left on the glass containers; however, as many
contaminants as possible should be removed. Crushing the glass before
shipment will increase the amount per trailer which can be loaded; however, the
cost of the crushing equipment must be factored into the economic equation.
Both the demand and prices paid for processed cullet (clean, crushed glass) are
strong due to the fact that domestic plants are able to use over 40% of recycled
glass in each batch of feedstock used to make new glass containers.
Glass must be sorted by color because most containers are made of clear glass,
for product appeal. Products which degrade in sunlight are packaged in brown
or green glass. Strict separation in the recycling collection process aids in
keeping glass color variance to a minimum. Changes in specifications in the
future may change the sorting requirements. There is also an increasing market
for mixed glass with application as an aggregate in construction and road paving
materials.
GLASS MARKETS
Dealer Material
FCR Corporation..............................Mixed Glass Greensboro, NC

City of Danville, Public Works Department 1990 Comprehensive Solid Waste Management Plan – 2004 REVISED
(D) Metals
Metals, including steel, iron and aluminum comprise about 8.7% of the nation’s
waste stream.
Scrap metal processing is complex and requires specialized equipment. Due to
different processing requirements, many handlers specialize in specific types of
metal, versus handling all grades. Metal is sorted for recycling into the following
grades: ferrous scrap (steel, tin, iron or iron-containing metal); non-ferrous scrap
(aluminum, brass, and copper) and white goods (enameled metal appliances.
Non-ferrous scrap has relatively high market value and is in steady demand. For
this reason, such material scrap generated by business and industry rarely enters
the waste stream destined for disposal.
• Steel Steel is recycled at a rate of 66 percent according to he Steel Can
Recycling Institute. Oxygen furnaces use 20-30 % scrap content per
“heat”, while electric arc furnaces can use up to 100% recycled steel
scrap. New steel production techniques reduced the industry’s per ton
energy consumption by 34% in the past 18 years.
Tin-plated steel cans and bimetal beverage cans were recycled at a rate of
21.6% in 1989. Most food containers (including #10 cans) are made of
tin-plated steel. Carbonated beverage containers are made with steel
bodies and aluminum tops.
• Aluminum
Reynolds Aluminum estimates that 22 million pounds of aluminum were
recycled in Virginia last year. Aluminum can be recycled repeatedly and
the process has been in existence since 1904. The demand for this
product will continue to be stable for the foreseeable future with prices

City of Danville, Public Works Department 1990 Comprehensive Solid Waste Management Plan – 2004 REVISED
generally high relative to other recyclable materials but fluctuating with
changes in the economy.
• White Goods
Used household appliances (white goods) contain motors and capacitors
which must be removed in most instances prior to their sale. For
environmental reason, removal of freon is also required. Some buyers will
purchase the motors separately, but most require that capacitors be
removed before arrival on their premises.
METAL MARKETS
Dealer Material
FCR Corporation.............................. Steel cans, bi-metal cans, Greensboro, NC aluminum cans. Hayes Iron & Metal ......................... All types of metal Providence, NC 336-388-5986 Goodwill Industries of Danville ......... Aluminum cans Martinsville Iron & Metals ................ Steel, copper, aluminum cans, 1331 Virginia Avenue stainless, aluminum, bimetal, Martinsville, VA 24112 appliances, steel food cans. 276-632-9781 Don’s Auto Recycling....................... Appliances (no motors, black 737 Ferry Road boxes or freon), car parts Danville, VA 24541 (starters, alternators), radiators, 434-799-6333 aluminum, irony, aluminum cans, copper, brass, steel
(E) Compost
The issue for evaluating the market for compost is not finding markets willing to
pay the best price for materials, but rather, finding users for the materials
produced. Compost and wood mulch are considered more and more valuable as

City of Danville, Public Works Department 1990 Comprehensive Solid Waste Management Plan – 2004 REVISED
soil conditioners and landscaping cover. They typically do not serve as a
replacement for fertilizer due to low nutrient values. As an additive to soils or as
a dressing, compost improves the following characteristics types of soil:
• Water retention capacity • Drainage capacity • Aggregate formation • Aeration
Soil properties are improved the most in regions of the country with soil
properties extremely different from compost. The Piedmont region, with its
sandy-clay to clay soils stands to benefit considerably by the loamy texture and
organic content of compost. In addition to its use as a soil conditioner, compost
is suitable as a replacement for potting soil mixes and peat moss in the nursery
and landscaping industry.
The major requirements for marketing compost are to identify potential users
and educate them as to the benefits and qualities of compost. Promotion of
backyard composting is an effective means of allowing the public a hands-on
experience with the process and the product. Assurances of non-pathogenicity
will be an important part, particularly where sludge containing products are
concerned.
Researchers at Virginia Polytechnic Institute and State University who sent
surveys to nursery operators across the state indicate that there is considerable
interest in compost as a substitute to currently utilized soil additives, and that a
substantial market exists for such materials. The survey results were, however,
anonymously reported, and no information exists on those parties which might
be interested in compost. Listed in Table D-2 are other potential compost user
groups and common applications.

City of Danville, Public Works Department 1990 Comprehensive Solid Waste Management Plan – 2004 REVISED
TABLE D-1
Major Compost User Groups and Applications
Private Residential
• Garden applications for food • Non-food garden and yard applications
Private Food
• Field crops for food and feed • Garden crops for food and feed
• Fruit trees • Vineyards
Private Non-food
• Greenhouses • Nurseries • Golf courses • Landscape contractors
• Turfgrass producers • Industrial park grounds • Cemeteries • Fertilizer and topsoil producers
Public Agencies
• Public parks • Playgrounds • Military and prison installations
• Public grounds • Roadside landscape and medians
Land Reclamation
• Landfill cover • Strip min land reclamation • Sand and gravel pit restoration

COMPREHENSIVE SOLID WASTE
MANAGEMENT PLAN
2004 UPDATE - REVISED
City of Danville, Public Works Department 1990 Comprehensive Solid Waste Management Plan – 2004 UPDATE REVISED
Appendix E CURRENT BUDGET


COMPREHENSIVE SOLID WASTE
MANAGEMENT PLAN
2004 UPDATE - REVISED
City of Danville, Public Works Department 1990 Comprehensive Solid Waste Management Plan – 2004 UPDATE REVISED
Appendix F 1997 PLAN UPDATE


COMPREHENSIVE SOLID WASTE
MANAGEMENT PLAN
2004 UPDATE - REVISED
City of Danville, Public Works Department 1990 Comprehensive Solid Waste Management Plan – 2004 UPDATE REVISED
Appendix G METHOD OF TRACKING WASTE GENERATION

City of Danville, Public Works Department 1990 Comprehensive Solid Waste Management Plan 2004 UPDATE – REVISED
METHOD OF TRACKING WASTE GENERATED WITHIN THE CITY LIMITS OF DANVILLE
Solid Waste Regulations require that a methodology shall be utilized to monitor
the amount of solid waste of each type produced within the area of the solid
waste management plan and to record the annual production by solid waste
types at a centralized archive and a copy shall be sent to the director. Waste
types include but are not limited to broad classes such as municipal solid waste,
construction/demolition/debris, industrial, regulated medical waste, white goods,
friable asbestos, petroleum contaminated soil and the major categories of
principle and supplemental recyclable materials.
As required in the regulations and upon acceptance of the Solid Waste
Management Plan revision, the City of Danville will follow these procedures to
track waste generation:
WASTE GENERATION QUANTITY
1. All waste disposal facilities used by waste generators in the plan area will
be polled to report the amount of waste which is being generated from City
sources. These facilities include:
A. First Piedmont Corporation Transfer Station
B. First Piedmont Construction / Demolition Landfill and Paper Recycling.
C. Waste Management Transfer Station in Danville
D. City of Danville Compost Facility
E. Scrap metal:
1. Don’s Recycling
2. Hayes Iron and Metal
F. Wastewater Treatment:
1. American Water Systems - Land Applied Sludge.
2. The reported tonnages will be placed into a source category as required in
the Solid Waste Regulation listed above.
APPENDIX G

City of Danville, Public Works Department 1990 Comprehensive Solid Waste Management Plan 2004 UPDATE – REVISED
RECYCLING QUANTITIES
1. Major Industries, businesses, and facilities in the plan area will then be
polled to report all recycling/reuse products in the reporting year.
2. The report will include primary recyclables and supplemental recyclables
(A sample form is included).
TIME TABLE
A schedule for implementation of the waste tracking is as follows:
December 2004 • Final acceptance by DEQ of Solid Waste Plan.
• Meet with businesses, industries, and recyclers to
explain form and due dates.
August 2005 • Mail out reporting forms.
* Report forms due January 2006.
January 2006 • Collect 2005 reporting forms and tabulate responses.
February 2006 • Compile 2005 Report and submit to DEQ.
* Submit annually thereafter.
CENTRALIZED ARCHIVE
All information resulting from monitoring the amount of solid waste generated
within the Solid Waste Plan area will be archived at the Public Works
Department, located at 998 South Boston Road. All information will be submitted
to DEQ based on the above schedule.

City of Danville, Public Works Department 1990 Comprehensive Solid Waste Management Plan 2004 UPDATE – REVISED
CITY OF DANVILLE
Primary & Supplemental Recyclables Tracking Report for Calendar Year 2005
Business Name: Date:
Address: Phone No.:
Part I: Principal Recyclable Material (PRM)
PRM TYPE RECYCLED AMOUNT (TONS)
Paper Metal Plastic Glass Commingled Yard Waste (composted or mulched) Waste Wood (chipped or mulched) Textiles TOTAL PRM (P)
Part II: Supplemental Recyclable Material (SRM)
SRM TYPE RECYCLED AMOUNT (TONS)
Waste Tires Used Oil Used Oil Filters Abandoned automobiles removed Batteries Sludge (composted) Electronics Tree Stumps (> 6” Diameter) Other SUBTOTAL (Recycled SRM)
SRM TYPE REUSED* AMOUNT (TONS)
Construction Waste Demolition Waste Debris Waste Ash Other SUBTOTAL (Reused SRM)
TOTAL SRM (S)
* Material separated from the waste stream and used, without processing or changing its form, for the same or another end use.

City of Danville, Public Works Department 1990 Comprehensive Solid Waste Management Plan 2004 UPDATE – REVISED
CITY OF DANVILLE
OTHER MATERIALS OPTIONAL: Use this page to report and summarize information for the “Other” categories on Page 1 of this form. SRMs, “Other” material: Material Tons Recycled TOTAL SRMs Recycled (to “Other” entry, Page 1) SRMs, “Other” material: Material Tons Reused TOTAL SRMs Reused (to “Other” entry, Page 1)

City of Danville, Public Works Department 1990 Comprehensive Solid Waste Management Plan 2004 UPDATE – REVISED
Conversion Table For General Guidance Only
Material Volume Weight in Pounds Metal Aluminum Cans, Whole One cubic yard 50-74 Aluminum Cans, Flattened One cubic yard 250 Aluminum Cans One full grocery bag 1.5 Ferrous Cans, Whole One cubic yard 150 Ferrous Cans, Flattened One cubic yard 850 Automobile Bodies One vehicle 2,000 Paper Newsprint, Compacted One cubic yard 720-1,000 Newsprint 12” stack 35 Corrugated Cardboard, Loose One cubic yard 300 Corrugated Cardboard, Baled One cubic yard 1,000-2,000 Plastic PETE, Whole, Loose One cubic yard 30-40 PETE, Whole, Loose Gaylord 40-53 PETE, Whole, Baled 30” x 62” 500 Film, Baled 30” x 42” x 48” 1,100 Film, Baled Semi-Load 44,000 Film, Loose Standard grocery bag 15 HDPE (Dairy Only), Whole, Loose One cubic yard 24 HDPE (Dairy Only), Baled 32” x 60” 400-500 HDPE (Mixed), Baled 32” x 60” 900 Mixed PET & Dairy, Whole, Loose One cubic yard 32 Mixed PET, Dairy & Other Rigid (Whole, Loose) One cubic yard 38 Mixed Rigid, No Film One cubic yard 49 Glass Glass, Whole Bottles One cubic yard 600-1,000 Glass, Semi-Crushed One cubic yard 1,000-1,800 Glass, Crushed (Mechanically) One cubic yard 800-2,700 Glass, Whole Bottles One full grocery bag 16 Glass, Uncrushed to Manually Broken 55 gallon drum 125-500 Arboreal Leaves, Uncompacted One cubic yard 250-500 Leaves, Compacted One cubic yard 320-450 Leaves, Vacuumed One cubic yard 350 Wood Chips One cubic yard 500 Grass Clippings One cubic yard 400-1,500 Other Battery (Heavy Equipment) One 60 Battery (Auto) One 35.9 Used Motor Oil One gallon 7.4 Used Oil Filters (Uncrushed) 55 gallon drum 66 lbs./Used Oil +
110 lbs./Ferrous Metal Used Oil Filters (Crushed) 55 gallon drum 16.5 lbs./Used Oil+
368 lbs./Ferrous Metal Tire – Passenger Car One 20 Tire – Truck, Light One 35 Tire – Semi One 105 Antifreeze One gallon 8.42 Food Waste, Solid & Liquid Fats 55 gallon drum 412

COMPREHENSIVE SOLID WASTE
MANAGEMENT PLAN
2004 UPDATE - REVISED
City of Danville, Public Works Department 1990 Comprehensive Solid Waste Management Plan – 2004 UPDATE REVISED
Appendix H DANVILLE TRANSFER STATION AGREEMENT