RIVANNA SOLID WASTE AUTHORITY COMPREHENSIVE ANNUAL ... · November 11, 2015 To the Board of...
86
RIVANNA SOLID WASTE AUTHORITY COMPREHENSIVE ANNUAL FINANCIAL REPORT YEARS ENDED JUNE 30, 2015 AND 2014 SERVING CHARLOTTESVILLE & ALBEMARLE COUNTY, VIRGINIA
Transcript of RIVANNA SOLID WASTE AUTHORITY COMPREHENSIVE ANNUAL ... · November 11, 2015 To the Board of...
RIVANNA SOLID WASTE AUTHORITY
COMPREHENSIVE ANNUAL FINANCIAL REPORT
YEARS ENDED
JUNE 30, 2015 AND 2014
SERVING
CHARLOTTESVILLE & ALBEMARLE COUNTY, VIRGINIA


RIVANNA SOLID WASTE AUTHORITY
CHARLOTTESVILLE, VIRGINIA
COMPREHENSIVE ANNUAL FINANCIAL REPORT YEARS ENDED JUNE 30, 2015 AND 2014
Prepared By:
Department of Finance and Administration

RIVANNA SOLID WASTE AUTHORITY
Comprehensive Annual Financial Report Fiscal Years Ended June 30, 2015 and 2014
Table of Contents
Page
INTRODUCTORY SECTION
Authority Officials 1 Letter of Transmittal 3-5 Certificate of Achievement 7 Organizational Chart 9
FINANCIAL SECTION
Independent Auditors’ Report 11-12 Management’s Discussion and Analysis 13-19
Basic Financial Statements
Exhibit 1 Statement of Net Position 22-23 Exhibit 2 Statement of Revenues, Expenses, and Changes in Net Position 24 Exhibit 3 Statement of Cash Flows 25
Notes to Financial Statements 27-57
Required Supplementary Information
Schedule of Components of and Changes in Net Position Liability and Related Ratios 61
Schedule of Employer Contributions 62
Notes to Required Supplementary Information 63
Schedule of OPEB Funding Progress 64
STATISTICAL SECTION
Table 1 Net Position by Component 67 Table 2 Changes in Net Position 68 Table 3 Annual Tonnages of Selected Categories of Waste Received 69 Table 4 Waste Tonnages Diverted for Reuse or Recycling 70 Table 5 Tipping Fees Per Ton By Waste Category 71 Table 6 Top Ten Customers 72 Table 7 Outstanding Debt by Type 73 Table 8 Demographic Data for the Service Area 74 Table 9 Principal Employers in the Charlottesville Area 75 Table 10 Number of Positions by Activity 76 Table 11 Operating and Capital Indicators 77 Table 12 Schedule of Insurance in Force 78
COMPLIANCE SECTION
Independent Auditors’ Report on Internal Control over Financial Reporting and on Compliance and Other Matters Based on an Audit of Financial Statements Performed in Accordance with Government Auditing Standards 79-80

BOARD MEMBERS
Michael A. Gaffney, Chairman
Thomas Foley, Vice-Chairman
Maurice Jones, Secretary/Treasurer
Judith M. Mueller
Mark B. Graham, P.E.
Kathleen Galvin
Kenneth C. Boyd
EXECUTIVE DIRECTOR
Thomas L. Frederick, Jr., P.E.
DIRECTOR OF FINANCE/ADMINISTRATION
Lonzy E. Wood, III, CPA
GENERAL COUNSEL
McGuire Woods, LLP Charlottesville, Virginia
1

November 11, 2015 To the Board of Directors Rivanna Solid Waste Authority Charlottesville, Virginia The Comprehensive Annual Financial Report (CAFR) of the Rivanna Solid Waste Authority (Authority) for the fiscal year end June 30, 2015 is submitted herewith. This report has been prepared in conformity with the reporting and accounting standards promulgated by the Government Accounting Standards Board, the Financial Accounting Standards Board, and with the accounting and reporting standards for enterprise funds set out by the Government Finance Officers Association of the United States and Canada, with such modifications as apply to our status as an independently chartered corporation. Based upon a comprehensive framework of internal control that it has established for this purpose, management assumes responsibility for the completeness and reliability of the information contained in this report. The objective of internal control is to provide reasonable, rather than absolute, assurance that the financial statements are free of material misstatements, because the cost of each internal control should not outweigh the potential benefit. Management’s discussion and analysis (MD&A) immediately follows the independent auditor’s report and provides a narrative introduction, overview, and analysis of the basic financial statements. MD&A complements this letter of transmittal and should be read in conjunction with it. ORGANIZATION AND SERVICES PROVIDED The Rivanna Solid Waste Authority is a regional non-profit public corporation chartered in 1990 under the Virginia Water and Waste Authorities Act (1950, as amended), that currently provides solid waste disposal and recycling services to the region comprised of the City of Charlottesville (City) and Albemarle County (County). The Authority does not provide collection services, which are managed by the City's Public Service Division and various private haulers who serve customers in both the County and the City. The Authority operates under the terms of a Service Agreement signed October 6, 1990 by the officers of the City Council, the County Board of Supervisors, and the Authority. By this agreement, the Authority is to be the sole provider of any landfills, transfer stations, or other solid waste disposal facilities, including recycling and solid waste energy generation, for all solid waste generated within Charlottesville and Albemarle County. The Authority accepted donation of the assets and liabilities and assumed operational responsibility for the Ivy Sanitary Landfill as of February 1, 1991. The Authority has determined that it is not part of the reporting entity of either the City of Charlottesville or the County of Albemarle (see Note 1 of the notes to the financial statements). The Board appoints an Executive Director, who manages Authority operations under their direction. The Authority’s operations mainly consist of the Ivy Material Utilization Center (IMUC), Municipal Solid Waste (MSW) transfer station, recycling activities and supporting administrative functions.
3
LOCAL ECONOMIC CONDITIONS The University of Virginia provides a significant buffer against large swings in the economy of our service area. In addition, the Charlottesville urban area is a major retail trade center for the surrounding region. Housing growth remains steady. Although the majority of such growth occurs in County developments, in-filling in Charlottesville continues. Both Charlottesville and Albemarle County enjoy low unemployment rates, steady economic growth and high bond ratings. A recent ten-year compilation analysis report dated August 2015 by the Charlottesville Area Chamber of Commerce examining employment in the Greater Charlottesville Region concluded that total jobs grew by 11.8%, or 12,359 jobs, from 2004 to 2014 to exceed pre-recession levels. . The majority of jobs within the Region are located in the City of Charlottesville and Albemarle County. The steady increase in employment rate from 2010 to 2014 may indicate a trend that could continue in the coming years. The report noted that private sector employment in the Greater Charlottesville Region increased by 12.0%, compared to 3.6% for the Commonwealth of Virginia outside the Region. The Charlottesville-Albemarle area attracts many visitors to its historic sites and the wine industry has been popular and has served to help benefit the tourism sector of the regional economy. The travel and tourism industry make a vital contribution to the local economy. LONG-TERM FINANCIAL PLANNING The Authority is committed to the environmental remediation of the former Ivy Landfill. This challenge is immense in terms of management and economic resources. The next ten year effort in this area for monitoring and remediation will cost an estimated $5 to $6 million, which should level off to less than $500,000 per year thereafter. A memorandum of understanding among the City, the County, the University of Virginia (UVA), and the Authority was signed on January 10, 2005 in which the City, County, and UVA agreed to share in funding the costs of environmental remediation at the former Ivy Landfill which includes implementing the Corrective Action Plan. Obviously, the remediation costs greatly outweigh the ability to generate revenues at Rivanna. This agreement clearly indicates that our associated local governments and UVA are committed to financially supporting this long-term effort to protect and correct adverse impacts on the environment. ACCOUNTING AND BUDGETARY CONTROLS The Authority's accounting records are maintained on the accrual basis of accounting. Under this method, revenues are recognized when earned and expenses are recorded as liabilities are incurred, without regard to receipt or payment of cash. Internal controls are maintained by segregation of duties and physical and data security systems in all areas of record keeping, billing, cash receipts, disbursements and purchasing authority. All of these control systems are reviewed regularly by staff and are evaluated as part of the annual financial audit (see the Compliance Section of this report).
4

ACCOUNTING AND BUDGETARY CONTROLS (CONTINUED) The Authority is required by the Service Agreement to adopt an annual fiscal year budget for setting tipping fees as well as for fiscal guidance to staff. Budgets include direct costs and provision for equipment replacement as well as allocations of administrative, maintenance, site improvements funding, debt service, recycling, and other expenses. Projections of tonnages and expenses by waste category are used to calculate tipping fee requirements for each waste category (see Table 5). A proposed budget incorporating proposed tipping fees is prepared by the Authority Directors and the Executive Director and submitted to the Board of Directors. A public hearing is held on any proposed tipping fee changes with at least sixty days advance public notice. All budget items lapse at the end of the fiscal year, with the exception of encumbrances and contractual commitments. Budgetary compliance is monitored and reported to the Board by the Director of Finance and Administration and the Executive Director. Projections of both revenues and expenses are understood to reflect anticipated service levels and to incorporate a variety of economic, climatic, and demographic forecasts. Variances from budget line items are examined at least monthly to assure a direct relation between costs and actual service levels, emergencies or other contingent conditions. AWARDS The Government Finance Officers Association of the United States and Canada (GFOA) awarded a Certificate of Achievement for Excellence in Financial Reporting to the Rivanna Solid Waste Authority for its Comprehensive Annual Financial Report for the year ended June 30, 2014. This was the twenty first consecutive year that this governmental unit has achieved this prestigious award. In order to be awarded a Certificate of Achievement, a governmental unit must publish an easily readable and efficiently organized comprehensive annual financial report. This report must satisfy both generally accepted accounting principles and applicable legal requirements. A Certificate of Achievement is valid for a period of one year only. We believe that our current comprehensive annual financial report continues to meet the Certificate of Achievement Program’s requirements, and we are submitting it to the GFOA to determine its eligibility for another certificate. ANNUAL AUDIT State law and the Service Agreement require an annual audit of the books and records of the Authority. The opinion of our independent certified public accountants is included in the Financial Section. The concurrent reports on compliance are included in the Compliance Section. ACKNOWLEDGEMENTS The help of staff and of our certified public accountants is gratefully acknowledged. Such help and the Board of Directors’ support and commitment to financial reporting excellence are essential to the preparation of this report. Respectfully submitted, Lonzy E. Wood, III Director of Finance and Administration
5

This page intentionally left blank

7

This page intentionally left blank

Rivann
aSolid
Waste
Autho
rity
Rivann
a Solid
Waste Autho
rity
City of C
harlottesville
Coun
ty of A
lbem
arle
Board of Dire
ctors
Executive Dire
ctor
Environm
ental
Remed
iatio
nFinance/
Adm
inistration
Recycling
Ope
ratio
nsIvy Material
Utilization Ce
nter
9

This page intentionally left blank

ROBINSON, FARMER, COX ASSOCIATES
A PROFESSIONAL LIMITED LIABILITY COMPANY CERTIFIED PUBLIC ACCOUNTANTS
Independent Auditors’ Report
To the Board of Directors Rivanna Solid Waste Authority Charlottesville, Virginia Report on the Financial Statements We have audited the accompanying financial statements of the business-type activities of Rivanna Solid Waste Authority, as of and for the years ended June 30, 2015 and 2014, and the related notes to the financial statements, which collectively comprise the Authority’s basic financial statements as listed in the table of contents.
Management’s Responsibility for the Financial Statements
Management is responsible for the preparation and fair presentation of these financial statements in accordance with accounting principles generally accepted in the United States of America; this includes the design, implementation, and maintenance of internal control relevant to the preparation and fair presentation of financial statements that are free from material misstatement, whether due to fraud or error. Auditors’ Responsibility Our responsibility is to express an opinion on these financial statements based on our audits. We conducted our audits in accordance with auditing standards generally accepted in the United States of America; the standards applicable to financial audits contained in Government Auditing Standards, issued by the Comptroller General of the United States; and the Specifications for Audits of Authorities, Boards, and Commissions, issued by the Auditor of Public Accounts of the Commonwealth of Virginia. Those standards require that we plan and perform the audit to obtain reasonable assurance about whether the financial statements are free from material misstatement. An audit involves performing procedures to obtain audit evidence about the amounts and disclosures in the financial statements. The procedures selected depend on the auditors’ judgment, including the assessment of the risks of material misstatement of the financial statements, whether due to fraud or error. In making those risk assessments, the auditor considers internal control relevant to the entity’s preparation and fair presentation of the financial statements in order to design audit procedures that are appropriate in the circumstances, but not for the purpose of expressing an opinion on the effectiveness of the entity’s internal control. Accordingly, we express no such opinion. An audit also includes evaluating the appropriateness of accounting policies used and the reasonableness of significant accounting estimates made by management, as well as evaluating the overall presentation of the financial statements. We believe that the audit evidence we have obtained is sufficient and appropriate to provide a basis for our audit opinion. Opinion
In our opinion, the financial statements referred to above present fairly, in all material respects, the financial position of the business-type activities of Rivanna Solid Waste Authority, as of June 30, 2015 and 2014, and the changes in financial position and cash flows thereof for the year then ended in accordance with accounting principles generally accepted in the United States of America.
11
Change in Accounting Principle
As described in Note 13 to the financial statements, in 2015, the Rivanna Solid Waste Authority adopted new accounting guidance, GASB Statement Nos. 68, Accounting and Financial Reporting for Pensions – an amendment of GASB Statement No. 27 and 71, Pension Transition for Contributions Made Subsequent to the Measurement Date – an amendment of GASB Statement No. 68. Our opinion is not modified with respect to this matter.
Other Matters
Comparative Information
As described in Note 13 to the financial statements, GASB Statement Nos. 68 and 71 were implemented prospectively resulting in a restatement of beginning net position. In the year of implementation, comparative information for the net pension liability and related items was unavailable. Therefore, the 2014 amounts related to pensions have not been restated to reflect the requirements of GASB Statement Nos. 68 and 71. Our opinion is not modified with respect to this matter.
Required Supplementary Information
Accounting principles generally accepted in the United States of America require that the management’s discussion and analysis and schedules related to pension and OPEB funding on pages 13-19 and 61-64 be presented to supplement the basic financial statements. Such information, although not a part of the basic financial statements, is required by the Governmental Accounting Standards Board, who considers it to be an essential part of financial reporting for placing the basic financial statements in an appropriate operational, economic, or historical context. We have applied certain limited procedures to the required supplementary information in accordance with auditing standards generally accepted in the United States of America, which consisted of inquiries of management about the methods of preparing the information and comparing the information for consistency with management’s responses to our inquiries, the basic financial statements, and other knowledge we obtained during our audit of the basic financial statements. We do not express an opinion or provide any assurance on the information because the limited procedures do not provide us with sufficient evidence to express an opinion or provide any assurance.
Other Information
Our audit was conducted for the purpose of forming an opinion on the financial statements that collectively comprise Rivanna Solid Waste Authority’s basic financial statements. The introductory section and statistical section are presented for purposes of additional analysis and are not a required part of the basic financial statements.
The introductory and statistical sections have not been subjected to the auditing procedures applied in the audit of the basic financial statements and, accordingly, we do not express an opinion or provide any assurance on them.
Other Reporting Required by Government Auditing Standards
In accordance with Government Auditing Standards, we have also issued our report dated October 30, 2015, on our consideration of Rivanna Solid Waste Authority’s internal control over financial reporting and on our tests of its compliance with certain provisions of laws, regulations, contracts, and grant agreements and other matters. The purpose of that report is to describe the scope of our testing of internal control over financial reporting and compliance and the results of that testing, and not to provide an opinion on internal control over financial reporting or on compliance. That report is an integral part of an audit performed in accordance with Government Auditing Standards in considering Rivanna Solid Waste Authority’s internal control over financial reporting and compliance.
Charlottesville, Virginia October 30, 2015
12
Management's Discussion and Analysis To the Board of Directors Rivanna Solid Waste Authority Charlottesville, Virginia As management of Rivanna Solid Waste Authority (the Authority), we offer readers of our financial statements this narrative overview and analysis of the financial activities of the Authority for the fiscal year ended June 30, 2015. We encourage readers to consider the information presented here in conjunction with additional information that we have furnished in our letter of transmittal, which can be found on pages 3 through 5 of this report. Overview of the Financial Statements This discussion and analysis is intended to serve as an introduction to the Authority's basic financial statements. Since the Authority is engaged only in business-type activities, its basic financial statements are comprised of only two components: 1) enterprise fund financial statements and 2) notes to the financial statements. This report also contains required supplementary information in addition to the basic financial statements. Enterprise fund financial statements. The enterprise fund financial statements are designed to provide readers with a broad overview of the Authority's finances, in a manner similar to a private-sector business. The statement of net position presents information on the Authority's assets, deferred outflow of resources, liabilities, and deferred inflow of resources, with the difference reported as net position. Over time, increases or decreases in net position may serve as a useful indicator of whether the financial position of the Authority is improving or deteriorating. The statement of revenues, expenses, and changes in net position presents information showing how the Authority's net position changed during the most recent fiscal year. All changes in net position are reported as soon as the underlying event giving rise to the change occurs, regardless of the timing of the cash flows. Thus, revenues and expenses are reported in this statement for some items that will only result in cash flows in future fiscal periods (e.g. earned but unused vacation leave). The basic enterprise fund financial statements can be found on pages 22 through 25 of this report. Notes to the financial statements. The notes provide additional information that is essential to a full understanding of the data provided in the financial statements. The notes to the financial statements can be found on pages 27 through 57 of this report. Required supplementary information. This report also includes required supplementary information concerning the Authority’s progress in funding its obligation to provide pension and other postemployment benefits to its employees. It is located immediately following the notes to financial statements.
13

Financial Highlights − The assets of the Authority exceeded its liabilities at the close of the current fiscal year by $3.8 million (net
position), which is unchanged from last year. − Total liabilities remained at roughly last year’s levels at $7 million. − Total revenues increased by $230,000 due to increased charges to the local jurisdictions for governmental
contributions to the operating costs.
− Total expenses decreased significantly by $3.2 million this year and increased by $2.6 million in the prior year due to fluctuations in accrued remediation costs being recognized.
Financial Analysis The Authority's net position invested in capital assets at the end of the past 3 years has remained relatively constant. The Authority uses these capital assets to provide services to its customers, so these assets are not available for future spending. Unrestricted net position is stated as negative $2.4 million as of June 30, 2015 and the previous year, because estimated landfill closure and post-closure costs for many years to come have been recorded as liabilities, but these costs are funded on a pay-as-you-go basis through financial assurance provided by local government contributions which has not yet been recorded as a funding source. The $3 million decrease shown in FY 2014 in unrestricted net position is tied to the increased accrual of estimated closure and post-closure costs. See Note 8 of the notes to the financial statements for details.
2015 2014 2013
Current and other assets $ 4,911,252 $ 4,844,215 $ 4,823,305 Capital assets 6,246,134 6,232,154 6,333,722
Total assets $ 11,157,386 $ 11,076,369 $ 11,157,027
Deferred outflow of resources $ 38,370 $ - $ -
Noncurrent liabilities $ 6,575,001 $ 6,553,673 $ 3,925,462 Current liabilities 645,549 727,881 404,350
Total liabilities $ 7,220,550 $ 7,281,554 $ 4,329,812
Deferred inflow of resources $ 141,434 $ - $ -
Net position:Invested in capital assets $ 6,246,134 $ 6,232,154 $ 6,333,722 Unrestricted (2,412,362) (2,437,339) 493,493
Total net position $ 3,833,772 $ 3,794,815 $ 6,827,215
Net Position
Tipping fee revenues were relatively flat for FY 2015 with a small decrease of $8,000 from FY 2014. In FY 2014, the loss of our largest customer resulted in the tipping fee decrease of $222,000. A private transfer station that accepts CDD (Construction and Demolition Debris), MSW (Municipal Solid Waste) and recyclable material started operations several years ago and became a very convenient disposal location for many private haulers. This competing transfer station is the main reason for the Authority’s declining transfer station revenues in recent years. Recycling revenues continued to decline over the last two years by $27,000 and $21,000 respectively due to soft material market pricing and lower volumes of material received.
14
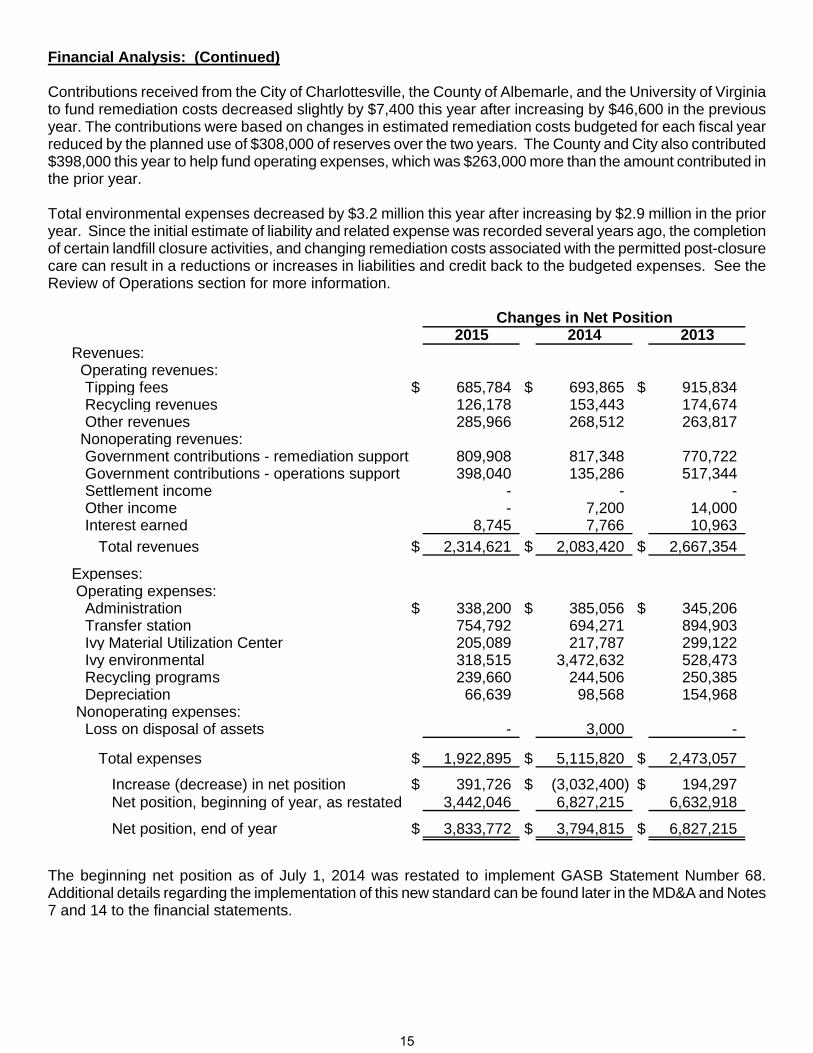
Financial Analysis: (Continued) Contributions received from the City of Charlottesville, the County of Albemarle, and the University of Virginia to fund remediation costs decreased slightly by $7,400 this year after increasing by $46,600 in the previous year. The contributions were based on changes in estimated remediation costs budgeted for each fiscal year reduced by the planned use of $308,000 of reserves over the two years. The County and City also contributed $398,000 this year to help fund operating expenses, which was $263,000 more than the amount contributed in the prior year. Total environmental expenses decreased by $3.2 million this year after increasing by $2.9 million in the prior year. Since the initial estimate of liability and related expense was recorded several years ago, the completion of certain landfill closure activities, and changing remediation costs associated with the permitted post-closure care can result in a reductions or increases in liabilities and credit back to the budgeted expenses. See the Review of Operations section for more information.
Changes in Net Position2015 2014 2013
Revenues: Operating revenues:
Tipping fees $ 685,784 $ 693,865 $ 915,834 Recycling revenues 126,178 153,443 174,674 Other revenues 285,966 268,512 263,817
Nonoperating revenues:Government contributions - remediation support 809,908 817,348 770,722 Government contributions - operations support 398,040 135,286 517,344 Settlement income - - - Other income - 7,200 14,000 Interest earned 8,745 7,766 10,963
Total revenues $ 2,314,621 $ 2,083,420 $ 2,667,354
Expenses: Operating expenses:
Administration $ 338,200 $ 385,056 $ 345,206 Transfer station 754,792 694,271 894,903 Ivy Material Utilization Center 205,089 217,787 299,122 Ivy environmental 318,515 3,472,632 528,473 Recycling programs 239,660 244,506 250,385 Depreciation 66,639 98,568 154,968
Nonoperating expenses:Loss on disposal of assets - 3,000 -
Total expenses $ 1,922,895 $ 5,115,820 $ 2,473,057
Increase (decrease) in net position $ 391,726 $ (3,032,400) $ 194,297 Net position, beginning of year, as restated 3,442,046 6,827,215 6,632,918
Net position, end of year $ 3,833,772 $ 3,794,815 $ 6,827,215
The beginning net position as of July 1, 2014 was restated to implement GASB Statement Number 68. Additional details regarding the implementation of this new standard can be found later in the MD&A and Notes 7 and 14 to the financial statements.
15
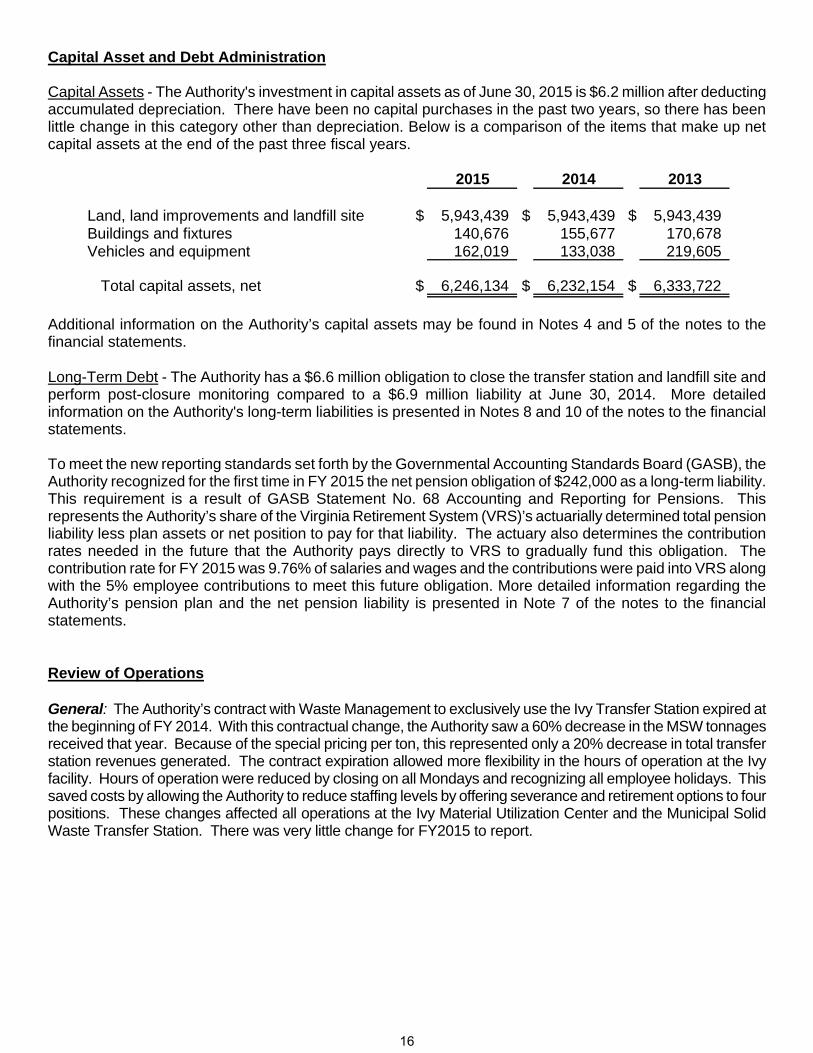
Capital Asset and Debt Administration Capital Assets - The Authority's investment in capital assets as of June 30, 2015 is $6.2 million after deducting accumulated depreciation. There have been no capital purchases in the past two years, so there has been little change in this category other than depreciation. Below is a comparison of the items that make up net capital assets at the end of the past three fiscal years.
2015 2014 2013
Land, land improvements and landfill site $ 5,943,439 $ 5,943,439 $ 5,943,439 Buildings and fixtures 140,676 155,677 170,678 Vehicles and equipment 162,019 133,038 219,605
Total capital assets, net $ 6,246,134 $ 6,232,154 $ 6,333,722
Additional information on the Authority’s capital assets may be found in Notes 4 and 5 of the notes to the financial statements. Long-Term Debt - The Authority has a $6.6 million obligation to close the transfer station and landfill site and perform post-closure monitoring compared to a $6.9 million liability at June 30, 2014. More detailed information on the Authority's long-term liabilities is presented in Notes 8 and 10 of the notes to the financial statements. To meet the new reporting standards set forth by the Governmental Accounting Standards Board (GASB), the Authority recognized for the first time in FY 2015 the net pension obligation of $242,000 as a long-term liability. This requirement is a result of GASB Statement No. 68 Accounting and Reporting for Pensions. This represents the Authority’s share of the Virginia Retirement System (VRS)’s actuarially determined total pension liability less plan assets or net position to pay for that liability. The actuary also determines the contribution rates needed in the future that the Authority pays directly to VRS to gradually fund this obligation. The contribution rate for FY 2015 was 9.76% of salaries and wages and the contributions were paid into VRS along with the 5% employee contributions to meet this future obligation. More detailed information regarding the Authority’s pension plan and the net pension liability is presented in Note 7 of the notes to the financial statements. Review of Operations General: The Authority’s contract with Waste Management to exclusively use the Ivy Transfer Station expired at the beginning of FY 2014. With this contractual change, the Authority saw a 60% decrease in the MSW tonnages received that year. Because of the special pricing per ton, this represented only a 20% decrease in total transfer station revenues generated. The contract expiration allowed more flexibility in the hours of operation at the Ivy facility. Hours of operation were reduced by closing on all Mondays and recognizing all employee holidays. This saved costs by allowing the Authority to reduce staffing levels by offering severance and retirement options to four positions. These changes affected all operations at the Ivy Material Utilization Center and the Municipal Solid Waste Transfer Station. There was very little change for FY2015 to report.
16

Review of Operations: (Continued) Ivy Material Utilization Center (IMUC): Waste items are received at the IMUC, where most of the items are processed for sale or reuse, such as metals, tires, grindable vegetative material, and pallets. Clean fill, which is inert material, is accepted as well. Tipping fees from these items generated $183,000 in gross revenues for the Authority this year. This was a $23,000 decrease from the previous year mainly due to a decrease in vegetative materials and clean fill being received. The resale of items such as scrap metal and mulch resulted in revenues of $94,000 and hauling fees increased by 41% to $89,000 this year. The IMUC has semiannual household hazardous waste (HHW) events for collection of paint, batteries, and other HHW. The public drop-off recycling center and a "blue bag" drop-off center for Albemarle County haulers that collect waste paper remained at the center this year. IMUC operating costs were cut by 6% this year after decreasing 27% in the prior year. Municipal Solid Waste Transfer Station: The Authority owns and operates a MSW transfer station at the IMUC that accepts MSW and small loads of construction debris from residential and commercial haulers. The waste is loaded into trailers, and a contractor hauls and disposes of the waste at a contracted facility in Amelia County. Tipping fees generated by this operation were $502,000 this year, which was a 3% increase from the prior year. See the chart below.
Ivy Transfer Station MSW Tonnages FY 2012-2015
0
500
1,000
1,500
2,000
2,500
3,000
Jul Aug Sep Oct Nov Dec Jan Feb Mar Apr May Jun
Ton
s
FY 2012
FY 2013
FY 2014
FY 2015
The preceding graph shows the monthly tonnage activity at the Ivy MSW transfer station compared to past fiscal years. Transfer Station waste tonnages declined again this year due to the slow economy and more options for disposal for private haulers.
17
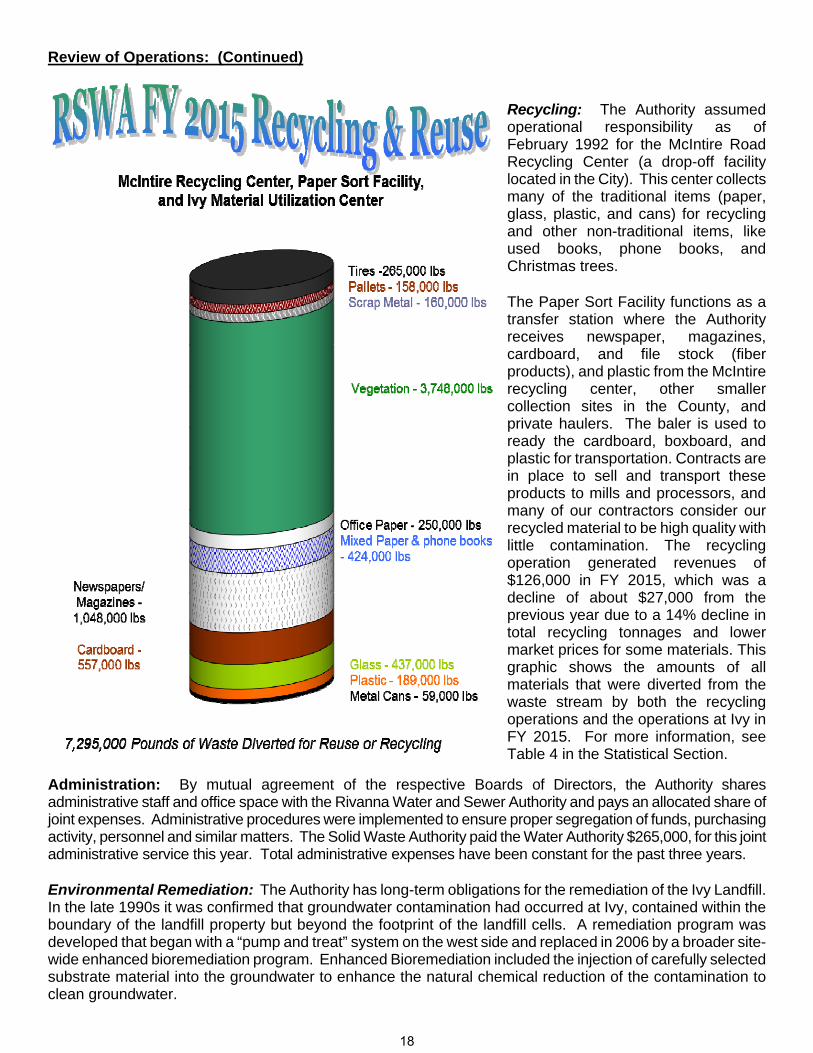
Review of Operations: (Continued) Recycling: The Authority assumed operational responsibility as of February 1992 for the McIntire Road Recycling Center (a drop-off facility located in the City). This center collects many of the traditional items (paper, glass, plastic, and cans) for recycling and other non-traditional items, like used books, phone books, and Christmas trees.
The Paper Sort Facility functions as a transfer station where the Authority receives newspaper, magazines, cardboard, and file stock (fiber products), and plastic from the McIntire recycling center, other smaller collection sites in the County, and private haulers. The baler is used to ready the cardboard, boxboard, and plastic for transportation. Contracts are in place to sell and transport these products to mills and processors, and many of our contractors consider our recycled material to be high quality with little contamination. The recycling operation generated revenues of $126,000 in FY 2015, which was a decline of about $27,000 from the previous year due to a 14% decline in total recycling tonnages and lower market prices for some materials. This graphic shows the amounts of all materials that were diverted from the waste stream by both the recycling operations and the operations at Ivy in FY 2015. For more information, see Table 4 in the Statistical Section.
Administration: By mutual agreement of the respective Boards of Directors, the Authority shares administrative staff and office space with the Rivanna Water and Sewer Authority and pays an allocated share of joint expenses. Administrative procedures were implemented to ensure proper segregation of funds, purchasing activity, personnel and similar matters. The Solid Waste Authority paid the Water Authority $265,000, for this joint administrative service this year. Total administrative expenses have been constant for the past three years. Environmental Remediation: The Authority has long-term obligations for the remediation of the Ivy Landfill. In the late 1990s it was confirmed that groundwater contamination had occurred at Ivy, contained within the boundary of the landfill property but beyond the footprint of the landfill cells. A remediation program was developed that began with a “pump and treat” system on the west side and replaced in 2006 by a broader site-wide enhanced bioremediation program. Enhanced Bioremediation included the injection of carefully selected substrate material into the groundwater to enhance the natural chemical reduction of the contamination to clean groundwater.
18
Review of Operations: (Continued) As a result of the bioremediation, the spread of contamination within the groundwater on the site has been tightly contained and reduced, protecting both the environment and human health. The injection of substrate material ceased in July 2013 while close groundwater monitoring continued to determine if the breakdown of contaminated material will continue without further injection. The Authority is prepared to re-initiate injections should it prove necessary based on the semiannual groundwater monitoring program that continues at the landfill. This frequency of monitoring is appropriate given that groundwater moves underground very slowly. Air quality is also an important part of landfill post closure care, as buried waste material decomposition causes the formation of landfill gases within the waste cells below the ground surface. Gas build-up can result in pressures that escape through the ground surface. In 2006 the Authority awarded a construction contract to significantly upgrade the gas collection system for all landfill cells, providing an effective means to pull the formed gas through an underground pipe network to a flare which destroys the methane and other gas components that may cause health or nuisance problems. Following the upgrade, odor complaints decreased significantly (in fact, there have been no odor complaints in the last several years). The Authority monitors the air quality at the Landfill site annually in August. Recent reports have been highly favorable. Sampling was performed again in August 2014. The analysis of samples identified only one compound, chloromethane, at levels almost two orders of magnitude below US EPAs risk-based screening levels. Although chloromethane may be derived from wastes at the landfill, the Agency for Toxic Substances and Disease Registry indicates that as much as 99% of chloromethane emissions into the environment may be from natural sources. Long-Term Trends Albemarle County is in the process of deciding whether to expand the existing Ivy Transfer station to meet the needs of small hauler and residential waste disposal or turn the current transfer station into a smaller convenience center for resident only users. The Virginia Department of Environmental Quality (DEQ) is the regulatory authority/agency that the current facility is permitted to operate. A review last year determined that the current configuration of the facility did not meet permitting requirements. The DEQ has given the Authority and the County a deadline of December 31, 2015 to formulate an action plan to reconfigure the current site, build a new site at Ivy or release the permit and become a convenience center that does not require a permit. This process is still on-going. Remediation management of the Ivy site is ongoing for the next decade in terms of closure and over two decades on post-closure care. The Board has indicated that these remediation efforts will continue to be the primary mission of the Authority. Requests for Information This financial report is designed to provide a general overview of the Authority’s finances. Questions concerning any of the information provided in this report or requests for additional financial information should be addressed to the Finance Department at 695 Moores Creek Lane, Charlottesville, Virginia 22902-9016.
19

This page intentionally left blank
Basic Financial Statements
21
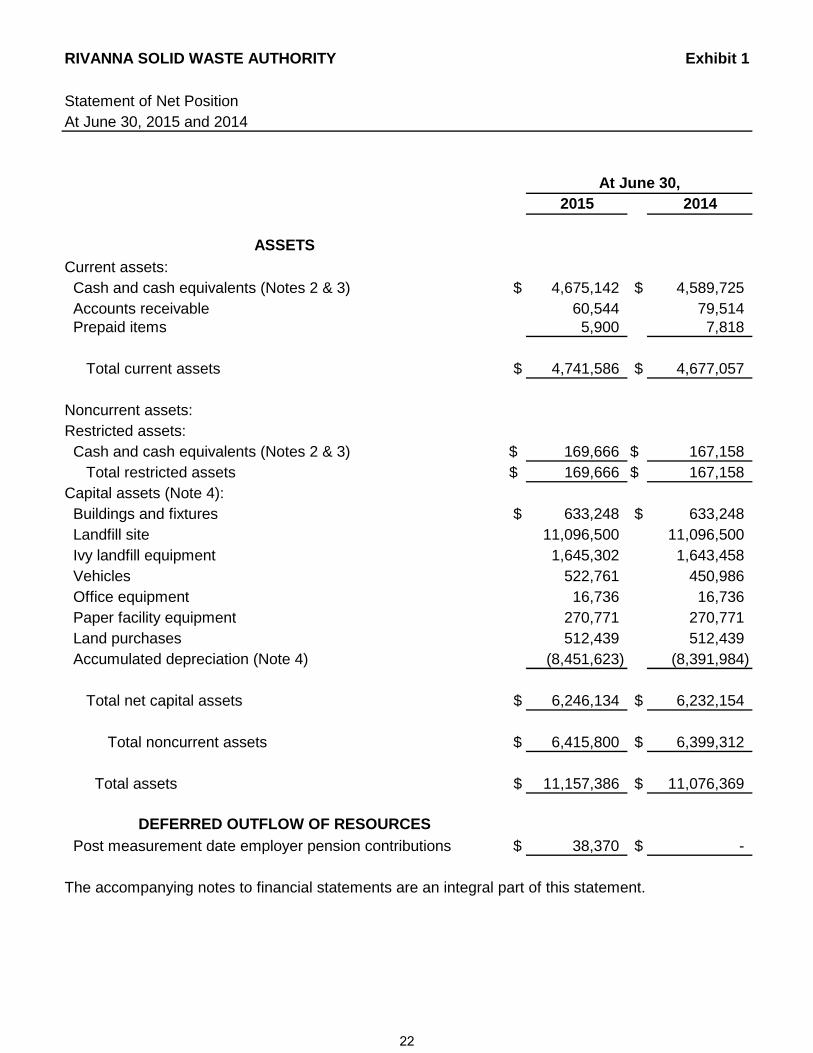
RIVANNA SOLID WASTE AUTHORITY Exhibit 1
Statement of Net PositionAt June 30, 2015 and 2014
2015 2014
ASSETS
Current assets: Cash and cash equivalents (Notes 2 & 3) $ 4,675,142 $ 4,589,725 Accounts receivable 60,544 79,514 Prepaid items 5,900 7,818
Total current assets $ 4,741,586 $ 4,677,057
Noncurrent assets:Restricted assets: Cash and cash equivalents (Notes 2 & 3) $ 169,666 $ 167,158 Total restricted assets $ 169,666 $ 167,158 Capital assets (Note 4): Buildings and fixtures $ 633,248 $ 633,248 Landfill site 11,096,500 11,096,500 Ivy landfill equipment 1,645,302 1,643,458 Vehicles 522,761 450,986 Office equipment 16,736 16,736 Paper facility equipment 270,771 270,771 Land purchases 512,439 512,439 Accumulated depreciation (Note 4) (8,451,623) (8,391,984)
Total net capital assets $ 6,246,134 $ 6,232,154
Total noncurrent assets $ 6,415,800 $ 6,399,312
Total assets $ 11,157,386 $ 11,076,369
DEFERRED OUTFLOW OF RESOURCES
Post measurement date employer pension contributions $ 38,370 $ -
The accompanying notes to financial statements are an integral part of this statement.
At June 30,
22

RIVANNA SOLID WASTE AUTHORITY Exhibit 1
Statement of Net Position (continued)At June 30, 2015 and 2014
2015 2014
LIABILITIES
Liabilities: Current liabilities: Accounts payable $ 260,413 $ 318,501 Accrued landfill corrective action and post-closure costs 357,136 370,215 Compensated absences - current portion (Note 10) 28,000 39,165
Total current liabilities $ 645,549 $ 727,881
Noncurrent liabilities: Payable from restricted assets: Accrued transfer station closure costs (Note 8) $ 169,666 $ 167,158 Accrued corrective action costs (Note 8) 3,214,223 3,331,930 Accrued post-closure monitoring costs (Note 8) 2,892,435 2,999,673 Net OPEB obligation (Note 12) 40,912 54,912 Net pension liability (Note 7) 242,163 - Compensated absences (net of current portion) (Note 10) 15,602 -
Total noncurrent liabilities $ 6,575,001 $ 6,553,673
Total liabilities $ 7,220,550 $ 7,281,554
DEFERRED INFLOW OF RESOURCES
Net difference of actual and expected pension plan earnings $ 141,434 $ -
NET POSITION
Net position: Investment in capital assets $ 6,246,134 $ 6,232,154 Unrestricted (2,412,362) (2,437,339)
Total net position $ 3,833,772 $ 3,794,815
The accompanying notes to financial statements are an integral part of this statement.
At June 30,
23

RIVANNA SOLID WASTE AUTHORITY Exhibit 2
Statement of Revenues, Expenses and Changes in Net PositionYears Ended June 30, 2015 and 2014
Year Ended June 30,2015 2014
Operating revenues: Tipping fees $ 685,784 $ 693,865 Recycling revenues 126,178 153,443 Other revenues 285,966 268,512
Total operating revenues $ 1,097,928 $ 1,115,820
Operating expenses: Administration $ 338,200 $ 385,056 Transfer station 754,792 694,271 Ivy Material Utilization Center 205,089 217,787 Ivy environmental 318,515 3,472,632 Recycling programs 239,660 244,506 Depreciation 66,639 98,568
Total operating expenses $ 1,922,895 $ 5,112,820
Operating income (loss) $ (824,967) $ (3,997,000)
Nonoperating revenues (expenses): Interest earned $ 8,745 $ 7,766 Local government contributions - remediation support 809,908 817,348 Local government contributions - operations support 398,040 135,286 Other income - 7,200 Gain (loss) on disposal of assets - (3,000)
Total nonoperating revenues (expenses) $ 1,216,693 $ 964,600
Change in net position $ 391,726 $ (3,032,400) Net position, beginning of year, as restated 3,442,046 6,827,215
Net position, end of year $ 3,833,772 $ 3,794,815
The accompanying notes to financial statements are an integral part of this statement.
24
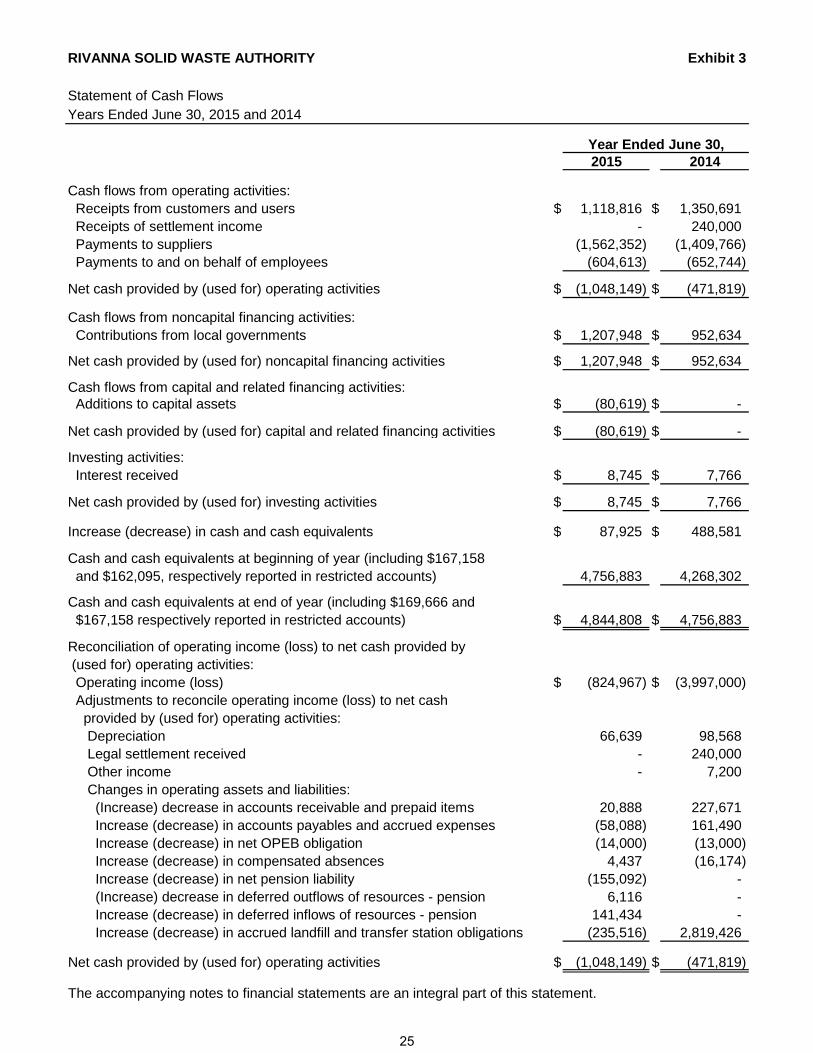
RIVANNA SOLID WASTE AUTHORITY Exhibit 3
Statement of Cash FlowsYears Ended June 30, 2015 and 2014
Year Ended June 30,2015 2014
Cash flows from operating activities: Receipts from customers and users $ 1,118,816 $ 1,350,691 Receipts of settlement income - 240,000 Payments to suppliers (1,562,352) (1,409,766) Payments to and on behalf of employees (604,613) (652,744)
Net cash provided by (used for) operating activities $ (1,048,149) $ (471,819)
Cash flows from noncapital financing activities: Contributions from local governments $ 1,207,948 $ 952,634
Net cash provided by (used for) noncapital financing activities $ 1,207,948 $ 952,634
Cash flows from capital and related financing activities: Additions to capital assets $ (80,619) $ -
Net cash provided by (used for) capital and related financing activities $ (80,619) $ -
Investing activities: Interest received $ 8,745 $ 7,766
Net cash provided by (used for) investing activities $ 8,745 $ 7,766
Increase (decrease) in cash and cash equivalents $ 87,925 $ 488,581
Cash and cash equivalents at beginning of year (including $167,158 and $162,095, respectively reported in restricted accounts) 4,756,883 4,268,302
Cash and cash equivalents at end of year (including $169,666 and $167,158 respectively reported in restricted accounts) $ 4,844,808 $ 4,756,883
Reconciliation of operating income (loss) to net cash provided by (used for) operating activities: Operating income (loss) $ (824,967) $ (3,997,000) Adjustments to reconcile operating income (loss) to net cash provided by (used for) operating activities: Depreciation 66,639 98,568 Legal settlement received - 240,000 Other income - 7,200 Changes in operating assets and liabilities: (Increase) decrease in accounts receivable and prepaid items 20,888 227,671 Increase (decrease) in accounts payables and accrued expenses (58,088) 161,490 Increase (decrease) in net OPEB obligation (14,000) (13,000) Increase (decrease) in compensated absences 4,437 (16,174) Increase (decrease) in net pension liability (155,092) - (Increase) decrease in deferred outflows of resources - pension 6,116 - Increase (decrease) in deferred inflows of resources - pension 141,434 - Increase (decrease) in accrued landfill and transfer station obligations (235,516) 2,819,426
Net cash provided by (used for) operating activities $ (1,048,149) $ (471,819)
The accompanying notes to financial statements are an integral part of this statement.
25

This page intentionally left blank

RIVANNA SOLID WASTE AUTHORITY
Notes to the Financial Statements As of June 30, 2015 and 2014
NOTE 1–FORMATION OF THE RIVANNA SOLID WASTE AUTHORITY: The Rivanna Solid Waste Authority is a jointly governed organization formed by the City of Charlottesville and the County of Albemarle pursuant to the Virginia Water and Waste Authorities Act (Code of Virginia, 1950 as amended). The Authority was formed to develop regional garbage and refuse disposal, as such terms are defined in Section 15.2-5101 of the Act, including development of systems and facilities for recycling, waste reduction and disposal alternatives with the ultimate goal of acquiring, financing, constructing, and/or operating and maintaining regional solid waste disposal areas, systems and facilities, all pursuant to the provisions of the Act. The Authority began operations on February 1, 1991. Financial Reporting Entity The Rivanna Solid Waste Authority provides the services mentioned above to the citizens of its participating governments, City of Charlottesville and County of Albemarle. However, these participating governments do not have a financial interest in or responsibility to the Authority. The Authority’s governing body is comprised of three members appointed by the City, three members appointed by the County, and one member who is jointly appointed by the City and County. Therefore, none of the participants appoints a voting majority of board members. The Authority is perpetual. No participating government has access to its resources or surpluses, nor is any participant liable for the Authority’s debts or deficits. The Authority also has the ability to finance its capital projects through user charges or the sale of revenue bonds. Based on the above representations, the Rivanna Solid Waste Authority has been determined to be a jointly governed organization of the City of Charlottesville and County of Albemarle. The Authority is not a component unit of either of the participating governments. For purposes of reporting entity disclosure, it should be noted that a separate entity, the Rivanna Water & Sewer Authority, provides wholesale water and sewer services to the City of Charlottesville and the Albemarle County Service Authority. Although certain administrative employees provide services to both Authorities, each Authority is operationally and legally independent. NOTE 2–SUMMARY OF SIGNIFICANT ACCOUNTING POLICIES: A. Basic Financial Statements
As a requirement of GASB Statement 34, the financial statements include a Management’s Discussion and Analysis (MD&A) section providing an analysis of the Authority’s overall financial position and results of operations.
Since the Authority is only engaged in business-type activities, it is required to present only the financial statements required for enterprise funds. For the Authority, the basic financial statements and required supplementary information consist of:
• Management’s discussion and analysis
27
RIVANNA SOLID WASTE AUTHORITY Notes to the Financial Statements As of June 30, 2015 and 2014 (Continued)
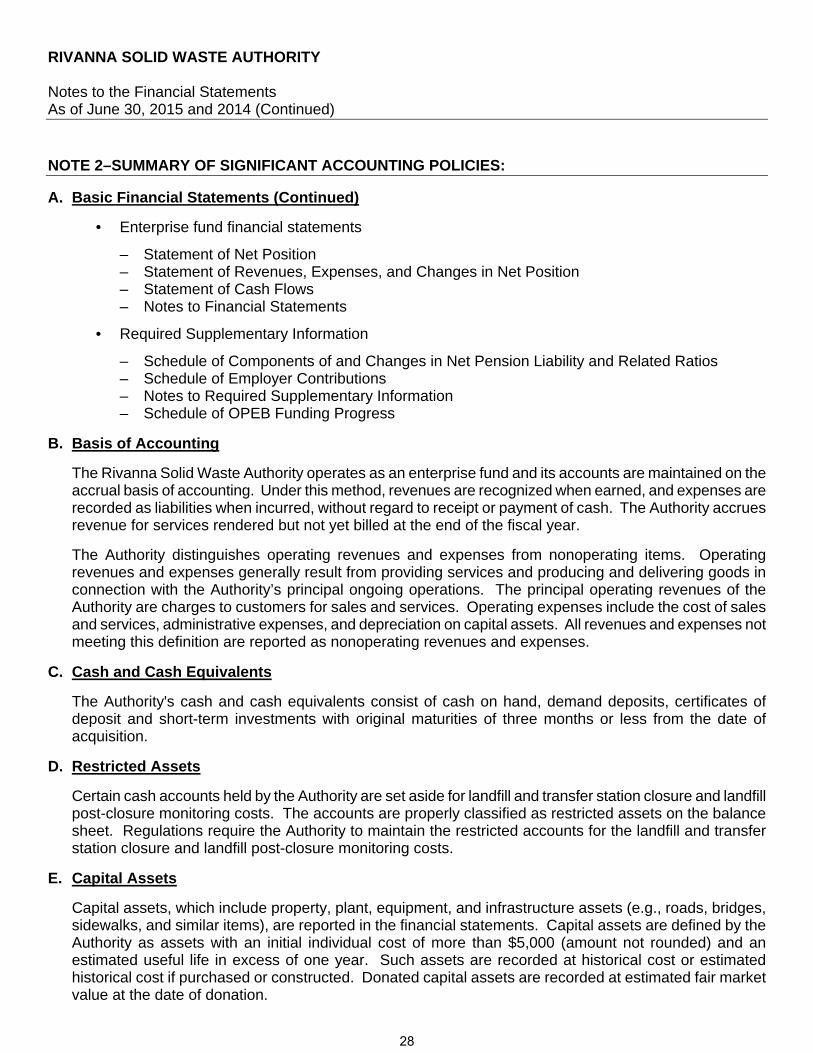
NOTE 2–SUMMARY OF SIGNIFICANT ACCOUNTING POLICIES:
A. Basic Financial Statements (Continued)
• Enterprise fund financial statements
– Statement of Net Position – Statement of Revenues, Expenses, and Changes in Net Position – Statement of Cash Flows – Notes to Financial Statements
• Required Supplementary Information
– Schedule of Components of and Changes in Net Pension Liability and Related Ratios – Schedule of Employer Contributions – Notes to Required Supplementary Information
– Schedule of OPEB Funding Progress
B. Basis of Accounting
The Rivanna Solid Waste Authority operates as an enterprise fund and its accounts are maintained on the accrual basis of accounting. Under this method, revenues are recognized when earned, and expenses are recorded as liabilities when incurred, without regard to receipt or payment of cash. The Authority accrues revenue for services rendered but not yet billed at the end of the fiscal year.
The Authority distinguishes operating revenues and expenses from nonoperating items. Operating revenues and expenses generally result from providing services and producing and delivering goods in connection with the Authority’s principal ongoing operations. The principal operating revenues of the Authority are charges to customers for sales and services. Operating expenses include the cost of sales and services, administrative expenses, and depreciation on capital assets. All revenues and expenses not meeting this definition are reported as nonoperating revenues and expenses.
C. Cash and Cash Equivalents
The Authority's cash and cash equivalents consist of cash on hand, demand deposits, certificates of deposit and short-term investments with original maturities of three months or less from the date of acquisition.
D. Restricted Assets
Certain cash accounts held by the Authority are set aside for landfill and transfer station closure and landfill post-closure monitoring costs. The accounts are properly classified as restricted assets on the balance sheet. Regulations require the Authority to maintain the restricted accounts for the landfill and transfer station closure and landfill post-closure monitoring costs.
E. Capital Assets
Capital assets, which include property, plant, equipment, and infrastructure assets (e.g., roads, bridges, sidewalks, and similar items), are reported in the financial statements. Capital assets are defined by the Authority as assets with an initial individual cost of more than $5,000 (amount not rounded) and an estimated useful life in excess of one year. Such assets are recorded at historical cost or estimated historical cost if purchased or constructed. Donated capital assets are recorded at estimated fair market value at the date of donation.
28
RIVANNA SOLID WASTE AUTHORITY Notes to the Financial Statements As of June 30, 2015 and 2014 (Continued)
NOTE 2–SUMMARY OF SIGNIFICANT ACCOUNTING POLICIES: (CONTINUED)
E. Capital Assets (Continued)
The City of Charlottesville and the County of Albemarle contributed certain landfill assets to the Authority. These assets are all reported at their market value on the date donated. Landfill vehicles and equipment are valued based upon estimates by Authority personnel. Landfill cells and the landfill site were valued by the Authority’s consulting engineer. The engineer also estimated the accrued landfill closure and related expenses. The remaining land area at the landfill site is reported at its value as a landfill site. If the Authority determines that the Ivy site will no longer be used for future waste disposal, the value will be adjusted to its fair value.
The costs of normal maintenance and repairs that do not add to the value of the asset or materially extend its useful life are not capitalized.
Major outlays for capital assets and improvements are capitalized as projects are constructed. Interest incurred during the construction phase of capital assets of business-type activities is included as part of the capitalized value of the assets constructed. No interest was capitalized during the current or previous fiscal year.
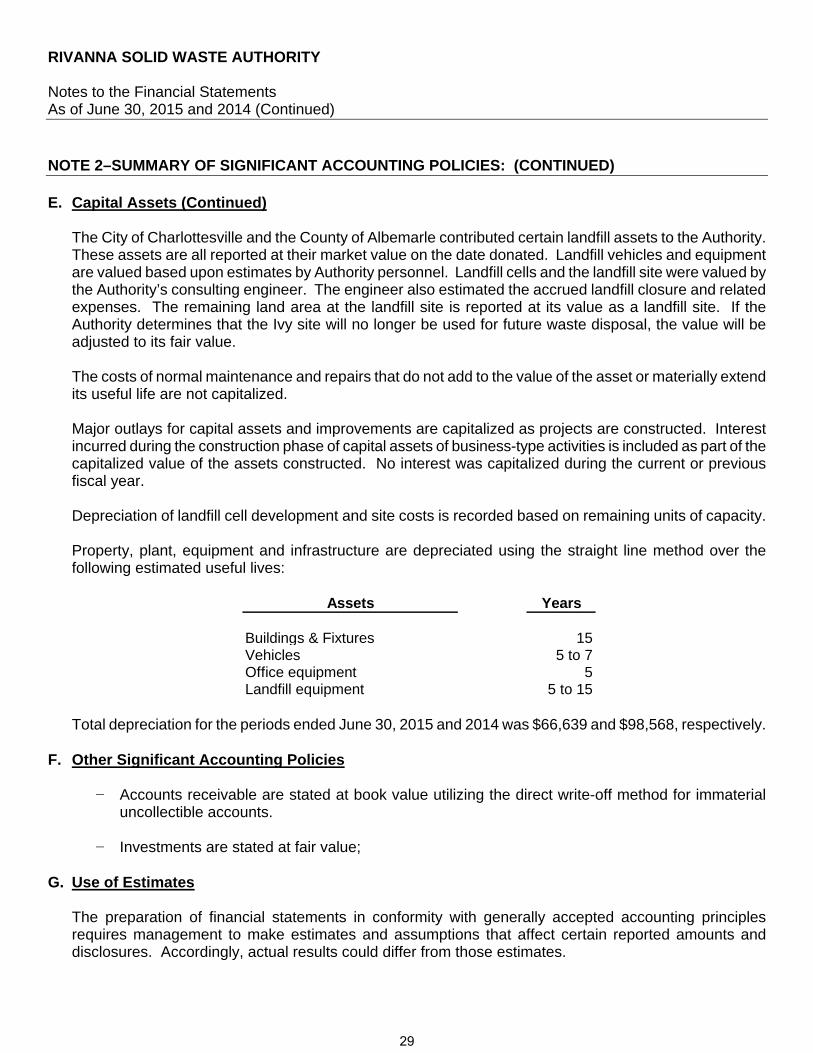
Depreciation of landfill cell development and site costs is recorded based on remaining units of capacity. Property, plant, equipment and infrastructure are depreciated using the straight line method over the following estimated useful lives:
Assets Years
Buildings & Fixtures 15Vehicles 5 to 7Office equipment 5Landfill equipment 5 to 15
Total depreciation for the periods ended June 30, 2015 and 2014 was $66,639 and $98,568, respectively.
F. Other Significant Accounting Policies
− Accounts receivable are stated at book value utilizing the direct write-off method for immaterial uncollectible accounts.
− Investments are stated at fair value;
G. Use of Estimates
The preparation of financial statements in conformity with generally accepted accounting principles requires management to make estimates and assumptions that affect certain reported amounts and disclosures. Accordingly, actual results could differ from those estimates.
29
RIVANNA SOLID WASTE AUTHORITY Notes to the Financial Statements As of June 30, 2015 and 2014 (Continued)
NOTE 2–SUMMARY OF SIGNIFICANT ACCOUNTING POLICIES: (CONTINUED)
H. Net Position
Net position is the difference between assets and deferred outflows of resources and liabilities and deferred inflows of resources. Net investment in capital assets represents capital assets, reduced by accumulated depreciation and by any outstanding debt, and deferred outflows of resources and increased by deferred inflows of resources related to the acquisition, construction or improvement of those assets. Restricted net position represents restricted assets reduced by liabilities and deferred inflows of resources related to those assets.
I. Reclassification
Certain amounts in previously issued financial statements have been restated to conform to current year classifications.
J. Closure and Post-Closure Obligations The Authority records all estimated closure costs for existing cells as a liability. Upon final closure of the landfill site, the Authority is then responsible, under current Federal regulations, for maintaining the closed site for the following thirty years.
K. Deferred Outflows/Inflows of Resources In addition to assets, the statement of net position will sometimes report a separate section for deferred outflows of resources. This separate financial statement element, deferred outflows of resources, represents a consumption of net position that applies to a future period(s) and so will not be recognized as an outflow of resources (expense) until then. The Authority has one item that qualifies for reporting in this category. It is comprised of contributions to the pension plan made during the current year and subsequent to the net pension liability measurement date, which will be recognized as a reduction of the net pension liability next fiscal year. For more detailed information on these items, reference the pension note. In addition to liabilities, the statement of net position will sometimes report a separate section for deferred inflows of resources. This separate financial statement element, deferred inflows of resources, represents an acquisition of net position that applies to a future period(s) and so will not be recognized as an inflow of resources (revenue) until that time. The Authority has one item that qualifies for reporting in this category. Certain items related to the measurement of the net pension liability are reported as deferred inflows of resources. These include differences between expected and actual experience, change in assumptions, and the net difference between projected and actual earnings on pension plan investments. For more detailed information on these items, reference the pension note.
L. Net Position Flow Assumption Sometimes the Authority will fund outlays for a particular purpose from both restricted (e.g., restricted bond or grant proceeds) and unrestricted resources. In order to calculate the amounts to report as restricted net position and unrestricted net position in the financial statements, a flow assumption must be made about the order in which the resources are considered to be applied. It is the Authority’s policy to consider restricted net position to have been depleted before unrestricted net position is applied.
30
RIVANNA SOLID WASTE AUTHORITY Notes to the Financial Statements As of June 30, 2015 and 2014 (Continued)
NOTE 2–SUMMARY OF SIGNIFICANT ACCOUNTING POLICIES: (CONTINUED)
M. Pensions For purposes of measuring the net pension liability, deferred outflows of resources and deferred inflows of resources related to pensions, and pension expense, information about the fiduciary net position of the Authority’s Retirement Plan and the additions to/deductions from the Authority’s Retirement Plan’s net fiduciary position have been determined on the same basis as they were reported by the Virginia Retirement System (VRS). For this purpose, benefit payments (including refunds of employee contributions) are recognized when due and payable in accordance with the benefit terms. Investments are reported at fair value.
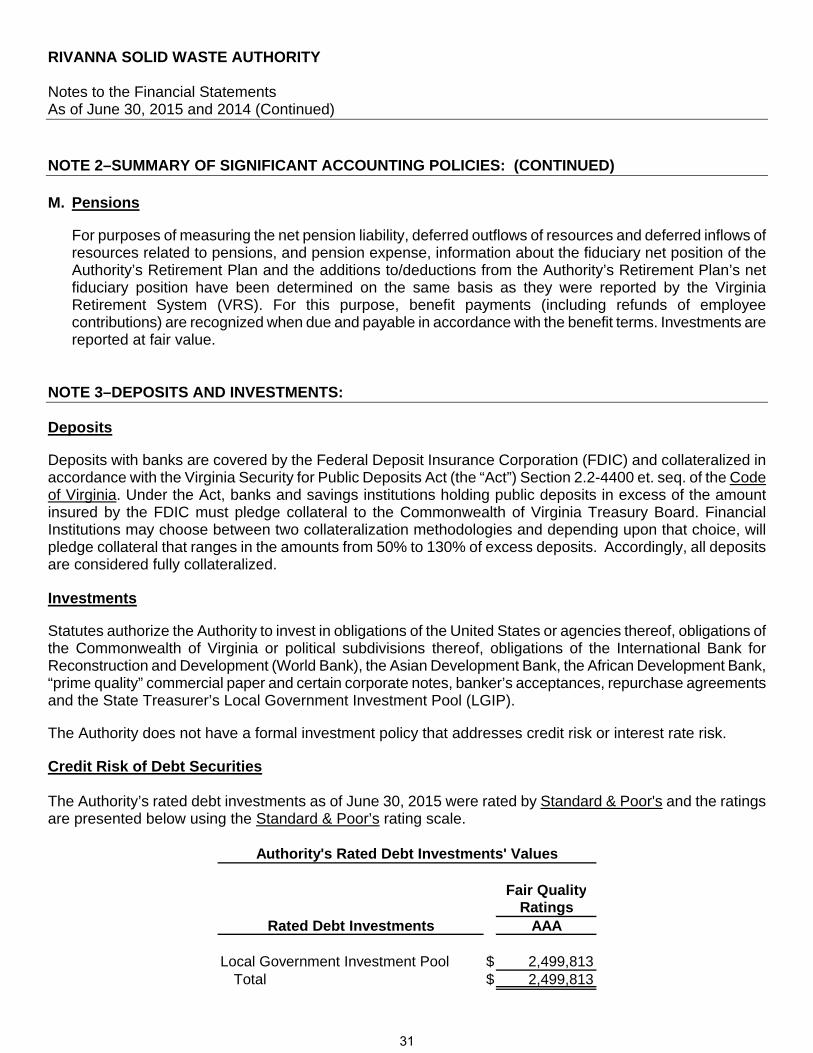
NOTE 3–DEPOSITS AND INVESTMENTS: Deposits Deposits with banks are covered by the Federal Deposit Insurance Corporation (FDIC) and collateralized in accordance with the Virginia Security for Public Deposits Act (the “Act”) Section 2.2-4400 et. seq. of the Code of Virginia. Under the Act, banks and savings institutions holding public deposits in excess of the amount insured by the FDIC must pledge collateral to the Commonwealth of Virginia Treasury Board. Financial Institutions may choose between two collateralization methodologies and depending upon that choice, will pledge collateral that ranges in the amounts from 50% to 130% of excess deposits. Accordingly, all deposits are considered fully collateralized. Investments Statutes authorize the Authority to invest in obligations of the United States or agencies thereof, obligations of the Commonwealth of Virginia or political subdivisions thereof, obligations of the International Bank for Reconstruction and Development (World Bank), the Asian Development Bank, the African Development Bank, “prime quality” commercial paper and certain corporate notes, banker’s acceptances, repurchase agreements and the State Treasurer’s Local Government Investment Pool (LGIP). The Authority does not have a formal investment policy that addresses credit risk or interest rate risk. Credit Risk of Debt Securities The Authority’s rated debt investments as of June 30, 2015 were rated by Standard & Poor's and the ratings are presented below using the Standard & Poor’s rating scale.
Fair Quality
Rated Debt Investments AAA
Local Government Investment Pool $ 2,499,813Total $ 2,499,813
Authority's Rated Debt Investments' Values
Ratings
31

RIVANNA SOLID WASTE AUTHORITY Notes to the Financial Statements As of June 30, 2015 and 2014 (Continued)
NOTE 3–DEPOSITS AND INVESTMENTS: (CONTINUED) External Investment Pools The fair value of the positions in the external investment pool, Local Government Investment Pool (LGIP), is the same as the value of the pool shares. As these pools are not SEC registered, regulatory oversight of the pool rests with the Virginia State Treasury. LGIP maintains a policy to operate in a manner consistent with SEC Rule 2a-7. NOTE 4–CAPITAL ASSETS: A summary of changes in capital assets for the year ended June 30, 2015 follows:
Balance BalanceJuly 1, June 30,2014 Increases Decreases 2015
Capital assets not being depreciated:
Land and Improvements $ 5,943,439 $ - $ - $ 5,943,439
Total capital assets not being depreciated $ 5,943,439 $ - $ - $ 5,943,439
Other Capital Assets:
Buildings & fixtures $ 633,248 $ - $ - $ 633,248 Accumulated depreciation (477,571) (15,001) - (492,572)
Landfill site 5,665,500 - - 5,665,500 Accumulated depreciation (5,665,500) - - (5,665,500)
Ivy Landfill equipment 1,643,458 8,844 7,000 1,645,302 Accumulated depreciation (1,539,984) (34,617) (7,000) (1,567,601)
Vehicles 450,986 71,775 - 522,761 Accumulated depreciation (450,985) (3,589) - (454,574)
Office equipment 16,736 - - 16,736 Accumulated depreciation (16,736) - - (16,736)
Paper facility equipment 270,771 - - 270,771 Accumulated depreciation (241,208) (13,432) - (254,640)
Other capital assets, net $ 288,715 $ 13,980 $ - $ 302,695
Capital assets, net $ 6,232,154 $ 13,980 $ - $ 6,246,134
32
RIVANNA SOLID WASTE AUTHORITY Notes to the Financial Statements As of June 30, 2015 and 2014 (Continued)
NOTE 4–CAPITAL ASSETS: (CONTINUED)
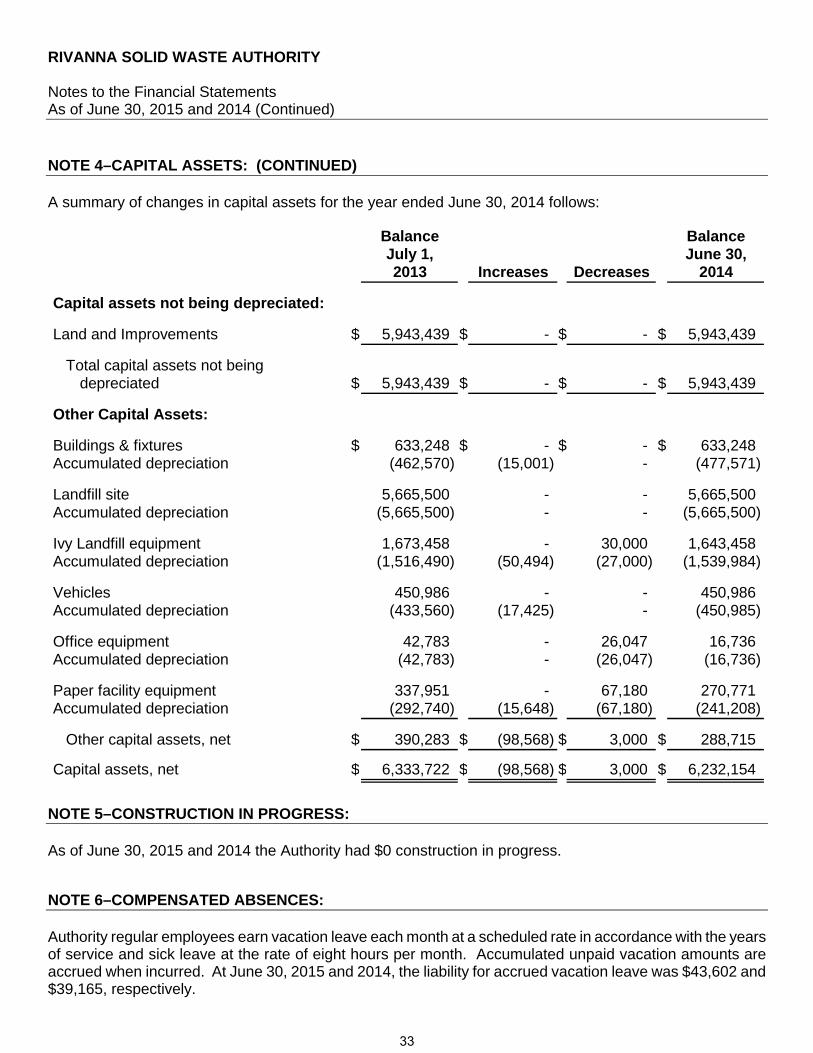
A summary of changes in capital assets for the year ended June 30, 2014 follows:
Balance BalanceJuly 1, June 30,2013 Increases Decreases 2014
Capital assets not being depreciated:
Land and Improvements $ 5,943,439 $ - $ - $ 5,943,439
Total capital assets not being depreciated $ 5,943,439 $ - $ - $ 5,943,439
Other Capital Assets:
Buildings & fixtures $ 633,248 $ - $ - $ 633,248 Accumulated depreciation (462,570) (15,001) - (477,571)
Landfill site 5,665,500 - - 5,665,500 Accumulated depreciation (5,665,500) - - (5,665,500)
Ivy Landfill equipment 1,673,458 - 30,000 1,643,458 Accumulated depreciation (1,516,490) (50,494) (27,000) (1,539,984)
Vehicles 450,986 - - 450,986 Accumulated depreciation (433,560) (17,425) - (450,985)
Office equipment 42,783 - 26,047 16,736 Accumulated depreciation (42,783) - (26,047) (16,736)
Paper facility equipment 337,951 - 67,180 270,771 Accumulated depreciation (292,740) (15,648) (67,180) (241,208)
Other capital assets, net $ 390,283 $ (98,568) $ 3,000 $ 288,715
Capital assets, net $ 6,333,722 $ (98,568) $ 3,000 $ 6,232,154
NOTE 5–CONSTRUCTION IN PROGRESS: As of June 30, 2015 and 2014 the Authority had $0 construction in progress.
NOTE 6–COMPENSATED ABSENCES: Authority regular employees earn vacation leave each month at a scheduled rate in accordance with the years of service and sick leave at the rate of eight hours per month. Accumulated unpaid vacation amounts are accrued when incurred. At June 30, 2015 and 2014, the liability for accrued vacation leave was $43,602 and $39,165, respectively.
33

RIVANNA SOLID WASTE AUTHORITY Notes to the Financial Statements As of June 30, 2015 and 2014 (Continued)
NOTE 7–PENSION PLAN:
Plan Description
Name of Plan: Virginia Retirement System (VRS) Identification of Plan: Agent Multiple-Employer Pension Plan Administering Entity: Virginia Retirement System
All full-time, salaried permanent employees of the Authority are automatically covered by VRS Retirement Plan upon employment. This plan is administered by the Virginia Retirement System (the System) along with plans for other employer groups in the Commonwealth of Virginia. Members earn one month of service credit for each month they are employed and for which they and their employer pay contributions to VRS. Members are eligible to purchase prior service, based on specific criteria as defined in the Code of Virginia, as amended. Eligible prior service that may be purchased includes prior public service, active military service, certain periods of leave, and previously refunded service.
The System administers three different benefit structures for covered employees – Plan 1, Plan 2, and, Hybrid. Each of these benefit structures has a different eligibility criteria. The specific information for each plan and the eligibility for covered groups within each plan are set out in the table below:
RETIREMENT PLAN PROVISIONS
PLAN 1 PLAN 2 HYBRID RETIREMENT PLAN
About Plan 1 Plan 1 is a defined benefit plan. The retirement benefit is based on a member’s age, creditable service and average final compensation at retirement using a formula. Employees are eligible for Plan 1 if their membership date is before July 1, 2010, and they were vested as of January 1, 2013.
About Plan 2 Plan 2 is a defined benefit plan. The retirement benefit is based on a member’s age, creditable service and average final compensation at retirement using a formula. Employees are eligible for Plan 2 if their membership date is on or after July 1, 2010, or their membership date is before July 1, 2010, and they were not vested as of January 1, 2013.
About the Hybrid Retirement Plan The Hybrid Retirement Plan combines the features of a defined benefit plan and a defined contribution plan. Most members hired on or after January 1, 2014 are in this plan, as well as Plan 1 and Plan 2 members who were eligible and opted into the plan during a special election window. (see “Eligible Members”)
• The defined benefit is based on a member’s age, creditable service and average final compensation at retirement using a formula.
• The benefit from the defined contribution component of the plan depends on the member and employer contributions made to the plan and the investment performance of those contributions.
34
RIVANNA SOLID WASTE AUTHORITY Notes to the Financial Statements As of June 30, 2015 and 2014 (Continued)
NOTE 7–PENSION PLAN: (CONTINUED) Plan Description (Continued)
RETIREMENT PLAN PROVISIONS (CONTINUED)
PLAN 1 PLAN 2 HYBRID RETIREMENT PLAN
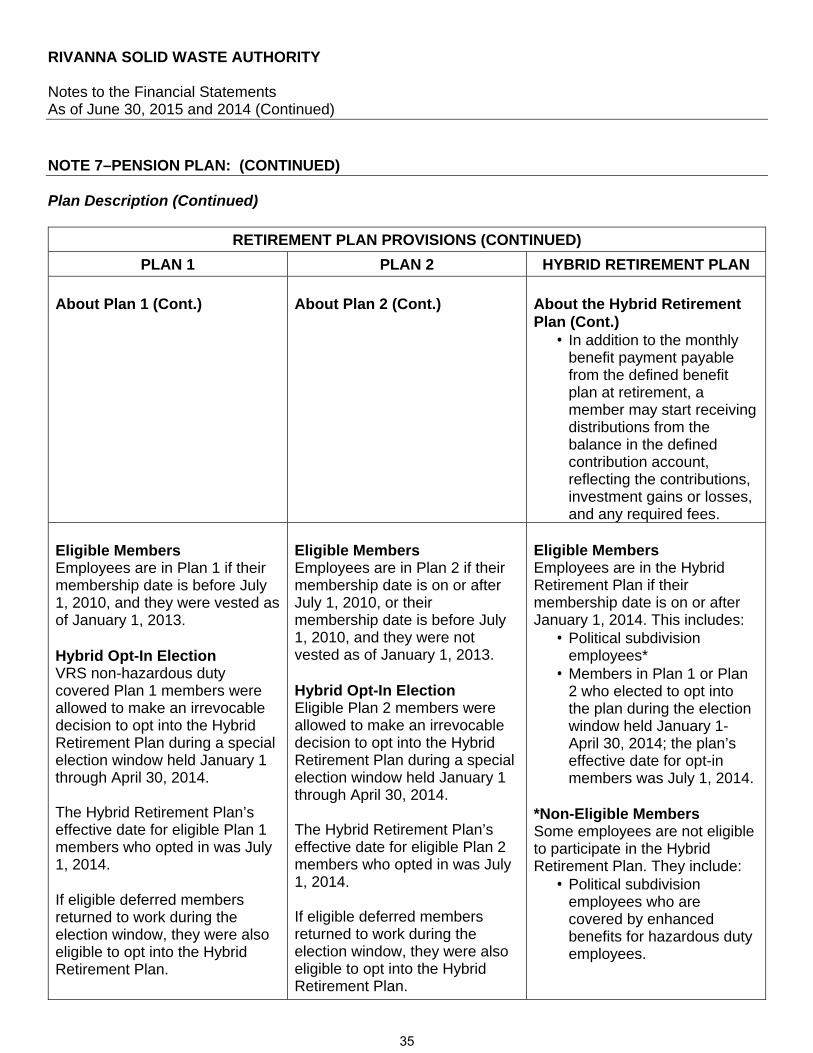
About Plan 1 (Cont.)
About Plan 2 (Cont.)
About the Hybrid Retirement Plan (Cont.)
• In addition to the monthly benefit payment payable from the defined benefit plan at retirement, a member may start receiving distributions from the balance in the defined contribution account, reflecting the contributions, investment gains or losses, and any required fees.
Eligible Members Employees are in Plan 1 if their membership date is before July 1, 2010, and they were vested as of January 1, 2013. Hybrid Opt-In Election VRS non-hazardous duty covered Plan 1 members were allowed to make an irrevocable decision to opt into the Hybrid Retirement Plan during a special election window held January 1 through April 30, 2014. The Hybrid Retirement Plan’s effective date for eligible Plan 1 members who opted in was July 1, 2014. If eligible deferred members returned to work during the election window, they were also eligible to opt into the Hybrid Retirement Plan.
Eligible Members Employees are in Plan 2 if their membership date is on or after July 1, 2010, or their membership date is before July 1, 2010, and they were not vested as of January 1, 2013. Hybrid Opt-In Election Eligible Plan 2 members were allowed to make an irrevocable decision to opt into the Hybrid Retirement Plan during a special election window held January 1 through April 30, 2014. The Hybrid Retirement Plan’s effective date for eligible Plan 2 members who opted in was July 1, 2014. If eligible deferred members returned to work during the election window, they were also eligible to opt into the Hybrid Retirement Plan.
Eligible Members Employees are in the Hybrid Retirement Plan if their membership date is on or after January 1, 2014. This includes:
• Political subdivision employees*
• Members in Plan 1 or Plan 2 who elected to opt into the plan during the election window held January 1-April 30, 2014; the plan’s effective date for opt-in members was July 1, 2014.
*Non-Eligible Members Some employees are not eligible to participate in the Hybrid Retirement Plan. They include:
• Political subdivision employees who are covered by enhanced benefits for hazardous duty employees.
35
RIVANNA SOLID WASTE AUTHORITY Notes to the Financial Statements As of June 30, 2015 and 2014 (Continued)
NOTE 7–PENSION PLAN: (CONTINUED) Plan Description (Continued)
RETIREMENT PLAN PROVISIONS (CONTINUED)
PLAN 1 PLAN 2 HYBRID RETIREMENT PLAN
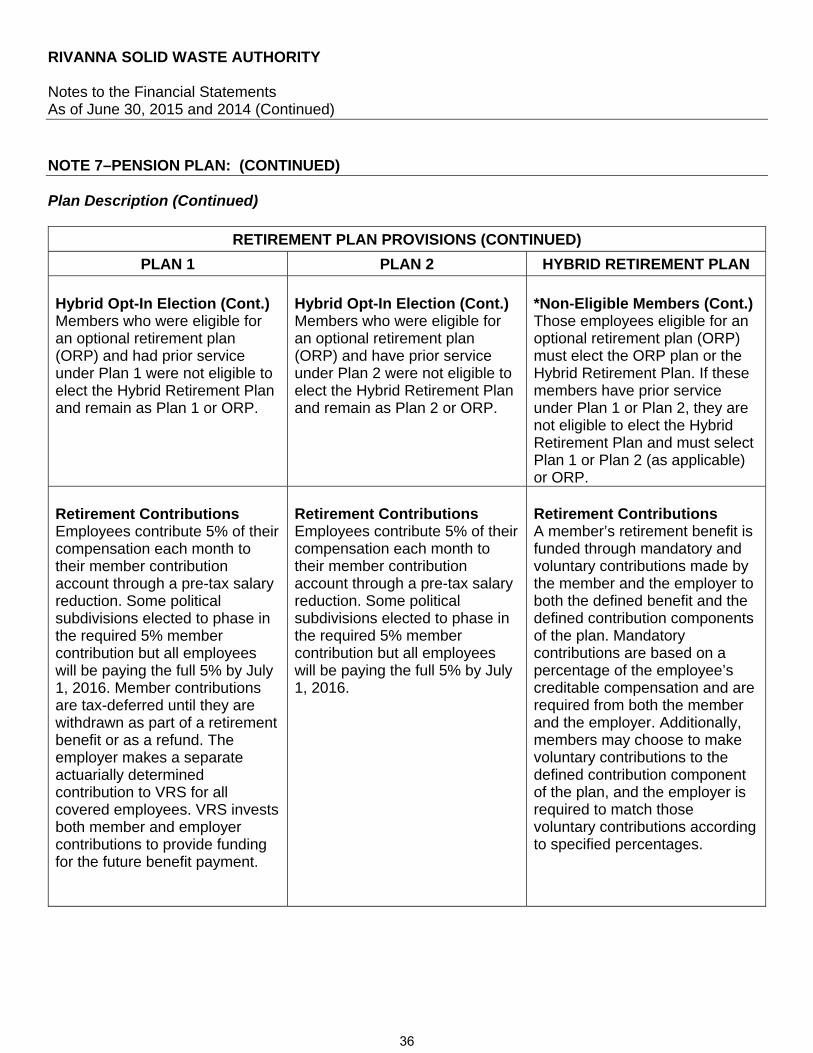
Hybrid Opt-In Election (Cont.) Members who were eligible for an optional retirement plan (ORP) and had prior service under Plan 1 were not eligible to elect the Hybrid Retirement Plan and remain as Plan 1 or ORP.
Hybrid Opt-In Election (Cont.) Members who were eligible for an optional retirement plan (ORP) and have prior service under Plan 2 were not eligible to elect the Hybrid Retirement Plan and remain as Plan 2 or ORP.
*Non-Eligible Members (Cont.) Those employees eligible for an optional retirement plan (ORP) must elect the ORP plan or the Hybrid Retirement Plan. If these members have prior service under Plan 1 or Plan 2, they are not eligible to elect the Hybrid Retirement Plan and must select Plan 1 or Plan 2 (as applicable) or ORP.
Retirement Contributions Employees contribute 5% of their compensation each month to their member contribution account through a pre-tax salary reduction. Some political subdivisions elected to phase in the required 5% member contribution but all employees will be paying the full 5% by July 1, 2016. Member contributions are tax-deferred until they are withdrawn as part of a retirement benefit or as a refund. The employer makes a separate actuarially determined contribution to VRS for all covered employees. VRS invests both member and employer contributions to provide funding for the future benefit payment.
Retirement Contributions Employees contribute 5% of their compensation each month to their member contribution account through a pre-tax salary reduction. Some political subdivisions elected to phase in the required 5% member contribution but all employees will be paying the full 5% by July 1, 2016.
Retirement Contributions A member’s retirement benefit is funded through mandatory and voluntary contributions made by the member and the employer to both the defined benefit and the defined contribution components of the plan. Mandatory contributions are based on a percentage of the employee’s creditable compensation and are required from both the member and the employer. Additionally, members may choose to make voluntary contributions to the defined contribution component of the plan, and the employer is required to match those voluntary contributions according to specified percentages.
36
RIVANNA SOLID WASTE AUTHORITY Notes to the Financial Statements As of June 30, 2015 and 2014 (Continued)
NOTE 7–PENSION PLAN: (CONTINUED) Plan Description (Continued)
RETIREMENT PLAN PROVISIONS (CONTINUED)
PLAN 1 PLAN 2 HYBRID RETIREMENT PLAN
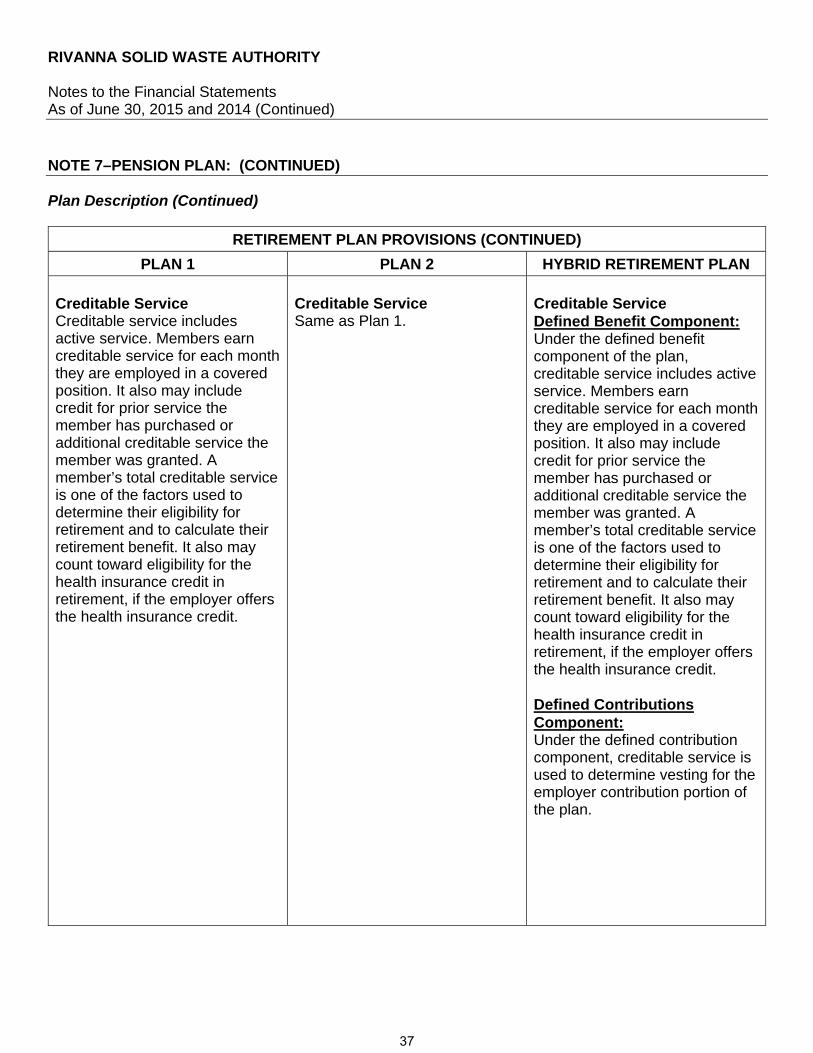
Creditable Service Creditable service includes active service. Members earn creditable service for each month they are employed in a covered position. It also may include credit for prior service the member has purchased or additional creditable service the member was granted. A member’s total creditable service is one of the factors used to determine their eligibility for retirement and to calculate their retirement benefit. It also may count toward eligibility for the health insurance credit in retirement, if the employer offers the health insurance credit.
Creditable Service Same as Plan 1.
Creditable Service Defined Benefit Component: Under the defined benefit component of the plan, creditable service includes active service. Members earn creditable service for each month they are employed in a covered position. It also may include credit for prior service the member has purchased or additional creditable service the member was granted. A member’s total creditable service is one of the factors used to determine their eligibility for retirement and to calculate their retirement benefit. It also may count toward eligibility for the health insurance credit in retirement, if the employer offers the health insurance credit. Defined Contributions Component: Under the defined contribution component, creditable service is used to determine vesting for the employer contribution portion of the plan.
37

RIVANNA SOLID WASTE AUTHORITY Notes to the Financial Statements As of June 30, 2015 and 2014 (Continued)
NOTE 7–PENSION PLAN: (CONTINUED) Plan Description (Continued)
RETIREMENT PLAN PROVISIONS (CONTINUED)
PLAN 1 PLAN 2 HYBRID RETIREMENT PLAN
Vesting Vesting is the minimum length of service a member needs to qualify for a future retirement benefit. Members become vested when they have at least five years (60 months) of creditable service. Vesting means members are eligible to qualify for retirement if they meet the age and service requirements for their plan. Members also must be vested to receive a full refund of their member contribution account balance if they leave employment and request a refund. Members are always 100% vested in the contributions that they make.
Vesting Same as Plan 1.
Vesting Defined Benefit Component: Defined benefit vesting is the minimum length of service a member needs to qualify for a future retirement benefit. Members are vested under the defined benefit component of the Hybrid Retirement Plan when they reach five years (60 months) of creditable service. Plan 1 or Plan 2 members with at least five years (60 months) of creditable service who opted into the Hybrid Retirement Plan remain vested in the defined benefit component. Defined Contributions Component: Defined contribution vesting refers to the minimum length of service a member needs to be eligible to withdraw the employer contributions from the defined contribution component of the plan. Members are always 100% vested in the contributions that they make.
38
RIVANNA SOLID WASTE AUTHORITY Notes to the Financial Statements As of June 30, 2015 and 2014 (Continued)
NOTE 7–PENSION PLAN: (CONTINUED) Plan Description (Continued)
RETIREMENT PLAN PROVISIONS (CONTINUED)
PLAN 1 PLAN 2 HYBRID RETIREMENT PLAN
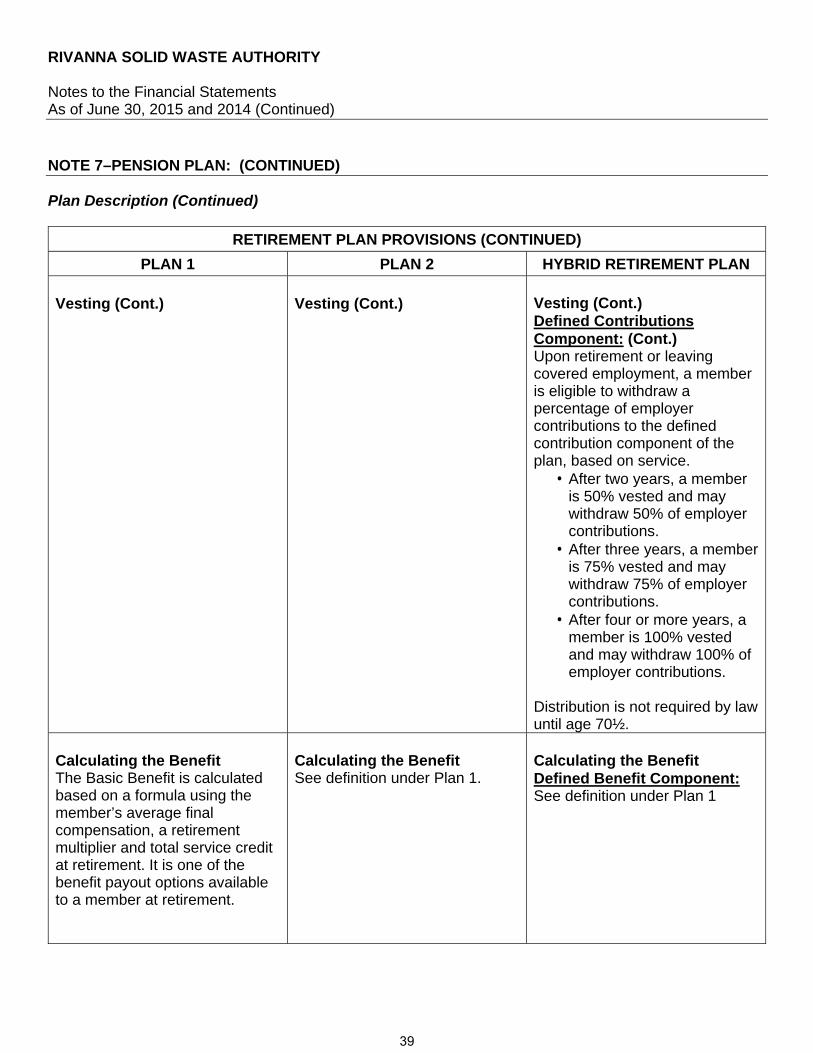
Vesting (Cont.)
Vesting (Cont.)
Vesting (Cont.) Defined Contributions Component: (Cont.) Upon retirement or leaving covered employment, a member is eligible to withdraw a percentage of employer contributions to the defined contribution component of the plan, based on service.
• After two years, a member is 50% vested and may withdraw 50% of employer contributions.
• After three years, a member is 75% vested and may withdraw 75% of employer contributions.
• After four or more years, a member is 100% vested and may withdraw 100% of employer contributions.
Distribution is not required by law until age 70½.
Calculating the Benefit The Basic Benefit is calculated based on a formula using the member’s average final compensation, a retirement multiplier and total service credit at retirement. It is one of the benefit payout options available to a member at retirement.
Calculating the Benefit See definition under Plan 1.
Calculating the Benefit Defined Benefit Component: See definition under Plan 1
39
RIVANNA SOLID WASTE AUTHORITY Notes to the Financial Statements As of June 30, 2015 and 2014 (Continued)
NOTE 7–PENSION PLAN: (CONTINUED)
Plan Description (Continued)
RETIREMENT PLAN PROVISIONS (CONTINUED)
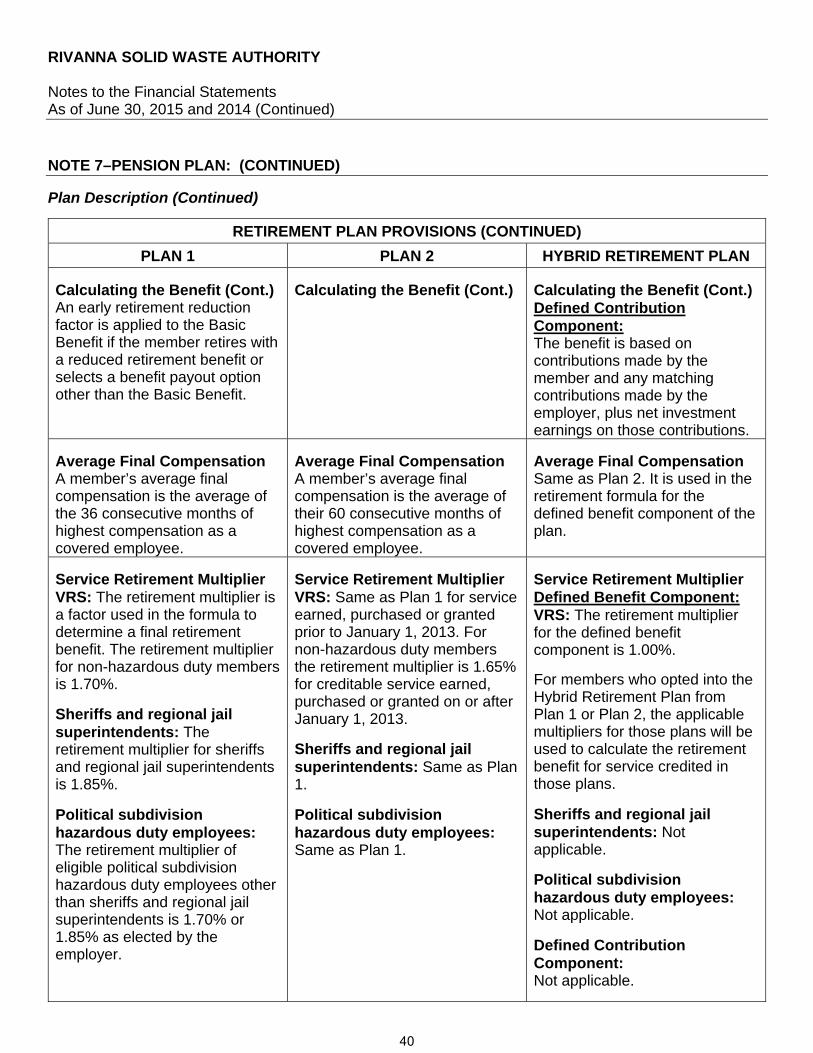
PLAN 1 PLAN 2 HYBRID RETIREMENT PLAN
Calculating the Benefit (Cont.) An early retirement reduction factor is applied to the Basic Benefit if the member retires with a reduced retirement benefit or selects a benefit payout option other than the Basic Benefit.
Calculating the Benefit (Cont.)
Calculating the Benefit (Cont.) Defined Contribution Component: The benefit is based on contributions made by the member and any matching contributions made by the employer, plus net investment earnings on those contributions.
Average Final Compensation A member’s average final compensation is the average of the 36 consecutive months of highest compensation as a covered employee.
Average Final Compensation A member’s average final compensation is the average of their 60 consecutive months of highest compensation as a covered employee.
Average Final Compensation Same as Plan 2. It is used in the retirement formula for the defined benefit component of the plan.
Service Retirement Multiplier VRS: The retirement multiplier is a factor used in the formula to determine a final retirement benefit. The retirement multiplier for non-hazardous duty members is 1.70%.
Sheriffs and regional jail superintendents: The retirement multiplier for sheriffs and regional jail superintendents is 1.85%.
Political subdivision hazardous duty employees: The retirement multiplier of eligible political subdivision hazardous duty employees other than sheriffs and regional jail superintendents is 1.70% or 1.85% as elected by the employer.
Service Retirement Multiplier VRS: Same as Plan 1 for service earned, purchased or granted prior to January 1, 2013. For non-hazardous duty members the retirement multiplier is 1.65% for creditable service earned, purchased or granted on or after January 1, 2013.
Sheriffs and regional jail superintendents: Same as Plan 1.
Political subdivision hazardous duty employees: Same as Plan 1.
Service Retirement Multiplier Defined Benefit Component: VRS: The retirement multiplier for the defined benefit component is 1.00%.
For members who opted into the Hybrid Retirement Plan from Plan 1 or Plan 2, the applicable multipliers for those plans will be used to calculate the retirement benefit for service credited in those plans.
Sheriffs and regional jail superintendents: Not applicable.
Political subdivision hazardous duty employees: Not applicable.
Defined Contribution Component: Not applicable.
40
RIVANNA SOLID WASTE AUTHORITY Notes to the Financial Statements As of June 30, 2015 and 2014 (Continued)
NOTE 7–PENSION PLAN: (CONTINUED) Plan Description (Continued)
RETIREMENT PLAN PROVISIONS (CONTINUED)
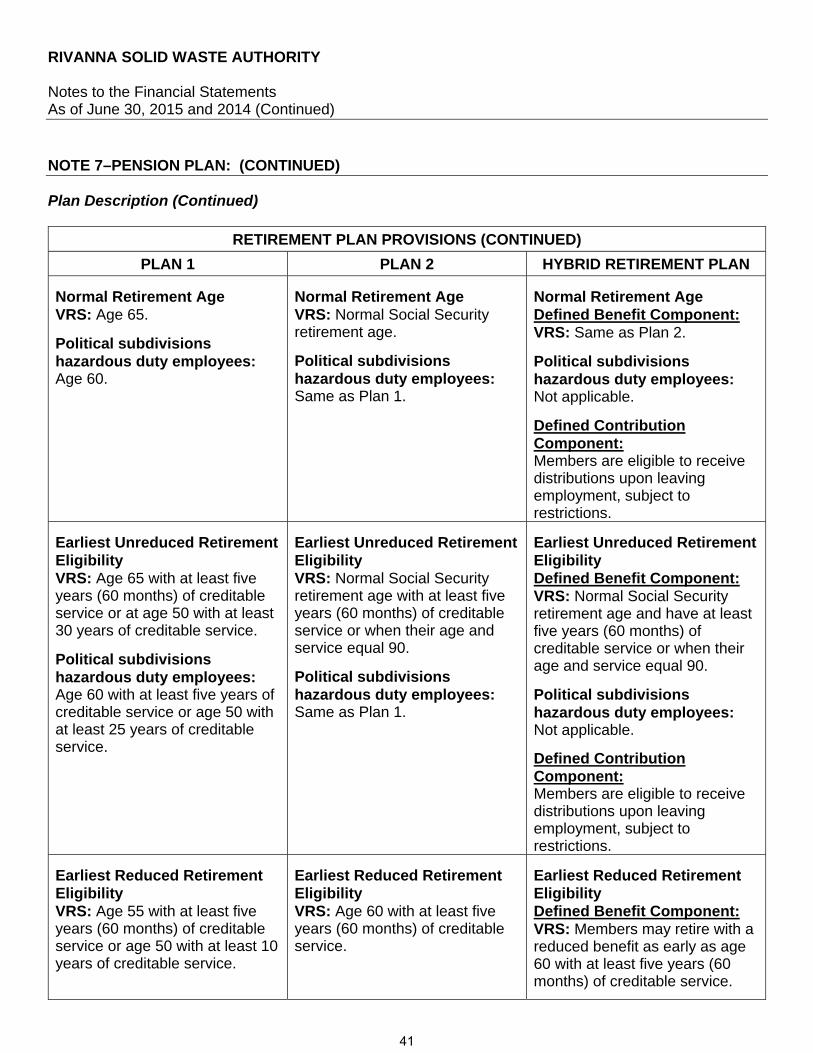
PLAN 1 PLAN 2 HYBRID RETIREMENT PLAN
Normal Retirement Age VRS: Age 65.
Political subdivisions hazardous duty employees: Age 60.
Normal Retirement Age VRS: Normal Social Security retirement age.
Political subdivisions hazardous duty employees: Same as Plan 1.
Normal Retirement Age Defined Benefit Component: VRS: Same as Plan 2.
Political subdivisions hazardous duty employees: Not applicable.
Defined Contribution Component: Members are eligible to receive distributions upon leaving employment, subject to restrictions.
Earliest Unreduced Retirement Eligibility VRS: Age 65 with at least five years (60 months) of creditable service or at age 50 with at least 30 years of creditable service.
Political subdivisions hazardous duty employees: Age 60 with at least five years of creditable service or age 50 with at least 25 years of creditable service.
Earliest Unreduced Retirement Eligibility VRS: Normal Social Security retirement age with at least five years (60 months) of creditable service or when their age and service equal 90.
Political subdivisions hazardous duty employees: Same as Plan 1.
Earliest Unreduced Retirement Eligibility Defined Benefit Component: VRS: Normal Social Security retirement age and have at least five years (60 months) of creditable service or when their age and service equal 90.
Political subdivisions hazardous duty employees: Not applicable.
Defined Contribution Component: Members are eligible to receive distributions upon leaving employment, subject to restrictions.
Earliest Reduced Retirement Eligibility VRS: Age 55 with at least five years (60 months) of creditable service or age 50 with at least 10 years of creditable service.
Earliest Reduced Retirement Eligibility VRS: Age 60 with at least five years (60 months) of creditable service.
Earliest Reduced Retirement Eligibility Defined Benefit Component: VRS: Members may retire with a reduced benefit as early as age 60 with at least five years (60 months) of creditable service.
41
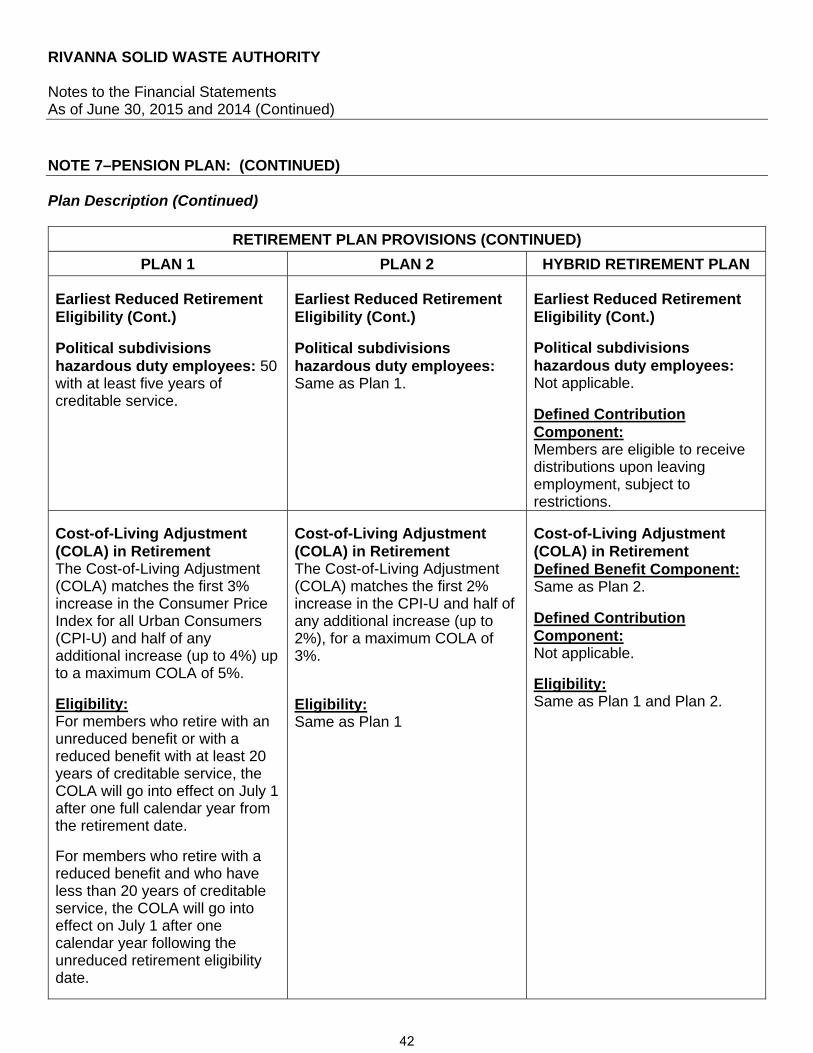
RIVANNA SOLID WASTE AUTHORITY Notes to the Financial Statements As of June 30, 2015 and 2014 (Continued)
NOTE 7–PENSION PLAN: (CONTINUED) Plan Description (Continued)
RETIREMENT PLAN PROVISIONS (CONTINUED)
PLAN 1 PLAN 2 HYBRID RETIREMENT PLAN
Earliest Reduced Retirement Eligibility (Cont.)
Political subdivisions hazardous duty employees: 50 with at least five years of creditable service.
Earliest Reduced Retirement Eligibility (Cont.)
Political subdivisions hazardous duty employees: Same as Plan 1.
Earliest Reduced Retirement Eligibility (Cont.)
Political subdivisions hazardous duty employees: Not applicable.
Defined Contribution Component: Members are eligible to receive distributions upon leaving employment, subject to restrictions.
Cost-of-Living Adjustment (COLA) in Retirement The Cost-of-Living Adjustment (COLA) matches the first 3% increase in the Consumer Price Index for all Urban Consumers (CPI-U) and half of any additional increase (up to 4%) up to a maximum COLA of 5%.
Eligibility: For members who retire with an unreduced benefit or with a reduced benefit with at least 20 years of creditable service, the COLA will go into effect on July 1 after one full calendar year from the retirement date.
For members who retire with a reduced benefit and who have less than 20 years of creditable service, the COLA will go into effect on July 1 after one calendar year following the unreduced retirement eligibility date.
Cost-of-Living Adjustment (COLA) in Retirement The Cost-of-Living Adjustment (COLA) matches the first 2% increase in the CPI-U and half of any additional increase (up to 2%), for a maximum COLA of 3%.
Eligibility: Same as Plan 1
Cost-of-Living Adjustment (COLA) in Retirement Defined Benefit Component: Same as Plan 2.
Defined Contribution Component: Not applicable.
Eligibility: Same as Plan 1 and Plan 2.
42
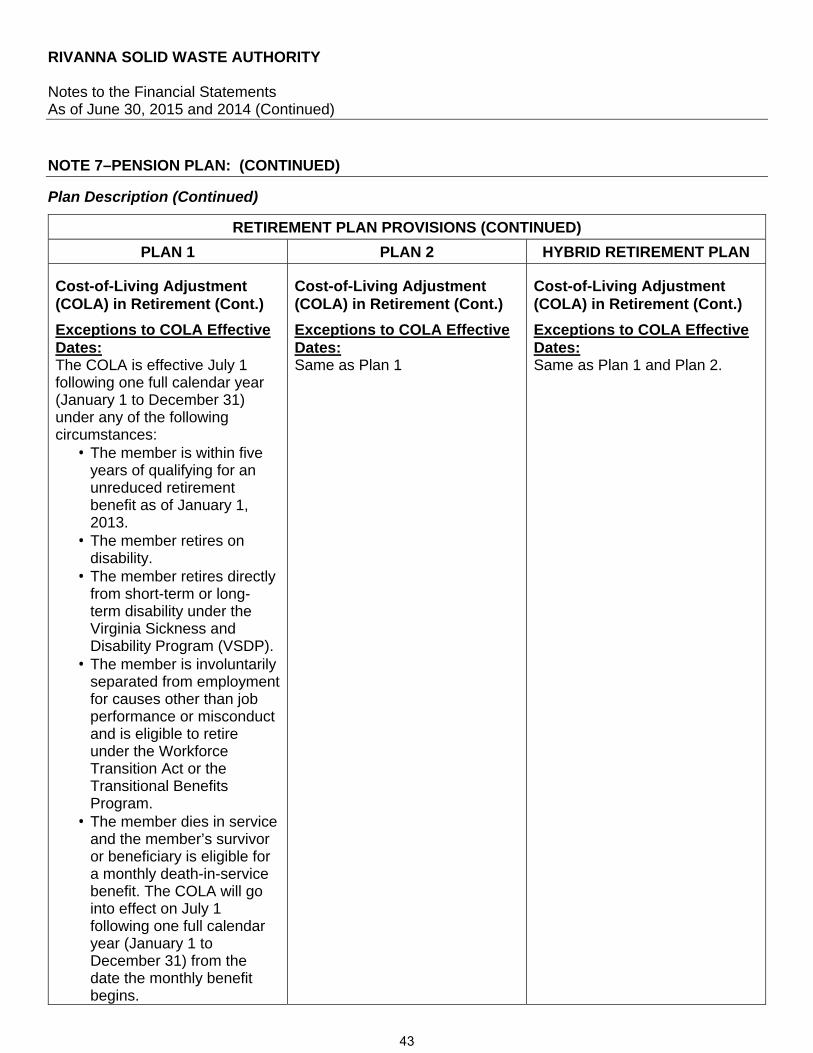
RIVANNA SOLID WASTE AUTHORITY Notes to the Financial Statements As of June 30, 2015 and 2014 (Continued)
NOTE 7–PENSION PLAN: (CONTINUED)
Plan Description (Continued)
RETIREMENT PLAN PROVISIONS (CONTINUED)
PLAN 1 PLAN 2 HYBRID RETIREMENT PLAN
Cost-of-Living Adjustment (COLA) in Retirement (Cont.)
Exceptions to COLA Effective Dates: The COLA is effective July 1 following one full calendar year (January 1 to December 31) under any of the following circumstances:
• The member is within five years of qualifying for an unreduced retirement benefit as of January 1, 2013.
• The member retires on disability.
• The member retires directly from short-term or long-term disability under the Virginia Sickness and Disability Program (VSDP).
• The member is involuntarily separated from employment for causes other than job performance or misconduct and is eligible to retire under the Workforce Transition Act or the Transitional Benefits Program.
• The member dies in service and the member’s survivor or beneficiary is eligible for a monthly death-in-service benefit. The COLA will go into effect on July 1 following one full calendar year (January 1 to December 31) from the date the monthly benefit begins.
Cost-of-Living Adjustment (COLA) in Retirement (Cont.)
Exceptions to COLA Effective Dates: Same as Plan 1
Cost-of-Living Adjustment (COLA) in Retirement (Cont.)
Exceptions to COLA Effective Dates: Same as Plan 1 and Plan 2.
43
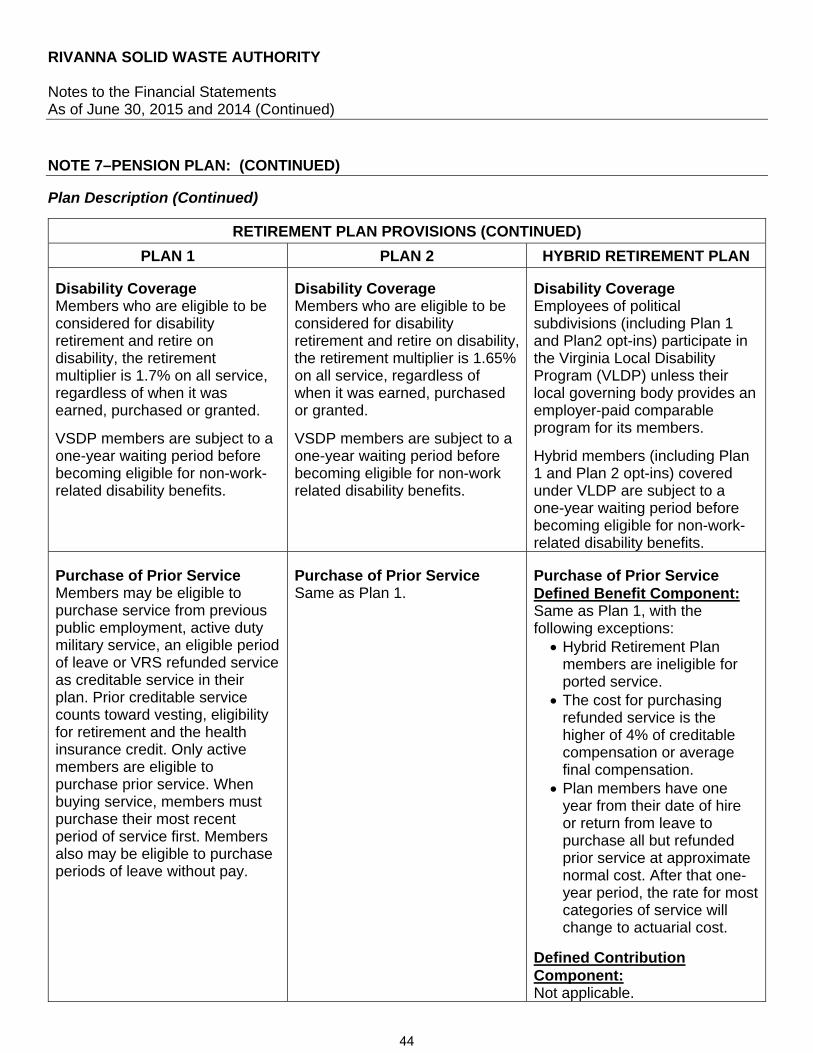
RIVANNA SOLID WASTE AUTHORITY Notes to the Financial Statements As of June 30, 2015 and 2014 (Continued)
NOTE 7–PENSION PLAN: (CONTINUED)
Plan Description (Continued)
RETIREMENT PLAN PROVISIONS (CONTINUED)
PLAN 1 PLAN 2 HYBRID RETIREMENT PLAN
Disability Coverage Members who are eligible to be considered for disability retirement and retire on disability, the retirement multiplier is 1.7% on all service, regardless of when it was earned, purchased or granted.
VSDP members are subject to a one-year waiting period before becoming eligible for non-work-related disability benefits.
Disability Coverage Members who are eligible to be considered for disability retirement and retire on disability, the retirement multiplier is 1.65% on all service, regardless of when it was earned, purchased or granted.
VSDP members are subject to a one-year waiting period before becoming eligible for non-work related disability benefits.
Disability Coverage Employees of political subdivisions (including Plan 1 and Plan2 opt-ins) participate in the Virginia Local Disability Program (VLDP) unless their local governing body provides an employer-paid comparable program for its members.
Hybrid members (including Plan 1 and Plan 2 opt-ins) covered under VLDP are subject to a one-year waiting period before becoming eligible for non-work-related disability benefits.
Purchase of Prior Service Members may be eligible to purchase service from previous public employment, active duty military service, an eligible period of leave or VRS refunded service as creditable service in their plan. Prior creditable service counts toward vesting, eligibility for retirement and the health insurance credit. Only active members are eligible to purchase prior service. When buying service, members must purchase their most recent period of service first. Members also may be eligible to purchase periods of leave without pay.
Purchase of Prior Service Same as Plan 1.
Purchase of Prior Service Defined Benefit Component: Same as Plan 1, with the following exceptions:
Hybrid Retirement Plan members are ineligible for ported service.
The cost for purchasing refunded service is the higher of 4% of creditable compensation or average final compensation.
Plan members have one year from their date of hire or return from leave to purchase all but refunded prior service at approximate normal cost. After that one-year period, the rate for most categories of service will change to actuarial cost.
Defined Contribution Component: Not applicable.
44

RIVANNA SOLID WASTE AUTHORITY Notes to the Financial Statements As of June 30, 2015 and 2014 (Continued)
NOTE 7–PENSION PLAN: (CONTINUED)
Plan Description (Continued) The System issues a publicly available comprehensive annual financial report that includes financial statements and required supplementary information for plans administered by VRS. A copy of the most recent report may be obtained from the VRS website at http://www.varetire.org/Pdf/Publications/2014-annual-report.pdf or by writing to the System’s Chief Financial Officer at P.O. Box 2500, Richmond, VA, 23218-2500. Employees Covered by Benefit Terms
As of the June 30, 2013 actuarial valuation, the following employees were covered by the benefit terms of the pension plan:
Number
Inactive members or their beneficiaries currently receiving benefits 7
Inactive members:Vested inactive members 2
Non-vested inactive members 10
Inactive members active elsewhere in VRS 5
Total inactive members 17
Active members 13
Total covered employees 37
Contributions The contribution requirement for active employees is governed by §51.1-145 of the Code of Virginia, as amended, but may be impacted as a result of funding options provided to political subdivisions by the Virginia General Assembly. Employees are required to contribute 5.00% of their compensation toward their retirement. Prior to July 1, 2012, all or part of the 5.00% member contribution may have been assumed by the employer. Beginning July 1, 2012 new employees were required to pay the 5% member contribution. In addition, for existing employees, employers were required to begin making the employee pay the 5.00% member contribution. This could be phased in over a period of up to 5 years and the employer is required to provide a salary increase equal to the amount of the increase in the employee-paid member contribution. The Authority’s contractually required contribution rate for the year ended June 30, 2015 was 9.76% of covered employee compensation. This rate was based on an actuarially determined rate from an actuarial valuation as of June 30, 2013. This rate, when combined with employee contributions, was expected to finance the costs of benefits earned by employees during the year, with an additional amount to finance any unfunded accrued liability. Contributions to the pension plan from the Authority were $38,370 and $44,486 for the years ended June 30, 2015 and June 30, 2014, respectively.
45
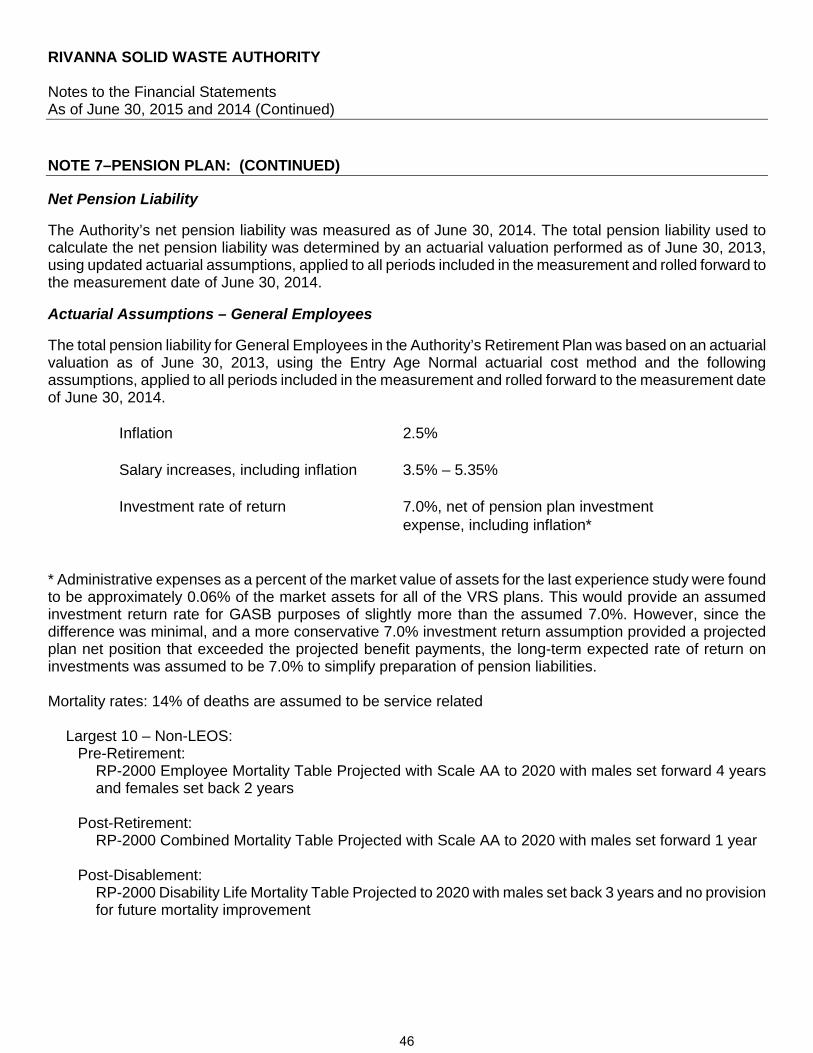
RIVANNA SOLID WASTE AUTHORITY Notes to the Financial Statements As of June 30, 2015 and 2014 (Continued)
NOTE 7–PENSION PLAN: (CONTINUED)
Net Pension Liability
The Authority’s net pension liability was measured as of June 30, 2014. The total pension liability used to calculate the net pension liability was determined by an actuarial valuation performed as of June 30, 2013, using updated actuarial assumptions, applied to all periods included in the measurement and rolled forward to the measurement date of June 30, 2014.
Actuarial Assumptions – General Employees
The total pension liability for General Employees in the Authority’s Retirement Plan was based on an actuarial valuation as of June 30, 2013, using the Entry Age Normal actuarial cost method and the following assumptions, applied to all periods included in the measurement and rolled forward to the measurement date of June 30, 2014.
Inflation 2.5%
Salary increases, including inflation 3.5% – 5.35%
Investment rate of return 7.0%, net of pension plan investmentexpense, including inflation*
* Administrative expenses as a percent of the market value of assets for the last experience study were found to be approximately 0.06% of the market assets for all of the VRS plans. This would provide an assumed investment return rate for GASB purposes of slightly more than the assumed 7.0%. However, since the difference was minimal, and a more conservative 7.0% investment return assumption provided a projected plan net position that exceeded the projected benefit payments, the long-term expected rate of return on investments was assumed to be 7.0% to simplify preparation of pension liabilities. Mortality rates: 14% of deaths are assumed to be service related
Largest 10 – Non-LEOS: Pre-Retirement:
RP-2000 Employee Mortality Table Projected with Scale AA to 2020 with males set forward 4 years and females set back 2 years
Post-Retirement: RP-2000 Combined Mortality Table Projected with Scale AA to 2020 with males set forward 1 year
Post-Disablement:
RP-2000 Disability Life Mortality Table Projected to 2020 with males set back 3 years and no provision for future mortality improvement
46

RIVANNA SOLID WASTE AUTHORITY Notes to the Financial Statements As of June 30, 2015 and 2014 (Continued)
NOTE 7–PENSION PLAN: (CONTINUED) Actuarial Assumptions – General Employees (Continued)
All Others (Non 10 Largest) – Non-LEOS:
Pre-Retirement: RP-2000 Employee Mortality Table Projected with Scale AA to 2020 with males set forward 4 years and females set back 2 years
Post-Retirement:
RP-2000 Combined Mortality Table Projected with Scale AA to 2020 with males set forward 1 year Post-Disablement:
RP-2000 Disability Life Mortality Table Projected to 2020 with males set back 3 years and no provision for future mortality improvement
The actuarial assumptions used in the June 30, 2013 valuation were based on the results of an actuarial experience study for the period from July 1, 2008 through June 30, 2012. Changes to the actuarial assumptions as a result of the experience study are as follows:
Largest 10 – Non-LEOS: - Update mortality table - Decrease in rates of service retirement
- Decrease in rates of disability retirement - Reduce rates of salary increase by 0.25% per year
All Others (Non 10 Largest) – Non-LEOS: - Update mortality table - Decrease in rates of service retirement - Decrease in rates of disability retirement - Reduce rates of salary increase by 0.25% per year
47
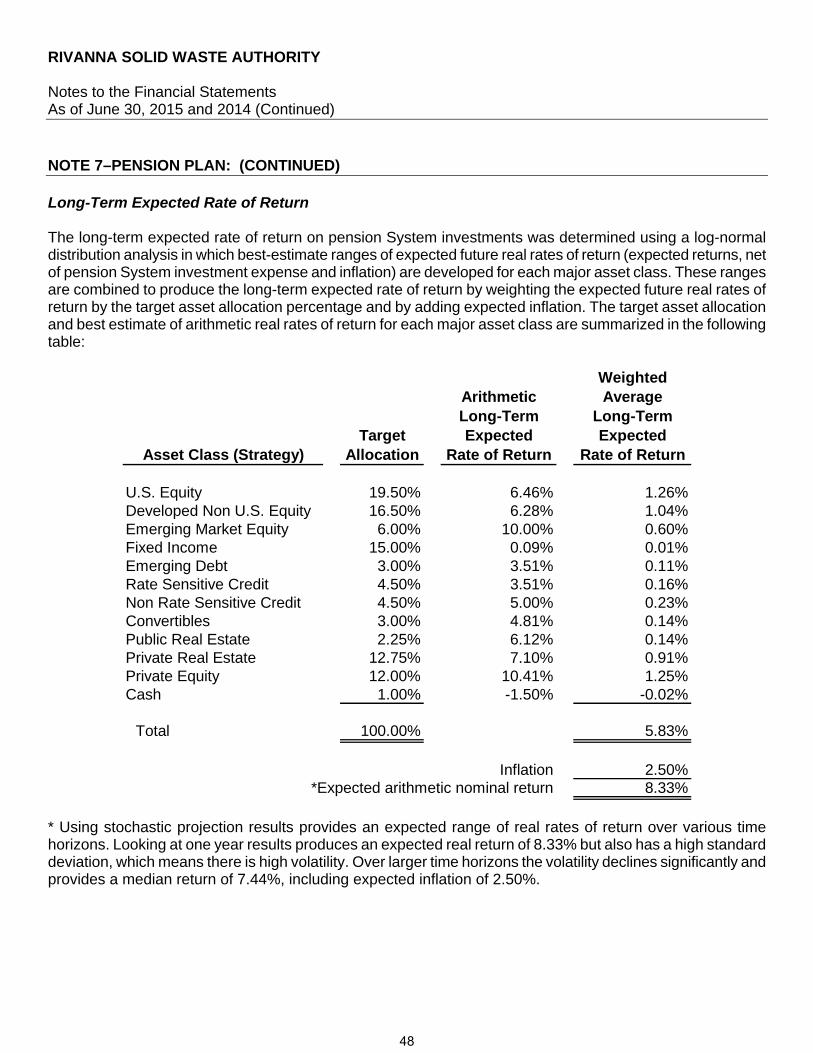
RIVANNA SOLID WASTE AUTHORITY Notes to the Financial Statements As of June 30, 2015 and 2014 (Continued)
NOTE 7–PENSION PLAN: (CONTINUED) Long-Term Expected Rate of Return The long-term expected rate of return on pension System investments was determined using a log-normal distribution analysis in which best-estimate ranges of expected future real rates of return (expected returns, net of pension System investment expense and inflation) are developed for each major asset class. These ranges are combined to produce the long-term expected rate of return by weighting the expected future real rates of return by the target asset allocation percentage and by adding expected inflation. The target asset allocation and best estimate of arithmetic real rates of return for each major asset class are summarized in the following table:
WeightedArithmetic AverageLong-Term Long-Term
Target Expected ExpectedAsset Class (Strategy) Allocation Rate of Return Rate of Return
U.S. Equity 19.50% 6.46% 1.26%Developed Non U.S. Equity 16.50% 6.28% 1.04%Emerging Market Equity 6.00% 10.00% 0.60%Fixed Income 15.00% 0.09% 0.01%Emerging Debt 3.00% 3.51% 0.11%Rate Sensitive Credit 4.50% 3.51% 0.16%Non Rate Sensitive Credit 4.50% 5.00% 0.23%Convertibles 3.00% 4.81% 0.14%Public Real Estate 2.25% 6.12% 0.14%Private Real Estate 12.75% 7.10% 0.91%Private Equity 12.00% 10.41% 1.25%Cash 1.00% -1.50% -0.02%
Total 100.00% 5.83%
Inflation 2.50%*Expected arithmetic nominal return 8.33%
* Using stochastic projection results provides an expected range of real rates of return over various time horizons. Looking at one year results produces an expected real return of 8.33% but also has a high standard deviation, which means there is high volatility. Over larger time horizons the volatility declines significantly and provides a median return of 7.44%, including expected inflation of 2.50%.
48
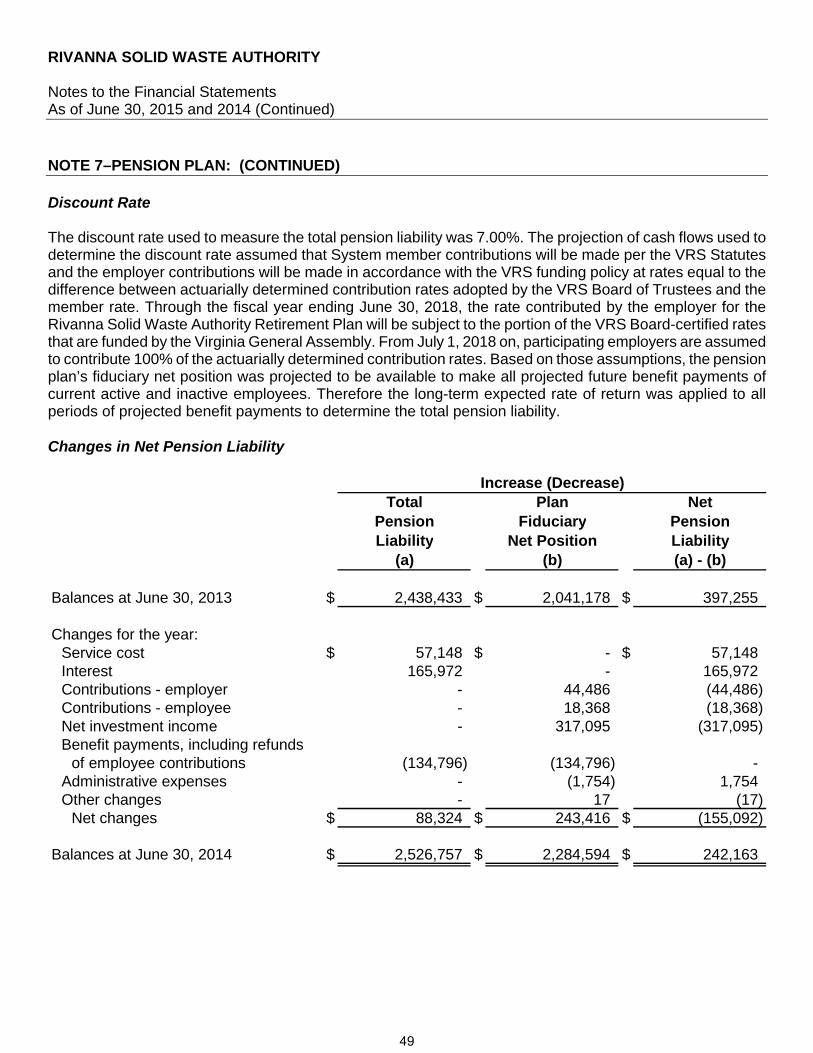
RIVANNA SOLID WASTE AUTHORITY Notes to the Financial Statements As of June 30, 2015 and 2014 (Continued)
NOTE 7–PENSION PLAN: (CONTINUED) Discount Rate The discount rate used to measure the total pension liability was 7.00%. The projection of cash flows used to determine the discount rate assumed that System member contributions will be made per the VRS Statutes and the employer contributions will be made in accordance with the VRS funding policy at rates equal to the difference between actuarially determined contribution rates adopted by the VRS Board of Trustees and the member rate. Through the fiscal year ending June 30, 2018, the rate contributed by the employer for the Rivanna Solid Waste Authority Retirement Plan will be subject to the portion of the VRS Board-certified rates that are funded by the Virginia General Assembly. From July 1, 2018 on, participating employers are assumed to contribute 100% of the actuarially determined contribution rates. Based on those assumptions, the pension plan’s fiduciary net position was projected to be available to make all projected future benefit payments of current active and inactive employees. Therefore the long-term expected rate of return was applied to all periods of projected benefit payments to determine the total pension liability. Changes in Net Pension Liability
Total Plan NetPension Fiduciary PensionLiability Net Position Liability
(a) (b) (a) - (b)
Balances at June 30, 2013 $ 2,438,433 $ 2,041,178 $ 397,255
Changes for the year:Service cost $ 57,148 $ - $ 57,148 Interest 165,972 - 165,972 Contributions - employer - 44,486 (44,486) Contributions - employee - 18,368 (18,368) Net investment income - 317,095 (317,095) Benefit payments, including refunds
of employee contributions (134,796) (134,796) - Administrative expenses - (1,754) 1,754 Other changes - 17 (17)
Net changes $ 88,324 $ 243,416 $ (155,092)
Balances at June 30, 2014 $ 2,526,757 $ 2,284,594 $ 242,163
Increase (Decrease)
49
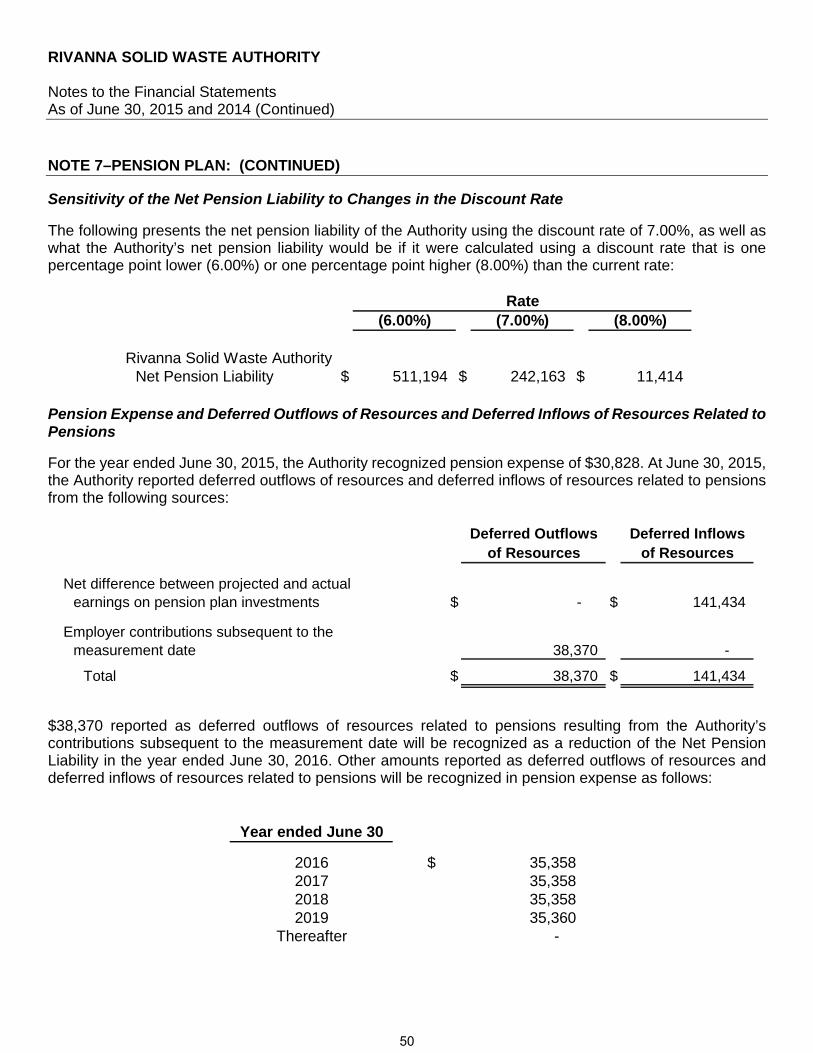
RIVANNA SOLID WASTE AUTHORITY Notes to the Financial Statements As of June 30, 2015 and 2014 (Continued)
NOTE 7–PENSION PLAN: (CONTINUED)
Sensitivity of the Net Pension Liability to Changes in the Discount Rate
The following presents the net pension liability of the Authority using the discount rate of 7.00%, as well as what the Authority’s net pension liability would be if it were calculated using a discount rate that is one percentage point lower (6.00%) or one percentage point higher (8.00%) than the current rate:
(6.00%) (7.00%) (8.00%)
Rivanna Solid Waste AuthorityNet Pension Liability $ 511,194 $ 242,163 $ 11,414
Rate
Pension Expense and Deferred Outflows of Resources and Deferred Inflows of Resources Related to Pensions
For the year ended June 30, 2015, the Authority recognized pension expense of $30,828. At June 30, 2015, the Authority reported deferred outflows of resources and deferred inflows of resources related to pensions from the following sources:
Deferred Outflows Deferred Inflowsof Resources of Resources
Net difference between projected and actualearnings on pension plan investments $ - $ 141,434
Employer contributions subsequent to themeasurement date 38,370 -
Total $ 38,370 $ 141,434
$38,370 reported as deferred outflows of resources related to pensions resulting from the Authority’s contributions subsequent to the measurement date will be recognized as a reduction of the Net Pension Liability in the year ended June 30, 2016. Other amounts reported as deferred outflows of resources and deferred inflows of resources related to pensions will be recognized in pension expense as follows:
Year ended June 30
2016 $ 35,358 2017 35,358 2018 35,358 2019 35,360
Thereafter -
50
RIVANNA SOLID WASTE AUTHORITY Notes to the Financial Statements As of June 30, 2015 and 2014 (Continued)
NOTE 8–CLOSURE AND POST-CLOSURE CARE COSTS: State and federal laws and regulations require the Authority to place a final cover on its Ivy landfill site when it stops accepting waste and to perform certain maintenance and monitoring functions at the site for thirty years after closure. Although the landfill has stopped operating as a landfill, the Authority must recognize the estimated costs of closure corrective action and post-closure care as a liability on the financial statements. As work is completed, the liability recognized by the Virginia Department of Environmental Quality is reduced. The Authority is implementing a corrective action plan to correct detected environmental issues at the landfill. The amount recorded as accrued corrective action costs is $3,571,359 at June 30, 2015. The $2,892,435 reported as post-closure monitoring liability at June 30, 2015 represents the cumulative amount reported to date based on the use of 100% of the currently permitted cells at the landfill. In addition to the costs reported for the Ivy landfill site, the Authority has accrued closure costs for the Ivy transfer station in the amount of $169,666. Total closure corrective action and post-closure care costs and post-closure monitoring costs accrued at June 30, 2015 are $6,633,460. The Authority will recognize any remaining costs of closure corrective action and post-closure care and post-closure monitoring as the closure is completed. These amounts are based on what it would cost to perform all closure and post-closure care in 2015. Actual costs may be higher due to inflation, changes in technology, or changes in regulations. The Authority is required by state and federal laws and regulations to meet certain financial assurance requirements. The Authority has opted to meet these requirements through agreements with the participating localities, County of Albemarle and City of Charlottesville. The agreement provides guarantees by the County of Albemarle in the amount of $4,107,534 and the City of Charlottesville in the amount of $2,260,735 for a total guarantee of $6,368,269. The Authority expects that future inflation costs will be paid from interest earned on the annual contributions. However, if interest earnings are inadequate or additional post-closure care requirements are determined (due to changes in technology or applicable laws or regulations, for example), these costs may need to be covered by charges to future landfill users or other sources. Additionally, the Authority has set aside a cash account restricted for payment of the transfer station closure costs in the amount of $169,666. On behalf of the Authority, the City of Charlottesville and the County of Albemarle demonstrate financial assurance requirements for closure, post-closure care, and corrective action costs through the submission of a Local Government Financial Test to the Virginia Department of Environmental Quality in accordance with section 9VAC-20-70 of the Virginia Administrative Code. NOTE 9–RISK MANAGEMENT: The Authority is exposed to various risks of loss related to torts; theft of, damage to and destruction of assets; errors and omissions; injuries to employees; and natural disasters. The Authority joined together with other local governments in the Commonwealth to form the Virginia Municipal Group Self Insurance Association, a public entity risk pool currently operating as a common risk management and insurance program for member governments. The Authority pays an annual premium to the pool for its workers compensation coverage. For property and liability insurance the Authority joined together with other local governments in the State to form the Virginia Association of Counties Group Self-Insurance Pool, a public entity risk pool. The Agreements for Formation of the associations provide that the associations will be self-sustaining through member premiums. Settled claims have not exceeded pool coverage in any of the past three fiscal years.
51

RIVANNA SOLID WASTE AUTHORITY Notes to the Financial Statements As of June 30, 2015 and 2014 (Continued)
NOTE 10–SUMMARY OF LONG-TERM OBLIGATIONS: The following is a summary of long-term obligations transactions for the year ended June 30, 2015:
(Restated)Balance BalanceJuly 1, June 30, Due Within2014 Additions Reductions 2015 One Year
Landfill closure/corrective action/postclosure costs $ 6,868,975 $ 60,436 $ 295,951 $ 6,633,460 $ 357,136
Net pension liability 397,255 224,857 379,949 242,163 - Net OPEB obligation 54,912 1,000 15,000 40,912 - Compensated absences 39,165 33,232 28,795 43,602 28,000
Totals $ 7,360,307 $ 319,525 $ 719,695 $ 6,960,137 $ 385,136
The following is a summary of long-term obligations transactions for the year ended June 30, 2014:
Balance BalanceJuly 1, June 30, Due Within2013 Additions Reductions 2014 One Year
Landfill closure/corrective action/postclosure costs $ 4,049,550 $ 3,223,873 $ 404,448 $ 6,868,975 $ 370,215
Net OPEB obligation 67,912 2,000 15,000 54,912 - Compensated absences 55,339 32,179 48,353 39,165 39,165
Totals $ 4,172,801 $ 3,258,052 $ 467,801 $ 6,963,052 $ 409,380
NOTE 11–OTHER POSTEMPLOYMENT BENEFITS−HEALTH INSURANCE:
Background In fiscal year 2010 the Authority implemented Governmental Accounting Standards Board (GASB) Statement No. 45 for other postemployment benefits (OPEB) offered to retirees. This standard addresses how governmental reporting entities should account for and report their costs related to postemployment healthcare and non-pension benefits, such as the Authority’s retiree health benefit. Historically, the Authority’s subsidy was funded on a pay-as-you-go basis, but GASB Statement No. 45 requires that the Authority accrue the cost of the retiree health subsidy and other postemployment benefits during the period of the employees’ active employment, while the benefits are being earned, and disclose the unfunded actuarial accrued liability in order to accurately account for the total future cost of postemployment benefits and the financial impact on the Authority. This funding methodology mirrors the funding approach used for pension benefits.
52
RIVANNA SOLID WASTE AUTHORITY Notes to the Financial Statements As of June 30, 2015 and 2014 (Continued)
NOTE 11–OTHER POSTEMPLOYMENT BENEFITS−HEALTH INSURANCE: (CONTINUED)
Plan Description In addition to the pension benefits described in Note 7, the Authority previously provided post-retirement healthcare benefits for employees who were eligible under a single-employer defined benefit plan. The plan and benefits have been terminated except for a closed group of retirees, who will continue to receive benefits under the previous plan policy. The Authority permitted retirees to participate and purchase medical benefits under the Authority’s existing plan for current employees. Retirees were responsible for the entire cost of the benefits. Benefits were available for a period of five years or until age 65, whichever came first. The OPEB Plan does not issue separate audited financial statements.
Eligible, employees must have met the age and service criteria for unreduced retirement benefits from VRS and been covered by the Authority’s group health plan for active employees at retirement or been eligible for reduced retirement benefits at age 50 and employed by the Authority in a benefits-eligible position for 10 years. Funding Policy The retirees pay and participate in the same plan for medical benefits as current employees creating an implicit rate subsidy liability for the Authority. The Authority determines how the liability will be funded each year, whether it will partially or fully fund the liability. Eligibility under the plan ceases when retirees reach the age of 65. Participating dependents are also entitled to continue coverage under the plan after the death of the retiree.
Annual Required Contribution (ARC) The annual cost of other postemployment benefits (OPEB) under GASB 45 is called the annual required contribution or ARC. Based on an actuarial valuation dated July 1, 2014, the estimated pay-as-you-go cost for OPEB benefits is $1,000 for fiscal year 2015. The Authority has paid an estimated $15,000 towards this obligation during the fiscal year. The Authority is required to contribute the annual required contribution of the employer (ARC), an amount actuarially determined in accordance within the parameters of GASB Statement 45. The ARC represents a level of funding that, if paid on an ongoing basis, is projected to cover normal cost each year and amortize any unfunded actuarial liabilities (or funding excess) over a period of three years.
53
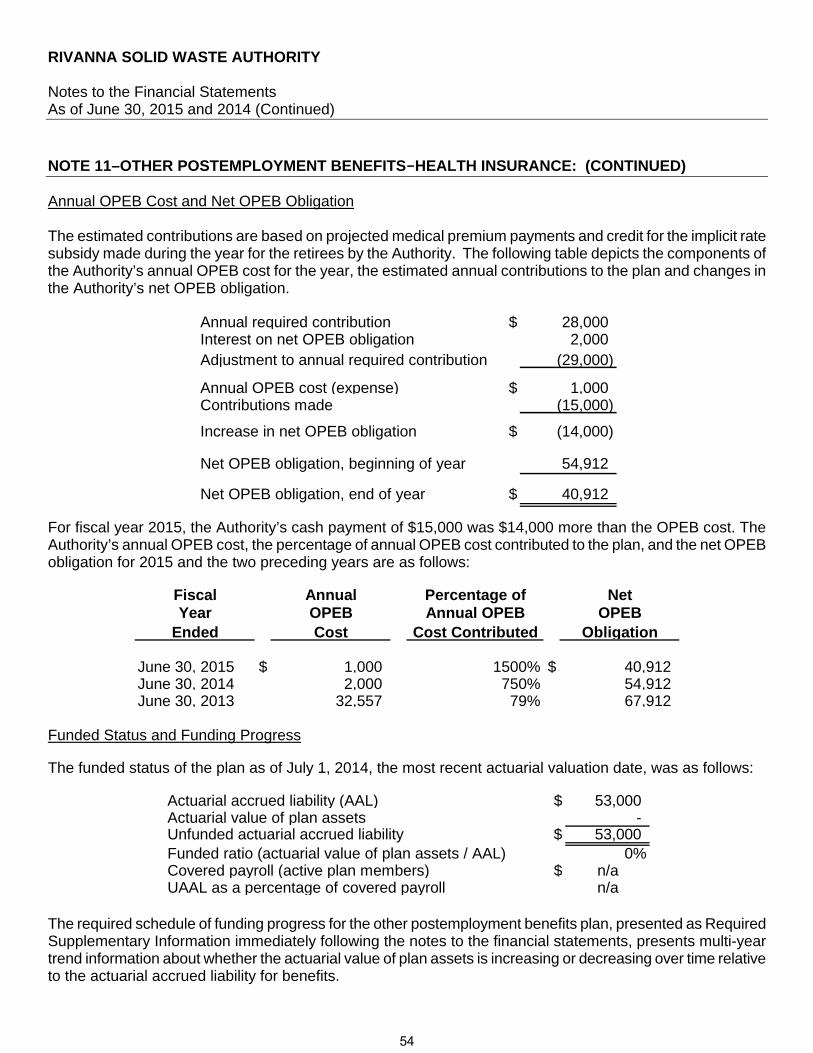
RIVANNA SOLID WASTE AUTHORITY Notes to the Financial Statements As of June 30, 2015 and 2014 (Continued)
NOTE 11–OTHER POSTEMPLOYMENT BENEFITS−HEALTH INSURANCE: (CONTINUED)
Annual OPEB Cost and Net OPEB Obligation The estimated contributions are based on projected medical premium payments and credit for the implicit rate subsidy made during the year for the retirees by the Authority. The following table depicts the components of the Authority’s annual OPEB cost for the year, the estimated annual contributions to the plan and changes in the Authority’s net OPEB obligation.
Annual required contribution $ 28,000 Interest on net OPEB obligation 2,000 Adjustment to annual required contribution (29,000)
Annual OPEB cost (expense) $ 1,000 Contributions made (15,000)
Increase in net OPEB obligation $ (14,000)
Net OPEB obligation, beginning of year 54,912
Net OPEB obligation, end of year $ 40,912
For fiscal year 2015, the Authority’s cash payment of $15,000 was $14,000 more than the OPEB cost. The Authority’s annual OPEB cost, the percentage of annual OPEB cost contributed to the plan, and the net OPEB obligation for 2015 and the two preceding years are as follows:
Fiscal Annual Percentage of NetYear OPEB Annual OPEB OPEB
Ended Cost Cost Contributed Obligation
June 30, 2015 $ 1,000 1500% $ 40,912 June 30, 2014 2,000 750% 54,912 June 30, 2013 32,557 79% 67,912
Funded Status and Funding Progress The funded status of the plan as of July 1, 2014, the most recent actuarial valuation date, was as follows:
Actuarial accrued liability (AAL) $ 53,000 Actuarial value of plan assets - Unfunded actuarial accrued liability $ 53,000 Funded ratio (actuarial value of plan assets / AAL) 0%Covered payroll (active plan members) $ n/aUAAL as a percentage of covered payroll n/a
The required schedule of funding progress for the other postemployment benefits plan, presented as Required Supplementary Information immediately following the notes to the financial statements, presents multi-year trend information about whether the actuarial value of plan assets is increasing or decreasing over time relative to the actuarial accrued liability for benefits.
54

RIVANNA SOLID WASTE AUTHORITY Notes to the Financial Statements As of June 30, 2015 and 2014 (Continued)
NOTE 11–OTHER POSTEMPLOYMENT BENEFITS−HEALTH INSURANCE: (CONTINUED)
Actuarial Methods and Assumptions Projections of benefits for financial reporting purposes are based on the substantive plan (the plan as understood by the employer and the plan members) and include the type of benefits provided at the time of each valuation and the historical pattern of sharing of benefit cost between the employer and plan members at that point. The actuarial method and assumptions used include techniques that are designed to reduce the effects of short-term volatility in actuarial accrued liabilities and the actuarial value of assets, consistent with the long-term perspective of the calculations. Actuarial valuations of an ongoing plan involve estimates of the value of reported amounts and assumptions about the probability of occurrence of events far into the future. Examples include assumptions about future employment, mortality, and the healthcare cost trend. Amounts determined regarding the funded status of the plan and the annual required contributions of the employer are subject to continual revisions as actual results are compared with past expectations and new estimates are made about the future. Cost Method The projected unit credit cost method was used to determine the plan’s funding liabilities with costs pro-rated to the date of benefit commencement. The valuation of the liabilities is based on a closed group, of retirees only. Under the projected unit credit cost method, the liability is projected from the date of the actuarial valuation to the expected end date of benefits. The liability is computed by measuring each unit benefit during the period of obligation. Assumptions Interest/Discount rate (unfunded) 4.00%Inflation rate 2.80%Amortization period 3 years - level percentage of projected payroll on a closed basisHealthcare cost trend rate 6.4% - 4.30%Payroll growth rate 3.00%
NOTE 12–RELATED PARTIES: Rivanna Solid Waste Authority (RSWA) and Rivanna Water and Sewer Authority (RWSA) share common office space and administrative staff. Procedures are in place to ensure proper segregation of funds, purchasing activity, personnel and similar matters. RSWA pays RWSA monthly for its share of joint administrative expenses, which totaled $265,000 in FY 2015 and $257,000 in FY 2014 and for leachate acceptance and treatment of $ 2,394 in FY 2015 and $1,322 in FY 2014. Rivanna Solid Waste Authority billed Rivanna Water & Sewer Authority $89,751 for hauling and tipping fees in FY 2015 and $63,258 in the previous year. RSWA owed RWSA $22,502 and $21,591 at June 30, 2015 and 2014, respectively.
55
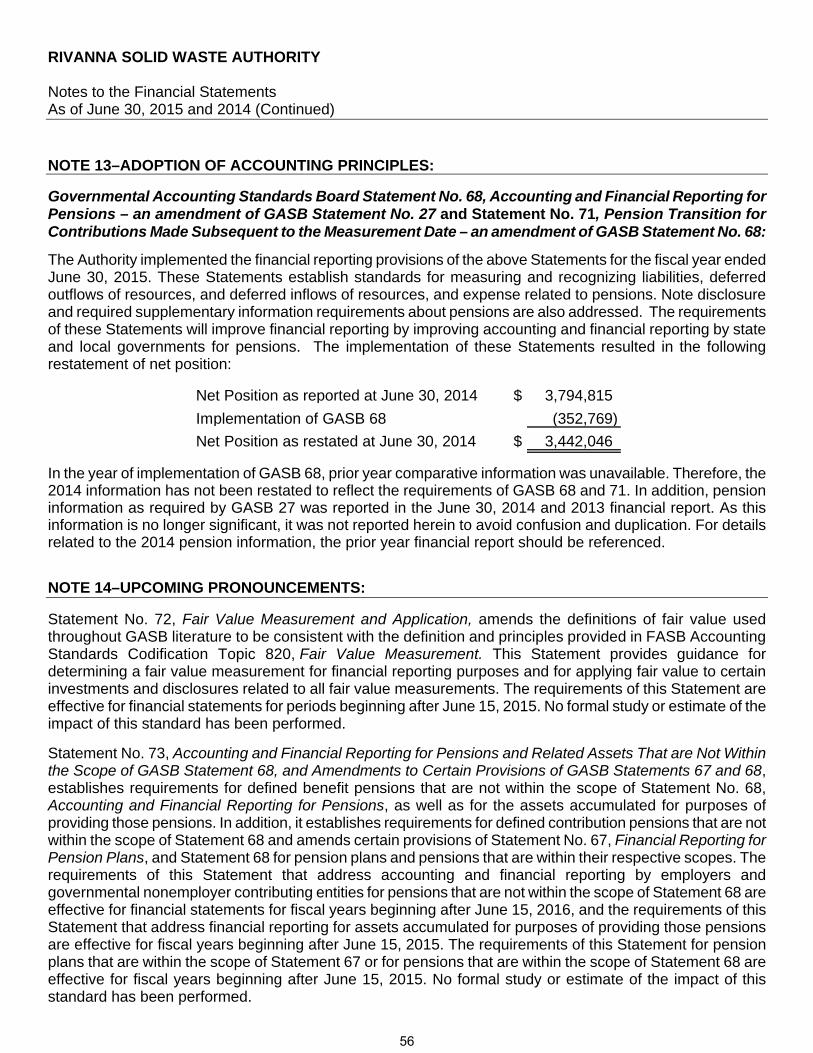
RIVANNA SOLID WASTE AUTHORITY Notes to the Financial Statements As of June 30, 2015 and 2014 (Continued)
NOTE 13–ADOPTION OF ACCOUNTING PRINCIPLES:
Governmental Accounting Standards Board Statement No. 68, Accounting and Financial Reporting for Pensions – an amendment of GASB Statement No. 27 and Statement No. 71, Pension Transition for Contributions Made Subsequent to the Measurement Date – an amendment of GASB Statement No. 68:
The Authority implemented the financial reporting provisions of the above Statements for the fiscal year ended June 30, 2015. These Statements establish standards for measuring and recognizing liabilities, deferred outflows of resources, and deferred inflows of resources, and expense related to pensions. Note disclosure and required supplementary information requirements about pensions are also addressed. The requirements of these Statements will improve financial reporting by improving accounting and financial reporting by state and local governments for pensions. The implementation of these Statements resulted in the following restatement of net position:
Net Position as reported at June 30, 2014 $ 3,794,815
Implementation of GASB 68 (352,769)
Net Position as restated at June 30, 2014 $ 3,442,046
In the year of implementation of GASB 68, prior year comparative information was unavailable. Therefore, the 2014 information has not been restated to reflect the requirements of GASB 68 and 71. In addition, pension information as required by GASB 27 was reported in the June 30, 2014 and 2013 financial report. As this information is no longer significant, it was not reported herein to avoid confusion and duplication. For details related to the 2014 pension information, the prior year financial report should be referenced.
NOTE 14–UPCOMING PRONOUNCEMENTS:
Statement No. 72, Fair Value Measurement and Application, amends the definitions of fair value used throughout GASB literature to be consistent with the definition and principles provided in FASB Accounting Standards Codification Topic 820, Fair Value Measurement. This Statement provides guidance for determining a fair value measurement for financial reporting purposes and for applying fair value to certain investments and disclosures related to all fair value measurements. The requirements of this Statement are effective for financial statements for periods beginning after June 15, 2015. No formal study or estimate of the impact of this standard has been performed.
Statement No. 73, Accounting and Financial Reporting for Pensions and Related Assets That are Not Within the Scope of GASB Statement 68, and Amendments to Certain Provisions of GASB Statements 67 and 68, establishes requirements for defined benefit pensions that are not within the scope of Statement No. 68, Accounting and Financial Reporting for Pensions, as well as for the assets accumulated for purposes of providing those pensions. In addition, it establishes requirements for defined contribution pensions that are not within the scope of Statement 68 and amends certain provisions of Statement No. 67, Financial Reporting for Pension Plans, and Statement 68 for pension plans and pensions that are within their respective scopes. The requirements of this Statement that address accounting and financial reporting by employers and governmental nonemployer contributing entities for pensions that are not within the scope of Statement 68 are effective for financial statements for fiscal years beginning after June 15, 2016, and the requirements of this Statement that address financial reporting for assets accumulated for purposes of providing those pensions are effective for fiscal years beginning after June 15, 2015. The requirements of this Statement for pension plans that are within the scope of Statement 67 or for pensions that are within the scope of Statement 68 are effective for fiscal years beginning after June 15, 2015. No formal study or estimate of the impact of this standard has been performed.
56
RIVANNA SOLID WASTE AUTHORITY Notes to the Financial Statements As of June 30, 2015 and 2014 (Continued)
NOTE 14–UPCOMING PRONOUNCEMENTS: (CONTINUED) Statement No. 74, Financial Reporting for Postemployment Benefit Plans Other Than Pension Plans, improves the usefulness of information about postemployment benefits other than pensions (other postemployment benefits or OPEB) included in the general purpose external financial reports of state and local governmental OPEB plans for making decisions and assessing accountability. This Statement replaces Statements No. 43, Financial Reporting for Postemployment Benefit Plans Other Than Pension Plans, as amended, and No. 57, OPEB Measurements by Agent Employers and Agent Multiple Employer Plans. It also includes requirements for defined contribution OPEB plans that replace the requirements for those OPEB plans in Statement No. 25, Financial Reporting for Defined Benefit Pension Plans and Note Disclosures for Defined Contribution Plans, as amended, Statement 43, and Statement No. 50, Pension Disclosures. This Statement is effective for financial statements for fiscal years beginning after June 15, 2016. No formal study or estimate of the impact of this standard has been performed. Statement No. 75, Accounting and Financial Reporting for Postemployment Benefits Other Than Pension, improves accounting and financial reporting by state and local governments for postemployment benefits other than pensions (other postemployment benefits or OPEB). This Statement replaces the requirements of Statements No. 45, Accounting and Financial Reporting by Employers for Postemployment Benefits Other Than Pensions, as amended, and No. 57, OPEB Measurements by Agent Employers and Agent Multiple Employer Plans, for OPEB. Statement No. 74, Financial Reporting for Postemployment Benefit Plans Other Than Pension Plans, establishes new accounting and financial reporting requirements for OPEB plans. This Statement is effective for fiscal years beginning after June 15, 2017. No formal study or estimate of the impact of this standard has been performed.
57

This page intentionally left blank
Required Supplementary Information
59

This page intentionally left blank
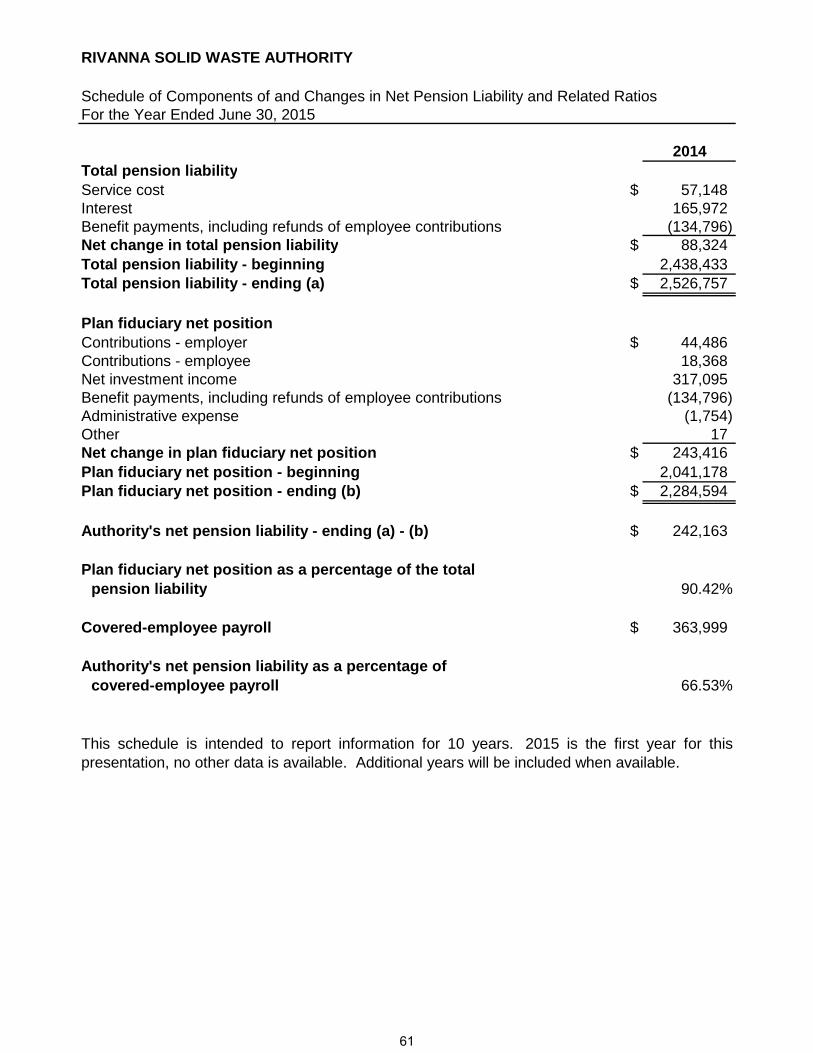
RIVANNA SOLID WASTE AUTHORITY
Schedule of Components of and Changes in Net Pension Liability and Related RatiosFor the Year Ended June 30, 2015
2014Total pension liabilityService cost $ 57,148 Interest 165,972 Benefit payments, including refunds of employee contributions (134,796) Net change in total pension liability $ 88,324 Total pension liability - beginning 2,438,433 Total pension liability - ending (a) $ 2,526,757
Plan fiduciary net positionContributions - employer $ 44,486 Contributions - employee 18,368 Net investment income 317,095 Benefit payments, including refunds of employee contributions (134,796) Administrative expense (1,754) Other 17 Net change in plan fiduciary net position $ 243,416 Plan fiduciary net position - beginning 2,041,178 Plan fiduciary net position - ending (b) $ 2,284,594
Authority's net pension liability - ending (a) - (b) $ 242,163
Plan fiduciary net position as a percentage of the totalpension liability 90.42%
Covered-employee payroll $ 363,999
Authority's net pension liability as a percentage of covered-employee payroll 66.53%
This schedule is intended to report information for 10 years. 2015 is the first year for thispresentation, no other data is available. Additional years will be included when available.
61
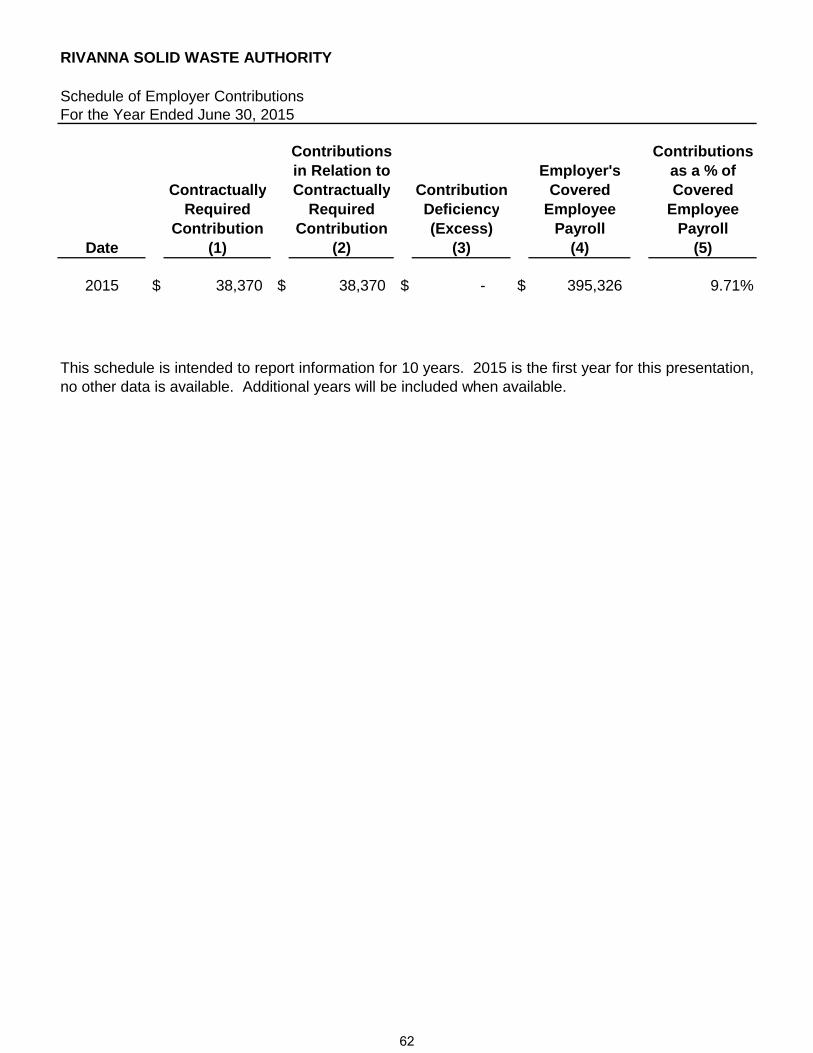
RIVANNA SOLID WASTE AUTHORITY
Schedule of Employer ContributionsFor the Year Ended June 30, 2015
Contributions Contributionsin Relation to Employer's as a % of
Contractually Contractually Contribution Covered CoveredRequired Required Deficiency Employee Employee
Contribution Contribution (Excess) Payroll PayrollDate (1) (2) (3) (4) (5)
2015 $ 38,370 $ 38,370 $ - $ 395,326 9.71%
This schedule is intended to report information for 10 years. 2015 is the first year for this presentation,no other data is available. Additional years will be included when available.
62
RIVANNA SOLID WASTE AUTHORITY
Notes to Required Supplementary InformationFor the Year Ended June 30, 2015
Largest 10 – Non-LEOS:- Update mortality table- Decrease in rates of service retirement- Decrease in rates of disability retirement- Reduce rates of salary increase by 0.25% per year
All Others (Non 10 Largest) – Non-LEOS:- Update mortality table- Decrease in rates of service retirement- Decrease in rates of disability retirement- Reduce rates of salary increase by 0.25% per year
Changes of benefit terms – There have been no significant changes to the System benefit provisionssince the prior actuarial valuation. A hybrid plan with changes to the defined benefit plan structure anda new defined contribution component were adopted in 2012. The hybrid plan applies to most newemployees hired on or after January 1, 2014 and not covered by enhanced hazardous duty benefits.The liabilities presented do not reflect the hybrid plan since it covers new members joining the Systemafter the valuation date of June 30, 2013 and the impact on the liabilities as of the measurement dateof June 30, 2014 are minimal.
Changes of assumptions – The following changes in actuarial assumptions were made effectiveJune 30, 2013 based on the most recent experience study of the System for the four-year periodending June 30, 2012:
63
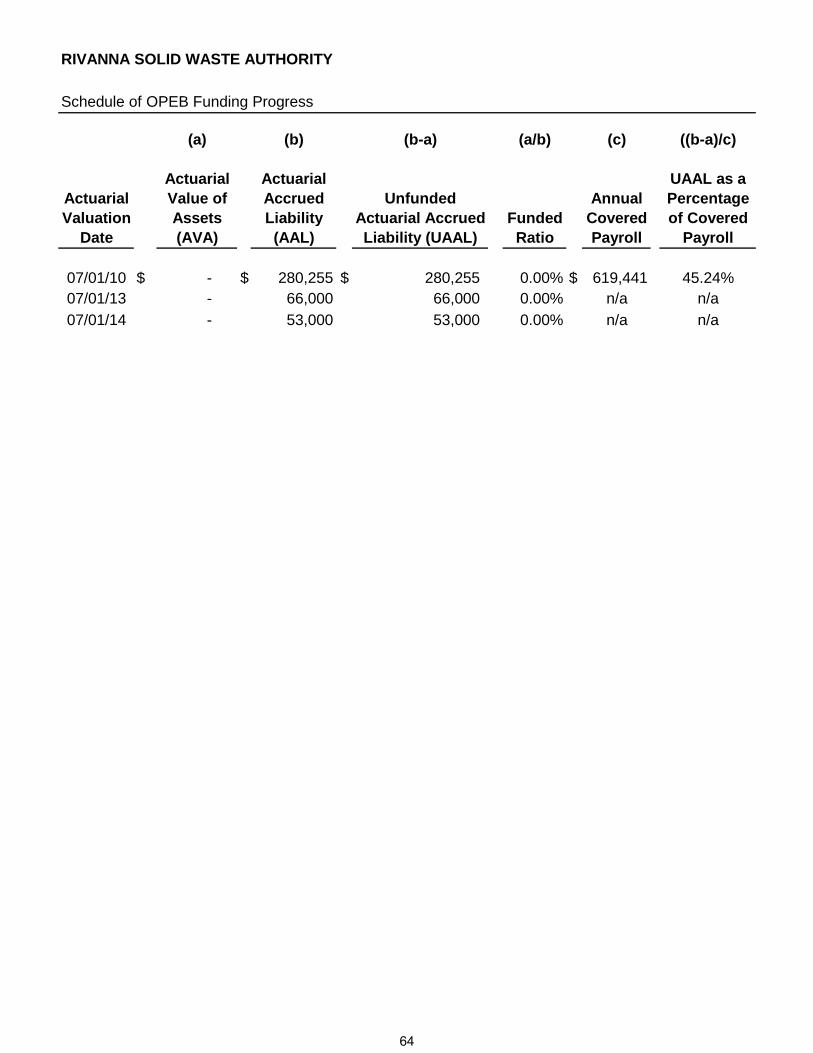
RIVANNA SOLID WASTE AUTHORITY
(a) (b) (b-a) (a/b) (c) ((b-a)/c)
Actuarial Actuarial UAAL as aActuarial Value of Accrued Unfunded Annual PercentageValuation Assets Liability Actuarial Accrued Funded Covered of Covered
Date (AVA) (AAL) Liability (UAAL) Ratio Payroll Payroll
07/01/10 $ - $ 280,255 $ 280,255 0.00% $ 619,441 45.24%07/01/13 - 66,000 66,000 0.00% n/a n/a
07/01/14 - 53,000 53,000 0.00% n/a n/a
Schedule of OPEB Funding Progress
64
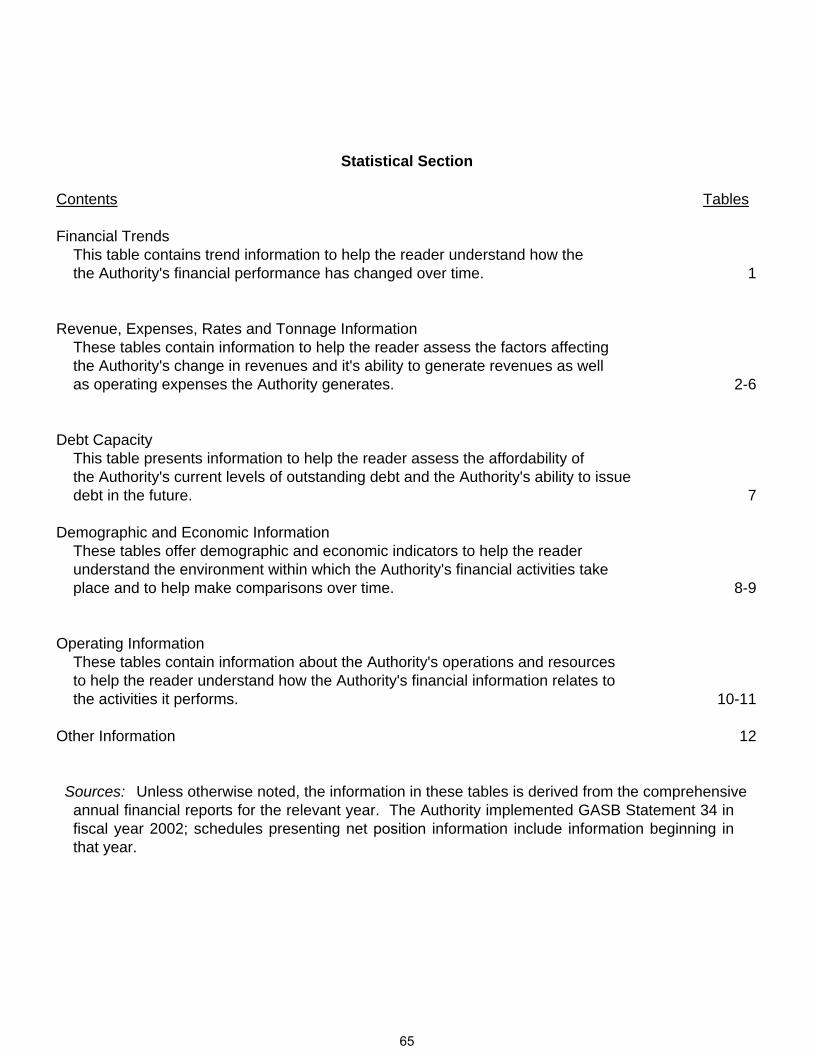
Contents Tables
Financial TrendsThis table contains trend information to help the reader understand how the the Authority's financial performance has changed over time. 1
Revenue, Expenses, Rates and Tonnage InformationThese tables contain information to help the reader assess the factors affectingthe Authority's change in revenues and it's ability to generate revenues as wellas operating expenses the Authority generates. 2-6
Debt CapacityThis table presents information to help the reader assess the affordability ofthe Authority's current levels of outstanding debt and the Authority's ability to issuedebt in the future. 7
Demographic and Economic InformationThese tables offer demographic and economic indicators to help the readerunderstand the environment within which the Authority's financial activities takeplace and to help make comparisons over time. 8-9
Operating InformationThese tables contain information about the Authority's operations and resourcesto help the reader understand how the Authority's financial information relates tothe activities it performs. 10-11
Other Information 12
Sources: Unless otherwise noted, the information in these tables is derived from the comprehensiveannual financial reports for the relevant year. The Authority implemented GASB Statement 34 in fiscal year 2002; schedules presenting net position information include information beginning in that year.
Statistical Section
65

This page intentionally left blank

RIV
AN
NA
SO
LID
WA
ST
E A
UT
HO
RIT
YT
able
1
Net
Pos
ition
by
Com
pone
ntLa
st T
en F
isca
l Yea
rs
2015
2014
2013
2012
2011
2010
2009
2008
2007
2006
Net
inve
stm
ent i
n ca
pita
l ass
ets
$6,
246,
134
$
6,23
2,15
4
$6,
333,
722
$6,
488,
690
$6,
566,
617
$6,
720,
624
$7,
092,
475
$
6,94
4,53
0
$7,
074,
036
$
7,07
2,10
8
Unr
estr
icte
d(2
,412
,362
)
(2,4
37,3
39)
49
3,49
314
4,22
81,
308,
953
1,34
5,00
7(2
34,2
55)
(7
20,5
09)
(1
,403
,882
)
(3,6
09,2
14)
T
otal
net
pos
ition
$3,
833,
772
$
3,79
4,81
5
$6,
827,
215
$6,
632,
918
$7,
875,
570
$8,
065,
631
$6,
858,
220
$
6,22
4,02
1
$5,
670,
154
$
3,46
2,89
4
Fis
cal Y
ears
En
ded
Ju
ne
30,
67
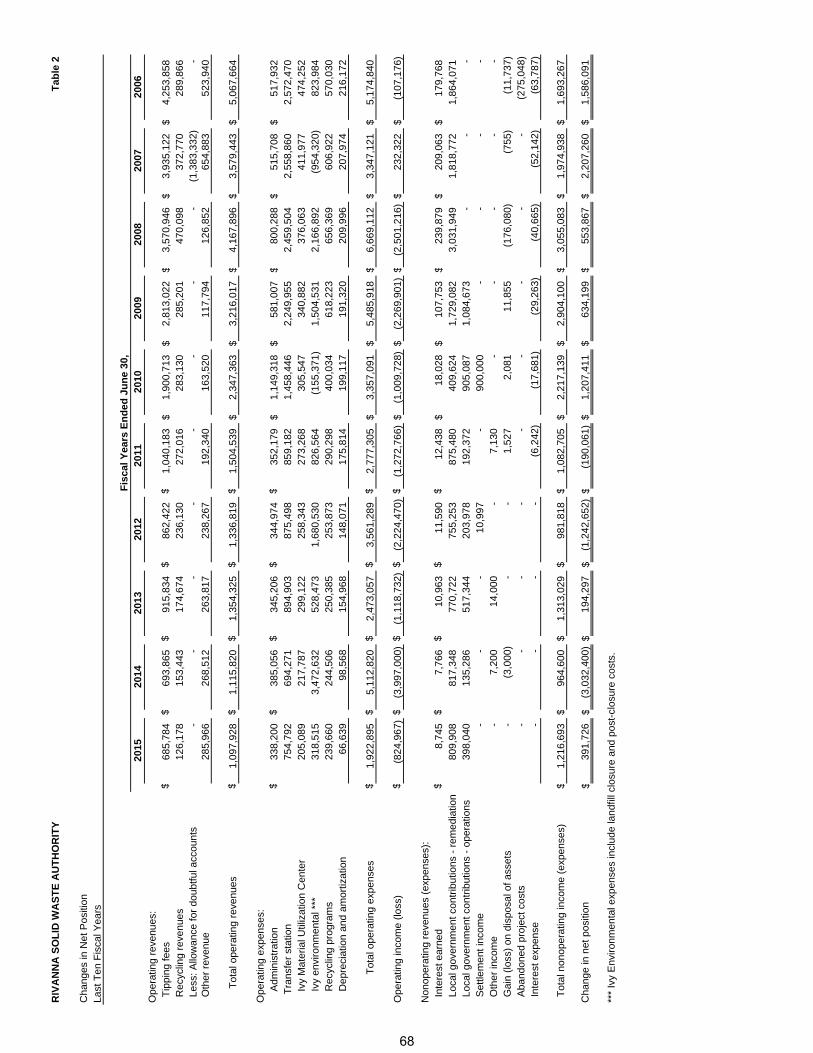
RIV
AN
NA
SO
LID
WA
ST
E A
UT
HO
RIT
YT
able
2
Cha
nges
in N
et P
ositi
onLa
st T
en F
isca
l Yea
rs
2015
2014
2013
2012
2011
2010
2009
2008
2007
2006
Ope
ratin
g re
venu
es:
Tip
ping
fees
$68
5,78
4
$69
3,86
5
$91
5,83
4
$86
2,42
2
$1,
040,
183
$1,
900,
713
$2,
813,
022
$3,
570,
946
$3,
935,
122
$4,
253,
858
Rec
yclin
g re
venu
es12
6,17
8
153,
443
17
4,67
4
236,
130
27
2,01
6
283,
130
28
5,20
1
470,
098
37
2,77
0
289,
866
L
ess:
Allo
wan
ce fo
r do
ubtfu
l acc
ount
s-
-
-
-
-
-
-
-
(1
,383
,332
)
-
Oth
er r
even
ue28
5,96
6
268,
512
26
3,81
7
238,
267
19
2,34
0
163,
520
11
7,79
4
126,
852
65
4,88
3
523,
940
T
otal
ope
ratin
g re
venu
es$
1,09
7,92
8
$
1,11
5,82
0
$
1,35
4,32
5
$
1,33
6,81
9
$
1,50
4,53
9
$
2,34
7,36
3
$
3,21
6,01
7
$
4,16
7,89
6
$
3,57
9,44
3
$
5,06
7,66
4
Ope
ratin
g ex
pens
es:
A
dmin
istr
atio
n$
338,
200
$
385,
056
$
345,
206
$
344,
974
$
352,
179
$
1,14
9,31
8
$
581,
007
$
800,
288
$
515,
708
$
517,
932
Tra
nsfe
r st
atio
n75
4,79
2
694,
271
89
4,90
3
875,
498
85
9,18
2
1,45
8,44
6
2,
249,
955
2,45
9,50
4
2,
558,
860
2,57
2,47
0
Ivy
Mat
eria
l Util
izat
ion
Cen
ter
205,
089
21
7,78
7
299,
122
25
8,34
3
273,
268
30
5,54
7
340,
882
37
6,06
3
411,
977
47
4,25
2
Iv
y en
viro
nmen
tal *
**31
8,51
5
3,47
2,63
2
52
8,47
3
1,68
0,53
0
82
6,56
4
(155
,371
)
1,
504,
531
2,16
6,89
2
(9
54,3
20)
823,
984
Rec
yclin
g pr
ogra
ms
239,
660
24
4,50
6
250,
385
25
3,87
3
290,
298
40
0,03
4
618,
223
65
6,36
9
606,
922
57
0,03
0
D
epre
ciat
ion
and
amor
tizat
ion
66,6
39
98,5
68
154,
968
14
8,07
1
175,
814
19
9,11
7
191,
320
20
9,99
6
207,
974
21
6,17
2
T
otal
ope
ratin
g ex
pens
es$
1,92
2,89
5
$
5,11
2,82
0
$
2,47
3,05
7
$
3,56
1,28
9
$
2,77
7,30
5
$
3,35
7,09
1
$
5,48
5,91
8
$
6,66
9,11
2
$
3,34
7,12
1
$
5,17
4,84
0
Ope
ratin
g in
com
e (lo
ss)
$(8
24,9
67)
$(3
,997
,000
)
$(1
,118
,732
)
$(2
,224
,470
)
$(1
,272
,766
)
$(1
,009
,728
)
$(2
,269
,901
)
$(2
,501
,216
)
$23
2,32
2
$(1
07,1
76)
Non
oper
atin
g re
venu
es (
expe
nses
): I
nter
est e
arne
d$
8,74
5
$
7,76
6
$
10,9
63
$11
,590
$
12,4
38
$18
,028
$
107,
753
$
239,
879
$
209,
063
$
179,
768
L
ocal
gov
ernm
ent c
ontr
ibut
ions
- r
emed
iatio
n80
9,90
8
817,
348
77
0,72
2
755,
253
87
5,48
0
409,
624
1,
729,
082
3,03
1,94
9
1,
818,
772
1,86
4,07
1
L
ocal
gov
ernm
ent c
ontr
ibut
ions
- o
pera
tions
398,
040
13
5,28
6
517,
344
20
3,97
8
192,
372
90
5,08
7
1,08
4,67
3
-
-
-
S
ettle
men
t inc
ome
-
-
-
10,9
97
-
900,
000
-
-
-
-
O
ther
inco
me
-
7,20
0
14
,000
-
7,
130
-
-
-
-
-
Gai
n (lo
ss)
on d
ispo
sal o
f ass
ets
-
(3,0
00)
-
-
1,52
7
2,
081
11,8
55
(176
,080
)
(7
55)
(1
1,73
7)
Aba
ndon
ed p
roje
ct c
osts
-
-
-
-
-
-
-
-
-
(275
,048
)
I
nter
est e
xpen
se-
-
-
-
(6
,242
)
(1
7,68
1)
(29,
263)
(4
0,66
5)
(52,
142)
(6
3,78
7)
Tot
al n
onop
erat
ing
inco
me
(exp
ense
s)$
1,21
6,69
3
$
964,
600
$
1,31
3,02
9
$
981,
818
$
1,08
2,70
5
$
2,21
7,13
9
$
2,90
4,10
0
$
3,05
5,08
3
$
1,97
4,93
8
$
1,69
3,26
7
Cha
nge
in n
et p
ositi
on$
391,
726
$
(3,0
32,4
00)
$
194,
297
$
(1,2
42,6
52)
$
(190
,061
)
$
1,20
7,41
1
$
634,
199
$
553,
867
$
2,20
7,26
0
$
1,58
6,09
1
***
Ivy
Env
ironm
enta
l exp
ense
s in
clud
e la
ndfil
l clo
sure
and
pos
t-cl
osur
e co
sts.
Fis
cal Y
ears
En
ded
Ju
ne
30,
68
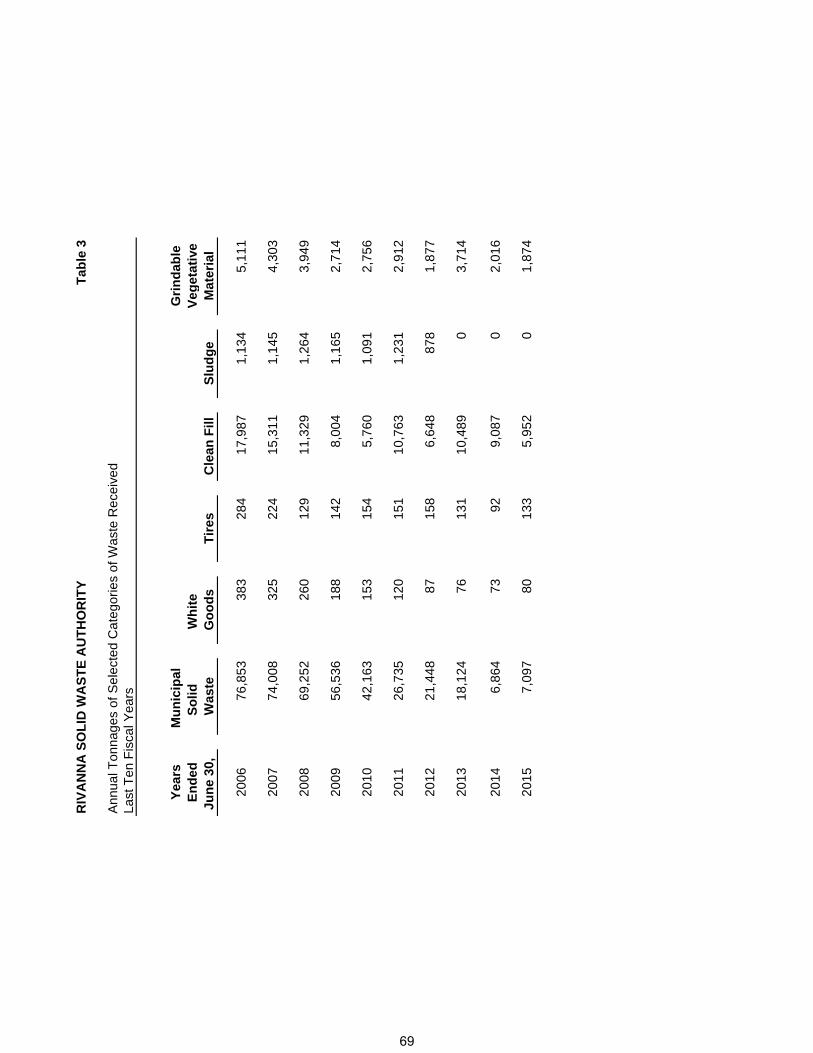
RIV
AN
NA
SO
LID
WA
ST
E A
UT
HO
RIT
YT
able
3
Ann
ual T
onna
ges
of S
elec
ted
Ca
tego
ries
of W
aste
Rec
eive
dLa
st T
en F
isca
l Yea
rs
Yea
rsM
un
icip
al
Gri
nd
able
En
ded
So
lid
W
hit
e V
eg
etat
ive
Jun
e 30
, W
aste
Go
od
sT
ire
sC
lean
Fil
lS
lud
ge
Mat
eria
l
2006
76,8
5338
328
417
,987
1,13
45,
111
2007
74,0
0832
522
415
,311
1,14
54,
303
2008
69,2
5226
012
911
,329
1,26
43,
949
2009
56,5
3618
814
28,
004
1,16
52,
714
2010
42,1
6315
315
45,
760
1,09
12,
756
2011
26,7
3512
015
110
,763
1,23
12,
912
2012
21,4
4887
158
6,64
887
81,
877
2013
18,1
2476
131
10,4
890
3,71
4
2014
6,86
473
929,
087
02
,016
2015
7,09
780
133
5,95
20
1,87
4
69
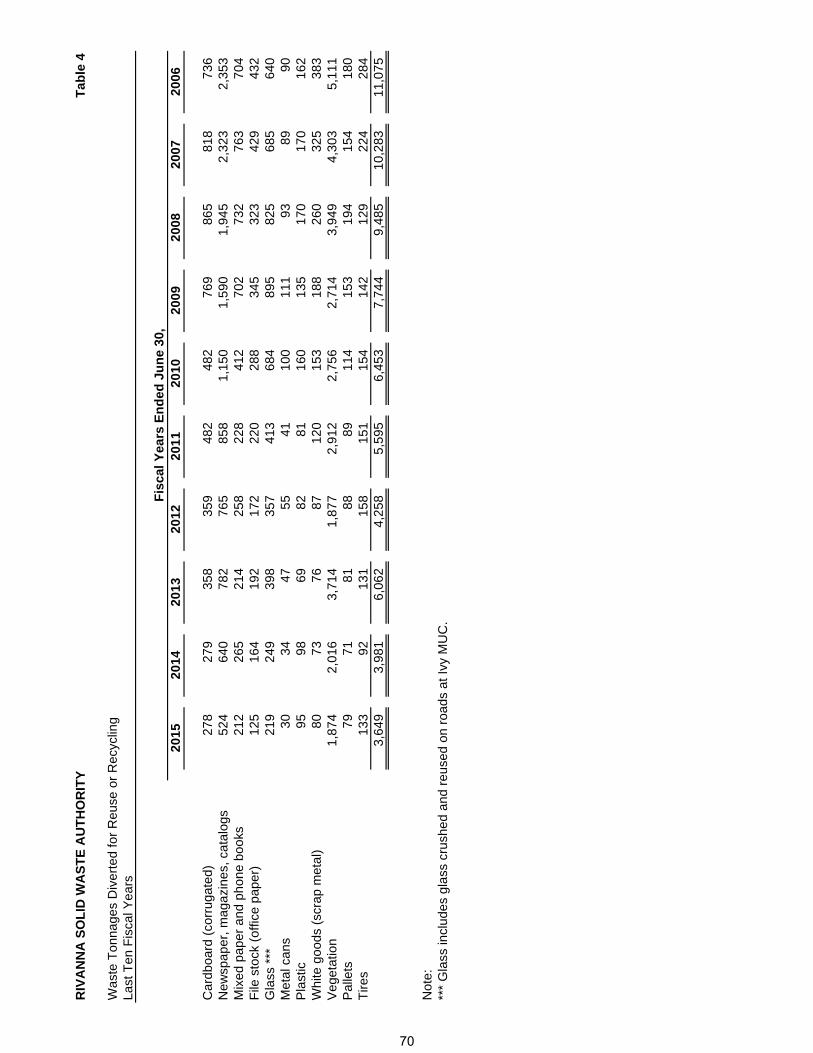
RIV
AN
NA
SO
LID
WA
ST
E A
UT
HO
RIT
YT
able
4
Wa
ste
To
nn
ag
es
Div
ert
ed
fo
r R
eu
se o
r R
ecy
clin
gLa
st T
en F
isca
l Yea
rs
20
15
20
14
20
13
20
12
20
11
20
10
20
09
20
08
20
07
20
06
Ca
rdb
oa
rd (
corr
ug
ate
d)
27
8
27
9
35
8
35
9
48
2
48
2
76
9
86
5
81
8
73
6
N
ew
spa
pe
r, m
ag
azi
ne
s, c
ata
log
s5
24
640
782
765
858
1,15
0
1,59
0
1,9
45
2,
323
2
,35
3
Mix
ed
pa
pe
r a
nd
ph
on
e b
oo
ks2
12
265
214
258
228
412
702
732
763
704
File
sto
ck (
off
ice
pa
pe
r)1
25
164
192
172
220
288
345
323
429
432
Gla
ss *
**2
19
249
398
357
413
684
895
825
685
640
Me
tal c
an
s3
0
34
47
55
41
100
111
93
89
90
Pla
stic
95
98
69
82
81
16
0
13
5
17
0
17
0
16
2
W
hite
go
od
s (s
cra
p m
eta
l)8
0
73
76
87
120
153
188
260
325
383
Ve
ge
tatio
n1
,87
4
2,0
16
3
,71
4
1,8
77
2
,91
2
2,75
6
2,71
4
3,9
49
4,
303
5
,11
1
Pal
lets
79
71
81
88
89
114
153
194
154
180
Tir
es13
3
92
13
1
15
8
15
1
15
4
14
2
12
9
22
4
28
4
3
,64
9
3,9
81
6
,06
2
4,2
58
5
,59
5
6,45
3
7,74
4
9,4
85
1
0,2
83
11
,07
5
Not
e:**
* G
lass
incl
ud
es
gla
ss c
rush
ed
an
d r
eu
sed
on
ro
ad
s a
t Iv
y M
UC
.
Fis
cal
Yea
rs E
nd
ed J
un
e 30
,
70

RIV
AN
NA
SO
LID
WA
ST
E A
UT
HO
RIT
YT
able
5
Last
Ten
Fis
cal Y
ears
Was
te C
ateg
ory
2015
2014
2013
2012
2011
2010
2009
2008
2007
2006
Mun
icip
al:
Ivy
Tra
nsfe
r S
tatio
n$
66.0
0$
66.0
0$
66.0
0$
66.0
0$
66.0
0$
66.0
0$
66.0
0$
66.0
0$
66.0
0$
66.0
0 B
FI T
rans
fer
Sta
tion
N/A
N/A
N/A
N/A
N/A
62.0
062
.00
62.0
062
.00
62.0
0
Veg
etat
ive
48.0
048
.00
48.0
048
.00
48.0
048
.00
48.0
046
.00
46.0
044
.00
Tire
s: S
plit
Tire
sN
/AN
/AN
/AN
/AN
/AN
/AN
/AN
/AN
/AN
/A W
hole
Tire
s19
0.00
190.
0019
0.00
190.
0019
0.00
173.
1017
3.10
166.
0016
6.00
166.
00
Whi
te G
oods
: N
on-F
reon
105.
0010
5.00
105.
0010
5.00
105.
0010
4.30
104.
3010
0.00
100.
0010
0.00
Cle
an-F
ill8.
008.
008.
008.
008.
008.
008.
007.
507.
507.
00
Slu
dge
8.00
8.00
8.00
8.00
8.00
7.30
7.30
7.00
7.00
7.00
Pal
lets
48.0
048
.00
48.0
048
.00
48.0
046
.00
46.0
046
.00
46.0
046
.00
Tip
ping
Fee
s P
er T
on B
y W
aste
Cat
egor
y
Fis
cal Y
ears
En
ded
Ju
ne
30,
71

RIV
AN
NA
SO
LID
WA
ST
E A
UT
HO
RIT
YT
able
6
Top
Ten
Cus
tom
ers
Cur
rent
Yea
r an
d N
ine
Yea
rs A
go
Fis
cal Y
ear
2015
(C
urr
ent
Yea
r):
Am
ou
nt
% o
f T
ota
lS
onoc
o R
ecyc
ling
$10
0,37
0
9%
Riv
anna
Wat
er &
Sew
er A
uth.
89,7
51
8%
Ger
dau-
Cha
ppar
ral,
Inc.
46,2
83
4%
Alb
emar
le C
ount
y41
,202
4%V
irgin
ia D
EQ
28,5
62
3%
Rea
l Pro
pert
y, In
c.13
,981
1%A
rnol
d E
xcav
atio
n &
Hau
ling
13,6
36
1%
Bru
ce H
owar
d C
ontr
actin
g14
,453
1%F
airf
ield
-Ech
ols,
LLC
9,65
2
1%M
artin
Roo
fing
& S
heet
Met
al8,
591
1%
Sub
tota
l (to
p te
n cu
stom
ers)
$36
6,48
0
33
%O
ther
cus
tom
ers
731,
448
67%
Tot
al$
1,09
7,92
8
100%
Fis
cal Y
ear
2006
(N
ine
Yea
rs A
go
):
Am
ou
nt
% o
f T
ota
lC
ity o
f Cha
rlotte
svill
e$
1,00
3,17
6
20%
Was
te M
anag
emen
t of V
A-B
lue
Rid
ge81
4,72
8
16
%W
eyer
haeu
ser
262,
301
5%D
ixon
's T
rash
Dis
posa
l22
7,74
8
4%
Con
tain
er R
enta
ls17
5,51
5
3%
Alb
emar
le R
ecyc
ling
& C
onta
iner
112,
796
2%F
aulc
oner
Con
stru
ctio
n C
o, In
c.84
,756
2%B
est o
f Wha
t's A
roun
d84
,121
2%M
artin
Hor
n, In
c.78
,999
2%B
arne
tt's
Tra
sh S
ervi
ce70
,378
1%S
ubto
tal (
top
ten
cust
omer
s)$
2,91
4,51
8
58%
Oth
er c
usto
mer
s2,
153,
146
42
%T
otal
$5,
067,
664
100%
Op
erat
ing
Rev
enu
es
Op
erat
ing
Rev
enu
es
72
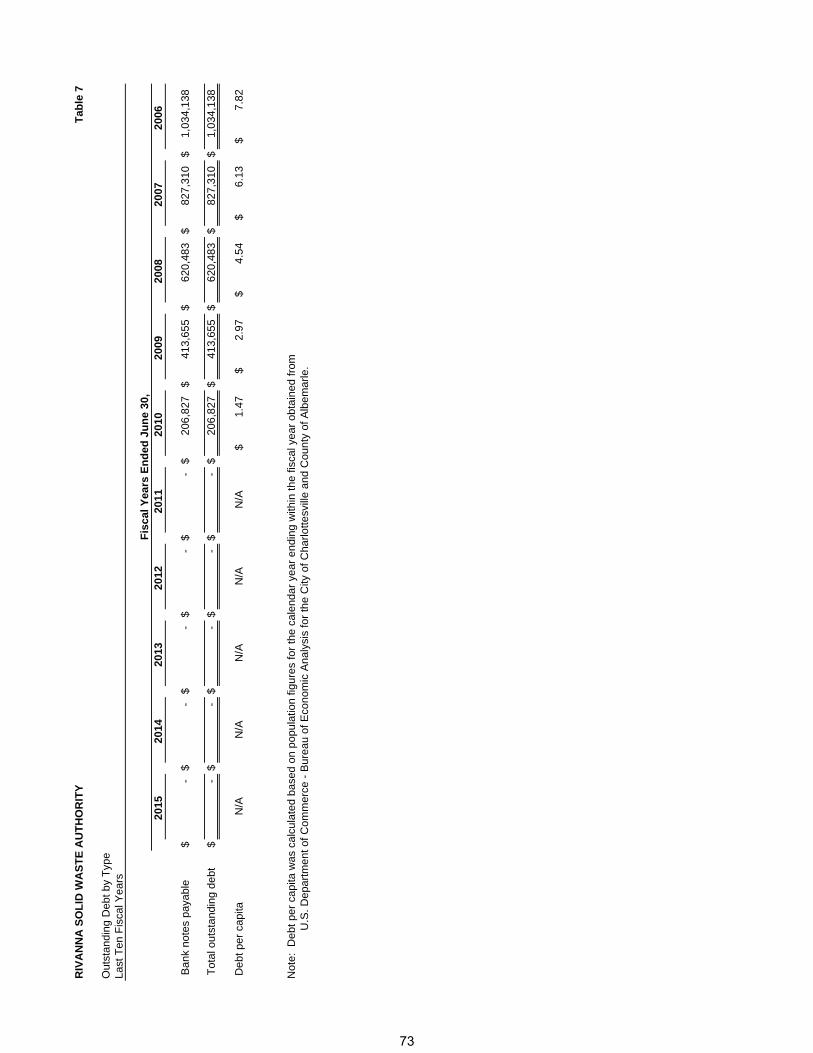
RIV
AN
NA
SO
LID
WA
ST
E A
UT
HO
RIT
YT
able
7
Out
stan
ding
Deb
t by
Typ
eLa
st T
en F
isca
l Yea
rs
2015
2014
2013
2012
2011
2010
2009
2008
2007
2006
Ban
k no
tes
paya
ble
$-
$-
$-
$-
$-
$20
6,82
7
$
413,
655
$62
0,48
3
$
827,
310
$1,
034,
138
Tot
al o
utst
andi
ng d
ebt
$-
$-
$-
$-
$-
$20
6,82
7
$
413,
655
$62
0,48
3
$
827,
310
$1,
034,
138
Deb
t per
cap
ita
N/A
N/A
N/A
N/A
N/A
1.47
$
2.97
$
4.54
$
6.13
$
7.82
$
Not
e: D
ebt p
er c
apita
was
cal
cula
ted
base
d on
pop
ulat
ion
figur
es fo
r th
e ca
lend
ar y
ear
endi
ng w
ithin
the
fisca
l yea
r ob
tain
ed f
rom
U.S
. Dep
artm
ent o
f Com
mer
ce -
Bur
eau
of E
cono
mic
Ana
lysi
s fo
r th
e C
ity o
f Cha
rlotte
svill
e an
d C
ount
y of
Alb
emar
le.
Fis
cal Y
ears
En
ded
Ju
ne
30,
73
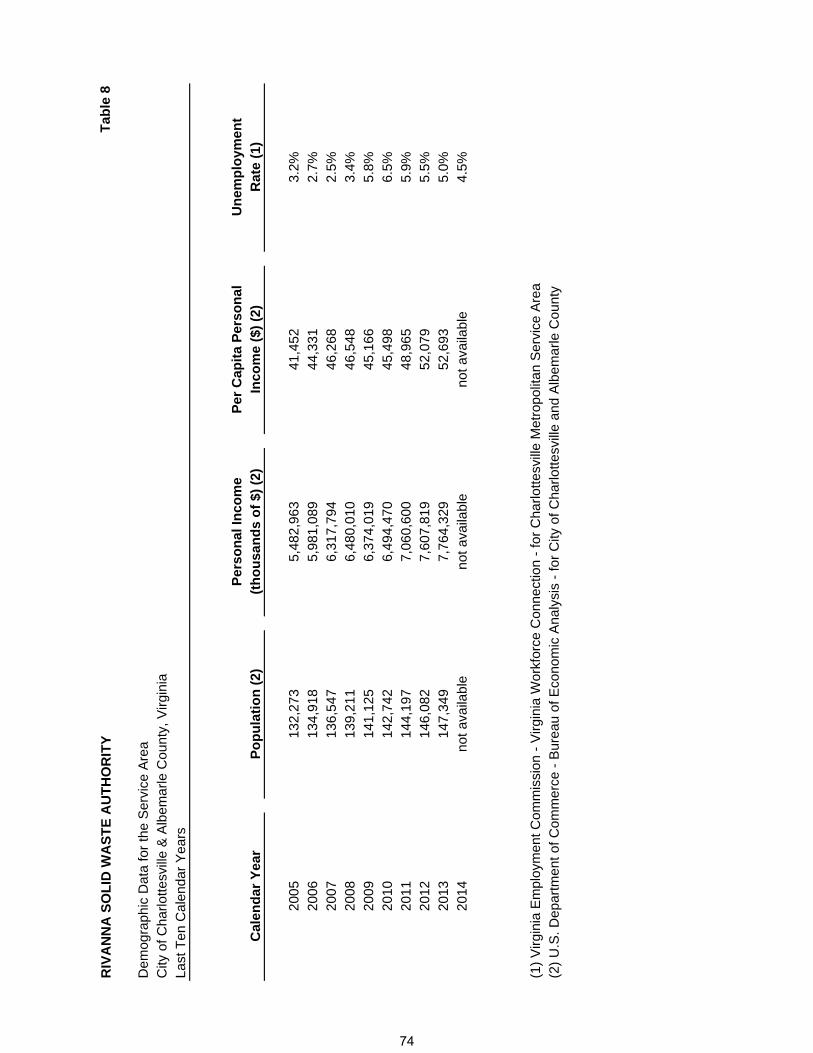
RIV
AN
NA
SO
LID
WA
ST
E A
UT
HO
RIT
YT
able
8
Dem
ogra
phic
Dat
a fo
r th
e S
ervi
ce A
rea
City
of C
harlo
ttesv
ille
& A
lbem
arle
Cou
nty,
Virg
inia
Last
Ten
Cal
enda
r Y
ears
Per
son
al In
com
eP
er C
apit
a P
erso
nal
Un
emp
loym
ent
Cal
end
ar Y
ear
Po
pu
lati
on
(2)
(th
ou
san
ds
of
$) (
2)In
com
e ($
) (2
)R
ate
(1)
2005
132,
273
5,48
2,96
341
,452
3.2%
2006
134,
918
5,98
1,08
944
,331
2.7%
2007
136,
547
6,31
7,79
446
,268
2.5%
2008
139,
211
6,48
0,01
046
,548
3.4%
2009
141,
125
6,37
4,01
945
,166
5.8%
2010
142,
742
6,49
4,47
045
,498
6.5%
2011
144,
197
7,06
0,60
048
,965
5.9%
2012
146,
082
7,60
7,81
952
,079
5.5%
2013
147,
349
7,76
4,32
952
,693
5.0%
2014
not a
vaila
ble
not a
vaila
ble
not a
vaila
ble
4.5%
(1)
Virg
inia
Em
ploy
men
t Com
mis
sion
- V
irgin
ia W
orkf
orce
Con
nect
ion
- fo
r C
harlo
ttesv
ille
Met
ropo
litan
Ser
vice
Are
a(2
) U
.S. D
epar
tmen
t of C
omm
erce
- B
urea
u of
Eco
nom
ic A
naly
sis
- fo
r C
ity o
f Cha
rlotte
svill
e an
d A
lbem
arle
Cou
nty
74

RIV
AN
NA
SO
LID
WA
ST
E A
UT
HO
RIT
YT
able
9
Prin
cipa
l Em
ploy
ers
in th
e C
harlo
ttesv
ille
Are
aC
urre
nt Y
ear
and
Nin
e Y
ears
Ago
Num
ber
ofN
umbe
r of
Em
plo
yer
Em
ploy
ees
Ran
kE
mpl
oyee
sR
ank
Uni
vers
ity o
f Virg
inia
/ Blu
e R
idge
Hos
pita
l1,
000
& o
ver
11,
000
& o
ver
1U
nive
rsity
of V
irgin
ia M
edic
al C
ente
r1,
000
& o
ver
21,
000
& o
ver
2C
ount
y of
Alb
emar
le1,
000
& o
ver
31,
000
& o
ver
3M
arth
a Je
ffers
on H
ospi
tal
1,00
0 &
ove
r4
1,00
0 &
ove
r4
City
of C
harlo
ttesv
ille
1,00
0 &
ove
r5
1,00
0 &
ove
r5
Sta
te F
arm
Mut
ual A
utom
obile
Insu
ranc
e1,
000
& o
ver
61,
000
& o
ver
6U
VA
Hea
lth S
ervi
ces
Fou
ndat
ion
1,00
0 &
ove
r7
1,00
0 &
ove
r7
Cha
rlotte
svill
e C
ity S
choo
l Boa
rd50
0-99
98
500-
999
8U
.S. D
epar
tmen
t of D
efen
se50
0-99
99
Flu
vann
a C
ount
y P
ublic
Sch
ool B
oard
500-
999
10N
orth
rop
Gru
mm
an C
orpo
ratio
n50
0-99
99
Ara
mar
k C
ampu
s50
0-99
910
Sou
rce:
Virg
inia
Em
ploy
men
t Com
mis
sion
, Qua
rter
ly C
ensu
s of
Em
ploy
men
t and
Wag
es
-
for
Cha
rlotte
svill
e M
etro
polit
an S
ervi
ce A
rea
(MS
A)
Eac
h em
ploy
er's
per
cent
age
of to
tal e
mpl
oym
ent i
s no
t ava
ilabl
e.
Fou
rth
Qua
rter
of 2
014
Fou
rth
Qua
rter
of 2
005
75
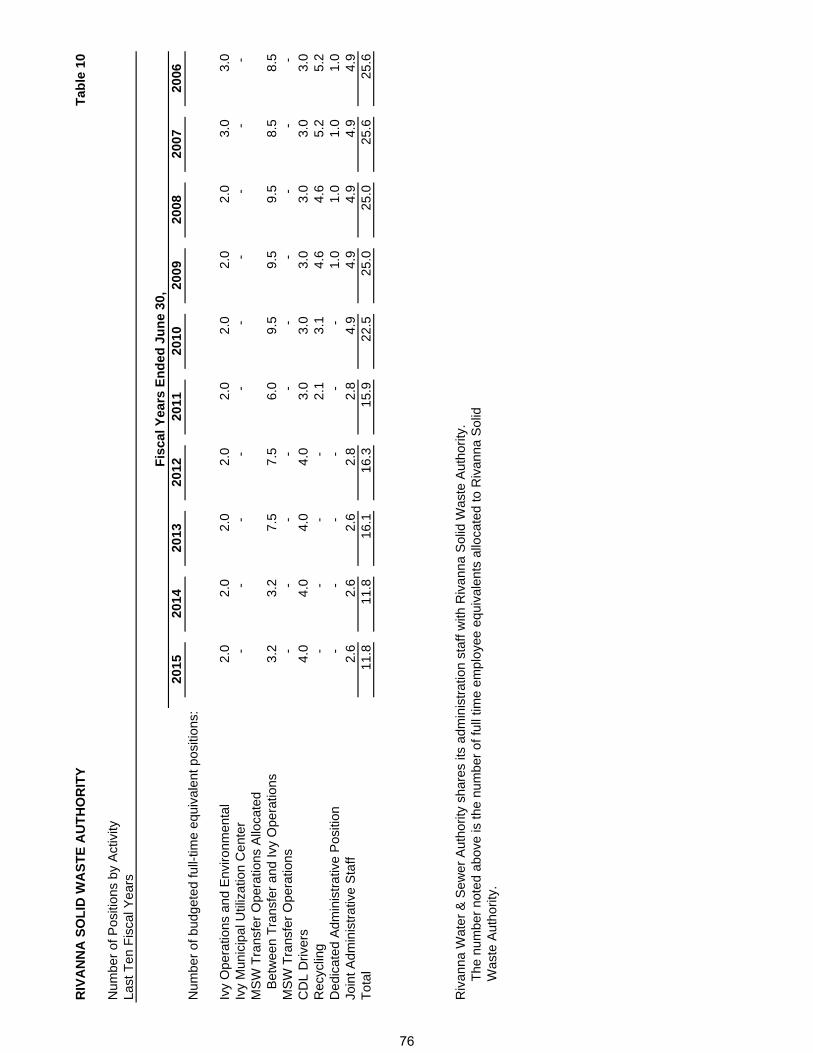
RIV
AN
NA
SO
LID
WA
ST
E A
UT
HO
RIT
YT
able
10
Num
ber
of P
ositi
ons
by A
ctiv
ityLa
st T
en F
isca
l Yea
rs
2015
2014
2013
2012
2011
2010
2009
2008
2007
2006
Num
ber
of b
udge
ted
full-
time
equi
vale
nt p
ositi
ons:
Ivy
Ope
ratio
ns a
nd E
nviro
nmen
tal
2.0
2.0
2.0
2.0
2.0
2.0
2.0
2.0
3.0
3.0
Ivy
Mun
icip
al U
tiliz
atio
n C
ente
r-
-
-
-
-
-
-
-
-
-
M
SW
Tra
nsfe
r O
pera
tions
Allo
cate
d
Bet
wee
n T
rans
fer
and
Ivy
Ope
ratio
ns3.
23.
27.
57.
56.
09.
59.
59.
58.
58.
5M
SW
Tra
nsfe
r O
pera
tions
-
-
-
-
-
-
-
-
-
-
CD
L D
river
s4.
04.
04.
04.
03.
03.
03.
03.
03.
03.
0R
ecyc
ling
-
-
-
-
2.1
3.1
4.6
4.6
5.2
5.2
Ded
icat
ed A
dmin
istr
ativ
e P
ositi
on-
-
-
-
-
-
1.
01.
01.
01.
0Jo
int A
dmin
istr
ativ
e S
taff
2.6
2.6
2.6
2.8
2.8
4.9
4.9
4.9
4.9
4.9
Tot
al
11.8
11.8
16.1
16.3
15.9
22.5
25.0
25.0
25.6
25.6
Riv
anna
Wat
er &
Sew
er A
utho
rity
shar
es it
s ad
min
istr
atio
n st
aff w
ith R
ivan
na S
olid
Was
te A
utho
rity.
The
num
ber
note
d ab
ove
is th
e nu
mbe
r of
full
time
empl
oyee
equ
ival
ents
allo
cate
d to
Riv
anna
Sol
idW
aste
Aut
horit
y.
Fis
cal Y
ears
En
ded
Ju
ne
30,
76
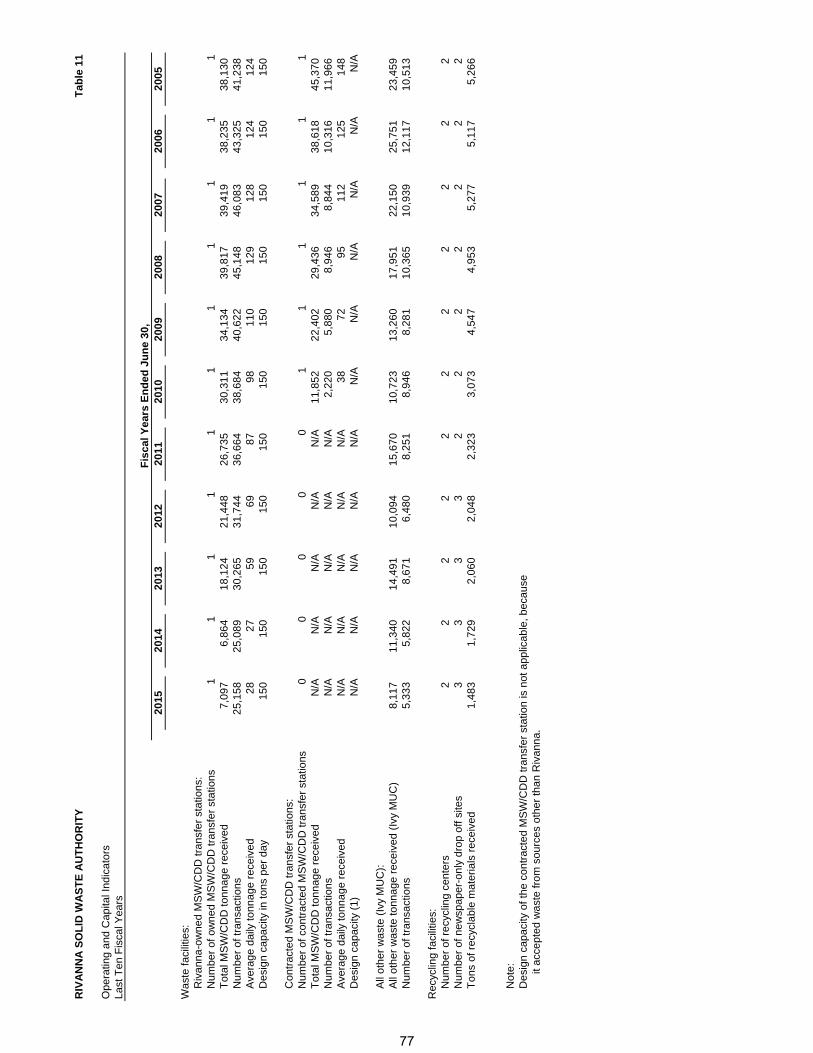
RIV
AN
NA
SO
LID
WA
ST
E A
UT
HO
RIT
YT
ab
le 1
1
Op
era
ting
an
d C
ap
ital I
nd
ica
tors
La
st T
en
Fis
cal Y
ea
rs
20
15
20
14
20
13
20
12
20
11
20
10
20
09
20
08
20
07
20
06
20
05
Was
te fa
cilit
ies:
Riv
an
na
-ow
ne
d M
SW
/CD
D tr
an
sfe
r st
atio
ns:
Num
ber
of o
wne
d M
SW
/CD
D tr
ansf
er s
tatio
ns1
11
11
11
11
11
To
tal M
SW
/CD
D to
nn
ag
e r
ece
ive
d7
,09
7
6
,86
4
1
8,1
24
21
,44
8
2
6,7
35
30
,31
1
3
4,1
34
39
,81
7
3
9,4
19
38
,23
5
3
8,1
30
Nu
mb
er
of t
ran
sact
ion
s2
5,1
58
25
,08
9
3
0,2
65
31
,74
4
3
6,6
64
38
,68
4
4
0,6
22
45
,14
8
4
6,0
83
43
,32
5
4
1,2
38
Ave
rag
e d
aily
ton
na
ge
re
ceiv
ed
28
27
59
69
87
98
11
0
12
9
12
8
12
4
12
4
De
sig
n c
ap
aci
ty in
ton
s p
er
da
y1
50
1
50
1
50
1
50
1
50
1
50
1
50
1
50
1
50
1
50
1
50
Con
trac
ted
MS
W/C
DD
tran
sfer
sta
tions
:N
umbe
r of
con
trac
ted
MS
W/C
DD
tran
sfer
sta
tions
00
00
01
11
11
1T
ota
l MS
W/C
DD
tonn
age
rece
ived
N/A
N/A
N/A
N/A
N/A
11,8
52
2
2,4
02
29
,43
6
3
4,5
89
38
,61
8
4
5,3
70
Nu
mb
er
of t
ran
sact
ion
sN
/AN
/AN
/AN
/AN
/A2
,22
0
5
,88
0
8
,94
6
8
,84
4
1
0,3
16
11
,96
6
A
vera
ge
da
ily to
nn
ag
e r
ece
ive
dN
/AN
/AN
/AN
/AN
/A3
8
7
2
9
5
1
12
1
25
1
48
D
esi
gn
ca
pa
city
(1
)N
/AN
/AN
/AN
/AN
/AN
/AN
/AN
/AN
/AN
/AN
/A
All
oth
er
wa
ste
(Iv
y M
UC
):A
ll o
the
r w
ast
e to
nn
ag
e r
ece
ive
d (
Ivy
MU
C)
8,1
17
11
,34
0
1
4,4
91
10
,09
4
1
5,6
70
10
,72
3
1
3,2
60
17
,95
1
2
2,1
50
25
,75
1
2
3,4
59
Nu
mb
er
of t
ran
sact
ion
s5
,33
3
5
,82
2
8
,67
1
6
,48
0
8
,25
1
8
,94
6
8
,28
1
1
0,3
65
10
,93
9
1
2,1
17
10
,51
3
Rec
yclin
g fa
cilit
ies:
Nu
mb
er
of r
ecy
clin
g c
en
ters
2
2
2
2
2
2
2
2
2
2
2
Nu
mb
er
of n
ew
spa
pe
r-o
nly
dro
p o
ff si
tes
3
3
3
3
2
2
2
2
2
2
2
To
ns
of r
ecy
cla
ble
ma
teri
als
re
ceiv
ed
1,4
83
1,7
29
2,0
60
2,0
48
2,3
23
3,0
73
4,5
47
4,9
53
5,2
77
5,1
17
5,2
66
No
te:
Des
ign
capa
city
of t
he c
ontr
acte
d M
SW
/CD
D tr
ansf
er s
tatio
n is
not
app
licab
le, b
ecau
se
it a
cce
pte
d w
ast
e fr
om
so
urc
es
oth
er
tha
n R
iva
nn
a.
Fis
ca
l Ye
ars
En
de
d J
un
e 3
0,
77
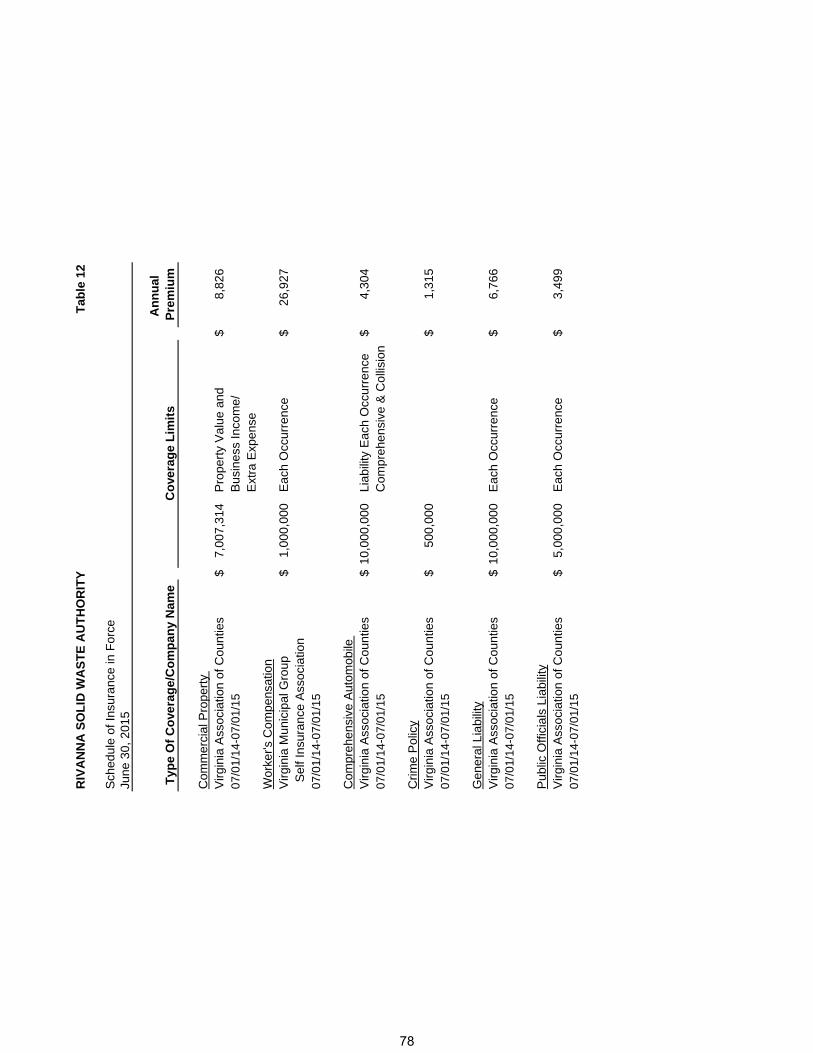
RIV
AN
NA
SO
LID
WA
ST
E A
UT
HO
RIT
YT
able
12
Sch
edul
e of
Ins
uran
ce in
For
ceJu
ne 3
0, 2
015
An
nu
al
Pre
miu
m
Com
mer
cial
Pro
pert
y V
irgin
ia A
ssoc
iatio
n of
Cou
ntie
s$
7,00
7,31
4P
rope
rty
Val
ue a
nd$
8,82
6
07
/01/
14-0
7/01
/15
Bus
ines
s In
com
e/E
xtra
Exp
ense
Wor
ker's
Com
pens
atio
nV
irgin
ia M
unic
ipal
Gro
up
$1,
000,
000
Eac
h O
ccur
renc
e$
26,9
27
S
elf
Insu
ranc
e A
ssoc
iatio
n07
/01/
14-0
7/01
/15
Com
preh
ensi
ve A
utom
obile
V
irgin
ia A
ssoc
iatio
n of
Cou
ntie
s$
10,0
00,0
00Li
abili
ty E
ach
Occ
urre
nce
$4,
304
07/0
1/14
-07/
01/1
5C
ompr
ehen
sive
& C
ollis
ion
Crim
e P
olic
yV
irgin
ia A
ssoc
iatio
n of
Cou
ntie
s$
500,
000
$1,
315
07/0
1/14
-07/
01/1
5
Gen
eral
Lia
bilit
yV
irgin
ia A
ssoc
iatio
n of
Cou
ntie
s$
10,0
00,0
00E
ach
Occ
urre
nce
$6,
766
07/0
1/14
-07/
01/1
5
Pub
lic O
ffici
als
Liab
ility
Virg
inia
Ass
ocia
tion
of C
ount
ies
$5,
000,
000
Eac
h O
ccur
renc
e$
3,49
9
07
/01/
14-0
7/01
/15
Typ
e O
f C
ove
rag
e/C
om
pan
y N
ame
Co
vera
ge
Lim
its
78
ROBINSON, FARMER, COX ASSOCIATES
CERTIFIED PUBLIC ACCOUNTANTS A PROFESSIONAL LIMITED LIABILITY COMPANY
Independent Auditors’ Report on Internal Control over Financial Reporting and on Compliance and Other Matters Based on an Audit of Financial Statements
Performed in Accordance with Government Auditing Standards To the Board of Directors Rivanna Solid Waste Authority Charlottesville, Virginia We have audited, in accordance with the auditing standards generally accepted in the United States of America; the standards applicable to financial audits contained in Government Auditing Standards, issued by the Comptroller General of the United States; and the Specifications for Audits of Authorities, Boards, and Commissions, issued by the Auditor of Public Accounts of the Commonwealth of Virginia, the financial statements of the business-type activities of Rivanna Solid Waste Authority as of and for the year ended June 30, 2015, and the related notes to the financial statements, which collectively comprise the Rivanna Solid Waste Authority’s basic financial statements and have issued our report thereon dated October 30, 2015. Internal Control Over Financial Reporting In planning and performing our audit of the financial statements, we considered Rivanna Solid Waste Authority’s internal control over financial reporting (internal control) to determine the audit procedures that are appropriate in the circumstances for the purpose of expressing our opinion on the financial statements, but not for the purpose of expressing an opinion on the effectiveness of Rivanna Solid Waste Authority’s internal control. Accordingly, we do not express an opinion on the effectiveness of Rivanna Solid Waste Authority’s internal control. A deficiency in internal control exists when the design or operation of a control does not allow management or employees, in the normal course of performing their assigned functions, to prevent, or detect and correct, misstatements on a timely basis. A material weakness is a deficiency, or a combination of deficiencies, in internal control such that there is a reasonable possibility that a material misstatement of the entity’s financial statements will not be prevented, or detected and corrected on a timely basis. A significant deficiency is a deficiency, or a combination of deficiencies, in internal control that is less severe than a material weakness, yet important enough to merit attention by those charged with governance. Our consideration of internal control was for the limited purpose described in the first paragraph of this section and was not designed to identify all deficiencies in internal control that might be material weaknesses or significant deficiencies. Given these limitations, during our audit we did not identify any deficiencies in internal control that we consider to be material weaknesses. However, material weaknesses may exist that have not been identified. Compliance and Other Matters As part of obtaining reasonable assurance about whether Rivanna Solid Waste Authority’s financial statements are free from material misstatement, we performed tests of its compliance with certain provisions of laws, regulations, contracts, and grant agreements, noncompliance with which could have a direct and material effect on the determination of financial statement amounts. However, providing an opinion on compliance with those provisions was not an objective of our audit, and accordingly, we do not express such an opinion. The results of our tests disclosed no instances of noncompliance or other matters that are required to be reported under Government Auditing Standards.
79
Purpose of this Report
The purpose of this report is solely to describe the scope of our testing of internal control and compliance and the results of that testing, and not to provide an opinion on the effectiveness of the entity’s internal control or on compliance. This report is an integral part of an audit performed in accordance with Government Auditing Standards in considering the entity’s internal control and compliance. Accordingly, this communication is not suitable for any other purpose.
Charlottesville, Virginia October 30, 2015
80