Comprehensive molecular characterization of lung tumors ...
19
Quintanal‑Villalonga et al. J Hematol Oncol (2021) 14:170 https://doi.org/10.1186/s13045‑021‑01186‑z RESEARCH Comprehensive molecular characterization of lung tumors implicates AKT and MYC signaling in adenocarcinoma to squamous cell transdifferentiation Alvaro Quintanal‑Villalonga 1* , Hirokazu Taniguchi 1 , Yingqian A. Zhan 2 , Maysun M. Hasan 3 , Shweta S. Chavan 4 , Fanli Meng 3 , Fathema Uddin 1 , Viola Allaj 1 , Parvathy Manoj 1 , Nisargbhai S. Shah 1 , Joseph M. Chan 1,5,6 , Metamia Ciampricotti 1 , Andrew Chow 1 , Michael Offin 1 , Jordana Ray‑Kirton 7 , Jacklynn D. Egger 1 , Umesh K. Bhanot 7 , Irina Linkov 7 , Marina Asher 7 , Michael H. Roehrl 7,8,9 , Katia Ventura 8 , Juan Qiu 10 , Elisa de Stanchina 10 , Jason C. Chang 7 , Natasha Rekhtman 7 , Brian Houck‑Loomis 3 , Richard P. Koche 2 , Helena A. Yu 1,11 , Triparna Sen 1,11* and Charles M. Rudin 1,11,12*† Abstract Background: Lineage plasticity, the ability to transdifferentiate among distinct phenotypic identities, facilitates ther‑ apeutic resistance in cancer. In lung adenocarcinomas (LUADs), this phenomenon includes small cell and squamous cell (LUSC) histologic transformation in the context of acquired resistance to targeted inhibition of driver mutations. LUAD‑to‑LUSC transdifferentiation, occurring in up to 9% of EGFR‑mutant patients relapsed on osimertinib, is associ‑ ated with notably poor prognosis. We hypothesized that multi‑parameter profiling of the components of mixed his‑ tology (LUAD/LUSC) tumors could provide insight into factors licensing lineage plasticity between these histologies. Methods: We performed genomic, epigenomics, transcriptomics and protein analyses of microdissected LUAD and LUSC components from mixed histology tumors, pre‑/post‑transformation tumors and reference non‑transformed LUAD and LUSC samples. We validated our findings through genetic manipulation of preclinical models in vitro and in vivo and performed patient‑derived xenograft (PDX) treatments to validate potential therapeutic targets in a LUAD PDX model acquiring LUSC features after osimertinib treatment. Results: Our data suggest that LUSC transdifferentiation is primarily driven by transcriptional reprogramming rather than mutational events. We observed consistent relative upregulation of PI3K/AKT, MYC and PRC2 pathway genes. Concurrent activation of PI3K/AKT and MYC induced squamous features in EGFR‑mutant LUAD preclinical models. Pharmacologic inhibition of EZH1/2 in combination with osimertinib prevented relapse with squamous‑features in an EGFR‑mutant patient‑derived xenograft model, and inhibition of EZH1/2 or PI3K/AKT signaling re‑sensitized resistant squamous‑like tumors to osimertinib. © The Author(s) 2021. Open Access This article is licensed under a Creative Commons Attribution 4.0 International License, which permits use, sharing, adaptation, distribution and reproduction in any medium or format, as long as you give appropriate credit to the original author(s) and the source, provide a link to the Creative Commons licence, and indicate if changes were made. The images or other third party material in this article are included in the article’s Creative Commons licence, unless indicated otherwise in a credit line to the material. If material is not included in the article’s Creative Commons licence and your intended use is not permitted by statutory regulation or exceeds the permitted use, you will need to obtain permission directly from the copyright holder. To view a copy of this licence, visit http://creativecommons.org/licenses/by/4.0/. The Creative Commons Public Domain Dedication waiver (http://creativeco mmons.org/publicdomain/zero/1.0/) applies to the data made available in this article, unless otherwise stated in a credit line to the data. Open Access *Correspondence: [email protected]; [email protected]; [email protected] † Charles M. Rudin: Lead contact 1 Department of Medicine, Thoracic Oncology Service, Memorial Sloan Kettering Cancer Center, 408 East 69th Street, ZRC‑1731, New York, NY 10021, USA Full list of author information is available at the end of the article
Transcript of Comprehensive molecular characterization of lung tumors ...

Quintanal‑Villalonga et al. J Hematol Oncol (2021) 14:170 https://doi.org/10.1186/s13045‑021‑01186‑z
RESEARCH
Comprehensive molecular characterization of lung tumors implicates AKT and MYC signaling in adenocarcinoma to squamous cell transdifferentiationAlvaro Quintanal‑Villalonga1*, Hirokazu Taniguchi1, Yingqian A. Zhan2, Maysun M. Hasan3, Shweta S. Chavan4, Fanli Meng3, Fathema Uddin1, Viola Allaj1, Parvathy Manoj1, Nisargbhai S. Shah1, Joseph M. Chan1,5,6, Metamia Ciampricotti1, Andrew Chow1, Michael Offin1, Jordana Ray‑Kirton7, Jacklynn D. Egger1, Umesh K. Bhanot7, Irina Linkov7, Marina Asher7, Michael H. Roehrl7,8,9, Katia Ventura8, Juan Qiu10, Elisa de Stanchina10, Jason C. Chang7, Natasha Rekhtman7, Brian Houck‑Loomis3, Richard P. Koche2, Helena A. Yu1,11, Triparna Sen1,11* and Charles M. Rudin1,11,12*†
Abstract
Background: Lineage plasticity, the ability to transdifferentiate among distinct phenotypic identities, facilitates ther‑apeutic resistance in cancer. In lung adenocarcinomas (LUADs), this phenomenon includes small cell and squamous cell (LUSC) histologic transformation in the context of acquired resistance to targeted inhibition of driver mutations. LUAD‑to‑LUSC transdifferentiation, occurring in up to 9% of EGFR‑mutant patients relapsed on osimertinib, is associ‑ated with notably poor prognosis. We hypothesized that multi‑parameter profiling of the components of mixed his‑tology (LUAD/LUSC) tumors could provide insight into factors licensing lineage plasticity between these histologies.
Methods: We performed genomic, epigenomics, transcriptomics and protein analyses of microdissected LUAD and LUSC components from mixed histology tumors, pre‑/post‑transformation tumors and reference non‑transformed LUAD and LUSC samples. We validated our findings through genetic manipulation of preclinical models in vitro and in vivo and performed patient‑derived xenograft (PDX) treatments to validate potential therapeutic targets in a LUAD PDX model acquiring LUSC features after osimertinib treatment.
Results: Our data suggest that LUSC transdifferentiation is primarily driven by transcriptional reprogramming rather than mutational events. We observed consistent relative upregulation of PI3K/AKT, MYC and PRC2 pathway genes. Concurrent activation of PI3K/AKT and MYC induced squamous features in EGFR‑mutant LUAD preclinical models. Pharmacologic inhibition of EZH1/2 in combination with osimertinib prevented relapse with squamous‑features in an EGFR‑mutant patient‑derived xenograft model, and inhibition of EZH1/2 or PI3K/AKT signaling re‑sensitized resistant squamous‑like tumors to osimertinib.
© The Author(s) 2021. Open Access This article is licensed under a Creative Commons Attribution 4.0 International License, which permits use, sharing, adaptation, distribution and reproduction in any medium or format, as long as you give appropriate credit to the original author(s) and the source, provide a link to the Creative Commons licence, and indicate if changes were made. The images or other third party material in this article are included in the article’s Creative Commons licence, unless indicated otherwise in a credit line to the material. If material is not included in the article’s Creative Commons licence and your intended use is not permitted by statutory regulation or exceeds the permitted use, you will need to obtain permission directly from the copyright holder. To view a copy of this licence, visit http:// creat iveco mmons. org/ licen ses/ by/4. 0/. The Creative Commons Public Domain Dedication waiver (http:// creat iveco mmons. org/ publi cdoma in/ zero/1. 0/) applies to the data made available in this article, unless otherwise stated in a credit line to the data.
Open Access
*Correspondence: [email protected]; [email protected]; [email protected]†Charles M. Rudin: Lead contact1 Department of Medicine, Thoracic Oncology Service, Memorial Sloan Kettering Cancer Center, 408 East 69th Street, ZRC‑1731, New York, NY 10021, USAFull list of author information is available at the end of the article

Page 2 of 19Quintanal‑Villalonga et al. J Hematol Oncol (2021) 14:170
BackgroundLineage plasticity, the ability of cells to transdifferenti-ate from one committed fate to a distinct developmen-tal lineage, has been implicated as a driver of resistance to targeted therapies in multiple cancer types [1]. In patients with lung adenocarcinoma (LUAD), the advent of potent and selective targeted inhibitors of primary driver mutations, and the increased practice of tumor re-biopsy at the time of treatment relapse, has led to increasing recognition of lineage plasticity as a common mechanism of acquired resistance and treatment failure. The first example of this phenomenon to be character-ized in lung cancer was neuroendocrine transformation of EGFR-mutant LUADs to tumors resembling small cell lung cancer [2, 3]. Such tumors retain the EGFR driver mutation but lose dependence on EGFR signaling for survival and proliferation. More recently, histologic transdifferentiation of LUAD to squamous carcinoma of the lung (LUSC) has also been observed in associa-tion with acquired resistance to highly active targeted therapies [4–6]. Interestingly, even if targeted agents may promote transdifferentiation, the existence of untreated adenosquamous tumors containing areas of LUAD and LUSC showing shared driver alterations in both his-tological components [7, 8] suggests that this lineage plasticity phenomenon may occur in the absence of the selective pressure exerted by treatment. Mixed histology non-small cell lung cancer has a remarkably poor prog-nosis across stage, significantly worse than either LUAD or LUSC [9]. A better understanding of potential drivers of histologic transdifferentiation in lung cancer is desper-ately needed to define more effective therapeutic strate-gies for these patients.
The primary drivers of LUAD to LUSC transdifferen-tiation have not been defined in human tumors. Line-age plasticity between LUAD and LUSC histologies has been observed in a murine model of Kras-mutant LUAD that transdifferentiated to LUSC upon Lkb1 loss [10], but STK11 (encoding human LKB1) loss-of-function muta-tions and deletions are among the most common somatic events in human LUAD [11]. Due to the sparseness of well-annotated matched pre- and post-clinical specimens and the absence of representative preclinical models, lit-tle is known about the molecular alterations that facili-tate LUSC transdifferentiation.
Adenosquamous carcinomas containing discrete areas of LUAD and LUSC histology amenable for
physical isolation for independent molecular analyses may provide insight into lineage plasticity along this axis. The occurrence of common driver mutations in both histologic components in such cases [7, 8] sug-gests a recent divergence in phenotypic commitment to adenomatous vs. squamous lineages. We hypoth-esized that defining common genetic and epigenetic differences between LUAD and LUSC components in the constrained environment of these mixed histology tumors could define candidate determinants of LUAD to LUSC transdifferentiation, which could be subse-quently validated in manipulable models. In this study, we examined lineage plasticity between LUAD and LUSC by integrated genomic, epigenomic, transcrip-tomic and protein analyses of (1) mixed LUAD/LUSC tumors with discrete areas of each histology and (2) pre- and post-transdifferentiation specimens, including matched pairs. We then interrogated the effects of can-didate drivers in preclinical models of human LUAD. Our findings provide the first comprehensive molecular characterization of LUSC transdifferentiation, nomi-nating key drivers and potential therapeutic targets to prevent or treat this mechanism of tumor escape from targeted therapies.
MethodsClinical specimens11 Formalin-fixed paraffin-embedded (FFPE) tumors with combined LUAD and LUSC histology were iden-tified, from which independent isolation of both his-tological components was possible (N = 11, Additional file 1: Table S1). As the components of these mixed his-tology tumors are not temporally ordered, we refer to the component parts of these mixed histology tumors as “T-LUAD” and “T-LUSC” with the T referring to histologic transformation, without presumption of directionality. We identified an additional 4 pre-trans-formation LUAD and 7 post-transformation LUSC cases for which tissue material was available (Addi-tional file 1: Table S1). As controls, we included a group of never-transformed LUADs (N = 15) and a set of de novo LUSC samples (N = 11) (Additional file 1: Tables S2,3). All study subjects had provided signed informed consent for biospecimen analyses under an institutional review board-approved protocol.
Conclusions: Our findings provide the first comprehensive molecular characterization of LUSC transdifferentiation, suggesting putative drivers and potential therapeutic targets to constrain or prevent lineage plasticity.
Keywords: Lineage plasticity, Squamous transdifferentiation, Treatment resistance, Targeted therapy

Page 3 of 19Quintanal‑Villalonga et al. J Hematol Oncol (2021) 14:170
Tissue isolationFor microdissection, hematoxylin and eosin (H&E)-stained FFPE tumor slides of tumors with combined LUAD/LUSC were evaluated by a pathologist. Multiple FFPE blocks of each tumor were reviewed, with the aim of selecting areas containing exclusively the LUAD or the LUSC component. Where individual slides with pure components were not available, slides containing both histologic components with complete physical separa-tion were selected. Between 10 and 20 unstained sections (USS) at 10 μm prepared on uncharged slides from cor-responding FFPE blocks were used for microdissection of each case. Every 10 sections, an additional section was stained with H&E for confirmation of histology. The areas corresponding to each histological component on the ini-tial H&E were dissected using a clean blade and the tissue collected in 0.5-ml nuclease-free tubes for nucleic acid extraction. Alternatively, 1.0–1.5-mm core punches were made from LUAD and LUSC areas on the FFPE blocks and placed in 0.5-ml nuclease-free tubes for nucleic acid extraction, exclusively in cases where each histologic component was located in a different block and where no histologic cross-contamination was confirmed by patho-logical review.
DNA extractionFFPE tissue was deparaffinized using heat treatment (90 °C for 10’ in 480 μL PBS and 20 μL 10% Tween 20), centrifugation (10,000 × g for 15’) and ice chill. Paraf-fin and supernatant were removed, and the pellet was washed with 1 mL 100% EtOH followed by an incuba-tion overnight in 400 µl 1 M NaSCN for rehydration and impurity removal. Tissues were subsequently digested with 40 µl Proteinase K (600 mAU/ml) in 360 µl Buffer ATL at 55 °C. DNA isolation proceeded with the DNeasy Blood & Tissue Kit (QIAGEN catalog #69504) accord-ing to the manufacturer’s protocol modified by replacing AW2 buffer with 80% ethanol. DNA was eluted in 0.5X Buffer AE.
RNA/DNA dual extraction from FFPE tissueFFPE sections were deparaffinized in mineral oil. Briefly, 800µL mineral oil (Fisher Scientific, #AC415080010) and 180µL Buffer PKD were mixed with the sections, Pro-teinase K was added for tissue digestion, and the sample was incubated at 56 °C for 15 min. Phase separation was encouraged with centrifugation, and the aqueous phase was chilled 3 min to precipitate RNA. After centrifuga-tion for 15 min at 20,000 g, RNA-containing supernatant was removed for extraction, while DNA remained in the pellet. Nucleic acids were subsequently extracted using the AllPrep DNA/RNA Mini Kit (QIAGEN, #80204)
according to the manufacturer’s instructions. RNA was eluted in nuclease-free water and DNA in 0.5X Buffer ATE.
Whole exome sequencingFor DNA samples, after PicoGreen quantification and quality control by Agilent BioAnalyzer, 100–500 ng of DNA were used to prepare libraries using the KAPA Hyper Prep Kit (Kapa Biosystems KK8504) with 8 cycles of PCR. After sample barcoding, 100 ng of library was captured by hybridization using the xGen Exome Research Panel v1.0 (IDT) according to the manufac-turer’s protocol. PCR amplification of the post-capture libraries was carried out for 12 cycles.
For DNA library samples, after PicoGreen quantifica-tion and quality control by Agilent BioAnalyzer, 100 ng of library transferred from the DMP was captured by hybridization using the xGen Exome Research Panel v1.0 (IDT) according to the manufacturer’s protocol. PCR amplification of the post-capture libraries was carried out for 8 cycles.
Samples were run on a HiSeq 4000 in a 100 bp/100 bp paired end run, using the HiSeq 3000/4000 SBS Kit (Illu-mina). Normal and tumor samples had a median target coverage of 87X and 108X, respectively.
Whole exome analysisWe used a comprehensive in-house WES pipeline TEMPO—time-efficient mutational profiling in oncology (https:// github. com/ mskcc/ tempo & https:// ccste mpo. netli fy. app) that performs alignment using BWA-mem algorithm followed by mutation calling using Strelka2 and Mutect2 variant callers. The combined, annotated and filtered variant calls were used for downstream anal-ysis. Details of the variant call processing are described at https:// ccste mpo. netli fy. com/ varia nt- annot ation- and- filte ring. html# somat ic- snvs- and- indels and are previ-ously described as well [12]. Copy number analysis was performed with FACETS (https:// github. com/ mskcc/ facets), processed using facets-suite (https:// github. com/ mskcc/ facets- suite), and manual reviewed and refitted using facets-preview (https:// github. com/ taylor- lab/ fac-ets- previ ew). To delineate mutational processes driving the acquisition of somatic alterations, mutational signa-tures were decomposed for all tumor samples that had a minimum of 5 single-nucleotide somatic mutations using the R package mutation signatures (https:// github. com/ mskcc/ mutat ion- signa tures). Further, a given signa-ture was considered to be ‘dominant’ if the proportion of mutations contributing to the signature was at least 20% of all mutations detected in the sample.
Purity, ploidy, tumor mutational burden (TMB), genome doubling and cancer cell fractions for all

Page 4 of 19Quintanal‑Villalonga et al. J Hematol Oncol (2021) 14:170
mutations in all specimens were inferred from sequenc-ing data. We estimated neoantigen load by taking the number of variant estimated to having strong class I MHC binding affinity by NetMHC 4.0 [13] and normal-izing it by the TMB. We summarized the top occurring somatic variants located on cancer genes in an oncoprint using the R package ComplexHeatmaps version 2.0.0 (https:// github. com/ joker goo/ Compl exHea tmap) [14]. Cancer genes were genes defined as “OncoKB Anno-tated” on the Cancer Gene List (downloaded in June 2020, https:// www. oncokb. org/ cance rGenes). All other plots for this analysis were created using ggplot2 version 3.3.2 (https:// github. com/ tidyv erse/ ggplo t2).
Comparison to TCGA Somatic mutations and copy number alterations (CNAs) found in cancer genes in our T-LUAD samples were com-pared to those found in The Cancer Genome Atlas Lung Adenocarcinoma (TCGA-LUAD) cohort using a Fisher exact test. The mutations from TCGA-LUAD [15] were extracted using the R package TCGA mutations (https:// github. com/ Poiso nAlien/ TCGAm utati ons) and tested against our cohort mutations with maftools v.2.0.16 (https:// github. com/ Poiso nAlien/ mafto ols) [16]. Sepa-rately, a Fisher exact test was used to identify significant CNAs by comparing the number of samples with ampli-fications and deletions on particular genes in TCGA-LUAD, extracted from CbioPortal [17, 18], to the number of samples with gene level CNAs in our cohort. For both mutations and CNAs, genes with p < 0.05 were consid-ered differentially altered. The results were summarized in a volcano plot using the R packages, EnhancedVolcano version 1.7.4 (https:// github. com/ kevin blighe/ Enhan cedVo lcano) and ggplot.
Methylation sequencingAfter PicoGreen quantification (ThermoFisher, #P11496) and quality control by Agilent BioAnalyzer, 170–750 ng of genomic DNA was sheared using a LE220-plus Focused-ultrasonicator (Covaris, #500569). Samples were cleaned using Sample Purification Beads from the TruSeq Methyl Capture EPIC LT Library Prep Kit (Illu-mina, #FC-151-1002) according to the manufacturer’s instructions with modifications. Briefly, samples were incubated for 5 min after addition of SPB, 50 µL RSB was added for resuspension, and resuspended samples were incubated for 2 min. Sequencing libraries were prepared using the KAPA Hyper Prep Kit (Kapa Biosys-tems KK8504) without PCR amplification. Post-ligation cleanup proceeded according to Illumina’s instructions with 110 µL Sample Purification Mix. After purification, 3–4 samples were pooled equimolar and methylome regions were captured using EPIC oligos. Capture pools
were bisulfite converted and amplified with 11–12 cycles of PCR. Pools were sequenced on a NovaSeq 6000 or HiSeq 4000 in a 150/150 bp or 100 bp/100 bp paired end run, using the NovaSeq 6000 S4 Reagent Kit (300 Cycles) or HiSeq 3000/4000 SBS Kit (Illumina). The average number of read pairs per sample was 51 million.
DNA methyl capture EPIC data processingThe Bismark pipeline [19] was adopted to map bisulfite-treated EPIC sequencing reads and determine cyto-sine methylation states. Trim Galore v0.6.4 was used to remove raw reads with low-quality (less than 20) and adapter sequences. The trimmed sequence reads were C(G) to T(A) converted and mapped to similarly con-verted reference human genome (hg19) [20] using default Bowtie 2 [21] settings within Bismark. Duplicated reads were discarded. The remaining alignments were then used for cytosine methylation calling by Bismark meth-ylation extractor.
Differential methylation analysisDifferentially methylated CpGs (DMCs) were identi-fied using DSS R package [22, 23] on the basis of dis-persion shrinkage followed by Wald statistical test for beta-binomial distributions. Any CpGs with FDR < 0.1 and methylation percentage difference greater than 10% were considered significant DMCs. Differentially methyl-ated regions (DMRs) were subsequently called based on the DMCs. The called DMRs were required to satisfy the minimum length of 50bps and minimum 3 CpGs in the region; two neighboring DMRs were merged if less than 50bps apart, and significant CpGs were those that occupy at least 50% of all CpGs population in the called DMRs as default in DSS package. Pairwise comparisons were con-ducted for pre-transformation pre-transformation LUAD versus control LUAD, post-transformation LUSC versus de novo LUSC, and post-transformation LUSC versus pre-transformation LUAD. The DMRs were mapped to gene regions at promoters and gene bodies, and differen-tial methylation levels were subsequently associated with differential gene expression values in selected pathways. In addition to pairwise comparisons, principal compo-nent analysis (PCA) and partial least square discriminant analysis (PLSDA) were also performed to classify samples into groups and identify influential CpGs using mixOm-ics R package [23].
Motif enrichment analysisDifferential methylation may influence transcription fac-tor (TF) binding. To identify overrepresented known TF motifs due to differential methylation for the post-transformation LUSC compared with pre-transfor-mation LUAD, “findMotifsGenome.pl” from HOMER

Page 5 of 19Quintanal‑Villalonga et al. J Hematol Oncol (2021) 14:170
[24] was applied to DMCs (± 50bps) overlapping with gene promoter regions. DMCs regions with hyper- and hypo-methylation in LUSC were explored separately to show the effects from different methylation status. The significantly enriched TFs were defined as those with q value ≤ 0.1.
RNA sequencingApproximately 500 ng of FFPE RNA or 100 ng of fresh frozen RNA per sample was used for RNA library con-struction using the KAPA RNA Hyper library prep kit (Roche, Switzerland) per the manufacturer’s instruc-tions with minor modifications. Customized adapters with unique molecular indexes (UMI) (Integrated DNA Technologies, US) and Sample-specific dual-indexes primers (Integrated DNA Technologies, US) were added to each library. The quantity of libraries was measured with Qubit (Thermo Fisher Scientific, US) and quality measured by TapStation Genomic DNA Assay (Agilent Technologies, US). Equal amounts of each RNA library (around 500 ng) were pooled for hybridization capture with IDT Whole Exome Panel V1 (Integrated DNA Tech-nologies, US) using a customized capture protocol modi-fied from NimbleGen SeqCap Target Enrichment system (Roche, Switzerland). The captured DNA libraries were then sequenced on an Illumina HiSeq4000 with paired end reads (2 Å ~ 100 bp), at 50millions reads/sample.
RNASeq analysisIn-line UMI sequences were trimmed from the sequenc-ing reads with Marianas (https:// github. com/ mskcc/ Maria nas) and aligned to human GRCh37 genome using STAR 2.7.0 (https:// github. com/ alexd obin/ STAR) [25] with Ensembl v75 gene annotation. Hybrid selection-specific metrics and alignment metrics were calculated for the BAM files using CalculateHsMetrics and Col-lectRnaSeqMetrics, respectively, from Picard Toolkit (https:// github. com/ broad insti tute/ picard) to determine the quality of the capture.
We quantified RNA-seq reads with Kallisto v.0.45.0 [26] to obtain transcript counts and abundances. Kallisto was run with 100 bootstrap samples, sequence-based bias correction and in strand-specific mode, which pro-cessed only the fragments where the first read in a pair is pseudoaligned to the reverse strand of a transcript. Differential gene expression analysis, principle compo-nent analysis and transcript per million (TPM) normali-zation by size factors were done from Kallisto output files using Sleuth v0.30.0 run in gene mode [27]. Differ-entially expressed genes were identified using the Wald test. Genes were marked significant if the False Discov-ery Rates, q, calculated using the Benjamini–Hochberg method, were less than 0.05, and beta (Sleuth-based
estimation of log2 fold change) > 1.25, which approxi-mately correlated with a log2 fold change of 2 in our data. The log of the normalized TPM values for selected signif-icant genes was rescaled using a z-score transformation and plotted in a heatmap using the ComplexHeatmap Library in R.
Pathway enrichmentGene set enrichment analysis (GSEA) [28] was performed on full sets of gene expression data across the previously mentioned three comparisons. Genes were ranked on p value scores computed as − log10(p value) * (sign of beta). Gene set annotations were taken from Molecu-lar Signatures Database (MSigDB v7.0.1) [28, 29]. The significance level of enrichment was evaluated using permutation test, and the p value was adjusted by Benja-mini–Hochberg procedure. Any enriched gene sets with adjusted p value ≤ 0.1 were regarded as significant. This analysis was conducted using ClusterProfiler R pack-age [30]. The enriched gene sets that are influenced by DMCs were selected, and pathway annotations concat-enated manually to remove redundancy and achieve high level generality. When the pathway terms were merged, median enrichment score was taken as the new group enrichment score, p values were aggregated using Fisher’s method from the Aggregation R package [31], and core enrichment of genes was collapsed.
LUSC subtypingWilkerson’s model [32] was used to predict LUSC sub-types by a nearest centroid classification algorithm. An expression heatmap on centroid genes was produced by ‘ComplexHeatmap’ library in R. Chi-square test was per-formed to detect the association between cell types and subtypes.
ImmunoblottingProtein extraction and Western blot were performed as previously described [33] after quantification of protein extracts using the Bradford method (#5000205, Bio-Rad), running 10–30-ug aliquots in the gels. Western blot antibodies for Beta-catenin (#8480, Cell Signaling Technology), pAKT (#4060, Cell Signaling Technology), p40 (#67825, Cell Signaling Technology), EGFR (#4267, Cell Signaling Technology), EZH2 (#5246, Cell Signal-ing Technology), MYC (#13987, Cell Signaling Technol-ogy), pPRAS40 (#2997, Cell Signaling Technology), SOX2 (#3579, Cell Signaling Technology), Vinculin (#13901, Cell Signaling Technology) and actin (#3700, Cell Signal-ing Technology) were used. Immunohistochemistry anti-bodies for p40 (#AC13066A, BioCare), TTF-1 (#M3575, Dako), CK5/6 (#790-4554, Ventana) and MYC (#ab32072, Abcam) were used.
Page 6 of 19Quintanal‑Villalonga et al. J Hematol Oncol (2021) 14:170
Protein extraction from FFPEProtein extraction from punches on the LUAD and LUSC components of combined histology FFPE blocks was per-formed following the instructions from the Qproteome FFPE Tissue Kit (#37623, Qiagen), using one punch per extraction.
Phospho‑kinase arrayProtein samples were quantified with the Bradford method (#5000205, Bio-Rad), and 200-ug aliquots were used in the phospho-kinase array (#ARYC003C, R&D-Biotechne), which was performed using the manufactur-er’s instructions. Quantification of spots was performed using the Image Studio software (Version 3.1, Li-Cor). Technical replicates (2 per array) per sample were aver-aged. Two-tailed Student’s T-test was performed on these values, comparing the T-LUAD and T-LUSC groups.
Cell line transductionsLx462 cell line was derived by PDX dissociation using the tumor dissociation kit (#130-95-929, Miltenyi) and GentleMACS Octo Dissociator with Heaters (Miltenyi, #130-096-427) as indicated by the manufacturer. Dis-sociated cells were seeded in RPMI 1640 10% FBS and expanded in culture. PC9 cell line was purchased from Millipore Sigma (#90071810-VL). Both cell lines were regularly tested for Mycoplasma and maintained in RPMI 1640 10% FBS. Lentiviruses were produced as previ-ously described [34] with a MYC overexpression plasmid (#10674, Addgene) and a myrAKT overexpression plas-mid, kindly provided by Dr. Witte [35]. Cell lines were transduced at high MOI as previously described [34] with overnight virus incubation.
Xenografts and in vivo treatmentsFor cell line xenografts, 1 million cells were injected in a 1:1 mixture of PBS and Matrigel (#CB40234, Fisher) in the flanks of NOD.Cg-Prkdc < scid > Il2rg < tm1Wjl > /SzJ (NSG) mice. For patient-derived xenografts, tumor was dissociated as described above, and 1 mil-lion cells were injected in a 1:1 mixture of PBS and Matrigel (#CB40234, Fisher) in the flanks of NOD.Cg-Prkdc < scid > Il2rg < tm1Wjl > /SzJ (NSG) mice.
For treatments, 5–6 mice were engrafted per treat-ment arm (please see figure legends for details) until they reached 100–150 mm3. At that point, mice were randomized into groups and treated with either vehicle, osimertinib (25 mg/kg/day), ORS1 (100 mg/kg/day) or samotolisib (10 mg/kg/day), or combinations of osimer-tinib and ORS1, or of osimertinib and samotolisib, by oral gavage 5 days a week. Mice were killed when tumors
reached ~ 1000 mm3 and fixed in formalin 10% O/N for paraffin embedding. Tumors and mice body weight were measured twice a week.
To generate osimertinib-resistant Lx462 tumors, these were treated with osimertinib in the previously men-tioned conditions until relapse (~ 1000 mm3), when tumors were collected, dissociated and re-engrafted to continue osimertinib treatment. At second relapse on osimertinib, mice were considered resistant.
ResultsGenomic characterization of LUSC transformationWe began our analysis by identifying eleven lung aden-osquamous clinical specimens with clear spatial sepa-ration of the LUAD and LUSC components (Figs. 1a, b and Additional file 1: Table S1, Samples #1–11). We also identified pure histology pre-transdifferentiation LUADs (N = 4) and post-transdifferentiation LUSC (N = 7), including 3 matched cases (Fig. 1a and Addi-tional file 1: Table S1 Samples #12–19), of squamous relapse on targeted therapy with known previous his-tory of adenocarcinoma, where a common driver altera-tion was confirmed clinically by targeted sequencing. Control LUAD (N = 15) and LUSC (N = 11) samples with no history of histologic transitions were analyzed in parallel as an anchor for group comparisons made (Fig. 1a and Additional file 1: Tables S2,3). In the aden-osquamous cases, LUAD and LUSC components were micro-dissected and subjected to independent genomic, methylomic, transcriptomic and protein analyses (Fig. 1c and Additional file 1: Table S4).
Mixed histology tumors with discrete areas of LUAD and LUSC could reflect subclonal histologic divergence of a single parental clone, or alternatively could reflect independent oncogenic events arising in a patient at risk of lung cancer due to field carcinogenesis. To con-firm a common clonal origin of both histological deriva-tives in these samples, we analyzed all paired samples for shared somatic mutations. Whole exome sequencing (WES) of LUAD and LUSC components from adenos-quamous specimens (N = 11) and the matched pre- and post-transdifferentiation pairs (N = 3) revealed multiple shared mutations in all but one case (T6). Although low tumor purity of the LUAD component in this question-able case may explain this result (Additional file 2: Fig-ure S1B), we elected to discard this case from further analyses (Fig. 2A). For one adenosquamous case (T11) with no WES data available, clonal relation of the LUAD and LUSC components was confirmed by detection of shared mutations in the RNAseq data (Additional file 2: Figure S1A). We refer to the genetically related samples hereafter as T-LUAD and T-LUSC with the T referring to histologic transdifferentiation, with no presumption of

Page 7 of 19Quintanal‑Villalonga et al. J Hematol Oncol (2021) 14:170
directionality. These results further support the existence of lineage plasticity in adenosquamous samples, consist-ent with previous reports [7, 36].
There were no consistent differences in sample purity (Additional file 2: Figure S1B), sample ploidy (Addi-tional file 2: Figure S1C), or tumor mutational burden (Additional file 2: Figure S1D) between T-LUAD and T-LUSC samples. Analyses of mutational signatures revealed a predominance of smoking and aging signa-tures as expected, without consistent differences between T-LUAD and T-LUSC pairs (Additional file 2: Figure S1E). Frequently observed genomic alterations included mutation of TP53 (9/16 cases) and EGFR (7/16 cases),
and deletion of genes located in the 9q21 chromosome region including MTAP (5/16 cases), CDKN2A (4/16) and CDKN2B (4/16) (Fig. 2b). Four of 16 cases showed alterations of STK11 (Fig. 2b), similar to the observed rate of 17% among over 6700 LUAD cases sequenced at our institution. None of these frequently altered genes were differentially mutated between matched T-LUAD and T-LUSC samples. These results do not suggest a par-ticular genomic context in which LUSC transformation is strongly favored.
To further explore genetic alterations that might facili-tate LUSC transdifferentiation, we performed enrichment analyses comparing our T-LUAD samples with TCGA
Fig. 1 Multilayer molecular characterization of LUSC transformation. a Schematic composition of the cohort under study. b Illustrative H&E images of two adenosquamous samples with clear spatial isolation of the LUAD and LUSC components. c Schema showing the processing of adenosquamous samples for molecular analyses

Page 8 of 19Quintanal‑Villalonga et al. J Hematol Oncol (2021) 14:170
LUADs as control (Figs. 2c, d and Additional file 2: Fig-ure S1F). We focused only on those genomic alterations occurring in > 20% of T-LUAD due to the limited size of our cohort (Fig. 2d). We found significant enrichment of mutations in TBX3 (25.0% T-LUAD versus 2.6% LUAD,
p-value = 0.005), a transcriptional repressor involved in development and overexpressed in multiple cancer types, including squamous tumors [37, 38]; MET (25% T-LUAD versus 4.0% LUAD, p-value = 0.013), a receptor tyrosine kinase whose amplification confers resistance to EGFR
Fig. 2 Genomic characterization of LUSC transformation. a Bar blot showing number of mutations occurring specifically in the T‑LUAD (blue) and T‑LUSC (red) components, and of mutations shared between these (green). b Oncoprint showing the most prevalent mutations and CNAs in the transformation samples. c Volcano plot showing enrichment (as shown by odds ratio, OR) of genomic alterations in our T‑LUAD samples, compared to the TCGA LUAD samples, used as control cohort. d Barplot showing the percentage of cases harboring mutations in genes of interest in the T‑LUAD (red) and TCGA LUAD (blue) cohorts. Samples IDs in black indicate that they come from a combined histology specimen where LUAD and LUSC components are genetically related. Samples IDs in blue indicate that they come from a combined histology specimen where LUAD and LUSC components are genetically unrelated. Samples IDs in red indicate that they come from a pre‑/post‑transformation specimen

Page 9 of 19Quintanal‑Villalonga et al. J Hematol Oncol (2021) 14:170
inhibitors in EGFR-mutant LUADs [39] and is altered in 6% of LUSC(40); and RBM10 (33.3% T-LUAD versus 7.3% LUAD, p-value = 0.011), an RNA binding protein and alternative splicing regulator, implicated as a tumor suppressor and frequently deleted or mutated in human cancers [41, 42] (Fig. 2d). These data nominate TBX3, MET, and RBM10 alterations as molecular contexts that may facilitate transdifferentiation. Even if unlikely driv-ers, these alterations may potentially serve as predictors of LUSC transdifferentiation.
T‑LUSC is enriched in the secretory subtype, and retains transcriptomic and methylomic features of T‑LUADsWe next performed transcriptome (RNAseq) and meth-ylation (EPIC) analyses of T-LUADs, T-LUSCs, control LUADs and LUSCs. LUSCs have been divided into four subtypes distinguished by distinct transcriptional pro-files, termed classical, secretory, primitive and basal [32]. Subtype distribution in control LUSCs in our cohort essentially mirrored previously reported cohorts (Fig. 3a) [32]. However, subtype distribution among T-LUSCs was substantially skewed, with no classical subtype sam-ples and a marked enrichment of the secretory subtype (p = 0.0067) (Fig. 3a and Additional file 2: Figure S2A). Notably, the transcriptional program of the secretory subtype is most closely aligned with that of LUAD [32].
To gain further insight into the commonalities and dif-ferences among our defined cohorts, we performed par-tial least squares discriminant analysis (PLSDA) on both the transcriptional and methylation datasets. PLSDA of the RNAseq data showed distinct clustering of control LUAD and control LUSC, with higher transcriptional diversity among the LUSC samples (Fig. 3b). T-LUSC showed extensive overlap with T-LUAD and partial over-lap with both control LUAD and control LUSC. This suggests that T-LUSC retain some transcriptomic fea-tures of LUAD (Fig. 3b). PLSDA of genome-wide meth-ylation showed substantial overlap between the profiles of T-LUAD and T-LUSC, with both of these groups more closely associated with control LUAD than with control LUSC (Fig. 3c). These data suggest that tumors
undergoing LUSC transdifferentiation retain epigenomic features of their previous LUAD state.
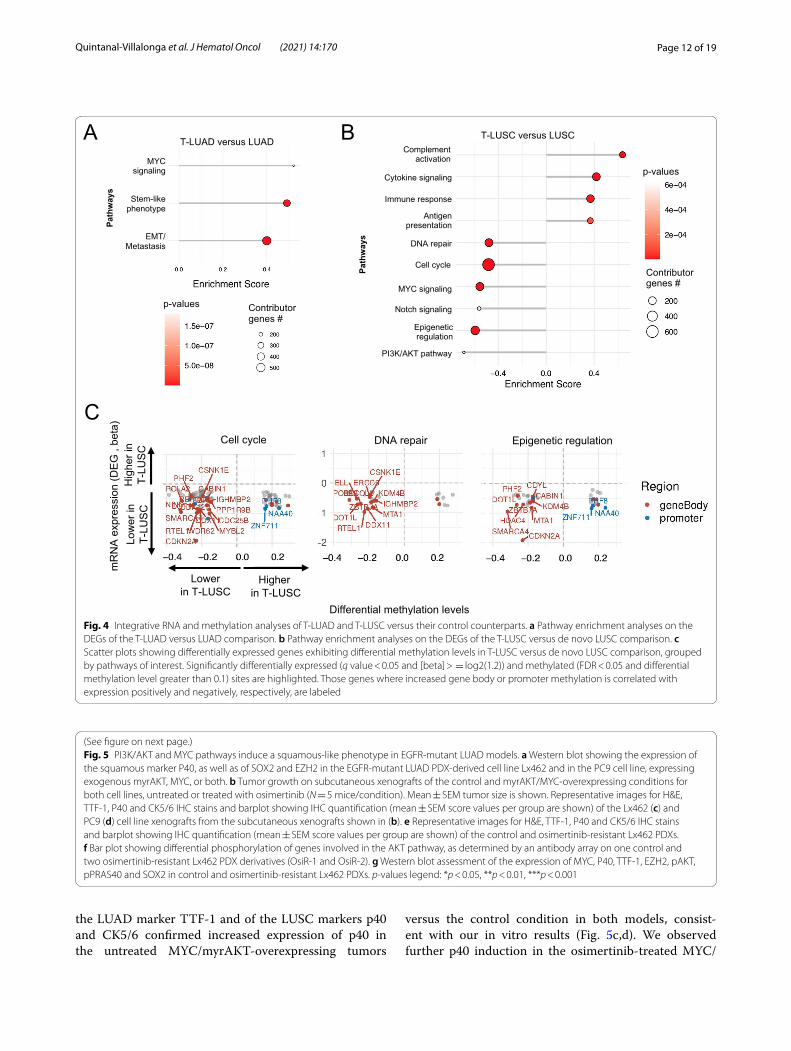
Identification of pathways dysregulated in LUSC transdifferentiationTo analyze signaling pathways dysregulated upon trans-differentiation, we performed differential gene expression and pathway enrichment analyses (GSEA) of T-LUSC versus T-LUAD samples (Fig. 3d and Additional file 1: Table S4). As expected, we observed upregulation of TP63, the gene encoding the squamous marker P40 in T-LUSC, which was further enriched in control LUSC (Additional file 2: Figure S2B). GSEA demonstrated downregulation of multiple immune response path-ways in T-LUSC relative to T-LUAD, including neu-trophil degranulation, interferon signaling, cytokine signaling, antigen presentation and complement activa-tion. Together, these data suggest suppressed anti-tumor immune response in T-LUSC. We further observed enriched expression of genes (1) associated with a basal phenotype; (2) involved in cell cycle and DNA repair; (3) involved in epigenetic regulation (including EZH2, previ-ously implicated in lineage plasticity [43, 44]) (Additional file 2: Figure S2C); (4) metastasis, a signature previously implicated in histologic transformation [43, 44]; and (5) genes involved in a variety of oncogenic signaling path-ways, including MYC, NOTCH, Hedgehog, PI3K/AKT and WNT (Fig. 3d).
Consistent with these results, phospho-kinome arrays on microdissected T-LUAD (N = 5) and T-LUSC (N = 3) (Additional file 1: Table S4) further suggested T-LUSC-specific activation of DNA damage response, as indi-cated by increased CHK-2_T68 (Fig. 3e); of PI3K/AKT signaling, as suggested by increased AKT1/2/3_S473 and T308, PRAS40_T246, PYK2_Y402 and RSK1/2/3_ S380/386/377; and of WNT signaling (beta-catenin upregulation) (Fig. 3e). Western blotting confirmed increased expression of beta-catenin, pAKT_S473 and pPRAS40_T246. MYC protein expression was elevated in T-LUSC relative to T-LUAD, as demonstrated both by Western blotting (Fig. 3f ) and by immunohistochemistry (5 out of 8 samples) (Fig. 3g, Additional file 1: Table S4),
Fig. 3 Transcriptomic, epigenomic and protein characterization of LUSC transformation. a Heatmap showing the expression of genes predictive of LUSC subtype in the LUSC and T‑LUSC samples in our cohort (left) and bar plot indicating the percentage of each subtype present in our LUSC and T‑LUSC cohorts, with comparison to Wilkerson et al.18. p‑value was calculated using the Chi‑Square test assessing the distribution differences between cohorts. PLSDA analyses on the transcriptome (b) and (c) methylome of T‑LUAD and T‑LUAD samples, and of control LUAD and SCLC samples. Circles delimiting each sample group were calculated with 90% interval of confidence. d Pathway enrichment analyses on DEGs of the T‑LUSC versus T‑LUAD comparison. e Bar plot showing differential expression of phosphorylated proteins involved in the AKT, Wnt and DNA damage response pathways, as determined by an antibody array on microdissected LUAD and LUSC tissue from adenosquamous clinical samples (see Additional file 1; Table S4). f Western blot showing expression/phosphorylation of proteins of interest on the same samples analyzed by protein array. g MYC protein expression levels (IHC score) on matched T‑LUAD and T‑LUSC components in adenosquamous samples. h Plot exhibiting differentially methylated transcription factor binding domains in T‑LUSC versus T‑LUAD. Sample IDs in black and red indicate that they come from a combined histology specimen or a pre‑/post‑transformation specimen, respectively. p‑values legend: *p < 0.05, **p < 0.01
(See figure on next page.)

Page 10 of 19Quintanal‑Villalonga et al. J Hematol Oncol (2021) 14:170
Fig. 3 (See legend on previous page.)

Page 11 of 19Quintanal‑Villalonga et al. J Hematol Oncol (2021) 14:170
consistent with the RNAseq data (Fig. 3d). These data point to a possible role of PI3K/AKT signaling and MYC in LUSC transformation.
Methylation changes may facilitate a stem‑like state in LUSC transdifferentiationTo identify particular epigenetic mechanisms that might promote lineage plasticity between LUAD and LUSC, we analyzed differential methylation of TF-binding motifs (Fig. 3h). Site-specific methylation can inhibit TF binding and affect regulation of target gene expression [45]. We found hypermethylation of binding motifs for GATA6 in T-LUSC relative to T-LUAD (p-value < 0.001, q-value = 0.022). GATA6 is a known lineage specifica-tion factor amplified in adenocarcinomas of the upper gastrointestinal tract, promoting adenocarcinoma but not squamous cell carcinoma survival in the esophagus [46], and whose loss induces a shift in pancreatic cancer from adenocarcinoma to squamous metabolic pheno-type [47]. Conversely we observed hypomethylation of binding motifs for genes involved in EMT and stemness such as SNAI2 (SLUG) (p-value < 0.001, q-value = 0.019) and MYB (p-value < 0.001, q-value = 0.019) [48, 49]. We also observed T-LUSC-specific demethylation of multi-ple lineage-determining transcription factors, including ASCL1 (p-value = 0.001, q-value = 0.081) [50]; FOXI1 (p-value = 0.010, q-value = 0.081) [51]; and GRHL2 (p-value = 0.010, q-value = 0.109) [52, 53] (Fig. 3h). Our results suggest that site-specific methylation changes may promote lineage plasticity through altered binding of multiple lineage-determining transcription factors, facili-tating lineage plasticity between LUAD and LUSC.
Transcriptomic and methylomic alterations of transforming versus control tumorsWe next performed GSEA on differentially expressed genes in T-LUAD versus control LUAD to identify dys-regulated pathways specific to LUAD at potential risk of transformation, which may comprise early events of LUSC transformation (Fig. 4a). We observed upregula-tion of genes involved in MYC signaling, stemness, and EMT/metastasis (Fig. 3d). However, transcriptomic dys-regulation of these pathways was not driven by methyla-tion events (Additional file 2: Figure S3A). Together, these support the occurrence a plastic phenotype in T-LUAD facilitating histological transdifferentiation.
We also performed GSEA on differentially expressed genes in T-LUSC versus control LUSC, to identify any molecular characteristic specific to LUSC that have undergone transdifferentiation. This analysis revealed higher immune activation in T-LUSC, including upregulation of gene pathways of complement activa-tion, cytokine signaling, immune response and antigen
presentation (Fig. 4b). This suggests a degree of immune inflammation in T-LUSC tumors relative to their de novo counterparts, consistent with enrichment for the secretory subtype characterized by high tumor-asso-ciated immune response [32]. T-LUSC demonstrated decreased expression relative to control LUSC of genes involved in cell cycle/DNA repair and epigenetic regula-tion pathways, which seemed to be driven by methylation changes (Fig. 4c). We also observed downregulation of genes involved in MYC, Notch and PI3K/AKT pathways (Fig. 4b), which seemed to be independent to methyla-tion events (Additional File 2: Figure S3B). Interestingly, all these pathways were upregulated also in T-LUSC rela-tive to T-LUAD (Fig. 3d).
MYC overexpression and AKT overactivation induce expression of LUSC markers in LUAD preclinical modelsNext, we sought to identify molecular drivers of LUSC transformation among the signaling pathways upregu-lated in the RNAseq/protein analyses. Among these, the PI3K/AKT pathway has been extensively involved in lin-eage plasticity [1]. LUAD undergoing histologic trans-formation are enriched for mutations in this pathway [2, 3, 54], and Pten loss promotes squamous tumors in an adenocarcinoma model of prostate cancer [55]. MYC signaling has also been similarly implicated as a driver of stemness and histological transdifferentiation [1, 43].
To test the role of these factors in promoting squamous transformation of LUAD, we first overexpressed MYC, a constitutively active isoform of AKT (myrAKT), or their combination, in a short-term cultured LUAD PDX-derived cell line (LX462) and in a LUAD cell line (PC9) (Fig. 5a). Both models harbor an EGFR mutation, mod-eling a setting where LUSC transformation has been extensively described [4]. In vitro we observed that com-bined MYC/myrAKT overexpression induced the expres-sion of the squamous marker P40 in both cell lines, with MYC overexpression alone inducing this at lower levels in one of the cell lines under study (Lx462). Interestingly, combined MYC/myrAKT overexpression also induced the expression of EZH2 and of SOX2 (Fig. 5a), the latter being a known driver of LUSC [56, 57].
Next we wanted to assess the effect modulating these factors on tumor growth. We performed subcutaneous injection of control and MYC/myrAKT-overexpress-ing Lx462 and PC9 cell lines in the flank of NSG mice. We did not observe any appreciable difference in tumor growth in untreated tumors. In mice treated with osi-mertinib, MYC/myrAKT markedly accelerated acquired treatment resistance in both tumor models (Fig. 5b).
Although the xenografts did not fully transdifferen-tiate to classical squamous morphology with intercel-lular bridges and heavy keratinization, IHC analysis of
Page 12 of 19Quintanal‑Villalonga et al. J Hematol Oncol (2021) 14:170
the LUAD marker TTF-1 and of the LUSC markers p40 and CK5/6 confirmed increased expression of p40 in the untreated MYC/myrAKT-overexpressing tumors
versus the control condition in both models, consist-ent with our in vitro results (Fig. 5c,d). We observed further p40 induction in the osimertinib-treated MYC/
Fig. 4 Integrative RNA and methylation analyses of T‑LUAD and T‑LUSC versus their control counterparts. a Pathway enrichment analyses on the DEGs of the T‑LUAD versus LUAD comparison. b Pathway enrichment analyses on the DEGs of the T‑LUSC versus de novo LUSC comparison. c Scatter plots showing differentially expressed genes exhibiting differential methylation levels in T‑LUSC versus de novo LUSC comparison, grouped by pathways of interest. Significantly differentially expressed (q value < 0.05 and [beta] > = log2(1.2)) and methylated (FDR < 0.05 and differential methylation level greater than 0.1) sites are highlighted. Those genes where increased gene body or promoter methylation is correlated with expression positively and negatively, respectively, are labeled
Fig. 5 PI3K/AKT and MYC pathways induce a squamous‑like phenotype in EGFR‑mutant LUAD models. a Western blot showing the expression of the squamous marker P40, as well as of SOX2 and EZH2 in the EGFR‑mutant LUAD PDX‑derived cell line Lx462 and in the PC9 cell line, expressing exogenous myrAKT, MYC, or both. b Tumor growth on subcutaneous xenografts of the control and myrAKT/MYC‑overexpressing conditions for both cell lines, untreated or treated with osimertinib (N = 5 mice/condition). Mean ± SEM tumor size is shown. Representative images for H&E, TTF‑1, P40 and CK5/6 IHC stains and barplot showing IHC quantification (mean ± SEM score values per group are shown) of the Lx462 (c) and PC9 (d) cell line xenografts from the subcutaneous xenografts shown in (b). e Representative images for H&E, TTF‑1, P40 and CK5/6 IHC stains and barplot showing IHC quantification (mean ± SEM score values per group are shown) of the control and osimertinib‑resistant Lx462 PDXs. f Bar plot showing differential phosphorylation of genes involved in the AKT pathway, as determined by an antibody array on one control and two osimertinib‑resistant Lx462 PDX derivatives (OsiR‑1 and OsiR‑2). g Western blot assessment of the expression of MYC, P40, TTF‑1, EZH2, pAKT, pPRAS40 and SOX2 in control and osimertinib‑resistant Lx462 PDXs. p‑values legend: *p < 0.05, **p < 0.01, ***p < 0.001
(See figure on next page.)

Page 13 of 19Quintanal‑Villalonga et al. J Hematol Oncol (2021) 14:170
Fig. 5 (See legend on previous page.)

Page 14 of 19Quintanal‑Villalonga et al. J Hematol Oncol (2021) 14:170
myrAKT-overexpressing tumors again in both models. In PC9, but not LX462, we observed increased CK5/6 lev-els in the MYC/myrAKT-overexpressing tumors (either untreated or treated with osimertinib) relative to control tumors without MYC/myrAKT. Notably, in the LX462 model, TTF-1 expression was downregulated only in the osimertinib-treated MYC/myrAKT condition (Fig. 5c), further supporting the potential for EGFR inhibition to facilitate transdifferentiation to a squamous-like phe-notype. No TTF-1 expression was observed in the PC9 model tumors (Fig. 5d). These results suggest that com-bined MYC overexpression and AKT overactivation can promote a squamous-like phenotype similar to that reported for the secretory squamous subtype [32] (i.e., partially retained TTF-1 expression, moderate and non-ubiquous p40 expression) which is further accentuated by EGFR inhibition.
Expression of p40 was increased in the osimertinib-treated control condition in the Lx462 cell line xeno-grafts (Fig. 5c), suggesting that this model may be prone to spontaneous potentiation of squamous features under selective pressure of EGFR-targeted therapy, even in the absence of exogenous AKT and MYC signaling. We con-firmed this by the generation of osimertinib-resistant Lx462 PDXs. Comparison of control untreated versus osimertinib-relapsed Lx462 tumors showed increased p40 expression after osimertinib relapse (Fig. 5e). We fur-ther observed decreased TTF-1 expression and increased CK5/6 expression in the osimertinib-relapsed Lx462 PDX tumors (Fig. 5e), as well as increased KRT5 and decreased AGR2 mRNA expression (Additional File 2: Figure S4A), a recently described qualitative signature for LUSC tumors(58). Additionally, performance of pathway enrichment analysis on DEGs in osimertinib-relapsed versus control Lx462 (Additional File 2: Figure S4B) showed high consistency with the pathways we found dysregulated in transforming clinical samples (Fig. 3d), further supporting the acquisition of a LUSC phenotype during acquisition of osimertinib resistance. Genetic relatedness of control and osimertinib-resistant tumors was confirmed by MSK-IMPACT [59], which shared the EGFR mutation, among others.
Analysis by phospho-kinase array suggested activation of the AKT signaling pathway including phosphorylation of downstream PRAS40 in osimertinib-relapsed LX462 PDXs (Fig. 5f ). PRAS40 phosphorylation occurred in conjunction with upregulation of EZH2, SOX2 and MYC in the osimertinib-relapsed LX462 PDXs (Fig. 5g), largely recapitulating the pathways activated by exog-enous myrAKT and MYC and upon LUSC transforma-tion in our clinical samples. Taken together, these data support the hypothesized involvement of MYC and AKT
signaling in the induction of a marker expression profile more compatible with LUSC.
EZH2 or AKT inhibition may interfere with osimertinib “squamous‑like” relapseWe next sought to explore how inhibition of targets found upregulated in our clinical and preclinical analyses may interfere with osimertinib sensitivity and with the acquisition of the “squamous-like” phenotype observed in our Lx462 PDX model after osimertinib relapse. We first focused on EZH2, the enzymatic subunit of the PRC2 complex, which has been previously defined as a mediator of MYC-induced stemness [60] and as a fac-tor promoting histological transformation [43, 44]; it was also notably upregulated in our analysis of clinical biospecimens (Fig. 5g and Additional file 2: Figure S2C). We treated the Lx462 PDX with osimertinib, the EZH1/2 inhibitor ORS1, or their combination (Fig. 6a). While ORS1 alone had no significant effect on tumor growth, ORS1 was able to prevent acquired resistance to osimer-tinib in Lx462 tumors (Fig. 6a and Additional file 2: Fig-ure S4C). To assess whether this strategy could also be used to resensitize to EGFR inhibition after acquisition of the “squamous-like” phenotype, we tested the efficacy of osimertinib plus ORS1 in osimertinib-relapsed (“squa-mous-like”) Lx462 tumors. These tumors also demon-strated no significant response to ORS1 alone, and early progression on osimertinib (Fig. 6b). ORS1 treatment again potentiated the anti-tumor efficacy of osimertinib (Fig. 6b and Additional file 2: Figure S4D), demonstrat-ing over 60% tumor growth inhibition (TGI) relative to the osimertinib-treated group at experiment endpoint (p = 0.008). We assessed markers of LUAD and LUSC in the tumors taken down at study endpoint; while there was a slight increase in TTF-1 expression in the combi-nation group compared to the osimertinib group, no dif-ferences in P40 or CK5/6 staining was observed among different study cohorts: neither EZH2 inhibition alone nor the combination reverted tumors back to pre-trans-formation P40 levels (Additional file 2: Figure S4E).
Finally, our clinical and preclinical data also suggested a role for PI3K/AKT pathway activity as a driver of LUSC transdifferentiation. We therefore similarly assessed the efficacy of the AKT inhibitor samotolisib in the osi-mertinib-relapsed “squamous-like” Lx462 PDX tumors (Fig. 6c). Samotolisib also enhanced the efficacy of osi-mertinib in this model, resulting in a TGI of 65% rela-tive to osimertinib alone at osimertinib group endpoint (p = 0.002, Fig. 6c). No increased toxicity was observed with the combination treatment relative to osimerti-nib single agent, as assessed by body weight (Additional file 2: Figure S4F). Immunohistochemistry for lineage

Page 15 of 19Quintanal‑Villalonga et al. J Hematol Oncol (2021) 14:170
markers showed no differences in TTF-1, P40 or CK5/6 expression (Additional file 2: Figure S4G).
In summary, although these results would need to be validated in additional fully LUSC-transformed mod-els, these data nominate EZH2 inhibition as a poten-tial therapeutic target in this setting that may enhance the durability of osimertinib response in tumors at risk of lineage transformation. Our results also suggest that inhibition of EZH2 or AKT, even if not able to revert the
osimertib-induced “squamous-like” phenotype, may be able to re-sensitize EGFR-mutant tumors to osimertinib after its acquisition.
DiscussionLineage plasticity is a key source of tumor adaptability to adverse conditions or selective pressures and is increas-ingly recognized as a driver of therapeutic resistance [1]. The first described examples of this in LUAD were cases
Fig. 6 PI3K/AKT pathway and EZH2 as therapeutic targets for LUSC transformation. a In vivo tumor growth of the LUAD EGFR‑mutant PDX model Lx462 with the EGFR inhibitor osimertinib, the EZH1/2 inhibitor ORS1, or their combination (N = 5 mice/treatment group). In vivo tumor growth of the squamous‑like osimertinib‑resistant EGFR‑mutant PDX model Lx462 with the EGFR inhibitor osimertinib, the EZH1/2 inhibitor ORS1, or their combination (N = 6 mice/treatment group) (b); or with osimertinib, the AKT inhibitor samotolisib or their combination (N = 6 mice/treatment group) (c). For in vivo tumor growth, group mean tumor size ± SEM is shown. Statistical differences in tumor sizes were assessed by a two‑tailed Student´s t‑test, using the tumor sizes for osimertinib‑treated group experiment endpoint. d Schematic summarizing the phenotypes and pathways altered upon LUSC transformation

Page 16 of 19Quintanal‑Villalonga et al. J Hematol Oncol (2021) 14:170
of neuroendocrine transformation to a tumor resembling small cell lung cancer [2, 3]. With the advent of increas-ingly potent and selective targeted therapies addressing “on-target” resistance, we may see increasingly preva-lent, and increasingly diverse, examples of tumor escape by histologic transformation. Transformation of LUAD to LUSC as a mechanism of acquired resistance has only recently been described [4] and has been less extensively characterized than neuroendocrine transformation. EGFR-mutant LUAD progressing through squamous transformation has a poor prognosis [4], as does primary mixed histology LUAD/LUSC [9]. Here we provide the first comprehensive characterization of squamous trans-formation, through a multi-omic analysis of a cohort of mixed LUAD/LUSC tumors as well as isolated pre- and post-LUAD to LUSC transformation cases.
Our study was predicated on the hypothesis that clon-ally related mixed histology tumors, in which both LUAD and LUSC lineages are in temporal and spatial proximity, might provide general insight into relevant biologic path-ways dictating differentiation between these lineages, and could identify therapeutic targets of relevance to squamous transdifferentiation. A limitation of this study is the modest number of cases available of mixed histol-ogy tumors in which clean microdissection could be per-formed. This analysis provided a progressive signaling landscape of LUAD to LUSC transformation, and iden-tified several potential targets including the PI3K/AKT and MYC activation, and PRC2 complex action (Fig. 6d). Validating our approach, concomitant activation of AKT and MYC in LUAD preclinical models induced LUSC features, with further augmentation under the selective pressure of a driver oncogene-targeted therapy. These results suggested that even if targeted therapy may be accelerating transdifferentiation, selective pressure by treatment may not be essential for it to occur, which was consistent with the fact that the majority of adenosqua-mous samples under analysis had not received any treat-ment before collection.
Confirming the potential translational relevance of these findings, targeted inhibition of EZH2 prevented emergence of acquired osimertinib resistance in an EGFR-mutant LUAD prone to lineage plasticity and par-tially restored osimertinib efficacy in the osimertinib-resistant derivative with increased squamous features. AKT inhibition demonstrated similar combinatorial efficacy in this context. Even if these results would need to be validated in additional models exhibiting full squa-mous-transformation, these findings nominate targets with a potential translational relevance, as multiple phar-macologic inhibitors of both of these pathways are clini-cally available.
The cell of origin of adenosquamous tumors has not been clearly defined, and it is possible that multiple cell types could give rise to such tumors. Our genomic data confirm prior findings that LUAD and LUSC compo-nents of adenosquamous carcinomas share a clonal origin. Our epigenomic and transcriptomic data indi-cate that T-LUSC exhibits a molecular profile close to that of LUAD, but distinct from that of de novo LUSC. These results support a role for lineage plasticity in their development, rather than colocalization of independent tumors, as previously suggested [7, 36]. The directional-ity of transformation in adenosquamous cases cannot be assumed, and it is possible that both histologies arise in parallel establishing a cooperative relationship, as has been previously reported for other tumor types in which distinct intratumoral subpopulations cooperate to pro-mote therapeutic resistance or metastasis [61].
While apparent enrichment of TBX3, MET and RBM10 mutations in the T-LUAD relative to control LUAD may provide a genetic context favoring lineage plasticity and histological transdifferentiation, the absence of recur-rent genomic alterations distinguishing paired LUAD and LUSC components suggests that these or other genomic alterations are not driving this process, which appears to be rather transcriptionally driven. The commonalities among altered transcriptional programs between paired T-LUAD and T-LUSC, and the focal methylation changes affecting binding of known transcriptional regulators implicated in stemness and plasticity, strongly under-score the primary epigenetic nature of lineage plasticity.
Cross-comparison of the data reported here with prior analyses of histologic transformation in other contexts reveals interesting commonalities and distinctions—reflecting pathways that may facilitate lineage plasticity per se, and pathways that may in particular drive con-version toward particular alternative lineages. We would anticipate that shared promoters of lineage plasticity might include factors required for maintaining stem or progenitor capacity in embryonic and fetal development: for example, as noted here, MYC, EZH2 (and PRC2 com-plex activity generally), GATA proteins, SLUG, MYB, WNT, Hedgehog and Notch signaling. Indeed, several of these, most notably MYC and PRC2 activity, have been implicated across multiple prior studies, including in of lung and prostate adenocarcinomas to aggressive small cell neuroendocrine tumors [1, 10, 33, 35]. PI3K/AKT pathway activity and drivers of EMT while not canoni-cal stem cell pathways have also been identified in neu-roendocrine transformation [1, 4, 35, 52]. In contrast, a canonical requirement of neuroendocrine transforma-tion in both prostate and lung cancer, concomitant loss or mutational inactivation of both TP53 and RB1, does

Page 17 of 19Quintanal‑Villalonga et al. J Hematol Oncol (2021) 14:170
not appear to be a feature of squamous transformation (Fig. 2b).
ConclusionsThe study of plasticity mechanisms leading to histological transformation and eventually therapy resistance is key to understand tumor evolution and to design strategies to manage patients with T-LUSC. Our data point in particu-lar to AKT, MYC, and PRC2 complex signaling as playing key roles in this histologic transformation. Using preclin-ical models of EGFR-mutant LUAD, we observed that the combination of AKT stabilization and MYC overexpres-sion induced a “squamous-like” phenotype, which was further accentuated by osimertinib treatment. Pharma-cologic inhibition of either AKT or PRC2 complex activ-ity substantially augmented the efficacy of osimertinib treatment in a PDX model acquiring squamous features under EGFR inhibition. Here, we provide the first com-prehensive molecular characterization of LUSC transdif-ferentiation and suggest potential drivers and therapeutic approaches for these tumors.
AbbreviationsLUAD: Lung adenocarcinoma; LUSC: Lung squamous carcinoma; IHC: Immu‑nohistochemistry; PDX: Patient‑derived xenograft; GSEA: Gene set enrichment analysis; TPM: Transcripts per million.
Supplementary InformationThe online version contains supplementary material available at https:// doi. org/ 10. 1186/ s13045‑ 021‑ 01186‑z.
Additional file 1: Table S1. Clinical characteristics of the adenosquamous and pre /post‑transformation tumors under study. Table S2. Clinical characteristics of the de novo LUSC tumors under study. Table S3. Clinical characteristics of the control LUAD tumors under study. Table S4. Sum‑mary of molecular applications per sample.
Additional file 2: Supporting supplementary figures.
AcknowledgementsWe acknowledge Maria Corazon Mariana and Emily Lin from the PPBC Biobank for their invaluable help.
Authors’ contributionsAQV took part in conceptualization; AQV, HT, MMH, YAZ, RK, FM, FU, VA, PM, NSS, SSC, AC, MO, JRK, JE, MHR, TJH, HAY, JQ, EDS, JCC, NR, UB, IL, MA, BHL, TS, CMR took part in methodology; AQV, MMH, YAZ, TS, CMR involved in investigation; AQV, HT, FU took part in validation; AQV, MMH, YAZ, RK, SSC, TS, CMR participated in formal analysis; AQV, MMH, YAZ, TS, CMR involved in writing—original draft; AQV, YAZ, MMH, SSC, JMC, MC, AC, MO, NR, BHL, RK, TS and CMR took part in review & editing; AQV, RK, TS, SSC and CMR involved in supervision; TS and CMR participated in funding acquisition. All authors read and approved the final version of the manuscript.
FundingThis is supported by NCI R01 CA197936 and U24 CA213274 (CMR), the SU2C/VAI Epigenetics Dream Team (CMR), the Druckenmiller Center for Lung Cancer Research (CMR, TS, AQV), Parker Institute for Cancer Immunotherapy grant (TS); International Association for the Study of Lung Cancer grant (TS), NIH K08 CA‑248723 (AC). We acknowledge the use of the Integrated Genomics
Operation Core, funded by the NCI Cancer Center Support Grant (CCSG, P30 CA08748), Cycle for Survival and the Marie‑Josée and Henry R. Kravis Center for Molecular Oncology. The PPBC Biobank and Pathology Core Facility are supported by the NCI Cancer Center Support Grant P30‑CA008748 (R35 CA263816).
Availability of data and materialsThe datasets used and/or analyzed during the current study, as well as all materials used, are available from the corresponding author on reasonable reques. RNAseq data are available in https:// drive. google. com/ drive/ folde rs/ 1YX6j NesWy_ rsdx4 6eErkc_ bHEym qNVia? usp= shari ng (data will be deposited in a public repository upon acceptance).
Declarations
Ethics approval and consent to participateAll study subjects had provided signed informed consent for biospecimen analyses under an institutional review board‑approved protocol. All animal experiments were approved by the Memorial Sloan Kettering Cancer Center (MSKCC) Animal Care and Use Committee.
Consent for publicationNot applicable.
Competing interestsAQV reports honoraria from AstraZeneca. MO reports advisory roles for Phar‑Mar, Novartis and Targeted Oncology and reports honoraria from Bristol‑Myers Squibb and Merck Sharp & Dohme. CMR has consulted regarding oncology drug development with AbbVie, Amgen, Ascentage, Astra Zeneca, Bicycle, Celgene, Daiichi Sankyo, Genentech/Roche, Ipsen, Jazz, Lilly, Pfizer, Phar‑maMar, Syros, and Vavotek. CMR serves on the scientific advisory boards of Bridge Medicines, Earli, and Harpoon Therapeutics. AQV and CMR are included on a US patent application entitled, “Methods for predicting and treating chemoresistance in small cell lung cancer patients.”
Author details1 Department of Medicine, Thoracic Oncology Service, Memorial Sloan Ketter‑ing Cancer Center, 408 East 69th Street, ZRC‑1731, New York, NY 10021, USA. 2 Center for Epigenetics Research, Memorial Sloan Kettering Cancer Center, New York, NY 10065, USA. 3 Sloan Kettering Institute, Memorial Sloan Kettering Cancer Center, New York, NY, USA. 4 Marie‑Josée and Henry R. Kravis Center for Molecular Oncology, Memorial Sloan Kettering Cancer Center, New York, NY, USA. 5 Program for Computational and Systems Biology, Sloan Kettering Institute, Memorial Sloan Kettering Cancer Center, New York, NY, USA. 6 Parker Institute for Cancer Immunotherapy, Memorial Sloan Kettering Cancer Center, New York, NY, USA. 7 Precision Pathology Center, Memorial Sloan Kettering Cancer Center, New York, NY, USA. 8 Department of Pathology, Memorial Sloan Kettering Cancer Center, New York, NY, USA. 9 Human Oncology and Patho‑genesis Program, Memorial Sloan Kettering Cancer Center, New York, NY, USA. 10 Antitumor Assessment Core, Memorial Sloan Kettering Cancer Center, New York, NY 10065, USA. 11 Weill Cornell Medical College, 1275 York Avenue, New York, NY 10065, USA. 12 Molecular Pharmacology Program, Memorial Sloan Ket‑tering Cancer Center, 1275 York Avenue, New York, NY 10065, USA.
Received: 16 August 2021 Accepted: 4 October 2021
References 1. Quintanal‑Villalonga Á, Chan JM, Yu HA, Pe’er D, Sawyers CL, Sen T, et al.
Lineage plasticity in cancer: a shared pathway of therapeutic resist‑ance. Nat Rev Clin Oncol. 2020;17(6):360–71. https:// doi. org/ 10. 1038/ s41571‑ 020‑ 0340‑z.
2. Niederst MJ, Sequist LV, Poirier JT, Mermel CH, Lockerman EL, Garcia AR, et al. RB loss in resistant EGFR mutant lung adenocarcinomas that transform to small‑cell lung cancer. Nat Commun. 2015;6:199–203.
3. Lee JK, Lee J, Kim S, Kim S, Youk J, Park S, et al. ClonalHistory and genetic predictors of transformation into small‑cell carcinomas from lung adeno‑carcinomas. J Clin Oncol. 2017;35(26):3065–74.
Page 18 of 19Quintanal‑Villalonga et al. J Hematol Oncol (2021) 14:170
4. Schoenfeld AJ, Chan JM, Kubota D, Sato H, Rizvi H, Daneshbod Y, et al. Tumor analyses reveal squamous transformation and off‑target altera‑tions as early resistance mechanisms to first‑line osimertinib in EGFR‑mutant lung cancer. Clin Cancer Res. 2020;26(11):2654–63.
5. Kaiho T, Nakajima T, Iwasawa S, Yonemori Y, Yoshino I. ALK rearrange‑ment adenocarcinoma with histological transformation to squamous cell carcinoma resistant to alectinib and ceritinib. Onco Targets Ther. 2020;13:1557–60.
6. Wang F, Qin J, Xie F, Wu Q, Lu H. Transformation of EML4‑ALK fusion‑pos‑itive adenocarcinoma into squamous cell carcinoma in association with acquired resistance to crizotinib. Lung Cancer. 2019;2020(140):118–20.
7. Tochigi N, Dacic S, Nikiforova M, Cieply KM, Yousem SA. Adenosquamous carcinoma of the lung a microdissection study of KRAS and EGFR muta‑tional and amplification status in a Western patient population. Am J Clin Pathol. 2011;135(5):783–9.
8. Krause A, Roma L, Lorber T, Habicht J, Lardinois D, De Filippo MR, et al. Deciphering the clonal relationship between glandular and squamous components in adenosquamous carcinoma of the lung using whole exome sequencing. Lung Cancer. 2020;150:132–8. https:// doi. org/ 10. 1016/j. lungc an. 2020. 10. 013.
9. Filosso PL, Ruffini E, Asioli S, Giobbe R, Macri L, Bruna MC, et al. Adenos‑quamous lung carcinomas: a histologic subtype with poor prognosis. Lung Cancer. 2011;74(1):25–9. https:// doi. org/ 10. 1016/j. lungc an. 2011. 01. 030.
10. Zhang H, Brainson CF, Koyama S, Redig AJ, Chen T, Li S, et al. Lkb1 inactivation drives lung cancer lineage switching governed by Polycomb Repressive Complex 2. Nat Commun. 2017;8.
11. Shen R, Martin A, Ni A, Hellmann M, Arbour KC, Jordan E, et al. Harness‑ing clinical sequencing data for survival stratification of patients with metastatic lung adenocarcinomas. JCO Precis Oncol. 2019;3:1–9.
12. Jonsson P, Bandlamudi C, Cheng ML, Srinivasan P, Chavan SS, Friedman ND, et al. Tumour lineage shapes BRCA‑mediated phenotypes. Nature. 2019;571(7766):576–9.
13. Jurtz V, Paul S, Andreatta M, Marcatili P, Peters B, Nielsen M. NetM‑HCpan‑4.0: improved peptide–MHC class I interaction predictions integrating eluted ligand and peptide binding affinity data. J Immunol. 2017;199(9):3360–8.
14. Gu Z, Eils R, Schlesner M. Complex heatmaps reveal patterns and correlations in multidimensional genomic data. Bioinformatics. 2016;32(18):2847–9.
15. Ellrott K, Bailey MH, Saksena G, Covington KR, Kandoth C, Stewart C, et al. Scalable open science approach for mutation calling of tumor exomes using multiple genomic pipelines. Cell Syst. 2018;6(3):271–81.
16. Mayakonda A, Lin DC, Assenov Y, Plass C, Koeffler HP. Maftools: efficient and comprehensive analysis of somatic variants in cancer. Genome Res. 2018;28(11):1747–56.
17. Cerami E, Gao J, Dogrusoz U, Gross BE, Sumer SO, Aksoy BA, et al. The cBio cancer genomics portal: an open platform for exploring multidimen‑sional cancer genomics data. Cancer Discov. 2012;2(5):401–4.
18. Gao J, Aksoy BA, Dogrusoz U, Dresdner G, Gross B, Sumer SO, et al. Inte‑grative analysis of complex cancer genomics and clinical profiles using the cBioPortal. Sci Signal. 2013;6(269):1–20.
19. Krueger F, Andrews SR. Bismark: a flexible aligner and methylation caller for Bisulfite‑Seq applications. Bioinformatics. 2011;27(11):1571–2.
20. Lander ES, Linton LM, Birren B, Nusbaum C, Zody MC, Baldwin J, et al. Erra‑tum: initial sequencing and analysis of the human genome: international human genome sequencing consortium (Nature (2001) 409 (860–921)). Nature. 2001;412(6846):565–6.
21. Langmead B, Salzberg SL. Fast gapped‑read alignment with Bowtie 2. Nat Methods. 2012;9(4):357–9.
22. Park Y, Wu H. Differential methylation analysis for BS‑seq data under general experimental design. Bioinformatics. 2016;32(10):1446–53.
23. Rohart F, Gautier B, Singh A, Lê Cao KA. mixOmics: an R package for ‘omics feature selection and multiple data integration. PLoS Comput Biol. 2017;13(11):1–19.
24. Heinz S, Benner C, Spann N, Bertolino E, Lin YC, Laslo P, et al. Simple combinations of lineage‑determining transcription factors prime cis‑regulatory elements required for macrophage and B cell identities. Mol Cell. 2010;38(4):576–89. https:// doi. org/ 10. 1016/j. molcel. 2010. 05. 004.
25. Dobin A, Davis CA, Schlesinger F, Drenkow J, Zaleski C, Jha S, et al. STAR: ultrafast universal RNA‑seq aligner. Bioinformatics. 2013;29(1):15–21.
26. Bray NL, Pimentel H, Melsted P, Pachter L. Near‑optimal probabilistic RNA‑seq quantification. Nat Biotechnol. 2016;34(5):525–7.
27. Pimentel H, Bray NL, Puente S, Melsted P, Pachter L. Differential analysis of RNA‑seq incorporating quantification uncertainty. Nat Methods. 2017;14(7):687–90.
28. Subramanian A, Tamayo P, Mootha VK, Mukherjee S, Ebert BL, Gillette MA, et al. Gene set enrichment analysis: a knowledge‑based approach for interpreting genome‑wide expression profiles. Proc Natl Acad Sci U S A. 2005;102(43):15545–50.
29. Liberzon A, Subramanian A, Pinchback R, Thorvaldsdóttir H, Tamayo P, Mesirov JP. Molecular signatures database (MSigDB) 3.0. Bioinformatics. 2011;27(12):1739–40.
30. Yu G, Wang LG, Han Y, He QY. ClusterProfiler: an R package for com‑paring biological themes among gene clusters. Omi A J Integr Biol. 2012;16(5):284–7.
31. Yi L, Pimentel H, Bray NL, Pachter L. Gene‑level differential analysis at transcript‑level resolution. Genome Biol. 2018;19(1):1–11.
32. Wilkerson MD, Yin X, Hoadley KA, Liu Y, Hayward MC, Cabanski CR, et al. Lung squamous cell carcinoma mRNA expression subtypes are repro‑ducible, clinically important, and correspond to normal cell types. Clin Cancer Res. 2010;16(19):4864–75.
33. Gardner EE, Lok BH, Schneeberger VE, Desmeules P, Miles LA, Arnold PK, et al. Chemosensitive relapse in small cell lung cancer proceeds through an EZH2‑SLFN11 axis. Cancer Cell. 2017;31(2):286–99. https:// doi. org/ 10. 1016/j. ccell. 2017. 01. 006
34. Hulton CH, Costa EA, Shah NS, Quintanal‑Villalonga A, Heller G, de Stanchina E, et al. Direct genome editing of patient‑derived xenografts using CRISPR‑Cas9 enables rapid in vivo functional genomics. Nat Cancer. 2020;1(3):359–69. https:// doi. org/ 10. 1038/ s43018‑ 020‑ 0040‑8
35. Park JW, Lee JK, Sheu KM, Wang L, Balanis NG, Nguyen K, et al. Repro‑gramming normal human epithelial tissues to a common, lethal neu‑roendocrine cancer lineage. Science. 2018;362(6410):91–5.
36. Krause A, Roma L, Lorber T, Habicht J, Lardinois D, De Filippo MR, et al. Deciphering the clonal relationship between glandular and squamous components in adenosquamous carcinoma of the lung using whole exome sequencing. Lung Cancer. 2020;150(July):132–8.
37. Burgucu D, Guney K, Sahinturk D, Ozbudak IH, Ozel D, Ozbilim G, et al. Tbx3 represses PTEN and is over‑expressed in head and neck squamous cell carcinoma. BMC Cancer. 2012;12(1):1.
38. Khan SF, Damerell V, Omar R, Du Toit M, Khan M, Maranyane HM, et al. The roles and regulation of TBX3 in development and disease. Gene. 2020;726:144223. https:// doi. org/ 10. 1016/j. gene. 2019. 144223.
39. Cortot AB, Jänne PA. Molecular mechanisms of resistance in epidermal growth factor receptor‑mutant lung adenocarcinomas. Eur Respir Rev. 2014;23(133):356–66.
40. Perez‑Moreno P, Brambilla E, Thomas R, Soria JC. Squamous cell carci‑noma of the lung: molecular subtypes and therapeutic opportunities. Clin Cancer Res. 2012;18(9):2443–51.
41. Jung JH, Lee H, Zeng SX, Lu H. RBM10, a new regulator of p53. Cells. 2020;9(9):1–13.
42. Hernández J, Bechara E, Schlesinger D, Delgado J, Serrano L, Valcárcel J. Tumor suppressor properties of the splicing regulatory factor RBM10. RNA Biol. 2016;13(4):466–72. https:// doi. org/ 10. 1080/ 15476 286. 2016. 11440 04.
43. Dardenne E, Beltran H, Benelli M, Gayvert K, Berger A, Puca L, et al. N‑Myc induces an EZH2‑mediated transcriptional program driving neuroendo‑crine prostate cancer. Cancer Cell. 2016;30(4):563–77. https:// doi. org/ 10. 1016/j. ccell. 2016. 09. 005.
44. Zhang Y, Zheng D, Zhou T, Song H, Hulsurkar M, Su N, et al. Androgen deprivation promotes neuroendocrine differentiation and angiogenesis through CREB‑EZH2‑TSP1 pathway in prostate cancers. Nat Commun. 2018;9(1). https:// doi. org/ 10. 1038/ s41467‑ 018‑ 06177‑2
45. Domcke S, Bardet AF, Adrian Ginno P, Hartl D, Burger L, Schübeler D. Com‑petition between DNA methylation and transcription factors determines binding of NRF1. Nature. 2015;528(7583):575–9.
46. Lin, Bass AJ, Lockwood WW, Wang Z, Silvers AL, Thomas DG, et al. Activation of GATA binding protein 6 (GATA6) sustains oncogenic lineage‑survival in esophageal adenocarcinoma. Proc Natl Acad Sci USA. 2012;109(11):4251–6.
Page 19 of 19Quintanal‑Villalonga et al. J Hematol Oncol (2021) 14:170
• fast, convenient online submission
•
thorough peer review by experienced researchers in your field
• rapid publication on acceptance
• support for research data, including large and complex data types
•
gold Open Access which fosters wider collaboration and increased citations
maximum visibility for your research: over 100M website views per year •
At BMC, research is always in progress.
Learn more biomedcentral.com/submissions
Ready to submit your researchReady to submit your research ? Choose BMC and benefit from: ? Choose BMC and benefit from:
47. Brunton H, Caligiuri G, Cunningham R, Upstill‑Goddard R, Bailey UM, Garner IM, et al. HNF4A and GATA6 loss reveals therapeutically actionable subtypes in pancreatic cancer. Cell Rep. 2020;31(6).
48. Nakano K, Uchimaru K, Utsunomiya A, Yamaguchi K, Watanabe T. Dys‑regulation of c‑Myb pathway by aberrant expression of proto‑oncogene MYB provides the basis for malignancy in adult T‑cell leukemia/lym‑phoma cells. Clin Cancer Res. 2016;22(23):5915–28.
49. Zuber J, Rappaport AR, Luo W, Wang E, Chen C, Vaseva AV, et al. An integrated approach to dissecting oncogene addiction implicates a Myb‑coordinated self‑renewal program as essential for leukemia maintenance. Genes Dev. 2011;25(15):1628–40.
50. Rudin CM, Poirier JT, Byers LA, Dive C, Dowlati A, George J, et al. Molecular subtypes of small cell lung cancer: a synthesis of human and mouse model data. Nat Rev Cancer. 2019. https:// doi. org/ 10. 1038/ s41568‑ 019‑ 0133‑9
51. Montoro DT, Haber AL, Biton M, Vinarsky V, Lin B, Birket SE, et al. A revised airway epithelial hierarchy includes CFTR‑expressing ionocytes. Nature. 2018;560(7718):319–24. https:// doi. org/ 10. 1038/ s41586‑ 018‑ 0393‑7.
52. Werth M, Walentin K, Aue A, Schönheit J, Wuebken A, Pode‑Shakked N, et al. The transcription factor grainyhead‑like 2 regulates the molecular composition of the epithelial apical junctional complex. Development. 2010;137(22):3835–45.
53. Kersbergen A, Best SA, Dworkin S, Ah‑Cann C, de Vries ME, Asselin‑Labat ML, et al. Lung morphogenesis is orchestrated through Grainyhead‑like 2 (Grhl2) transcriptional programs. Dev Biol. 2018;443(1):1–9. https:// doi. org/ 10. 1016/j. ydbio. 2018. 09. 002.
54. Offin M, Chan JM, Tenet M, Rizvi HA, Shen R, Riely GJ, et al. Concurrent RB1 and TP53 alterations define a subset of EGFR‑mutant lung cancers at risk for histologic transformation and inferior clinical outcomes. J Thorac Oncol. 2019;14(10):1784–93.
55. Zou M, Toivanen R, Mitrofanova A, Floch N, Hayati S, Sun Y, et al. Transdif‑ferentiation as a mechanism of treatment resistance in a mouse model of castration‑resistant prostate cancer. Cancer Discov. 2017;7(7):736–49.
56. Kim BR, Van de Laar E, Cabanero M, Tarumi S, Hasenoeder S, Wang D, et al. SOX2 and PI3K cooperate to induce and stabilize a squamous‑committed stem cell injury state during lung squamous cell carcinoma pathogen‑esis. PLoS Biol. 2016;14(11).
57. Murray NR, Justilien V, Fields AP. SOX2 determines lineage restriction: modeling lung squamous cell carcinoma in the mouse. Cancer Cell. 2016;30(4):505–7. https:// doi. org/ 10. 1016/j. ccell. 2016. 09. 012.
58. Li X, Shi G, Chu Q, Jiang W, Liu Y, Zhang S, et al. A qualitative transcrip‑tional signature for the histological reclassification of lung squamous cell carcinomas and adenocarcinomas. BMC Genom. 2019;20(1):1–16.
59. Cheng DT, Mitchell TN, Zehir A, Shah RH, Benayed R, Syed A, et al. Memo‑rial sloan kettering‑integrated mutation profiling of actionable cancer targets (MSK‑IMPACT): a hybridization capture‑based next‑generation sequencing clinical assay for solid tumor molecular oncology. J Mol Diagnost. 2015;17(3):251–64.
60. Das B, Pal B, Bhuyan R, Li H, Sarma A, Gayan S, et al. MYC regulates the HIF2a stemness pathway via nanog and Sox2 to maintain self‑renewal in cancer stem cells versus non‑stem cancer cells. Cancer Res. 2019;79(16):4015–25.
61. Calbo J, van Montfort E, Proost N, van Drunen E, Beverloo HB, Meuwissen R, et al. A functional role for tumor cell heterogeneity in a mouse model of small cell lung cancer. Cancer Cell. 2011;19(2):244–56.
Publisher’s NoteSpringer Nature remains neutral with regard to jurisdictional claims in pub‑lished maps and institutional affiliations.