Neodymium ceramic alnico samarium cobalt - ALL Magnetics Inc

Compositional Variations in Vapor Deposited Samarium Zirconate Coatings
A Thesis Presented to
the faculty of the School of Engineering and Applied Science University of Virginia
In Partial Fulfillment
of the requirements for the Degree
Master of Science (Materials Science and Engineering)
by
Toni Kember
December 2011

APPROVAL SHEET
The thesis is submitted in partial fulfillment of the
requirements for the degree of
Master of Science (Materials Science and Engineering)
Author, Toni Kember
This thesis has been read and approved by the examining Committee:
Thesis Advisor, H. N. G. Wadley
J. M. Fitz-Gerald
E. J. Opila
Accepted for the School of Engineering and Applied Science:
Dean, School of Engineering and Applied Science
December 2011

i
Abstract
Increasing the maximum operating temperature of a turbine engine is central to
increases in its efficiency. This temperature is limited by the materials available to
construct the hot section of the engine (the combustor and high pressure turbine). The
blades at the inlet of the high pressure turbine in particular are a challenge, since they
must support significant centrifugal loads and are subject to high gas temperatures. Many
improvements have been made to turbine blade materials and manufacturing processes to
enable their operation at higher temperatures. The blades have evolved from solid
wrought nickel-based alloys to single crystal superalloy structures with intricate channels
to facilitate internal cooling. The development of these alloys, the casting techniques to
produce blades from them, and the design of internal air cooling systems have reached
their physical limits and recent increases in engine temperatures instead have relied on
the development of thermal barrier coating (TBC) systems.
The thermal barrier coating systems applied to superalloys consist of three layers:
(i) an aluminum rich metallic bond coat applied to the superalloy surface, (ii) a thermally
grown oxide layer (TGO) that forms on the bond coat, and (iii) a thermal insulation
(ceramic) topcoat deposited on the TGO by vapor or thermal spray deposition. Among
other requirements, the material for this highly porous top coat must be phase stable from
room to operating temperature, have a high melting point (which reduces the rate of
sintering) and a low thermal conductivity. Zirconia stabilized with 7-8 wt % yttria
(7YSZ) is currently the industry standard for this application. However, its use is limited

ii
to temperatures <1200oC due to increased sintering rates and the existence of a phase
change at higher temperatures. As a result, alternatives to 7YSZ are being explored.
The pyrochlore rare-earth (RE) zirconates are a promising candidate to replace
7YSZ, as they possess a low thermal conductivity, have a very high melting point, and
are phase stable to the melting point. One of these materials, samarium zirconate (SZO),
has been deposited by directed vapor electron beam deposition (DVD) for possible use as
a thermal barrier coating. However, these coatings had significant compositional
fluctuations: both high samarium concentration in initially deposited material and
fluctuations in the form of compositional banding, of varying degree, throughout the
remainder of the coating. These fluctuations make it difficult to ascertain the suitability of
samarium zirconate for thermal barrier coating applications.
The compositional variations have been hypothesized to result from the difference
in vapor pressure between the Sm and Zr oxides in the single source Sm2Zr2O7 melt. In
this research the effect of vapor formation, transport, and deposition parameters (beam
current, carrier gas flow rate, and rotation of the sample) on these compositional
variations has been explored, and the hypothesis critically evaluated. Additional
experiments attempted to mitigate the compositional banding by implementing
evaporation and deposition from separate Sm2O3 and ZrO2 sources, but failed to alleviate
the problem. From these experiments, together with compositional evaluations of source
materials and coatings, it was determined that the initial samarium rich region is caused
by the difference in component metal oxide vapor pressures. However, the compositional
banding problem does not appear to be caused by differences in vapor pressure.
Alternative explanations have been evaluated, including the possibility of oscillations in

iii
evaporation source temperature, leading to disproportionate changes in the vapor
pressures of the constituent oxides, resulting in discrepancies between their evaporation
rates.

iv
Acknowledgements
I would first like to thank my advisor, Professor Haydn Wadley, for his time,
patience, and guidance. Secondly I would like to express my gratitude to the members of
my committee, Dr. James Fitz-Gerald and Dr. Elizabeth Opila, for reviewing this thesis.
I would like to show appreciation to Hengbei Zhao and George Yu, whom I
worked with on this project, for training me and facilitating this research. Also, I would
like to express gratitude to DVTI - Paul Muskopf, Dan Christy, Christina Elzey, Derek
Hass, and Balvinder Gogia, for their support. I would like to thank the other members of
my group – Theron Rodgers, Bradley Richards, Tochukwu George, Scott Kasen, Adam
Malcom, Ryan Hollloman, and Mark O’Masta whom have offered much appreciated
advice. Thanks to Tommy Eanes, David Glover, Rich Gregory, and Sherri Sullivan for
assistance getting things up and running smoothly and continuing to do so. Thank you to
Richard White for answering endless characterization questions. Finally, thank you to my
family.
This work has been funded by the Office of Naval Research, Program Officer: Dr. David
Shifler Contract # N00014-03-1-0297.

v
Table of Contents
Abstract................................................................................................................... i
Acknowledgements .............................................................................................. iv
Table of Contents .................................................................................................. v
Chapter One : Background.................................................................................. v
1.1 The Gas Turbine Engine ........................................................................................... 1
1.2 Thermal Barrier Coating Systems............................................................................. 5
1.3 Alternatives to YSZ ................................................................................................ 11
1.3.1 Defect Cluster TBC’s....................................................................................... 13
1.3.2 Aluminates ....................................................................................................... 13
1.3.3 Perovskites ....................................................................................................... 14
1.4 Pyrochlores ............................................................................................................. 14
1.4.1 Structure and Properties of Pyrochlores .......................................................... 16
1.4.2 Pyrochlores TBC’s........................................................................................... 19
TGO Interactions .................................................................................................. 19
Compositional Variations ..................................................................................... 20
1.4.3 Fundamentals of Samarium Zirconate Evaporation ........................................ 23
Chapter Two : Coating Deposition Methodology and Characterization....... 29
2.1 Growth of SZO coatings by DVD .......................................................................... 29
2.1.1 The DVD system.............................................................................................. 30
2.1.2 Materials and Growth Conditions.................................................................... 35
Source Material .................................................................................................... 35
Substrate ............................................................................................................... 37
Deposition Conditions .......................................................................................... 38
2.2 Characterization ...................................................................................................... 39
2.2.1 SEM - EDS Measurements .............................................................................. 39
2.2.2 XRD Measurements......................................................................................... 41
Chapter Three : Single Source Depositions...................................................... 42

vi
3.1 Vaporization of SZO............................................................................................... 42
3.1.1 Effect of Evaporation Time on Source Material.............................................. 43
3.1.2 Effect of Beam Current on SZO Source Material............................................ 46
3.1.3 Effect of Beam Current on SZO Coating......................................................... 52
3.2 Transport of SZO Vapor ......................................................................................... 56
3.2.1 Gas Flow Effects.............................................................................................. 56
Experimental ......................................................................................................... 57
Maximum Jet Velocity Calculation....................................................................... 60
Gas Flow Effects Simulations ............................................................................... 63
3.2.2 Rotated Versus Stationary................................................................................ 64
3.3 Discussion ............................................................................................................... 66
Chapter Four : Dual Source Depositions.......................................................... 69
4.1 Experimental ........................................................................................................... 70
4.2 Problems with Dual Source Evaporation................................................................ 72
4.3 Two Source Evaporation Results............................................................................ 74
4.4 Discussion ............................................................................................................... 77
Chapter Five : Discussion................................................................................... 79
Chapter Six : Conclusions .................................................................................. 84
References............................................................................................................ 86

vii
List of Figures
Figure 1-1: Basic sections of a jet engine [3] ..................................................................... 2 Figure 1-2: Basic sections of a gas turbine engine with bypass air shown [3] .................. 2
Figure 1-3 : Plot of ideal (green line) versus actual engine measurements (circles) of temperature versus power. T2, T3, and T4 are the fan inlet, compressor exit, and combustor exit temperatures, R is the gas constant, γ is the ratio of heat capacities, approximately 1.4 [7,8] .............................................................................................. 3
Figure 1-4 : Plot of changes in gas temperature entering the turbine over time resulting from superalloy developments. The effect of blade cooling and coating technology is also shown (striped region) [1,9] ............................................................................... 5
Figure 1-5 : Left – Turbine blade (~12cm) showing cooling holes [7] Right – Diagram of cooling system air flow in turbine blade [1]............................................................... 5
Figure 1-6 : Diagram of TBC system with overlay plot of temperature gradient from combustion chamber to turbine blade surface with and without TBC [11] ............... 6
Figure 1-7 : a) Plasma spray coating structure showing pores perpendicular to heat flow. b) EB-PVD coating with vertical pores parallel to heat flow..................................... 9
Figure 1-8 : SEM micrograph and schematic showing the zig-zag structure of the coating. This reduces the thermal conductivity while maintaining a high lateral compliance.................................................................................................................................... 12
Figure 1-9 : Plot of thermal conductivity at 1000oC (700oC for SZO and GZO) versus thermal expansion coefficient (30-1000oC) for dense alternative thermal barrier coating materials compared to YSZ [10,32,34]........................................................ 13
Figure 1-10 : Plot of thermal conductivity versus temperature for various hot pressed pyrochlore ceramics compared to YSZ. Values have been adjusted to account for the samples not being fully dense [32] ........................................................................... 15
Figure 1-11 : Comparison of some pyrochlore (P) phase diagrams [12,44] to 7YSZ [12]. The shaded area is the approximate operation temperature range [29]. ................ 16
Figure 1-12 : (a) Fluorite structure unit cell. Yellow = A or B cation = Zr or Sm, Red = Oxygen (b) 1/8 of the pyrochlore structure. Yellow = A cation (Zr), Blue = B cation i.e. Gd, Sm, La, Red = Oxygen [43] ......................................................................... 17
Figure 1-13 : Plot of calculated min k values from Equation 1.2 versus specific modulus [29,31] ...................................................................................................................... 18
Figure 1-14 : Simulated map of thermal conductivity of pyrochlores based on atomic radius of A and B atoms. From the simulations it appears that the thermal conductivity depends more on the ionic radius of the B then A cation [35,43]........ 19
Figure 1-15 : Cycle test failure versus temperature for YSZ and some alternative coatings prepared by APS. One cycle consists of 5 min heating followed by a 2 min cooling [10]. .......................................................................................................................... 20

viii
Figure 1-16 : SEM backscatter image of cross section of an SZO coating with plot of EDS data overlaid showing samarium compositional variation through the thickness of the coating. Lighter bands coincide with more samarium rich regions, and darker zirconium. Due to samarium’s higher vapor pressure it is initially evaporated out of the melt, which leads to a samarium rich region at the base of the coating. ........... 21
Figure 1-17 : Calculated vapor pressures of rare earth oxides as compared to zirconia [12,53]. ..................................................................................................................... 21
Figure 1-18 : ZrO2 – SmO1.5 Phase diagram (P = pyrochlore, F = fluorite) [12,44]...... 24
Figure 1-19 : (a) Plots of calculated vapor pressures of ZrO2 and Sm2O3 versus 1000/T (oC) [53] (b) Plot of the ratio of calculated samarium oxide and zirconia vapor pressures versus temperature [44,53] ...................................................................... 25
Figure 2-1 : (a) Schematic of the pumping and DVD systems with main components labeled. (b) Photograph of the outside of the DVD system (the part to the right of the wall in (a))................................................................................................................. 30
Figure 2-2 : Diagram of the inside of the DVD chamber. In this figure a dual source deposition is shown with the plumes from the separate sources overlapping to give compositionally constant coating. In experiments the source rods are fed on at slight angle (~80o), not 90o as shown [11]. ........................................................................ 31
Figure 2-3 : (a) Scan pattern used for ceramic sources consisting of three rings of varying dwell times with the outer ring being the longest and the center least. (b) Pattern used for dual source depositions, each also consisting of three rings......... 33
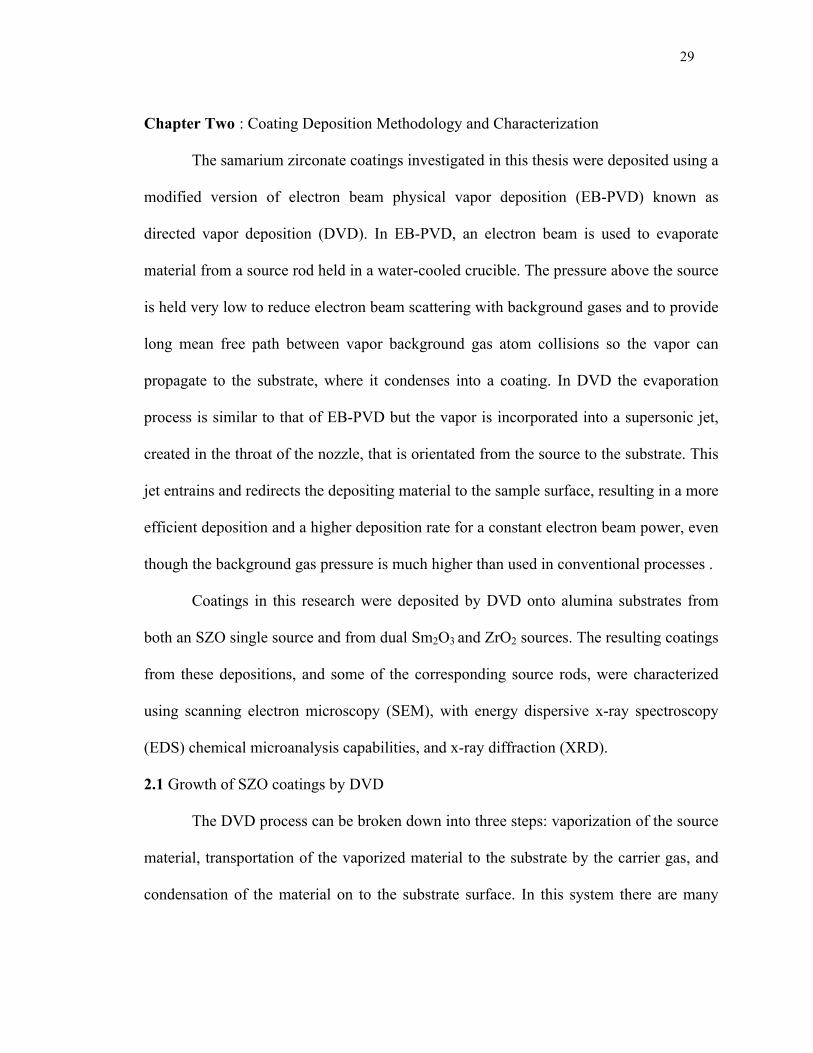
Figure 2-4 : Dependence of the deposition rate upon helium gas flow rate for two evaporation rates (different electron beam currents). The R2 values are for the second order polynomial fit tread lines accompanying the data (circles)................ 35
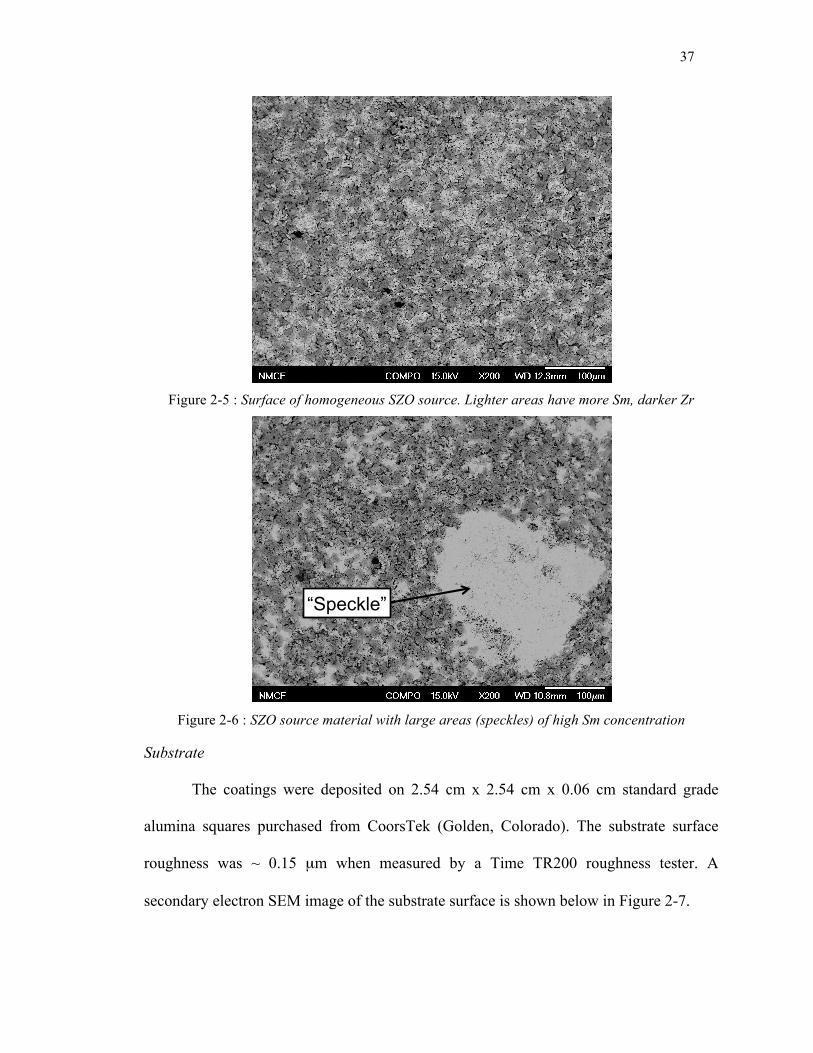
Figure 2-5 : Surface of homogeneous SZO source. Lighter areas have more Sm, darker Zr................................................................................................................................... 37
Figure 2-6 : SZO source material with large areas (speckles) of high Sm concentration 37 Figure 2-7 : Secondary electron image of surface of alumina substrate .......................... 38
Figure 3-1 : Line scan data of a SZO coating with initial concentration gradient labeled.................................................................................................................................... 44
Figure 3-2 : Optical images of cross-sections of ablated source rods (1.2 cm diameter). The darkest region is the cross section of the melt. EDS area scans (~ 4.2 x 104 µm2) were acquired from top center .The green box is the approximate location of area scanned (below white arrow). The darker speckles in the lighter region of the source material are samarium rich regions. ........................................................................ 45
Figure 3-3 : Plot of EDS data from source rod area scans (from just below top center, white arrow in Figure 3-2, of ingots) versus ablation time. The “zero” time sample is the composition of the source (measured by EDS to be 50 +/- 3 atomic % samarium). Also, the average samarium concentration for source material ablated for over 30 minutes is included for comparison. ...................................................... 46

ix
Figure 3-4 : Optical image of SZO source with approximate points where EDS area scans were obtained (blue diamonds)....................................................................... 48
Figure 3-5 : Plot of the atomic % samarium at points shown in Figure 3-4 versus distance (mm) from top (green square in Figure 3-4 ) of source rod ..................................... 48
Figure 3-6 : Image from Figure 3-4 with data overlaid from Figure 3-5 (red line). Each red point gives the samarium concentration for the corresponding blue diamond. . 49
Figure 3-7 : (a) “Speckled” material ablated with 30 mA beam current. (b) “Non-speckled” source also ablated with 30 mA beam current......................................... 50
Figure 3-8 : Optical micrograph of Cross-sections of SZO sources (0.47” diameter), evaporated for ~30 min. The white dashed line marks the approximate location of where the measurements were obtained. In some samples these are slightly off center to avoid the pore in the center of the source that forms upon cooling. The melt region (black area) is slightly angled since the source rod was angled (~80o) in the crucible................................................................................................................ 50
Figure 3-9 : Plots of samarium concentration versus distance from center top in “speckled” source rods Figure 3-8........................................................................... 51
Figure 3-10 : Plots of samarium concentration versus distance from center top in uniform (non-speckled) source material................................................................................. 52
Figure 3-11 : XRD data from beam current samples. [12].............................................. 53 Figure 3-12 : EDS line scan data from samples deposited at 30, 35, and 40 mA.
Compared from substrate up to 200 µm from substrate. .......................................... 54
Figure 3-13: Comparison plot of EDS line scan data of coatings deposited from speckled and non-speckled ...................................................................................................... 56
Figure 3-14 : Plot of XRD data from samples deposited using different gas flow rates... 58 Figure 3-15 : Backscatted SEM images (same magnification) of banding in thinner lower
carrier gas flow rate samples (5 and 8 slm) compared to a thicker, higher carrier gas flow rate sample (10 slm). .................................................................................. 59
Figure 3-16 : Smoothed EDS line scan data. There does not appear to be any relation to the compositional fluctuations throughout the coatings and gas flow rate. ............. 60
Figure 3-17 : SEM backscatter image of SZO coating, Stationary.................................. 65
Figure 3-18 : SEM backscatter image of SZO coating, Rotated 6 RPM.......................... 65 Figure 3-19 : Plot of atomic percent samarium versus distance from the substrate surface.
The rotated and stationary samples show similar trends in compositional variation. (EDS data not completed versus a standard) ........................................................... 66
Figure 4-1 : Dual crucible configuration. Sources evaporated by scanning single EB-gun over each source. ...................................................................................................... 70
Figure 4-2 : Plot of evaporation rate versus beam current. The evaporation rate is the amount of material that is evaporated off of the source (grams) per minute. .......... 71

x
Figure 4-3 : Coating deposited with too high of a beam current (55 mA, dwell time 45% / 55% between samarium oxide / zirconia). This caused the zirconia source rod to become stuck and resulted in an area of higher samarium concentration. .............. 73
Figure 4-4 : Coating deposited with too low a dwell time on zirconia source, (29 mA, dwell time 45% / 55% between samarium oxide / zirconia) leaving the coating with a high samarium concentration. ............................................................................... 73
Figure 4-5 : Coating made from two separate sources with an average samarium concentration of 50.9 atomic%. ................................................................................ 74
Figure 4-6 : Comparison of XRD data from SZO coating deposited from two separate sources as compared to sample deposited from single source (single source sample also included in Figure 3-11). .................................................................................. 75
Figure 4-7 : Plot of final dual sample included with single source data for comparison. 76
xi
List of Tables
Table 3-1 : Average and standard deviation of EDS line scan data 75 – 200 µm from substrate after evaporation of samarium from melt has stabilized........................... 55
Table 3-2 : Summary of EDS line scan data from coating thickness of 20 to 100 µm from substrate. ................................................................................................................... 60
Table 3-3 : Calculated values for the various gas flow runs. The estimated jet velocity did not greatly change by changing the gas flow rate; as such the time of flight would be similar. ...................................................................................................................... 62
Table 3-4 : % difference samarium versus zirconium at different flow rates from simulations. ............................................................................................................... 64
Table 3-5 : EDS line scan summary for Figure 3-19........................................................ 66 Table 4-1 : Comparison of EDS data between dual and single source (varying beam
current) samples from the substrate up to 75 µm from the substrate. ..................... 77
Table 4-2 : Comparison of EDS data between dual and single source (varying beam current) samples from 75 µm to 200 µm above the substrate. ................................. 77

1
Chapter One : Background
Gas turbine engines are widely used for aircraft propulsion and for generating
electrical power. Today’s gas turbine engines utilize a Brayton thermodynamic cycle to
convert chemical energy to mechanical work. The ideal Brayton cycle consists of an
isentropic compression, an isobaric combustion of the air and gas mixture, followed by
an isentropic expansion, and finally an isobaric cool down back to the starting
temperature [1]. The engine’s performance and fuel efficiency therefore increases with
operating temperature. This thesis addresses one of the consequences of ongoing efforts
to increase engine efficiency via increases in turbine operating temperature.
1.1 The Gas Turbine Engine
In an aeroderivative gas turbine engine, air is ingested through the inlet and
compressed to pressures up to 10 or more atmospheres by a series of (low, intermediate,
and high pressure) axial compressors consisting of rotating blades and stationary stators
that direct airflow (Figure 1-1). The compressed air is then mixed with fuel in a
combustion chamber and ignited. The heat generated results in an expansion of the
compressed air and fuel reaction product mixture, forcing the mixture out the back of the
combustor into a high pressure turbine. The turbine consists of a series of rotating blades
attached to disks. Passage of the high speed combustor gases over the air foil shaped
blades causes the disks to rotate. This in turn powers the compressor, usually by means of
a main turbine shaft that connects the turbine disks to those used to hold the compressor
blades. The exhaust exiting the engine has higher momentum than that entering it, and
thus creates thrust [1,2].

2
Figure 1-1: Basic sections of a jet engine [3]
The efficiency of propulsion can be increased by incorporating bypass air (air that
goes through the fan, but not the compressor or combustor) with that from the exhaust
(Figure 1-2). This increases the mass of gas ejected from the engine and thus increases
momentum [1,2].
Figure 1-2: Basic sections of a gas turbine engine with bypass air shown [3]
Gas stream temperatures in the turbine section of the engine (the hot section)
over development time have risen and can now exceed 1500oC. This is well above the
incipient melting temperature of the superalloys used in this section of the engine.
However, because the engine components are internally and surface air cooled, the
temperature at the surface of these cooled parts only reaches 1200oC [4–6].
The dependence of engine core power upon turbine inlet temperature is plotted in
Figure 1-3. The units of specific core power used are kilowatts of power scaled by the

3
mass of the airflow (not including fuel) that passes through the core per second. The
green line marks the ideal engine performance where T2, T3, and T4 are respectively the
fan inlet, compressor exit, and combustor exit temperatures, and the circles below
represent the efficiencies of specific engines. The general trend in both plots is that as the
engine temperature is raised it is accompanied by an increase in power output, though the
performance of actual engines increases at a slower rate due to a portion of the
compressor air being diverted to cool engine components, various frictional losses, and
deviations from the ideal Brayton cycle (for example non-isobaric combustion or failure
to achieve isentropic compression/expansion) [4,7,8].
Figure 1-3 : Plot of ideal (green line) versus actual engine measurements (circles) of temperature versus power. T2, T3, and T4 are the fan inlet, compressor exit, and combustor exit temperatures, R is the gas constant, γ is the ratio of heat capacities, approximately 1.4 [7,8]
The maximum engine operating temperature is limited by the materials (usually
nickel superalloys) used to construct the turbine hardware and the effectiveness of metal
cooling strategies. Along with high temperature phase stability, materials for the turbine

4
must be fatigue, creep, corrosion, erosion, and oxidation resistant [4]. The continuous
improvement of engine power over time has been enabled by over seventy years of alloy
development resulting in modern superalloys. These developments also required the
invention of novel methods for creating the complex turbine blades and other component
structures from these alloys.
One of the earliest operation temperature improvements, first utilized in engines
for late WWII aircraft, was to air cool the solid wrought nickel alloy blades by having
some of the inlet air circulate within them [2]. The next major increases in temperature
were due to alloy processing changes. The largest jump in engine temperature from these
developments occurred in the 1950’s due to age and precipitation hardening of the nickel
alloys, giving an improvement of 200oC. Subsequent gains in temperature were mostly
achieved by switching to casting methods that resulted in directionally solidified (DS)
alloys with reduced creep rates. Pratt and Whitney made the first cast turbine blades in
1965. These DS blades had grains aligned in the direction of the centrifugal force;
parallel to the blade’s axis. This extended the creep lifetime of the components by
reducing the grain boundaries (where failure usually occurs) transverse to the loading
direction. This development was followed by processes that completely removed the
grain boundaries by creating single crystal turbine blades [1]. These developments are
summarized in Figure 1-4. The striped region of the plot displays the increases in
temperature, above those of alloy development, made by incorporating complex internal
cooling systems into the blades design (Figure 1-5) and by the introduction of thermal
barrier coatings.

5
Figure 1-4 : Plot of changes in gas temperature entering the turbine over time resulting from superalloy developments. The effect of blade cooling and coating technology is also shown (striped region) [1,9]
Figure 1-5 : Left – Turbine blade (~12cm) showing cooling holes [7] Right – Diagram of cooling system air flow in turbine blade [1]
1.2 Thermal Barrier Coating Systems
The temperatures at which internally cooled superalloy components operate are
now within 200oC of the superalloy’s melting point. Internal air cooling has also matured,
and so for further increases in lifetime and/or operation temperture of hot section
components require alternatives to superalloy or internal cooling improvement. This led

6
to the development of thermal barrier coating (TBC) systems. TBC systems typically
consist of three layers (i) a metallic aluminum rich bond coat, (ii) a thermallly grown
oxide (TGO) composed predominitalty of protective α-Al2O3, and (iii) a highly porous
ceramic thermal insulating layer made up of a material with a low intrinsic thermal
conductivity [4,8]. This coating system was first explored in the 1950’s and was initially
incorporated into commercial engines in the 1960’s [10]. A schematic of this layered
structure and its reduction of the surface temperature of the metal is shown below.
Figure 1-6 : Diagram of TBC system with overlay plot of temperature gradient from combustion chamber to turbine blade surface with and without TBC [11] The metallic bond coat typically consists of 50 to 125 µm of platinum aluminide,
NiCoCrAlY, or similar layer generally deposited through a pack cementation, plasma
spray, or physical vapor deposition process. This layer is rich in aluminum (and
sometimes chromium), which provides oxidation and corrosion resistance that is

7
impossible to achieve in an uncoated superalloy where the goal is maintaining tensile,
creep, and fatigue strength [4].
The high aluminum content of the bond coat is designed to form a protective α-
alumina TGO layer in a high temperature oxidizing environment. This layer gradually
thickens during service of the component, and (provided it does not spall and expose a
new surface) protects the underlying superalloy from oxidative and hot corrosion damage.
A thin TGO region is usually formed during deposition of the ceramic top coat. The TGO
layer thickness there on increases from about one half to ten microns over the service
lifetime of the coating. The TGO thickness is controlled by diffusion through the TGO
and as such grows parabolically with time at constant temperature. The difference in
thermal expansion coefficients between the alumina and bond coat result in residual
stress in the TGO, and stored elastic strain energy, that increases with TGO layer
thickness. Eventually, the release of this energy exceeds the interfacial toughness, a
delamination crack forms between the TGO and bond coat, and spallation occurs.
Thermal stresses also develop in the ceramic top coat upon cooling, making it vulnerable
to spallation from the TGO [12–17]. The application of a few hundred micron thick
ceramic layer to the bond coat can lead to an increase in engine operating temperature of
around 150oC without increasing the surface temperature of the superalloy. This is
approximately equivalent to the gain of 2-3 generations of superalloy development [18].
Current ceramic coatings consist of yttria-stabilized zirconia (YSZ); typically
zirconia containing 7-8 wt% yttria. These coatings are usually deposited by either air
plasma spraying (APS) [19–21] or electron beam physical vapor deposition (EB-PVD)
[16,22,23]. Both provide the high enthalpy needed to melt ceramics (the melting point of

8
YSZ is 2690oC), however in vapor deposition processes, the enthalpy of vaporization
must also be supplied [4,24].
APS coatings have the advantage of a lower thermal conductivity than the EB-
PVD material and are less costly to apply (due to the high cost of EB-PVD equipment
and slow rate of coating deposition) [25,26]. During APS, the depositing liquid droplets
hit the surface and form splats on previously deposited material. Long pores are then
formed at splat boundaries. These pores are orientated transverse to the direction of heat
flow inhibiting the thermal diffusion to the bond coat, as shown in Figure 1-7 (a). Plasma
spray coatings suffer from several potential problems. (i) It can be hard to control the
coating composition, with some areas of the coating varying from 7 wt% YSZ leading to
the formation of other phases [4]. (ii) Unless dense vertically cracked coatings are used,
there is no mechanism for the coating to expand and contract sufficiently with the metal
on heating / cooling. As a result high residual stresses form upon cooling in APS coatings,
making them more prone to spallation. For these reasons APS TBC’s are generally used
in less demanding TBC applications such as stationary parts in aero engines or in
industrial turbine engines where there is less severe thermal cycling [10,24,26].

9
Figure 1-7 : a) Plasma spray coating structure showing pores perpendicular to heat flow. b) EB-PVD coating with vertical pores parallel to heat flow.
EB-PVD coatings have a columnar structure with inter-column pores running
through the coating thickness, Figure 1-7 (b). As a result they have a slightly higher
through thickness thermal conductivity. However, these vertical pores can open and close
during thermal cycling, which reduces the residual stress and results in a higher thermal
cycling life compared to plasma spray coatings. For these reasons EB-PVD is the
deposition method of choice for coatings on turbine components intended for more severe
environments, such as on turbine blades used in engines for advanced fighter aircraft [24].
However, there can be several problems with EB-PVD coatings. It is difficult to control
the pore content in the coating, and the process makes very inefficient use of the vapor
(just a few percent condenses on the component). A modification to the EB-PVD process
known as directed vapor deposition (DVD) utilizes a carrier gas to direct the vapor from

10
the source to the substrate, increasing the deposition rate and decreasing the amount of
material lost to the chamber walls by about a factor of ten. It also enables much higher
pore volume fractions to be incorporated in a coating, which increases the coatings
spallation lifetime [12,25,27,28].
There are a number of requirements for ceramic topcoats deposited by any of
these methods. A suitable material should possess:
1. High melting point
2. Phase stability from room to operation temperature
3. Low thermal conductivity
4. Chemical inertness
5. Thermal expansion coefficient close to that of substrate
6. Adhere to substrate
7. Low sintering rate
8. Erosion resistance
9. Corrosion resistance [29,30]
The ceramic of choice, from the 1980’s until present, that meets this criteria is
seven-weight percent yttria-stabilized zirconia1 (7YSZ) [10]. However, YSZ usage is
considered to be limited to temperatures less then 1200oC. At temperatures above this,
increased sintering starts to occur (resulting in a loss of porosity) and phase stability
becomes an issue as YSZ enters a two-phase region (t and cubic zirconia)2 [30]. Upon
cooling to room temperature from this two-phase region there is a phase change to
monoclinic accompanied by a 3 – 5 % volume increase leading to cracking of the coating
1 7 wt % yttrium is the established stabilizing content because at lower yttrium concentrations upon cooling to room temperature the monoclinic phase forms (as would in pure zirconia) and at higher concentrations the cubic phase (less tough then tetragonal) is stabilized [4]. 2 Zirconia – yttria phase diagram shown in Figure 1-11on page 16.

11
[4]. As such YSZ is mostly implemented to extend the life of engine components rather
than increase operating temperature [29].
Since increasing the engine temperature above the YSZ usage limit would lead to
increased efficiency, there have been many efforts to replace the YSZ coating itself with
a more suitable material [31]. However, YSZ possess a uniquely good combination of
properties required to be a suitable thermal barrier coating and has proven to be difficult
to replace [31].
1.3 Alternatives to YSZ
Some of the properties previously mentioned (i.e. melting point, phase stability,
chemical inertness) are intrinsic material properties (changing processing conditions does
not affect them). Other properties, such as thermal conductivity (k) and thermal
expansion, can be optimized through both materials selection and modification of the
processing conditions. Using a TBC material with a lower intrinsic thermal conductivity
reduces the bond coat surface temperature and slows the thermally activated processes
(such as TGO growth) that cause TBC failure. Alternatively, improved TBC materials
allow for the use of a thinner TBC coating, which reduces the parasitic weight of the
coating on the rotating turbine blade [32]. In view of these benefits, low k materials and
application methods have been the focus of a great deal of research [29,31–36], including
research at the University of Virginia [12,25,37].
Processing modifications for the application of YSZ coatings have been aimed at
decreasing the thermal conductivity by creating a more porous microstructure that better
obstructs heat flow. For example, in plasma spray coatings the lower thermal
conductivity (0.9 – 1.0 W/mK as opposed to 1.8 – 2 W/mK for EB-PVD coatings) is due

12
to the presence of voids parallel to the substrate surface that are less effective at heat
conduction compared to the perpendicular voids found in EB-PVD coatings (Figure 1-7).
One way to create EB-PVD coatings with voids that better inhibit through thickness
thermal conduction is to grow columns with a zigzag structure by manipulating the angle
of the substrate surface during the deposition Figure 1-8 [25,28,38]. Methods such as this
allow the coating to have both a strain tolerant columnar structure typical of EB-PVD
coatings and a low thermal conductivity typical of plasma spray systems. Other process
modifications that lead to decreased k include increasing the deposition pressure [25],
moving the substrate farther from the source [39], or rotating the substrate [12]. All of
these increase the coating porosity [9,29].
Figure 1-8 : SEM micrograph and schematic showing the zig-zag structure of the coating. This reduces the thermal conductivity while maintaining a high lateral compliance.
Other attempts to improve coating performance are focused on the material
properties. This includes attempting to lower the thermal conductivity of zirconia by
doping it with other elements besides yttrium (defect cluster TBC’s). Another approach
involves replacing YSZ with a material that has an inherently lower thermal conductivity
[10,29,30]. A few of the alternative materials being explored include perovskites,
aluminates, and pyrochlores [10] (Figure 1-9). The pyrochlores, as a group, appear to

13
offer the lowest thermal conductivity compared to the other options currently being
explored.
Figure 1-9 : Plot of thermal conductivity at 1000oC (700oC for SZO and GZO) versus thermal expansion coefficient (30-1000oC) for dense alternative thermal barrier coating materials compared to YSZ [10,32,34]. 1.3.1 Defect Cluster TBC’s
Doping a zirconia (or possibly hafnia) matrix with two or more other cations,
typically one smaller and one larger, causes the formation of nano-scale clusters of
different size ions which act as phonon scattering sites that lower the thermal
conductivity. For instance, the thermal conductivity at room temperature of 7YSZ is
reduced by 63% with the addition of 1-5 mole percent La2O3. These coatings could also
have the potential to be used in environments up to 1650oC [10,29,36,40].
1.3.2 Aluminates
Lanthanum aluminates have the general composition (La, Nd)MAl11O19 (where M
could be Mg, Mn → Zn, Cr or Sm). They have a high melting point, are phase stable up
to 1400oC, have a lower sintering rate than YSZ, high thermal expansion coefficient, and
relatively low thermal conductivity [10,30]. When deposited by APS these coatings are
typically amorphous and the crystalline form is brought about through heat-treating,

14
which is accompanied by a large decrease in volume. However, careful heat-treating of
some compositions can result in a strain tolerant microstructure containing many small
vertical cracks. They also show good thermal cycling life at 1300oC when deposited on
top of YSZ in a dual layer system [10,41].
1.3.3 Perovskites
Perovskites, ABO3 i.e. BaZrO3, SrZrO3, Ba(Mg2/3Ta2/3)O3, have high melting
points, and most are stable at high temperatures. In general, the properties of bulk
perovskites make them a good candidate thermal barrier coating. However, there are
processing problems with these coatings due to the large difference in vapor pressures of
the various oxide species. Stoichiometric deposition of the perovskite BaLa2Ti3O10 into a
low thermal conductivity coating has been achieved, however it has not been determined
if this material can be used at higher temperatures than YSZ [10].
1.4 Pyrochlores
Pyrochlores with the general stoichiometry Ln2Zr2O7 (where Ln =La, Nd, Sm, or
Gd), are a promising TBC candidate for operation over 1300oC because of their high
phase stability and low thermal conductivity compared to YSZ (Figure 1-10). Also, at
1200oC the thermal expansion coefficients of the pyrochlores is ~10-5 oC-1 [34], above the
minimum 9 x 10⁻⁶ oC-1 required for compatibility with metallic substrates3. In addition
they have potentially better CMAS4 (calcium-magnesium-alumino-silicate) resistance
than YSZ. This has been seen in Gd2Zr2O7 (GZO) where the effect of CMAS attack was
reduced as GZO reacted with it and slowed down infiltration [10]. Amongst the
3 Substrate and bond coat thermal expansion coefficients typically around ~1.5 x 10⁻⁵ oC-1 and 10-5 to 1.1 x 10⁻⁵ oC-1 for YSZ [10] 4 CMAS is a corrosive substance that occurs when debris becomes liquid in the hot section of the engine, comes in contact with the coating, and then seeps into it. When the system is cooled the CMAS solidifies resulting in a reduction of coating strain tolerance [10].

15
pyrochlores, samarium zirconate, Sm23+Zr2
4+O72- (abbreviated as SZO) has the greatest
thermal expansion coefficient as a consequence of its weak Ln-O bond [42]. It also has
low thermal conductivity5 (1.5 to 1.6 W/(m*K)), comparable to that of Gd2Zr2O7 and the
other Ln2Zr2O7 [32,34,43]. Gd2Zr2O7 has a slightly higher maximum operation
temperature than 7YSZ, where as Sm2Zr2O7 and La2Zr2O7 pyrochlores are stable to
higher temperatures. The phase stability of these pyrochlores, in comparison to 7YSZ,
can be seen in the calculated phase diagrams in Figure 1-11 [12,44]. Sm2Zr2O7 was
originally chosen for this research due to the above reasons and because, out of the
pyrochlores, the least amount of studies on its vapor phase deposition had been
completed [12,37].
Figure 1-10 : Plot of thermal conductivity versus temperature for various hot pressed pyrochlore ceramics compared to YSZ. Values have been adjusted to account for the samples not being fully dense [32]
5 Thermal conductivity ~2.5 W/mK for 8.8wt% YSZ [32]

16
Figure 1-11 : Comparison of some pyrochlore (P) phase diagrams [12,44] to 7YSZ [12]. The shaded area is the approximate operation temperature range [29]. 1.4.1 Structure and Properties of Pyrochlores
The pyrochlore structure is an ordered form of the fluorite structure and can be
viewed as consisting of eight fluorite cells each, on average, containing one oxygen
vacancy as marked by the arrow in Figure 1-12 (b). The fluorite structure can be seen as
one extreme with oxygen atoms distributed throughout the tetrahedral positions giving
each disordered cation a coordination number of eight. The pyrochlore, to the other
extreme, has ordered cations with the smaller Zr cation now having a coordination
number of six and the larger Ln cation remaining at eight [43,45–48].

17
Figure 1-12 : (a) Fluorite structure unit cell. Yellow = A or B cation (Zr or Ln), Red = Oxygen (b) 1/8 of the pyrochlore structure. Yellow = A cation (Zr), Blue = B cation (i.e. Gd, Sm, La), Red = Oxygen [43]
The thermal conductivity of a material is governed by the phonon (lattice
vibrations) scattering distance. Debye proposed that the thermal conductivity, k, depends
upon the product of the phonon mean free path lP, specific heat CV, and phonon velocity
vm [31,49]. (1.1)
Above the Debye temperature (ΘD) of a crystalline material, the thermal
conductivity reaches a minimum value (kmin) and varies little with further temperature
increases [29,31,49]. The minimum thermal conductivity can be expressed in terms of the
volume per atom Ωa, Boltzmann constant kb, and the speed of sound in a material;
(E/ρ)1/2 where E is the Young’s modulus and ρ is the material density [31]:
(1.2) 6
The operation temperatures of turbine engines are typically well above the Debye
temperature of thermal barrier coating materials (ΘD of YSZ is ~200oC). Therefore,
changes in thermal conductivity with temperature are of minimal importance for these
6 In Equation 1.2 is the average volume per atom. Where M is the molar volume, m is the number atoms per formula unit, and NA is Avogadro’s number
€
Ωa = M /mρNA[ ]
€
k =13lpCvvm
€
kmin = 0.87kBΩa−2 / 3 E /ρ( )1/ 2

18
applications, and the estimated kmin from Equation 1.3 has been used to pinpoint
candidates for TBC applications [29,31]. These values are higher than those reported
experimentally due to higher levels of porosity in the experimental samples. However,
from these estimates of kmin it can qualitatively be determined that a good TBC material
will possess large (heavier) ions, a complex crystal structure, and non-directional bonding
[29,31,49]. As seen in Figure 1-13, the rare earth zirconates cluster in the desired low k
range.
Figure 1-13 : Plot of calculated min k values from Equation 1.2 versus specific modulus [29,31]
Molecular dynamic simulations by Schelling et. al. [35] have been used to
investigate the effect of cation size on thermal conductivity and found a greater
dependence on the B (Zr) than A (i.e. Sm) ionic radius. The values in these simulations
are around 30% higher than the actual values, which could be attributed to measurements
not consistently accounting for porosity, defects, or impurities. Based on these
calculations, the zirconate pyrochlores offer the best choice for low thermal conductivity,
considering that Pb compounds need to be avoided due to their easy decomposition and
associated environmental hazards (Figure 1-14) [31,35,43].

19
Figure 1-14 : Simulated map of thermal conductivity of pyrochlores based on atomic radius of A and B atoms. From the simulations it appears that the thermal conductivity depends more on the ionic radius of the B then A cation [35,43]. 1.4.2 Pyrochlores TBC’s
Early efforts to develop pyrochlore TBC’s led to the discovery of premature
spallation during thermal cycling. This has been shown to result from a reaction between
the alumina rich TGO layer and the rare earth zirconate. In this reaction a rare earth
aluminate is formed that reduces the toughness of the interface [12,29,50]. Significant
compositional variations in as deposited EB-PVD samarium and lanthanum zirconate
coatings have also been found to occur [37,51]. An explanation of these variations, or
their effects on the coating structure and lifetime, is yet to be understood.
TGO Interactions
Many of the rare earths form equilibrium phases with alumina in the relevant
temperatures range of TBC operation. For instance gadolinium zirconate coatings react
with alumina to form a porous GdAlO3 that over time depletes the protective TGO layer
and also reduces the durability of the interface [50,52]. Similar situations resulting in the
formation of interface toughness reducing oxides occur at samarium zirconate / alumina

20
interfaces [15]. It is likely that analogous reactions will also occur between other rare
earth containing TBC’s and the alumina based TGO [50]. To avoid this problem a YSZ
diffusion barrier can be deposited between the TGO and rare earth zirconate topcoat.
YSZ was chosen because it has already proven to be compatible with the TGO. Also, it is
somewhat insulated from the high temperature engine environment by the above
pyrochlore layer, and should not greatly limit the overall coatings usefulness [12,15]. The
use of a YSZ diffusion barrier layer has been verified to increase the lifetime of
pyrochlore coatings deposited by the APS method (Figure 1-15).
Figure 1-15 : Cycle test failure versus temperature for YSZ and some alternative coatings prepared by APS. One cycle consists of 5 min heating followed by a 2 min cooling [10]. Compositional Variations
Compositional fluctuations have been reported in SZO and other rare earth oxide
containing TBC’s. The compositional fluctuations in an SZO coating are displayed in the
backscatter SEM image and accompanying overlay line scan data (blue line), in Figure
1-16. The usually advanced hypothesis is that the difference in vapor pressure varies

21
greatly between the rare earth oxides and zirconia (Figure 1-17), thus in EB-PVD
evaporation the higher vapor pressure material evaporates first resulting in an un-
stoichiometric melt, and in turn a compositionally varying coating.
Figure 1-16 : SEM backscatter image of cross section of an SZO coating with plot of EDS data overlaid showing samarium compositional variation through the thickness of the coating. Lighter bands coincide with more samarium rich regions, and darker zirconium. Due to samarium’s higher vapor pressure it is initially evaporated out of the melt, which leads to a samarium rich region at the base of the coating.
Figure 1-17 : Calculated vapor pressures of rare earth oxides as compared to zirconia [12,53].

22
The compositional variation problem in SZO coatings may be attributed to the
difference in vapor pressure between the Zr and Sm oxide vapor species. Similar coating
fluctuations have not been reported in EB-PVD Gd2Zr2O7 coatings, though the
differences in gadolinium and zirconium oxides vapor pressures are not as large as the
oxides of La and Sm [50,52]. Bobzin et. al. found no compositional variations in EB-
PVD lanthanum zirconate (LZO) coatings, however backscatter images of the coatings do
show some lighter banding that was not addressed [54]. LZO coatings deposited by
Saruhan et. al. did show compositional banding, with some of the larger fluctuations
being attributed to changes in chamber pressure which was correlated to the EDS data.
Also, from the EDS line scan data of these LZO coatings it was seen that the base of the
coatings possessed a greater concentration of the higher vapor pressure lanthanum [51].
Both of these coating compositional variations, the initial greater concentration of the
rare earth and banding (which consists of larger 10-50 µm thick compositional bands, and
smaller 1 µm bands), have been found in SZO coatings deposited by directed electron
beam physical vapor deposition at the University of Virginia [12,15,37].
Solutions that have been suggested to address the compositional variation
problems identified above generally fall into two categories. The first is to use a single
source RE2Zr2O7 ingot and try to eliminate the compositional differences through
optimizing the deposition parameters (i.e. power to the source, since the vapor pressure
differences depend on temperature) [12,55]. This method can also be utilized to pinpoint
the stage of the process where the banding occurs, possibly developing in the evaporation,
vapor transport, or deposition onto to the substrate. The second approach, and more
common solution, is to deposit each component material from an independently heated

23
source [40,56,57]. In the case of SZO coatings that would be two separate oxide sources,
one samarium oxide and one zirconia, with the power adjusted to each to give a Sm:Zr
ratio within the pyrochlore range in the coating.
1.4.3 Fundamentals of Samarium Zirconate Evaporation
The coatings grown during this research were deposited onto alumina substrates
by DVD from both a samarium zirconate (Sm2Zr2O7) single source, and from separate
samarium and zirconium oxide sources (Sm2O3 and ZrO2) using a dual source technique.
In both types of deposition the difference in vapor pressure between these two oxides
must be taken into consideration. In single source evaporation this difference can cause
preferential evaporation out of the melt of the higher vapor pressure constituent. When
utilizing a dual method this vapor pressure difference, which effects the deposition rate of
each source, necessitates adjustment of the EB-gun dwell time on each source to result in
a coating of the desired pyrochlore composition.
A phase diagram for the ZrO2 – SmO1.5 system where the center section is the
pyrochlore region (marked with a P) is shown in Figure 1-18 [12,44]. The SZO
pyrochlore phase is stable from room temperature to 2000 oC and is one of the main
reasons, along with a very low thermal conductivity value, that it is being considered as a
possible thermal barrier coating. For an SZO coating of pyrochlore composition, close to
a 1:1 atomic ratio of Sm to Zr needs to be maintained. To do so requires the evaporation
and deposition of 1.4 times more SmO1.5 (or 0.7 Sm2O3), by weight, than ZrO2. In the
deposition temperature range of 950 +/- 50 oC, this composition can vary from 50
atomic % samarium by approximately +/- 4% and still remain in the pyrochlore region.

24
Figure 1-18 : ZrO2 – SmO1.5 Phase diagram (P = pyrochlore, F = fluorite) [12,44].
However, due to the difference in vapor pressures between the samarium and
zirconium oxides, achieving this ratio is not trivial. This vapor pressure difference can be
seen Figure 1-19 (a), as reproduced from [53] for the calculated total7 vapor pressures
above the oxides. The plotted ratio of samarium oxide to the major zirconia species (ZrO
and ZrO2) present versus temperature is displayed in Figure 1-1(b), this data is also
presented in Figure 1-17 versus 1/T and is reproduced from [53]. There is preferential
evaporation of the higher vapor pressure Sm2O3. If not taken into consideration this
results in a higher samarium to zirconium evaporation ratio, and in turn a coating rich in
samarium.
7 For ZrO2 this includes ZrO2, ZrO, O2, and Zr, and for Sm2O3: SmO, O2, O, and Sm

25
(a)
Figure 1-19 : (a) Plots of calculated total vapor pressures of ZrO2 and Sm2O3 versus 1000/T (oC) [53] (b) Plot of the ratio of calculated total samarium oxide to ZrO2 and ZrO vapor pressures versus temperature [44,53] The evaporation rate of separate oxide sources can be estimated to illustrate the
impact of the vapor pressure difference on evaporation. Langmuir [56,64,65] determined
that the idealized evaporation rate, a, of a substance (with units of kg s-1 m-2, assuming all
particles evaporate, that is no condensation back into the source) and its vapor pressure
are related by:
Mel$ng'Point''of'
Sm2Zr2O7' ZrO2'
Sm2O3'
1.E815'
1.E812'
1.E809'
1.E806'
1.E803'
0.3' 0.4' 0.5' 0.6' 0.7'
Pressure'(kPa)'
1000/Temperature'(oC)'
Mel$ng'Point'of''Sm2Zr2O7'
1'
10'
100'
1000'
1400' 1900' 2400' 2900'
P(Sm
2O3)/P(ZrO2+ZrO)'
Temperature'(oC)'
(b)

26
(1.3)
Where:
ps is the saturated vapor pressure at Tv (Pa)
MD is the molecular weight (kg/mole)
Tv is the vaporization temperature (K)
R is the gas constant (8.314 m2 kg s-1 K-1 mole-1)
If collisions with background gas atoms scatter some of the vapor back towards
the liquid surface, the effective evaporation rate a2 is decreased by a factor of τ. The
transmission coefficient τ ranges from zero to one, as the background pressure is
decreased, and results in a reduced evaporation rate, a1, that increases with decreasing
pressure [56].
(1.4)
The DVD system operates at higher pressures (~ 0.02 kPa) than typical
evaporation systems and as such the transmission coefficient is comparably smaller. τ is
constant for equivalent chamber conditions, and will be equal for co-evaporated materials.
Consequently, for these reasons and simplicity, τ is not incorporated into the following
sections.
To demonstrate how the difference in vapor pressure affects the rate of
evaporation, Equation 2.1 can be used to estimate the ratio of the evaporation rates of
samarium oxide and zirconia at the SZO (Sm2Zr2O7) melting point (2497 oC [44]).
(1.5)
€
a = psMD
2πRTv
€
a1 = τa2
€
aSmOaZrO
=pSmOpZrO
MSmO
MZrO

27
The ratio of the vapor pressures (Figure 1-19 (b)) of PSmO/PZrO at this temperature
is about 15 [53], which results in approximately eighteen times greater mass of samarium
oxide evaporated per area-second compared to zirconia. Using the 0.7 Sm2O3 to 1 ZrO2
mass ratio needed for pyrochlore composition, the mass evaporation rate is around 25
times greater than the mass of samarium oxide needed for a 1:1 atomic ratio of Zr:Sm.
Furthermore, these rates will change with temperature. The relationship between
vapor pressure and temperature can be estimated by [56]:
(1.6)
Where K1 and K2 are material constants. Equation 1.6 can be combined with
equation 1.3 to give the evaporation rate related to temperature:
(1.7)
This equation shows that the vapor pressure depends on temperature, as does the
evaporation rate, and increases almost exponentially with it [56,64].
For single source evaporations, the evaporation rate a (kg s-1 m-2 ) of elements A
and B can be related to the mole fraction of the melt (XA, XB) by [56,62]:
(1.8)
Assuming the ratio of the activity coefficients (γA / γB) is ~1, this equation can be
used to estimate the effect the difference in vapor pressures of samarium and zirconium
oxide will have on the relationship between the melt and vapor compositions in SZO. For
example having a source material with 53 atomic % samarium and 47 atomic %
zirconium, which is within the range of the composition fluctuations in the SZO source
€
ps = K1e−K2 /Tv
€
a = K1MD
2πRTve−K2 /Tv
€
aAaB
=γAXA pAMA
1/ 2
γBXB pBMB1/ 2

28
material, gives a vapor phase mass ratio of 20:1 between the samarium and zirconium
oxides. These parameters result in about 28 times more samarium, by weight, than is
needed due to vapor pressure differences and the slight composition change.
Furthermore, when evaporation occurs from a single source where one compound
is more volatile then the other, depletion of this component in the melt occurs, and the
calculation becomes impractical. If the composition of the melt and coating are directly
related (material vaporized is deposited onto the substrate, not condensed back into the
melt), then both depletion in the melt and coating composition will be time dependent
[56].
Purpose of this Thesis
This thesis seeks to explore the origins of compositional variation in a
prototypical RE zirconate with a large vapor pressure difference (SZO). It investigates
the validity of the current vapor pressure difference hypothesis and also the efficacy of
processing strategies to mitigate the phenomenon.
29
Chapter Two : Coating Deposition Methodology and Characterization
The samarium zirconate coatings investigated in this thesis were deposited using a
modified version of electron beam physical vapor deposition (EB-PVD) known as
directed vapor deposition (DVD). In EB-PVD, an electron beam is used to evaporate
material from a source rod held in a water-cooled crucible. The pressure above the source
is held very low to reduce electron beam scattering with background gases and to provide
long mean free path between vapor background gas atom collisions so the vapor can
propagate to the substrate, where it condenses into a coating. In DVD the evaporation
process is similar to that of EB-PVD but the vapor is incorporated into a supersonic jet,
created in the throat of the nozzle, that is orientated from the source to the substrate. This
jet entrains and redirects the depositing material to the sample surface, resulting in a more
efficient deposition and a higher deposition rate for a constant electron beam power, even
though the background gas pressure is much higher than used in conventional processes .
Coatings in this research were deposited by DVD onto alumina substrates from
both an SZO single source and from dual Sm2O3 and ZrO2 sources. The resulting coatings
from these depositions, and some of the corresponding source rods, were characterized
using scanning electron microscopy (SEM), with energy dispersive x-ray spectroscopy
(EDS) chemical microanalysis capabilities, and x-ray diffraction (XRD).
2.1 Growth of SZO coatings by DVD
The DVD process can be broken down into three steps: vaporization of the source
material, transportation of the vaporized material to the substrate by the carrier gas, and
condensation of the material on to the substrate surface. In this system there are many

30
parameters, which if varied, can affect the properties of the deposited coating including
its composition, thickness, and structure.
2.1.1 The DVD system
The apparatus consists of the DVD chamber assembly (the working chamber, gas
flow system, and electron beam gun), two independent pumping systems (one for the
chamber and one to differentially evacuate the EB-gun), a computer control system, and
the supply systems (i.e. - cooling water, compressed air, power supplies). A schematic of
the DVD system, with basic components and pumps labeled, is shown along with an
image deposition chamber in Figure 2-1. A schematic diagram of the inside of the
chamber, configured for a dual source deposition, is shown in Figure 2-2. In a dual source
deposition the source / substrate are a distance apart that gives significant over-lapping of
the vapor plumes. Additional scattering in the gas jet results in a laterally uniform
composition coating [11,58].
Figure 2-1 : (a) Schematic of the pumping and DVD systems with main components labeled. (b) Photograph of the outside of the DVD system (the part to the right of the wall in (a))
Wall
Pumping System
DVD System
Vacuum
Lines
Plasma Unit
Mechanical pumps EB-gun Turbo pump
Intermediate chamber
Working chamber
Gas flow system
Oil vapor
booster pump
!
(a) (b)

31
Figure 2-2 : Diagram of the inside of the DVD chamber. In this figure a dual source deposition is shown with the plumes from the separate sources overlapping to give compositionally constant coating. In experiments the source rods are fed on at slight angle (~80o), not 90o as shown [11].
Because of the high pressure within the deposition chamber, the electron beam
gun used in this evaporation process has a high accelerating voltage of 70 kV (to reduce
the electron scattering cross section with background gases). The beam current can be
varied from zero to 150 mA, yielding a maximum beam power of 10 kW. However, beam
current values of 20 – 50 mA suffice for most evaporation practices. The beam is
generated by heating a tungsten wire filament, leading to ejection of electrons off of the
filament that in turn impact a bolt tungsten cathode, heating it, and causing it to also emit
electrons. A 70 kV voltage accelerates these electrons from the cathode to the anode
inside a low pressure gun. An electromagnetic deflection system near the exit of the gun
focuses these electrons into a beam. The beam then exits through a small, differentially

32
pumped aperture, propagates through the chamber and impacts the sample with a ~0.5
mm beam spot size. This spot can be scanned over the sample at rates of up to 100,000
Hz in complex patterns made up of many points [11,12,27,56,59]. If the scan pattern’s
size and complexity need to be increased, lower scan rates are used, with ~ 2,000 Hz
repetition rates being typical.
The beam scan patterns are developed based on the properties of the deposition
material and the effects of the water-cooled copper crucible (the one used here can
accommodate up to four separate sources; two 1.27 cm and two 0.64 cm diameter). If the
beam scans each differential area element equally, the cooled outer portion of the source
will evaporate at a much lower rate and a concave cup will develop. For low thermal
conductivity materials such as the ceramics investigated here, the pattern needs a higher
scan density towards the outside of the material, where it is in contact with the cooled
crucible. Thus to give a stable even melt pool for ceramic materials, patterns of varying
beam scan concentration from the center out, less to more, must be used. In metals (with
a higher thermal conductivity) a less graded, or even uniform, pattern may be used due to
their better ability to distribute heat.
An example of a pattern used for ceramic sources, made up of three rings of
varying intensity, is shown in Figure 2-3 (a). The outer ring (green8) has the highest
energy density and so the longest beam dwell time. The very center has no points at all
and is not impinged by the beam. This gives an even evaporation of the ceramic source
(un-evaporated material does not accumulate). These scan patterns can be applied to up to
four sources almost simultaneously given high scan frequency. An example of a pattern
8 The pattern color scheme ranges from red (highest current density mA/mm2) to green (intermediate) to purple (lowest current density). However, this coloring is only relative to other sections of the same pattern, and as such coloring schemes cannot be compared between patterns.

33
used in a dual ceramic source deposition is shown in Figure 2-3 (b). In this pattern it can
be seen that the bottom left source has a higher density of scanned points compared to
that at the top right [60].
(a) (b)
Figure 2-3 : (a) Scan pattern used for ceramic sources consisting of three rings of varying dwell times with the outer ring being the longest and the center least. (b) Pattern used for dual source depositions, each also consisting of three rings.
As material evaporates, the surface drops into the crucible out of reach of the
electron beam gun. The source feed rate is therefore adjusted to compensate for
evaporation in such a way that the source height remains level with the crucible. It is
essential that the correct feed rate be determined before coating trials are preformed. If
during deposition the source becomes lower than the crucible, the source rod can stick
inside the crucible causing it to become immovable and ending the deposition. In this
situation material can also deposit onto the cooled crucible walls, causing build-up, and
in turn the source becoming stuck. If the feed rate is too high the melt pool becomes
unstable and liquid droplet “spitting” occurs. Also, at these high feed rates the melt pool
can grow too large, topple over onto the crucible where it solidifies, and also lead to the
source material sticking.

34
The source is located in the throat of a nozzle that separates two sections of the
DVD chamber; the working chamber and the gas flow entry system. A pressure
difference is maintained between these two parts, which results in a supersonic expansion
of the carrier gas as it passes through the nozzle. This pressure difference is the ratio of
the pressure in the gas flow system (upstream pressure, Pup, 0.05 to 0.2 kPa) to the
pressure in the working chamber (downstream pressure, Pdown, 0.01 to 0.03 kPa). The
pressure ratio controls the velocity of the carrier gas jet, which influences coating
porosity and thickness through changes in the deposition rate [25,38].
In a traditional EB-PVD system, the vapor hemi-spherically expands from the
source into the deposition chamber. The gas jet in the DVD system confines the vapor
and focuses it onto the substrate. As a result, the deposition rate significantly increases
with the density (gas flow rate) of the jet. Figure 2-4 shows the measured change in
deposition rate for SZO evaporated from a single source using two values of electron
beam current. It shows a significant increase in deposition rate with gas flow rate (i.e.
density of the gas jet). This results from focusing the vapor plume into an area that
approaches that of the substrate area. The flow rate of the carrier gas, which is typically
helium, can be varied from 0 to 20 slm. Oxygen can also be introduced into the system
(at up to 1 slm) to maintain metal to oxygen stoichiometry (avoid reduction) in the oxide
coatings.
35
Figure 2-4 : Dependence of the deposition rate upon helium gas flow rate for two evaporation rates (different electron beam currents). The R2 values are for the second order polynomial fit tread lines accompanying the data (circles).
In addition, there are other parameters related to the substrate that can be varied.
A shutter can be used to shield the substrate while the feed rate is adjusted and a
compositionally stable melt pool is obtained. The substrate is also typically heated during
depositions to ensure a crystalline coating [61,62]. Furthermore, rotating the substrate
results in a more porous coating, due to flux shadowing by asperities, which decreases its
thermal conductivity [12]. Most of the coatings grown here used stationary (non-rotating)
substrates.
2.1.2 Materials and Growth Conditions
Source Material
Both single source, Sm2Zr2O7, and two source (Sm2O3, ZrO2) ingots, were
purchased from TCI Ceramics (Bethlehem, Pennsylvania) where they were created
through a propriety process involving a series of reactions and a final firing step. The
Beam Current!
R² = 0.96"
R² = 0.99"
0!
3!
6!
9!
12!
0! 4! 8! 12! 16! 20!
Dep
ositi
on R
ate
(μm
/min
)!
Gas Flow Rate (slm) !
28 mA!
33 mA!

36
single source material was then dry machined to the final dimensions, typically 1.2 cm in
diameter and six to ten centimeters in length [63]. A low magnification micrograph of a
polished region of the single source material is presented in Figure 2-5. The 10-20 µm
lighter regions are samarium rich (higher atomic number) in this backscatter image, and
the darker areas Zr (lower atomic number). Some of the source material received had
larger areas (0.1 to 1 mm across) of high samarium concentration (~90 atomic %) (Figure
2-6). These could also be seen visibly as darker “speckles” throughout the ingot. This
material was not ideal, however was used for some of the depositions due to long lead
time required to replace it. Analysis of these source ingots is presented in Chapter 3.
Additional, more homogeneous “speckle” free ingot material was also obtained from TCI
(as described in Chapter 3).
The composition of the as received ingots (both more homogenous and speckled)
received was periodically checked through EDS and found to be 50 +/- 3 atomic %
samarium (by averaging four EDS area scans). Separate Sm2O3 and ZrO2 ingots (1.2 cm
diameter, 7 to 12 cm in length) were also purchased through TCI Ceramics.
37
Figure 2-5 : Surface of homogeneous SZO source. Lighter areas have more Sm, darker Zr
Figure 2-6 : SZO source material with large areas (speckles) of high Sm concentration
Substrate
The coatings were deposited on 2.54 cm x 2.54 cm x 0.06 cm standard grade
alumina squares purchased from CoorsTek (Golden, Colorado). The substrate surface
roughness was ~ 0.15 µm when measured by a Time TR200 roughness tester. A
secondary electron SEM image of the substrate surface is shown below in Figure 2-7.
“Speckle”

38
Figure 2-7 : Secondary electron image of surface of alumina substrate
Deposition Conditions
Coatings were deposited in both single and dual evaporation source
configurations. Several parameters were held constant through all depositions, while
others needed to be varied to accommodate two sources, and some were varied to observe
their effect on the coating composition (only in the single source depositions). These
three categories, and the parameter values for each, are summarized in the list below.
More specific values are described in the following sections.
Parameters held constant through all depositions
- Reactive gas flow rate (oxygen): 1 slm9
- Substrate type: 2.54 cm alumina square
- Substrate temperature10: 950 +/- 50 oC
- Distance from source to substrate: 23 cm
- Accelerating voltage: 70 kV
9 Standard liters per minute 10 As measured by type K thermocouple 2 cm from substrate

39
- Beam scan rate: 2000 Hz
Varied from single / dual source
- Nozzle diameter: Single source = 3.25 cm, Dual source = 4.5 cm
- Scan pattern: Single or double ceramic pattern (Figure 2-3 on page 33)
Varied to determine effect (Single source)
- Carrier gas flow rate (helium): 1 – 18 slm
- Chamber pressure: 0.01 to 0.03 kPa11
- Gas flow system pressure: 0.05 to 0.2 kPa
- Beam current: 25 to 40 mA
- Rotation of sample: 0 or 6 rpm
2.2 Characterization
The coatings, and some of the source material used to make them, were polished
and characterized by SEM-EDS to determine the average Sm:Zr concentration, and the
degree to which it varied from the desired 1:1 ratio (50 atomic % samarium). These
values are recorded as the average and standard deviation for the line scans of the
coatings, or just as the samarium atomic percent in the area scans of the source material.
XRD measurements of all coatings were also preformed to determine their as deposited
crystal structure.
2.2.1 SEM - EDS Measurements
All energy dispersive spectra (EDS) measurements were obtained on a JEOL
JSM-6700F field emission scanning electron microscope (SEM) using an accelerating
voltage of 15 keV and a probe current of 0.3 nA. The L lines of both Sm (5.42 eV) and Zr
(2.4 eV) were analyzed, versus standards unless otherwise noted, with Spirit 1.07 11 Operating pressures, changes with gas flow rates

40
software. Prior to measurement samples were mounted in epoxy, cross-sectioned,
polished down to 0.05 µm diamond suspension, and then coated with approximately 9 -
13 nm of carbon. The SEM micrographs shown, all of which are electron backscattered
images unless noted, without overlaid EDS data were obtained using different settings
(i.e. accelerating voltage) than those used for the EDS measurements. The SEM settings
are displayed in the image captions.
The EDS line scan measurements of the sample cross sections were collected for
400 seconds from the center square centimeter of the sample. The spacing of the smaller
compositional banding in the samples is about 1 µm. The line scan spacing was chosen to
measure roughly 10 points per band. In some of the thicker coatings (+100 µm) this
choice of spacing resulted in over 1000 points. For ease of visual comparison, some plots
of the EDS data have been smoothed using the IMSL Fortran library CSSED function
and are captioned as such. However, all reported statics are from the raw EDS data.
Cross-sectioned and polished source rods after deposition were also examined by
SEM-EDS. The EDS measurements of the source rods were preformed by first locating
the four corners of the source rod in low magnification SEM. These SEM stage
coordinates were then recorded to give a rough map of the source. The top center point of
the melted region was located by a notch placed there before the sample was loaded into
the SEM chamber. EDS area scan measurements were then made down the center of the
rod from this point using the source rod outline (from the four corner points) as a guide.
At each of these points an area scan of ~0.042 mm2 was analyzed for 120 seconds to
obtain the average samarium concentration over that area. For some source material

41
comparisons, an EDS area scan of only the top center point was obtained in the same
manner described above. This procedure is further explained in Chapter 3.
2.2.2 XRD Measurements
An XRD scan was preformed on all coatings in the as deposited condition. The
scans were measured from a 2θ of 25 to 85 degrees at a step rate of 1o / min on an XDS
2000 powder diffractometer from Scintag, Inc. using CuKα radiation. The resulting
diffraction pattern was indexed using the International Centre for Diffraction Data PDF
(powder diffraction file) 4+ database 2009 (ICDD PDF 4+ 2009) and also compared
with previous XRD data from SZO coatings deposited at the University of Virginia [12].

42
Chapter Three : Single Source Depositions
To eliminate compositional variations in SZO coatings the effect of varying
deposition parameters on the vaporization and transport of the vapor to the substrate
surface was investigated. The difference in vapor pressure between samarium oxide and
zirconia leads to preferential vaporization of samarium from the melt. This has been
speculated to be the source of the initial samarium rich region, and a factor in the larger
and smaller scale compositional banding. Also, due to the oxides differing masses, there
may be gas phase interactions between them in the transport of the vapor, which leads to
greater scattering of the zirconia from the vapor stream, which could also effect the
composition in the coating.
3.1 Vaporization of SZO
The hypothesis for non-uniformity in SZO coatings is as follows: The vapor
pressures of the rare earth metal oxides and zirconia differ greatly, so when a rare earth
zirconate source is evaporated, the higher vapor pressure material evaporates out of the
single source melt first resulting in melt non-stoichiometry and in turn a compositionally
varying coating. The vapor pressure of Sm2O3 at the melting point of Sm2Zr2O7 is ~ 0.1
kPa, approximately fifteen times greater than the vapor pressure of zirconia [12,44,53].
As such Sm2O3 is likely to preferentially evaporate from the source at the start of the
deposition resulting in an initial excess of samarium in the coatings. The difference in
vapor pressure between these two oxides is also a strong function of temperature, and is
reduced as temperature is increased (plotted in Figure 1-19 (b) on page 25).

43
To investigate this hypothesis the composition of single source Sm2Zr2O7 melt
pool regions in ablated source materials were chemically analyzed. Two separate sets of
experiments were conducted (i) the source material was ablated at increasing amounts of
time to verify the depletion of the higher vapor pressure samarium along with the time
scale on which it occurred, and (ii) the material was ablated at increasing beam currents,
which increases the surface temperature, to see if this effects the composition of the melt.
This second experiment was completed with both speckled and non-speckled source
material. Coatings deposited at varying beam currents were also analyzed to determine if
increasing the beam current caused a reduction in larger and/or smaller scale
compositional banding.
3.1.1 Effect of Evaporation Time on Source Material
Figure 3-1 shows a cross-sectional backscatter SEM image and EDS line scan for
an SZO coating evaporated using an electron beam current of 28 mA. The lighter bands
correspond to regions increased Sm (higher atomic number) concentration. In this image
the transient samarium enriched region is labeled and compositional banding can be seen
throughout the reminder of the coating. The shorter period banding is noticeable as
lighter and darker striations in the sample, were as the larger length scale fluctuations are
more evident by examination of the overlaid (blue) EDS line scan data.

44
Figure 3-1 : Line scan data of a SZO coating with initial concentration gradient labeled.
To determine if the initial transient samarium enriched area is due to the
differences in vapor pressure five small pieces (~2.5 cm in length) of the Sm2Zr2O7
source ingots were electron beam evaporated using an electron beam current of 28 mA
for increasing lengths of time. It was expected that this increased samarium concentration
in the coating would correlate with a decreased samarium concentration in the melted
region of the source material.
After evaporation and metallographic preparation of the ingots as described in
section 2.2.1, optical micrographs of the sources were obtained (Figure 3-2). The times
noted are the duration the beam was at full power (28 mA) with the “on/off” sample
having the beam simply ramped up to 28 mA and then down (which takes approximately
30 seconds). The melt pool in each ingot can be seen as the darkest region at the top of
the source. The melt volume appeared to be roughly independent of time. A region of less
dark shading was also seen near the melt region and the ingots contained dark “speckles”
of greater samarium concentration. The samarium concentration was measured just below
the center surface of the cross-sectioned source rods with an EDS area scan (green boxes
in Figure 3-2).

45
Figure 3-2 : Optical images of cross-sections of ablated source rods (1.2 cm diameter). The darkest region is the cross section of the melt. EDS area scans (~ 4.2 x 104 µm2) were acquired from top center .The green box is the approximate location of area scanned (below white arrow). The darker speckles in the lighter region of the source material are samarium rich regions. The concentration of samarium (in atomic %) just below the source material
surface is plotted versus the duration of melting in Figure 3-3. It can be seen that at the
surface of the melt, the samarium concentration falls rapidly with time, and that it takes
1.2 cm
a) on/off b) 0.5 min
c) 1 min d) 3 min
6 min
Melt Region
Sm rich “Speckles”

46
three to six minutes for this region to reach an asymptotic samarium concentration (the
average value found in similarly characterized source material ablated for longer times, ~
30 minutes) of about 8-10 atomic % samarium.
Figure 3-3 : Plot of EDS data from source rod area scans (from just below top center, white arrow in Figure 3-2, of ingots) versus ablation time. The “zero” time sample is the composition of the source (measured by EDS to be 50 +/- 3 atomic % samarium). Also, the average samarium concentration for source material ablated for over 30 minutes is included for comparison.
The coating in Figure 3-1 has a ~10 µm thick initial samarium rich region. With
these conditions (beam current of 28 mA and a gas flow rate of 10 slm) the initial
deposition rate is ~2 µm/ minute, as seen in Figure 2-4 on page 35. At this rate it would
take around five minutes for this region to develop. It is also evident from Figure 3-2 that
the melt pool volume quickly (in less than a minute of heating) reaches a steady state,
thus the gradient in initial composition appears not to be due to growth of the melt pool
volume. The development of the samarium rich region in the coating in Figure 3-1 is
consistent with the time it takes for the melt to become samarium depleted (Figure 3-3).
3.1.2 Effect of Beam Current on SZO Source Material
Source materials, containing speckles and “speckle free” (see Source Material
section page 35), were used to investigate the effect of beam current on the banding

47
process. These measurements were used to determine if compositional variations were
present in the frozen melt pool consistent with the variations (banding) found in the
deposited coatings. They were also completed to ascertain if the final melt composition
(8-10 atomic % samarium) varied with increasing beam current.
Furthermore, the compositional variations in the speckled source material may
add to compositional banding in the coating. When a source region containing a
samarium rich (~90 atomic% samarium, ~1 mm in diameter) “speckle” is fed into the
melt, it would cause a spike in the samarium concentration of the melt. Due to its higher
vapor pressure, this excess samarium would quickly evaporate off. This would lead to
compositional fluctuations in the melt, possibly adding to the compositional variations in
the coating.
The melt regions in both sets of source material were investigated by obtaining a
series of EDS area scans (as described in 2.2.1 on page 39) down the center cross-section
of the post-deposition ingots. An example diagram showing the approximate location of
these measurement points, overlaid onto a stereoscope image of the source material, is
shown in Figure 3-4. The samarium concentration at these points (blue diamonds in
Figure 3-4), versus distance from the top of the source (green box in Figure 3-4), was
then plotted as a function distance from the top surface. An example of this resulting
composition plot is shown in Figure 3-5.

48
Figure 3-4 : Optical image of SZO source with approximate points where EDS area scans were obtained (blue diamonds)
Figure 3-5 : Plot of the atomic % samarium at points shown in Figure 3-4 versus distance (mm) from top (green square in Figure 3-4 ) of source rod
The most striking feature of the optical images of the source material cross
section after deposition is the dark melt pool. This low optical transparency (black)
region corresponds to material with a reduced samarium concentration. The gray area
below this region contains a samarium concentration consistent with the starting material.
Overlaying the results in Figure 3-4 on Figure 3-5 reveals this (Figure 3-6).
1.2 cm
Melt Region
SZO Source Rod
Points where EDS
measurements were made. Sm rich areas
(speckled)
0"
20"
40"
60"
80"
0" 2" 4" 6" 8" 10" 12"
Atom
ic"%"Sm"
Distance"from"top"of"source"(mm)""
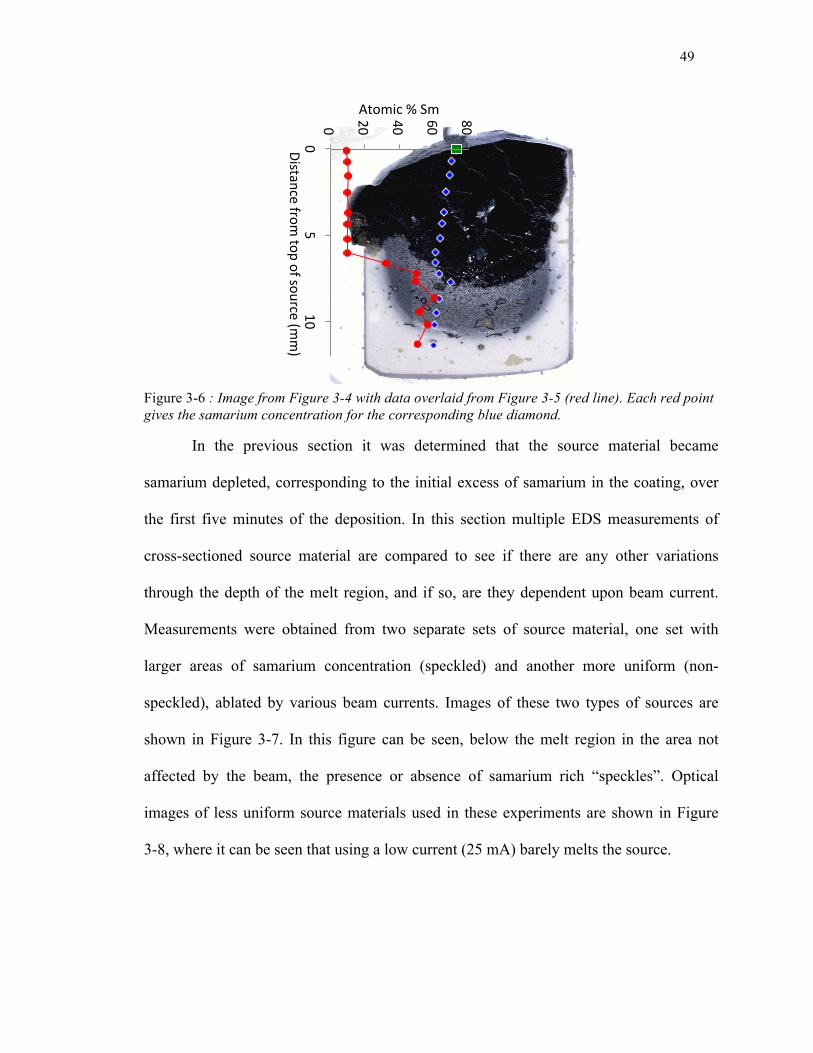
49
Figure 3-6 : Image from Figure 3-4 with data overlaid from Figure 3-5 (red line). Each red point gives the samarium concentration for the corresponding blue diamond.
In the previous section it was determined that the source material became
samarium depleted, corresponding to the initial excess of samarium in the coating, over
the first five minutes of the deposition. In this section multiple EDS measurements of
cross-sectioned source material are compared to see if there are any other variations
through the depth of the melt region, and if so, are they dependent upon beam current.
Measurements were obtained from two separate sets of source material, one set with
larger areas of samarium concentration (speckled) and another more uniform (non-
speckled), ablated by various beam currents. Images of these two types of sources are
shown in Figure 3-7. In this figure can be seen, below the melt region in the area not
affected by the beam, the presence or absence of samarium rich “speckles”. Optical
images of less uniform source materials used in these experiments are shown in Figure
3-8, where it can be seen that using a low current (25 mA) barely melts the source.
0"
20"
40"
60"
80"
0"5"
10"
Atomic"%"Sm"
Distance"from"top"of"source"(m
m)""

50
Figure 3-7 : (a) “Speckled” material ablated with 30 mA beam current. (b) “Non-speckled” source also ablated with 30 mA beam current.
Figure 3-8 : Optical micrograph of Cross-sections of SZO sources (0.47” diameter), evaporated for ~30 min. The white dashed line marks the approximate location of where the measurements were obtained. In some samples these are slightly off center to avoid the pore in the center of the source that forms upon cooling. The melt region (black area) is slightly angled since the source rod was angled (~80o) in the crucible.
1.2 cm
(a) (b)
Speckled Non-
speckled
1.2 cm
a) 25 mA b) 30 mA
c) 35 mA c) 40 mA

51
The results of the EDS area scans along the axis of the cross-section of these
sources show a very similar trend (Figure 3-9 and Figure 3-10). The composition of the
melt region (the darkest areas in Figure 3-8) in all samples, both more and less uniform,
is found to be within +/- 2% of 9.5 atomic% samarium. This region is labeled in the plot
of samarium concentration versus distance from top of source in Figure 3-9 for the
speckled sources, and Figure 3-10 for more uniform ones. By comparing Figure 3-8 with
Figure 3-2 it is evident that the melt pool volume initially increases with beam current
and then stabilizes for currents above 30 mA. The melt region is shallow (~0.25 mm) for
both of 25 mA samples. However, it is about the same depth, averaging 6.5 mm, for the
material ablated at 30, 35, and 40 mA. Therefore it is anticipated that coatings deposited
at higher beam currents (above 30 mA) should have a thicker samarium rich region, than
those deposited at lower currents, being that a larger volume of the source becomes
samarium depleted.
Figure 3-9 : Plots of samarium concentration versus distance from center top in “speckled” source rods Figure 3-8.
0!
20!
40!
60!
0! 2! 4! 6! 8! 10! 12!
Atom
ic %
Sm!
Distance from source surface (mm)!
25 mA!30 mA!35 mA!40 mA!
Melt Region
Melt Region
50 at%

52
Figure 3-10 : Plots of samarium concentration versus distance from center top in uniform (non-speckled) source material It can be seen in Figure 3-9 and Figure 3-10 that the composition of the melt
region did not significantly fluctuate with depth as it was approximately the same for all
samples. As such the compositional banding in the coatings cannot result from variations
in the melt composition (as was found between the initial increase in samarium
concentration and samarium depletion in the source). It can also be concluded that
fluctuations in the source material composition, on this scale or less, do not affect the
melt, as long as on average it is the desired composition.
3.1.3 Effect of Beam Current on SZO Coating
The electron beam current was varied to study its effect on coating composition.
The vapor pressures of the two oxides approach each other as temperature increases
(Figure 1-19). Increasing the beam power, by increasing the current, will result in a
higher temperature at the source surface. Thus, the difference in oxide vapor pressures
will be reduced. This may lead to a reduction of composition variation in the sample. To
test this hypothesis, the beam current was varied from 25 to 40 mA in 5 mA increments.
0!
20!
40!
60!
0! 2! 4! 6! 8! 10! 12!
Atom
ic %
Sm!
Distance from source surface (mm)!
25 mA!30 mA!35 mA!40 mA!
Melt Region
Melt Region
50 at%

53
Changes in the coating composition were measured using EDS line scans of the
sample cross-sections as previously described (page 39). The reactive oxygen gas flow
rate was maintained at 1 slm, with helium flow rate at 10 slm. Substrate temperature was
restricted to 950 +/- 35 oC, the same beam scan pattern was used, and the SZO sources
evaporated from were “speckled” (as seen in Figure 3-4). Substrates were un-rotated, and
a shutter was not employed in order to determine composition development in the coating.
All of the as deposited samples possessed a fluorite crystal structure, as verified
by XRD (Figure 3-11, measurement and indexing described in section 2.2.2 on page 41)
due to the absence of the ordered pyrochlore peaks at 2θ of 28o (311), 37o (331) and 45o
(511) [66]. Prior research on DVD SZO coatings has shown that, although at these
depositions temperatures the pyrochlore phase is stable, the deposition time is insufficient
for ordering of the disordered fluorite phase. However, it was found that coatings with
less compositional variation displayed pyrochlore ordering after 300 thermal cycles12 at
1100 oC [12,37].
Figure 3-11 : XRD data from beam current samples. [12].
12 A thermal cycle consists of 1 hour at temperature, followed by a 10 minute room temperature cool down
(a) 40 mA!!
(b) 35 mA!
!(c) 30 mA!!
(d) 25 mA!
(111)!(400)! (331)!(420)!
Beam!Current!
25! 30! 35! 40! 45! 50! 55! 60! 65! 70! 75! 80! 85!2θ "
(200)!
(220)! (311)!

54
At lower beam currents the source does not melt (25 mA barely melts source,
Figure 3-8), and at higher currents the melt becomes too unstable (spitting occurs). For
samples 30 – 40 mA the deposition rate was measured between 6.5 and 8 µm/min, for the
25 mA sample it was 2 µm / min. This 25 mA deposition was conducted for a similar
length of time and resulted in a coating too thin for comparison (60 µm versus 200 µm).
Excluding the 25 mA sample, all of the samples are just over 200 µm thick,
giving a good picture of coating composition development. This development is shown in
the overlaid EDS data in Figure 3-12. The figure shows that the coating composition
fluctuates around 50 atomic % after ~ 75 µm of material has been deposited. The average
and standard deviation for the EDS data for this 75 to 200 µm thickness show that there is
no discernable difference between these three samples. All three coatings contain close to
an average of 50 atomic % samarium with a standard deviation of ~7% (Table 3-1).
Figure 3-12 : EDS line scan data from samples deposited at 30, 35, and 40 mA. Compared from substrate up to 200 µm from substrate.
0!
25!
50!
75!
100!
125!
150!
175!
200!
0%! 20%! 40%! 60%! 80%! 100%!
Dis
tanc
e Fr
om S
ubst
rate
(μm
)!
At % Sm - Smoothed Data!
30 mA!
35 mA!
40 mA!
75 µm
50%
Transient Region
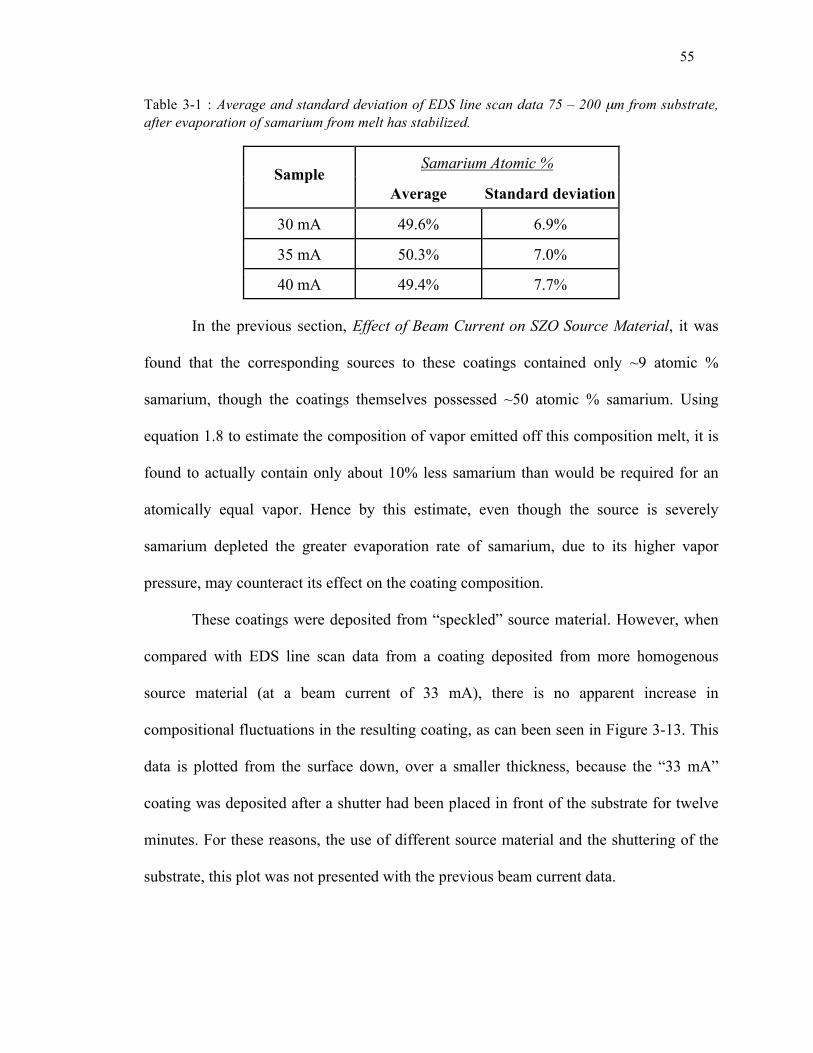
55
Table 3-1 : Average and standard deviation of EDS line scan data 75 – 200 µm from substrate, after evaporation of samarium from melt has stabilized.
Samarium Atomic % Sample
Average Standard deviation
30 mA 49.6% 6.9%
35 mA 50.3% 7.0%
40 mA 49.4% 7.7% In the previous section, Effect of Beam Current on SZO Source Material, it was
found that the corresponding sources to these coatings contained only ~9 atomic %
samarium, though the coatings themselves possessed ~50 atomic % samarium. Using
equation 1.8 to estimate the composition of vapor emitted off this composition melt, it is
found to actually contain only about 10% less samarium than would be required for an
atomically equal vapor. Hence by this estimate, even though the source is severely
samarium depleted the greater evaporation rate of samarium, due to its higher vapor
pressure, may counteract its effect on the coating composition.
These coatings were deposited from “speckled” source material. However, when
compared with EDS line scan data from a coating deposited from more homogenous
source material (at a beam current of 33 mA), there is no apparent increase in
compositional fluctuations in the resulting coating, as can been seen in Figure 3-13. This
data is plotted from the surface down, over a smaller thickness, because the “33 mA”
coating was deposited after a shutter had been placed in front of the substrate for twelve
minutes. For these reasons, the use of different source material and the shuttering of the
substrate, this plot was not presented with the previous beam current data.

56
Figure 3-13: Comparison plot of EDS line scan data of coatings deposited from speckled and non-speckled
3.2 Transport of SZO Vapor
In addition to the effect of vaporization on the coating composition, single source
Sm2Zr2O7 was also used to test the effects of transporting vapor species from the source
to the substrate. The transport of the vapor is believed to effect the composition of the
coating due to differences in scattering rates between the greater massed samarium oxides
and the lighter zirconia species. Two sets of experiments were completed to test this: (i)
the carrier gas flow rate was varied and (ii) the substrate was rotated or held stationary.
3.2.1 Gas Flow Effects
The samarium oxides are heavier than the zirconia oxides and the binary
collisions responsible for vapor entrapment are sensitive to the mass of the colliding
particles. As a result the differing mass species could be entrained dissimilarly in the
carrier gas jet, and the lighter zirconia more easily deflected away from the source-
50%!0!
25!
50!
75!
100!
0%! 20%! 40%! 60%! 80%! 100%!
Dis
tanc
e Fr
om C
oatin
g Su
rface
(μm
)!
At % Sm - Smoothed Data!
30 mA!35 mA!40 mA!33 mA!
Speckled(
()((Non)speckled(
Sample Source Material

57
substrate path (Gas Flow Effects Simulations page 60) leading to samarium enrichment in
the vapor streamline from which deposition occurs. By decreasing the time of flight
through increasing the gas flow rate fewer collisions should occur, and in return the
coatings should have a lower samarium/zirconium ratio present than coatings deposited
with lower gas flow rate. To explore these possibilities the gas flow rate was varied to
determine its effect on coating composition.
Experimental
To alter the vapor-carrier gas scattering time (and number of events per transit to
the substrate) in the gas phase, the carrier gas flow rate was varied from 5 to 18 standard
liters per minute (slm). However, the gas flow rate also greatly affects the deposition rate
(Figure 2-4) and below 10 slm too thin of a film (< 25 µm) was obtained to give a good
representation of the coating composition development. Thus, only EDS line scan data
from the 10, 12, 15, and 18 slm experiments are used for comparison. For all coatings the
oxygen gas flow rate was maintained at 1 slm, the beam current at 33 mA, the same
electron beam scan pattern was used, and the SZO single source material used was
homogeneous “non-speckled”. There was some variation in the substrate temperature. At
times (in the 15 and 18 slm experiments) the temperatures dropped from 950oC to about
850oC due to problems with the heating element. A shutter was used in all runs for the
first twelve minutes to ensure that the melt composition had stabilized before beginning
deposition. This choice of time was somewhat arbitrary due to inexperience, and proved
too short, allowing a samarium rich region to be deposited at some of the lower gas flow
rates. To account for this, EDS data is compared starting twenty microns from the
substrate surface (out of the samarium rich region).

58
All coatings as deposited possessed a fluorite crystal structure, with the 15 and 18
slm peaks displaying a slight negative shift (Figure 3-14). These coatings were deposited
at a lower temperature, however this should result in a positive peak shift [45]. Also, the
15 slm coating did not display greater compositional fluctuations, another possible cause
of peak shift, than the 12 or 10 slm samples [44]. However, the 15 and 18 slm coatings
were scanned on the same day, while the other coatings were scanned on separate days,
leading to the conclusion that the XRD may have been in need of calibration on that date.
Figure 3-14 : Plot of XRD data from samples deposited using different gas flow rates
The coatings deposited here all contained compositional banding, from the thinner
low carrier gas flow rate samples to the higher flow rate samples (Figure 3-15). Line
scans were obtained over eighty microns of the thicker high gas flow rate samples.
Neither the average composition nor the standard deviation in composition exhibits
dependence on flow rate (Table 3-2). The 10, 12, and 15 slm samples are very similar to
each other, and it appears that the lower temperature used for the 15 slm sample had little
effect. The 18 slm sample does posses a slightly greater amount of variation, which is
also apparent in the EDS data (Figure 3-16). However, the similarity of the other samples
leads to the possibility that some other factor has added to the greater fluctuations.
25! 30! 35! 40! 45! 50! 55! 60! 65! 70! 75! 80! 85!2θ "
(200)!(220)! (311)!
!18 slm!!15 slm!!12 slm!!10 slm!
(111)!
(222)!
(400)! (331)! (420)!(a)
(b)
(c)
(d)
Gas Flow Rate

59
Figure 3-15 : Backscatted SEM images (same magnification) of banding in lower carrier gas flow rate samples (5 and 8 slm) compared to a thicker, higher carrier gas flow rate sample (10 slm).
5 slm!
8 slm!
10 slm!

60
Table 3-2 : Summary of EDS line scan data from coating thickness of 20 to 100 µm from substrate.
Atomic % Samarium Sample Average Standard deviation
10 slm 56.5% 5.5%
12 slm 43.6% 5.4%
15 slm 51.2% 6.1%
18 slm 46.8% 7.9%
Figure 3-16 : Smoothed EDS line scan data. There does not appear to be any relation to the compositional fluctuations throughout the coatings and gas flow rate. Maximum Jet Velocity Calculation
The carrier and reactive gases are introduced below the nozzle and then expand
out through the nozzle into the chamber, resulting in a stream of gas directed towards the
substrate. As the gas flow rate is varied, the ratio of the pressure in the gas flow system to
the pressure in the working chamber changes. This pressure ratio determines the velocity
of the gas flow. The pressure ratios from these experiments, along with a few gas
constants, can be used to estimate the upper limit of the gas flow velocity (related to the
time of flight of the oxides from the source to the substrate) from the nozzle by means of
20!
40!
60!
80!
100!
0%! 25%! 50%! 75%! 100%!
Dist
ance
from
sub
stra
te (μ
m)!
Atomic % Samarium!
10 slm!
12 slm!
15 slm!
18 slm!

61
the one-dimensional equation for isentropic flow of a compressible fluid (Equation 3.1)
[12,25,27].
(3.1)
Where:
U = Carrier gas stream speed
γ = Ratio of specific heats = 5/3 for helium
Rs = Specific gas constant = 2077 J/(kg*K) for helium
T = Temperature = 300 K
M is the Mach number =
(3.2)
Pu = Upstream pressure (pressure in the gas flow system)
Pd = Downstream pressure (chamber pressure)
Equation 3.2 can be substituted into 3.1 to give:
(3.3)
Using Equation 3.3 and the ratio of the gas flow system / working chamber
pressures from the gas flow experiments section on page 57, the jet velocity for the vapor
leaving the source in these experiments can be estimated. The results of these calculations
are shown in Table 3-3.
€
U = M γRsT
€
M =PuPd
"
# $
%
& '
γ −1γ
−1"
#
$ $ $
%
&
' ' '
2γ −1
€
U =2
γ −1PuPd
$
% &
'
( )
γ −1γ
−1$
%
& &
'
(
) ) * γRsT

62
Table 3-3 : Calculated values for the various gas flow runs. The estimated jet velocity did not greatly change by changing the gas flow rate; as such the time of flight would be similar.
Sample Pu / Pd Approximate
Jet Velocity m/s
10 slm 7.9 2001
12 slm 6.7 1881
15 slm 6.2 1841
18 slm 5.9 1799
It can be seen in Table 3-3 that increasing the pressure ratio Pu/Pd (Pu, upstream
pressure, is the pressure in the gas flow system and Pd, downstream pressure, is the
pressure in the working chamber) by decreasing the gas flow rate, while maintaining the
nozzle size and chamber pumping rate, results in a slight increase in the maximum jet
velocity. However, it can be seen that the pressure ratios from the experiments did not
significantly vary, and in turn the estimated jet velocity remained close to constant.
It should be noted that there are some limitations to this calculation. When the
pressure ratio is greater then 2.05 (for helium) there is a supersonic expansion of the gas
exiting the nozzle [27]; for all experiments the ratio was greater than this. The gas
velocity is decreased to subsonic velocities by shock waves down stream before the jet
reaches the substrate. This calculation only gives an estimate of the atom velocities as
they leave the nozzle without consideration of supersonic conditions. A multidimensional
calculation considering the changes in flow through these shock waves would be needed
to estimate the velocity at the substrate surface [27]. But, in this work no significant
difference was found in the estimated initial velocities or in the coatings themselves, so
this was not further explored.

63
Gas Flow Effects Simulations
To gain more insight into the deposition process, a simulation of the vapor
transport process was conducted in collaboration with T. Rodgers (private
communication). In this simulation equal amounts of samarium and zirconium are
introduced into the gas flow, and scattering interactions are modeled as the vapor is
transported from the source to the substrate. The premise tested by this simulation is that
the collisions occurring between elements in the gas phase might cause greater scattering
of the lighter zirconium than samarium. The samarium would be more directed towards
the substrate, resulting in a samarium rich coating. By increasing the gas flow rate, the
time of flight is decreased resulting in fewer collisions with the background gas and a
vapor jet more directed towards the substrate.
The results of these simulations, Table 3-4, show that the mass difference between
the two elements should indeed cause less scattering of the heavier samarium resulting in
a coating with approximately 9% more samarium than zirconium. However,
experimentally this was not found in the coatings; overall they were close to containing
equal amounts of samarium and zirconium (Table 3-4). These simulations also found that
changing the gas flow rate had no discernable effect on the coating composition, which
was consistent with experiments.

64
Table 3-4 : % difference samarium versus zirconium at different flow rates from simulations.
Conditions % Difference
Samarium Pu / Pd13
10 slm 7.6% 8.2
15 slm 10.7% 7.6
20 slm 8.2% 7.1 3.2.2 Rotated Versus Stationary
Rotation of the substrate was explored as a possible cause of composition
variation. The reasoning behind this is similar to that discussed in the gas flow rate
section; that is increased scattering of the lighter element. At the point when the rotating
substrate is parallel to the gas flow most of the vapor will pass by and not deposit on the
substrate. However, the lighter zirconium could be scattered further from the direction of
the main vapor stream. When the substrate is parallel to the plume more zirconium
should be deposited, and when it is perpendicular more samarium. This was thought to
possibly cause, or at least add to, the degree of banding in the sample.
To test this idea a stationary and rotated sample were deposited at 1000 +/- 25 oC
using a gas flow rate of 10 slm. The same beam pattern and source feed rate (1.8
mm/min) were used, but with slightly different beam currents. The beam current for the
rotated sample was changed from 28 to 33 mA 1/7 of the way into the deposition while
the stationary sample was held at 28 mA. Though, as explained in preceding section, the
different beam currents should not have any effect on the coating composition. Both
depositions produced a coating with a thickness of 40 +/- 5 µm.
13 In these simulations, the ratio of the working chamber pressure (Pu) to that in the gas flow system (Pd) was held approximately equal to those in the experiments.

65
As seen in the backscattered SEM images below of a coating deposited on a
stationary substrate (Figure 3-17) and one rotated at 6 RPM (rotations per minute)
(Figure 3-18) the banding seems much more pronounced in the stationary sample.
However, this appearance is due to the increased porosity in the rotated samples. There is
very little difference between the compositions of these two coatings as shown in the
compared EDS data (Figure 3-19) and its associated EDS summary (Table 3-5).
Figure 3-17 : SEM backscatter image of SZO coating, Stationary.
Figure 3-18 : SEM backscatter image of SZO coating, Rotated 6 RPM.

66
Figure 3-19 : Plot of atomic percent samarium versus distance from the substrate surface. The rotated and stationary samples show similar trends in compositional variation. (EDS data not completed versus a standard)
Table 3-5 : EDS line scan summary for Figure 3-19
Samarium Atomic % Sample
Average Standard Deviation
Rotated 49.0% 10.5%
Stationary 52.5% 10.4%
3.3 Discussion
There are two types of compositional fluctuations in DVD SZO coatings (i) an
initial samarium rich region and (ii) compositional banding throughout the coating on
both a larger and smaller scale. It was determined that decreased samarium in the source
at the start of the deposition coincides with the development of the initial samarium rich
region in the coating. Consequently, it appears that this region is the result of the
difference in vapor pressure between the two constituents, with the higher vapor pressure
samarium oxide evaporating out of the melt first. The cause of the second fluctuation, the
compositional banding in coating, has been more elusive. After the initial samarium
0!
10!
20!
30!
0%! 20%! 40%! 60%! 80%! 100%!
Dis
tanc
e fro
m s
urfa
ce (μ
m) !
Atomic % Samarium!
Stationary!
Rotated!

67
decrease in the melt region, its composition remains constant at ~9 atomic percent
samarium. This composition was confirmed in both homogenous source material and
material containing “speckles” (~ 1mm diameter) of greater samarium concentration (~
90 atomic %), ablated for longer times. Thus, fluctuations in the melt composition do not
seem to be the cause of the banding. Some of the processing parameters (carrier gas flow
rate, beam current, and rotation of sample) involved in the vaporization and transport of
the SZO from the source to the substrate were explored as possible causes of the banding
in the sample.
At higher temperatures the vapor pressures of the two samarium and zirconium
oxides differ less. Therefore by increasing the beam current, and in turn the temperature
of the melt, the amount of variation in the sample should decrease. The beam current was
varied within the constraints of the material; from the lowest current where the power
was high enough to melt the source up to the highest at which the melt pool was stable.
Comparison of this EDS data displayed no significant difference between the fluctuations
in these coatings. Furthermore, even though the melt composition had changed so that it
contained only ~10% samarium, the samples contained, on average, about equal atomic
fractions of the two constituents. The cause of this could be that the higher evaporation
rate of the samarium compensated for its reduced concentration, leading to an equally
atomic evaporation. Another feasible explanation, as was seen in simulations, is that less
samarium is being evaporated, but more zirconium is scattered from the source-substrate
path in route resulting in a larger ratio of samarium to zirconium being deposited than
was evaporated.

68
The transport of the vapor from the source to the substrate was also investigated
via varying the carrier gas flow rate. Collisions in the vapor phase could cause changes in
the coating composition by greater scattering of the lighter zirconia. By decreasing the
gas flow rate, and in turn increasing the time of flight, more collisions might occur in the
transport of the vapor and increase the samarium/zirconium ratio in the coating. Varying
the gas flow rate however, was not found to have an effect on the coating composition.
The rotation of the substrate was thought also to have an effect coupled with the
variation in scattering between the different mass oxides. The premise is the lighter
zirconia should be deflected more out of the source-substrate path and as a result when
the substrate is parallel to the plume the zirconia will be deflected onto the substrate,
while the heavier samarium oxide passes by, adding to the compositional banding in the
sample. Comparison of EDS line scans of coatings of similar thickness deposited
stationary and at six rotations per minute found no difference in the average amount of
samarium deposited or banding between these two coatings.

69
Chapter Four : Dual Source Depositions
From the experiments presented thus far, it is now clear that the initial transient
samarium rich region in SZO coatings results from a higher samarium evaporation rate,
which corresponds to a decrease in samarium concentration in the source material over
the same transient time period. This initial concentration gradient in the coating is due to
the higher vapor pressure of samarium oxide, which preferentially evaporates from the
melt. However, no association was found between changes in the composition of the melt
region and compositional banding in the SZO coatings, the hypothesis that this also was a
manifestation of the vapor pressure difference could not be confirmed.
If the difference in vapor pressures between the oxide species is responsible, then
a common solution employed to create a uniform coating is to a use individual sources
for each component [11,58]. This can be achieved by using a separate electron beam gun
for each source or, as implemented in this research, by scanning a beam from a single
EB-gun between two sources by using a programmed deflection system (Figure 4-1) [56].
In SZO coatings if the compositional banding is due to the difference in vapor pressures,
using two separate sources (Sm2O3 and ZrO2) and adjusting the evaporation rate of both
sources to compensate for this difference, should result in the desired Sm2Zr2O7
pyrochlore composition coating sans fluctuations.

70
Figure 4-1 : Dual crucible configuration. Sources evaporated by scanning single EB-gun over each source.
Utilizing dual source evaporation does add additional complexities to the DVD
process. Depositing from two separate sources can result in both lateral compositional
variations and variations due to inconsistencies in source material evaporation. In the
DVD lateral composition variations can be limited by significantly overlapping the
plumes from the two separate sources and using gas flow conditions that promote mixing
of the plumes [11,58]. Discrepancies between evaporation rates of the two sources have
to be accounted for through trial runs. In these trial runs the beam current and source feed
rates were optimized to give an even evaporation from stable melt pools, for all materials
being deposited, resulting in the desired coating composition.
4.1 Experimental
To determine the deposition parameters that result in a pyrochlore composition
coating, a series of evaporation experiments were preformed at varying beam currents (25,

71
30, and 35 mA) using either ZrO2 or Sm2O3 sources separately. A helium gas flow rate of
10 slm, a single source scan pattern, and dual source nozzle were used. Other process
conditions are as described in Section 2.1.2 on page 38. These evaporation experiments
were performed to establish the evaporation rate input beam current relation for each
source, and to establish the acceptable feed rate that produced a stable melt pool. The
evaporation rate was determined by measuring the difference in initial and post
evaporation rod mass and dividing this by evaporation time. In Figure 4-2 it can be seen
that the evaporation rate at fixed beam current (and power since the voltage across source
was fixed) was a roughly linear function of beam current. It is also evident that
evaporation of Sm2O3 at a fixed current significantly exceeded that of ZrO2.
Figure 4-2 : Plot of evaporation rate versus beam current. The evaporation rate is the amount of material that is evaporated off of the source (grams) per minute.
In these experiments the zirconia source remained stable (no spitting) for all beam
currents, whereas the samarium oxide source was most stable at a beam current of 25 mA.
At higher beam currents the Sm2O3 pool became visibly unstable, resulting in spitting and
occasional large bursts of material being ejected from the surface. At 25 mA the
evaporation rate of SmO1.5 is 0.5 g/min, by using the mass ratio required for pyrochlore
composition (Section 1.4.3 page 23), the required deposition rate for zirconia was
determined to be 0.36 g/min. This corresponds to a beam current of ~30 mA for the
0.0!
0.4!
0.8!
1.2!
25! 30! 35!Evap
orat
ion
Rat
e (g
/min
)!
Beam Current (mA)!
Sm2O3!ZrO2!

72
zirconia source. As a result a dual source scan pattern (assembled from two single source
patterns) was selected for subsequent depositions with a total current of 55 mA and the
dwell time split 45 / 55% between the samarium oxide and zirconia sources, respectively.
The beam scan rate was 2000 Hz, the entire pattern is scanned 2000 times per second and
each time scanned the beam spends 45% (0.23 milliseconds) of the time on the samarium
oxide source and 55% (0.28 milliseconds) on zirconia. This time is related to the point
density in the pattern as described in section 2.1.1 on page 30. Besides suitable beam
currents, from these experiments the appropriate source feed rates were also estimated to
be 1.7 mm/min for Sm2O3, and 1.3 mm/min for ZrO2.
4.2 Problems with Dual Source Evaporation
In practice, the scan pattern parameters calculated in the above section could not
be successfully implemented in the two source crucible. This arose due to limitations in
the DVD deflection system, which made it impossible to create a pattern by simply
doubling the scan pattern for a single ceramic source. The pattern was too complex to
scan within the scan rate capabilities of the system. A smaller pattern was constructed to
scan both sources and is shown in Figure 2-3 on page 33.
When the sources were ablated with the calculated total beam current, using the
smaller pattern, the melt pools were unstable and the source material feeder became stuck.
In using the smaller pattern, with the beam current of 55 mA (calculated based off the
larger pattern), the current density incident upon the source was almost doubled, from
0.09 to 0.16 mA/mm2, leading to an inconsistent deposition and a compositionally
fluctuating coating (Figure 4-3). When the beam current was scaled down from 55 mA to

73
29 mA to counteract this, it was found to then be insufficient to melt the zirconia source.
The consequence of this was a samarium rich coating, as seen in Figure 4-4.
Figure 4-3 : Coating deposited with too high of a beam current (55 mA, dwell time 45% / 55% between samarium oxide / zirconia). This caused the zirconia source rod to become stuck and resulted in an area of higher samarium concentration.
Figure 4-4 : Coating deposited with too low a dwell time on zirconia source, (29 mA, dwell time 45% / 55% between samarium oxide / zirconia) leaving the coating with a high samarium concentration.
Based on the information gained in these depositions the over all beam current
was increased to 33 mA. The percent of the dwell time to the zirconia source was also
50%!-36!
14!
64!
114!
164!
214!
264!
314!
0%! 20%! 40%! 60%! 80%! 100%!
Dis
tanc
e fro
m s
urfa
ce (μ
m)!
Atomic % Samarium!
Source Rod
Stuck
50%!-8!
2!
12!
22!
32!
42!
0%! 20%! 40%! 60%! 80%! 100%!
Dis
tanc
e fro
m s
urfa
ce (μ
m)!
Atomic % Samarium!

74
increased from 55% to 60%, with no change in the stability of the Sm2O3 source. Under
these conditions both melt pools remained stable, level with the crucible at feed rates of
1.0 mm/min ZrO2 and 1.3 mm/min Sm2O3, and the source material feeders ran smoothly.
4.3 Two Source Evaporation Results
A line scan of a coating grown using the evaporation conditions developed above
is shown in Figure 4-5. This coating had an average atomic percent samarium of 50.9%,
with a standard deviation in samarium concentration of 8.0 at %. It is apparent that this
coating still contains significant banding on both a 1 µm scale, seen as striations in the
coating, and also on a ~50 µm scale, as is more visible in the overlaid EDS line scan plot.
Figure 4-5 : Coating made from two separate sources with an average samarium concentration of 50.9 atomic%. The XRD pattern for this sample indicates the coating to have a fluorite structure,
similar to the coatings deposited from single SZO sources (Figure 4-6). An XRD plot
from one of these single source samples, grown using a 30 mA beam current (from
section 3.3), is included in the plot for comparison.
50%!-33!
17!
67!
117!
167!
217!
267!
317!
0%! 20%! 40%! 60%! 80%! 100%!
Dis
tanc
e fro
m s
urfa
ce (μ
m)!
Atomic % Samarium!

75
Figure 4-6 : Comparison of XRD data from SZO coating deposited from two separate sources as compared to sample deposited from single source (single source sample also included in Figure 3-11).
Though the transient Sm rich region has been eliminated and the overall
samarium to zirconium concentration is very close to 1:1, compositional banding in this
sample is still present. Using two separate sources does not appear to decrease it.
However, using separate sources does eliminate the initial samarium rich region. Besides
the lack of this region, the dual source samples are comparable to those deposited at
varying beam currents. This can be seen in a comparison plot of EDS line scan data for
single and dual source depositions in Figure 4-7.
25! 30! 35! 40! 45! 50! 55! 60! 65! 70! 75! 80! 85!2θ "
(200)!
(220)! (311)!
(111)!
(400)!
(222)! (331)!(420)!
Sample!!
Dual!Source!
!
!
!
!30 mA!
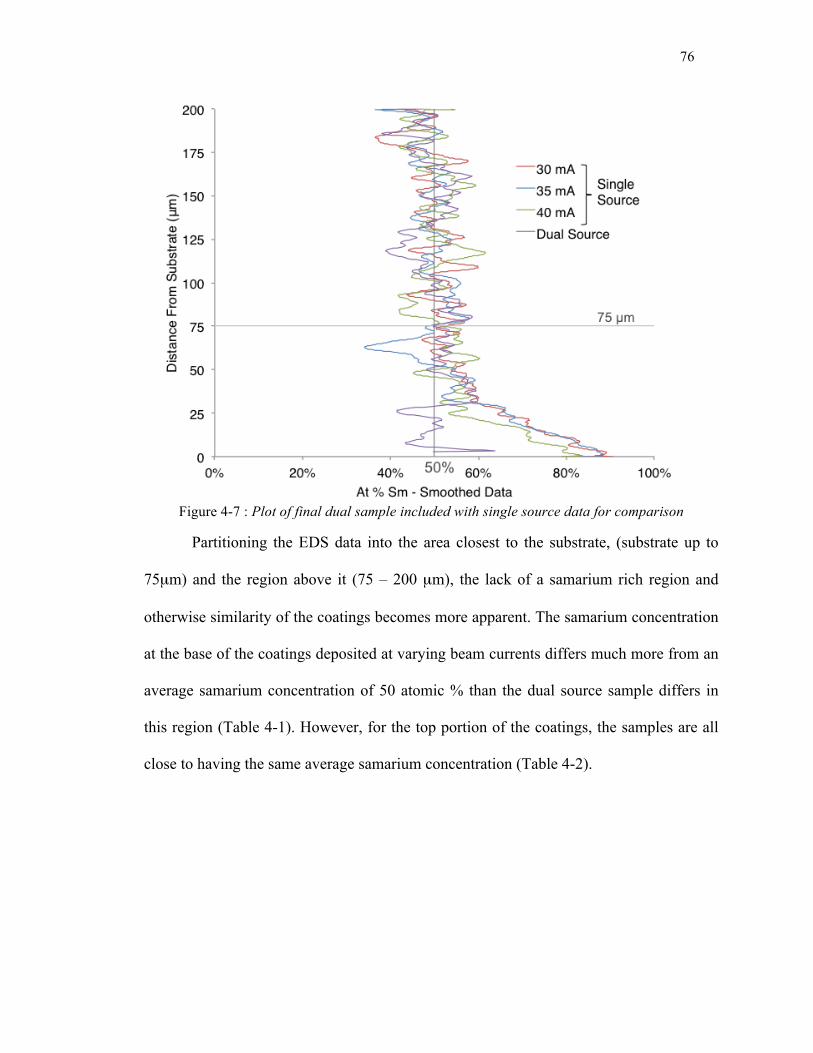
76
Figure 4-7 : Plot of final dual sample included with single source data for comparison
Partitioning the EDS data into the area closest to the substrate, (substrate up to
75µm) and the region above it (75 – 200 µm), the lack of a samarium rich region and
otherwise similarity of the coatings becomes more apparent. The samarium concentration
at the base of the coatings deposited at varying beam currents differs much more from an
average samarium concentration of 50 atomic % than the dual source sample differs in
this region (Table 4-1). However, for the top portion of the coatings, the samples are all
close to having the same average samarium concentration (Table 4-2).

77
Table 4-1 : Comparison of EDS data between dual and single source (varying beam current) samples from the substrate up to 75 µm from the substrate.
Samarium Atomic % Sample
Average Standard Deviation % Difference of average
From 50 atomic %
30 mA 62.9 12.4 22.8
35 mA 60.1 15.4 18.3
40 mA 59.8 11.4 17.8
Dual 53.3 8.1 6.4
Table 4-2 : Comparison of EDS data between dual and single source (varying beam current) samples from 75 µm to 200 µm above the substrate.
Samarium Atomic % Sample
Average Standard Deviation % Difference of average
From 50 atomic %
30 mA 49.6 6.9 0.8
35 mA 50.2 7.1 0.4
40 mA 49.5 7.8 1.0
Dual 48.6 7.8 2.8 4.4 Discussion
In SZO coatings there are two main compositional fluctuation problems: an
initially greater samarium concentration and compositional banding throughout the
coating. The difference in vapor pressures between samarium and zirconium oxides has
previously been attributed to both of these variations. If this is the case, then depositing
from two separate sources, and adjusting to compensate for discrepancies in deposition
rate caused by differences in vapor pressure, should give a compositionally even coating.
Depositing from two sources solves one of these problems. It eliminates the
samarium rich region. This further supports the previous chapter’s result that, in SZO
single source evaporations, this region is caused by preferential evaporation of samarium

78
oxide out of the melt due to its higher vapor pressure. Nevertheless, SZO coatings
deposited from separate samarium and zirconium oxide sources, under stable conditions,
possessed compositional banding. This leads to the conclusion that banding cannot be
caused just by the vapor pressure difference between the species. Something more subtle
appears to be occurring.
One possibility is that the vaporization temperature on each source surface is
fluctuating either due to fluctuations in the electron beam current (or resistance of the
source), variations in the heat transfer coefficients that govern thermal losses from the
source or possibly due to strong convectively driven flows in the melt which circulate
cooler liquid to the emitting surface. Regardless of the mechanism, the strong dependence
of the partial pressure ratio for Sm2O3 and ZrO2 on temperature would then lead to
fluctuations in the composition of the vapor plume.

79
Chapter Five : Discussion
Samarium zirconate, Sm2Zr2O7 pyrochlore, is in many ways an ideal candidate for
future TBC’s. Its phase is stable to temperatures in excess of those likely to be
encountered in an engine, it has a lower thermal conductivity than currently used material
and its thermal expansion coefficient is well matched with other materials in the coating
system. However, there are two problems with the deposition of these coatings. The first
is that SZO reacts with alumina in the thermally grown oxide (that protects the bond coat)
to form intermediate compounds, which decreases the toughness of the interface and
leads to a reduction in thermal cycling life. This problem has been resolved by
incorporating a YSZ diffusion barrier between the SZO topcoat and TGO layer
preventing the formation of deleterious phases. The second unresolved problem is that
EB-PVD SZO coatings made using a Sm2Zr2O7 source display compositional fluctuations.
The fluctuations are of two types: (i) a transiently high samarium concentration in the
first deposited material and (ii) compositional banding in the remainder of the coating.
This banding has two dominant wavelengths 10-50 µm and a shorter ~1 µm scale. Both
compositional variations have been attributed in the past to the differences in vapor
pressure between samarium oxide and zirconia in the SZO source. Proposed solutions to
these compositional difficulties include optimizing the parameters of single source
Sm2Zr2O7 depositions, or depositing from two separate Sm2O3 and ZrO2 source rods. The
traditional hypothesis and both of the proposed solution strategies were investigated in
this research.
Examination of thermodynamic data for Sm2O3 and ZrO2 reveals the strong
dependence of their vapor pressures on vaporization temperature Tv. Sm2O3 has a much
80
higher vapor pressure than ZrO2 at the same Tv. It also reveals that the ratio of their vapor
pressures is a strong function of Tv. Since the evaporation rate has been shown by
Langmuir to depend on vapor pressure, heating of an SZO source is found to cause
preferential evaporation of Sm2O3.
The cause of the initial greater samarium concentration has been determined to be
due to the differences in vapor pressures of the oxide species. Depletion of the higher
vapor pressure samarium from the source rod over the first four to six minutes of the
deposition has been verified. After this 3-5 minute period, the composition asymptotes to
that of source material ablated for longer times. This corresponds to the development of
the samarium rich area in the coating as has been verified to occur in the same time span.
This explanation for the transiently enriched region in coatings grown from SZO sources
is further supported by the lack of samarium rich region at the base of coatings deposited
from two separate sources, a strategy commonly used to eliminate compositional
problems due to vapor pressure differences. It also has been shown that this samarium
rich area can be eliminated in single source depositions by simply using a shutter to block
the substrate from the plume for the first few minutes of evaporation. Depositing from
two sources (Sm2O3 and ZrO2) has also been shown to eliminate this samarium rich area.
Gaining insight into the origin of compositional banding in the coating has proven
more elusive. During a deposition process there are three regimes where the banding
could develop: (i) during vaporization from the source material melt pool, (ii) during
transport of the vapor to the substrate, and (iii) during deposition onto the substrate
surface.

81
The transportation of the vapor from the source to the substrate does not appear to
be the cause of the compositional variations. The most salient impact this transportation
process might have on coating composition would be due to greater scattering of the
lighter zirconium oxides, as opposed to the heavier samarium, from the source-substrate
path resulting in a samarium rich coating. Gas flow simulations have demonstrated that
this is likely to occur. But, in experiments it was found that when the carrier gas flow rate
was varied, and in turn the molecules time of flight and probability of scattering, it did
not influence the coating composition.
Surface interactions during the deposition of the vapor species may add to
composition variations. In this research it has been assumed that zirconia is as likely to
stick to samarium oxide (or the substrate) as it is to itself, no difference in sticking
coefficients between the two oxides. However, it is a possibility that there is initial
preferential absorption of one type of oxide species. If the oxide species are more prone
to stick to a surface of the like oxide, this may increase the probability of further
absorption of this species, until a build up of the opposing oxide occurs at the surface and
causes it to be preferential adsorbed. This cycle could continue as the coating is being
deposited, adding to the compositional banding.
The compositional banding also does not appear to be due to fluctuations in the
source material. Evaporating from source material with visible composition
inconsistencies (~1 mm diameter samarium rich regions) did not increase the amount of
compositional fluctuation in the coating. It can be assumed that smaller variations than
this, that may be found in more uniform material typically evaporated from, would also
not add to the compositional variation in the coating. Furthermore through comparing the

82
melt region in more and less uniform source material, this region was consistently found
to possess 9.5 +/- 2 atomic % samarium concentration, though the coatings deposited
from this source material contained, on average, ~50 atomic % samarium. This
inconsistency between low samarium concentration source material and the higher
concentration of the coating can be attributed to the greater evaporation rate of samarium
due to its higher vapor pressure. Another factor that may compensate for the samarium
depleted source is the greater likelihood that the heavier samarium, as opposed to the
lighter zirconium, will be directed by the carrier jet to the source, as was found to
possible through simulations.
The most likely source of compositional banding in the coating appears to be the
result of differential vaporization of the melt constituents. Since the vapor pressure ratio
of Sm2O3 and ZrO2 is a strong function of temperature, Figure 1-19, this might arise from
variations in melt surface temperature due either to fluctuations in electron beam current,
fluctuations in heat transfer from the source material to the surroundings, or convective
circulation in the melt (the circulation of cool melt to the surface). However, if the
banding were effected by this temperature dependent difference in vapor pressures, which
becomes smaller at higher temperatures, increasing the beam current (and in turn the melt
temperature) would be expected to decrease the compositional fluctuations. In the range
of beam currents spanning from the lowest sufficient to melt the source to the largest
where the melt pool is still stable, this was not found to have an effect. Furthermore,
compositional fluctuations were not found in the melt region of the source material used
to deposit these coatings. Also, if difference in vapor pressure was the only factor causing
these fluctuations, switching to a dual source deposition should have eliminated these

83
compositional bands. Conversely, if there are non-apparent unsteady evaporation
conditions present, possibly a subtly unstable beam current or uneven cooling by the
crucible, these could cause changes in the melt pool temperature. As such the
compositional banding could still be related to vapor pressure differences. Small changes
in temperature, of which deposition rate is exponentially dependent on, cause large
differences in the overall evaporation rate. The vapor pressure of each melt component
also depends on temperature; in turn small melt temperature changes could
disproportionally affect the evaporation rate of each oxide leading to greater
compositional variation between them. Furthermore, these temperature changes caused
by unstable evaporation conditions would affect oxides deposited from both single and
dual sources. Hence, elimination of the vaporization process as a probable point where
fluctuations develop, and also elimination of the difference in vapor pressure as the cause,
cannot be completed based on current results. To do so the temperature stability of the
melt over the length of the deposition would have to be accurately confirmed. If
oscillations are present that coincide with the compositional changes in the melt region,
then the compositional banding could be due to vapor pressure differences, and the cause
of the fluctuations in the evaporation conditions would have to be determined.

84
Chapter Six : Conclusions
The electron beam vapor deposition of rare earth zirconates (especially Sm2Zr2O7)
using the DVD approach has encountered two problems: (i) an initial samarium rich
region in the first material deposited and (ii) compositional banding throughout the
coating. The current hypothesis argues that these compositional fluctuations are caused
by the difference in vapor pressure between the constituent oxides. Solutions proposed to
resolve these problems have included optimizing single source deposition parameters or
employing a deposition from separate sources for each component. However, neither has
been investigated and no detailed assessment of the basic hypothesis conducted. This
thesis has begun such an assessment and investigation of the remediation strategies
previously proposed.
It has been confirmed that the source of the initial higher samarium concentration
in first deposited material is a result of the difference in vapor pressures of samarium and
zirconium oxides in SZO sources. Examination of subsequently deposited coatings made
using single SZO sources reveals that the Sm:Zr atom eventually reaches unity, even
though the melt is severely depleted in samarium. During this regime of evaporation,
incorporation of samarium into the melt (by advance of the liquid-solid interface into the
source) equals that of evaporation. This transient region can effectively be eliminated by
shuttering the substrate from the plume during the first few minutes of evaporation, or by
utilizing a dual (Sm2O3 and ZrO2) source deposition.
Insight has been gained into the compositional banding phenomenon through the
elimination of several candidate mechanisms. By examining the composition profile in a

85
coating and that within an SZO source rod subjected to heating for various times and
intensities, it has been shown that banding is uncorrelated with local variations of source
material composition. The effect of vapor transport, from the source to the substrate, on
scattering of the differing mass oxides was also evaluated. It was found to have no effect
on the ratio of Sm:Zr in the coatings and did not provide insight into the compositional
banding. The most probable cause of banding is fluctuations in the surface (vaporization)
temperature of the SZO melt. Since the vapor pressure ratio for Sm2O3 and ZrO2 is
strongly sensitive on temperature. It appears that this is not caused by fluctuations in the
electron beam current. However, convective flows in the melt, which can be driven by
the translating electron beam gun over the melt surface, may be responsible for this effect.
These convection processes might also bring samarium enriched liquid to the melt
surface and further contribute to the fluctuations in composition. To further confirm or
disprove the culpability of vaporization as the source of these variations, the stability (i.e.
temperature), of the melt pool should be monitored during deposition and evaluated for
fluctuations that could correlate to the coating composition fluctuations. Deposition from
two separate sources may have failed to result in compositional uniformity because these
convective processes would have been present and resulted in fluctuating vapor processes
of each material. Further research is needed to investigate this new hypothesis.

86
References
[1] T. Giampaolo, Gas turbine handbook: principles and practices, The Fairmont Press, Inc., 2006.
[2] I.E. Treager, Aircraft gas turbine engine technology, McGraw-Hill, 1970. [3] “Airplane Flying Handbook,” Federal Aviation Administration Available:
http://www.faa.gov/library/manuals/aircraft/airplane_handbook/. [4] S. Bose, High temperature coatings, Elsevier Butterworth-Heinemann, 2007. [5] M. Durand-Charre, The microstructure of superalloys, CRC Press, 1997. [6] R.C. Reed, The superalloys: fundamentals and applications, Cambridge University
Press, 2006. [7] D.M. Dimiduk and J.H. Perepezko, “Mo-Si-B Alloys: Developing a Revolutionary
Turbine-Engine Material,” MRS Bulletin, vol. 28, 2003, pp. 639-645. [8] J.H. Perepezko, “The Hotter the Engine, the Better,” Science, vol. 326, Nov. 2009,
pp. 1068 -1069. [9] U. Schulz, C. Leyens, K. Fritscher, M. Peters, B. Saruhan-Brings, O. Lavigne, J.-M.
Dorvaux, M. Poulain, R. Mévrel, and M. Caliez, “Some recent trends in research and technology of advanced thermal barrier coatings,” Aerospace Science and Technology, vol. 7, Jan. 2003, pp. 73-80.
[10] R. Vaßen, M.O. Jarligo, T. Steinke, D.E. Mack, and D. Stöver, “Overview on advanced thermal barrier coatings,” Surface and Coatings Technology, vol. 205, Nov. 2010, pp. 938-942.
[11] Z. Yu, K.P. Dharmasena, D.D. Hass, and H.N.G. Wadley, “Vapor deposition of platinum alloyed nickel aluminide coatings,” Surface and Coatings Technology, vol. 201, Dec. 2006, pp. 2326-2334.
[12] H. Zhao, “Low conductivity thermal barrier coatings,” Ph.D. dissertation, University of Virginia, 2009.
[13] M.R. Begley, D.R. Mumm, A.G. Evans, and J.W. Hutchinson, “Analysis of a wedge impression test for measuring the interface toughness between films/coatings and ductile substrates,” Acta Materialia, vol. 48, Jul. 2000, pp. 3211-3220.
[14] M.R. Begley and H.N.G. Wadley, “Delamination of Ceramic Coatings with Embedded Metal Layers,” Journal of the American Ceramic Society, vol. 94, Jun. 2011, p. s96-s103.
[15] H. Zhao, M.R. Begley, A. Heuer, R. Sharghi-Moshtaghin, and H.N.G. Wadley, “Reaction, transformation and delamination of samarium zirconate thermal barrier coatings,” Surface and Coatings Technology, vol. 205, Jun. 2011, pp. 4355-4365.
[16] H. Zhao, Z. Yu, and H.N.G. Wadley, “The influence of coating compliance on the delamination of thermal barrier coatings,” Surface and Coatings Technology, vol. 204, Apr. 2010, pp. 2432-2441.
[17] A.G. Evans, D.R. Mumm, J.W. Hutchinson, G.H. Meier, and F.S. Pettit, “Mechanisms controlling the durability of thermal barrier coatings,” Progress in Materials Science, vol. 46, Jan. 2001, pp. 505-553.
[18] P. Morell and D.S. Rickerby, AGARD report 823 Thermal Barrier Coatings, Aalborg, Denmark, 1998.
87
[19] B.C. Wu, E. Chang, D. Tu, and S.L. Wang, “Microstructures, properties and failure analysis of (ZrO2-8wt.%Y2O3)/((Co, Ni)---Cr---Al---Y) Thermal Barrier Coatings,” Materials Science and Engineering: A, vol. 111, May. 1989, pp. 201-210.
[20] J.A. Haynes, M.K. Ferber, and W.D. Porter, “Thermal Cycling Behavior of Plasma-Sprayed Thermal Barrier Coatings with Various MCrAIX Bond Coats,” Journal of Thermal Spray Technology, vol. 9, Mar. 2000, pp. 38-48.
[21] J. Allen Haynes, E. Douglas Rigney, M.K. Ferber, and W.D. Porter, “Oxidation and degradation of a plasma-sprayed thermal barrier coating system,” Surface and Coatings Technology, vol. 86-87, Dec. 1996, pp. 102-108.
[22] U. Schulz, M. Menzebach, C. Leyens, and Y.Q. Yang, “Influence of substrate material on oxidation behavior and cyclic lifetime of EB-PVD TBC systems,” Surface and Coatings Technology, vol. 146-147, September, pp. 117-123.
[23] Y.H. Sohn, J.H. Kim, E.H. Jordan, and M. Gell, “Thermal cycling of EB-PVD/MCrAlY thermal barrier coatings: I. Microstructural development and spallation mechanisms,” Surface and Coatings Technology, vol. 146-147, September, pp. 70-78.
[24] N.P. Padture, M. Gell, and E.H. Jordan, “Thermal Barrier Coatings for Gas-Turbine Engine Applications,” Science, vol. 296, Apr. 2002, pp. 280 -284.
[25] D.D. Hass, “Thermal barrier coatings via directed vapor deposition,” University of Virginia, 2001.
[26] A. Feuerstein, J. Knapp, T. Taylor, A. Ashary, A. Bolcavage, and N. Hitchman, “Technical and Economical Aspects of Current Thermal Barrier Coating Systems for Gas Turbine Engines by Thermal Spray and EBPVD: A Review,” Journal of Thermal Spray Technology, vol. 17, Feb. 2008, pp. 199-213.
[27] J.F. Groves, “Directed vapor deposition,” University of Virginia, 1998. [28] D.D. Hass, “Electron beam directed vapor deposition of thermal barrier coatings,”
Journal of Vacuum Science & Technology A: Vacuum, Surfaces, and Films, vol. 16, Nov. 1998, p. 3396.
[29] C.G. Levi, “Emerging materials and processes for thermal barrier systems,” Current Opinion in Solid State and Materials Science, vol. 8, Jan. 2004, pp. 77-91.
[30] X.Q. Cao, R. Vassen, and D. Stoever, “Ceramic materials for thermal barrier coatings,” Journal of the European Ceramic Society, vol. 24, Jan. 2004, pp. 1-10.
[31] D.R. Clarke, “Materials selection guidelines for low thermal conductivity thermal barrier coatings,” Surface and Coatings Technology, vol. 163-164, Jan. 2003, pp. 67-74.
[32] J. Wu, X. Wei, N. Padture, M. Gell, M. Garcia, P. Miranzo, and M. Osendi, “Low-Thermal-Conductivity Rare-Earth Zirconates for Potential Thermal-Barrier-Coating Applications,” Journal of the American Ceramic Society, vol. 85, Dec. 2002, pp. 3031-3035.
[33] D. Zhu and R.A. Miller, “Thermal Conductivity and Sintering Behavior of Advanced Thermal Barrier Coatings,” 26th Annual Conference on Composites, Advanced Ceramics, Materials, and Structures: B: Ceramic Engineering and Science Proceedings, 2002, pp. 457–468.
[34] Y.X. Qin, J.D. Wang, W. Pan, C.L. Wan, and Z.X. Qu, “Low Thermal Conductivity Ceramics for Thermal Barrier Coatings,” Key Engineering Materials, vol. 336-338, 2007, pp. 1764-1766.

88
[35] P.K. Schelling, S.R. Phillpot, and R.W. Grimes, “Optimum pyrochlore compositions for low thermal conductivity,” Philosophical magazine letters, vol. 84, 2004, pp. 127–137.
[36] N.P. Bansal and D. Zhu, “Effects of doping on thermal conductivity of pyrochlore oxides for advanced thermal barrier coatings,” Materials Science and Engineering: A, vol. 459, Jun. 2007, pp. 192-195.
[37] H. Zhao, C.G. Levi, and H.N.G. Wadley, “Vapor deposited samarium zirconate thermal barrier coatings,” Surface and Coatings Technology, vol. 203, Jul. 2009, pp. 3157-3167.
[38] D.D. Hass, A.J. Slifka, and H.N.G. Wadley, “Low thermal conductivity vapor deposited zirconia microstructures,” Acta Materialia, vol. 49, Apr. 2001, pp. 973-983.
[39] J.D. Rigney and D.J. Wortman, “Physical properties of thermal barrier coatings using electron beam-physical vapor deposition,” , September 2003.
[40] U. Schulz, B. Saruhan, K. Fritscher, and C. Leyens, “Review on Advanced EB-PVD Ceramic Topcoats for TBC Applications,” International Journal of Applied Ceramic Technology, vol. 1, Oct. 2004, pp. 302-315.
[41] R. Vassen, A. Stuke, and D. Stöver, “Recent Developments in the Field of Thermal Barrier Coatings,” Journal of Thermal Spray Technology, vol. 18, Mar. 2009, pp. 181-186.
[42] J. Yu, H. Zhao, S. Tao, X. Zhou, and C. Ding, “Thermal conductivity of plasma sprayed Sm2Zr2O7 coatings,” Journal of the European Ceramic Society, vol. 30, Feb. 2010, pp. 799-804.
[43] D.R. Clarke and S.R. Phillpot, “Thermal barrier coating materials,” Materials Today, vol. 8, Jun. 2005, pp. 22-29.
[44] C. Wang, “Experimental and Computational Phase Studies of the ZrO2-based Systems for Thermal Barrier Coatings,” Universität Stuttgart, 2006.
[45] C.W. Chiua, Y.H. Leea, H.S. Sheub, and H.C.. Kaoa, “Phase Transition and the Thermal Activated Ordering of the Ions with Pyrochlore Phase in Ln2Zr2O7 (Ln= Sm, Eu),” Journal of the Chinese Chemical Society, vol. 57, 2010, pp. 925–931.
[46] K.A. Gschneidner, Handbook on the Physics and Chemistry of Rare Earths, North-Holland, 1993.
[47] F.X. Zhang, J. Lian, U. Becker, L.M. Wang, J. Hu, S. Saxena, and R.C. Ewing, “Structural distortions and phase transformations in Sm2Zr2O7 pyrochlore at high pressures,” Chemical Physics Letters, vol. 441, Jun. 2007, pp. 216-220.
[48] L. Minervini, R.W. Grimes, and K.E. Sickafus, “Disorder in Pyrochlore Oxides,” Journal of the American Ceramic Society, vol. 83, Aug. 2000, pp. 1873-1878.
[49] P.K. Schelling and S.R. Phillpot, “Mechanism of Thermal Transport in Zirconia and Yttria-Stabilized Zirconia by Molecular-Dynamics Simulation,” Journal of the American Ceramic Society, vol. 84, Dec. 2001, pp. 2997-3007.
[50] R.M. Leckie, S. Krämer, M. Rühle, and C.G. Levi, “Thermochemical compatibility between alumina and ZrO2-GdO3/2 thermal barrier coatings,” Acta Materialia, vol. 53, Jun. 2005, pp. 3281-3292.
[51] B. Saruhan, “EB-PVD processing of pyrochlore-structured La2Zr2O7-based TBCs,” Surface and Coatings Technology, vol. 182, Apr. 2004, pp. 175-183.

89
[52] R.M.. Leckie, “Fundamental issues regarding the implementation of gadolinium zirconate in thermal barrier systems,” University of California, 2006.
[53] N.S. Jacobson, Thermodynamic properties of some metal oxide-zirconia systems, DTIC Document, 1989.
[54] K. Bobzin, E. Lugscheider, and N. Bagcivan, “Thermal Cycling Behaviour of Lanthanum Zirconate as EB-PVD Thermal Barrier Coating,” Advanced Engineering Materials, vol. 8, Jul. 2006, pp. 653-657.
[55] Z. Xu, L. He, X. Chen, Y. Zhao, and X. Cao, “Thermal barrier coatings of rare earth materials deposited by electron beam-physical vapor deposition,” Journal of Alloys and Compounds, vol. 508, 2010, pp. 94–98.
[56] S. Schiller, U. Heisig, and S. Panzer, Electron beam technology, Wiley, 1982. [57] U. Schulz, K. Fritscher, and C. Leyens, “Two-source jumping beam evaporation for
advanced EB-PVD TBC systems,” Surface and Coatings technology, vol. 133, 2000, pp. 40–48.
[58] I. Langmuir, “The vapor pressure of metallic tungsten,” Physical Review, vol. 2, 1913, p. 329.
[59] L.I. Maissel and R. Glang, Handbook of thin film technology, McGraw-Hill, 1970. [60] M. Ohring, The materials science of thin films: deposition and structure, Academic
Press, 2002. [61] Z. Yu, D.D. Hass, and H.N.G. Wadley, “NiAl bond coats made by a directed vapor
deposition approach,” Materials Science and Engineering: A, vol. 394, Mar. 2005, pp. 43-52.
[62] J. Groves, Directed Vapor Deposition: Low Vacuum Materials Processing Technology, DTIC Document, 2000.
[63] G. Mattausch, “Email. RE: DVD question,” Oct. 2011. [64] J.A. Thornton, “Influence of apparatus geometry and deposition conditions on the
structure and topography of thick sputtered coatings,” Journal of Vacuum Science and Technology, vol. 11, Jul. 1974, pp. 666-670.
[65] G. Yeager. TCI Ceramics, Phone conversation on July 7, 2011, . [66] F. Xu, J. Yu, X. Mou, L. Zhang, and S. Tao, “Structures and morphology of the
ordered domains in Sm2Zr2O7 coatings,” Chemical Physics Letters, vol. 492, Jun. 2010, pp. 235-240.