Complex evaluation of quick-frozen sweet corn...
26
THESIS OF DISSERTATION Complex evaluation of quick-frozen sweet corn products VIKTOR LOSÓ Supervisor: László Sipos PhD associate professor Corvinus University of Budapest Faculty of Food Science Department of Postharvest and Sensory Evaluation BUDAPEST 2015
Transcript of Complex evaluation of quick-frozen sweet corn...

THESIS OF DISSERTATION
Complex evaluation of quick-frozen sweet corn products
VIKTOR LOSÓ
Supervisor:
László Sipos PhD
associate professor
Corvinus University of Budapest
Faculty of Food Science
Department of Postharvest and Sensory Evaluation
BUDAPEST
2015

2
PhD School
Name: PhD School of Food Science
Field: Food Sciences
Head: Prof. József Felföldi, DSc
Corvinus University of Budapest
Faculty of Food Science
Department of Physics and Control
Supervisor: László Sipos, PhD
associate professor
Corvinus University of Budapest
Faculty of Food Science
Department of Postharvest and Sensory Evaluation
The Applicant met the requirement of the PhD regulations of the Corvinus
University of Budapest and the thesis is accepted for the defend process.
...................................................... ........................................................
Signature of Head of PhD School Signature of Supervisor

3
1. INTRODUCTION
The climatic and agro-ecologic conditions of Hungary provide
good conditions to the cultivation of sweet corn (Zea mays var. saccharata
L.) (FRUITVEB, 2006, 2007, 2008, 2009, 2010, 2011, 2012, 2013). The
cultivation and processing of the quick-frozen sweet corn are of national
economical importance. Thanks to the increasing purchase prices in the past
20 years, the size of the production area had multiplied (1992=9000ha;
2014=37000ha) (SYNGENTA, 2014; KSH, 2015; FÓRIÁN, 2014).
Concerning the exported quantity of quick-frozen sweet corn, Hungary
belonged to the biggest exporters in the past decade and became a market
leader in the past few years.
In general terms, the international and national sweet corn
improvement has executed the species selection under consideration of the
points of cultivation and the processing industry itself. At the same time, the
members of the sweet corn business – producers, processors, traders,
customers – have set sharply different demands toward the individual
species. The internal properties of the quick frozen sweet corn species and
the related experiments are incomplete; therefore, the increasing potential of
the nutrition-physiological value of the sweet corns are unexploited. For the
further spreading of the quick-frozen sweet corn in the market, a series of
scientifically well founded and statistically proven complex measurements is
required.
Figure 1. Export volume data for quick-frozen sweet corns
(AETMD, USDA 2015)

4
2. OBJECTIVES
The goal of my work is to accomplish the research needed to the
determination of the consumer quality establishing the market potential of
the quick-frozen sweet corn. The main goals of my thesis are the complex
analysis of the quick-frozen sweet corn species from consumers’ point of
view, the analysis of the internal parameters of the species and the
determinations of the similarities and differences caused by the sensory
parameters. The objects of the research within the main goals are shown as
follows:
1. Objects concerning the sensory parameters of the quick-frozen
sweet corn species tested:
- determining the full sensory profiles,
- creating external and internal preference maps,
- prediction of the consumers’ satisfaction using mathematical
models,
- product optimisation for the consumer segments, determining
the ideal product combinations, comparing the consumer
segments.
2. Instrumental and analytical objects concerning the nutrition-
physiological potential of the tested quick-frozen sweet corn
species:
- determining and characterising the colour profiles,
- determining and characterising the texture profiles,
- determining the carbohydrate content (glucose, fructose,
sucrose),
- determining the dry matter content,
- determining the total carotenoid content,
- characterising the antioxidant capacity,
- determining the most important micotoxin levels (zearalenon,
fumonisin).
The practical goal and benefits of the thesis are that the results help
to increase the internationally high volume of export and sales of the
Hungarian quick-frozen sweet corn as well as the national consumption at
the same time.

5
3. MATERIALS AND METHODS
The objects of the research were the samples of the quick-frozen sweet
corn (Table 1.).
Table 1. List of the sweet corn varieties and their maintainers
Serial
no. Name (maintainer)
Serial
no. Name (maintainer)
Serial
no.
Name
(maintainer)
1 ‘Basin R’
(SVS Holland BV) 15
‘GSS 5649’
(Syngenta Seeds
BV)
29 ‘Puma’
(Crookham Co.)
2
‘Boston’
(Syngenta Seeds
BV)
16
‘GSS 8529’
(Syngenta Seeds
BV)
30 ‘Rebecca’
(Pop Vriend BV)
3 ‘Box R’
(Topcorn Kft.) 17
‘Jubilee’
(Syngenta Seeds BV)
31
‘Rocket’
(Harris Moran Seeds Co)
4 ‘Dessert 82’
(Topcorn Kft.) 18
‘Jumbo’ (Crookham Co.)
32 ‘Royalty’
(Pop Vriend BV)
5 ‘Dessert R68’
(Topcorn Kft.) 19
‘Jurassic’
(Syngenta Seeds
BV)
33 ‘Rustler’
(Vilmorin-NL)
6 ‘Dessert R78’
(Topcorn Kft.) 20
‘Kinze’
(HM Clause SA) 34
‘Sheba’
(Asgrow Seeds
Co)
7
‘Dynamo’
(Harris Moran Seeds
Co.)
21
’Kuatour’
(Harris Moran Seeds
Co.)
35
‘Spirit’
(Syngenta Seeds
BV)
8
‘Enterprise’
(Snowy River Seeds
Ply Ltd.)
22 ‘Legend’
(HM Clause SA) 36
’Shinerock’
(Syngenta Seeds
BV)
9 ‘Galaxy’
(HM Clause SA) 23
‘Madonna’
(SVS Holland BV) 37
‘Starshine’
(Syngenta Seeds
BV)
10
‘Garrison’
(Syngenta Seeds
BV)
24 ‘Mercur’
(Royal Sluis BV) 38
‘Sweetstar’
(Syngenta Seeds
BV)
11
‘GH 2042’
(Syngenta Seeds BV)
25 ‘Merit’
(Royal Sluis BV) 39
‘Tasty Sweet’ (IFS Inc.)
12 ’SC 1036’
(Seminis) 26
‘Noa’
(Pop Vriend BV) 40
‘TOP 825’
(Topcorn Kft.)
13
’GH 6225’
(Syngenta Seeds
BV)
27
‘Overland’
(Syngenta Seeds
BV)
41
‘Turbo’
(Harris Moran
Seeds Co.)
14
‘GSS 1477’
(Syngenta Seeds
BV)
28
’Prelude’
(Snowy River Seeds
Ply Ltd.)

6
The primary research relies upon two main bases (Figure 2.).
Figure 2. Structure and units of the research
1. Sensory evaluation methods used in the study:
- determining the sensory profiles (ISO 11035:1994, ProfiSens
special software),
- creating preference maps (PCA on expert data,
Agglomerative Hierarchal Clustering on consumer data
(Euclidean distance, Ward method, XLSTAT software),
- prediction of consumer acceptance by mathematical models,
testing and optimisation of artificial neural networks
(MLFN/MLPN Best Net Search, Palisade Neural Tools ver.
5.5 software),
- product optimization for the consumer segments, determining
the ideal product combination, comparing the consumer
(consumer focus groups, value-based conjoint by using
orthogonal blocks, SPSS 22.0 software).

7
2. Instrumental and analytical objects concerning the nutrition-
physiological potential of the tested quick-frozen sweet corn
species:
- determining and characterizing the colour profiles (CIELab
L*a*b* colour coordinates, Minolta Chromameter CR-400
colour meter),
- determining and characterising the texture profiles
(Brookfield LFRA Texture Analyser, TexturePro Lite v1.1
Build 4 software),
- determining the carbohydrate content (glucose, fructose,
sucrose) (HPLC, High Performance Liquid Chromatography),
- determining the dry matter content (in drying box at 105°C
until reaching mass constancy),
- determining the total carotenoid content, (spectrophotometer,
Lichtenthaler and Buschmann (2001) method),
- characterizing the antioxidant capacity (DPPH, FRAP, TPC,
ABTS),
- determining the most important micotoxin levels (zearalenon,
fumonisin, chromatographic immunological test of the lateral
fluid).

8
4. RESULTS
4.1. Results relating to the sensory methods
4.1.1 Results of the expert panel, sensory profile of the species
The most important results of the profile analysis are the profile
diagrams characterising the species in full. The profile diagram of the
reference sample (‘Royalty’) is shown as an example in Figure 3.
Figure 3. Full sensory profile diagram of the ‘Royalty’ sweet corn
All possible sensory profiles of the 41 species of quick-frozen sweet
corn were created. One-way analysis of variance (ANOVA) and the
calculation of the Tukey HSD pair-wise comparisons were carried out to
determine the homogenous and heterogeneous groups. The sweet corn
species having similar sensory profiles were clustered by Agglomerative
hierarchal clustering, Euclidean distance, Ward method (Table 2.).

9
Table 2. Result of the cluster analysis and the species nearest to the cluster centre
by the SRD method (highlighted by gray)
Cluster 1 Cluster 2 Cluster 3 Cluster 4 Cluster 5 Cluster 6
Number of species within the
cluster 6 11 5 8 2 9
Variance within the class 6450.31 3534.24 6839.94 4999.81 10827.79 1519.64
Minimal distance from the
centre 46.63 39.12 63.12 37.47 71.72 22.60
Average distance from the centre 71.55 55.81 73.40 64.03 84.41 35.71
Maximmum distance from the
centre 98.42 69.90 89.30 82.93 94.95 52.76
‘Basin R’ ‘Boston’ ‘Dynamo’ ‘Enterprise’ ’Jurassic’ ‘GSS 8529’
‘Galaxy’ ‘Dessert R78’ ‘Merit’ ‘GH 2042’ ‘Rustler’ ‘Jumbo’
‘Garrison’ ‘Dessert 82’ ‘Shinerock’ ‘GH 6225’ ‘Legend’
‘GSS 1477’ ‘SC 1036’ ‘Starshine’ ‘Jubilee’ ‘Madonna’
‘Rocket’ ‘GSS 5649’ ‘TOP 825’ ‘Kuatour’ ‘Mercur’
‘Sweetstar’ ‘Kinze’ ‘Prelude’ ‘Overland’
‘Noa’ ‘Puma’ ‘Rebecca’
‘Sheba’ ‘Royalty’ ‘Spirit’
‘Tasty Sweet’ ‘Turbo’
‘Box R’
‘Dessert R68’
The individual factor weights of the individual sensory properties were
determined in the course of the principal component analysis (PCA). The
higher is the loading, the better is the characterisation of the 2D projection in
the multi-dimensional space by the two principal components (Figure 4.).
Figure 4. PCA loading values of the sensory properties of the sweet corns tested

10
4.1.2. Evaluation and monitoring by the expert panel
The basis of the sensory sciences is the sensory measurements. The
sensory science uses the human senses as tools for the measurements. The
quality of the sensory data is determined by the sensory panel and its
members; therefore, their performance shall continuously be monitored. The
expert panel consensus can continuously be followed, if the SRD method is
repeatedly run using the normalised SRD values for each panellist. The
panel tracking can be executed for arbitrary number of sessions (Figure 5.).
Figure 5. Rank of panellists determined by the SRDnorm values based on the
results of 41 sessions in total
4.1.3. Results of the consumer hedonic tests
The interdependences between the sensory properties and the liking
have been determined by Spearman-correlation. The total liking of the corn
has a strong positive correlation with the liking of taste and the cooked taste.
Furthermore, medium positive correlation is there in descending order
concerning the liking of the sweet taste, tenderness, grain size and odour.
The global taste strongly correlates with the cooked and sweet tastes, while a
medium-strong positive correlation can be seen with the tenderness,
hardness and odour (Table 3.).

11
Table 3. Spearman rank correlation and p-values of the consumer liking
odour hardness tenderness kernel size sweet taste cooked taste taste total total
colour 0.235 -0.015 -0.018 0.057 -0.153 -0.061 -0.077 -0.031
odour – 0.052 0.296 0.183 0.197 0.274 0.253 0.306
hardness 0.575 – 0.359 0.275 0.389 0.452 0.363 0.391
tenderness 0.001 < 0.0001 – 0.319 0.435 0.585 0.487 0.524
kernel size 0.046 0.002 0.000 – 0.190 0.228 0.188 0.313
sweet taste 0.031 < 0.0001 < 0.0001 0.037 – 0.598 0.723 0.646
cooked taste 0.003 < 0.0001 < 0.0001 0.012 < 0.0001 – 0.769 0.750
total taste 0.005 < 0.0001 < 0.0001 0.040 < 0.0001 < 0.0001 – 0.896
total 0.001 < 0.0001 < 0.0001 0.001 < 0.0001 < 0.0001 < 0.0001 –
4.1.4. Results of the preference mapping
The preference maps determine the interdependence between the
consumer liking of the quick-frozen sweet corn and the profile analysis
results. The three clusters differ from each other in the order of preference
determined by the evaluation of the liking of the corn (Table 4.).
Table 4. Hierarchy of the liking of the quick-frozen sweet corn species in an order
increasing from the top downwards
Cluster 1 Cluster 2 Cluster 3
‘Jurassic’ ‘Spirit’ ‘Jurassic’
‘Spirit’ ‘Dynamo’ ‘Dynamo’
‘Royalty’ ‘Dessert R78’ ‘Spirit’
‘Dynamo’ ‘Royalty’ ‘Dessert R78’
‘Dessert R78’ ‘Jurassic’ ‘Royalty’
‘Galaxy’ ‘Galaxy’ ‘Galaxy’
In the preference maps, based on the overall liking, the liking is higher
in the vicinity of the cluster centre and the longer the vector is, the more
expressed the preference is. In case of the contour plot, the higher consumer
liking in indicated with warmer colours. Within such warm colours, the
more intense red colour shows higher liking. Therefore, it’s worthy to
position the species in the red fields of the preference maps (Figure 6.).
12
Figure 6. Preference map created by the summarised evaluation of the
properties of the quick-frozen sweet corn species (F1-F2)
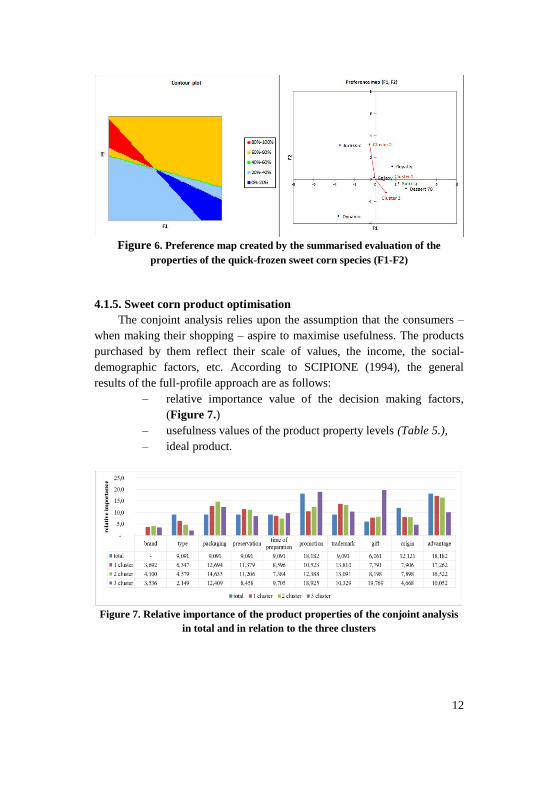
4.1.5. Sweet corn product optimisation
The conjoint analysis relies upon the assumption that the consumers –
when making their shopping – aspire to maximise usefulness. The products
purchased by them reflect their scale of values, the income, the social-
demographic factors, etc. According to SCIPIONE (1994), the general
results of the full-profile approach are as follows:
– relative importance value of the decision making factors,
(Figure 7.)
– usefulness values of the product property levels (Table 5.),
– ideal product.
Figure 7. Relative importance of the product properties of the conjoint analysis
in total and in relation to the three clusters

13
Table 5. Usefulness values of the product levels of the conjoint analysis
Product attributes Total Cluster 1 Cluster 2 Cluster 3
mean st. dev. mean st. dev. mean st. dev. mean st. dev.
bra
nd
private label -0.76 1.13 -0.44 1.88 -0.35 0.55 -1.42 1.17
brand 0.76 1.13 0.44 1.88 0.35 0.55 1.42 1.17
type normal sweet 1.83 1.13 3.60 1.88 0.55 0.55 1.46 1.17
super sweet -1.83 1.13 -3.60 1.88 -0.55 0.55 -1.46 1.17
pac
kag
ing
100g -1.39 2.12 -1.47 3.53 -1.09 1.04 -1.60 2.20
200g 1.07 2.12 3.11 3.53 0.47 1.04 -0.10 2.20
400g -1.45 2.12 -3.35 3.53 -0.97 1.04 -0.27 2.20
500g 0.39 2.75 0.53 4.58 0.17 1.35 0.44 2.85
1000g 1.37 2.75 1.17 4.58 1.42 1.35 1.53 2.85
pre
serv
atio
n canning (filled in bottle) -0.47 1.96 -0.24 3.26 0.08 0.96 -1.27 2.03
canning (filled in metal can) -1.70 1.96 -3.14 3.26 -1.58 0.96 -0.49 2.03
quick-frozen in plastic packaging 0.67 1.96 2.15 3.26 0.29 0.96 -0.28 2.03
quick-frozen in paper packaging 1.50 1.96 1.23 3.26 1.20 0.96 2.06 2.03
tim
e of
pre
par
atio
n
ready to eat -2.15 1.57 -3.09 2.61 -0.73 0.77 -2.68 1.62
5 minutes -0.64 1.57 -1.23 2.61 0.07 0.77 -0.81 1.62
15 minutes 2.79 1.74 4.32 2.90 0.66 0.86 3.49 1.80
pro
moti
on
tablet/smart phone 0.51 2.12 0.05 3.53 0.33 1.04 1.06 2.20
kitchen machine 0.48 2.12 -0.46 3.53 -0.23 1.04 2.04 2.20
scooter -0.41 2.12 1.10 3.53 -0.81 1.04 -1.45 2.20
travel 0.99 2.75 1.50 4.58 1.21 1.35 0.29 2.85
money -1.57 2.75 -2.20 4.58 -0.49 1.35 -1.94 2.85
trad
emar
k Excellent Hungarian Food -3.66 1.96 -5.38 3.26 -1.64 0.96 -4.08 2.03
Hungarian Product Grand Prix 0.94 1.96 2.08 3.26 -0.24 0.96 1.10 2.03
Superbrands -1.92 1.96 -4.29 3.26 -0.433 0.96 -1.27 2.03
Hungarian Brands 4.65 1.96 7.59 3.26 2.32 0.96 4.24 2.03
gif
t
+10% gratis 1.34 1.57 1.86 2.61 1.19 0.77 1.10 1.62
+25% gratis -2.19 1.57 -2.70 2.61 -1.21 0.77 -2.708 1.62
+33% gratis 0.85 1.74 0.84 2.90 0.02 0.86 1.60 1.80
ori
gin
Hungary -1.11 1.57 -0.28 2.61 -0.32 0.77 -2.68 1.62
France -0.79 1.57 -1.40 2.61 -0.59 0.77 -0.37 1.62
Poland 1.90 1.74 1.68 2.90 0.92 0.86 3.06 1.80
nu
trit
ional
ad
van
tag
e
natural fibre source 0.62 2.24 1.23 3.73 -0.33 1.10 0.99 2.32
vitamin E source 4.51 2.95 9.42 4.90 0.25 1.45 4.21 3.05
carotene source -3.02 2.95 -4.92 4.90 -0.90 1.45 -3.29 3.05
iron source -0.75 2.95 -0.79 4.90 -1.07 1.45 -0.40 3.05
vitamin B source 0.10 2.95 -0.10 4.90 0.48 1.45 -0.03 3.05
GMO free -0.07 2.95 -1.84 4.90 0.95 1.45 0.50 3.05
organic -1.38 2.95 -2.98 4.90 0.62 1.45 -1.97 3.05

14
4.2. Consumer prediction of the artificial neural nets
By means of the “Best Net Search”, the software has tested six MLFN
(Multi Layer Feed forward Net) configurations to select the one providing
the best fit prediction (Figure 8.) In case of the consumers, the 4-node
MLFN was the one providing the best results (Table 6.).
Figure 8. Interdependence of the artificial neural net (4 node MLFN)

15
Table 6. „Best Net Search” results of the network testing
Best Net Search Minimum Residual
(training)
Maximum residual
(training)
Minimum residual
(test)
Maximum residual
(test)
MLFN 2 nodes -1.06007 0.96618 -0.87118 0.99700
MLFN 3 nodes -0.97762 1.03442 -0.88366 0.99625
MLFN 4 nodes -0.95308 0.96563 -0.88233 0.98695
MLFN 5 nodes -1.03178 1.0418 -0.98502 1.10380
MLFN 6 nodes -1.11483 1.15705 -1.05110 1.14759
When training and testing the neural networks, the Palisade software is
able to indicate the order of importance of the variables playing role in the
structure of the networks as well.
4.3. Instrumental analytical results
The results of the instrumental measurements relating to the 41 species
of quick-frozen sweet corn included in my research are contained in detail.
Some results are emphasised, because for every samples the Kruskal-Wallis
test was applied by calculating the exact p-value (α=0.05) then, the Dunn
pair-wise post hoc test was carried out with Bonferroni correction.
4.3.1. Colour profile results
The colour differences between the individual species have been
determined by comparing to the selected ‘Royalty’ species used generally in
the refrigeration industry and chosen during the expert profile. The colour
differences were determined by the colour parameters (CIE L*a*b*)
applying the Pythagoras-theorem (Table 7.).

16
Table 7. Determining the perceivable colour differences (ΔELab*) (reference
’Royalty’)
0.5-1.5 hardly perceivable 1.5-3.0 perceivable 3.0-6.0 well perceivable 6.0-12.0 intensive
Species ΔELab* Species ΔELab* Species ΔELab* Species ΔELab*
‘Puma’ 0.8 ‘Rustler’ 1.85 ‘Tasty Sweet’ 3.1 ‘Jubilee’ 6.0
‘Enterprise’ 1.1 ‘Jurassic’ 2.06 ‘Dessert R68’ 3.3 ‘Box R’ 6.2
‘Overland’ 1.2 ‘Prelude’ 2.23 ‘Basin R’ 3.3 ‘Turbo’ 6.4
‘Boston’ 2.31 ‘Merit’ 3.4 ‘Kinze’ 6.4
‘Legend’ 2.81 ‘Madonna’ 3.5 ‘Starshine’ 7.2
‘GSS 8529’ 3.5 ‘Noa’ 7.3
’GH 6225’ 3.9 ‘Dessert R78’ 7.7
‘TOP 825’ 4.1 ‘GH 2042’ 9.9
‘Shinerock’ 4.1 ‘Garrison’ 10.5
‘Mercur’ 4.4 ‘Sheba’ 11.1
‘Dessert 82’ 4.5 ‘GSS 1477’ 11.1
‘Kuatour’ 4.6
‘GSS 5649’ 4.8
‘GSS 8529’ 4.9
‘Spirit’ 4.9
‘Rocket’ 5.2
‘SC 1036’ 5.8
‘Rebecca’ 5.8
‘Galaxy’ 5.8
‘Dynamo’ 5.9
‘Sweetstar’ 5.9
4.3.2. Texture profile results
The texture profile characterising the sweet corns shows a slow rising
zone followed by a steep dropping section and the cycle was repeated. The
second peak occupies nearly three-fourth of the first one representing the
sweet corns according to the measurements. The measured texture profiles
were identical for the individual samples, but in some cases the differences
were significant (Figure 9.).
Figure 9. The ‘Enterprise’ and ‘Spirit’ texture profiles

17
4.3.3. Carbohydrate profile results
Analyzing the samples in general terms it can be seen that the glucose
and fructose values are 8- 10 times lower than the sucrose values. Results of
the carbohydrate measurement (glucose, fructose, sucrose) (Figure 10.).
Figure 10. Results of the carbohydrate measurements
4.3.4. Results of the total carotenoid content
Based on the total carotenoid content, the ‘Sheba’ species is
significantly the highest one, while the species ‘Legend’ and ‘GH 2042’
have the significantly lowest values. The results for the remaining – identical
– species were between these two groups (Figure 11.)
Figure 11. Total carotenoid content (µg/mg)
4.3.5. Results of the antioxidant capacity (DPPH, FRAP, TPC, ABTS)

18
Based on the DPPH, the ‘Rebecca’ had the significantly highest value,
while the significantly lowest one is the ‘GH 2042’ species. Based on the
FRAP, the ‘Rebecca’ and ‘Rocket’ species have the significantly highest
value, while the ‘Galaxy’ had the significantly lowest value. Based on the
TPC, the species constituting the ‘Turbo’, ‘Galaxy’, ‘Noa’, ‘Madonna’
group have the significantly highest value, while the significantly lowest
values characterise the ‘GSS 5649’ and ‘Garrison’ species. Based on the
ABTS, the significantly highest value was tied to the ‘Dynamo’, species,
while ‘GH 6225’ had the significantly lowest value. The smallest differences
between the individual species were found by the ABTS method.
4.3.6. Results of the dry matter content measurement
During the ripening, the sweet corn transforms the starch into
carbohydrate. The dry matter content of the sweet corn depends first of all
on the quantity of carbohydrate and starch in the corn, because these are the
textures being present in the grain in the highest quantities (Figure 12.).
Figure 12. Dry mater content (g/100g)
4.3.7. Fumonisin and zearalenon micotoxin results
Before the sensory evaluation, the micotoxin quantities contained in
the sweet corn were determined. Respecting the micotoxin content, the
quantity of the zearalenone was below the detection threshold, while the
amount of fumonisin failed to approximate the limit value of 4000 µg/kg, it
remained below 70 µg/kg.

19
5. NEW SCIENTIFIC RESULTS
1. My research was the first one to characterise the full sensory profile
and sensory clusters of 41 species of quick-frozen sweet corns. The
colour, texture and carbohydrate profiles (glucose, fructose, sucrose)
and antioxidant textures of the species were determined.
2. I certified first that the application of the repeated SRD method (Sum
of Rank-Difference) run on the SRDnorm values provides a reliable
hierarchy for the process of the series of sessions to evaluate and
follow the individual panellist consensus.
3. I created first the odour, hardness, sweet taste, cooked taste and
tenderness preference maps for the species by combining the
professional sensory profile and the consumer acceptance tests.
4. Concerning the sweet corn, I determined firstly the comparative
importance of the consumer decision making factors, the usefulness of
the product levels and the ideal product combination by conjoint
research. By combining the conjoint analysis with cluster analysis, I
was able to explore and characterise the consumer segments.
5. I showed first the combination of the Monte Carlo simulation and the
artificial neural networks was a good combination of methods to
predict the consumer preferences by using the expert sensory data.
6. By means of the 4-node MLFN (Multi-Layer Feedforward Networks),
optimized for the species and providing the best prediction, the
product properties were identified and set in sequence by their
importance. The most important variables were the sweet taste (18 %),
the global colour intensity (14 %) and juicy (12 %).

20
6. CONCLUSIONS AND RECOMMENDATION
According to the literature, the profile analysis method is one of the
most complex sensory tests; its advantage is that it well describes the
properties/components of the tested products (ISO 11035:1994; VARELA
and ARES, 2014). The sensory characterisation of all the 41 quick-frozen
sweet corn species was shown in a profile diagram including an expert
panel. The similarities and differences between the individual properties
were analyzed by the one-way ANOVA, then, by using the pair-wise post
hoc tests (Tukey HSD). It is advantageous to analyse the profiles describing
the species and the sensory attributes by principal component analysis
(PCA), and Bi-plot and to include several principal components, because
this may provide a more complex outcome.
A well performing trained or expert panellist has good discriminative
abilities, the results are absolutely reproducible and the scores given by
him/her are near to the consensus point of the panel. The reliability of the
results provided by the sensory panel are determined by the panellist
performance parameters, i.e. their performance shall continuously be
monitored (Bi and Kuesten, 2012; ISO, 11132:2012). My examinations have
confirmed that the SRD method can be applied to the control of the profile
data used to evaluate the performance of the sensory panellist.
I have proved at first that the repeated SRD method run with the
SRDnorm values give a reliable rank for the entire series of sessions of the
aggregate performance of the panellists. This rank can be defined for each
evaluation, i.e. this method is suitable to the qualification of the panellist’s
performance. By means of the two-fold SRD run, the less reliable panellists
can be identified; they can be trained by additional evaluations or excluded.
From practical point of view, in the practice of the sensory evaluation it is
worthy to choose a software being able to handle ties in the sequence of
rank, because the panellists may specify the same values. The more lines we
have, the probability of ties is higher in the sequence that may lead
combinatorial explosion resulting in longer running times.
In relation to the preference mapping of the various foods, several
international research projects were launched covering the entire food
product group. Disregarding the colleagues of the Sensory Laboratory of
Corvinus University of Budapest, no similar works were published
concerning the sweet corn preference mapping (GERE et al., 2013; LOSÓ et
al., 2012). In general terms, the preference maps are modelled by the overall
liking. My results suggest that the species ‘Galaxy’, ‘Royalty’ and ‘Dessert

21
R78’ suit mostly the consumers’ demands. Out of the three species the
‘Galaxy’ proved to be the most preferred one. In my study, this species is the
“most average” one created by the expert profiles, i.e. the other species of
this cluster could be similarly preferred ‘Basin R’, ‘Garrison’, ‘GSS 1477’,
‘Rocket’, ‘Sweetstar’. The practical consequence is that the processors can
substitute the ‘Galaxy’ with these species to achieve similar sensory
characteristics. In the case of newly bred species, following the creation of
the expert profile, if it can be put into one of the clusters created during the
research, the results of the preference map can be generalised to the new
species as well.
Beside the preference map created by the overall liking, the preference
maps of the quick-frozen sweet corns tested were also created (colour,
odour, hardness, tenderness, grain size, sweet taste, cooked taste, global
taste). By means of them the liking hierarchy by preference maps and
clusters was created. These results indicate the parameters to be improved by
the geneticists to produce even more popular species for the consumers.
The artificial neural networks presented and the approach combining
the Monte Carlo simulation proved to be suitable for the prediction of the
consumer preference according to the sensory expert panel. The advantage
of this approach is that the time-, energy- and cost-consuming consumer
examinations can be substituted by a prediction based on the expert data. I
was able to predict the preference values of 36 sweet corn samples based on
the consumer evaluations of six samples in total.
During the creation of the artificial neural network model, the product
properties being the main drivers of the consumer acceptance were
successfully identified. The hierarchy of importance is: sweet taste, global
taste intensity and tenderness. These results are in harmony with the results
of my preliminary research, by the extension of which reliable results could
be obtained even for larger samples as well. This research could be extended
to other horticultural products (e.g. pea) as well and use it for products, for
which the consumer preference is not limited to a few, easily definable
product parameters (e.g. apples). The results of the preference mapping
originated from the overall liking coincide with the ANN results, because
the ‘Galaxy’ represents the cluster No. 1., while the ‘Dessert R78’ the No. 2.
and they have received the highest liking scores by the liking values of the
prediction.
By means of focus group interviews taken with the consumers, the
forms of thinking of the housewives purchasing quick-frozen sweet corns
and the criteria of their selection influencing the process of the decision

22
making were identified. By summarising the results of the 4 groups, the
product parameters and product parameter levels being important from the
point of view of sweet corn buying and representing the input information
for the conjoint examination were identified. Using the conjoint test, the
relative importance hierarchy, usefulness data and the ideal products were
determined for the clusters.
Further research should be devised how the number of cards influences
the quality of the answers. The goal of the orthogonal design is to decrease
the number of variables under consideration of the expectable concentration
abilities of the respondents. In my research, the high number of cards was
reduced by the orthogonal block method. Based on my results, by analyzing
the importance of the product parameters, I was able to show that
independently of the consumer segments, the most important decision points
declared are the nutritional advantages, promotion, the trademark and
packaging. The least important factor in the consumer’s decision is the
selection of brand. The consumer clusters were characterised.
The species were characterised by the descriptive colour parameters
(L*a*b*). The different target markets have various yellow colour
preferences. It was experimentally confirmed that there was a demand on the
consumers’ side to know the corn’s colour exactly. In industrial-scale sales
(B2B), the exact determination of the yellow colour is missing from the
specification in spite of the fact that the instrumental background of such
specification is well known long ago. The colour differences between the
species were determined as compared to ‘Royalty’ applied mostly in the
refrigeration industry and applied to the expert profile by using the spatial
Pythagoras-theorem. Later, it could be used to the comparison of all species.
A result like this could be of importance, because the outcome is based on
visual difference classes.
The hardness of the sweet corns shows large variability. The
characteristic texture profile was generally determined for the sweet corns,
in which a fast dropping zone follows a slow upslope phase and this cycle is
repeated. The second peak occupies nearly three-fourth of the firs peak;
based on measurements, this is a property characterising the corn. No
adhesion phenomenon was observed, i.e. the samples were not sticky or
clammy.
The carbohydrates are decisive components of the sweet corns. A
summary analysis based on research results confirms that the glucose and
fructose values are 8-10 times lower in average than the sucrose level, in the
sucrose content influences the sweet taste of the samples mostly. The super-

23
sweet species contain sucrose in three or four-fold quantities as compared to
the normal-sweet species.
The antioxidant capacity of the species was characterised by several
methods (DPPH, FRAP, TPC, ABTS). Based on our results, the individual
species have extraordinary antioxidant properties (‘Rebecca’ and ‘Rocket’).
The TPC method did not reveal differences between the species which might
originate from the fact that the carotenoides are responsible for the
antioxidant content, not the polyphenols. The results of the micotoxin tests
are extremely important from the point of view of food safety. The sensory
tests were carried out after the negative outcome of such tests.
As one result of the examination, a working process was created which
could serve as base to the further analysis of the sweet corn species.
Examining the new sweet corn species improved in the course of the past
years, they can become comparable by the above mentioned points.

24
PUBLICATIONS RELATED TO THE DISSERTATION
Original Research Papers
Published in referred (IF) journals:
1. V. Losó, A. Tóth, A. Gere, J. Heszberger, G. Székely, Z. Kókai, L. Sipos
(2012): Methodolgy problems of the industrial perference mapping. Acta
Alimentaria, 41 (Suppl) pp. 109-119. (IF=0,444).
2. A. Szőke, V. Losó, L. Sipos, A. Geösel, A. Gere, Z. Kókai (2012): The
effect of brand/type/variety knowledge on the sensory perception. Acta
Alimentaria, 41 (Suppl) pp. 197-204 (IF=0,444).
3. Gere, A., Losó, V., Tóth, A., Kókai, Z., Sipos, L. (2012): Kukoricafajták
preferenciatérképezése szoftveres támogatással. Élelmiszervizsgálati
közlemények, 58 (3-4) pp. 118-130 (IF=0,04).
4. Gere, A., Losó, V., Radványi, D., Juhász, R., Kókai, Z., Sipos, L.
(2013): Csemegekukorica fajták komplex értékelése.
Élelmiszervizsgálati közlemények, 59 (3) pp. 120-134 (IF=0,04).
5. A. Gere, V. Losó, A. Györey, S. Kovács, L. Huzsvai, A. Nábrádi, Z.
Kókai, L. Sipos (2014): Applying parallel factor analysis and Tucker-3
methods on sensory and instrumental data to establish preference maps.
Case study on sweet corn varieties. Journal of the Science of Food and
Agriculture, 94 (15) pp. 3213-3225 (IF=1,759).
Published in other international journals:
1. V. Losó (2009): Japan lebt von Tiefkühl-Gemüse. Tiefkühl Report, 37
(12) p. 71
2. V. Losó (2009): Von der Produktion auf den Tisch. Tiefkühl Report, 37
(12) pp. 72-73.
Published in other Hungarian journals:
1. Losó, V. (2007): Hűtőipari tendenciák I. A világpiac. Hűtőipar, 55 (3) 4-
5 p.
2. Losó, V. (2007): Hűtőipari tendenciák II. Az európai piac. Hűtőipar, 55
(4) 4-6 p.
3. Losó, V. (2008): Hűtőipari tendenciák III. A magyar piac. Hűtőipar, 56
(1) 5-8 p.
4. Losó, V. (2009): A zöldségfeldolgozás helyzete 2008-ban.
Zöldségtermesztés, Vegetable growing 15 (2) 6-8.
5. Losó, V. (2009): A Japán disztribúciós rendszer a fagyasztott termékek
tükrében. Hűtőipar, 57 (2) 7-10 p.

25
6. Losó, V. (2009): A változó Japán zöldségpiaca. Hűtőipar, 57 (1) 6-9 p.
7. Losó, V. (2009): Japán értékesítési csatornák. Hűtőipar, 57 (3) 5-7 p.
8. Losó, V., Hegyi, A. (2010): Aromakerekek szerepe és jelentősége a
termékfejlesztésben és a kutatásban, fontosságuk a Hűtőipar számára. 58
(3).
CONFERENCE PUBLICATIONS
International Conference Proceedings:
1. V. Losó, A. Gere, A. Györey, Z. Kókai, L. Sipos (2012): Comparison of
the performance of a trained and an untrained sensory panel on
sweetcorn varieties with the PanelCheck software. Applied Studies in
Agribusiness and Commerce, (1-2) 77-83.
2. L. Sipos, V. Losó (2008): Mineral water consumption habits of
university students with conjoint analysis. Hódmezővásárhely. April. 24.
2008. Review on Agriculture and Rural Development. Scientific Journal
of University of Szeged, Faculty of Agriculture 3 (1). With CD issue.
ISSN 1788-5345.
3. L. Sipos, V. Losó (2008): Popularity of mineral water in Hungary -
secondary analysis based on primary data. Hódmezővásárhely. April. 24.
2008. Review on Agriculture and Rural Development. Scientific Journal
of University of Szeged, Faculty of Agriculture 3 (1). With CD issue.
ISSN 1788-5345.
4. V. Losó, É. Hajnal, L. Sipos, Z. Kókai, G. Székely, K. Kollár-Hunek
(2010): Simulation methods in the optimization of the frozen supply
chain networks. 9th Wageningen International Conference on Chain and
Network Management. 26 May - 28 May 2010, Book of Abstracts:
P242, Wageningen, Netherland.
5. V. Losó, A. Gere, A. Györey, Z. Kókai, L. Sipos (2011): Comparison of
the performance of a trained and an untrained sensory panel on
sweetcorn varieties with the PanelCheck software. Second AGRIMBA-
AVA Congress, Dynamics of international cooperation in rural
development and agribusiness, 22-24 june, 2011. Wageningen,
Netherlands. 22. p.
6. D. Szöllősi, A. Gere, Z. Kovács, L. Sipos, Z. Kókai, V. Losó, A.
Györey, A. Fekete (2012): Analysis of flavoured mineral water by a
trained sensory panel and electronic tongue. XIII. Chemometrics and
Analytical Chemistry, 25-29 june, 2012, Budapest, Hungary.

26
7. Györey, A. Gere, V. Losó, L. Sipos, Z. Kókai (2012): Comparison of
novel panel evaluation methods on table margarine panel training data.
5th European Conference on Sensory and Consumer Research, 9-12
September, Bern, Switzerland.
8. A. Gere, A. Györey, V. Losó, A. Szőke, S. Kovács, Z. Kókai, L. Sipos
(2013): Comparison of mapping methods: PARAFAC and PCA in
horticultural and food sciences. 4th MoniQA International Conference,
26 February – 1 March, 2013, Budapest, Hungary.
Conference Proceedings In Hungarian
1. Losó, V., Kókai, Z., Füstös, Zs., Sipos, L. (2009): Csemegekukorica
fajták számítógéppel támogatott érzékszervi vizsgálata. 2009. október
28-30. Lippay János – Ormos Imre – Vas Károly, Tudományos
Ülésszak, p. 328-329. ISBN: 978-963-503-397-3
2. Kókai, Z., Losó, V., Sipos, L., Kollár-Hunek, K. (2009): Az érzékszervi
vizsgálatok informatikai támogatásának fejlesztése. 2009. október 28-30.
Lippay János – Ormos Imre – Vas Károly, Tudományos Ülésszak
3. Székely, G., Pecze, D., Losó, V., Sipos, L. (2009): Fenntartható zöldség-
és gyümölcsfogyasztás hazánkban. Fenntartható fogyasztás – a
növekedés határai konferencia, Szent István Egyetem, Gödöllő, 2009.
március 27.
4. Losó, V. (2009): Aromakerekek szerepe és jelentősége a
termékfejlesztésben és kutatásban. 2009. október 28-30. Lippay János -
Ormos Imre - Vas Károly, Tudományos Ülésszakra.
5. Székely, G., Pecze, D., Losó, V., Sipos, L. (2009): Zöldség- és
gyümölcsfogyasztás Magyarországon. 2009. október 28-30. Lippay
János - Ormos Imre - Vas Károly, Tudományos Ülésszakra.
6. Sipos, L., Losó, V., Gere, A., Kókai, Z. (2011): Varianciaanalízis
alkalmazása az érzékszervi vizsgálatokban. 2011. július 1. IX. Magyar
Biometriai, Biomatematikai és Bioinformatikai Konferencia. p. 69
7. Gere, A., Losó, V., Györey, A., Szabó, D., Sipos, L., Kókai, Z. (2013):
Élelmiszerek érzékszervi preferenciatérképezésének minőségbiztosítási
szempontjai. HUNGALIMENTARIA – „Kockázatbecslés, önellenőrzés,
élelmiszerbiztonság”, 2013. április 16-17.
Book:
1. Székely G., Sipos, L., Losó, V. (2009): FMCG marketing. Budapest,
Aula Kiadó, B/5 713 p. ISBN 978-963-9698-73-4