Competitiveness of District Cooling in Energy Efficient...
65
Competitiveness of District Cooling in Energy Efficient Supermarkets Master of Science Thesis within the Sustainable Energy Systems programme PETER FILIPSSON Department of Energy and Environment Division of Building Services Engineering CHALMERS UNIVERSITY OF TECHNOLOGY Göteborg, Sweden 2011 Master Thesis 2011:02
Transcript of Competitiveness of District Cooling in Energy Efficient...

Competitiveness of District Cooling in
Energy Efficient Supermarkets
Master of Science Thesis within the Sustainable Energy Systems programme
PETER FILIPSSON
Department of Energy and Environment
Division of Building Services Engineering
CHALMERS UNIVERSITY OF TECHNOLOGY
Göteborg, Sweden 2011
Master Thesis 2011:02


REPORT NO. 2011:02
Competitiveness of District Cooling in
Energy Efficient Supermarkets
PETER FILIPSSON
Department of Energy and Environment
Division of Building Services Engineering
CHALMERS UNIVERSITY OF TECHNOLOGY
Göteborg, Sweden 2011

Competitiveness of District Cooling in Energy Efficient Supermarkets
PETER FILIPSSON
© PETER FILIPSSON, 2011
Master Thesis 2011:02
Department of Energy and Environment
Division of Building Services Engineering
Chalmers University of Technology
SE-412 96 Göteborg
Sweden
Telephone: + 46 (0)31-772 1000
Chalmers Reproservice
Göteborg, Sweden 2011
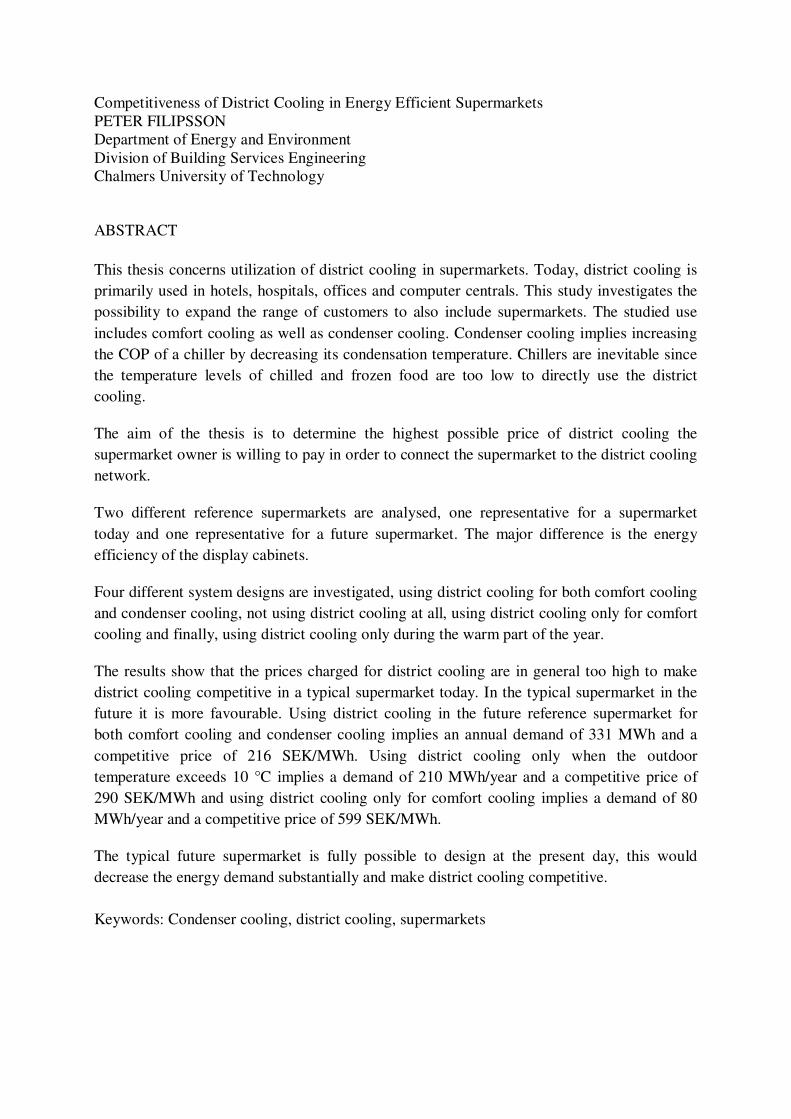
Competitiveness of District Cooling in Energy Efficient Supermarkets
PETER FILIPSSON
Department of Energy and Environment
Division of Building Services Engineering
Chalmers University of Technology ABSTRACT
This thesis concerns utilization of district cooling in supermarkets. Today, district cooling is
primarily used in hotels, hospitals, offices and computer centrals. This study investigates the
possibility to expand the range of customers to also include supermarkets. The studied use
includes comfort cooling as well as condenser cooling. Condenser cooling implies increasing
the COP of a chiller by decreasing its condensation temperature. Chillers are inevitable since
the temperature levels of chilled and frozen food are too low to directly use the district
cooling.
The aim of the thesis is to determine the highest possible price of district cooling the
supermarket owner is willing to pay in order to connect the supermarket to the district cooling
network.
Two different reference supermarkets are analysed, one representative for a supermarket
today and one representative for a future supermarket. The major difference is the energy
efficiency of the display cabinets.
Four different system designs are investigated, using district cooling for both comfort cooling
and condenser cooling, not using district cooling at all, using district cooling only for comfort
cooling and finally, using district cooling only during the warm part of the year.
The results show that the prices charged for district cooling are in general too high to make
district cooling competitive in a typical supermarket today. In the typical supermarket in the
future it is more favourable. Using district cooling in the future reference supermarket for
both comfort cooling and condenser cooling implies an annual demand of 331 MWh and a
competitive price of 216 SEK/MWh. Using district cooling only when the outdoor
temperature exceeds 10 °C implies a demand of 210 MWh/year and a competitive price of
290 SEK/MWh and using district cooling only for comfort cooling implies a demand of 80
MWh/year and a competitive price of 599 SEK/MWh.
The typical future supermarket is fully possible to design at the present day, this would
decrease the energy demand substantially and make district cooling competitive.
Keywords: Condenser cooling, district cooling, supermarkets


Preface
This work is the concluding part of my master studies in Sustainable Energy Systems at Chalmers
University of Technology. The work was carried out at the department of district cooling at Göteborg
Energi during April – October 2010. The study is made in collaboration with a doctoral programme
about energy efficient systems and suitable indoor climate in supermarkets at SP Technical Research
Institute of Sweden.
I would like to express my gratitude to everyone who has supported me or in any other way
contributed to this thesis. Thank you Anna Svernlöv, manager at the department of district cooling at
Göteborg Energi, for giving me this opportunity and providing me an ideal working environment.
I would also like to thank all employees at the department of district cooling at Göteborg Energi for
always being helpful and supportive. Thank you Ulla Lindberg, Lic.Eng. at SP Technical Research
Institute of Sweden, for great guidance and for sharing precious knowledge about energy systems in
supermarkets. Finally, I would like to thank my examiner Professor Per Fahlén for precious input and
support.
Göteborg, October 2010
Peter Filipsson

Table of Contents
1 Introduction 1
1.1 Background 1
1.2 Purpose and Aim of the Study 1
1.3 Method and Limitations 2
1.4 Outline of the Report 2
2 Energy Use in Supermarkets 3
2.1 The Heat Balance of a Building 4
2.2 Display Cabinets 4
2.3 The Vapour Compression Process 6
2.4 Supermarket Refrigeration System 7
2.4 District Cooling 8
2.5 Condenser Cooling 8
2.6 Condenser Heat Recovery 9
2.7 Trends in Energy Use in Supermarkets 10
3 The Reference Supermarkets 13
3.1 The Supermarket of 2010 14
3.2 The Supermarket of 2030 15
3.3 Calculations 16
4 Alternative System Designs 21
4.1 Selection of Components 21
4.2 Alternative 1 22
4.3 Alternative 2 23
4.4 Alternative 3 26
4.5 Alternative 4 28
5 Results 31
5.1 Energy Use 31
5.2 Economic Comparison 33
5.3 Sensitivity Analysis 34
6 Discussion 41
7 Conclusions 45
8 References 47
Appendix A – Humid Air 51
Appendix B – Latent Cooling Load 52
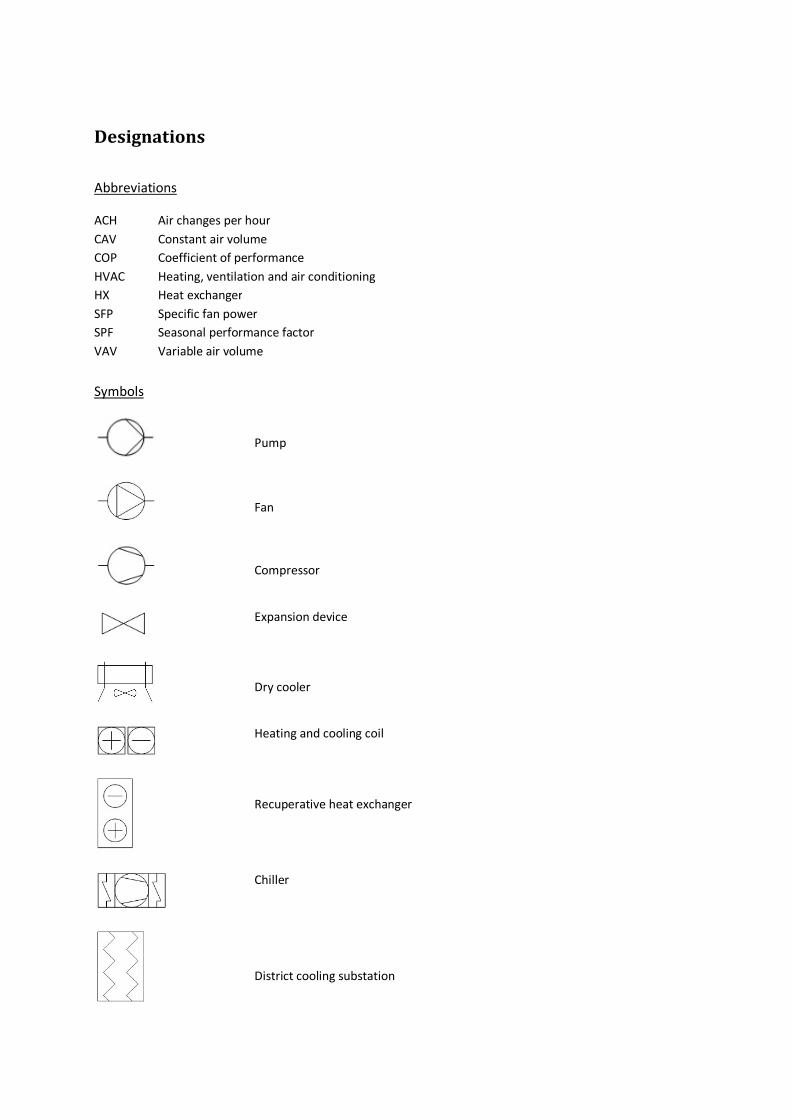
Designations
Abbreviations
ACH Air changes per hour
CAV Constant air volume
COP Coefficient of performance
HVAC Heating, ventilation and air conditioning
HX Heat exchanger
SFP Specific fan power
SPF Seasonal performance factor
VAV Variable air volume
Symbols
Pump
Fan
Compressor
Expansion device
Dry cooler
Heating and cooling coil
Recuperative heat exchanger
Chiller
District cooling substation

Nomenclature
� Area [m2] � Investment cost [SEK] � Energy price [SEK/MWh] �� Specific heat capacity [J/kg∙K] � Net present value factor [-] � Discount rate [-] � Heat transfer coefficient [W/K] � Length [m] Economic life [years] ∆� Pressure drop [Pa] � Energy [J] � Power [W] � Annual increase of energy price [-] � Specific power [W/m] � Heat of vaporization [J/kg] � Temperature [K] � Temperature [°C] � Volumetric flow [m3/s] � Electric power [W] ∆� Change of humidity ratio [kgwater/kgair] � Cooling load correction factor due to indoor humidity [-] � Efficiency [-] �� Carnot efficiency [-] � Density [kg/m3] � Relative humidity [-]
Subscripts
a air
cc comfort cooling
DC district cooling
DH district heating
el electricity
h heat
HR heat recovery
in indoor
inf infiltration
int internal
max maximum
out outdoor
rec recovery
s supply
tr transmission
v vapour
vent ventilation
1 Hot side of a chiller (e.g. �� denotes the condensation temperature)
2 Cold side of a chiller (e.g. ���� denotes the coefficient of performance in cooling mode)
Additional subscripts are used, but they are considered self explanatory.

Abbreviations used to denote streams in Figure 15, Figure 18, Figure 20 and Figure 22
Cond. Refrigerant in the condensers Cond. (C) Refrigerant specifically in the condensers of the chilled-food chillers Cond. (F) Refrigerant specifically in the condensers of the frozen-food chillers CC Condenser coolant (a secondary coolant with condensers as only heat source) DC District cooling water OA Outdoor air passing the dry cooler SC Secondary coolant VA Ventilation air


1
1 Introduction
1.1 Background
The use of district cooling in Sweden has grown steadily since the first commercial plant was taken
into operation in 1992. District cooling is primarily used for air conditioning and cooling of industrial
processes and computer centrals.
Estimations show that supermarkets stand for 3 - 5 % of the total use of electricity in industrialized
countries (Arias et al. 2010[4]). In Sweden in 2009, that corresponds to 4.2 – 6.9 TWh (The Swedish
Energy Agency, 2010b[25]). Around 45 % of the electricity use in a typical Swedish supermarket is due
to food refrigeration. A typical open vertical display cabinet of 5 m consumes as much electricity as a
Swedish electrically heated detached family house annually. The use of electricity in a vapour
compression chiller is directly related to the difference between the condensation temperature and
the evaporation temperature. The common practice today is to reject the condenser heat in dry
coolers located outside the supermarket, or to recover the condenser heat in a heat recovery system
connected to the air conditioning system. By rejecting the condenser heat to district cooling water, a
low and steady condensation temperature is achieved which may lead to a lower consumption of
electricity.
Different ways to reject heat from the condensers of chillers in supermarkets have been investigated
by Haglund Stignor (2003)[15]. The investigation was done with respect to costs, use of electricity and
environmental impact. The conclusion was that the district cooling must be very cheap in order to
compete with the other alternatives.
A technical procurement competition carried out in 1997 showed that there is a great potential in
making display cabinets more energy efficient. The present development in energy use in
supermarkets may make district cooling a more beneficial alternative. One big drawback with the
district cooling alternative is that the possibility to recover the condenser heat is lost. But more
energy efficient cooling cabinets will leak less cold air, and therefore reduce the need for heat and
increase the need for comfort cooling.
1.2 Purpose and Aim of the Study
The purpose of this Master thesis is to study how the profitability of connecting a supermarket to the
district cooling network will evolve the coming decades. In addition to study the present situation a
future scenario is studied. The most important difference between the cases is the energy efficiency
of the display cabinets.
The aim of this Master thesis is to determine the highest possible price the supermarket owner is
willing to pay for district cooling in order to connect the supermarket to the district cooling network,
today and in the future. This price will henceforth be referred to as the competitive price of district
cooling. It shall also be determined to what purpose the district cooling should be used and how
much.
2
1.3 Method and Limitations
By reviewing previous work on energy use in supermarkets a reference supermarket is defined. By
studying the present trends in this area a prediction about a typical supermarket in the year 2030 is
made. The defined parameters make it possible to calculate the demand for energy.
The next step is to elaborate a number of alternative solutions to meet the demand for energy in the
reference supermarket. Calculations are made in order to decide the need for externally added
energy for each alternative. All calculations are made using the numerical calculation programme
Matlab. With information about costs for all required components a fair comparison can be made.
This will end up with a highest possible price the supermarket owner can be willing to pay in order to
connect the supermarket to the district cooling network. Since this study deals with many uncertain
parameters, a thorough sensitivity analysis will be carried out.
The study does not include any measurements made in real supermarkets. Nor will it end up with any
detailed technical solutions regarding control systems etc. Geographically, the study is limited to
comprise a supermarket in Göteborg. Göteborg is located on the southwest coast of Sweden and has
a maritime climate. The weather data used in this study implies an annual mean temperature of
9.7 °C. Climatic variations make it possible to achieve different results in other regions. Regarding the
production of district cooling only Göteborg Energi´s production is studied. Only the sales area of the
supermarket is studied. Regarding the refrigeration system, a completely indirect system is studied.
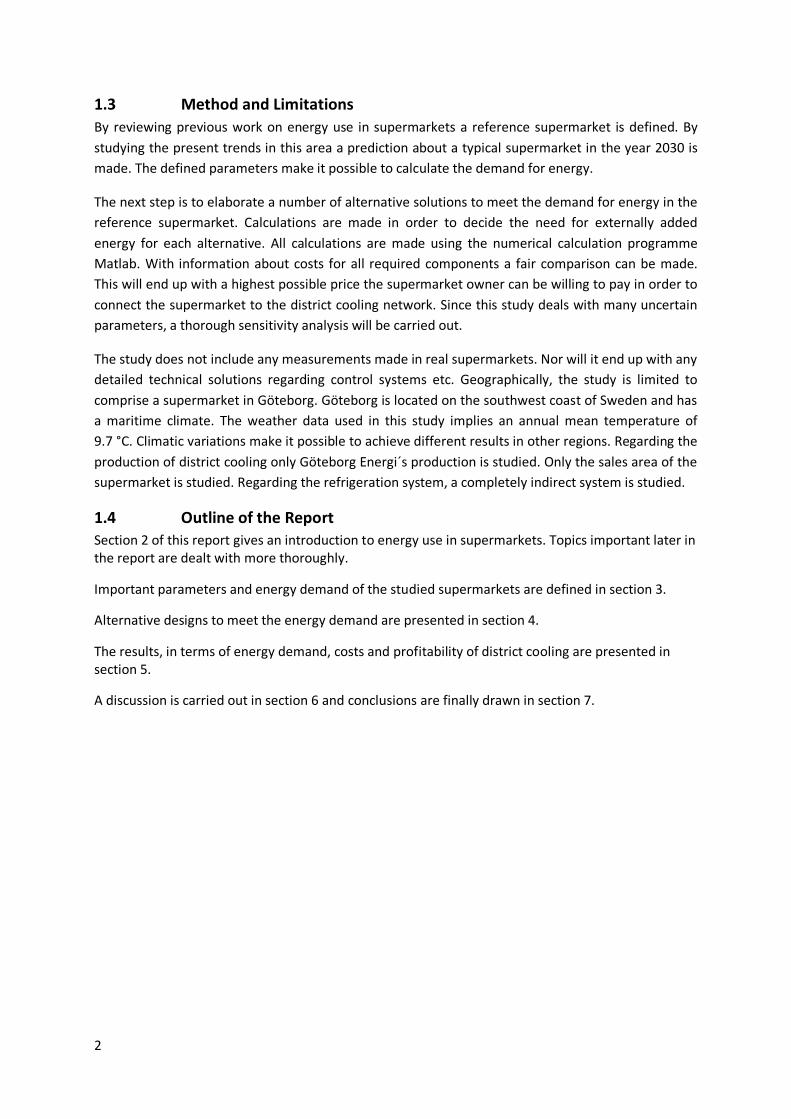
1.4 Outline of the Report
Section 2 of this report gives an introduction to energy use in supermarkets. Topics important later in the report are dealt with more thoroughly.
Important parameters and energy demand of the studied supermarkets are defined in section 3.
Alternative designs to meet the energy demand are presented in section 4.
The results, in terms of energy demand, costs and profitability of district cooling are presented in section 5.
A discussion is carried out in section 6 and conclusions are finally drawn in section 7.

3
2 Energy Use in Supermarkets
The energy system of a supermarket can be observed as several subsystems interacting with each
other, e.g. refrigeration system, cabinet system and HVAC system (Arias 2005, p. 104[2]). Figure 1
illustrates how the subsystems are interrelated with each other. To exemplify the interrelations
between the subsystems one can assume that the outdoor temperature decreases. A decrease of
outdoor temperature will very likely cause a decrease of indoor relative humidity. Dryer indoor air
decreases the losses and consequently the cooling load in the display cabinets. If the supermarket
uses a condenser heat recovery system there will be less heat to recover. The need for external heat
will consequently increase both directly due to higher transmission and infiltration losses through the
building envelope and indirectly due to less heat to recover in the condenser heat recovery system.
Figure 1 Model of the different subsystems in a supermarket (Arias 2005, p. 105[2]
)
The performance of the display cabinets influences the indoor climate to a large extent. Display
cabinets are major emitters of cold air. This has an impact on the HVAC system and causes an
increased demand for heating. The leakage of cold air also causes large vertical temperature
gradients in front of the cabinets, which impairs the thermal comfort (Lindberg 2009[18]). On the
other hand, more energy efficient display cabinets will cause a higher demand for comfort cooling,
especially during summer.
Supermarkets are major consumers of electricity. An average Swedish supermarket uses around
320 kWhel/m2 annually (The Swedish Energy Agency 2010a, p. 29[24]). However, the cost of energy is
only one percent of the overall cost for a supermarket, but halving the cost of energy results in an
increase of profits by 17 % (Arias et al. 2004, p. 7[3]).The refrigeration system and lighting are by far
the largest causes for the use of electricity. This is illustrated in Figure 2.

4
Figure 2 Distribution of electricity use in an average Swedish supermarket. (The Swedish Energy Agency 2010a, p. 29[24]
)
2.1 The Heat Balance of a Building
The heat balance of a building is influenced by three groups of factors:
• The building envelope
• The outdoor climate
• The activities in the building
The building envelope is defined by its area, the heat transmission coefficient, the air infiltration rate
and the heat storage capacity of the building structure.
The most important factors of the outdoor climate are for a supermarket the temperature and the
humidity, but the solar radiation and wind speed does also influence the heat balance.
The activities in the building determine how much internally generated heat there is. This includes
heat from people, lighting, equipment, heat emitted or absorbed by the building structure and heat
from solar irradiation. In contrast to other commercial buildings, supermarkets often have a very low
net amount of internally generated heat. The reason is cold display cabinets which absorb a lot of
heat. As in all commercial buildings, the internal generation of heat differs a lot between daytime
and nighttime. It is important to take this into consideration when making calculations.
To be able to keep the indoor climate within some comfort requirements, the building needs a HVAC
system. The main tasks of the HVAC system are to control the temperature, humidity and cleanliness
in the building. This is achieved by conditioning the air supplied into the building. The HVAC system
may include a heat exchanger located between the supply air and the exhaust air. To further
decrease the need for heat, the system can recover heat from the condensers in the refrigeration
system.
2.2 Display Cabinets
Display cabinets are an important part of the energy system of a supermarket. They can differ quite a
lot regarding temperature levels, accessibility, loading of goods, type of opening, cooling distribution
etc (Fahlén 2000[11]). In this study, vertical chilled-food cabinets and horizontal frozen-food gondolas
Food refrigeration (45%)
Lighting (28%)
Other (9%)
Fans (7%)
Pumps (4%)
Heating including heat pumps (4%)
Comfort cooling (1%)Unknown (2%)

5
are included. Vertical cabinets are very common due to the possibility to expose a large amount of
goods in a small floor area. In cabinets without doors, the cold air in the cabinet is separated from
the ambient air by an air curtain. Studies have been done to understand and improve the air curtains,
but it is very hard to design an air curtain which is not disturbed by moving people, ventilation air,
differences in cabinet loading etc. The cooling load in an open vertical display cabinet is linearly
proportional to the difference in specific enthalpy between the air in the cabinet and the surrounding
air (Axell 2002, p. 106[5]).
There are many methods to decrease the energy demand in a display cabinet. One efficient measure
is night covering. Lindberg et al. (2010)[19] has shown that a covered vertical chilled-food cabinet has
67 % lower cooling load. Mounting doors or lids on cabinets and gondolas is another efficient
measure to decrease the infiltration losses. Lindberg et al. (2010)[19] has investigated how the direct
electric input, the heat extraction rate and the food temperatures are influenced by mounting doors
on vertical display cabinets. The results show that the heat extraction rate decreases by 66 % at
daytime operation and by 53 % at nighttime operation when mounting doors on the cabinet. These
percentages are valid for a door opening frequency of 10 openings per hour. If the frequency is
increased to 30 openings per hour the reduction in heat extraction rate is 61 % during daytime and
46 % during nighttime. In addition to lower heat extraction rate, the use of doors made the
temperature distribution in the cabinet much more uniform and made it possible to increase the
brine inlet temperature from -8 ˚C to +2 ˚C.
The cooling load in a display cabinet is both due to sensible heat and latent heat. The sensible heat
load is due to the necessary change in temperature while the latent heat load is due to the fact that
some moisture condenses when cooling the air. This phenomenon makes the cooling load higher in
the summer, even if the indoor temperature is kept constant all year around, since indoor air is
almost always more humid during the summer. The magnitude of this is presented in Figure 3.
Figure 3 Cooling load as a function of the ambient humidity (Arias 2005, p. 124[2]
)
The cooling load in a display cabinet is on one hand due to difference in enthalpy between the air in
the cabinet and the ambient air and on the other hand due to internal loads in the cabinet. The
magnitude of the different contributions to the total load differs quite a lot in a vertical chilled-food
cabinet and a horizontal frozen-food gondola. The contributions to the total cooling load, � C, at an
ambient temperature of 25 °C are presented in Table 1, and illustrated in Figure 4.
0 20 40 60 80 1000.4
0.6
0.8
1
1.2
1.4
Indoor relative humidity [%]
Coolin
g load c
orr
ection f
acto
r [-
]
Vertical chilled-food cabinet
Horizontal frozen-food gondola

6
Table 1 The heat balance in display cabinets (Arias 2005[2]
& Fahlén 2000[11]
)
Vertical chilled-food cabinet Horizontal frozen-food gondola
Heat transfer through conduction � 1 7 % 11 %
Heat transfer through infiltration � 2 64 % 23 %
Heat transfer through radiation � 3 11 % 45 %
Heat from internal lighting � 4 11 % 0 %
Heat from fans and heating wires � 5 7 % 17 %
Heat from defrost equipment � 6 0 % 4 %
Figure 4 Energy balances of a vertical chilled-food cabinet and a horizontal frozen-food gondola (Fahlén 2000[11]
)
The energy demand in a horizontal gondola is much less than in a vertical cabinet. The reason is that
the cold and heavy air in the gondola is protected from pouring out by the walls of the gondola. In
addition to that, it is rather common to mount lids on horizontal gondolas.
2.3 The Vapour Compression Process
Since the supply temperature of the brine in display cabinets is kept well below 6 °C, district cooling
cannot directly be used to cool the food. It is therefore inevitable to use a chiller. This can be done in
a vast amount of configurations but almost all include a vapour compression process. The vapour
compression chiller makes use of the fact that the saturation temperature of a fluid is dependent on
its pressure. With a compressor and an expansion device the chiller can absorb heat at a low
temperature (in the evaporator) and reject the heat at a higher temperature (in the condenser). The
COP represents the efficiency of the chiller and is defined as the relation between achieved cooling
and electrical work required (it is common to use the term COP2 to refer to this definition. All COP
presented in this study refer to this definition). The COP increases when the difference between
condensation and evaporation temperature decreases. The relation is presented in Figure 5. In
modern supermarkets, the chillers are operated with a floating condensation temperature. It means
that the condensation temperature is adjusted according to the outdoor temperature. This yields a
high COP when it is cold outside and a lower COP when it is warm outside.

7
Figure 5 COP2 as a function of the condensation temperature (at a Carnot efficiency of 0,5)
2.4 Supermarket Refrigeration System
Refrigeration systems in supermarkets can be designed in several different ways. Some examples are:
• Direct systems (distributed or not)
• Completely indirect systems
• Partially indirect systems
• Different kinds of cascade systems
This study involves completely indirect systems. A schematic of such system is presented in Figure 6.
Figure 6 Schematic of a completely indirect refrigeration system
0 10 20 30 400
2
4
6
8
10
12
14
Condensation temperature
CO
P2
T2=-10 (Chilled-food cabinet)
T2=-35 (Frozen-food gondola)
Pump
Compressor
Expansion device
Dry cooler
Pump
Refrigeration system
Chillers(Vapour compression
process)Condenser
Evaporator
Horizontal gondolaVertical display
cabinet
Bri
ne
Re
frig
era
nt
Co
nd
en
se
rco
ola
nt

8
In a direct system, the condensation occurs in roof-mounted condensers and the evaporation occurs
in the display cabinets. The advantages with an indirect system are less amount (and leakage) of
refrigerant, more efficient defrosting, easier load-shedding and better possibilities to recover
condenser heat. The disadvantages with indirect systems are more pump work, higher investment
cost and lower efficiency. In addition to the cabinets and gondolas, cooling is also needed in cold
storerooms.
2.4 District Cooling
In a district cooling system, water is chilled in a central plant and distributed to customers through a
network of pipes. A big advantage is that the cooling is produced in a large plant with high efficiency.
In Göteborg, the river Göta älv is used to cool the district cooling water during the cold part of the
year, this is known as free cooling. During the warm part of the year, absorption heat pump
technology is used. It makes use of waste heat to produce cooling, which is very beneficial since the
demand for district heating is usually very low in the summer. Vapour compression technology is
used when the capacity of the free cooling and absorption technology is insufficient. The
temperature of the delivered cold water is 6 °C and the return temperature should be 16 °C.
2.5 Condenser Cooling
As presented in Figure 5, a low condensation temperature generates a high COP. A simple analysis
can be made in order to determine the value of the cooling used to increase the COP of a chiller. A
cooling load, Q �, is supplied by a chiller cooled by free outdoor air at a certain efficiency, ���� !. By
cooling the condenser with district cooling water, the same cooling load can be supplied at another
efficiency, ���"#. With a given price for electricity, C%&, it is possible to determine which price for
district cooling, C'(, that equalizes the cost of energy of the two cases. The cost of energy needed in
the case with air-cooled condenser equals
�)* ∙ � ����� ! (eq. 2.1)
The cost of energy needed for the case with a condenser cooled by district cooling is expressed as
�)* ∙ � ����"# + �"# -� � + � ����"#. (eq. 2.2)
By setting the cost of energy for the two cases equal the price of district cooling is obtained as
�"# = �)* 0���"#���� ! − 1���"# + 1 3
(eq. 2.3)
This relation is illustrated in Figure 7.
9
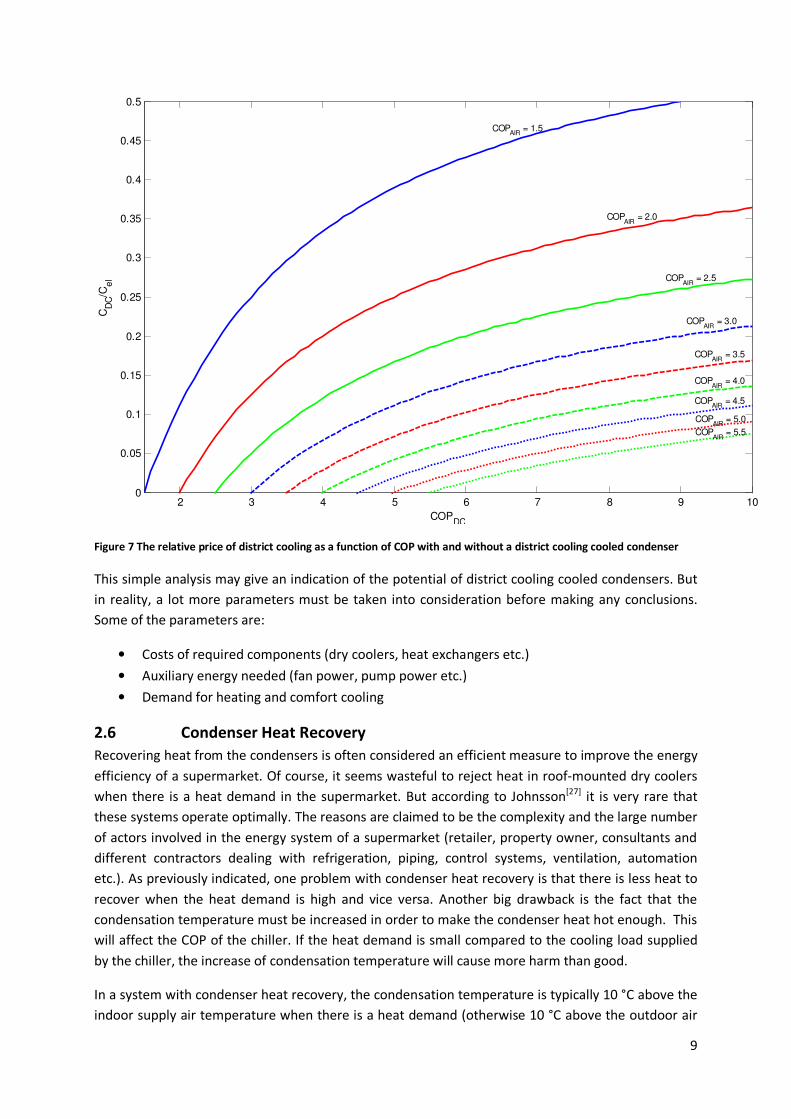
Figure 7 The relative price of district cooling as a function of COP with and without a district cooling cooled condenser
This simple analysis may give an indication of the potential of district cooling cooled condensers. But
in reality, a lot more parameters must be taken into consideration before making any conclusions.
Some of the parameters are:
• Costs of required components (dry coolers, heat exchangers etc.)
• Auxiliary energy needed (fan power, pump power etc.)
• Demand for heating and comfort cooling
2.6 Condenser Heat Recovery
Recovering heat from the condensers is often considered an efficient measure to improve the energy
efficiency of a supermarket. Of course, it seems wasteful to reject heat in roof-mounted dry coolers
when there is a heat demand in the supermarket. But according to Johnsson[27] it is very rare that
these systems operate optimally. The reasons are claimed to be the complexity and the large number
of actors involved in the energy system of a supermarket (retailer, property owner, consultants and
different contractors dealing with refrigeration, piping, control systems, ventilation, automation
etc.). As previously indicated, one problem with condenser heat recovery is that there is less heat to
recover when the heat demand is high and vice versa. Another big drawback is the fact that the
condensation temperature must be increased in order to make the condenser heat hot enough. This
will affect the COP of the chiller. If the heat demand is small compared to the cooling load supplied
by the chiller, the increase of condensation temperature will cause more harm than good.
In a system with condenser heat recovery, the condensation temperature is typically 10 °C above the
indoor supply air temperature when there is a heat demand (otherwise 10 °C above the outdoor air
2 3 4 5 6 7 8 9 100
0.05
0.1
0.15
0.2
0.25
0.3
0.35
0.4
0.45
0.5C
DC/C
el
COPDC
COPAIR
= 1.5
COPAIR
= 2.0
COPAIR
= 2.5
COPAIR
= 3.0
COPAIR
= 3.5
COPAIR
= 4.0
COPAIR
= 4.5
COPAIR
= 5.0
COPAIR
= 5.5

10
temperature) (Johnsson[27]). Assume a cooling load, � �, and a heat demand, � 4. When utilizing
condenser heat recovery, an efficiency, ���4!, is obtained and the electricity demand equals
� ����4! (eq. 2.4)
A system rejecting all heat in roof-mounted dry coolers, having an efficiency of ���� ! and an
electric heater with an efficiency of 100%, the total electricity demand equals
� ����� ! + � 4 (eq. 2.5)
The following inequality must hold in order to have lower electricity consumption in the system with
condenser heat recovery.
� ����� ! + � 4 > � ����4! (eq. 2.6)
By using the concept of Carnot coefficient of performance, equation 2.6 can be rewritten as
� 4� � > �6 − �789�� ∙ �� (eq. 2.7)
�� is the Carnot efficiency, �6 the indoor supply air temperature, �789 the outdoor air temperature
and �� the evaporation temperature expressed in kelvin. This implies a lower limit of the heating
demand in order to make heat recovery a better alternative than an electric heater. The higher the
heat demand is, the more beneficial it is to recover heat. But in addition to the lower limit of
equation 2.7, there is also an upper limit depending on the amount of available heat in the
condenser. Altogether, the constraints are expressed as
�6 − �789�� ∙ �� < � 4� � < 1 + �6 + 10 − ���� ∙ �� (eq. 2.8)
In theory, it is easy to have many chillers and be able to decide how many of them to recover heat
from and thereby controlling � �. This is rarely done efficiently in reality.
2.7 Trends in Energy Use in Supermarkets
There is a clear ambition among supermarket owners to use energy more efficiently. ICA aims at
cutting their direct and known emissions by 30 % to 2020, compared to 2006 (ICA AB 2010, p. 8[16]).
Axfood is planning to reduce the use of energy per square meter by 30 % until 2015 (Axfood 2010, p.
4[7]) and the Swedish Co-operative Union KF intends to decrease the use of electricity per sales area
by 30 % to 2020, compared to 2008 (KF 2010, p. 37[17]). These three actors cover 44 % of the
supermarkets in Sweden and 78 % of the total turnover (Ågren 2008[26]).

11
At the same time, more and more of the range of products are chilled and frozen food. The
consumption of deep frozen food in Sweden was 50.6 kg/capita in 2007 compared to 35.5 kg/capita
in 1995 and 26.2 kg/capita in 1985 (Börjesson red. 2008, p. 1[9]). There is also a trend towards more
use of electrical devices in supermarkets, e.g. ovens and roasters.
The specific use of electricity in Swedish supermarkets was increased by 8 % between 1990 and 2009
(The Swedish Energy Agency 2010a, p. 45[24]). This is presented in Figure 8.
Figure 8 Use of electricity in Swedish supermarkets in 1990 and 2009 (The Swedish Energy Agency 2010a[24]
)
The electricity consumed by lighting was increased from 72 kWh/m2 in 1990 to 79 kWh/m2 in 2009
despite the fact that new energy efficient lighting techniques emerged during this period. The
explanation is more illumination (more light in the supermarket) and extended opening hours. The
use of CAV ventilation systems in Swedish commercial premises decreased slightly from 81 % in 1990
to 76 % in 2009 at the expense of more VAV ventilation systems (The Swedish Energy Agency 2010a,
p. 48[24]).
A barrier for energy efficiency measures in supermarkets is the relation between the retailer and the
property owner. The heating cost for the supermarket can be fixed and included in the rent. Hence,
the retailer will not benefit from lower heating demand when installing energy efficient display
cabinets that spill less cold air. This phenomenon is called misplaced incentives and is a well known
barrier for energy efficiency in the real estate industry (Golove, W. & Eto, J. 1996, p. 9[14]).

12

13
3 The Reference Supermarkets
To be able to calculate the demand for energy and components two reference supermarkets are
defined; one model representative for a supermarket today and one representative for a
supermarket in 2030. The area, flow of customers and amount of display cabinets are based on
“Butik C” in Axell, Lindberg and Lidbom (2004)[6].
To make it easier to draw any conclusions about causes and effects some basic parameters are
assumed to be unchanged between 2010 and 2030, e.g. the dimensions of the supermarket, the flow
of customers and the outdoor climate. The data of outdoor climate originates from measurements
made in Göteborg by The Swedish Meteorological and Hydrological Institute in 2008. Note that 2008
is a leap year. The annual mean temperature in Göteborg in 2008 was 9.7 ˚C. The weather data, and
consequently all simulations made in this study, are made with a resolution of 3 hours.
The indoor temperature is always 20 ˚C. This simplification disregards the possibility to have
differentiated temperatures during daytime/nighttime and summertime/wintertime. The indoor
absolute humidity is assumed to equal the outdoor absolute humidity in the winter and to be 2
gwater/kgdry air less humid than the outdoor air in the summer. The difference is assumed to increase
linearly between winter and summer and the relation is obtained by studying figure 7.2 in Axell et al.
(2004, p. 50)[6]. Details regarding calculations of indoor relative humidity are available in Appendix A.
The average customer is assumed to stay 20 minutes, and five persons are working in the
supermarket. Every person is assumed to emit 144 W of sensible heat. The contribution of the sun to
the internal heat generation is neglected since supermarkets seldom have windows. Storage of heat
in the building structure is also neglected, since the mass of the building structure is small compared
to the volume of the supermarket.
Only the sales area is studied, it is 670 m2 and the flow of customers is 2744 people/day. The opening
hours are set to 07:30 – 22:30. These will henceforth be referred to as daytime, and 22:30 – 07:30
will be referred to as nighttime. The ventilation is achieved by a CAV system with different flow rates
during daytime and nighttime. The HVAC system includes a recuperative heat exchanger recovering
heat from the exhaust air.
It is assumed that 61.5 % of the cooling load in the cabinets and gondolas is sensible (Svensson 2006,
p. 13[22]). The dimensions of the supermarket are 34.7 m x 19.3 m x 3.15 m, but only the short side is
exposed to the outside air. However, the results are claimed to be applicable to a detached
supermarket as well since:
• The energy demands in a supermarket are very much influenced by the design of the HVAC
system and the activities in the building (i.e. internal generation of heat), and to a much
smaller extent by the properties of the building envelope.
• Detached supermarkets have better insulated outer walls than supermarkets integrated in
bigger buildings (The Swedish Energy Agency 2010a[24]).
A conceptual model of the reference supermarket is presented in Figure 9.

14
Figure 9 Schematic of the reference supermarket
3.1 The Supermarket of 2010
The values of building envelope transmission coefficients are obtained as an average of the
supermarkets studied by the Swedish Energy Agency (2010a) [24]. The infiltration rate is set to 0.2 ACH
during daytime and only 0.06 ACH during nighttime since the major part of the infiltration is assumed
to occur through gateways and open doors in the entrance.
The recuperative heat exchanger has a maximum temperature efficiency of 70 % and the ventilation
system operates at a specific fan power (SFP) of 2 kWs/m3 at daytime flow rate (SFP is proportional
to the square of the flow rate). The ventilation rate during daytime is set to 1.27 m3/s, this equals
the average maximum ventilation rate in the supermarkets studied by the Swedish Energy Agency
(2010a) [24] (1.9 l/s and m2). The ventilation rate is decreased by 50 % during nighttime.
The supermarket has a length of 44 m vertical chilled-food cabinet and 27 m horizontal frozen-food
gondola. The performance of the vertical cabinets is specified according to the laboratory
measurements made by Lindberg et al. (2010)[19]. The heat extraction rate equals 1804 W/m at
daytime operation and 592 W/m at nighttime operation (with night-curtains). The horizontal gondola
is assumed to have an average heat extraction rate of 321 W/m during daytime operation, and 224
W/m during nighttime operation. These values are produced by assuming a dimensioning cooling
load of 450 W/m at an ambient temperature of 25 °C (Fahlén, 2000[11]), a defrost rate of 5 hours per
day, a reduction of cooling load of 10 % due to the actual ambient temperature (Arias, 2005, p.
124[2]) and a cooling load reduction of 30 % due to night covering.
The heat generated within the horizontal frozen-food gondolas (lighting, fans, anti-sweat heaters and
defrost equipment) is assumed to be 23 % of the heat extraction rate (Arias 2005, p. 124[2]). In the
vertical chilled-food cabinets the internal generation of heat is assumed to be 12 % of the heat
extraction rate. This is quite far below the percentage stated in Table 1 even though that was
specified at higher ambient temperature. However, this assumption is more in accordance with
display cabinets studied in supermarkets in Gothenburg during September 2010 (12 % in this case
may imply a load of lighting of 145 W/m and fans/anti-sweat heaters of 70 W/m).
Chilled-food cabinetsand
frozen-food gondolas
touttrects
Recuperative heat exchanger
Sales area
Heat
Comfort cooling
Cooling for chilled and frozen food
Electricity for: -Lighting
-Pumps
-Fans
- Internal electricity equipment in display cabinets
-Other electric equipment (computers, ovens etc)

15
The required brine inlet temperature is set to -8 °C for the vertical cabinet and -33 °C for the
horizontal gondola. This is 2 °C above the evaporation temperatures stated in Fahlén (2000, pp. 32-
33)[11].
The amount of lighting equals 18.8 W/m2 during daytime and 3.4 W/m2 during nighttime. According
to the Swedish Energy Agency (2010a, p. 33 & p. 52)[24] the average installed amount of lighting in
the sales area of a supermarket is 18.8 W/m2 and 18 % of the lighting is switched on beyond the
opening hours. The supermarket comprises a bake-off oven of 7.6 kW used 3 hours per day and a
heated merchandiser of 1.8 kW used during daytime. There is 20 m plug-in cabinet emitting a net
amount of heat of 1041 W/m during daytime and 650 W/m during nighttime. This is the average
power input of all plug-in cabinets manufactured by Norpe AB. A plug-in cabinet is a display cabinet
with both condenser and evaporator enclosed in the cabinet frame. Since the amount of heat
emitted in the condenser equals the heat absorbed in the evaporator plus the electricity supplied to
the cabinet it can be treated as any other electric equipment (generation of heat equals supply of
electricity).
3.2 The Supermarket of 2030
Of course it is not possible to know today what a supermarket in 2030 will look like. But by looking at
recent trends a possible scenario can be defined.
The results from Lindberg et al. (2010)[19] are used to predict the performance of the vertical
cabinets. The heat extraction rate in the vertical cabinets is 616 W/m during daytime and 280 W/m
during nighttime. The heat extraction rate of the horizontal gondolas is assumed to be decreased by
30 % compared to 2010. The required brine inlet temperature is set to +2 °C for the vertical cabinet
and -33 °C for the horizontal gondola.
The heat generated within the vertical chilled-food cabinets is assumed to be 17 % of the heat
extraction, in accordance with the cabinet studied by Lindberg et al. (2010)[19]. Corresponding
percentage is 23 % in the horizontal frozen-food gondolas (Arias 2005, p. 124[2]).
Compared to 2010, the supermarket of 2030 is assumed to have 10 % less infiltration, 5 % less
transmission losses and 5 % more display cabinets. The ventilation system is still CAV but the SFP is
decreased to 1.25 kWs/m3 during daytime flow rate. In order to be able to remove the surplus of
heat without too low supply air temperatures, the ventilation rate during daytime is doubled
compared to 2010. The maximum efficiency of the recuperative heat exchanger is increased to 75 %.
The Swedish Energy Agency (2010a, p. 56)[24] anticipates the potential energy savings of lighting in
commercial premises to 11 kWh/m2 annually at an average uptime of 4000 hours per year. It is
assumed that the potential savings are proportional to the uptime which implies an amount of
lighting of 15.9 W/m2 during daytime and 2.9 W/m2 during nighttime (the lighting uptime is 6460
hours per year in this study). Any increase of the amount of plug-in cabinets is assumed to be
compensated by their energy efficiency improvements. Bigger bake-off oven and heated
merchandiser are used, the power of these are 9.4 kW and 2.6 kW respectively.
The parameters defining the reference supermarkets are presented in Table 2.

16
Table 2 Parameters of the reference supermarkets
2010 2030
Daytime
(Open)
Nighttime
(Closed)
Daytime
(Open)
Nighttime
(Closed)
Supermarket area [m²] 670 670
Flow of customers [people/day] 2744 0 2744 0
Vertical chilled-food cabinet [m] 44 46
Average heat extraction rate in the
chilled-food cabinets [W/m]
1804 592 616 280
Horizontal frozen-food gondola [m] 27 28
Average heat extraction rate in the
frozen-food gondolas at [W/m]
321 224 224 157
Ventilation system CAV and direct recuperative
heat exchanger
CAV and direct recuperative
heat exchanger
Temperature efficiency of HX [%] 70 75
Ventilation rate [m³/s] 1.27 0.64 2.55 0.64
SFP at daytime air flow rate [kWs/m3] 2.0 1.25
Infiltration rate [m³/s] 0.12 0.04 0.11 0.03
Heat transmission coefficient, outer
wall [W/m²K]
0.56 0.44
Heat transmission coefficient, floor
[W/m²K]
0.16 0.16
Heat generated by lighting, plug-in
cabinets, ovens and heated
merchandisers[W/m²]
54.9 22.8 53.6 22.3
3.3 Calculations
With information about the reference supermarkets, it is possible to calculate the demands for the
four categories of energy presented in Figure 9. All calculations are made in the numerical calculation
programme Matlab.
Comfort cooling and heating
The total internal generation of sensible heat in the supermarket can be expressed as
� =>9 = � �)7�*) + � *=?@96/)B8=�C)>9 + � @)D9,�DF=>)96 − � �77*,�DF=>)96 (eq. 3.1)
� �)7�*) is the sensible heat emitted from people, � *=?@96/)B8=�C)>9 is sensible heat emitted from
lighting, plug-in cabinets, ovens etc. (this also includes 50 % of the heat emitted by the ventilation
fans). � @)D9,�DF=>)96 is heat from internal heat sources in the conventional cabinets and gondolas and � �77*,�DF=>)96 is the sensible heat absorbed by the display cabinets and gondolas. The internal
generation of heat is presented in Figure 10.

17
Figure 10 Internal generation of heat
Heat is transferred through the building envelope by infiltration and by transmission. According to
Nilsson (2003)[20], these losses can be expressed as
� =>G = � =>G ∙ � ∙ �� ∙ H�=> − �789I = �=>G ∙ H�=> − �789I (eq. 3.2)
� 9J = K LM ∙ �M ∙ H�=> − �789I = �9J ∙ H�=> − �789I (eq. 3.3)
L is the heat transmission coefficient of the building envelope, � =>G is the rate of infiltration, A is the
area exposed to the outdoor, �=> and �789 are the indoor and outdoor temperature respectively and � and �� are the density and specific heat capacity of air.
When the internal generation of heat and the heat losses are known, the required supply air
temperature is calculated with an energy balance according to
�6 = �=> − N OPQRSTQUVTOPWX∙H9OPR9YZQI[ \]PQ ∙^∙�_ (eq. 3.4)
� `)>9 is the rate of ventilation. The recuperative heat exchanger located between the supply and
exhaust air streams recovers heat from the exhaust air and changes the temperature of the supply
air from �789 to �J)� , which is expressed as
�J)� = �789 + �a ∙ H�=> − �789I (eq. 3.5)

18
The temperature efficiency of the heat exchanger, �a, is controlled between zero and its maximum
value in order to minimize the energy demand.
With �6 and �J)� known, the demand for heating is calculated as
� @ = �`)>9 ∙ H�6 − �J)�I when �J)� < �6 (eq. 3.6)
�`)>9 equals � `)>9 ∙ � ∙ ��. When �J)� exceeds �6, there is a demand for comfort cooling. Since
condensation will occur when the temperature of the surface of the cooling coil is below the
dewpoint of the air, this latent load must be taken into account. In accordance with Nilsson (2003)[20],
the demand for comfort cooling is calculated as
� �� = �`)>9 ∙ H�J)� − �6I + � ∙ � ̀ )>9 ∙ S�D ∙ ∆�D + ��,` ∙ H�J)� − �6I ∙ ∆�DX when �J)� < �6 (eq. 3.7)
�D = enthalpy of vaporization (= 2500000 J/kg) ∆�D = change of airflow humidity ratio (kg/kg) ��,` = specific heat capacity of water vapour (=1900 J/kgK)
The first term of equation 3.7 represents the sensible cooling load while the second term represents
the latent cooling load, i.e. the heat that is released when moisture in the air condenses. When
calculating ∆�D, it is assumed that the temperature of the surface of the cooling coil is 8 °C.
Calculations regarding ∆�D are presented in Appendix B.
When �J)� equals �6, there is no need for additional heating or cooling. By plotting �6, �J)� , �789 and �=> in a duration diagram, the demand for heating and sensible cooling is efficiently illustrated
(Nilsson 2003[20]). This is presented in Figure 11 and Figure 12. The area between �6 and �J)� is
proportional to the amount of energy needed and the vertical distance between the lines is
proportional to the power. However, it is important to remember that the ventilation flow rate
differs in the four cases (see Table 2) and the required heat to change the supply air temperature is
proportional to the flow rate. Note that these diagrams do not say anything about the latent cooling
load.
Figure 11 Duration curves of the heat balance for the supermarket of 2010
0 2745 5490-10
0
10
20
30
Daytime 2010
Te
mpera
ture
[oC
]
Hours
tout
(Outdoor temperature) tin
(Indoor temperature) ts (Supply air temperature) t
rec (Temperature downstream of HX)
0 1647 3294-10
0
10
20
30
Nighttime 2010
Te
mpera
ture
[oC
]
Hours
tout
(Outdoor temperature) tin
(Indoor temperature) ts (Supply air temperature) t
rec (Temperature downstream of HX)

19
Figure 12 Duration curves of the heat balance for the supermarket of 2030
Cooling for the refrigeration of food
The cooling (extraction of heat) used in the vertical cabinets and horizontal gondolas is expressed as
� = � ∙ � ∙ � (eq. 3.8)
� is the length of the cabinet/gondola, � is the specific average heat extraction rate and � is the
cooling load correction factor due to indoor humidity (see Figure 3).
Electricity
The demand for electricity equals
� 979 = � *=?@96/)B8=�C)>9 + � �DF=>)96 + � ̀ )>9 ∙ bc� (eq.3.9)
� *=?@96/)B8=�C)>9 is the electricity used by lighting, ovens, plug-in cabinets and electronic
equipment. � �DF=>)96 is electricity used by fans, lighting, anti-sweat heaters and defrost equipment
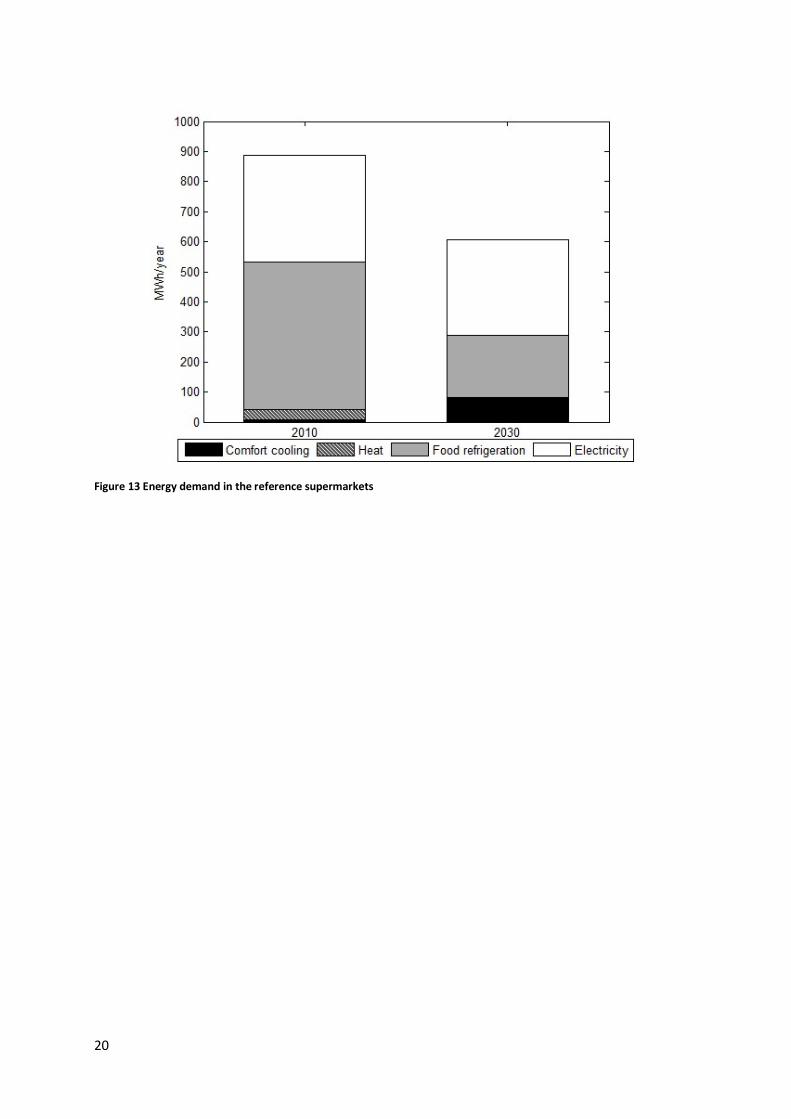
in the conventional cabinets and gondolas. Figure 13 presents the energy needed in the reference
supermarket of 2010 and 2030 respectively. Note that the cooling and heating may be produced by
electricity, but with this approach the demand is kept technology neutral.
0 2745 5490-10
0
10
20
30
Daytime 2030
Te
mp
era
ture
[oC
]
Hours
tout
(Outdoor temperature) tin
(Indoor temperature) ts (Supply air temperature) t
rec (Temperature downstream of HX)
0 1647 3294-10
0
10
20
30
Nighttime 2030
Te
mp
era
ture
[oC
]
Hours
tout
(Outdoor temperature) tin
(Indoor temperature) ts (Supply air temperature) t
rec (Temperature downstream of HX)
20
Figure 13 Energy demand in the reference supermarkets

21
4 Alternative System Designs
In this section, four different ways to meet the energy demands defined in the previous section are
presented.
4.1 Selection of Components
Regarding required components, only components that differ substantially between the alternatives
are included in the comparison. E.g. costs for cooling coils and heating coils controlling the
temperature of the supply air are assumed to be equal for all alternatives. To achieve a fair
comparison, it is important to be consistent when selecting components. The choice of
manufacturers of components is done with respect to availability of information about performance
and prices. Since there are different demands for energy in 2010 compared to 2030, different sizes of
components are needed. This makes it necessary to define two sets of components for each
alternative.
Compressor
Only semi-hermetic reciprocating compressors are dealt with in this study, since these are very
common in supermarket refrigeration applications. The selection of compressors is based on
calculations with subcooling of 5 K, superheating of 10 K and R404A as the refrigerant. 70 % of the
refrigerants used in Swedish supermarkets in 2003 were R404A (Arias et al. 2004, p. 17[3]). Due to
safety of operation, two chillers are used on the chilled- and frozen food side respectively. The
selection is done with the calculation software Bitzer Software (Bitzer 2010)[8]. The dimensioning
power, presented in Table 3-Table 6, equals the cooling load.
Dry cooler
By using the calculation software AIACalc (Asarums industri AB, 2010)[1], the sufficient dry cooler with
lowest cost is selected. The condenser coolant is assumed to be a mixture of water and 30 %
ethylene glycol. It is assumed that the coolant inlet and outlet temperatures are 8 and 2 K above the
outdoor temperature (38 °C /32 °C in the dimensioning case). Separate dry coolers for comfort
cooling and food refrigeration are used. This is common since the comfort cooling is usually operated
by the property owner while the food refrigeration is operated by the retailer (Johnsson[27]).
District cooling substation
District cooling substations are selected from the company SWEP International AB. Substations are
available in customised sizes. However, quotations of prices were received only for a dimensioning
power of 50 kW, 100 kW and 150 kW respectively. Consequently, interpolation and extrapolation are
used to estimate the costs of the required substations. The substations include all necessary
controllers and electrical components.
Condenser and evaporator
Plate heat exchangers are used as condensers and evaporators. In completely indirect refrigeration
systems this is always the case (Arias et al. 2004, p. 31[3]). The calculation software SSP G7 (SWEP
International AB, 2010)[21] is used and the sufficient heat exchangers with lowest costs are selected.
To calculate the temperature of the refrigerant at the inlet of the condenser, which is required by the
calculation software, the isentropic efficiency of the compressor is assumed to be 70 %.

22
4.2 Alternative 1 In this alternative, district cooling is used both for comfort cooling and condenser cooling. Neither
condenser heat recovery nor floating condensing is possible. The air cooler is connected in series
with the condensers and the design makes it possible to by-pass the secondary coolant when there is
no need for comfort cooling. The condensation temperature is fixed at 20 °C. Figure 14 shows a
schematic of the system.
Figure 14 Schematic of Alternative 1
When studying systems involving heat exchangers, it is convenient to illustrate the operation in a T-Q
diagram. The purpose of this is to enhance understanding and make sure that no heat is transferred
from a lower to a higher temperature fluid. The x-axis represents the amount of heat transferred and
the y-axis represents the temperature levels. The two operation modes of alternative 1 are
illustrated in a T-Q diagram in Figure 15.
Figure 15 T-Q-diagrams for operation with and without comfort cooling (abbreviations are explained in the designations
section)
6 °C
16 °C18 °C
8 °C
touttrects
District cooling water
Recuperative heat
exchanger
Sales area
Chilled-food cabinets
and
frozen-food gondolas
Seconda
ry
coola
nt
Ventilation air
0 20 40 60 805
10
15
20
25
VA
Cond.
SC
DC
A hot summerday (2010)
Power [kW]
Tem
pera
ture
[oC
]
0 20 40 605
10
15
20
25
Cond.
SC
DC
A cold winterday (2010)
Power [kW]
Tem
pera
ture
[oC
]

23
Required components
The components required specifically in alternative 1 are listed in Table 3. When dimensioning the
condensers it is important to take into account that the water inlet temperature is above 8 °C when
there is a comfort cooling demand.
Table 3 Required components in alternative 1
Component Year Dimensioning
power [kW]
Selected model Cost [kSEK] Comment
District cooling
substation
2010 144 SWEP Substation,
144 kW
94.4
2030 126 SWEP Substation,
126 kW
93.8
Compressor
(chilled food)
2010 91 2 x 4J-13.2Y 161.6
2030 32 2 x 2CC-4.2Y 51.7
Compressor
(frozen food)
2010 10 2 x 4EC-4.2Y 55.2
2030 7 2 x 2CC-3.2Y 49.6
Condenser
(chilled food)
2010 112 2 x B25Tx90 27.8 �d#,=> = 8.5 °C 2030 37 2 x B25Tx80 24.5 �d#,=> = 13.8 °C
Condenser
(frozen food)
2010 14 2 x BX8Tx58 13.0 �d#,=> = 8.5 °C 2030 10 2 x B15x50 13.1 �d#,=> = 13.8 °C
Total: 2010 352.0
2030 232.7
The cost of connecting the supermarket to the district heating system is not included. In 2030, this is
justified by the fact that the heat demand is too small to invest in a heat system other than an
electric heater. In 2010, however, it is assumed that the supermarket is already in the proximity of
the district heating network. A supermarket far away from the district heating network is very
unlikely to connect to the district cooling network, and thereby not interesting in this study. Any
connection costs are assumed to equal the costs of the condenser heat recovery system in the other
alternatives and are therefore not included.
4.3 Alternative 2
In this system, district cooling is not utilized at all. The comfort cooling demand is supplied by an
ordinary chiller. When there is a heat demand, condenser heat is recovered by rejecting it in the
supply air stream. When there is no heat demand, all condenser heat is rejected in roof-mounted dry
coolers.
The ambient outdoor air temperature determines the condensation temperature of the chillers.
However, it is not desirable to have the lowest possible condensation temperature since this would
cause unacceptably high power consumption in the dry cooler fans. There is an optimization issue to
minimize the combined power consumption of dry cooler fans and chiller compressor. According to
Johnsson[27], a good compromise is to operate at a condensation temperature of 10 °C above the
outdoor temperature. It is important to use speed-controlled fan motors in order to adjust the dry
cooler fans to the actual demand.
The power consumption of the dry cooler fans is proportional to the cube of the cooling load in the
dry cooler. Equation 4.1 is used to calculate the fan power.

24
� GD> = � GD>,CDj ∙ - � � CDj.k
(eq. 4.1)
� is the cooling load, � CDj is the maximum cooling load and � GD>,CDj is the fan power needed at
the maximum cooling load, which is obtained from the manufacturers calculation software.
All chillers are operated at a condensation temperature of 10 °C above the outdoor temperature
when there is no heat demand. When there is a heat demand, the condensation temperature of the
chillers used for condenser heat recovery is 10 °C above the indoor supply air temperature. It is not
necessary to have the same condensation temperature in the chilled-food chillers as in the frozen-
food chillers. However, the two chilled-food chillers and the two frozen-food chillers respectively are
operated at the same condensation temperature. According to Figure 16 it is obvious to choose the
frozen-food chillers to recover heat from. Figure 16 shows the heat demand of the supermarket, the
available heat in the condensers and the limit under which an electric heater would be more energy
efficient (see eq. 2.8). Recovering heat from the chilled-food chillers is approximately as bad as using
an electric heater. Recovering heat from the frozen-food chiller is better, but sometimes the heat
demand exceeds the amount of available heat. The heat shortages are assumed to be solved with an
electric heater. This concerns the supermarket of 2010, in 2030 the heat demand is too small to
motivate the investment of a heat recovering system.
Figure 16 Heat demand, condenser heat and the smallest heat demand needed to have lower electricity consumption in
a condenser heat recovery system compared to an electric heater (2010). Note the different scales.
Jan Mar May Jul Sep Nov0
50
100
Daytime, Chilled food chillers
[kW
]
Jan Mar May Jul Sep Nov0
50
100
Nighttime, Chilled food chillers
[kW
]
Available condenser heat
Heat demand
Limit under which an electric
boiler uses less electricity
Jan Mar May Jul Sep Nov0
5
10
15
[kW
]
Daytime, Frozen food chillers
Jan Mar May Jul Sep Nov0
5
10
15
Nighttime, Frozen food chillers
[kW
]

25
The minimum condensation temperature is set to 5 °C to avoid too low pressure difference in the
chillers. Figure 17 shows a schematic of the system and Figure 18 illustrates the operation in a T-Q
diagram.
Figure 17 Schematic of alternative 2
Figure 18 T-Q-diagrams for summer- and wintertime operation respectively (abbreviations are explained in the
designations section)
Required components
The components required specifically in alternative 2 are listed in Table 4.
Table 4 Required components in alternative 2
Component Year Dimensioning
power [kW]
Selected model Cost [kSEK] Comment
Compressor
(comfort cooling)
2010 22 4EC-6.2Y 31.5 T2= 6 °C
2030 80 4G-30.2Y 91.5
Evaporator
(comfort cooling)
2010 22 B25Tx50 8.6
2030 80 B50Hx100 37.0
Condenser
(comfort cooling)
2010 28 B25Tx80 12.3
2030 99 B120Tx180 49.0
touttrects
Recuperative heat exchanger
Sales area
Dry cooler
Dry coolerChilled-food cabinets
and
frozen-food gondolas
Ventilation air
Condensercoolant
Condenser coolant
0 20 40 60 80 10025
30
35
40
Cond.
Cond.
(Comfort)
CC
CC
OA
OA
A hot summerday (2010)
Power [kW]
Tem
pera
ture
[oC
]
0 20 40 60-10
-5
0
5
10
15
20
25
30
35Cond. (F)
Cond. (C)
CC
CC
VA
OA
A cold winterday (2010)
Power [kW]
Tem
pera
ture
[oC
]

26
Compressor
(chilled food)
2010 91 2 x 4G-20.2Y 175.9
2030 32 2 x 4EC-6.2Y 63.1
Compressor
(frozen food)
2010 10 2 x 4TCS-8.2Y 97.6
2030 7 2 x 4DC-5.2Y 69.0
Condenser
(chilled food)
2010 121 2 x B120Tx110 66.9
2030 40 2 x B25Tx60 19.6
Condenser
(frozen food)
2010 15 2 x B25Tx20 10.0
2030 11 2 x BX8Tx58 13.0
Dry cooler
(refrigeration)
2010 136 XPM-91X-23-4B4-
V-900-41
176.8 �GD>,CDj=15.0 kW
2030 51 XPM-91X-2-5B1-V-
900-20
73.8 �GD>,CDj=5.0 kW
Dry cooler
(comfort cooling)
2010 28 X2-D-80Q1A-1-3D-
6B4-V-900-12-
boostfin
49.5 �GD>,CDj=1.8 kW
2030 99 XPM-91X-4-5B4-V-
900-36
133.7 �GD>,CDj=10.0 kW
Total: 2010 629.1
2030 549.7
4.4 Alternative 3
This design is a mix of alternative 1 and 2. The condenser heat is rejected in roof-mounted dry
coolers but the comfort cooling demand is achieved by district cooling. Heat is recovered from the
frozen-food chiller condenser when there is a heat demand in the supermarket. The condensation
temperatures are determined as in alternative 2. Figure 19 shows a schematic of the system and
Figure 20 illustrates the operation in a T-Q diagram.
Figure 19 Schematic of alternative 3
touttrects
Recuperative heat
exchanger
Sales area
Dry cooler
6 °C
16 °C
District cooling water
Chilled-food cabinets
and frozen-food gondolas
18 °C
8 °C
Ventilation air
Condenser coolant
Secondary coolant

27
Figure 20 T-Q-diagrams for summer- and wintertime operation respectively (abbreviations are explained in the
designations section)
Required components
The components required specifically in alternative 3 are listed in Table 5.
Table 5 Required components in alternative 3
Component Year Dimensioning
power [kW]
Selected model Cost [kSEK] Comment
District cooling
substation
2010 22 SWEP Substation,
22 kW
30.9
2030 80 SWEP Substation,
80 kW
81.2
Compressor
(chilled food)
2010 91 2 x 4G-20.2Y 175.9
2030 32 2 x 4EC-6.2Y 63.1
Compressor
(frozen food)
2010 10 2 x 4TCS-8.2Y 97.6
2030 7 2 x 4DC-5.2Y 69.0
Condenser
(chilled food)
2010 121 2 x B120Tx110 66.9
2030 40 2 x B25Tx60 19.6
Condenser
(frozen food)
2010 15 2 x B25Tx20 10.0
2030 11 2 x BX8Tx58 13.0
Dry cooler 2010 136 XPM-91X-23-4B4-
V-900-41
176.8 �GD>,CDj=15.0 kW
2030 51 XPM-91X-2-5B1-V-
900-20
73.8 �GD>,CDj=5.0 kW
Total: 2010 558.1
2030 319.7
0 20 40 60 80 1005
10
15
20
25
30
35
40Cond.
CC
VA
DC
SC
OA
A hot summerday (2010)
Power [kW]
Tem
pera
ture
[oC
]
0 20 40 60-10
-5
0
5
10
15
20
25
30
35Cond. (F)
Cond. (C)
VA
OA
CC
CC
A cold winterday (2010)
Power [kW]
Tem
pera
ture
[oC
]

28
4.5 Alternative 4
This system gives priority to low condensation temperatures. Condenser heat recovery is not utilized.
As long as the outdoor air temperature is below 10 °C, the condenser heat is rejected in dry coolers
allowing a condensation temperature of 10 °C above the outdoor air temperature. When the outdoor
air temperature exceeds 10 °C, district cooling is used and the condensation temperature is 20 °C.
District cooling is also used to cover the comfort cooling demand. A schematic of the system is
presented in Figure 21 and the operation is illustrated in a T-Q diagram in Figure 22.
Figure 21 Schematic of alternative 4
Figure 22 T-Q-diagrams for summer- and wintertime operation respectively (abbreviations are explained in the
designations section)
touttrects
Recuperative heat exchanger
Sales area
Dry cooler
6 °C
16 °C
District cooling water
Chilled-food cabinetsand
frozen-food gondolas
Ventilation air
Secondary coolant
0 20 40 60 805
10
15
20
25
Cond.VA
SC
DC
A hot summerday (2010)
Power [kW]
Tem
pera
ture
[oC
]
0 10 20 30 40 50 60-10
-5
0
5
10
Cond.
SC
OA
A cold winterday (2010)
Power [kW]
Tem
pera
ture
[oC
]

29
Required components
The components required specifically in alternative 4 are listed in Table 6.
Table 6 Required components in alternative 4
Component Year Dimensioning
power [kW]
Selected model Cost [kSEK] Comment
District cooling
substation
2010 144 SWEP Substation,
144 kW
94.4
2030 126 SWEP Substation,
126 kW
93.8
Compressor
(chilled food)
2010 91 2 x 4J-13.2Y 161.6
2030 32 2 x 2CC-4.2Y 51.7
Compressor
(frozen food)
2010 10 2 x 4EC-4.2Y 55.2
2030 7 2x 2CC-3.2Y 49.6
Condenser
(chilled food)
2010 112 2 x B25Tx90 26.9 ���,=> = 8.5 °C 2030 37 2 x B25Tx80 24.5 ���,=> = 13.8 °C
Condenser
(frozen food)
2010 14 2 x BX8Tx58 13.0 ���,=> = 8.5 °C 2030 10 2 x B15x50 13.1 ���,=> = 13.8 °C
Dry cooler 2010 102 XPM-91X-5-4B4-V-
900-36
145.1 �GD>,CDj=12.5 kW �789 = 10.0 °C 2030 39 X2-D91Q2A-1-3E-
6B4-V-900-12-
boostfin
60.3 �GD>,CDj=3.6 kW �789 = 10.0 °C
Total: 2010 496.2
2030 293.0

30

31
5 Results
5.1 Energy Use
The electricity demand presented in Figure 13 is independent of alternative. It equals 352.9
MWh/year in 2010 and 317.7 MWh/year in 2030 and is excluded in this section from now on. Figure
23-Figure 26 present the remaining demand for energy in the four alternatives respectively.
Figure 23 Monthly use of energy for alternative 1 (District cooling used for comfort cooling as well as condenser cooling
all year)
Figure 24 Monthly use of energy for alternative 2 (No use of district cooling)
Jan Feb Mar Apr May Jun Jul Aug Sep Oct Nov Dec0
10
20
30
40
50
60
2010
MW
h
District cooling
Electricity
District heating
Jan Feb Mar Apr May Jun Jul Aug Sep Oct Nov Dec0
10
20
30
40
50
60
2030
MW
h
District cooling
Electricity
District heating
Jan Feb Mar Apr May Jun Jul Aug Sep Oct Nov Dec0
10
20
30
40
50
60
MW
h
2010
District cooling
Electricity
District heating
Jan Feb Mar Apr May Jun Jul Aug Sep Oct Nov Dec0
10
20
30
40
50
60
MW
h
2030
District cooling
Electricity
District heating

32
Figure 25 Monthly use of energy for alternative 3 (District cooling used for comfort cooling)
Figure 26 Monthly use of energy for alternative 4 (Using district cooling for comfort cooling as well as condenser cooling
when the outdoor air temperature exceeds 10 °C)
The annual use of energy is presented in Table 7 and Table 8 respectively.
Table 7 Annual use of energy 2010 [MWh/year]
Table 8 Annual use of energy 2030 [MWh/year]
Jan Feb Mar Apr May Jun Jul Aug Sep Oct Nov Dec0
10
20
30
40
50
60M
Wh
2010
District cooling
Electricity
District heating
Jan Feb Mar Apr May Jun Jul Aug Sep Oct Nov Dec0
10
20
30
40
50
60
MW
h
2030
District cooling
Electricity
District heating
Jan Feb Mar Apr May Jun Jul Aug Sep Oct Nov Dec0
10
20
30
40
50
60
MW
h
2010
District cooling
Electricity
District heating
Jan Feb Mar Apr May Jun Jul Aug Sep Oct Nov Dec0
10
20
30
40
50
60
MW
h
2030
District cooling
Electricity
District heating
Alternative 1 Alternative 2 Alternative 3 Alternative 4
District heating 34.3 0 0 34.3
District cooling 625.0 0 7.0 330.6
Electricity 126.0 164.7 163.2 135.5
Alternative 1 Alternative 2 Alternative 3 Alternative 4
Heating 0.2 0.2 0.2 0.2
District cooling 331.0 0 80.1 209.6
Electricity 43.8 70.0 54.8 45.7

33
The heat demand in 2030 is way too small to invest in a heating system other than an electric heater.
However this is equal in all alternatives and is therefore not bothering the comparison.
The difference in average COP of the refrigeration systems depends on the condensation
temperatures only. Since the cooling load varies due to changes in weather conditions it is more
appropriate to compare the seasonal performance factor, SPF, defined as the total cooling generated
during one year divided by the total compressor work during one year. By also including parasitic
losses a fair comparative figure is obtained. Since the pump power is assumed to be equal in all
alternatives, the parasitic losses in this comparison only include the fan power of the dry coolers. The
average COP, the SPF and the SPF including dry cooler fan power are presented in Table 9.
Table 9 Comparison of energy efficiency figures (food cooling, 2030)
Alternative 1 Alternative 2 Alternative 3 Alternative 4
Average COP 4.73 5.44 5.44 5.67
SPF 4.73 4.64 4.64 5.22
SPF incl. dry cooler fan power 4.73 3.78 3.78 4.54
5.2 Economic Comparison
To be able to compare investment costs with future demands for energy it is necessary to use an
economic model. In this study, the net present value method is used. By calculating the net present
value (cost) of future demands for energy, these can be added to the investment and enable
comparison of the four different alternatives. By setting the net present value of an alternative
including district cooling equal to the net present value of the alternative without district cooling a
competitive price of district cooling is obtained. The price of district cooling that equalizes the net
present value of the two alternatives is calculated according to equation 5.1.
�"# = �� − �� + � ∙ S�)* ∙ S�)*,� − �)*,�X + �"4 ∙ H�"4,� − �"4,�IX�"#,� ∙ � (eq. 5.1)
� = Investment cost �)* =Annual demand for electricity �"# = Annual demand for district cooling �"4 =Annual demand for district heating �"#= Competitive price of district cooling �)* = Price of electricity �"4 =Price of district heating �= Net present value factor
Subscripts 1 and 2 represent an alternative without and with district cooling respectively.
The net present value factor is calculated from
� = 1 − H1 + �IR>� (eq. 5.2)
34
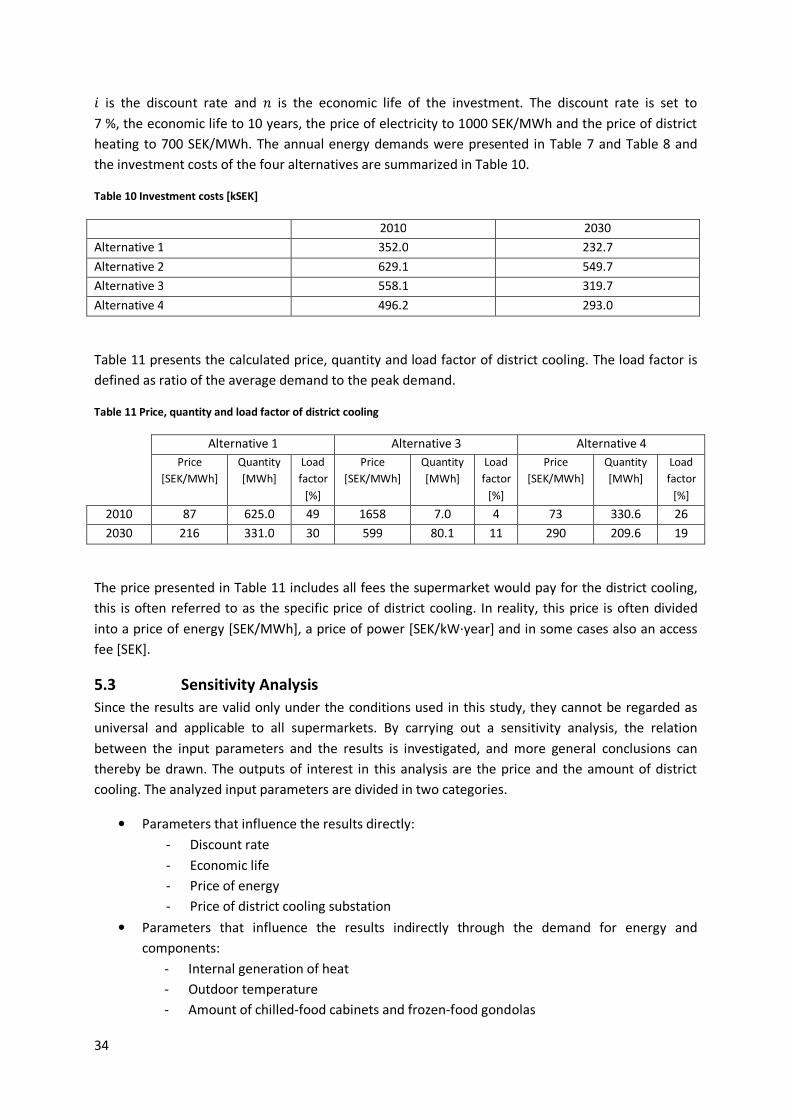
� is the discount rate and is the economic life of the investment. The discount rate is set to
7 %, the economic life to 10 years, the price of electricity to 1000 SEK/MWh and the price of district
heating to 700 SEK/MWh. The annual energy demands were presented in Table 7 and Table 8 and
the investment costs of the four alternatives are summarized in Table 10.
Table 10 Investment costs [kSEK]
2010 2030
Alternative 1 352.0 232.7
Alternative 2 629.1 549.7
Alternative 3 558.1 319.7
Alternative 4 496.2 293.0
Table 11 presents the calculated price, quantity and load factor of district cooling. The load factor is
defined as ratio of the average demand to the peak demand.
Table 11 Price, quantity and load factor of district cooling
Alternative 1 Alternative 3 Alternative 4
Price
[SEK/MWh]
Quantity
[MWh]
Load
factor
[%]
Price
[SEK/MWh]
Quantity
[MWh]
Load
factor
[%]
Price
[SEK/MWh]
Quantity
[MWh]
Load
factor
[%]
2010 87 625.0 49 1658 7.0 4 73 330.6 26
2030 216 331.0 30 599 80.1 11 290 209.6 19
The price presented in Table 11 includes all fees the supermarket would pay for the district cooling,
this is often referred to as the specific price of district cooling. In reality, this price is often divided
into a price of energy [SEK/MWh], a price of power [SEK/kW∙year] and in some cases also an access
fee [SEK].
5.3 Sensitivity Analysis
Since the results are valid only under the conditions used in this study, they cannot be regarded as
universal and applicable to all supermarkets. By carrying out a sensitivity analysis, the relation
between the input parameters and the results is investigated, and more general conclusions can
thereby be drawn. The outputs of interest in this analysis are the price and the amount of district
cooling. The analyzed input parameters are divided in two categories.
• Parameters that influence the results directly:
- Discount rate
- Economic life
- Price of energy
- Price of district cooling substation
• Parameters that influence the results indirectly through the demand for energy and
components:
- Internal generation of heat
- Outdoor temperature
- Amount of chilled-food cabinets and frozen-food gondolas
35
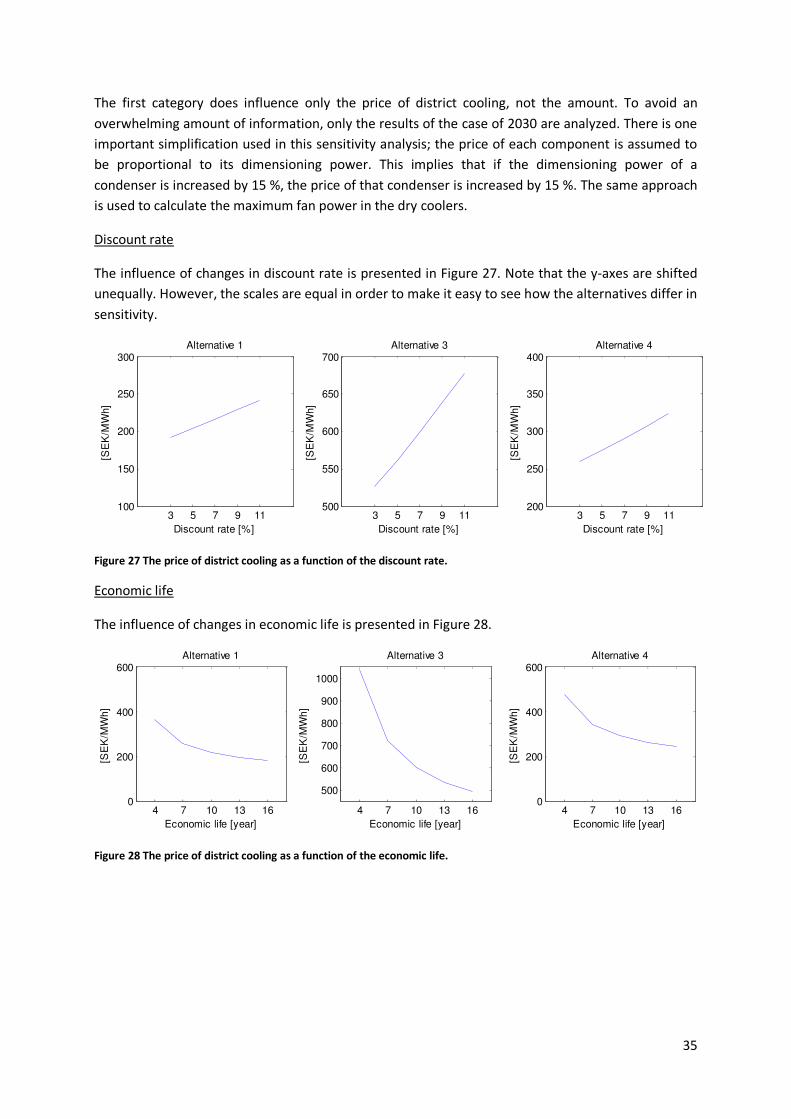
The first category does influence only the price of district cooling, not the amount. To avoid an
overwhelming amount of information, only the results of the case of 2030 are analyzed. There is one
important simplification used in this sensitivity analysis; the price of each component is assumed to
be proportional to its dimensioning power. This implies that if the dimensioning power of a
condenser is increased by 15 %, the price of that condenser is increased by 15 %. The same approach
is used to calculate the maximum fan power in the dry coolers.
Discount rate
The influence of changes in discount rate is presented in Figure 27. Note that the y-axes are shifted
unequally. However, the scales are equal in order to make it easy to see how the alternatives differ in
sensitivity.
Figure 27 The price of district cooling as a function of the discount rate.
Economic life
The influence of changes in economic life is presented in Figure 28.
Figure 28 The price of district cooling as a function of the economic life.
3 5 7 9 11100
150
200
250
300
Discount rate [%]
[SE
K/M
Wh]
Alternative 1
3 5 7 9 11500
550
600
650
700
Discount rate [%]
[SE
K/M
Wh]
Alternative 3
3 5 7 9 11200
250
300
350
400
Discount rate [%]
[SE
K/M
Wh]
Alternative 4
4 7 10 13 160
200
400
600
Economic life [year]
[SE
K/M
Wh]
Alternative 1
4 7 10 13 16
500
600
700
800
900
1000
Economic life [year]
[SE
K/M
Wh]
Alternative 3
4 7 10 13 160
200
400
600
Economic life [year]
[SE
K/M
Wh]
Alternative 4

36
Price of energy
Since the supermarket of 2030 is assumed to not use district heating, only the price of electricity is
investigated. Two approaches are used to analyze the influence of the electricity price. First, it is
assumed that the price of electricity is constant during the lifetime of the investments. Then, it is
assumed that the price of energy is increased during the lifetime of the investments by a certain
percentage annually. The result of the first approach is presented in Figure 29.
Figure 29 The price of district cooling as a function of the electricity price.
In the approach with increasing prices of energy, the initial price of electricity is kept at 1000
SEK/MWh. It is assumed that the percental increase in the price of electricity equals the percental
increase in the price of district cooling. Mathematically, this is obtained by substituting the net
present value factor calculated in eq. 5.2 into the one calculated in eq. 5.3 (Nilsson 2003)[20].
�B = 1 − l1 + �1 + � m>1 + �1 + � − 1
(eq. 5.3)
� equals the annual increase in energy prices. The result is the initial price of district cooling (y-axis),
while the annual increase is presented on the x-axis.
Figure 30 The initial price of district cooling as a function of annual increase of energy prices
500 1000 1500 2000 25000
100
200
300
400
Electricity price [SEK/MWh]
[SE
K/M
Wh]
Alternative 1
500 1000 1500 2000 2500500
600
700
800
900
Electricity price [SEK/MWh]
[SE
K/M
Wh]
Alternative 3
500 1000 1500 2000 2500100
200
300
400
500
Electricity price [SEK/MWh]
[SE
K/M
Wh]
Alternative 4
-2 3 80
100
200
300
Annual increase of energy prices [%]
[SE
K/M
Wh]
Alternative 1
-2 3 8400
500
600
700
Annual increase of energy prices [%]
[SE
K/M
Wh]
Alternative 3
-2 3 8100
200
300
400
Annual increase of energy prices [%]
[SE
K/M
Wh]
Alternative 4

37
Price of district cooling substation
Investigating the price of district cooling substation includes any additional costs that might come
around when buying a substation and connecting it to the district cooling network.
Figure 31 The price of district cooling as a function of the cost of the district cooling substation (compared to the original
cost)
Internal generation of heat
The net amount of internally generated heat in the supermarket can differ a lot from one
supermarket to another. This parameter covers assumptions made about lighting, customer flow,
plug-in cabinets, ovens etc. Figure 32 presents how sensitive the amount and price of district cooling
are to changes in the amount of internally generated heat. Practical problems, such as too low supply
air temperature when having a vast amount of internally generated heat, are not taken into account.
Figure 32 The price and amount of district cooling as a function of the net amount of internally generated heat in the
supermarket (compared to the original case)
0 50 100 150 2000
50
100
150
200
250
300
Price of DC substation [%]
[SE
K/M
Wh]
Alternative 1
0 50 100 150 200450
500
550
600
650
700
750
Price of DC substation [%]
[SE
K/M
Wh]
Alternative 3
0 50 100 150 200100
150
200
250
300
350
400
Price of DC substation [%]
[SE
K/M
Wh]
Alternative 4
50 100 150
100
200
300
400
Internal generation of heat [%]
[SE
K/M
Wh]
Alternative 1
50 100 150
300
400
Am
ount
of
dis
tric
t coolin
g [
MW
h/y
ear]
50 100 150
500
600
700
800
900
Internal generation of heat [%]
[SE
K/M
Wh]
Alternative 3
50 100 150
50
100
150
Am
ou
nt
of
dis
tric
t coolin
g [
MW
h/y
ear]
50 100 150
100
200
300
400
Internal generation of heat [%]
[SE
K/M
Wh]
Alternative 4
50 100 150
50
150
250
Am
ount
of
dis
tric
t coolin
g [
MW
h/y
ear]

38
Outdoor temperature
Analyzing the influence of the outdoor temperature gives an indication of how the situation differs in
other geographical locations. The outdoor relative humidity is kept unchanged. A higher outdoor
temperature increases the cooling load in the display cabinets since it causes a higher indoor relative
humidity. The influence of the outdoor temperature is presented in Figure 33.
Figure 33 The price and amount of district cooling as a function of the avarage outdoor air temperature
5 8 11 14
100
200
300
400
Average outdoor temperature [oC]
[SE
K/M
Wh]
Alternative 1
5 8 11 14
200
300
400
500
Am
ount
of
dis
tric
t coolin
g [
MW
h/y
ear]
5 8 11 14
500
600
700
800
900
1000
Average outdoor temperature [oC]
[SE
K/M
Wh]
Alternative 3
5 8 11 14
0
100
200
Am
ount
of
dis
tric
t coolin
g [
MW
h/y
ear]
5 8 11 14
100
200
300
400
Average outdoor temperature [oC]
[SE
K/M
Wh]
Alternative 4
5 8 11 14
100
200
300
400
Am
ount
of
dis
tric
t coolin
g [
MW
h/y
ear]

39
Amount of food cooling
An increased amount of food cooling decreases the demand for comfort cooling and increases the
demand for condenser cooling. This is presented in Figure 34.
Figure 34 The price and amount of district cooling as a function of the amount of chilled-food cabinets and frozen-food
gondolas (Compared to the original case)
50 100 1500
100
200
300
Cabinets and gondolas [%]
[SE
K/M
Wh]
Alternative 1
50 100 150200
300
400
Am
ount
of
dis
tric
t coolin
g [
MW
h/y
ear]
50 100 150400
500
600
700
800
Cabinets and gondolas [%][S
EK
/MW
h]
Alternative 3
50 100 150-100
0
100
Am
ount
of
dis
tric
t coolin
g [
MW
h/y
ear]
50 100 150100
200
300
400
Cabinets and gondolas [%]
[SE
K/M
Wh]
Alternative 4
50 100 150
100
200
300
Am
ount
of
dis
tric
t coolin
g [
MW
h/y
ear]

40

41
6 Discussion
It is difficult to define “a typical supermarket” since there are many parameters involved, of which
many can vary in a very wide range. The term “the supermarket of 2030” used in this study may be
misleading. It is fully possible to design a supermarket like that today and consequently decrease the
energy demand and increase the competitiveness of district cooling.
It is important to keep in mind that the results are valid only under the conditions used in this study.
One important simplification made in this study is the constant indoor temperature. In reality, most
HVAC systems allow a higher indoor temperature during summer and vice versa, which decreases the
demand for comfort cooling and heating. A hint of the error from this simplification is obtained by
adjusting the line of indoor temperature in Figure 11 and Figure 12. Another simplification is the
disability to vary the ventilation flow rate according to the demand of heating and cooling. If there is
a comfort cooling demand when it is cold outside, this could in reality be solved with an increased
ventilation flow rate. However, studies have shown that the SFP must be very low in order to make
this approach beneficial (Fahlén et al.[12]).
It is reasonable to assume that display cabinets equipped with doors are not as sensitive to changes
in indoor humidity as cabinets without doors. In reality, the annual load curve would be flatter with
cabinets equipped with doors, which would make the use of dry coolers slightly more beneficial.
However, doors are not the only measure to make energy efficient display cabinets and it is hard to
predict how sensitive other solutions are to fluctuations of indoor humidity.
It is assumed that the comfort cooling is achieved by cooling the ventilation air before it is supplied
into the supermarket. In a system where the indoor air is cooled by chilled beams in the supermarket
the results may be different.
The specific electricity demands [kWhel/m2] of the reference supermarkets are significantly
surpassing the average supermarket studied in by The Swedish Energy Agency 2010a[24]. The
explanation is that the reference supermarkets are much smaller than the average supermarket, and
small supermarkets have higher specific electricity demands than big supermarkets (The Swedish
Energy Agency 2010a[24])
The data of outdoor temperature implies an average temperature of 9.7 °C. This is 1.9 °C above the
normal average temperature in Göteborg (defined as the average during 1990 - 1961). But only one
of the last twenty years had an average temperature below the normal, and the annual average
temperature in Göteborg is predicted to rise further according to The Swedish Meteorological and
Hydrological Institute.
Costs and electricity consumptions of all pumps in the refrigeration systems are assumed to be equal
in the four alternatives and therefore not included in the comparison. A big temperature change in a
heat exchanger requires less flow rate (at constant power), and the required pump work is
proportional to the cube of the flow rate. The temperature rise of the condenser coolant in the
condenser is 6.0 °C without district cooling and 4.2 °C - 10 °C with district cooling (the average is
8.6 °C). This is valid for the supermarket of 2030 and the variation depends on the comfort cooling
demand. Consequently it is reasonable to assume that the alternatives with district cooling cooled
condensers require larger pumps, but the annual electricity demand of those pumps is less.

42
Intuitively, alternative 4 seems very expensive since investments are made in both district cooling
and dry coolers. The results from this study show quite the opposite. Alternative 4 has a lower
investment cost than both alternative 2 and alternative 3. A big part of the explanation is the fact
that the chillers do not need to be dimensioned for a condensation temperature of 40 °C.
This study does not include the possibility to sell recovered heat to nearby buildings. This possibility
is studied by Tabrizi (2009)[23], and would be of disadvantage to the competitiveness of district
cooling.
Regarding the sensitivity analysis, alternative 3 is more sensitive than the other alternatives (in
absolute terms). This is true for all parameters. The price of district cooling increases exponentially in
alternative 3 when decreasing the amount of internally generated heat or the average outdoor
temperature. The reason for this is that the amount of district cooling decreases, and since
alternative 3 is a cheaper investment than alternative 2, the savings in investments are allocated on a
decreased amount of energy.
District cooling is not competitive in the supermarket of 2010. The results indicate that it is possible
to charge a high price for the district cooling if it is used for comfort cooling, but the demand is only 7
MWh/year. In reality, this demand is probably too small to be met at all. In other words, it is not fair
to compare the district cooling alternative with a scenario where other comfort cooling equipment is
invested in.
The results of the supermarket of 2030 are more interesting. Using district cooling for both comfort
cooling and condenser cooling implies a demand of 331 MWh annually and a competitive price of
216 SEK/MWh. Using district cooling only when the outdoor temperature exceeds 10 °C implies a
demand of 210 MWh/year and a competitive price of 290 SEK/MWh and using district cooling only
for comfort cooling implies a demand of 80 MWh/year and a competitive price of 599 SEK/MWh. In
Figure 35, the price of district cooling is plotted against the number of full-load hours during one year
(full-load hours are defined as the load factor times the number of hours).

43
Figure 35 Specific price of district cooling plotted against number of full-load hours per year
The relation between price and number of full-load hours obtained in this study corresponds very
well to the relation based on concluded district cooling agreements presented in Folkesson (2009)[13].
The prices of district cooling in the supermarket of 2030 are among the lower prices presented in
Folkesson (2009)[13], and it shall be noted that the prices presented in that study does not include any
access fees.
Costs of operation and maintenance are not included in this study. It is common to add 2-3 % to the
investment cost of a chiller to take this into account, which would be of advantage to the
competitiveness of district cooling. In addition to the prices calculated in this study, it is common to
value other advantages of district cooling. This includes reliability, simplicity and reduction of noise
from dry coolers which also take up a great deal of space. Estimating the value of these factors is
beyond the scope of this study.
0 500 1000 1500 2000 2500 3000 3500 4000 45000
200
400
600
800
1000
1200
1400
1600
1800
Full-load hours
Specific
price o
f dis
tric
t coolin
g [
SE
K/M
Wh]
2010
2030Alt 3
Alt 1
Alt 4
Alt 1
Alt 3
Alt 4

44

45
7 Conclusions
All conclusions drawn in this section are valid only under the conditions used in this study.
Cooling the condensers of a refrigeration system in a supermarket with district cooling does not lead
to a lower average condensation temperature compared to a conventional system operating with a
floating condensation temperature. District cooling cooled condensers also make it impossible to
recover condenser heat. On the other hand, there are three major advantages associated with
utilization of district cooling in supermarkets:
• Avoid usage of electricity consuming dry coolers.
• Not need to dimension the refrigeration system according to the maximum outdoor
temperature.
• Meet the demand of comfort cooling in an energy efficient way.
The main difference between today’s reference supermarket and that of the future is the net
amount of internally generated heat. This big increase, which is mainly due to more energy efficient
display cabinets, is shown to wipe out the demand for heating and to increase the annual demand
for comfort cooling from 10 kWh/m2 to 120 kWh/m2 in the reference supermarket. In the meantime,
the demand for food cooling decreases from 742 kWh/m2 to 309 kWh/m2.
In today’s reference supermarket, the district cooling must be very cheap in order to compete with
conventional system designs (87 SEK/MWh).
The competitiveness of district cooling is much better in the future reference supermarket. The main
reason is the increased comfort cooling demand and the fact that a condenser heat recovery system
is useless. Using district cooling in the future reference supermarket for both comfort cooling and
condenser cooling implies an annual demand of 331 MWh, a competitive price of 216 SEK/MWh and
2628 full-load hours. Using district cooling only when the outdoor temperature exceeds 10 °C implies
a demand of 210 MWh/year, a competitive price of 290 SEK/MWh and 1664 full-load hours. Using it
only for comfort cooling implies a demand of 80 MWh/year, a competitive price of 599 SEK/MWh
and 964 full-load hours. The competitive price is defined as the price that equalizes the net present
value of a system including district cooling with the net present value of a conventional system
without district cooling. Neither simplicity, reliability, noise from bulky dry coolers nor costs for
operation and maintenance are taken into account.
The future reference supermarket is fully possible to design today and thereby increasing both the
energy efficiency of the supermarket and the competitiveness of district cooling. Which alternative
to prefer from a district cooling company point of view, is very much a matter of the benefit from
having a large amount of full-load hours.

46

47
8 References
1. AIA Calc (Version 1003.02)(2010) [Computer programme] Asarums Industri AB. Asarum,
Sweden. Available at: < http://www.aia.se > [Accessed 10 August 2010]
2. Arias, J. (2005). Energy usage in supermarkets - Modelling and field measurements [On-
line Version]. Stockholm: KTH. Available at: < http://kth.diva-
portal.org/smash/get/diva2:7929/FULLTEXT01 > ISBN 91-7178-075-0.
3. Arias, J., Claesson, J., Sawalha, S. & Rogstam, J. (2004). Effektivare kyla, en inventering (in
Swedish). Katrineholm: Installatörernas utbildningscentrum.
4. Arias, J., Lundqvist, P., Sawalha, S. & Axell, M. (2010). Advanced Modelling and Tools for
Analysis of Energy Use in Supermarket Systems. Proceedings of the 1st IIR conference on
the cold chain and sustainability, Cambridge, 2010.
5. Axell, M. (2002). Vertical display cabinets in supermarkets - Energy efficiency and the
influence of air flows. Diss. Chalmers University of Technology. Göteborg: Chalmers
reproservice. ISBN 91-7291-239-1.
6. Axell, M., Lindberg, U. & Lidbom, P. (2004). Energieffektivisering i livsmedelsbutiker med
målsättning att förbättra klimatet för kunder, varor och personal – En fältstudie i tre
butiker (in Swedish). ISBN 91-7848-944-X.
7. Axfood (2010). Axfoods hållbarhetsprogram 2010 (in Swedish). [On-line Version].
Available at:
<http://www.axfood.se/Global/Miljö%20och%20Ansvar/Hållbarhetsprogram%20Axfood.
pdf > [Accessed 10 August 2010]
8. Bitzer Software (Version 5.2.1.2)(2010) [Computer programme] Bitzer Kühlmaschinenbau
GmbH. Sindelfingen, Germany. Available at: < http://www.bitzer.de > [Accessed 10
August 2010]
9. Börjesson, J. (red.) (2008). Kristallklart, ett nyhetsbrev från Djupfrysningsbyrån (in
Swedish). (nr 19 maj 2008).
10. Claesson, J. (2006). Slutrapport Etapp 1: Energieffektiv kyla – Effektivare Styrning,
Övervakning och Systemlösningar (in Swedish). Project report, IUC-SEK.
11. Fahlén, P. (2000). Butikskyla (in Swedish). ISBN 91-7848-799-4.
12. Fahlén, P., Markusson, C. & Jagemar, L. Influence of ventilation-system design on the use
of heating, cooling and drive energy to fans, Chalmers University of Technology,
Buildning Services Engineering, Gothenburg.

48
13. Folkesson, T. (2009). Fokus på fjärrkyla 2008. (in Swedish) EKAN Gruppen.
14. Golove, W. & Eto, J. (1996). Market barriers to energy efficiency: A critical reappraisal of
the rationale for public policies to promote energy efficiency. University of California.
Berkeley.
15. Haglund Stignor, C. (2003). Kylning av kylmaskiners kondensorer med fjärrkyla i
livsmedelsbutiker (in Swedish). Stockholm: Svenska fjärrvärmeföreningens service AB.
FOU 2003:92.
16. ICA AB (2010). ICA-koncernens årsredovisning inklusive hållbarhetsredovisning för 2009
(in Swedish).
17. KF (2010). KF-koncernens hållbarhetsredovisning 2009 (in Swedish).
18. Lindberg, U. (2009). Indoor thermal environment in supermarkets. A study of measured
and perceived comfort parameters. Lic. Chalmers University of Technology. Göteborg:
Chalmers reproservice. D2009:04.
19. Lindberg, U., Axell, M. & Fahlén, P. (2010). Vertical display cabinets without and with
doors – A comparison of measurements in a laboratory and in a supermarket.
Proceedings of the 1st IIR conference on sustainability and the cold chain, Cambridge,
2010.
20. Nilsson, P-E (red.) (2003). Achieving the desired indoor climate: energy efficiency aspects
of system design. Lund: Studentlitteratur.
21. SSP G7 (Version 7.0.1.7)(2010) [Computer programme] SWEP International AB.
Landskrona, Sweden. Available: < http://www.swep.net > [Accessed 10 August 2010]
22. Svensson, J. (2006). Energieffektiva livsmedelsbutiker – en studie av förutsättningar för
användning av frikyla (in Swedish). Chalmers University of Technology. Göteborg:
Chalmers reproservice.
23. Tabrizi, H. (2009). Energieffektivisering – Integrerat värmesystem mellan bostäder och
livsmedelsbutik. (in Swedish). Chalmers University of Technology, Civil and Environmental
Engineering, Gothenburg.
24. The Swedish Energy Agency (2010a). Energianvändning i handelslokaler (in Swedish). ER
2010:17
25. The Swedish Energy Agency (2010b). Energiläget 2010 (in Swedish). ET 2010:45
26. Ågren, K. (2008). ICA-handlarna fortsätter att öka avståndet. Market Vem är vem, pp. 28-
29 (in Swedish). Västerås: Forma Publishing Group AB.

49
Personal Communication
27. Johnsson, Martin. Technical Manager at Partor AB, correspondence by email. August
2010.

50
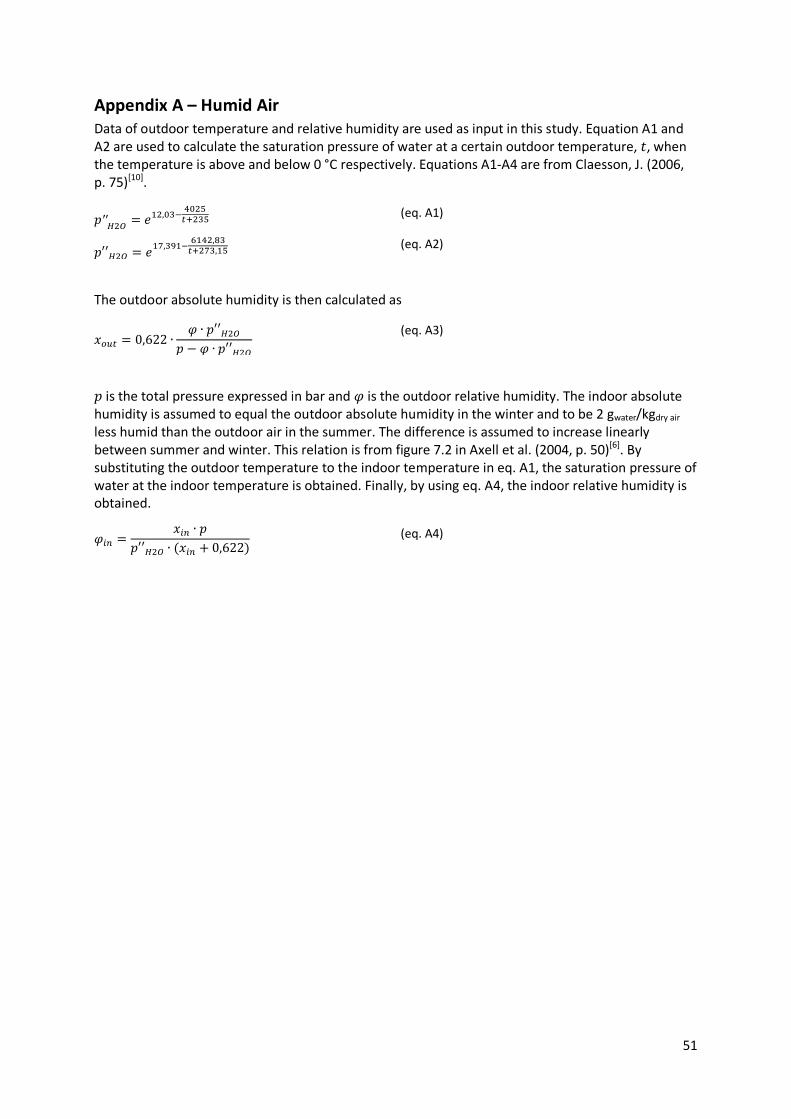
51
Appendix A – Humid Air
Data of outdoor temperature and relative humidity are used as input in this study. Equation A1 and A2 are used to calculate the saturation pressure of water at a certain outdoor temperature, �, when the temperature is above and below 0 °C respectively. Equations A1-A4 are from Claesson, J. (2006, p. 75)[10].
�′′4�n = o��,pkR qp�r9V�kr (eq. A1) �′′4�n = o�t,ku�R v�q�,wk9V�tk,�r (eq. A2)
The outdoor absolute humidity is then calculated as
�789 = 0,622 ∙ � ∙ �′′4�n� − � ∙ �′′4�n (eq. A3)
� is the total pressure expressed in bar and � is the outdoor relative humidity. The indoor absolute humidity is assumed to equal the outdoor absolute humidity in the winter and to be 2 gwater/kgdry air less humid than the outdoor air in the summer. The difference is assumed to increase linearly between summer and winter. This relation is from figure 7.2 in Axell et al. (2004, p. 50)[6]. By substituting the outdoor temperature to the indoor temperature in eq. A1, the saturation pressure of water at the indoor temperature is obtained. Finally, by using eq. A4, the indoor relative humidity is obtained.
�=> = �=> ∙ ��′′4�n ∙ H�=> + 0,622I (eq. A4)

52
Appendix B – Latent Cooling Load
When cooling air, condensation will occur if the temperature of the cooling coil is lower than the dewpoint of the air (Nilsson 2003)[20]. The condensation causes a latent load, which doesn’t change the temperature of the air. The total cooling load consists of a sensible part and a latent part according to equation B.1.
� = � 6 + � z (eq. B.1) � 6 = � ∙ � `)>9 ∙ ��,D ∙ H�� − ��I (eq. B.2) � z = � ∙ � `)>9 ∙ H�D ∙ ∆�D + ��,` ∙ H�� − ��I ∙ ∆�DI (eq. B.3)
� = Total cooling load � 6 = Sensible cooling load � z = Latent cooling load � = Air density � `)>9 =Air volume flow ��,D = Specific heat capacity of air �� = Inlet air temperature (�J)� ) �� = Outlet air temperature (�6) �D = vaporization heat of air ∆�D = change of airflow humidity ratio (x� − x�) ��,` = specific heat capacity of water vapour
The change of airflow humidity ratio, ∆�D, is calculated according to equation B.4.
∆x| = x� − x}|~t� − t���& ∙ Ht� − t�I (eq. B.4)
x� = Inlet humidity ratio x}|~ = Saturated humidity ratio at coil temperature t���& = Coil temperature
This is efficiently explained in a Mollier-diagram. In figure B1, the state of the air in Göteborg in 2008
is plotted (the blue circles). The red dot represents the cooling coil. The black arrow represents a
cooling process from state 1 to state 2. The air is cooled from (x1,t1) to (x2,t2) in the direction towards
(xsat,tcoil).
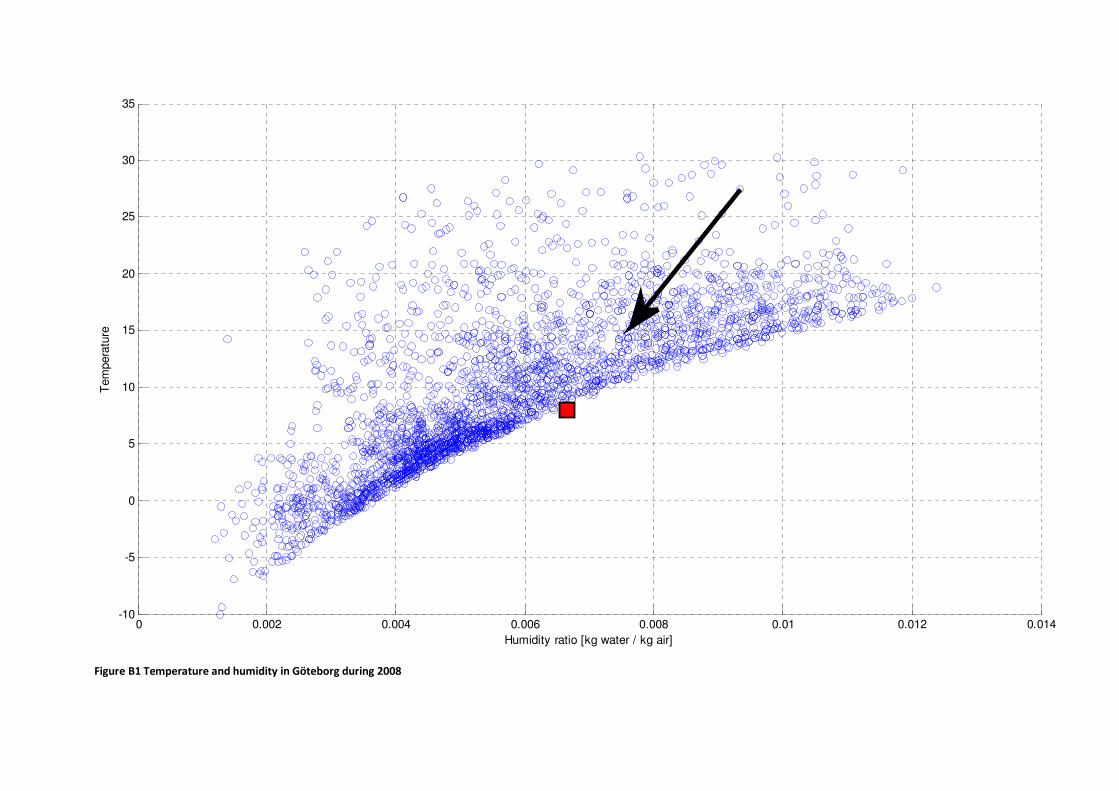
Figure B1 Temperature and humidity in Göteborg during 2008
0 0.002 0.004 0.006 0.008 0.01 0.012 0.014-10
-5
0
5
10
15
20
25
30
35
Humidity ratio [kg water / kg air]
Tem
pera
ture