A Proposal for Efficient Cooling Arrangement for uGMRT ...
23
NATIONAL CENTRE FOR RADIO ASTROPHYSICS Ver 3.0 Date : 10/07/2015 Internal Technical Report A Proposal for Efficient Cooling Arrangement for uGMRT Digital Backend Irappa M. Halagali and Mr. Ajith Kumar B. Group Head, Digital Backend Prof. Yashwant Gupta Dean, GMRT Objective : To propose a suitable cooling arrangement for the new Backend system for the uGMRT receiver, so that the system can co-exist with the GMRT Software Backend (GSB) receiver in the Central electronics building (CEB).
Transcript of A Proposal for Efficient Cooling Arrangement for uGMRT ...

NATIONAL CENTRE FOR RADIO ASTROPHYSICS
Ver 3.0 Date : 10/07/2015
Internal Technical Report
A Proposal for Efficient Cooling Arrangement foruGMRT Digital Backend
Irappa M. Halagali
and
Mr. Ajith Kumar B. Group Head, Digital Backend
Prof. Yashwant Gupta
Dean, GMRT
Objective : To propose a suitable cooling arrangement for the new Backend system for the uGMRT receiver, so that the system can co-exist with the GMRT Software Backend (GSB) receiver in the Central electronics building (CEB).

Index 1 Introduction2 Summary of experiment results 3 AC distribution layout4 Correlator Room Floor diagram5 GWB Modelwise Power Consumption6 GWB Rackwise Power Consumption7 Measuring of air flow using meter8 Measurement of Power Consumption9 Theoratical Calculations10 Practical Measurements11 Final Conclusions
appendices :I Auto calculatorII Experiment setup detailsIII Summary of Daily readingsIV Average of Daily readingsV Daily ReadingsVI Air Flow meter User Manual
1. Introduction :
A Wideband Backend (GWB) is being developed for the uGMRT based on FPGA/GPU hybrid technology. The system being developed utilises Casper designed FPGA / ADC boards to digitise the baseband signals and pass it on to server class machines with GPU cards which work as the compute nodes. The processed data is collected in host nodes through a high speed switch.
As per the current design, Dell make server T620 with two nos. of nVidia GPUs K20 will be used as the compute nodes and three nos. of T620 will be used as host nodes. Final GWB system for 32 antennae will have 5 racks of standard 19” dimension. Racks 1 to 4 will have compute node machines aongwith Roach units. Each of these racks will consume about 4,850 Watts of maximum power (Typical power consumption 2800 Watts). The fifth rack will have host machines, Switch, small units like PPS, clock and Instruments. This rack will consume about 2050 Watts maximum power (typical consumption 1,250 watts ).
In order to propose the cooling arrangements in the rack, theoritical calculations were done and it was later verified with experiments in the correlator room. A 42U rack has been used for the experiments, with modifications (as shown in figure) to improve the cool air flow inside the rack. Tests were also done without these modifications for comparison of the cooing effects.

2. Summary of experiment results :
A quick summary of the test results is, a. for a power dissipation of about 4KW per rack ( refer topics“4. GWB modelwise & 5. GWB rackwise Power Consumption”), the maximum outlet air temperature will be of the order of about 25 degCel., while the maximum inlet temperature is 10 degCel. More details are given in Appendix 3 : Summary of Daily Readings.b. Volume of cool air from each duct in correlator room as per theoritical assumption is 1000cfm. It is 1600cfm as per the measurement done using air flow meter over the duct at duct no. 1 (which is 1200cfm over duct no. 3). As per the setup 3a (refer apendix II experiment setup details) , we gets a temperature difference of 9.21DegCel. This results in the volume of cool air as 812cfm. The cool air volume using meter is around 600cfm(5' away from the duct).
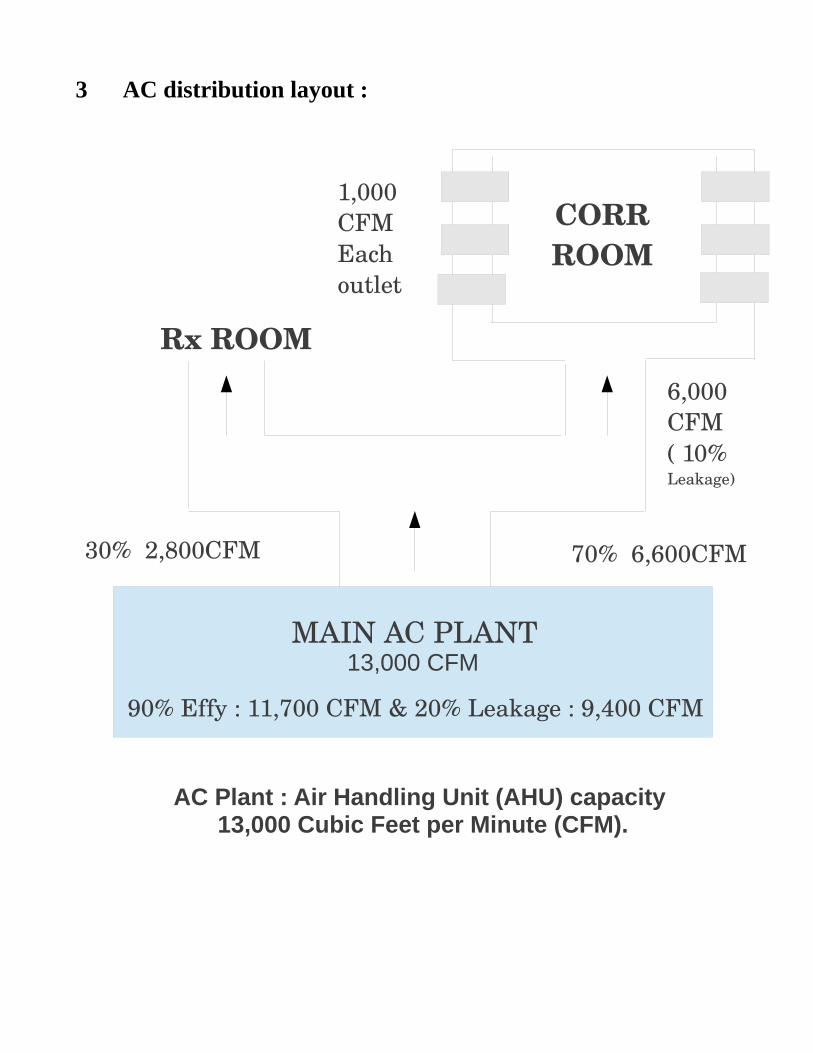
3 AC distribution layout :
13,000 CFMMAIN AC PLANT
Rx ROOM
CORRROOM
1,000CFMEachoutlet
30% 2,800CFM 70% 6,600CFM
6,000 CFM ( 10% Leakage)
90% Effy : 11,700 CFM & 20% Leakage : 9,400 CFM
AC Plant : Air Handling Unit (AHU) capacity 13,000 Cubic Feet per Minute (CFM).

4 Correlator Room Floor diagram

5 GWB Modelwise Power Consumption :
6 GWB Rackwise Power Consumption
Model wise Power consumption by GWB 30 Ant. System.Power Consumption/Model Total Total Power Consumptin
Model Name Typical Maximum Models Typical MaximumDell T620 Nodes 369 628 16 5,904 10,048 Dell T620 Hosts 369 628 3 1,107 1,884 K20 GPU Cards 105 225 32 3,360 7,200 Myricom 10GbE Single Port 5 5 32 160 160 Melox infiniband NIC card 2 2 19 38 38 ROACH Board (1 ADC) 50 60 32 1,600 1,920 ADC in ROACH Boards 1.5 1.5 32 48 48 Melox infiniband 32P Switch 3 3 1 3 3 Signal Generator (N9310A) 65 65 1 65 65 PPS unit & misc.. 50 100 1 50 100
G. Total 12,335 21,466
Rack wise Power consumption by GWB 30 Ant. System.Power Consumption/Model Total Total Power Consumptin
Rack Number Model Name Typical Maximum Models Typical Maximum1 to 4 Dell T620 Nodes 369 628 4 1,476 2,512
K20 GPU Cards 105 225 8 840 1,800 Myricom 10GbE Single Port 5 5 8 40 40 Melox infiniband NIC card 2 2 4 8 8 ROACH Board (1 ADC) 50 60 8 400 480 ADC in ROACH Boards 1.5 1.5 8 12 12
Sub Total 1 2,776 4,852
5 Dell T620 Hosts 369 628 3 1,107 1,884 Melox infiniband NIC card 2 2 3 6 6 Melox infiniband 32P Switch 3 3 1 3 3 Signal Generator (N9310A) 65 65 1 65 65 PPS unit & misc.. 50 100 1 50 100
Sub Total 2 1,231 2,058
G. Total 12,335 21,466

7 Measuring of air flow using meter :
For air flow measurement in the correlator room, we have used “ Pitot Tube Anemometer + Differential Manometer HD350” from Extech Instruments. Measured the air flow volume over the duct number 1 and 3. Using this meter, we measured air flow at 5 points in the duct (4 corners and at the centre about half a foot height) and took average of those readings. It was around 1600cfm & 1200cfm from duct number 1 & 3 respectively.
Detailed measurement of air flow from AC plant to end points in Correlator & Receiver rooms needs to be done at various possible locations. This will give the complete and exact know how about the cool air volume at different locations and leakages.
The air flow measurement procedure is explained in apendix “VI Air Flow Meter User Manual”
8 Measurement of Power Consumption :
Two months back measured the power consumption by the GWB host PC with cards, while correlator code running. The Power consumption was near to Typical Values as per the datasheets/documents. But we need to check again with all the peripherals in the node PC and final code running on it. This may force the power consumption towards maximum ratings.
Setup image and details to be added for future references.

9 Theoratical Calculations :
For this theoratical calculations, we have considered the following as inputs :1. Maximum heat energy from GWB system is 21,500 watts.2. Cool air entering the correlator room is 6000 CFM (Cubic Feet per Minute).3. Difference in temperature of air in the corr room = 15 DegCel from inlet to outlet.4. Constants : a. 1 Joule = 0.238902957619 calories. b. 1 ft^3 = 0.02832 mtr^3 c. average Air density is 1.128666667 kg/mtr^3 for average temperature of 17.5 DegCel. d. Specific Heat of air @ 20 DegCel & 1 pascal is 240 calories/kg degree celsius.
A. Maximum Total Heat Energy in calories/min. from the GWB system. Total Heat Energy in Joules/min. = Total Power consumption * 1 minute = 21,500 watts * 60 sec. = 12,90,000 Joules/min.
1 Joule = 0.238902957619 calories , 1 calorie = 4.186 joules .
Total Heat Energy in calories/min. = 12,90,000 * 0.238902957619 = 3,08,185 calories/min.
B. Heat Absorption of the cool air in calories/min. from the AHU(AC Plant).
Heat Absorption = mass * Specific Heat of air * Diff. in temp.of the cool air kg/min. Calories/kg degree cel.
degree celsiusa. “mass” mass = Air Density kg/mtr^3 * Volume mtr^3/min. = kg/min.
i. Air Density in kg/mtr^3 : http://www.weatheronline.in/weather/maps/city & http://www.denysschen.com/catalogue/density.aspx
Air Density @ Pune (above sea level of 1837 feet or 560 mtrs and relative humidity varies between 24 to 94 % in the year 2014) for average relative humidity of 59%) is ....
Temperature in DegCel Air Density in kg/mtr^3 @ pressure of 1 pascal 10 1.16
17 1.1325 1.096
So average Air density is 1.128666667 kg/mtr^3 for average temperature of 17.5 DegCel.
ii. Air Volume in mtr^3/min :
1 ft^3 = 0.02832 mtr^3 & 1 mtr^3 = 35.31467 ft^3

So volume of cool air reaching corr. Room = 6,000 ft^3/min. = 169.92 mtr^3/min. So mass of cool air = 1.128666667 * 169.92 reaching corr. Room kg/mtr^3 mtr^3/min.
= 191.783040057 kg/min.
b. “Specific Heat of air = 240 calories/kg degree celsius. @ temp. of 20degree cel. & pressure of 1 pascal www.usc.edu/org/.../Heat%20Capacity%20and%20Specific%20Heat.pdf , http://www.engineeringtoolbox.com/specific-heat-capacity-d_391.html
c. “Diff. in temperature = 25 – 10 = 15 degree celsius of corr. Room
So,
Heat Absorption = 191.783040057 * 240 * 15of the cool air kg/min. Calories/kg DegCel.
per DegCel. = 6,90,419 calories/min.
So,Heat Absorption of the cool air from each outlet = 6,90,419 / 6in the correlator room = 1,15,070 Calories/min.
Conclusion : a. Heat absorption of cool air from each inlet of 1000 CFM and inlet to outlet temperature difference of 15 DegCel is 1,15,070 Calories/minute.
b. So to absorb 3,08,185 calories/min. of heat generated by GWB system, we need 2.68 (308185÷115070) cool air inlets. Each inlet of 1000 CFM cool air.
10 Practical measurements :
For this practical measurements, we have used the Heat load of 4000 Watts. Maximum GWB power consumption is 21,500 watts or 3,08,185 calories/minute(refer “5. GWB rackwise power consumption”).
Conclusion :
A. Using 3 fans of 100cfm each to suck the cool air in the aluminium cage in the rack.We got the temperature difference of 15.5 degreeCel. So
Volume of cool air per inlet in the correlator room is 482 Cubic Feet/Minute instead of 1000CFM !!!

Total Heat Energy --> 3,08,185 calories/minuteHeat Absorption by 482cfm Cool Air --> 57,312 calories/minute
So 5.38 inlets with cool air of 482 CFM are required !!!
B. Using 2 fans of 600cfm each to suck the cool air in the aluminium cage in the rack.If these fans are at 2' height of the al. cage, then the temperature difference is 5.4 degCel.If moved these fans at the bottom of the rack and kept this 2' height slot in the al. cage open, then the temperature difference is 9.21degCel. This temperature increases by around 1 degCel, if we put 3 fans of 100cfm each at the open slot in the al. cage!
If we take 5.4 degCel., then a. Volume of cool air per inlet in the correlator room is 1384 CFM.b. Heat Absorption by 1384 CFM Cool Air is 1,64,565 calories/minute.c. So 1.87 inlets with cool air of 1384 CFM are required.
If we take 9.21 degCel., then a. Volume of cool air per inlet in the correlator room is 812 CFM.b. Heat Absorption by 812 CFM Cool Air is 96,551 calories/minute.c. So 3.19 inlets with cool air of 812 CFM are required.
11 Final Conclusions :
A. Theoratically each inlet gives 1000CFM of cool air. So we need 2.68 cool air inlets to absorb the heat generated by GWB system of 21,500 Watts ( 3,08,185 calories/minute). But practically, with 3fans of 100cfm each to suck the cool air into the al. cage, we need 5.38 cool air inlets. This is doubble the theoratical requirement. So we have to find out the reasons, which could be as follows ;1. Actual cool air spilt for the correlator room may not be 6000 CFM.2. There may be leakeages between the AHU and correlator room inlets.3. May be considerable leakages at the bottom of the rack.4. May be adjustment of locations of the heat load is required in the rack, in order to utilize the cool air efficiently.5. May be adjustment of locations of the input/output thermometers is required to findout the actual volume of the cool air, which may be more than 482 CFM. 6. If possible and not harmful to the system, increase the humidity of the cool air (decrease the temperature of the cool air comming out of the inlets).
B. We found the following things are useful in utilising the cool air efficiently.1. We have replaced the 3 fans of 100cfm each to suck the cool air into the al. cage by 2 fans of 600cfm at 2' height in the al. cage. 2. Made sure the cool air entered in the rack, shouldn't leakout. 3. And also took care of no obstacles in the cool air flow towards the exit in the rack.

Enenthough the rack is kept 5 feet away from the cool air duct and without any aluminium cage/duct to bring the cool air from the inlet(setup No. 3a), we got a averaged temperature difference of 5.4 degCel.
If we move these fans from the al. cage to the bottom of the rack and keep the slot in the al. cage @ 2' height open, then the temperature difference increses to 9.21 degCel.
This temperature increases by around 1 degCel, if we put 3 fans of 100cfm each at the open slot in the al. cage!
If we take maximum of these ie 9.21 DegCel, then the volume of cool air from the outlet is 812cfm.
So we need 3.19 inlets of 1000cfm cool air to dissipate 21,500KW heat from GWB system.
Appendices will follow in the next page .............

Appendices :I Auto calculator :
please use the file auto_calc_temp.ods to change the input parameters to get output values. Sample file attached here for standard input parameters...
User Parameters : INPUTS Output Parameters OUTPUTS
PowerConsumption in Watts --> 21500 3,08,185Difference in Temperature --> 15.5 Heat Absorption of Cool Air cal/min --> 96,551Volume of Cool Air in ft^3 --> 812 Number of cool air inlets required.. 3.19
Heat absorption in watts --> 4,000Difference in temperature deg. Cel. --> 9.21 Volume of Cool Air in ft^3 : 812
Constant Parameters : Constant Values Intermittent Calculation Parameters : int'nt. results
1 Joule equal to --> Calories 0.2389029576 Volume of Cool Air in mtr^3 --> 22.995841 Cubic feet equal to --> Cubic mtr 0.02832 Mass of cool air in kg/minute --> 25.954638088Air Density kg/mtr^3 @ 25dC & 1 PascalSpecific Heat of Air cal/kgdC @ 20dC & 1 Pascal 240
Tables :Total Heat Energy in Cal./min. Volume of Cool Air in ft^3 @1KW heat if :For 1000 watts of Power Consumption --> 14,334 Temperature difference of 3 deg. Cel. 2,491For 1500 watts of Power Consumption --> 21,501 Temperature difference of 3.5 deg. Cel. 2,135For 2000 watts of Power Consumption --> 28,668 Temperature difference of 4 deg. Cel. 1,869For 2500 watts of Power Consumption --> 35,835 Temperature difference of 4.5 deg. Cel. 1,661For 3000 watts of Power Consumption --> 43,003 Temperature difference of 5 deg. Cel. 1,495For 3500 watts of Power Consumption --> 50,170For 4000 watts of Power Consumption --> 57,337 Heat Absorption of Cool Air in cal./min. For 1000ft^3/For 4500 watts of Power Consumption --> 64,504 min. Cool airFor 5000 watts of Power Consumption --> 71,671 For Temperature difference of 1 deg.Cel. 6,229
For Temperature difference of 1.5 deg.Cel. 9,344For Temperature difference of 2 deg.Cel. 12,458For Temperature difference of 2.5 deg.Cel. 15,573For Temperature difference of 3 deg.Cel. 18,687For Temperature difference of 3.5 deg.Cel. 21,802For Temperature difference of 4 deg.Cel. 24,916For Temperature difference of 4.5 deg.Cel. 28,031For Temperature difference of 5 deg.Cel. 31,146For Temperature difference of 5.5 deg.Cel. 34,260For Temperature difference of 6 deg.Cel. 37,375For Temperature difference of 6.5 deg.Cel. 40,489For Temperature difference of 7 deg.Cel. 43,604For Temperature difference of 7.5 deg.Cel. 46,718For Temperature difference of 8 deg.Cel. 49,833For Temperature difference of 8.5 deg.Cel. 52,947For Temperature difference of 9 deg.Cel. 56,062For Temperature difference of 9.5 deg.Cel. 59,177For Temperature difference of 10 deg.Cel. 62,291
Total Heat Energy in calories/minute -->
1.128666667

II Experiment setup details :
The following setups were done with the help of mechanical and electrical sections. These setups were used to study the effects of cooling over varying temperature under different conditions like when the rack is placed over the inlet cool air duct or 5 feet away from it and so on.... A total of 8 setups were created to study the possible conditions to make out the rise in temperature at the output over input ie difference in temperature of the air entering the rack and exiting the rack.
Setup 1 : 42U Rack directly on the cool air inlet in the corr room with all the leakages at the bottom closed. The cool air enters the rack from the front bottom opening and enters the aluminium cage through a window provided in the cage at a height of about 2 feet. One thermometer(T1) and two temperature sensors (S2 & S3) are present at this opening to measure the inlet temperature. Inside the al. cage about a feet high 4 hellogen (with seperate ON-OFF switches in the two extension boards having current carrying capacity of 16amps. These two extension boards are getting power from MSEB metal MCB box through 25amps MCB) lamps of 1 KW each are mounted. Some 3 feet above these lamps there is window in the al cage at the backside for heated air to exhaust. At this poist also one thermometer (T2) and two sensors (S4 & S5) are mounted. Sensor S1 is outside and near to this rack.
Rabbit card gets input on pin numbers 1 to 5 on 64pin FRC male connector from sensors S1 to S5 respectively. +11 volts power has been given to this rabbit card as well all to all temperature sensor cards. An ethernet cable with ip 192.168.4.152 has been connected to this rabbit card for web based monitoring of temperature.
Setup 2 : setup 1 with 3 fans of 100cfm each, mounted at the height of about 2 feet front side, to suck air in the aluminium cage.
Setup 2a : setup 2 with 2 fans of 600cfm each, mounted at the height of about 2 feet front side, to suck air in the aluminium cage. This is done with and without aluminium plate in al. cage to abstruct the air.
Setup 3 : setup 1 & 2 with whole setup moved about 5 feet away from cool air inlet duct. Cool air brought to the rack's inlet using aluminium sheet enclosure underneath the false flooring.
Setup 3a : setup 3 with 2 fans of 600cfm each instead 3 fans with 100cfm each and without al. enclosure to bring the cool air to rack.This is done with and without an aluminium plate in the al. cage in the rack, to be an obstacle in the air flow.
Setup 3b : setup 3a with 2 fans of 600cfm each, moved to bottom of the rack with opening @ 2' height. This is done with and without an aluminium plate in the al. cage in the rack, to be an obstacle in the air flow.
Setup 4 : setup 3 without fans to suck the cool air in the aluminium cage at 2 feet height.
Setup 5 : setup 3 without aluminium sheet enclosure underneath the false flooring to bring the cool air from the inlet duct to the rack and with fans to suck the air in the aluminium cage at 2 feet height.
Setup 6 : setup 5 but without fans to suck the cool air in the aluminium cage at 2 feet height.
Setup 7 : Rack without any modifications (aluminium cage in the rack removed). Kept 5 feet away from the cool air inlet duct. Input temperature monitoring about 2 feet high at the frontside. Four

hellogens of 1 KW each mounted at the centre of the rack. And output temperature monitoring at the top of the rack's rear side.
Setup 8 : Rack without any modifications (aluminium cage in the rack removed). Kept over the cool air inlet duct. Input temperature monitoring about 2 feet high at the frontside, where cool air blows in the rack's bottom. Four hellogens of 1 KW each mounted at the centre of the rack. And output temperature monitoring at the top of the rack's rear side.
T – Thermometer readings average. & S – Temperature Sensors readings average in Deg. Cel.LH – Left Hand side RH – Right Hand side (from back) F- Front of rack B – Back of rack.
III Summary of Daily readings :
Setup No. Measuring Instrument Average temp. readings for1KW 2KW 3KW 4KW
Max. outputtemp. for 4KW
Termp. Sensor minus Thermometer readings.
I Themometer 3.0 6.6 11.2 -- 20.0 1.2
Temperature Sensor 4.2 8.2 12.2 --
II ThemometerTemperature Sensor
2.6 6.3 9.0 11.74.3 8.2 11.7 14.2
22.5 2.2
IIa Themometer/TempSeThemometer/TempSe
6.23 8.89 with al. plate3.50 6.06 w/o al. plate
16.0017.00
2.262.56
III Themometer 2.8 7.3 12.5 14.8 25.5 2.6
Temperature Sensor 5.3 10.0 14.9 17.6
IIIa Themometer/TempSeThemometer/TempSe
9.21 9.23 with al. plate6.12 5.33 w/o al. plate
20.0021.00
0.02-0.79
IIIb Themometer/TempSeThemometer/TempSe
10.64 13.26 with al. plate10.82 12.84 w/o al. plate
20.5020.00
2.622.02
IV Themometer 3.5 10.0 14.1 18.5 28 2.8
Temperature Sensor 6.4 12.6 17.1 21.4
V Themometer 4.8 9.5 11 18.4 33 -3.0
Temperature Sensor 3.8 6.5 9.3 12.1
VI Themometer 8.0 18.2 24.8 31.7 46 1.8
Temperature Sensor 10.5 20.0 26.8 32.7
VII Themometer -5.2 -3.2 -1.3 -1.1 31.5 1.9
Temperature Sensor -0.8 -1.3 -2.3 +1.2
VIII Themometer -2.2 -3.1 -3.1 -2.8 9.0 1.0
Temperature Sensor -0.5 -1.4 -2.0 -3.3
Note : Thermometer readings are considered.

My words on this summary : 1. Since maximum temperature crosses 26 degCel (16 degCel over the temperature at the duct) for the setups IV and above, not considered for further evaluation. 2. The cool air entering the rack must be sucked towards the loads and heat air must be sucked out.3. Temperature goes down by about 0.5 to 2 degCel for 1KW to 4KW load, if we use fans to suck the air when the rack is over the duct. But this trend reverses when the rack is 5 feet away from the duct with fans.4. Temperature for 1KW about 3 degCel. It increases by about 3.5 degCel from 1KW to 2KW. And by 3 to 5 degCel & about 2.5 degCel for 2 to 3KW and 3 to 4KW respectively. 5. Setup 2a, 3a & 3b done after all other setups, to make use of the cool air efficiently. We got succeded in using it almost 100% efficiently by using 2 fans of 600cfm each to suck the cool air into the rack. Set up 3a & 3b with some modifications may be used for final setup.
IV Average of Daily readings :
SETUP : 142U Rack directly placed on the cool air inlet in the correlator room with all the leakages at the bottom closed. Aluminium cage with cool air in and hot air out and load in the centre of the cage.
Difference in Temperature
Date Readings Heat load of T S KW's Time Remarks
10/10/2014 4 4 1 12 – 17 Readings every half an hour11/10/2014 7 8.5 2 11 - 17 “13/10/2014 3 4 1 10 – 17 “14/10/2014 8 8.5 2 10 – 17 “15/10/2014 3.5 4 1 10 – 17 “16/10/2014 2.5 4.5 1 10 – 17 “18/10/2014 3 4.2 1 10 – 17 “20/10/2014 2 4 1 10 – 15 “21/10/2014 3 4.5 1 10 - 12 LH-1 every 5 min.
10.5 11.5 3 12 - 13 LH-1 + RH-2 “22/10/2014 6 8 2 10 - 12 LHB + RHB every 10 min.
5.5 8 2 12 - 13 LHF + RHF “12 13 3 14 - 15 LH-2 + RH “
Average Readings in degCel. 1KW 2KW 3KW 4KW
Themometer 3 6.6 11.2 18 Temp. Sensors 4.2 8.2 12.2 21Conclusions : Temperature Sensor results are about 1.2degCel. more than the Themometer readings. And maximum output temperature for 4 KW is about 20 degCel.

SETUP : 2setup 1 with 3 fans of 100cfm mounted at the height of about 2 feet front side, to suck air in the aluminium cage.
Difference in Temperature
Date Readings Heat load of T S KW's Time Remarks
28/10/2014 2 4.2 1 10:00 - 11:40 LHB every 10 min.
8.5 9 2 11:45 - 13:00 LHB + RHB “10 12.5 3 14:10 - 15:30 LH-2 + RH “13 15.5 4 15:40 - 16:40 All “
29/10/2014 11 13.5 4 09:40 - 11:30 All every 10 min.10 12.5 3 11:40 - 13:00 LH-2 + RHF “7.5 9.5 2 14:20 - 15:20 LHB + RHB “2.5 4.5 1 15:55 - 17:10 LHB “
30/10/2014 2 4.2 1 09:45 - 10:40 LHF every 10 min.2 4 1 10:50 - 11:45 RHF “4 5.2 1 12:00 - 12:55 RHB “2.5 4 1 14:10 - 15:00 LHB “5 7 2 15:30 - 16:10 LH-2 “5.5 8 2 16:20 - 17:20 RH-2 “
31/10/2014 6.2 7.7 2 09:50 - 11:30 LHF+RHB every 10 min.5.2 7.7 2 11:35 - 14:20 LHB+RHF “7.2 10.3 3 14:25 - 16:40 LH-2+RHF “
31/10/2014 11 13.5 4 09:45 - 16:00 All every 10 min.
26/05/2015 8.0 10.5 4 14:30 - 16:50 All every 10 min.Page 19 w/o al. plate obstacke in the al. cage.
Average Readings in degCel. 1KW 2KW 3KW 4KW
Themometer 2.6 6.3 9.0 11.7Temp. Sensors 4.3 8.2 11.7 14.2Conclusions : Temperature Sensor results are about 2 degCel. more than the Themometer readings. And maximum output temperature for 4 KW is about 22.5 (1/11/2014@14:50hrs)Alos noted a decrease of temperature by 3 degCel if remove the al. plate in the al. cage.
SETUP : 2asetup 2 with 2 fans of 600cfm mounted at the height of about 2 feet front side, to suck air in the aluminium cage.

Difference in Temperature
Date Readings Heat load of T S KW's Time Remarks
03/06/2015 6.23 8.89 4 12:40 - 17:00 All every 10 min.Page 20 with al. plate obstacke in the al. cage.05/06/2015 3.50 6.06 4 10:20 - 17:00 All every 10 min.Page 20 w/o al. plate obstacke in the al. cage.
SETUP : 3setup 1 & 2 with whole setup moved about 5 feet away from cool air inlet duct. Cool air brought to the rack's inlet using aluminium sheet enclosure underneath the false flooring.
Difference in Temperature
Date Readings Heat load of T S KW's Time Remarks
07/11/2014 6.8 9.3 2 15:20 - 17:10 RHB+RHF every 10 min.Sheet 110/11/2014 16.0 17.82 4 10:00 - 13:00 All “sheet 2 12.72 15.25 3 14:15 – 17:10 LH-2+RHB “11/11/2014 2.28 5.12 1 10:00 – 14:20 LHF “sheet 3 6.50 8.74 2 14:50 – 17:15 RH-2 “12/11/2014 6.19 9.36 2 10:00 – 14:20 LH -2 “sheet 4 7.00 10.08 2 14:10 – 15:15 LHB+RHF “13/11/2014 7.50 10.54 2 09:50 – 14:35 LHF+RHB “sheet 5 1.93 4.04 1 14:40 – 17:10 RHF “14/11/2014 3.93 6.13 1 10:20 – 14:40 RHF “sheet 6 2.81 5.53 1 14:45 – 17:20 LHB15/11/2014 3.30 5.95 1 10:10 – 11:30 RHB “sheet 7 9.64 12.02 2 11:35 – 14:20 LHB+RHB
12.33 14.63 3 14:30 – 15:50 LHB+RH-2 “ 13.70 16.38 4 15:55 – 17:20 All
16/11/2014 14.79 18.67 4 09:25 - 20:10 All “sheet 8
Average Readings in degCel. 1KW 2KW 3KW 4KW
Themometer 2.8 7.3 12.5 14.8Temp. Sensors 5.3 10.0 14.9 17.6Conclusions : Temperature Sensor results are about 2.5 degCel. more than the Themometer readings. And maximum output temperature for 4 KW is about 25.5 (16/11/2014@12:00hrs sheet no. 8 of temp_readings.ods file.)

Setup 3a : setup 3 with 2 fans of 600cfm each instead 3 fans with 100cfm each.
Difference in Temperature
Date Readings Heat load of T S KW's Time Remarks
08/06/2015 6.12 5.33 4 All 15:10 - 17:10 every 10 min.Page 21 w/o al. plate obstacke in the al. cage.09/06/2015 9.21 9.23 4 All 10:00 - 17:10 every 10 min.Page 21 with al. plate obstacke in the al. cage.16/06/2015 9.89 12.74 4 All 14:40 – 17:10 with plate “page 22
Setup 3b : setup 3a with 2 fans of 600cfm each moved to bottom of the rack with opening @ 2' height.
17/06/2015 10.64 13.26 4 All 10:10 - 17:10 every 10 min.Page 22 with al. plate obstacke in the al. cage.18/06/2015 10.82 12.84 4 All 10:00 - 17:10 every 10 min.Page 23 w/o al. plate obstacke in the al. cage.
SETUP : 4setup 3 but without fans to suck the cool air in the aluminium cage at 2 feet height.{Sheet number 13 & 14 in the temp_readings.ods file}
Difference in Temperature
Date Readings Heat load of T S KW's Time Remarks
26/12/2014 18.00 21.30 4 11:50 - 15:30 All every 10 min.Sheet 13 14.80 17.69 3 15:40 – 17:10 LH-2+RHF “
27/12/2014 11.54 13.33 2 09:55 - 12:00 LHB+RHB every 10 min.Sheet 13 04.53 06.61 1 12:10 – 16:10 LHB “
18.33 21.15 4 16:20 - 21:00 All 28/12/2014 13.44 16.48 3 12:20 – 15:00 LHF+RH-2 every 10 min.Sheet 14 08.57 11.99 2 15:10 - 16:30 LHF+RHF “
02.50 06.15 1 16:40 – 20:30 RHF “29/12/2014 19.21 21.70 4 10.10 - 16:40 All every 10 min.Sheet 14
Note : In this setup when bottom of the rack wasn't packed properly, so cool air was passing there. The average readings were about 1 to 4 degrees higher than the above mentioned ( Readings in the Sheet number 9 of temp_readings.ods file) readings for 1KW to 4KW load resp.. Above readings are taken again after packing the rack bottom with the floor.

Average Readings in degCel. 1KW 2KW 3KW 4KW
Themometer 3.5 10.0 14.1 18.5Temp. Sensors 6.4 12.6 17.1 21.4Conclusions : Temperature Sensor results are about 1.2degCel. more than the Themometer readings. And maximum output temperature for 4 KW is about 28.0 (26,27,29/11/2014 sheets 13 & 14)
SETUP : 5setup moved 5 feet away from the inlet cool air duct, without aluminium duct between cool air inlet and rack but fans to suck air at the aluminium cage present.{Sheet number 11 in the temp_readings.ods file}
Difference in Temperature
Date Readings Heat load of T S KW's Time Remarks
26/11/2014 11.90 08.23 3 09:50 - 11:30 LHF+RH-2 every 10 min.Sheet 11 09.60 06.86 2 12:00 - 13:00 LHF+RHF “27/11/2014 17.95 11.33 4 11:30 - 13:00 All every 10 min.Sheet 11 06.45 05.35 1 14:20 - 16:00 LHB “
09.20 06.14 2 16:30 – 17:10 LHB+RHF “28/11/2014 18.31 11.37 4 10:20 - 12:50 All every 10 min.Sheet 1131/12/2014 18.73 12.17 4 10:30 – 16:30 All “sheet 1601/01/2015 10.14 10.44 3 10:00 – 11:30 LH-2+RHB “sheet 16 9.63 06.44 2 14.15 – 16:00 LHF+RHB “02/01/2015 3.22 02.18 1 10:10 – 14:10 RHF “sheet 16 17.79 12.38 4 15:00 – 16:00 All “03/01/2015 19.14 13.14 4 10:00 – 12:10 All “
Note : In this setup Thermometer reading are higher than the sensor readings!
Average Readings in degCel. Max. o/p Themometer +/-1KW 2KW 3KW 4KW temp. 4KW Temp. Sensor
Themometer 4.8 9.5 11 18.4 Temp. Sensors 3.8 6.5 9.3 12.1Conclusions : Temperature Sensor results are about 1 to 6 degCel. less than the Themometer readings. And maximum output temperature for 4 KW is about 33degCel (sheets 11 and 16)

SETUP : 6setup 5 but without fans to suck the cool air in the aluminium cage at 2 feet height.{Sheet number 12 in the temp_readings.ods file}
Difference in Temperature
Date Readings Heat load of T S KW's Time Remarks
28/11/2014 08.00 10.55 1 14:30 - 16:00 LHF every 10 min.Sheet 12 18.70 20.61 2 16:20 - 17:00 LHF+RHB “01/12/2014 23.85 26.10 3 10:00 - 12:00 LHF+RH-2 every 10 min.Sheet 12 18.18 19.96 2 12:10 - 14:50 LHB+RHF “02/12/2014 32.36 34.08 4 10:00 - 12:50 All every 10 min.Sheet 12 17.67 19.64 2 14:10 - 15:30 LH-2 “30/12/2014 30.11 30.20 4 12:20 - 15:50 All every 10 min.03/01/2015 32.56 33.87 4 12:30 – 17:00 All “05/01/2015 25.84 27.50 3 12:10 – 17:10 LHF+RF-2 “sheet 15
Average Readings in degCel. 1KW 2KW 3KW 4KW
Themometer 8.0 18.2 24.8 31.7 Temp. Sensors 10.5 20.0 26.8 32.7Conclusions : Temperature Sensor results are about 1 to 2 degCel. more than the Themometer readings. And maximum output temperature for 4 KW is about 46 degCel. (sheet no. 12)
SETUP : 7Rack without any modifications (aluminium cage in the rack removed). Kept 5 feet away from the cool air inlet duct. {Sheet number 17 in the temp_readings.ods file}
Date Readings Heat load of T S KW's Time Remarks
22/01/2015 -1.14 1.24 4 11:40 - 16:00 All every 10 min.Sheet 1723/01/2015 -1.26 2.27 3 10:00 - 14:20 LHB+RH-2 every 10 min.Sheet 17 -3.22 1.27 2 14:30 - 15:50 LHB+RHB “
-5.25 -0.79 1 16:00 - 17:20 RHB “
Average Readings in degCel. 1KW 2KW 3KW 4KW
Themometer -5.2 -3.2 -1.3 -1.1Temp. Sensors -0.8 -1.3 -2.3 +1.2Conclusions : Temperature Sensor results are about 1 to 4 degCel. less than the Themometer readings. And maximum output temperature for 4 KW is about 31.5 on 22/01/2015 sheet no. 17.

SETUP : 8Rack without any modifications (aluminium cage in the rack removed). Kept over the cool air inlet duct. {Sheet number 17 in the temp_readings.ods file}
Difference in Temperature
Date Readings Heat load of T S KW's Time Remarks
24/01/2015 -2.78 -3.35 4 12:30 - 17:10 All every 10 min.Sheet 1830/01/2015 -3.17 -2.20 3 10:30 - 14:50 LHB+RH-2 “Sheet 18 -3.21 -1.70 2 15:00 – 17:10 LHB+RHB “02/02/2015 -2.21 -0.50 1 10:00 - 12:00 LHF “Sheet 18 -3.04 -1.10 2 12:10 – 15:00 LH-2 “
-3.14 -1.68 3 15:10 – 17:20 LH-2+RHB “Average Readings in degCel. 1KW 2KW 3KW 4KW
Themometer -2.2 -3.1 -3.1 -2.8Temp. Sensors -0.5 -1.4 -2.0 -3.3Conclusions : Temperature Sensor results are about 1.5 degCel. more than the Themometer readings. And maximum output temperature for 4 KW is about 9.0 degCel 24/01/2015 sheet no. 18.
Conclusions :
Temperature Difference Range, for the Heat Load ofSetup No. 1 KW 2 KW 3 KW 4 KW Remarks
1 2 – 4 5.5 – 8 10.5 – 12 not done Thermometer4 – 4.5 8 – 8.5 11.5 – 13 not done Temp. Sensors
Average 3.2 7 11.7 not done
2 2 – 4 5 – 8.5 7.2 – 10 11 – 13 Thermometer4 – 5.2 7 – 9.5 10.3 – 12.5 13.5 – 15.5 Temp. Sensors
Average 3.6 7.2 9.8 13.2
3 2 – 4 6 – 9.5 12.3 – 12.7 13.7 – 16.0 Thermometer4 – 6 8.7 – 12 14.6 – 15.3 16.4 – 18.7 Temp. Sensors
Average 4 8 13.8 16.2
4 2.5 – 4.5 8.5 – 11.5 13.5 – 14.8 18.0 – 19.2 Thermometer6.2 – 6.6 12.0 – 13.3 16.5 – 17.7 21.2 – 21.7 Temp. Sensors
Average 4.6 10.9 15.6 19.8

5 3.2 - 6.4 9.2 – 9.6 10.1 - 11.9 17.8 - 19.1 Thermometer2.2 - 5.3 6.1 - 6.8 8.2 – 10.5 11.4 – 13.1 Temp. Sensors
Average 4.3 7.8 10.0 10.4
6 8.0 17.7 – 18.7 23.8 - 25.9 30.1 - 32.5 Thermometer10.5 19.6 – 20.6 26.1 - 27.5 30.2 - 34.0 Temp. Sensors
Average 9.2 19.2 25.8 32.0
7 -5.25 -3.22 -1.26 -1.14 Thermometer-0.79 1.27 2.27 1.24 Temp. Sensors
Average - 3.02 - 1.0 - 0.5 0.05
8 -2.21 -3.04 - -3.21 -3.08 - -3.14 -3.35 Thermometer-0.50 -1.10 - -1.70 -1.68 - -2.20 -2.78 Temp. Sensors
Average -1.35 -2.15 -2.41 -3.1
Setup# with al. plate w/o al. plate (inside the al. cage which obstructs the air flow) Ther / T.Sensor Ther / T.Sensor Remarks 2a 6.23 / 8.89 3.50 / 6.06 -- 3a 9.55 / 10.98 6.12 / 5.33 -- 3b 10.64 / 13.26 10.82 / 12.84 slot in the al. cage at 2' height open.
This temp. diff. increases by 1 degCel., if we put 3 fans of 100cfm at open slot.
V Daily Readings :
Please refer the file temp_readings.ods attached with this report.

VI Air Flow meter User Manual :
Visit the webpage : http://www.extech.com/instruments/product.asp?catid=1&prodid=600
and click at the
English User's Manual under Downloads & Software
for complete User Manual.
ORDocuments available with the Meter.
ORfile “HD350_UM.pdf” attached with this Report.
Introduction :Congratulations on your purchase of the Extech HD350. This handheld meter measures and
displays air velocity (speed), air flow (volume), ambient air temperature, and gauge/differential pressure. This meter is shipped fully tested and calibrated and, with proper use, will provide years of reliable service.