Comparisons of Harmony and Rhythm of Japanese and English
26
Comparisons of Harmony and Rhythm of Japanese and English through Signal Processing by Aiko Nakano Submitted to the Department of Mechanical Engineering in Partial Fulfillment of the Requirement for the Degree of MASSACHUSETTS INST TUTE OF TECHNOLOGY SEP 1 6 2009 LIBRARIES Bachelor of Science at the Massachusetts Institute of Technology June 2009 ARCHIVES © 2009 Aiko Nakano All rights reserved The author hereby grants to MIT permission to reproduce and to distribute publicly paper and electronic copies of this thesis document in whole or in part in any medium now known or hereafter created. Signature of Author ........... .. Department of Mechanical Engineering May 8, 2009 Certified by ... Barbara Hughey, PhD Instructor Thesis Supervisor Accepted by ...................................... ............ .............. Professor J. Lienhard V Collins Professor of Mechanical Engineering Chairman, Undergraduate Thesis Committee
Transcript of Comparisons of Harmony and Rhythm of Japanese and English

Comparisons of Harmony and Rhythm of Japanese and Englishthrough Signal Processing
by
Aiko Nakano
Submitted to the Department of Mechanical Engineeringin Partial Fulfillment of the Requirement for the Degree of
MASSACHUSETTS INST TUTEOF TECHNOLOGY
SEP 1 6 2009
LIBRARIES
Bachelor of Science
at the
Massachusetts Institute of Technology
June 2009
ARCHIVES© 2009 Aiko Nakano
All rights reserved
The author hereby grants to MIT permission to reproduce and to distributepublicly paper and electronic copies of this thesis document in whole
or in part in any medium now known or hereafter created.
Signature of Author ........... ..Department of Mechanical Engineering
May 8, 2009
Certified by ...Barbara Hughey, PhD
InstructorThesis Supervisor
Accepted by ...................................... ............ ..............Professor J. Lienhard V
Collins Professor of Mechanical EngineeringChairman, Undergraduate Thesis Committee


Comparisons of Harmony and Rhythm of Japanese and Englishthrough Signal Processing
by
Aiko Nakano
Submitted to the Department of Mechanical Engineering on May 8, 2009in partial fulfillment of the requirements for the Degree of Bachelor of Science in
Mechanical Engineering
ABSTRACTJapanese and English speech structures are different in terms of harmony, rhythm, and
frequency of sound. Voice samples of 5 native speakers of English and Japanese were collectedand analyzed through fast Fourier transform, autocorrelation, and statistical analysis.
The harmony of language refers to the spatial frequency content of speech and is analyzedthrough two different measures, Harmonics-to-Noise-Ratio (HNR) developed by Boersma(1993) and a new parameter "harmonicity" which evaluates the consistency of the frequencycontent of a speech sample. Higher HNR values and lower harmonicity values mean that thespeech is more harmonious. The HNR values are 9.6+0.6Hz and 8.9±0.4Hz and harmonicitiesare 27±13Hz and 41+26Hz, for Japanese and English, respectively; therefore, both parametersshow that Japanese speech is more harmonious than English. A profound conclusion can bedrawn from the harmonicity analysis that Japanese is a pitch-type language in which the exactpitch or tone of the voice is a critical parameter of speech, whereas in English the exact pitch isless important.
The rhythm of the language is measured by "rhythmicity", which relates to the periodicstructure of speech in time and identifies the overall periodicity in continuous speech. Lowerrhythmicity values indicate that the speech for one language is more rhythmic than another. Therhythmicities are 0.84±0.02 and 1.35±0.02 for Japanese and English respectively, indicating thatJapanese is more rhythmic than English.
An additional parameter, the 8 0th percentile frequency, was also determined from the data tobe 1407±242 and 2021±642Hz for the two languages. They are comparable to the known valuesfrom previous research.
Thesis Supervisor: Barbara Hughey, PhD
Title: Instructor of Mechanical Engineering


Table of Contents
ABSTRACT............................................ 3Table of Contents ..................................................................................................................... 5ACKNOW LEDGEM ENT ....................................................................................................... 6BIOGRAPHICAL NOTE ....................................................................................................... 61. Introduction....................................... 72. Background ......................................................................................................................... 7
2.1.1 Frequency Analysis of Spoken Language................................................................ 72.1.2 Frequency Attributes of Japanese .................................................. ........................ 102.1.2 Frequency Attributes of English ......................................................................... 10
2.2 Autocorrelation: Finding the Repeating Patterns in Tim e ........................................ 102.3 Harmony: Tonal Frequency Content of Spoken Language in Space............................... 11
2.3.1 Harm onics-to-Noise Ratio (HNR) .................................................................... 112.3.2 Harm onicity: A New Param eter of Harm ony ..................................... ....... .. 12
2.4 Rhythm icity: Periodicity of Language in Tim e ............................................................... 133. Experim ental Procedure ......................................................................................................... 14
3.1 Recording Voice Samples.......................................... ................................................... 143.2 Analyzing Voice Samples ................................................................................................ 15
3.2.1 HNR ............................................................................................................................. 153.2.2 Harm onicity ................................................................................................................. 153.2.3 Rhythm icity................................ ............................. ............................................... 163.2.4 80-Percentile Frequency ............................................................. ........................... 16
4. Results and Discussion ................................................ ....................................................... 164.1 Harm ony ............................................................................................................................. 17
4.1.1 Qualitative Analysis for Each Trial ................................... ...................... 174.1.2 Calculation of Harm onics-to-Noise Ratio (HNR) .................................................... 184.1.3 Harm onicity ................................................................................................................. 18
4.2 Rhythm icity........................................ 204.2.1 Qualitative Analysis for Each Trial ......................................................... 204.2.2 Building Blocks for Rhythm icity: 1 Phrase for 1 Speaker .................................... . 214.2.3 Rhythm of the Languages ..................................................... ................................. 21
4.3 Frequency of the Languages ............................................................. ............................ 224.4 Summ ary............................................................................................................................. 23
5. Conclusions and Recomm endations ............................................................................... 23References ..................................................................................................................................... 24Appendices ...................... ............................................................................................. .25
A l Summ ary of the Param eters Used in This Paper.................................... ............ 25A2 Characteristics of Speakers .......................................... ................................................. 25A3 Phrases Used for This Research..................................... ............................................... 26
ACKNOWLEDGEMENT
I would like to thank my thesis advisor Barbara Hughey for helping me develop the theoryfor rhythmicity and also for participating in data analysis. I am grateful for her continued supportsince the initial research, which evolved as a 2.671 class project. I would also like to thank Ms.Miwako Hisagi of the Speech Communications Group at the Research Laboratory of Electronicsat MIT for meeting with me to discuss possible improvements on the initial draft. Many thanksgo to Brian Ross, Edward Cho, Hideo Nakano, Jennifer Moore, Jewel Sharpe, Koji Umeda,Noriko Nakano, Rebecca Smith, and Yuta Kuboyama for willingly agreeing to participate in thisexperiment. Without their participation, this experiment would not have been possible.
Finally, I would like to thank my family and friends for their continued support through thisthesis and throughout my career at MIT.
BIOGRAPHICAL NOTEAiko Nakano is a senior at the Massachusetts Institute of Technology. She is receiving a
B.S. in Mechanical Engineering with minors in Economics and Management in June 2009.
The motivations for this research were her background as a bilingual in Japanese andEnglish and her interests in languages. She is originally from Japan and has spent five years inSeattle before high school, where she learned English. This paper originated as a class project for2.671 Measurement and Instrumentation, which was taught by her thesis advisor.

1. IntroductionWith fluencies in both Japanese and English, the author's personal experience indicates that
the pitch of voice and rhythm of the two languages are significantly different. Her voice is higherin tone when speaking in English than in Japanese, and the ways that she stresses syllables aredifferent. Linguistics studies show that in Japanese, stresses are given by lowering or raising thetone of voice. In English, stresses are given by changing the volume of speech.1
The present study compares Japanese and English speech by analyzing frequency spectra of5 phrases spoken by 5 native speakers of each of the two languages. Each voice samplerecording is analyzed through fast Fourier transform, correlation function techniques, and simplestatistical methods. We use Praat, a signal processing program developed by Boersma, to find theharmonics-to-noise-ratio of the signal. New parameters, "harmonicity" and "rhythmicity", areintroduced, which measure how musical or rhythmic the language is. Harmonicity is defined asthe standard deviation of the spacing between frequency peaks in the Fourier spectrum of thevoice sample. Rhythmicity is defined from the frequency spectrum of the autocorrelationfunction as the width encompassing 20% - 80% of the total power divided by the centralfrequency. Additionally, the "frequency" for each language is defined as the frequency thatincludes 80% of the total power in the Fourier spectrum of the voice sample.
Previous research has been performed on rhythmicity 7 and harmonicity 18' 19,20 in differentcontexts such as for musical instruments or measuring the hoarseness of voice. However, themethods developed by Boersma or Kohler and Yumoto et al. have not been widely used in thecontext of comparing the rhythm and harmony of languages. The concepts of harmonicity andrhythmicity as used in the present work were independently developed by the author and B.Hughey and differ from Boersma's or Kohler and Yumoto's definitions.
We find that the results of this experiment agree with the linguistics research that Japanese isa pitch language and English is not. Additionally, the frequencies of the languages can becompared with the accepted values: Japanese has a frequency of 400-1200 Hz and English has afrequency of 1500-5000 Hz.5 Further research with a variety of languages would be helpful indemonstrating the general usefulness of the two new parameters, harmonicity and rhythmicity.
2. Background
2.1.1 Frequency Analysis of Spoken LanguageAny time-varying signal can be mathematically expressed as superposition of sine waves,
and a particular tone can be described by a combination of a fundamental frequency and itsharmonic (integer) multiples. Figure 1 shows the frequency of an Al note played on violin in thetime and frequency domain. On the top chart, we can observe the repeating pattern that looks likea mountain with three bumps. Each of these bumps corresponds to the three peaks in the bottomchart: 900, 1800, and 2700 Hz. 900Hz is the fundamental frequency of the Al note, and thehigher two frequencies are its harmonics.

0 2x10 - 3 4x10- 3 6x10- 3 8x10 - 3
Time (s)
Sound Power Spectrum
5x10
0 lx103 2x10 3 3x10 3 4x10 3 5x10³
Frequency (Hz)
Figure 1 The Al note played on a violin in the time (top) and frequency (bottom) domain.
Similarly, speech can be expressed as superposition of sine waves. The frequency range for
vowels is typically 300-1000Hz, whereas that for consonants is higher at 1000-3000Hz. 4 The
vowels have solid tones typically expressed by multiples of fundamental frequencies, often
related in frequency by simple integer ratios. In Figure 2, the frequency spectra of the five vowel
sounds are shown as measured in the present study. The number of peaks varies for different
sounds, but they all have peaks at consistent intervals, resulting in a clear tone. The sound power
spectrum much resembles that of violin shown in Figure 1.
In contrast, consonants have higher and broader frequency components made of harmonics
of many unrelated fundamental frequencies. For example, sounds such as "sh" consist of many
non-harmonic components, giving a non-systematic frequency pattern.3 This sound is shown in
the Frequency domain in Figure 3. The less distinct peaks and unequal spacing between them
suggest existence of more than one fundamental frequency.
0.01

A I
Sound Power Spectrum Sound Powe Spectrum
3x10⁻³ 0.02 -
x10- 3
0.01
0 500 1x10³
1.5xIO3
2O 0 500 lxl03 1.5x10³ 2xO3
Frequency (Hz) Frequmcy (Hz)
U E
Sound Power Spectrum0.06 ,Sound Pown Spectrum
0.015
0.01
0.02 5x10⁻³
0 50 1x10³
1.5x10³
2x10³
0 500 lx103 1.5x03 2103
Frequency (Hz) Frequency (Hz)
O
Sound Power Spectrum
0.03
0.02-
0.01-
0 500 Ixl03
1.5x03
2x10³
Frequacy (Hz)
Figure 2 The five Japanese consonant sounds each have one fundamental frequency.
Sound Power Spectrum
2103
4x10³
Frequency (Hz)
Figure 3 The sound power spectrum of a consonant sound "sh" contains more than onefundamental frequency sound as shown by the noisy spectra and unequal peak spacing.
8x10³

2.1.2 Frequency Attributes of Japanese
The frequency of Japanese speech is typically 400-1200Hz. It is a low frequency language,because all Japanese sounds end with a vowel sound due to its one-to-one vowel and consonantstructure. Since vowels have specific frequencies associated with them, as shown in Figure 2, wewould expect that the frequency spectra of Japanese speech have distinct peaks at consistentintervals.
In linguistics term, Japanese is called a pitch-type language because the syllables arestressed by changing the pitch, or the frequency of the sound. 1
2.1.2 Frequency Attributes of English
On the other hand, English sound structure is not very consistent when compared toJapanese and has higher frequency of 1500-5000Hz. American English has fifteen differentvowel sounds, and at times the vowel sound can be reduced, such as the "a" in "about".Furthermore, the frequency structure is made more complex by the silent consonant sounds suchas "sh", as shown in Figure 3. Such English consonants have frequencies as high as 8,000 or10,000Hz. 5
We call English a stress-type language because syllables are stressed by changing therelative prominence/loudness during pronunciation. 2
Table 1 summarizes the characteristics of Japanese and English discussed above. The resultsfrom this experiment are compared with the data in the table.
Table 1 Key Properties of Japanese and English
Japanese English
Type Pitch Stress
Stress on syllables by Tone of voice (frequency of Volume of voice (amplitude ofsound) sound)
Structure Each sound is vowel + Many vowel sounds, silentconsonant syllables, and many consonants
Frequency 400 - 1200 Hz 1500 - 5000 Hz
2.2 Autocorrelation: Finding the Repeating Patterns in TimeAutocorrelation is the cross-correlation of a signal with itself. For a time signal x(t) that is
stationary (statistics are constant), the autocorrelation rx() shifts one wave form by a time-lag t
defined as
rx () = Ix(t)x(t + r)dt (1)
and finds a repeating pattern within itself. It can be used to find a periodic signal which is buriedunder noise or to identify the missing fundamental frequency in a signal implied by its harmonicfrequencies. In Figure 4, autocorrelation reveals a sinusoidal pattern within an otherwise rather

noisy signal. A noisy and less rhythmic sound appears as a vertical line at zero lag. The FFT of
the original sound file and the Fast Fourier Transform of the autocorrelation function result in the
same peak positions, as shown in Figure 5, but autocorrelation picks out repeating frequencies.
Therefore, we can expect that the fundamental frequencies of the vowel sounds will be extracted
out and the "noisy" consonant sounds such as "sh" is eliminated by the autocorrelation function.
autocorrelation0.2
0.1
0 5 10 15 2(
Time (s)
2-
0 4
-2-i
autocorrelation
0 5 10 15 20
Time (s)
0 2 4 6 8 1(
Lag (s)
Pattern - rhythmic
0 10 20 30 40 5
Lag (s)
Figure 4 Autocorrelation removes the noise by collecting the non-repeating frequencies near time
0.FFT of X WITH NOISE FFr ofAutocorrelation of X WITH NOISE
01
autocorrelatio
0
Frequency (Hz) Frequaecy (Hz)
Figure 5 Autocorrelation on the FFT extracts the repeating pattern.
2.3 Harmony: Tonal Frequency Content of Spoken Language in Space
2.3.1 Harmonics-to-Noise Ratio (HNR)
The Harmonics-to-Noise ratio (HNR) was developed by Pal Boersma at the Institute of
Phonetic Sciences at University of Amsterdam and can be calculated using Praat2 1, a speech
analysis tool for phonetics, developed by him and his colleague D. Weenink. We will use his
methods as one of the ways to analyze the harmony of the speech. The following paragraphs are
taken from Boersma's paper, "Accurate Short-term analysis of the Fundamental Frequency and
the Harmonics-to-Noise Ratio of a Sampled Sound" (1993).20
I I I I
Noise - not rhythmic
| ivi
I
nn~w~U~~'m~ ltnl TYmr n r urrrr*rrr~nluru r nr rnrIrl~L

[As shown in Figure 4 for the non-rhythmic sound, the autocorrelationfunction (1)] has a global maximum for '=0. If there are also global maximaoutside 0, the signal is called periodic and there exists a lag To, called the period,so that all these maxima are placed at the lags nTo, for every integer n. Thefundamental frequency fo of this periodic signal is defined as fo=1/To. If there areno global maxima outside 0, there can still be local maxima. If the highest ofthese is at a lag Tmax, and if its height rx(Tmax) is large enough, the signal is said tohave a periodic part, and its harmonic strength Ro is a number between 0 and 1,equal to the local maximum rx'(tmax) of the normalized autocorrelation.
rx) r _ ) (2)
We could make such a signal x(t) by taking a periodic signal H(t) with aperiod To and adding a noise N(t) to it. We can infer from equation (1) that ifthese two parts are uncorrelated, the autocoffrelation of the total signal equals thesum of the autocorrelations of its parts. For zero lag, we have rx(0) = rH(O) + rN(O),and if the noise is white (i.e., if it does not correlate with itself), we find a localmaximum at a lag "cmax = To with a height rx(tmax) = rH(To) = rH(O). Because theautocorrelation of a signal at zero lag equals the power in the signal, thenormalized autocorrelation at tmax represents the relative power of the periodic (orharmonic) component of the signal, and its complement represents the relativepower of the noise component:
rH (0) , ()(3)r' (max) X () - 1 - r )-
m x (0) r (0)
This allows us to define the logarithmic harmonics-to-noise ratio (HNR) asr' r,(rnx ) (4)
HNR = 10 x log r 'x (rmx )(4)
HNR measures "the degree of acoustic periodicity" by comparing the relative magnitudes ofthe harmonics and the noise. It is expressed in dB; if 99% of the energy of the signal is in theperiodic part, and 1% is noise, the HNR is 10*logl0(99/1) = 20 dB. A HNR of 0 dB means thatthere is equal energy in the harmonics and in the noise. Hence, the higher the HNR ratio, themore harmonic the sound is.
2.3.2 Harmonicity: A New Parameter of Harmony
This paper proposes another method of measuring the harmony of the language, bymeasuring the consistency of spacing between frequency peaks. We will call this harmonicity H,and define it as
H = o(Afi) Vi = 1,2,...n (5)
where (T is the standard deviation and Af is the peak frequency spacing in the Fourierspectrum of a recorded sound, as shown in Figure 6. In this case, H is close to a value of zero,

because the frequency peaks are equally spaced and thus there is no variation in the spacing.
Low value of harmonicity means that there are a small number of fundamental frequencies and
therefore the speech can be called "harmonious" in terms of its frequency content. If harmonicity
for 5 phrases for one language is consistently lower than the other, it can be said that that
language is more harmonious than the other. The harmonicity is a more sensitive measure of the
harmony than HNR, because it considers more than one periodic signal.
The parameters and their definitions are summarized in Appendix Al.
Sound Power Spectrum310-33x10
2x10⁻³
1 0-3 Ixi Afi ,f2 A3 Af4
~ _ _
3lx 01x10 2x10³ 3x10
Frequency (Hz)
Figure 6 Harmonicity H is the standard deviation of the frequency spacing, Afi through fs.
2.4 Rhythmicity: Periodicity of Language in Time
The main rhythm of spoken language is determined by applying the Fourier transform to the
autocorrelation function. For example, if there is only one peak at non-zero frequency, thespeech has one repeating beat. Conversely, multiple frequency peaks indicate a rhythmiclanguage with more complicated structure. The figure of merit for rhythmicity is defined in this
work as
(6)Rh =
where 8 is the difference in frequencies between the 2 0 th and 8 0 th percentile integrated power inthe Fourier transform of the autocorrelation function. It is normalized by fo, which is the 5 0th
percentile of the integrated power. The steps to obtain the figure of merit are schematicallyshown in Figure 7. A lower value of Rh means that the speech is more rhythmic.
U

Autocorrelation functionFourier Transform o-3_
0 A A 2xl0 3-
-1i
0 0.01 0.02 0.03 0.04 0 1x10³ 2X10³ 3xl03
Time lag (s) Te Ig)Frequency (Hz)
80% of Integrated Power0.015
0.01 50% of Integrated Power
10-- 20% of Integrated Power-0r
Integral ofFourier powerspectrum
0 lxl03
2x10³ 3x10³
fo Frequency (Hz)
Figure 7 The rhythmicity parameter of a speech sample is calculated from the integratedfrequency spectrum of autocorrelation function. Shown above are the steps used to calculaterhythmicity for Japanese speaker 1, phrase 1, trial 1.
3. Experimental ProcedureVoice samples of five native speakers of Japanese and English were collected for five
phrases, which are listed in the Appendix 3. Each phrase was recorded 5 times. English speakerswere asked to say only the English phrases, and Japanese speakers were asked to speak only theJapanese phrases, to control for the frequency differences intrinsic to the languages. One mayexpect that a female subject would have a higher tone of voice than a male subject, and ayounger person would have a higher pitch than an older person. These differences do not affectour results; however, because all of our parameters are normalized. The 8 0th percentile frequencydata is not normalized, but a general comparison of the frequencies sufficed for the purpose ofthis paper. Appendix A2 summarizes the characteristics of each of the eight speakers.
The collected voice samples were analyzed using Praat2 1, autocorrelation, and Fouriertransform techniques as described above to determine the HNR, harmonicity, rhythmicity, andthe 80th percentile frequency of each sample.
3.1 Recording Voice SamplesThe voice samples were recorded using a microphone (audio-technica ATR25 Stereo
Microphone) and Sound Recorder application on a Windows operating system. All samples wererecorded at the best quality available (PCM 48.000 kHz, 16 Bit, Stereo).
Five phrases were randomly selected for each language, famous sayings that vary in lengthand intonation. Each person said each phrase 5 times, resulting in a total of 25 measurements.Each phrase was recorded as one continuous recording for consistency, and then segmented intoseparate trials

3.2 Analyzing Voice Samples3.2.1 HNR
Praat21 was used to calculate the HNR values. After the voice sample is read by the program,we used Harmonicity (cc) function under Periodicity, where (cc) refers to cross-correlation.Since we want to find a repeating pattern within one recording, cross-correlation in this case isequivalent to auto-correlation. The recommended parameters of time step 0.01 seconds,maximum pitch 75 Hz, silence threshold 0.1, and periods per window 1.0 were used. Finally, weobtained the mean HNR value.
3.2.2 Harmonicity
The Sound Analysis 5 code written in MathCAD by Prof. I. W. Hunter was used to apply theFourier transform to each voice recording. An example frequency spectrum is shown in Figure 8.The frequency of each peak was manually determined, and the value of each interval betweenadjacent peaks was then calculated in order to determine harmonicity, as described in Section2.3.2. The selections of peaks are based on the two criteria:
(1) the peak was at least 10% of the maximum power
(2) if the peak was less than 10% of the maximum power, the peak was still selected if it wasfar enough away from and had power much greater than its neighbors
For example, the power of the fifth peak in Figure 8 is less than 10% of the power of thethird (highest) peak. However, it satisfies criteria (2), so it was considered a distinct peak.
Sound Power Spectrum3x10
Maximumpower
2x10- 3
Peak selected because it satisfiescriteria (2)
0 1x10 3 2x10 3 3x10 3
Frequency (Hz)
Figure 8 Fast Fourier Transform plot for English Speaker 1, phrase 1, trial 2.

3.2.3 Rhythmicity
Similarly, the rhythmicity was found by manually selecting the 2 0 th, 50th and 8 0 th percentilefrequencies of the integrated autocorrelation FFT as described in Section 2.4. AnAutoCorrelation'o code written by Prof. I. W. Hunter was used for this analysis.
3.2.4 80-Percentile Frequency
Lastly, the 80th percentile frequency was found by taking the numerical integral of thefrequency spectra and selecting the frequency that intersected the horizontal 80% line (Figure 9).Sound Analysis5 code was again used for this measurement.
Integrated Fourier Spectrum
fo lxlO3 2103
Frequency
Figure 9 The 80th percentile frequency tells the frequency of the language.
4. Results and Discussion
3x10 3
We find that the HNR value is higher, and harmonicity and rhythmicity values are lower forJapanese than English. Hence, Japanese is more harmonious and rhythmic than English. Inaddition, we confirm that the frequency of the language is lower for Japanese than for English.
The qualitative analysis of harmonicity and rhythmicity is presented first, followed by thequantitative results. Qualitative analysis reveals interesting traits of each language, such as theword structure and the type of language. For the quantitative analysis, the voice samples areanalyzed on the micro- and macro- scales: each trial for each word for one person and thecomparison of average harmonicities for the two languages. Lastly, the 8 0th percentile frequencymeasurements are presented.

4.1 Harmony
4.1.1 Qualitative Analysis for Each Trial
Qualitative examination of the sound power spectrum can give much insight about each
language. Figures 10 and 11 are representative sound power spectra of Japanese and English;
other Japanese and English frequency spectra exhibit similar patterns. Figure 10 shows that
Japanese has three distinct peaks below 1000 Hz, and Figure 11 shows that English has at least 6
peaks. In fact, 11 peaks are analyzed for Figure 11, since each of these peaks has power of at
least 10% of the maximum power. A quick comparison reveals that not only does English have
smaller spacing intervals, but these intervals are not as systematic as that of Japanese. On the
other hand, Japanese has consistent intervals and thus is harmonious.
The frequency spectra also show the stronger presence of frequencies above 2000 Hz for
English than for Japanese. This supports the known finding that English speech consists of many
consonant sounds, since consonants have much higher frequency than vowels.
Sound Power Spectrum4x10-
3
3x10⁻³
2x10⁻³
1x10
0 1x10 3 2x10 3 3x10 3 4x10 3
Frequency (Hz)
Figure 10 A sound power spectra for Japanese speaker 1, phrasefrequency intervals, and so Japanese is harmonious.
1.5x10 - 3
1, trial 1. The peaks have similar
Sound Power Spectrum
0 1x10 3 2x10 3 3x10 34x10
3
Frequency (Hz)
Figure 11 A Sound power spectrums for English speaker 1, phrase 1, trial 4. The frequencyspacing is not consistent, so it is not harmonious.

4.1.2 Calculation of Harmonics-to-Noise Ratio (HNR)The mean HNR values are 9.6+0.6 dB for Japanese and 8.9±0.4dB for English. The HNR
values for each of the five phrases averaged over the five speakers are shown in Figure 12. Thetwo values are within the 95% confidence intervals of each other, but Student's t-test shows thatwe can be 76% confident that Japanese is more harmonious than English.
18
16 Japanese English Average
14
12
10
z 8 16 ; iU
, II4
2 II0
0 1 2 3 4 5 6 7 8 9 10 Japanese EnglishPhrase
Figure 12 The HNR for the two languages. T-test analysis gives a 76% chance that Japanese HNRis higher than that of English.
Figure 12 shows the results for all five phrases for a single Japanese speaker and a differentEnglish speaker. The five different Japanese phrases are shown as trials 1-5, and the Englishphrases are shown as trials 6-10. All error bars display the 95% confidence interval calculatedusing standard statistical techniques for small numbers of samples. 9 The average values of the 5data points for Japanese and English on the left are plotted to the right of the double dashed line.Their 95% confidence intervals are computed using all values used to calculate the averages, sothey are not merely the average 95% confidence interval values of the five data points. The samechart format is used throughout the Results section.
4.1.3 Harmonicity
4.1.3.1 Building Blocks for Harmonicity: 1 Phrase for 1 SpeakerThe analysis of the harmonicity of a particular language requires averaging over multiple
speakers and multiple phrases, but useful qualitative information can be gained by comparingresults for a single phrase and a single speaker. Only in this section, we present the results as"average frequency spacing ± harmonicity" to emphasize the large variance of the Englishspeakers.
The first phrase for one Japanese speaker results in average frequency spacing of 273±10 Hz,and that for the English speaker is 168±31 Hz. The lower average value for English shows thatthe English phrase has more prominent peaks close to each other. More importantly, the largevariance for English shows that the frequencies are not equally spaced and that there is more thanone fundamental frequency, as expected from the complex English speech structure. On the other
18

hand, the 95% confidence interval for Japanese is roughly a third of that of English. This meansthat the variance of the spacing is small, so Japanese is more harmonious than English.
Figure 13 demonstrates that Japanese has consistent frequency spacing and small variance foreach trial. This implies that Japanese speech can be controlled purely by changing the frequencyor the pitch. From this we can infer that Japanese is a pitch language and new learners ofJapanese can acquire a native-like speech by practicing to say each syllable consistently. On theother hand, English frequency intervals vary significantly for the same phrase, even though eachtrial sounded consistent to our ears. Hence, English uses different pitches (or frequencies) to saythe same phrases and is not a pitch language.
... .. --.... ..--------.. ------- -
; Englisha
o
I
o
I
o
I
t
I;
1 2 3 4 5 7
Trial
Average
f
9 10 H. Japanese
Figure 13 The averages and 95% confidence intervals of frequency spacing for 5 trials of onephrase for one Japanese and one English speaker. The average of the 5 trials is the averagefrequency spacing for the phrase for one speaker.
4.1.3.2 Harmonicity of the Language
The harmonicity of each language is found by averaging the harmonicities of each phrasefor each speaker. The average of this value is the average harmonicity, shown next to the doubledashed lines. Japanese has harmonicity of 27+13 Hz, and English has harmonicity of 41+26 Hz,as shown in Figure 14. We are 90% confident that Japanese is more harmonious than Englishfrom performing Student's t-test.
English
2 3 4 5 6
- ----------
7 8 9
Phrase
Average
N Japanese Englisil i
J1.-..--------------- ---
Figure 14 The harmonicity for each phrase averaged over all speakers.
Japanese
English
Japanese
I
i
i

4.2 Rhythmicity
4.2.1 Qualitative Analysis for Each Trial
Before the rhythmicity figure of merit is presented, it is useful to examine the frequencyspectra of the autocorrelation functions for each language as shown in Figure 15. Japanese hasonly one main frequency peak, meaning that the language has one beat. On the other hand,English has several prominent peaks. It has a mixture of beats in its rhythm, and so it is not asrhythmic as Japanese. This information is imbedded in the figure of merit, since more peaks leadto a broader 6 as shown in Figure 15, and thus higher value of Rh.
0
0 P1
I
0 0.01 0.02 0.03 0.04 0 0.01 0.02 0.03 0.0
Time Lag (s) Time Lag (s)
I-L. 6-10
.L 8x10⁻⁴
4×10- 610-_
2 x0 -4x10-
210-10
L. 2x10⁴_Ixl0
0 0 110 2x10³ 310' 0 1x10³ 2xo 3x10
Frequency(Hz) Frequecy (Hz)
0.02 6
Sic 80% of Integrated Power i 80% of Integrated ower
50in of Integrated Power 50% of Integrated Pow
10 - 20% of Integrated Powel- 20% of Intted Powe
0 lx0 2x10³
3xl03
l 20 3x10
ll FFrequency (Hz)
Frequency (Hz)
Figure 15 A typical Japanese and English autocorrelation function, its Fourier spectrum, and theintegrated Fourier spectrum. As described in the text, English has more peaks because ofinconsistent rhythm.
Japanese English

4.2.2 Building Blocks for Rhythmicity: 1 Phrase for 1 Speaker
Again, the analysis of rhythmicity of a particular language requires averaging over multiplespeakers and multiple phrases, but useful qualitative information can be gained by comparingresults for a single phrase and a single speaker.
The individual trial results in Figure 16 show that the average rhythmicity is consistent foreach trial for Japanese. This is perhaps because every syllable is enunciated in Japanese and isgiven equal length of pronunciation. Since every Japanese sound is a combination of a vowel anda constant sound, the vowel sound is repeated in each sound, and the speech can be veryrhythmic. On the other hand, both the average and variance varied for English, even though thespeaker was saying the same phrases repeatedly. For Trial 6, the 95% confidence interval is wide,meaning that the speaker did not say the phrase very rhythmically. On the other hand, Trial 7 hasa very tight confidence interval. This shows that the speaker can easily change her speech tobecome rhythmic or arrhythmic because English speech is controlled by the volume of speech.
The two numbers to the right of the double dashed lines in Figure 16 show the rhythmicitiesof Japanese and English: 0.454+0.086 and 1.44+0.52 respectively. The low rhythmicity valuemeans that Japanese is more rhythmic, and the tight 95% confidence interval shows thatJapanese speech is consistently rhythmical over the 5 phrases. On the other hand, English hasmixed beats. Since the 95% confidence intervals do not overlap for the two languages, therhythmicities of Japanese and English are significantly different. In fact, Student's t-test showsthat the rhythmicity value is lower for Japanese than English with 98% confidence.
Japanese English Average6
5112- II5 I I.V 4, II
1 2 3 4 5 6 7 8 9 10 Japanese English
Trial
Figure 16 The rhythmicity of the two languages for one speaker for one phrase. Japanese is morerhythmic than English.
4.2.3 Rhythm of the Languages
The rhythmicity of Japanese is 0.84±0.02 and that of English is 1.35+0.02. Thus, Japanese ismore rhythmic than English. Furthermore, the 95% confidence interval does not overlap at all,hence the rhythms of the two languages are significantly different. Surprisingly, the standarddeviation of the average rhythmicity for English resulted in a very small variance, when theconfidence interval was calculated from all 125 sets of data used in this experiment, as shown inFigure 17.
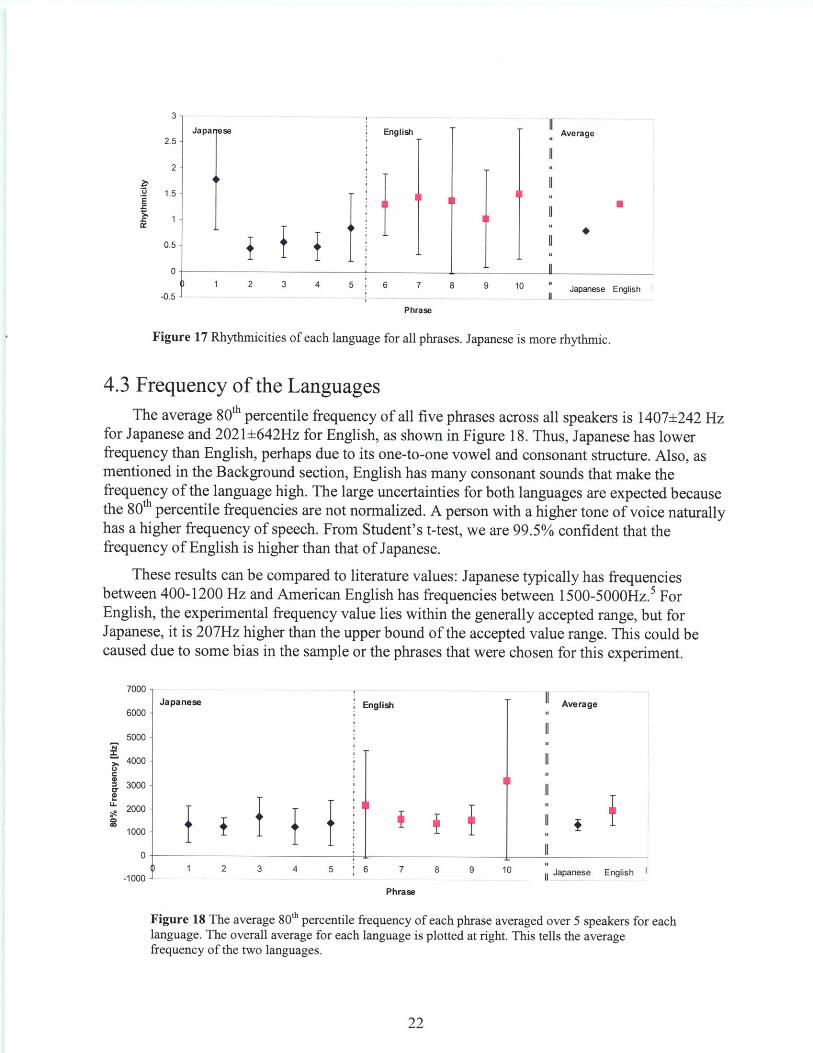
Japa ese English Average2.5 "
II2
. 1.5
- II
0.5
0-
1 2 3 4 5 6 7 8 9 10 Japanese English-0.5 .
Phrase
Figure 17 Rhythmicities of each language for all phrases. Japanese is more rhythmic.
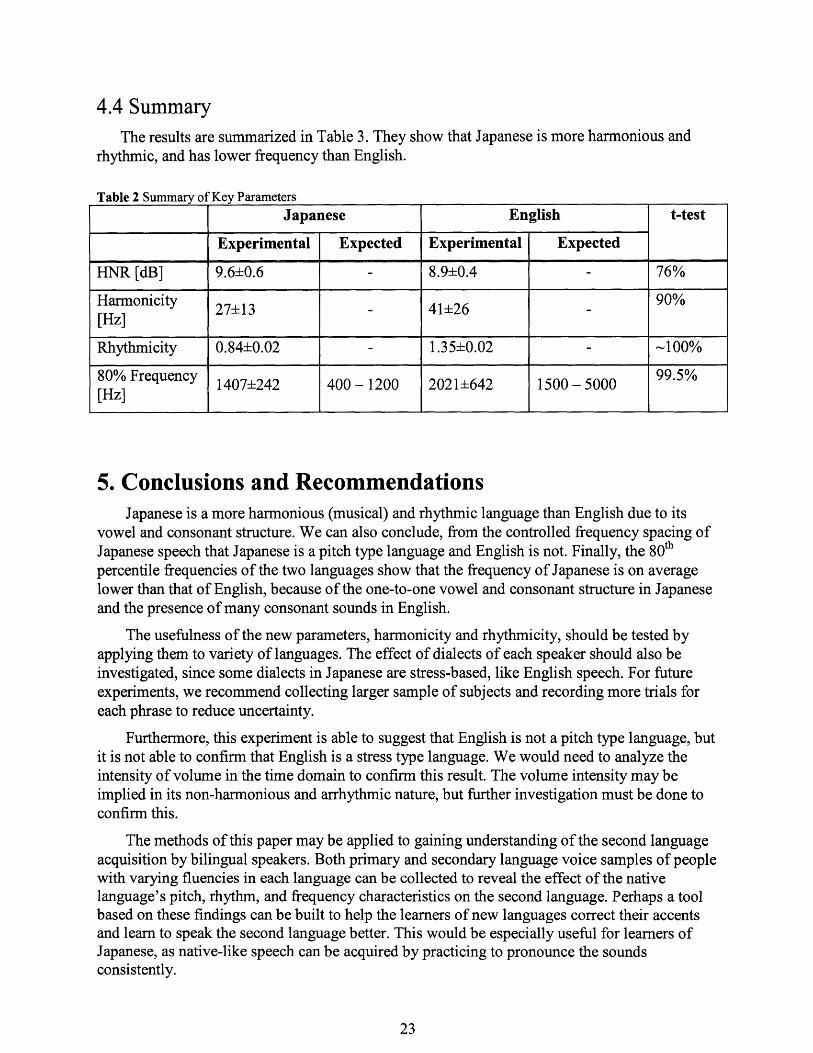
4.3 Frequency of the LanguagesThe average 80th percentile frequency of all five phrases across all speakers is 1407±242 Hz
for Japanese and 2021±642Hz for English, as shown in Figure 18. Thus, Japanese has lowerfrequency than English, perhaps due to its one-to-one vowel and consonant structure. Also, asmentioned in the Background section, English has many consonant sounds that make thefrequency of the language high. The large uncertainties for both languages are expected becausethe 80th percentile frequencies are not normalized. A person with a higher tone of voice naturallyhas a higher frequency of speech. From Student's t-test, we are 99.5% confident that thefrequency of English is higher than that of Japanese.
These results can be compared to literature values: Japanese typically has frequenciesbetween 400-1200 Hz and American English has frequencies between 1500-5000Hz. 5 ForEnglish, the experimental frequency value lies within the generally accepted range, but forJapanese, it is 207Hz higher than the upper bound of the accepted value range. This could becaused due to some bias in the sample or the phrases that were chosen for this experiment.
7000Japanese English Average
6000
5000
4000 II
3000-. 000 II
1000
0I1000 1 2 3 4 5 6 7 8 9 10 Japanese English-1000 '.
Phrase
Figure 18 The average 80th percentile frequency of each phrase averaged over 5 speakers for eachlanguage. The overall average for each language is plotted at right. This tells the averagefrequency of the two languages.
4.4 SummaryThe results are summarized in Table 3. They show that Japanese is more harmonious and
rhythmic, and has lower frequency than English.
Table 2 Summary of Key Parameters
Japanese English t-test
Experimental Expected Experimental Expected
HNR [dB] 9.6±0.6 - 8.9±0.4 - 76%
Harmonicity 27±13 41±26 90%[Hz]
Rhythmicity 0.84±0.02 - 1.35±0.02 - -100%
80%Frequency 1407±242 400-1200 2021±642 1500- 5000[Hz]
5. Conclusions and RecommendationsJapanese is a more harmonious (musical) and rhythmic language than English due to its
vowel and consonant structure. We can also conclude, from the controlled frequency spacing ofJapanese speech that Japanese is a pitch type language and English is not. Finally, the 8 0th
percentile frequencies of the two languages show that the frequency of Japanese is on averagelower than that of English, because of the one-to-one vowel and consonant structure in Japaneseand the presence of many consonant sounds in English.
The usefulness of the new parameters, harmonicity and rhythmicity, should be tested byapplying them to variety of languages. The effect of dialects of each speaker should also beinvestigated, since some dialects in Japanese are stress-based, like English speech. For futureexperiments, we recommend collecting larger sample of subjects and recording more trials foreach phrase to reduce uncertainty.
Furthermore, this experiment is able to suggest that English is not a pitch type language, butit is not able to confirm that English is a stress type language. We would need to analyze theintensity of volume in the time domain to confirm this result. The volume intensity may beimplied in its non-harmonious and arrhythmic nature, but further investigation must be done toconfirm this.
The methods of this paper may be applied to gaining understanding of the second languageacquisition by bilingual speakers. Both primary and secondary language voice samples of peoplewith varying fluencies in each language can be collected to reveal the effect of the nativelanguage's pitch, rhythm, and frequency characteristics on the second language. Perhaps a toolbased on these findings can be built to help the learners of new languages correct their accentsand learn to speak the second language better. This would be especially useful for learners ofJapanese, as native-like speech can be acquired by practicing to pronounce the soundsconsistently.

References1 Iwate University, "Acoustic Analysis of Japanese Spoken Language", http://sp.cis.iwate-u.ac.jp/sp/lesson/j/doc/accent.html
2 University of Washington, Symbols for American English Vowel Sounds,http://faculty.washington.edu/dillon/PhonResources/newstart.html
3 M. Ross, Rehabilitation Engineering Research Center on Hearing Enhancement,http://www.hearingresearch.org/Dr.Ross/Audiogram/Audiogram.htm
4 R. J. Baken, "Clinical Measurement of Speech and Voice", London: Taylor and Francis Ltd,1987.5K. Murase, "Most Effective Method to Learn a Foreign Language", Nihon ZitsugyouShuoppansha.
6 P. Bourke, University of Western Australia, http://local.wasp.uwa.edu.au/-pbourke/other/dft/
7 I. W. Hunter, "Fourier Analysis," 2.671 Measurement and Instrumentation, MIT, Spring 2008(unpublished).
8 I. W. Hunter, "Sound Analysis," 2.671 Measurement and Instrumentation, MIT, Spring 2008(unpublished).
9 I. W. Hunter and B. J. Hughey, "Uncertainty Analysis," 2.671 Measurement andInstrumentation, MIT, Spring 2008 (unpublished).10 I. W. Hunter and B. J. Hughey, "AutoCorrelation Analysis of WAV Files," 2.671Measurement and Instrumentation, MIT, Spring 2008 (unpublished).I M. Ross, Rehabilitation Engineering Research Center on Hearing Enhancement,http://www.hearingresearch.org/Dr.Ross/Audiogram/Audiogram.htm12 P. Ladefoged, "Phonetic Data Analysis", Malden: Blackwell Publishing, 2003.14 L. R. Waugh and C.H. van Schooneveld, "The Melody of Language", Baltimore: UniversityPark Press, 1980.15 D. Gibbon and H. Richter, "Intonation, Accent, and Rhythm", Berlin: Walter de Gruyter &Co., 1984.16 p. Warren, "Prosody and Parsing", Erlbaum: Psychology Press, 1996.
17 K. J. Kohler, "Rhythm in Speech and Language, A New Research Paradigm", Phonetica 2009;66:29-4518 E. Yumoto, W. J. Gould, and T. Baer, "Harmonics-to-noise ratio as an index of the degree ofhoarseness", Journal of Acoustic Society of America 1982: 71(6)
19 J. C. Brown, "Frequency ratios of spectral components of musical sounds", Journal ofAcoustic Society of America 1996: 99(2)20 Paul Boersmia, "Accurate Short-term analysis of the Fundamental Frequency and theHarmonics-to-Noise Ratio of a Sampled Sound", Institute of Phonetic Sciences, University ofAmsterdam, Proceedings 17 (1993), 97-110.
21 Paul Boersma & David Weenink (2009): Praat: doing phonetics by computer (Version 5.1.05)[Computer program]. Retrieved May 1, 2009, from http://www.praat.org/
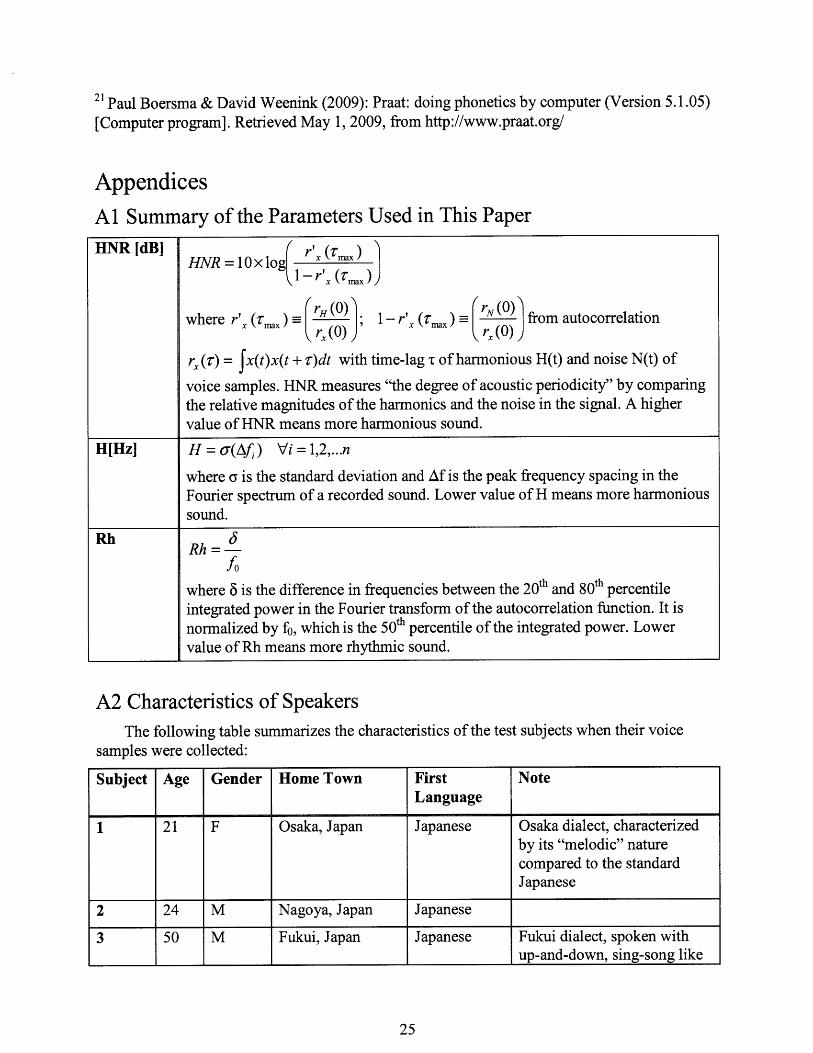
AppendicesAl Summary of the Parameters Used in This Paper
HNR = 10 x log
where r' x (rmax )
r x (rmax
1- r'x (rmax)
r,(0)(o)1rx (0) 1- r'x (rx)- rN (0) from autocorrelationrx (0))
r, () = Ix(t)x(t + r)dt with time-lag t of harmonious H(t) and noise N(t) of
voice samples. HNR measures "the degree of acoustic periodicity" by comparingthe relative magnitudes of the harmonics and the noise in the signal. A highervalue of HNR means more harmonious sound.
H[Hz] H = o(Af ) Vi = 1,2,...n
where o is the standard deviation and Af is the peak frequency spacing in theFourier spectrum of a recorded sound. Lower value of H means more harmonioussound.
Rh =
where 8 is the difference in frequencies between the 2 0 th and 8 0 th percentileintegrated power in the Fourier transform of the autocorrelation function. It isnormalized by fo, which is the 5 0 th percentile of the integrated power. Lowervalue of Rh means more rhythmic sound.
A2 Characteristics of SpeakersThe following table summarizes the characteristics of the test subjects when their voice
samples were collected:
Subject Age Gender Home Town First NoteLanguage
1 21 F Osaka, Japan Japanese Osaka dialect, characterizedby its "melodic" naturecompared to the standardJapanese
2 24 M Nagoya, Japan Japanese
3 50 M Fukui, Japan Japanese Fukui dialect, spoken withup-and-down, sing-song like
HNR [dB]
manner
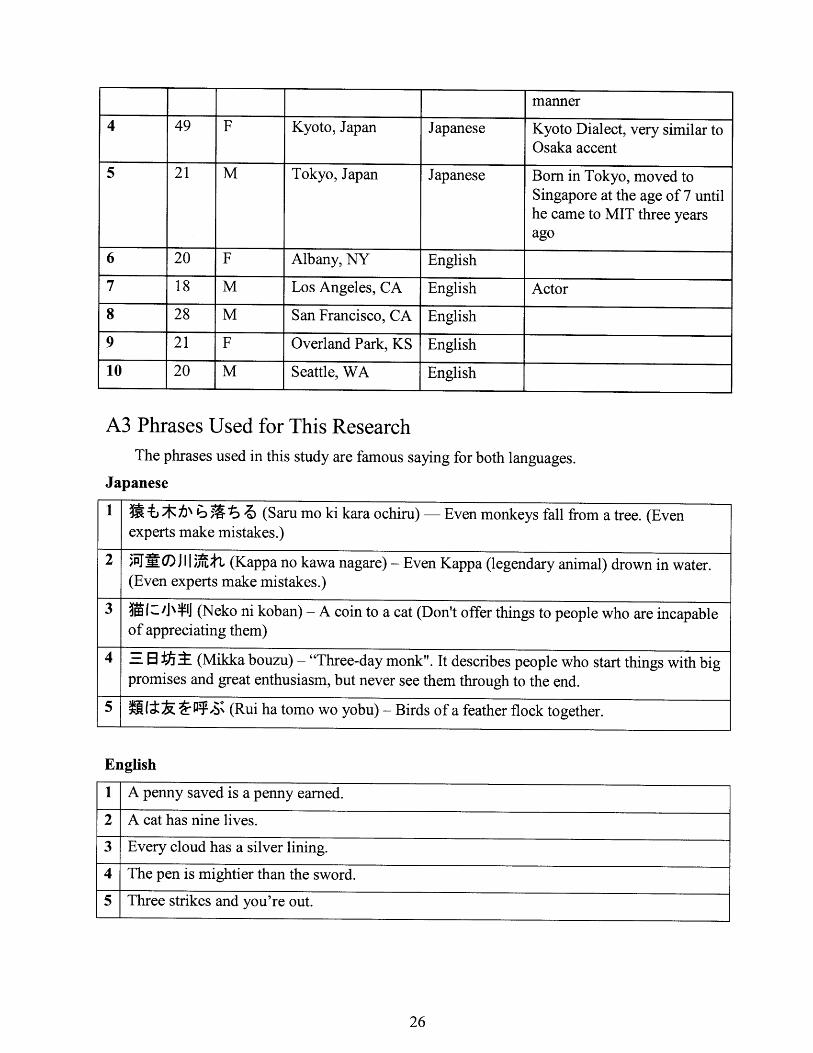
4 49 F Kyoto, Japan Japanese Kyoto Dialect, very similar toOsaka accent
5 21 M Tokyo, Japan Japanese Born in Tokyo, moved toSingapore at the age of 7 untilhe came to MIT three yearsago
6 20 F Albany, NY English
7 18 M Los Angeles, CA English Actor
8 28 M San Francisco, CA English
9 21 F Overland Park, KS English
10 20 M Seattle, WA English
A3 Phrases Used for This ResearchThe phrases used in this study are famous saying for both languages.
Japanese
1 * ~ t h\ -5 7@ (Saru mo ki kara ochiru) - Even monkeys fall from a tree. (Evenexperts make mistakes.)
5 M~I f -, ; (Rui ha tomo wo yobu) - Birds of a feather flock together.
English
1 A penny saved is a penny earned.
2 A cat has nine lives.
3 Every cloud has a silver lining.
4 The pen is mightier than the sword.
5 Three strikes and you're out.
lG) llI Itlt (Kappa no kawa nagare)- Even Kappa (legendary animal) drown in water.(Even experts make mistakes.)
il- i/J]\*I] (Neko ni koban) - A coin to a cat (Don't offer things to people who are incapableof appreciating them)
-E lH I (Mikka bouzu) - "Three-day monk". It describes people who start things with bigpromises and great enthusiasm, but never see them through to the end.
I
.