USING STRUCTURAL HOLES METRICS FROM COMMUNICATION NETWORKS TO PREDICT CHANGE DEPENDENCIES

Comparison of Optical Quality Metrics to Predict Subjective Quality of Vision after LASIK
Bühren J, Yoon GY, Martin T, Strenger A, Kohnen T
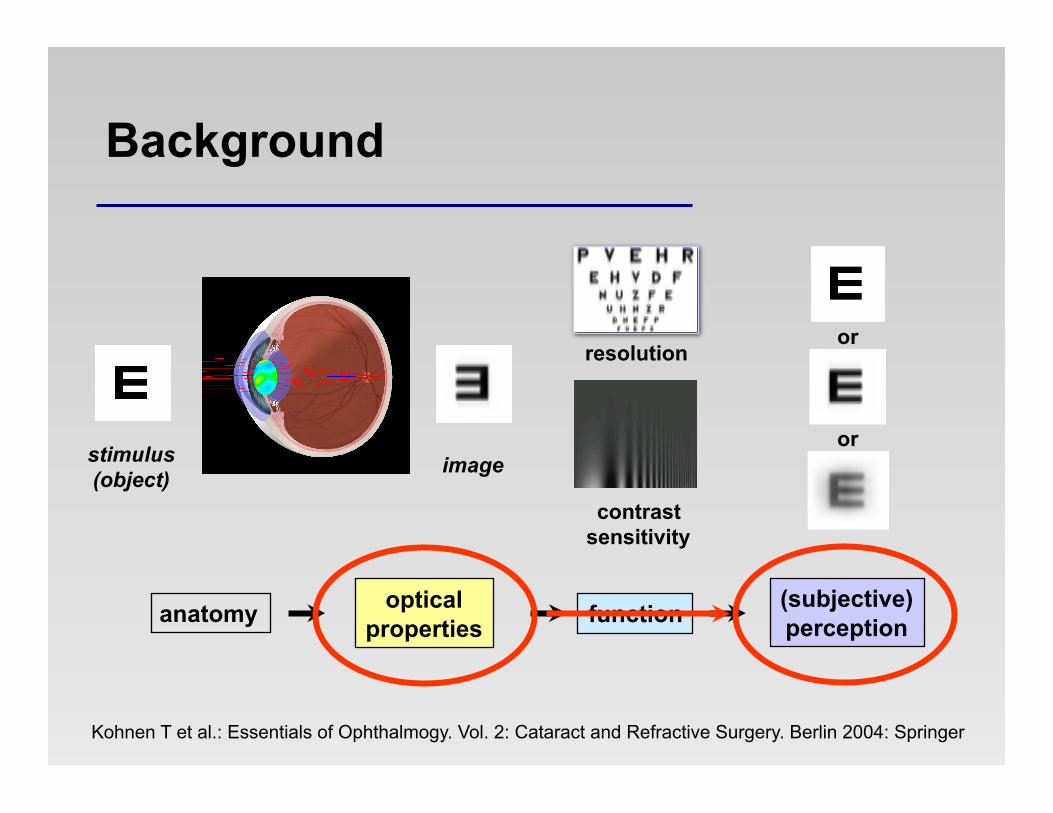
Background
image stimulus (object)
resolution
contrast sensitivity
anatomy optical properties function (subjective)
perception
or
or
Kohnen T et al.: Essentials of Ophthalmogy. Vol. 2: Cataract and Refractive Surgery. Berlin 2004: Springer
Objective
• What image quality metric / wavefront error representation is capable best of predicting subjective Quality of Vision ?
Objective
• What image quality metric / wavefront error representation is capable best of predicting subjective Quality of Vision ?
• How could predictability be increased ?

Patients: preop data
• 56 eyes of 29 patients with LASIK for Myopia – 51 eyes (26 patients Zyoptix 5.09 with static iris recognition) – 5 symptomatic eyes with LASIK elsewhere
• age 36.5 years (24 to 55 years)
• preop Rx – median SE -4.88 D (-1.63 to -8.25 D) – median sphere -4.25 D (-1.50 to -4.25 D) – median cylinder -0.75 D (0.74 to -4.0 D)

Patients and Methods
• Aberrometry 1 month postoperatively – Hartmann-Shack sensor (ZywaveTM, B & L)
• Questionnaire 1 month postoperatively – rating of „optical quality“ for three illuminance levels: photopic („bright light“). high-mesopic („indoors“) low-mesopic
(„dusk“) – visual analogue scale 0-100
20 40 60 80 100 0
perfect extremely bad

• Zernike decomposition (6 mm) of the WFE up to the 5th
order (monochromatic [555 nm])
• different WFE representations (wavefront shape) – LOA RMS and HOA RMS
Methods: WFE representation
LOA
HOA
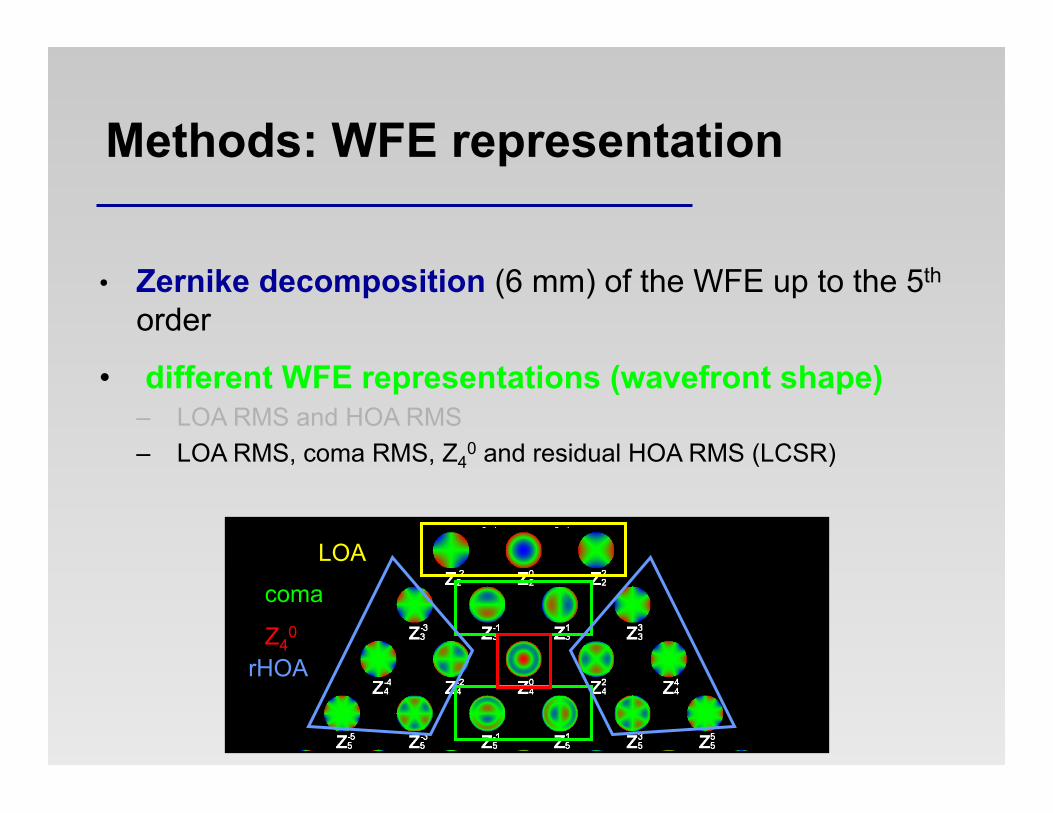
• Zernike decomposition (6 mm) of the WFE up to the 5th
order
• different WFE representations (wavefront shape) – LOA RMS and HOA RMS – LOA RMS, coma RMS, Z4
0 and residual HOA RMS (LCSR)
Methods: WFE representation
LOA
coma
Z40
rHOA

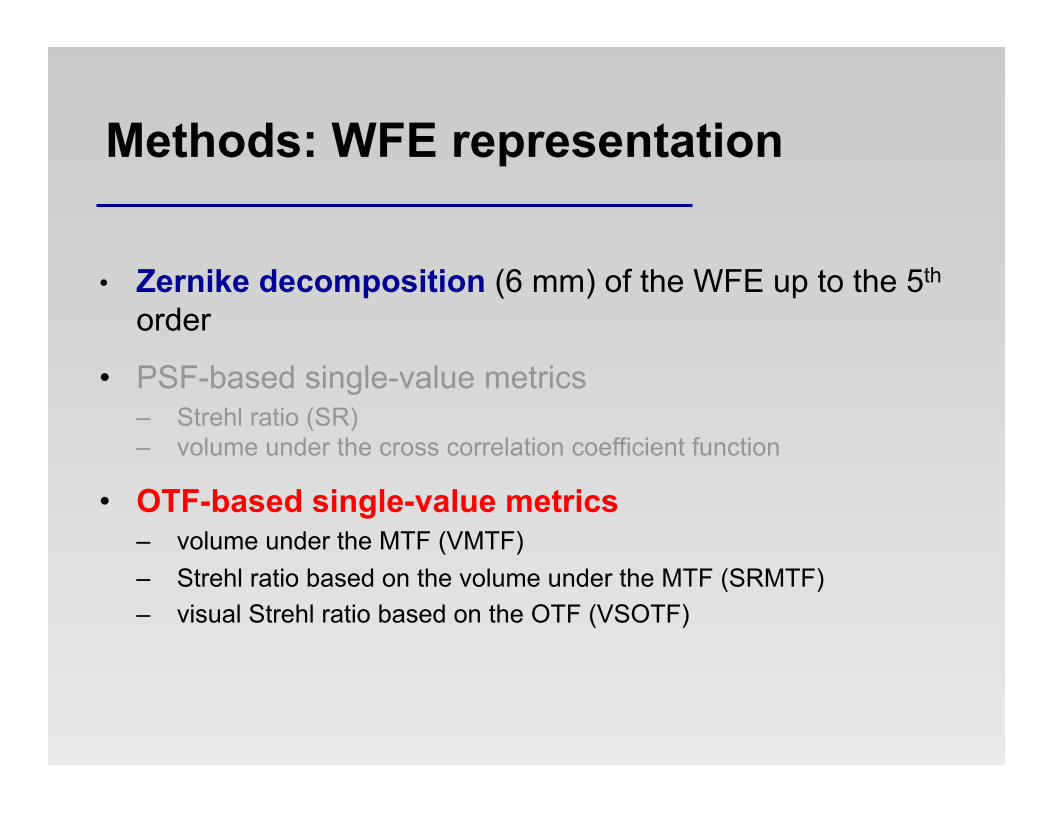
• Zernike decomposition (6 mm) of the WFE up to the 5th
order
• PSF-based single-value metrics – Strehl ratio (SR) – volume under the cross correlation coefficient function (VXC)
Methods: WFE representation
• Zernike decomposition (6 mm) of the WFE up to the 5th
order
• PSF-based single-value metrics – Strehl ratio (SR) – volume under the cross correlation coefficient function
• OTF-based single-value metrics – volume under the MTF (VMTF) – Strehl ratio based on the volume under the MTF (SRMTF) – visual Strehl ratio based on the OTF (VSOTF)
Methods: WFE representation

• different conditions/simulations: – lighting conditions „photopic“, „high-“ and „low-mesopic“ – uncorrected / best-corrected (VSOTF-based or HOA RMS) – 6 mm PD / physiological PD (0.4 lux)
Methods: WFE representation
2.0
4.0
6.0
8.0
10.0
0.0 0.1 1.0 10.0
illuminance [lux]
pupi
l dia
met
er [m
m]

• linear regression analysis – SQV: dependent – WFE parameters: predictors – if more than one predictor: MRA w/ backwards
decomposition – R2 (coefficients of determination)
Methods: statistical analysis

Results: SQV
20 40 60 80 100 0 perfect extremely bad
photopic
high- mesopic
low- mesopic
hi-mes lo-mes
phot 0.88 0.84
hi-mes 0.84
Pearson matrix

Results: R2 values (6 mm PD)
0
0.1
0.2
0.3
0.4
0.5
total RMS HOA RMS LCSR
wavefront shape
R2
PSF-derived
log UC Strehl
log BC Strehl
log UCXC log BCXC log UCVXC log BCVXC
phot hi-mes lo-mes
0
0.1
0.2
0.3
0.4
0.5 phot hi-mes lo-mes
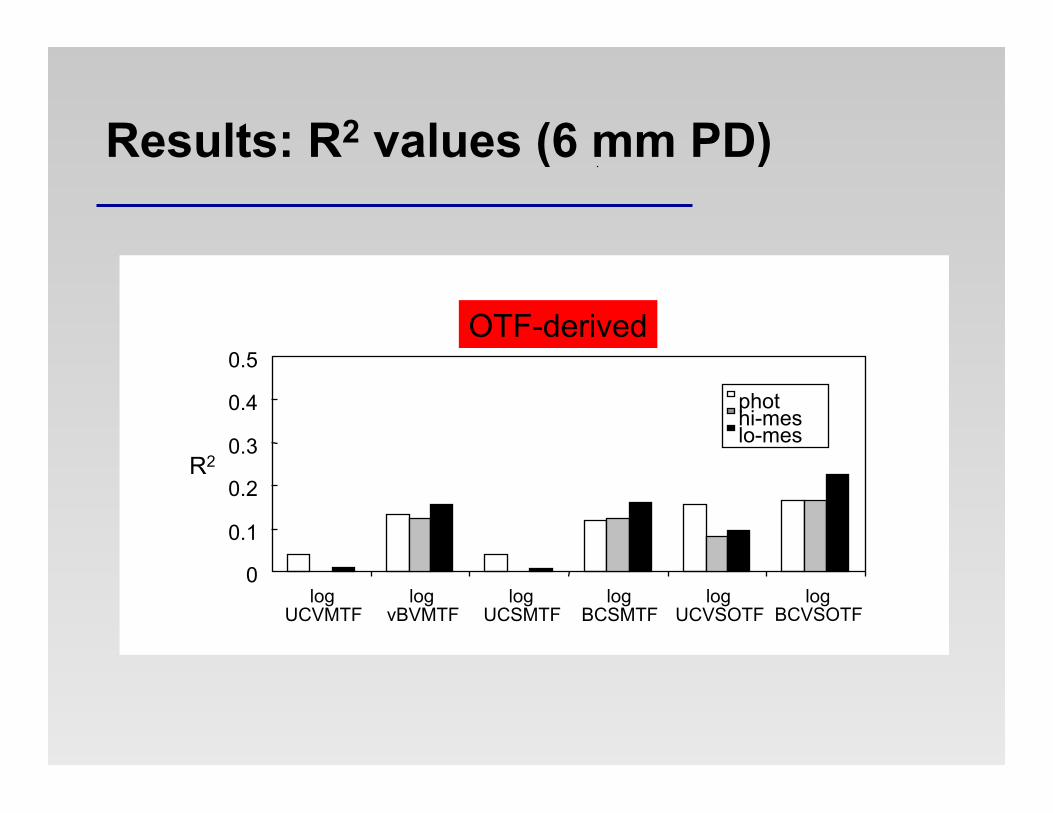
Results: R2 values (6 mm PD)
OTF-derived
0
0.1
0.2
0.3
0.4
0.5
log UCVMTF
log vBVMTF
log UCSMTF
log BCSMTF
log UCVSOTF
log BCVSOTF
phot hi-mes lo-mes
R2

Results: mean R2 values (6 mm PD)
0
0.1
0.2
mea
n R
2
wavefront shape PSF OTF
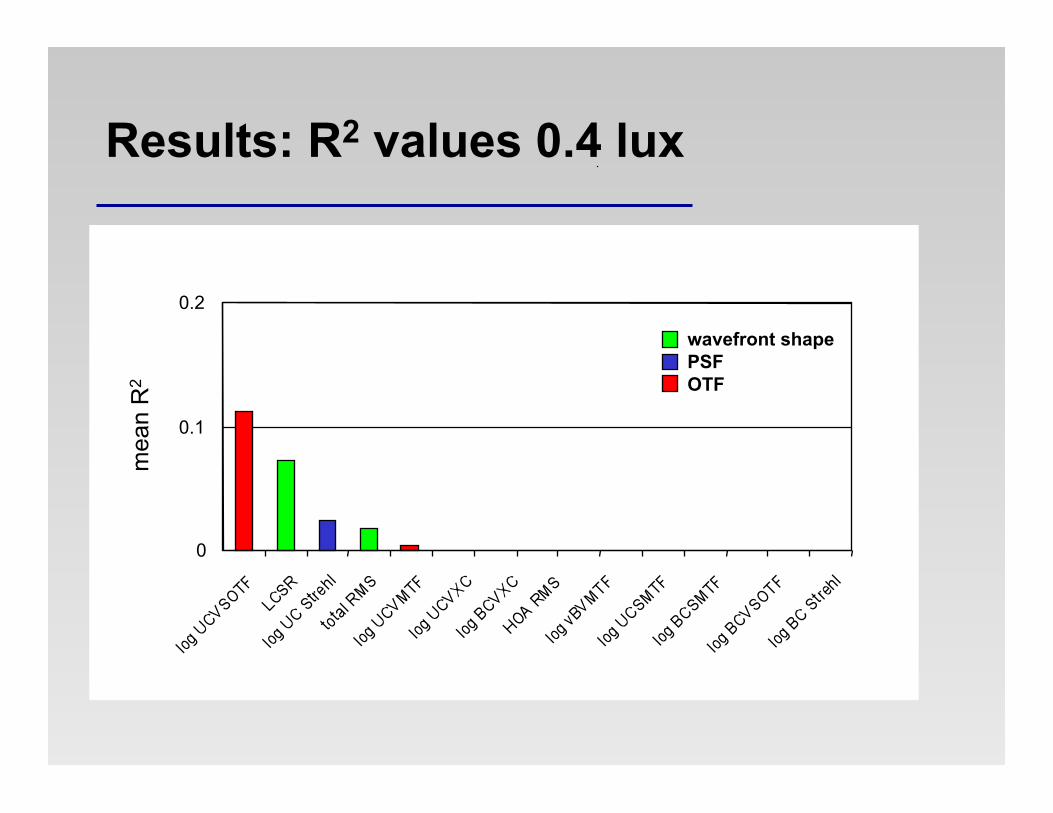
Results: R2 values 0.4 lux
0
0.1
0.2
mea
n R
2
wavefront shape PSF OTF
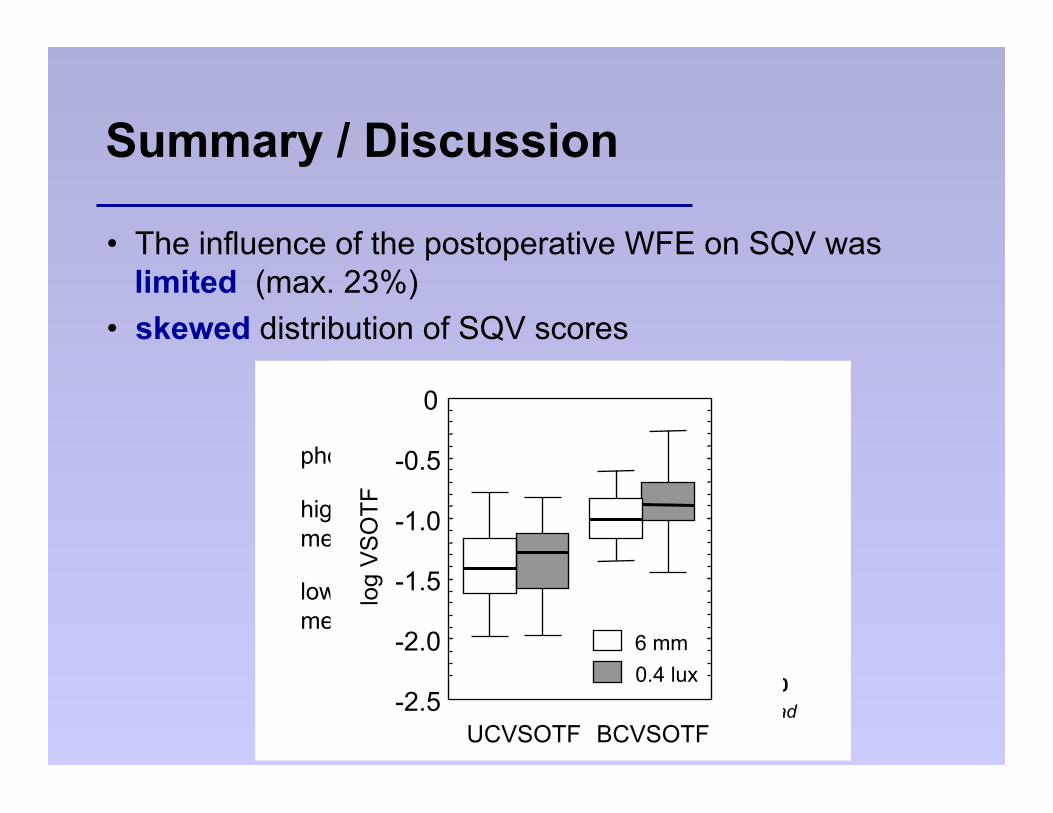
Summary / Discussion
• The influence of the postoperative WFE on SQV was limited (max. 23%) • skewed distribution of SQV scores
20 40 60 80 100 0 perfect extremely bad
photopic
high- mesopic
low- mesopic
0
-0.5
-1.0
-1.5
-2.0
-2.5 UCVSOTF BCVSOTF
6 mm 0.4 lux
log
VS
OTF

Summary / Discussion
• almost “universal” performance under different lighting conditions (high correlation between SQV for different luminance conditions) • no improvement of computation of physiological WFEs
0
20
40
60
80
100 -2.5 -2.0 -1.5 -1.0 -0.5
low
-mes
opic
SQ
V
log UCVSOTF
0.4 lux: R2=0.08 6 mm: R2=0.10
• Adding additional variance
• More information in a 6 mm WFE
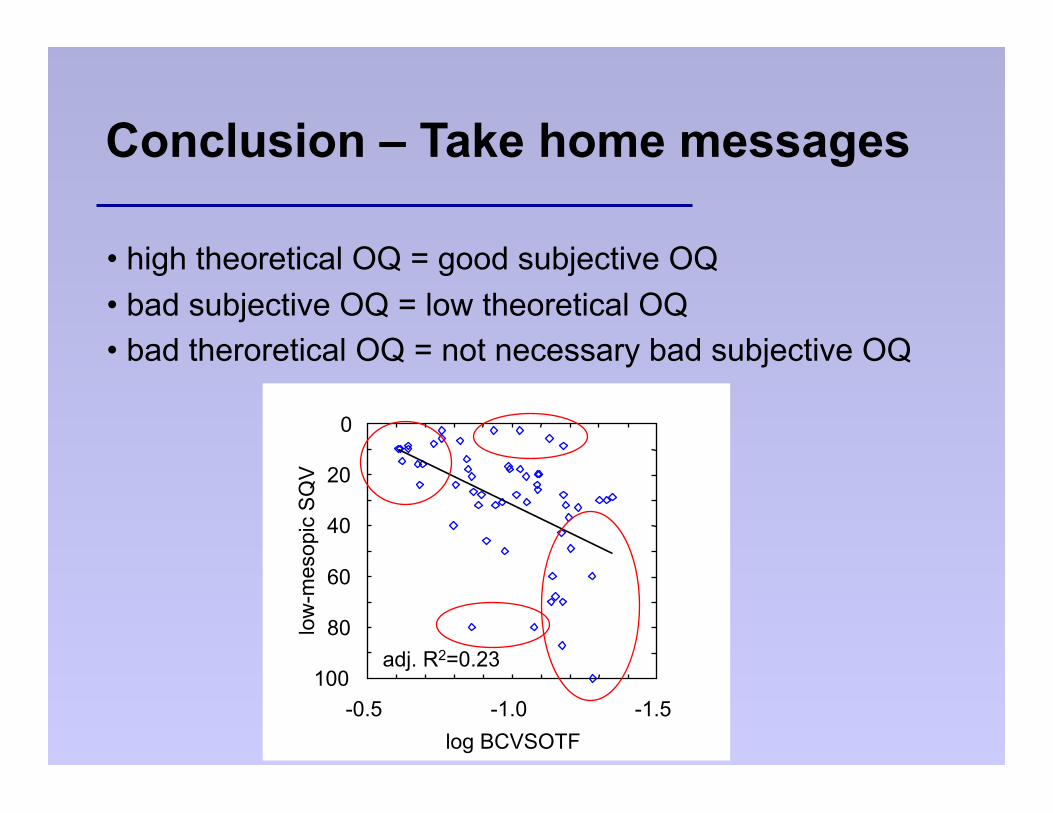
Conclusion – Take home messages
• high theoretical OQ = good subjective OQ • bad subjective OQ = low theoretical OQ • bad theroretical OQ = not necessary bad subjective OQ
-1.5 -1.0 -0.5
0
20
40
60
80
100
log BCVSOTF
low
-mes
opic
SQ
V
adj. R2=0.23
Danke ! Thank you !

Summary / Discussion
• higher predictability for best-corrected values @ 6mm
0
20
40
60
80
100 -2.5 -2.0 -1.5 -1.0 -0.5 0.0
low
-mes
opic
SQ
V
log VSOTF
UC: R2=0.10 BC: R2=0.23
• Higher tolerance to LOA blur ?