
Comparison of Four Classification Methods to Extract Land ... · The reasons of remote sensing...
25
JKAU; Earth Sci., Vol. 20 No.1, pp: 167-191 (2009 A.D./1430 A.H.) 167 Comparison of Four Classification Methods to Extract Land Use and Land Cover from Raw Satellite Images for Some Remote Arid Areas, Kingdom of Saudi Arabia F. S. Al-Ahmadi and A. S. Hames * Remote Sensing Dept., Ministry of Water and Electricity, PO Box 4377, Madina, Saudi Arabia – [email protected] * Assoc. Prof., Dept. of Hydrogeology, Faculty of Earth Sciences, King Abdulaziz University, P.O. Box 109840, Jeddah 21351, Saudi Arabia – [email protected] Received: 14/11/2007 Accepted: 2/6/2008 Abstract. Remote sensing (RS) technologies was utilized to extract some of the important spatially variable parameters, such as land cover and land use (LCLU), from satellite images for remote arid areas in Saudi Arabia. Four different classification techniques unsupervised (ISODATA), and supervised (Maximum likelihood, Mahalanobis Distance, and Minimum Distance) are applied in three sub-catchments in Saudi Arabia for the classification of the raw TM5 images. The developed maps are then visually compared with each other and accuracy assessments utilizing ground-truths are undertaken. It was found that the Maximum likelihood method gave the best results and both Minimum distance and Mahalanobis distance methods overestimated agriculture land and suburban areas. In spite of missing few insignificant features due to the low resolution of the satellite images (90m), good agreement between parameters extracted automatically from the developed maps and field observations was found. Keywords. Remote sensing, land use, land cover, arid regions, satellite images.
Transcript of Comparison of Four Classification Methods to Extract Land ... · The reasons of remote sensing...
JKAU; Earth Sci., Vol. 20 No.1, pp: 167-191 (2009 A.D./1430 A.H.)
167
Comparison of Four Classification Methods to Extract
Land Use and Land Cover from Raw Satellite Images for
Some Remote Arid Areas, Kingdom of Saudi Arabia
F. S. Al-Ahmadi and A. S. Hames*
Remote Sensing Dept., Ministry of Water and Electricity, PO Box 4377,
Madina, Saudi Arabia – [email protected]
* Assoc. Prof., Dept. of Hydrogeology, Faculty of Earth Sciences, King
Abdulaziz University, P.O. Box 109840, Jeddah 21351, Saudi Arabia –
Received: 14/11/2007 Accepted: 2/6/2008
Abstract. Remote sensing (RS) technologies was utilized to extract
some of the important spatially variable parameters, such as land
cover and land use (LCLU), from satellite images for remote arid
areas in Saudi Arabia. Four different classification techniques
unsupervised (ISODATA), and supervised (Maximum likelihood,
Mahalanobis Distance, and Minimum Distance) are applied in three
sub-catchments in Saudi Arabia for the classification of the raw TM5
images. The developed maps are then visually compared with each
other and accuracy assessments utilizing ground-truths are undertaken.
It was found that the Maximum likelihood method gave the best
results and both Minimum distance and Mahalanobis distance
methods overestimated agriculture land and suburban areas. In spite of
missing few insignificant features due to the low resolution of the
satellite images (90m), good agreement between parameters extracted
automatically from the developed maps and field observations was
found.
Keywords. Remote sensing, land use, land cover, arid regions, satellite
images.

F.S. Ahmadi and A.S. Hames 168
Introduction
Remote Sensing (RS) technologies can be used to acquire spatially variable data for several applications. A number of these technologies can supply data to help to solve problems, and can often be accomplished at a lower relative cost than many other traditional methods. Remote sensing data of the earth's surface could be made readily available in digital format (Richards and Jia, 1998). These advantages have attracted great interest in the scientific and engineering community (Lyon, 1995). The reasons of remote sensing priorities over traditional methods are because of several unique aspects including the capability to measure spatial, spectral, and temporal information as opposed to point data, ability to assess the state of the Earth’s surface over large areas, and to assemble long-term data sets and the capability to measure inaccessible areas; as the case in most arid regions (Qi et al., 1994; Ritchie and Rango, 1996; and Rango and Shalaby, 1998). The “landscape-scale” requires methods to gather spatially distributed information and this requires repeated sampling of the variables of interest to acquire information over large areas. The costs and logistics of these actions can be high, and work is usually constrained by available resources. However, remote sensing is considered the most efficient technology to handle these problems and to observe the spatially distributed variables (Lyon, 1995).
Modeling environmental phenomena usually needs some spatial information about the distribution and the types of land cover and land use (LCLU) as well as soil types (Engman and Gurney, 1991). Ragan and Jackson (1980) investigated the use of computer analysis of Landsat Satellite Multispectral Scanner data for estimating the land cover distributions needed in operating the Soil Conservation Service (SCS) models. Schultz (1988) presented the importance of remote sensing in hydrological applications such as computation of historic monthly runoff for design purposes, and real-time flood forecasting using radar rainfall measurements for which LCLU is very essential. In similar concepts, Kite (1991) developed a simple watershed model which uses satellite data to simulate basin runoff. More recently Gangodagamage (2001) and Nayak and Jaiswal (2003) used satellite based remote sensing technologies to estimate the spatial variation of soil parameters for the estimation of SCS Curve Number. Foody et al. (2004) derived the land cover spatial information from satellite remote sensing to predict sites at risk from large peak flows associated with flash flooding in arid regions.
Comparison of Four Classification Methods to Extract … 169
Proper classification of LCLU is a very essential requirement for all modeling tasks in environmental problems. However, in remote arid areas this is difficult to obtain easily due to lack of information and inaccessibility of these areas. Therefore, utilizing automatic remote
sensing techniques will provide a reasonable answer to this problem. Nevertheless, knowing the best classification method to perform this task is a very important aspect in order to utilize the right approach for classification. Yet, these methods have not been investigated thoroughly in arid areas. Thus, this paper evaluates four remote sensing classification methods for automatically obtaining LCLU in three remote arid areas from Landsat TM images.
Description of Study Area
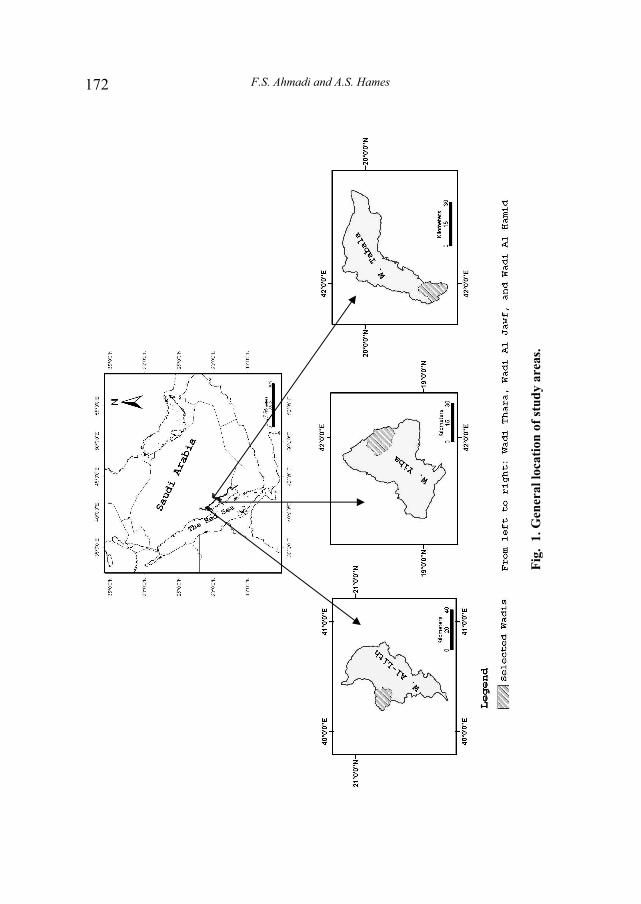
Three small to medium size sub-basins (100 to 300 km2) were
selected to study in this work, these are: Wadi Thara (290 km2) is located
in the west of the main catchment at the upstream area of Wadi Al Lith , Wadi Al-Hamid (170 km
2) is located in the south of the main catchment
at the upstream area of Wadi Tabala, and Wadi Al Jawf (320 km2) is
located in the north east of the main catchment at the upstream area of Wadi Yiba. These areas were selected for their distinctive location on the east and west of the escarpment. Figure 1 shows the location of these
three basins and the sub-basins.
Wadi Al Lith is located about 250 km south of Jeddah city and administratively located within Makka Province, covering an area of 3377 km
2. It lies geographically between longitudes 40.19° and 40.81° E
and between latitudes 20.11° and 21.14° N. The maximum elevation of the watershed is about 2238 m above the mean sea level at Jabal Judah, and the minimum elevation is at the Rea Sea level (Al Lith town) and flows from north to south. Wadi Tabala is located about 250 km
southeast of Al Baha City, and is administratively located in Asir Province, covering an area of 1900 km
2. The basin lies between
longitudes 41.87° and 42.58° E and between latitudes 19.46° and 20.15°
N. The maximum elevation of the watershed is about 2358 m above the mean sea level at Al Bihasaz, and the minimum elevation is 1219 m at the junction with wadi Bisha. The wadi flows from the south west to the north east, and it is a major tributary of wadi Bisha. Wadi Yiba is located west of Nimas city and most of the catchment is administratively located
within Asir Province, covering an area of 2830 km2. It lies between

F.S. Ahmadi and A.S. Hames 170
longitudes 41.42° and 42.13° E and between latitudes 18.84° and 19.60° N. Maximum elevation is 2725 m above the mean sea level at Jabal Mirrir mountains and the minimum elevation is at the Red Sea level and flows from north east to south west.
Four LCLU classes can be shown in the three sub-basins, these are: arid rangeland, farms, villages, and main roads. Wadi Thara can be considered mainly as arid range land. The vegetation cover in the rock outcrops consists of about 20% shrubs and 5% grass. The vegetation cover in the alluvial deposits consists of about 25% trees and 20% shrubs. There are no farms or villages in Wadi Thara and only insignificant, very small and scattered houses are found near the main channel.
Almost 85% of Wadi Al Hamid is considered as arid rangeland. This consists mainly of 15% trees, 10% shrubs, 10% forbs, and 10% grass. Small villages and farms cover about 14% and can be found near the main channels and the most upper parts of the Wadi. Two main roads exist in Wadi Al Hamid; the old main road which crosses the middle of the Wadi and the new main road which passes in the eastern part of the Wadi.
Almost 85% of Wadi Al Jawf is considered as arid rangeland. There
are three different arid rangeland categories in Wadi Al Jawf; the upper portion of the Wadi at the escarpment consists of 60% trees, 10% shrubs, and 10% grass, the lower portion of the Wadi consists of 30% shrubs and 5% grass, and the main alluvial deposits consist of 10% trees and 15% shrubs. Most of the farms (represent 12% of this category) are located near the three villages and in the most upper portion of the Wadi at the escarpment.
Methodology
1) Introduction
The spatial distribution of LCLU can be obtained via classification of
satellite images which can be defined as the process of assigning each
pixels or group of pixels of the image to thematic classes (Richards,
1999). The most famous types of classification techniques are the
unsupervised classification which doesn’t need a prior knowledge of the
area and the supervised classification which needs prior knowledge of the
area (Lillesand and Kiefer, 2000). The process of gaining this prior
Comparison of Four Classification Methods to Extract … 171
knowledge is known as ground-truthing. These ground-truths (or
signatures) can be obtained from existing maps or by conducting
fieldwork in the study areas.
The classification system used in this study was the one developed by Anderson et al. (1976). Image classification (or image information extraction) of land cover process in this study involves several steps (Jensen, 1996). These are: Stating the nature of the classification problem which involves the definition of region of interest and identifying the classes of interest from land cover classification system, collection of ground reference data based on a prior knowledge of the study area (ground-truths such as: maps, field survey, …etc.), selection of appropriate image classification logic and algorithm (supervised or unsupervised classifications), accuracy assessment, and post classification (involving clump and sieving). The above steps are discussed and applied below for extraction of land cover information for the three selected sub-catchments.
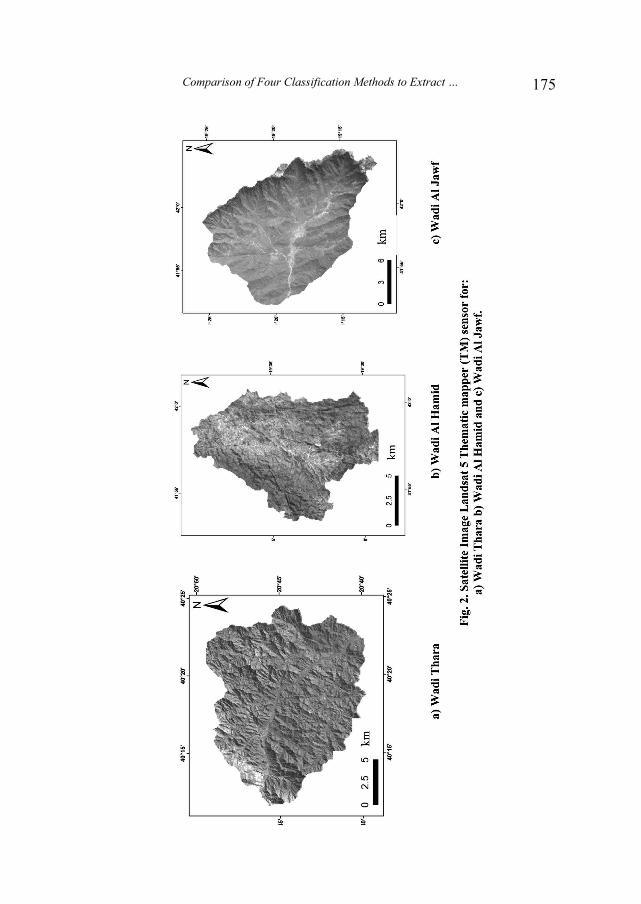
Satellite images used in this study for land cover and land use classification were Landsat 5 Thematic Mapper (TM) acquired from King Abdulaziz City for Sciences and Technology (KACST) around the period from 1984 to 1987 (Fig. 2a, b, and c). Some ortho-rectification (registration) was applied to these images from Landsat 7 Enhanced Thematic Mapper plus (ETM
+) for the same areas using image to image
rectification. The resultant root mean square errors of rectified images were less than 10 m for all the three images. Each scene was subseted and the Wadis were delineated from DEMs using ArcGIS (ESRI, 2001) with Spatial Analyst.
After acquiring the satellite images of the study areas, classification of raw digital TM data of Landsat, was applied to the three sub-catchments with four methods of classification. These are: Unsupervised classification in which the applied algorithm is Iterative Self-Organizing Data Analysis Technique (ISODATA), and three different supervised methods which include Maximum likelihood, Mahalanobis Distance, and Minimum Distance. This makes a total of 12 classification combinations (three sub-catchments with four types of classification). After classified thematic maps were developed, accuracy was tested by different methods of accuracy assessment, and the post-classification process was the last process in classification. The software packages used for classification were ERDAS IMAGINE 8.4 developed by Leica Geosystems and ENVI 4.0 developed by Research System Incorporation.
F.S. Ahmadi and A.S. Hames 172
Fig
. 1
. G
ener
al
loca
tio
n o
f st
ud
y a
rea
s.
Comparison of Four Classification Methods to Extract … 173
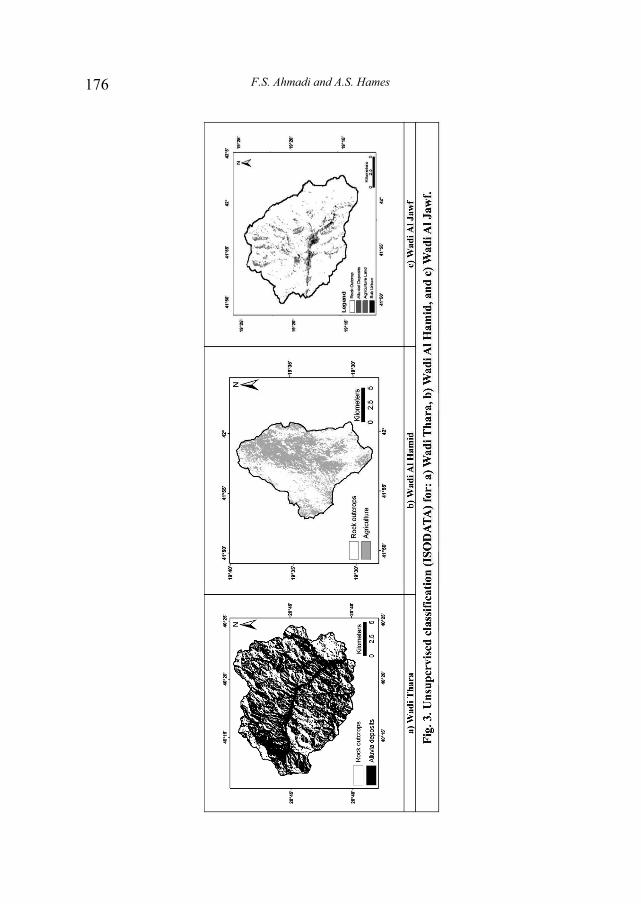
2) Utilization of Unsupervised Classification
Unsupervised classification method employs ISODATA method
which is one of the most popular methods of unsupervised classification.
It only needs three input parameters; these are: The number of classes
(clusters), in the classification processes (was set to 20 classes), the
maximum number of iteration (was set to 30), and the convergence
threshold, which is the maximum percentage of pixels whose class values
are allowed to be unchanged between iterations (was set to 0.95). These
values were the same for all the three sub-catchments. After the
execution of the algorithm, the assigned classes (20 classes) were
grouped into a number of categories according to their spectral
appearance on screen. Visually, the pixels in Wadi Thara image can be
divided into two main classes: alluvial deposits and rock outcrops which
both constitute one land cover class as arid range land. Wadi Al Hamid
was divided into two main classes: arid range land and agriculture land
while Wadi Al Jawf was as arid range land. Figures 3a-c show the results
of application of ISODATA algorithm for the three sub-catchments.
3) Utilization of Supervised Classification
Supervised classification algorithms need a prior knowledge of the
study area (ground-truths) which may be obtained from different groups
into four classes, alluvial deposits, rock outcrops, agriculture land, and
suburban areas. First two classes constitute one class sources. The
ground-truth samples are introduced as sets of pixels selected to represent
actual phenomena in order to train the computer system to recognize data
patterns. In 1979 at 1:50,000 scale with insignificant change in most
LCLU types such as suburban areas, agriculture areas, and roads. These
maps were geo-referenced, and the locations as well as the distribution of
feature classes of LCLU were extracted. Field visits to the study areas
were undertaken during which some ground-truths were collected
especially for undeveloped areas and the location of classes were
recorded by GPS. According to these two sources, different ground-truths
were recorded. Extra groups of land cover and land use were obtained for
Wadi Al Hamid and Wadi Al Jawf (suburban areas and roads).
Identifying seed pixel is the procedure used in the supervised
classification in this study for computer training. This method has some
advantages including auto-assisted and time saving although it may
F.S. Ahmadi and A.S. Hames 174
underestimate class variance (ERDAS IMAGINE, 2002). Here the
analyst defines a single pixel that is representative of the training sample
and the computer system makes a comparison between the seed pixel and
the contiguous pixels, based on some parameters specified by the analyst.
When one or more of the contiguous pixels is accepted, the mean of the
sample is calculated from the accepted pixels, and then the pixels
contiguous to the sample are compared in the same way. This process
repeats until no pixels that are contiguous to the sample satisfy the
spectral parameters. In effect, the sample grows outward from the model
pixels with each iteration.Three supervised classification methods were
used in this study; these are maximum likelihood, minimum distance, and
mahalanobis distance.
Maximum likelihood is one of the most popular supervised
classification method used with remote sensing image data. This method
is based on the probability that a pixel belongs to a particular class. The
basic theory assumes that these probabilities are equal for all classes, and
that the input bands have normal distributions. However, this method
needs long time of computation, relies heavily on a normal distribution of
the data in each input band and tends to over-classify signatures with
relatively large values in the covariance matrix. The distance (spectral
distance) method calculates the spectral distance between the
measurement vector for the candidate pixel and the mean vector for each
signature, and the equation for classifying by spectral distance is based
on the equation for Euclidean distance. It requires the least computational
time amongst other supervised methods, however, the pixels that should
not be unclassified become classified, and it does not consider class
variability.
Mahalanobis distance is similar to minimum distance, except that the
covariance matrix is used instead. Unlike minimum distance, this method
takes the variability of classes into account. It could be more useful than
minimum distance in cases where statistical criteria must be taken into
account, but the weighting factors that are available with the maximum
likelihood option are not needed. However, this method tends to over-
classify signatures with relatively large values in the covariance matrix.
Also, it is slower to compute than minimum distance; and it relies heavily
on a normal distribution of the data in each input band.
Comparison of Four Classification Methods to Extract … 175
F.S. Ahmadi and A.S. Hames 176
Comparison of Four Classification Methods to Extract … 177
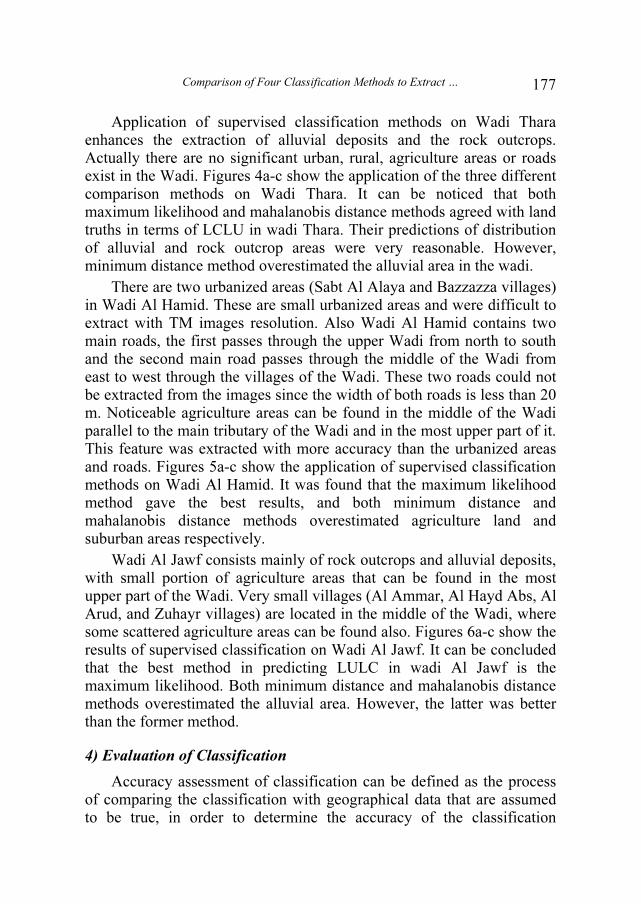
Application of supervised classification methods on Wadi Thara enhances the extraction of alluvial deposits and the rock outcrops. Actually there are no significant urban, rural, agriculture areas or roads exist in the Wadi. Figures 4a-c show the application of the three different comparison methods on Wadi Thara. It can be noticed that both maximum likelihood and mahalanobis distance methods agreed with land truths in terms of LCLU in wadi Thara. Their predictions of distribution of alluvial and rock outcrop areas were very reasonable. However, minimum distance method overestimated the alluvial area in the wadi.
There are two urbanized areas (Sabt Al Alaya and Bazzazza villages) in Wadi Al Hamid. These are small urbanized areas and were difficult to extract with TM images resolution. Also Wadi Al Hamid contains two main roads, the first passes through the upper Wadi from north to south and the second main road passes through the middle of the Wadi from east to west through the villages of the Wadi. These two roads could not be extracted from the images since the width of both roads is less than 20 m. Noticeable agriculture areas can be found in the middle of the Wadi parallel to the main tributary of the Wadi and in the most upper part of it. This feature was extracted with more accuracy than the urbanized areas and roads. Figures 5a-c show the application of supervised classification methods on Wadi Al Hamid. It was found that the maximum likelihood method gave the best results, and both minimum distance and mahalanobis distance methods overestimated agriculture land and suburban areas respectively.
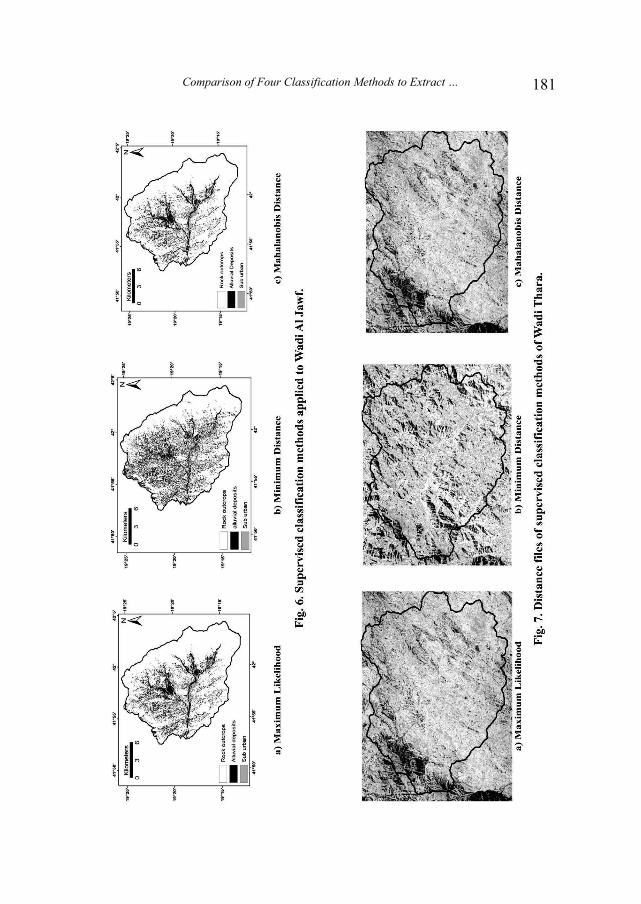
Wadi Al Jawf consists mainly of rock outcrops and alluvial deposits, with small portion of agriculture areas that can be found in the most upper part of the Wadi. Very small villages (Al Ammar, Al Hayd Abs, Al Arud, and Zuhayr villages) are located in the middle of the Wadi, where some scattered agriculture areas can be found also. Figures 6a-c show the results of supervised classification on Wadi Al Jawf. It can be concluded that the best method in predicting LULC in wadi Al Jawf is the maximum likelihood. Both minimum distance and mahalanobis distance methods overestimated the alluvial area. However, the latter was better than the former method.
4) Evaluation of Classification
Accuracy assessment of classification can be defined as the process of comparing the classification with geographical data that are assumed to be true, in order to determine the accuracy of the classification
F.S. Ahmadi and A.S. Hames 178
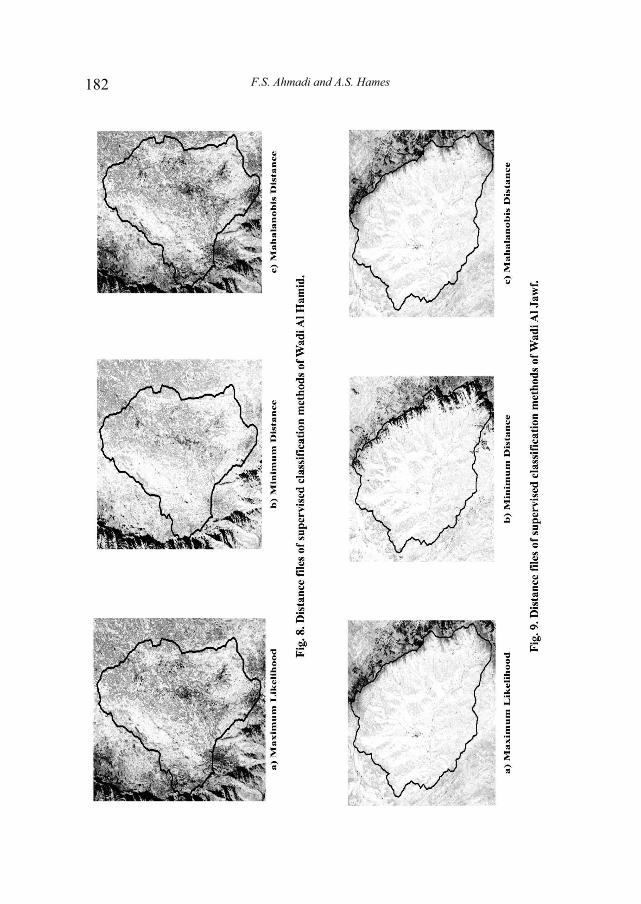
process. Usually, the assumed-true data are derived from ground-truth data. Evaluating the accuracy of the classification was done here by applying thresholding and accuracy assessment methods. Figures 7a-c show the distance file for Wadi Thara, Fig. 8a-c show the distance file for Wadi Al Hamid, and Fig. 9a-c show the distance file for Wadi Al Jawf with three supervised classifications. It can be shown that maximum likelihood and mahalanobis distance methods were superior to minimum distance method in Wadi Thara, minimum distance was slightly superior to both maximum likelihood and mahalanobis distance in Wadi Al Hamid, and the three methods show similar response in Wadi Al Jawf distance files.
A set of reference pixels is usually used where points on the
classified image for which actual data are (or will be) known. The
relationship between these two compared information is commonly
summarized in an error matrix (also known as a confusion matrix or
contingency table). The number of rows and columns in the error matrix
should be equal to the number of categories whose classification
accuracy is being assessed (Lillesand and Kiefer, 2000).
In error matrix, the pixels located along the diagonal (from the upper
left to the lower right) represent the pixels that classified into the proper
category. The non-diagonal values in the columns represent the omission
error, while the non-diagonal values in the rows represent the
commission error. Omission error calculates the probability of a pixel
being accurately classified (producer's accuracy). This results from
dividing the number of correctly classified pixels in each category by the
number of training pixels used for that category (the column total). This
indicates how well training set pixels of the given cover type are
classified. Commission error determines the probability that a pixel
represents the class for which it has been assigned (user's accuracy). This
is computed by dividing the number of correctly classified pixels in each
category by the total number of pixels in that category (the row total).
The total accuracy (overall accuracy) is computed by dividing the total
number of correctly classified pixels (sum of major diagonal) by the total
number of tested pixels (Lillesand and Kiefer, 2000, and USACE, 2003).
Another characteristic coefficient that can be obtained from error matrix
is Kappa coefficient which is an indicator of the extent to which the
percentage correct values of an error matrix are due to "true" agreement
versus "chance" agreement, and it ranges from 0 (worst) to 1(best).
Comparison of Four Classification Methods to Extract … 179
In this study, the number of reference points used for the accuracy
assessment of classification were 50, most of which were taken from the
field visit, and the remaining from the topographic maps. The error
matrix and the associated accuracies were computed by three methods of
supervised classifications for the three sub-catchments which produced 9
error matrices. Tables 1a-c, 2a-c, and 3a-c below show the error matrices
of the three classification methods on the three studied sub-catchments
and other derived statistical parameters. It can be shown from the tables
that the best overall classification accuracy method was the maximum
likelihood for all the three sub-catchments; these were 84.00%, 74.51%,
and 80.77% for Wadi Thara, Wadi Al Hamid, and Wadi Al Jawf,
respectively. The second best overall classification accuracy method was
mahalanobis distance for all the three sub-catchments; they were 80.00%,
68.63%, and 73.08% for Wadi Thara, Wadi Al Hamid, and Wadi Al
Jawf, respectively. The worst overall classification accuracy method was
minimum distance for all the three sub-catchments; they were 74.00%,
62.75%, and 65.38% for Wadi Thara, Wadi Al Hamid, and Wadi Al
Jawf, respectively. It can be noticed that the best overall classification
was on Wadi Thara where there were two relatively distinctive categories
(classes); the rock outcrops and the main alluvial deposits. These two
classes had sizes larger than the pixels size. Extraction of rock outcrops
may be extracted more accurately than the alluvial deposits. Very small
indistinctive scattered urbanized areas couldn't be detected, and they
were omitted from table of classification because of their insignificant
effects.
The worst overall classifications was noticed on Wadi Al Hamid
where there were five categories; the rock outcrops, narrow line of
alluvial deposits near the outlet, agriculture areas, urban areas, and two
main roads. The roads are added later from topographic maps using
manual digitizing. The two small villages couldn't be extracted accurately
and they were processed manually from other maps.
Wadi Al Jawf has mainly four classes, rock outcrops, alluvial
deposits, agriculture areas, and urban areas. The spectral characteristics
of the loamy sand alluvial were similar to urban areas and the algorithms
found some difficulties to distinguish between them and further
processing may have been needed to separate them.
F.S. Ahmadi and A.S. Hames 180
Comparison of Four Classification Methods to Extract … 181
F.S. Ahmadi and A.S. Hames 182
Comparison of Four Classification Methods to Extract … 183
5) Post-Classification Processes
Classified images often manifest a salt-and-pepper appearance due to
the inherent spectral variability encountered by a classifier when applied
on a pixel-by-pixel basis. In such situations it is often desirable to smooth
the classified images to show only the dominant presumably correct
classification. Thus, post classification processes were applied over a
classified image to eliminate isolated pixels, and to generate an
apparently less noisy image. In this study only two post classification
processes were applied; these are Sieve and Clump. These two post
classification processes were applied on the images that are classified by
maximum likelihood which have the best overall accuracy for the three
sub-catchments.
Sieve and Clump provide means for generalizing classification
images. Sieve is usually run first to remove the isolated pixels based on a
size (number of pixels) threshold, and then clump is run to add spatial
coherency to existing classes by combining adjacent similar classified
areas.
The sieve method looks at the neighboring 4 or 8 pixels to determine
if a pixel is grouped with pixels of the same class. If the number of pixels
in a class that are grouped is less than the value that enters by the
classifier, those pixels will be removed from the class. When pixels are
removed from a class using sieving, black pixels (unclassified) will be
left.
The Clump method is used to clump adjacent similar classified areas
together using morphological operators. Classified images often suffer
from a lack of spatial coherency (speckle or holes in classified areas).
Low pass filtering could be used to smooth these images, but the class
information would be contaminated by adjacent class codes. Clumping
classes solves this problem. The selected classes are clumped together by
first performing a dilate operation and then an erode operation on the
classified image using a kernel of the size specified in the parameters
dialog.
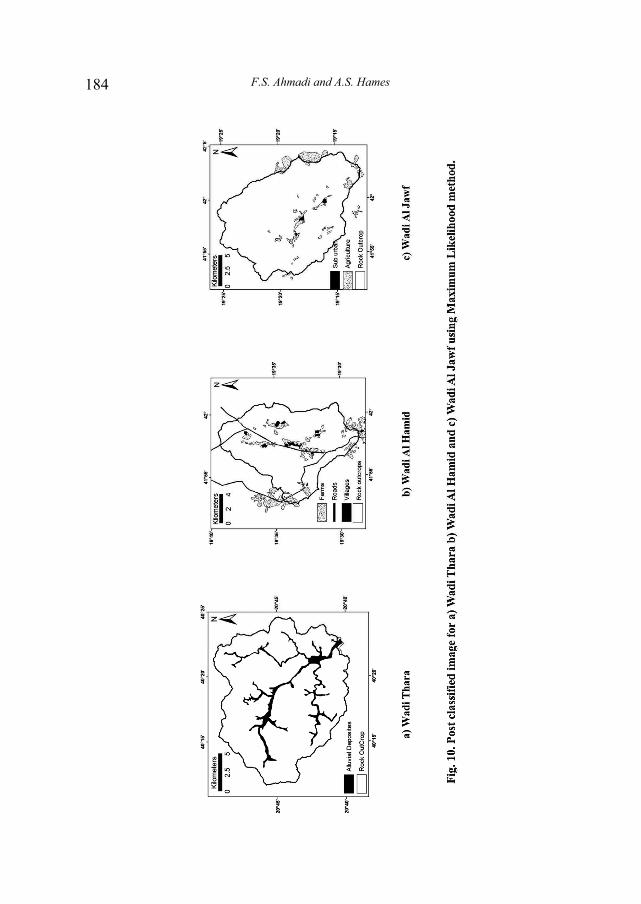
Figures 10a-c show the final product of classified images for the
three sub-catchments using maximum likelihood classification method.
F.S. Ahmadi and A.S. Hames 184
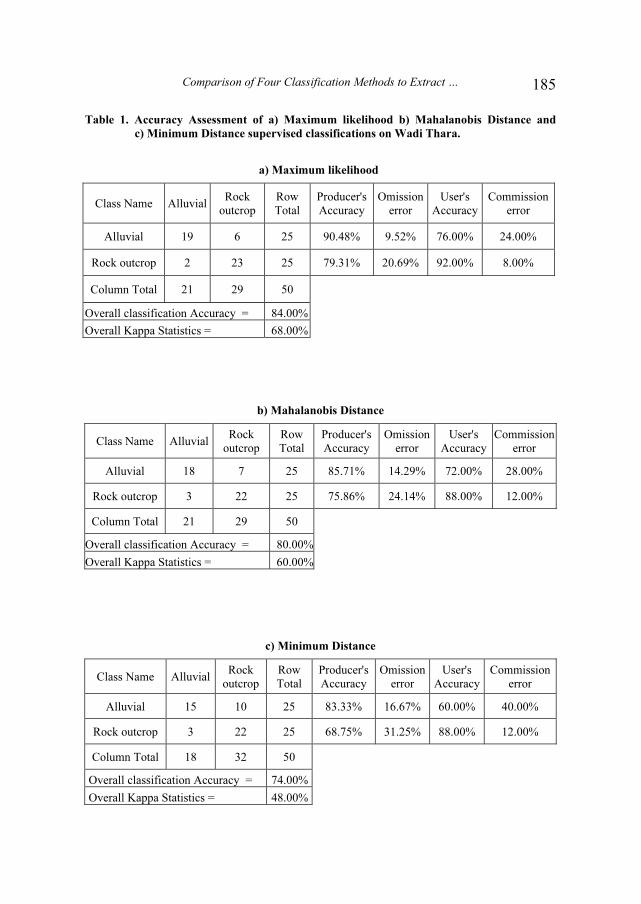
Comparison of Four Classification Methods to Extract … 185
Table 1. Accuracy Assessment of a) Maximum likelihood b) Mahalanobis Distance and
c) Minimum Distance supervised classifications on Wadi Thara.
b) Mahalanobis Distance
Class Name AlluvialRock
outcrop
Row
Total
Producer's
Accuracy
Omission
error
User's
Accuracy
Commission
error
Alluvial 18 7 25 85.71% 14.29% 72.00% 28.00%
Rock outcrop 3 22 25 75.86% 24.14% 88.00% 12.00%
Column Total 21 29 50
Overall classification Accuracy = 80.00%
Overall Kappa Statistics = 60.00%
c) Minimum Distance
Class Name AlluvialRock
outcrop
Row
Total
Producer's
Accuracy
Omission
error
User's
Accuracy
Commission
error
Alluvial 15 10 25 83.33% 16.67% 60.00% 40.00%
Rock outcrop 3 22 25 68.75% 31.25% 88.00% 12.00%
Column Total 18 32 50
Overall classification Accuracy = 74.00%
Overall Kappa Statistics = 48.00%
a) Maximum likelihood
Class Name AlluvialRock
outcrop
Row
Total
Producer's
Accuracy
Omission
error
User's
Accuracy
Commission
error
Alluvial 19 6 25 90.48% 9.52% 76.00% 24.00%
Rock outcrop 2 23 25 79.31% 20.69% 92.00% 8.00%
Column Total 21 29 50
Overall classification Accuracy = 84.00%
Overall Kappa Statistics = 68.00%
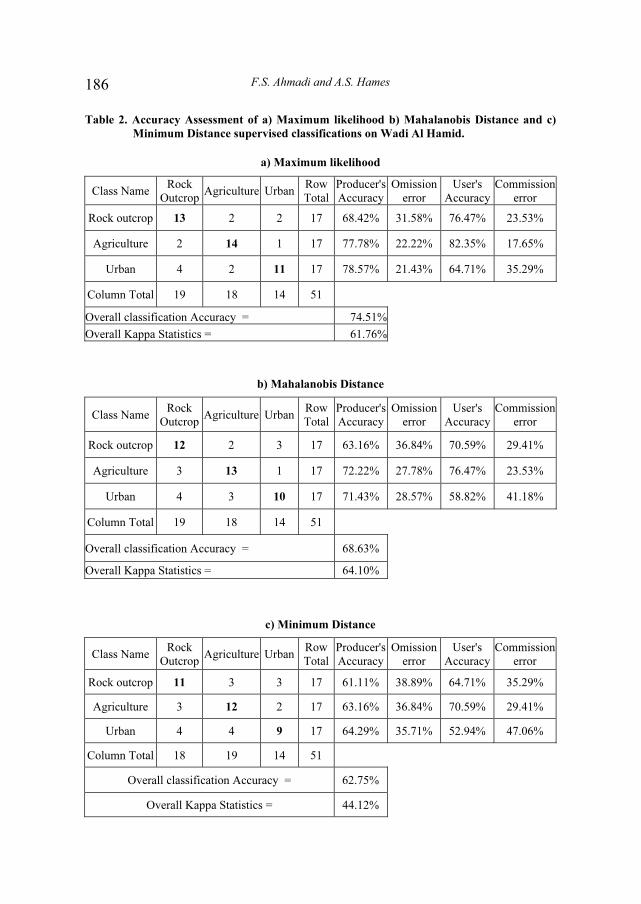
F.S. Ahmadi and A.S. Hames 186
b) Mahalanobis Distance
Class Name Rock
OutcropAgriculture Urban
Row
Total
Producer's
Accuracy
Omission
error
User's
Accuracy
Commission
error
Rock outcrop 12 2 3 17 63.16% 36.84% 70.59% 29.41%
Agriculture 3 13 1 17 72.22% 27.78% 76.47% 23.53%
Urban 4 3 10 17 71.43% 28.57% 58.82% 41.18%
Column Total 19 18 14 51
Overall classification Accuracy = 68.63%
Overall Kappa Statistics = 64.10%
c) Minimum Distance
Class Name Rock
OutcropAgriculture Urban
Row
Total
Producer's
Accuracy
Omission
error
User's
Accuracy
Commission
error
Rock outcrop 11 3 3 17 61.11% 38.89% 64.71% 35.29%
Agriculture 3 12 2 17 63.16% 36.84% 70.59% 29.41%
Urban 4 4 9 17 64.29% 35.71% 52.94% 47.06%
Column Total 18 19 14 51
Overall classification Accuracy = 62.75%
Overall Kappa Statistics = 44.12%
Table 2. Accuracy Assessment of a) Maximum likelihood b) Mahalanobis Distance and c)
Minimum Distance supervised classifications on Wadi Al Hamid.
a) Maximum likelihood
Class Name Rock
OutcropAgriculture Urban
Row
Total
Producer's
Accuracy
Omission
error
User's
Accuracy
Commission
error
Rock outcrop 13 2 2 17 68.42% 31.58% 76.47% 23.53%
Agriculture 2 14 1 17 77.78% 22.22% 82.35% 17.65%
Urban 4 2 11 17 78.57% 21.43% 64.71% 35.29%
Column Total 19 18 14 51
Overall classification Accuracy = 74.51%
Overall Kappa Statistics = 61.76%
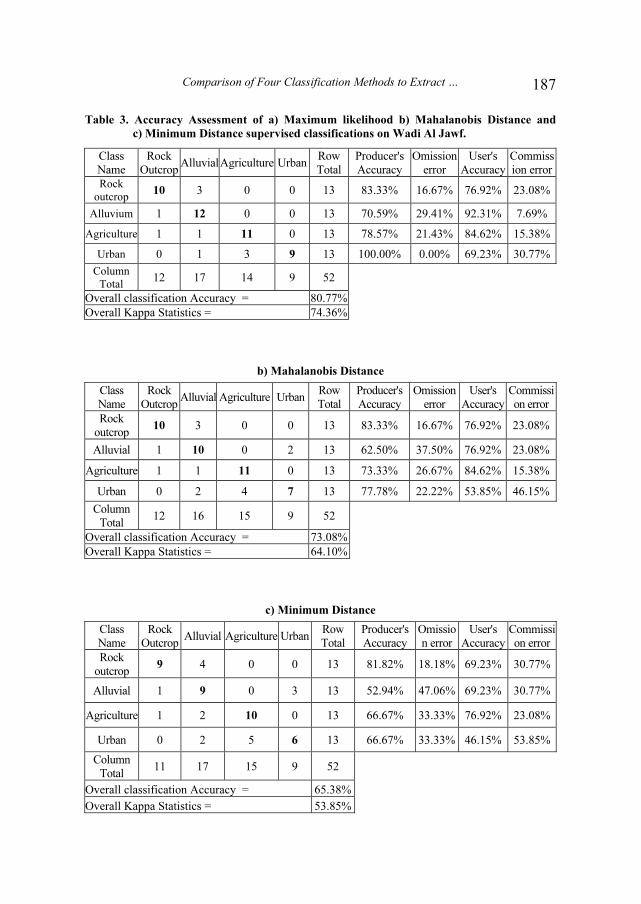
Comparison of Four Classification Methods to Extract … 187
Table 3. Accuracy Assessment of a) Maximum likelihood b) Mahalanobis Distance and
c) Minimum Distance supervised classifications on Wadi Al Jawf.
b) Mahalanobis Distance
Class
Name
Rock
OutcropAlluvial Agriculture Urban
Row
Total
Producer's
Accuracy
Omission
error
User's
Accuracy
Commissi
on error
Rock
outcrop 10 3 0 0 13 83.33% 16.67% 76.92% 23.08%
Alluvial 1 10 0 2 13 62.50% 37.50% 76.92% 23.08%
Agriculture 1 1 11 0 13 73.33% 26.67% 84.62% 15.38%
Urban 0 2 4 7 13 77.78% 22.22% 53.85% 46.15%
Column
Total 12 16 15 9 52
Overall classification Accuracy = 73.08%
Overall Kappa Statistics = 64.10%
c) Minimum Distance
Class
Name
Rock
OutcropAlluvial Agriculture Urban
Row
Total
Producer's
Accuracy
Omissio
n error
User's
Accuracy
Commissi
on error
Rock
outcrop 9 4 0 0 13 81.82% 18.18% 69.23% 30.77%
Alluvial 1 9 0 3 13 52.94% 47.06% 69.23% 30.77%
Agriculture 1 2 10 0 13 66.67% 33.33% 76.92% 23.08%
Urban 0 2 5 6 13 66.67% 33.33% 46.15% 53.85%
Column
Total 11 17 15 9 52
Overall classification Accuracy = 65.38%
Overall Kappa Statistics = 53.85%
Class
Name
Rock
OutcropAlluvialAgriculture Urban
Row
Total
Producer's
Accuracy
Omission
error
User's
Accuracy
Commiss
ion error
Rock
outcrop 10 3 0 0 13 83.33% 16.67% 76.92% 23.08%
Alluvium 1 12 0 0 13 70.59% 29.41% 92.31% 7.69%
Agriculture 1 1 11 0 13 78.57% 21.43% 84.62% 15.38%
Urban 0 1 3 9 13 100.00% 0.00% 69.23% 30.77%
Column
Total 12 17 14 9 52
Overall classification Accuracy = 80.77%
Overall Kappa Statistics = 74.36%
F.S. Ahmadi and A.S. Hames 188
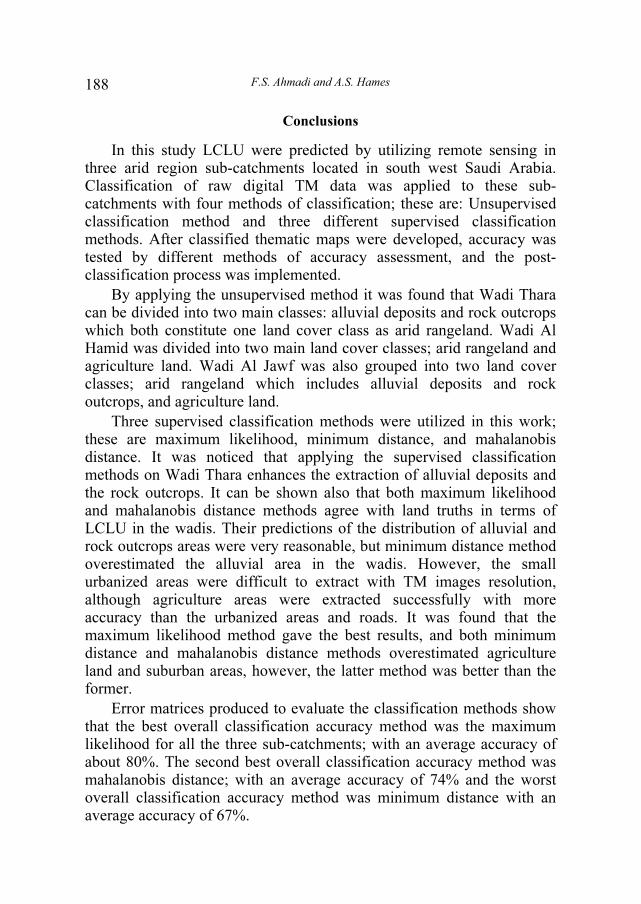
Conclusions
In this study LCLU were predicted by utilizing remote sensing in three arid region sub-catchments located in south west Saudi Arabia. Classification of raw digital TM data was applied to these sub-catchments with four methods of classification; these are: Unsupervised classification method and three different supervised classification methods. After classified thematic maps were developed, accuracy was tested by different methods of accuracy assessment, and the post-classification process was implemented.
By applying the unsupervised method it was found that Wadi Thara can be divided into two main classes: alluvial deposits and rock outcrops which both constitute one land cover class as arid rangeland. Wadi Al Hamid was divided into two main land cover classes; arid rangeland and agriculture land. Wadi Al Jawf was also grouped into two land cover classes; arid rangeland which includes alluvial deposits and rock outcrops, and agriculture land.
Three supervised classification methods were utilized in this work; these are maximum likelihood, minimum distance, and mahalanobis distance. It was noticed that applying the supervised classification methods on Wadi Thara enhances the extraction of alluvial deposits and the rock outcrops. It can be shown also that both maximum likelihood and mahalanobis distance methods agree with land truths in terms of LCLU in the wadis. Their predictions of the distribution of alluvial and rock outcrops areas were very reasonable, but minimum distance method overestimated the alluvial area in the wadis. However, the small urbanized areas were difficult to extract with TM images resolution, although agriculture areas were extracted successfully with more accuracy than the urbanized areas and roads. It was found that the maximum likelihood method gave the best results, and both minimum distance and mahalanobis distance methods overestimated agriculture land and suburban areas, however, the latter method was better than the former.
Error matrices produced to evaluate the classification methods show that the best overall classification accuracy method was the maximum likelihood for all the three sub-catchments; with an average accuracy of about 80%. The second best overall classification accuracy method was mahalanobis distance; with an average accuracy of 74% and the worst overall classification accuracy method was minimum distance with an average accuracy of 67%.

Comparison of Four Classification Methods to Extract … 189
References
Anderson, J.R., Hardy, E.E., Roach, J.T. and Witmer, R.E. (1976), A land use and land cover
classification system for use with remote sensor data, U.S. Geological Survey Professional
Paper, No. 964, USGS, Washington, D.C.
Engman, E. T. and Gurney, R. J. (1991) Remote Sensing in Hydrology, Chapman and Hall,
London, 225 p.
ERDAS IMGINE (2002) ERDAS Field Guide, 6th Edition, 686 p.
ESRI (2001) ArcGIS version 8, 8 volumes.
Foody, G.M., Ghoneim, E.M. and Arnell, N.W. (2004) Prediction locations sensitive to flash
flooding in an arid environment, Journal of Hydrology, No. 292, pp. 48-58.
Gangodagamage, C. (2001) Hydrological modeling using remote sensing and GIS, 22nd Asian
Conference on Remote Sensing, 5-9 Nov, 2001, Singapore.
Jensen, J. R. (1996) Introductory Digital Image Processing, A Remote Sensing Perspective, 2nd,
Prinice Hall, 318 p.
Kite, G.W. (1991) A watershed model using satellite data applied to a mountain basin in Canada,
Journal of Hydrology, No. 128: 157-169.
Lillesand, T.M. and Kiefer, R.W. (2000) Remote Sensing and Digital Image Interpretation,
Wiley, New York, 724 p.
Lyon, J. G. (1995) Remote Sensing and Geographic Information Systems in Hydrology, in Ward,
A. D., and Elliot, W. J., (eds.), Environmental Hydrology, CRC Press, pp: 337-367.
Nayak, T. and Jaiswal, R. (2003) Rainfall-runoff modeling using satellite data and GIS for
Bebas river in Madhya Pradesh, IE (I) Journal-CV, Vol. 84.
Qi, J., Huete, A. R., Cabot, F. and Chehboumi, A. (1994) Biodirectional properties and
utilizations of high resolution spectra from a semi-arid watershed, Water Resources
Research, 30 (5), pp. 1271-1279.
Ragan, R.M. and Jackson, T.J. (1980) Runoff synthesis using Landsat and SCS model, Journal
of Hydraulic Division, ASCE (106), pp. 667-678.
Rango, A and Shalaby, A (1998) Operational applications of remote sensing in hydrology:
success, prospects, and problems, Hydrological Sciences Journal, 43 (6), pp. 947-968.
Richards, J. A. (1999) Remote Sensing and Digital Image Analysis: An Introduction, 2nd ed.
Springer, Berlin, Heidelberg, 363 p.
Richards, J. A. and Jia, X. (1998) "Remote Sensing Digital Image Analysis: An Introduction",
3rd Ed., Springer, Germany, 365 p.
Ritchie, J. C. and Rango, A (1996) Remote sensing application to hydrology: introduction,
Hydrological Sciences Journal, 41(4): 429-431.
Schultz, G.A. (1988) Remote sensing in hydrology, Journal of Hydrology, No. 100, pp. 239-265.
US Army Corps of Engineers (USACE) (2003) Remote Sensing, Engineering and design,
Engineering Manual EM 1110-2-2907, 217 p.

F.S. Ahmadi and A.S. Hames 190
����� ���� � ���� ����� �� ����� ������
����� �������� ������ �!� "� ������ #���$����!
��$!���� ������� �%&����� ��'���� �(�)�� ������ *���
����� �� ���� ������ ���� ���*
������� ���������� ��� ������ ������� �� ������� ������ ����� �������
������������� �������� ������ ������� �
* ���� ���� ���� ������� ������ ���� ��� ���������� ����� ���
�������� ������ �������
������� .�������� �� �� �� �� ��� �� �������
����� ������ ��� !"������ #������ $�%��� ������� �� &'�
&'���� (���� ���)LULC ( ���+�� ��, �� &-�/0 ����
$�0���� &1 $1���� $�-���� 2������ ���� (����� 3�� $����,��
$������� $������ .��%4 $,0 ���� (������� 567 $��78
96��� (� �� �� "� �� ��� �:� $;0 � ���<� �%��� ���
������ �� ������ ���/)rainfall-runoff( +� �+ ���=� !
>�=����)CN (���� �-�, �$ . $������ 567 &1 (�� �� �/��
8 � �� $�-�';�� ��,0� $;0 � ?��, 2�� @��)raw
thematic maps( &7� !)ISODATA, Maximum likelihood, Mahalanobis Distance, and Minimum
Distance .($���/�� ��/�� A�6 ��� � �%+� ��� �� �-�� ��
���� >0� ��/�� �%���/�� !$�����)ground-truths ( ��0=�

Comparison of Four Classification Methods to Extract … 191
�%�1 :� �� . $+�� "��4� !#���,�� ������ ��� �/1 �� <��� >0��
$�� ���� $����,�� ���+�� ��,)BC(8 ��� �+ D�8 �E ! A��7 �
"��-�/0 $,0 ���� (������� ��� ��� 21�� $�0/=�� (��7������
@+���� &1.


