Comparison of financial models - IPART and Australian Energy ...
32
Independent Pricing and Regulatory Tribunal Comparison of financial models - IPART and Australian Energy Regulator Research — Research Paper November 2009
Transcript of Comparison of financial models - IPART and Australian Energy ...

Independent Pricing and Regulatory Tribunal
Comparison of financial models -
IPART and
Australian Energy Regulator
Research — Research Paper
November 2009


Comparison of financial models – IPART and Australian Energy Regulator
Research — Research Paper November 2009

ii IPART Comparison of financial models – IPART and Australian Energy Regulator
© Independent Pricing and Regulatory Tribunal of New South Wales 2009
This work is copyright. The Copyright Act 1968 permits fair dealing for study, research, news reporting, criticism and review. Selected passages, tables or diagrams may be reproduced for such purposes provided acknowledgement of the source is included.
ISBN 978-1-921628-13-9 DP123
The Tribunal members for this review are:
Mr James Cox, Acting Chairman and Chief Executive Officer
Ms Sibylle Krieger, Part Time Member
Inquiries regarding this document should be directed to a staff member:
Bee Thompson (02) 9290 8496
Linda Li (02) 9113 7729
Independent Pricing and Regulatory Tribunal of New South Wales PO Box Q290, QVB Post Office NSW 1230 Level 8, 1 Market Street, Sydney NSW 2000
T (02) 9290 8400 F (02) 9290 2061
www.ipart.nsw.gov.au

Comparison of financial models – IPART and Australian Energy Regulator IPART iii
Contents
1 Background 1
2 Comparison of models 2 2.1 Models used 2 2.2 Main components and differences 2 2.3 Features of IPART’s and the AER’s spreadsheet models 13
Appendices 15 A Building block components 17 B Weighted average cost of capital (WACC) 20 C Map of AER’s Post Tax Revenue model 22 D Map of IPART’s metropolitan water model 24


Comparison of financial models – IPART and Australian Energy Regulator IPART 1
1 Background
The use of a ‘building block’ approach to determining an agency’s revenue requirement is common amongst economic regulators. This approach generally requires the determination of efficient operating costs, a return of capital (or depreciation) and a return on capital. The revenue requirement generated by adding these cost components is converted into tariffs or prices in accordance with the regulator’s preferred method of control.
IPART uses the building block approach to price water services (metropolitan water and bulk water) and passenger transport services (rail and, in the future, buses). Until the economic regulatory functions for the NSW electricity distribution sector were transferred to the Federal Australian Energy Regulator, IPART also used a building block approach to price electricity and gas distribution services.
Although the basic principles of the building block approach are well understood, there are differences between regulators with respect to the types of component ‘blocks’ used and/or how they are calculated. There are also differences in the methodologies that regulators use to price services. These differences often reflect the types of incentives that regulators or policy makers wish to give to the regulated entities in question (eg, incentives to improve efficiency).
The Australian Energy Regulator is one of a number of regulators that publish their cost building block and pricing models.1 IPART compared the AER’s model with one of our own models to:
better understand how the AER approaches building block calculations and constructs its pricing models
identify any significant differences between the AER’s and IPART’ models and the reasons for those differences.
This paper describes and compares the key components of the AER’s and IPART’s building block calculation models, focussing on the major differences between them. It also describes how the models are physically composed. The appendices set out in detail how IPART’s and the AER’s models are constructed.
1 Other regulators include, for example, the Office of the Gas and Electricity Markets (Ofgem) in
the UK, Victoria’s Essential Services Commission (ESC) and Western Australia’s Economic Regulation Authority.

2 IPART Comparison of financial models – IPART and Australian Energy Regulator
2 Comparison of models
2.1 Models used
The models examined for this paper are that recently used by the AER to determine prices for electricity distribution services and by IPART to determine prices for metropolitan water services. The AER’s electricity distribution services model is useful for comparison purposes because, until 31 December 2007, prices for this sector were regulated by IPART. In recently assuming regulatory responsibility for this sector, the AER considered in detail how it should assess costs and set prices within the framework set by the National Electricity Rules.
The National Electricity Rules are a subordinate regulatory instrument under the National Electricity Law. The Rules prescribe to a significant degree how the AER must undertake building block calculations and set prices. In contrast, IPART has reasonably broad regulatory discretion.
IPART’s cost building block model for metropolitan water services is based largely on past practice and established calculation methodologies. However, IPART considers at each periodic pricing review whether any element needs to be changed given the issues relevant to that particular determination.
This paper compares the main components of the models and provides a broad overview of each regulator’s approach to determining costs and prices. We recommend that readers read determination reports if they wish to gain a more detailed understanding of how the approaches were applied in practice and modelling outcomes.
2.2 Main components and differences
The cost building block and pricing model used by the AER is known as the Post-Tax Revenue Model (PTRM). The PTRM is used to determine prices for the standard control services of electricity distribution network service providers (DNSPs).
The main differences between the PTRM and IPART’s model were found to be associated with:
the building block components
the timing assumptions used
how assets are rolled forward, and
how the weighted average cost of capital (WACC) is calculated.

Comparison of financial models – IPART and Australian Energy Regulator IPART 3
Some differences relate to the assumptions used while others relate to the particular building block calculation methodologies adopted by the AER and IPART. Analysing how the components are calculated (that is, the formulae in the models) is therefore an important part of making comparisons.
2.2.1 Building block components
AER’s Post Tax Revenue Model
Annual revenue requirement (ARR) = return of assets + partially post-tax return on assets + opex (excludes carry-over amounts) + carry-over amounts + benchmark tax liability
IPART’s pre-tax building block model
Notional revenue requirement = return of assets + pre-tax return on assets + pre-tax return on working capital + opex
The cost building blocks in both the AER and IPART’s models include three main components: 1) return of assets (depreciation); 2) return on assets; and 3) operating expenditure (opex).
The building blocks in the AER’s PTRM differ to IPART’s model in three main ways:
the AER includes two components not included by IPART (carry-over amounts and a benchmark tax liability)
the AER provides for a partially post-tax return on assets, whereas IPART’s allowed revenue includes a pre-tax return on assets. Hence the AER includes a tax building block, while IPART makes provision for tax in the return on assets, and
IPART provides for a return on working capital.
These and other similarities and differences between the models are described below.
Carry-overs
The National Electricity Rules (NER) require carry-over amounts to be included in the AER’s building block model. The NER provide for carry-overs because the AER is required, also by the NER, to apply an Efficiency Benefit Sharing Scheme (EBSS) to distribution network service providers.
The EBSS is an incentive mechanism that provides additional revenue or applies penalties depending on whether the business exceeds or falls short of operating expenditure targets in each year of a regulatory control period. The scheme allows businesses to retain any operating efficiency gain or requires them to bear any loss for a set period, irrespective of the year in that control period in which the efficiency gain or loss was initiated. The EBSS is aimed at providing Distribution Network

4 IPART Comparison of financial models – IPART and Australian Energy Regulator
Service Providers (DNSPs) with a continuous incentive to improve the efficiency of its operating expenditure (opex).2
There is no requirement that IPART use carry-over mechanisms in setting prices. The current metropolitan water model does not provide for carry-overs.
Tax liabilities
The AER’s PTRM is a post-tax model, and a benchmark tax liability is included as a building block cost. The PTRM includes a post-tax return on equity and a pre-tax return on debt, in line with a “vanilla’ WACC (see section 2.2.4 below). For the post-tax return on equity the AER uses an effective tax rate based on the statutory tax rate and an adjustment for imputation credits, with the tax liability modelled as a building block cost. In contrast, IPART uses a pre–tax WACC to calculate the return on assets. The total tax liability is included in the allowed return rather than as a cost line item.
Return on assets
Like IPART, the AER calculates returns using the standard CAPM model and debt margin formulas.
The AER applies a nominal vanilla WACC to a nominal RAB, and makes the adjustment for inflation indexation, which is applied to the RAB, in the depreciation cost building block (see below). In contrast, IPART applies a real WACC to the RAB, which may be nominal or real,3 and therefore does not need to adjust for inflation indexation.
The AER applies the WACC to the opening value of the RAB each year, and inflates capex by a half-year of WACC to compensate for lost return on new assets due to the mid-year timing assumption (see section 2.2.2). In contrast, IPART applies the WACC to the opening value plus 50% of capex so that the return on new assets is immediately included in revenue.
IPART calculates a mid-year value of return on and of assets in the cost building blocks, because it is assumed revenue is received evenly through the regulatory year rather than in full at year-end as assumed by the AER (see discussion of timing assumptions below). Because of this, IPART recognises a need for an explicit working capital allowance and therefore includes a return on working capital in the cost building blocks. The AER’s return on and of assets are year-end values, and no allowance is made for working capital.
2 The EBSS will not have a direct financial impact on the NSW (DNSPs) until the 2014 – 2019
regulatory control period for transitional reasons. 3 The IPART model has the option of forecasting costs and prices in nominal or real terms. If the
forecasts are in real term, a real WACC is applied to a real RAB and prices are set in real terms. The prices are then inflated to give nominal prices.

Comparison of financial models – IPART and Australian Energy Regulator IPART 5
The AER splits the return on assets into return on equity and return on debt by multiplying the nominal residual RAB value by the proportion of equity or debt funding. It does this to identify the interest payment that it needs to calculate the building block tax liability. The AER also uses these returns in its cash flow analysis, to compare return to debt and equity holders. In contrast, IPART calculates a single return on assets, and calculates interest, tax and dividend payments separately as part of the financial statements and ratio analysis. Splitting the return on assets does not, of itself, affect the cost building blocks.
Return of assets (depreciation)
The AER and IPART both calculate depreciation using the straight-line method.
The PTRM is a nominal model. To ensure that inflation is not double-counted – that is, entities do not receive inflation costs rolled forward in the RAB and also included in the nominal vanilla WACC (discussed above) - the inflation component in the opening RAB is deducted from depreciation calculations.4
Formulae A1 and A2 below show how the AER calculates depreciation. The existing asset value (opening RAB) is depreciated based on the remaining life of the assets. For expenditure on new assets, a half-year WACC allowance is provided to compensate for the six month period before a return on capex is provided (this reflects the AER’s mid-year capex assumption). The adjusted capex value is depreciated using the standard life of the assets. The standard life measures how long the infrastructure would physically last had it just been built.
A1.
Nominal straight-line depreciation = real straight-line depreciation (A2) x cumulative
inflation index
A2.
lifendardsta
WACCvanillarealcapexnetforecast
lifemainingre
RABOpeningondepreciatilineStraightaleR
21
1
Note:
WACC) vanillareal (1)1( 21
WACCvanillareal
Forecast net capex = capex - capital contributions – asset disposals
4 Email correspondence with Toby Holder from the AER, 24 August 2009.
6 IPART Comparison of financial models – IPART and Australian Energy Regulator
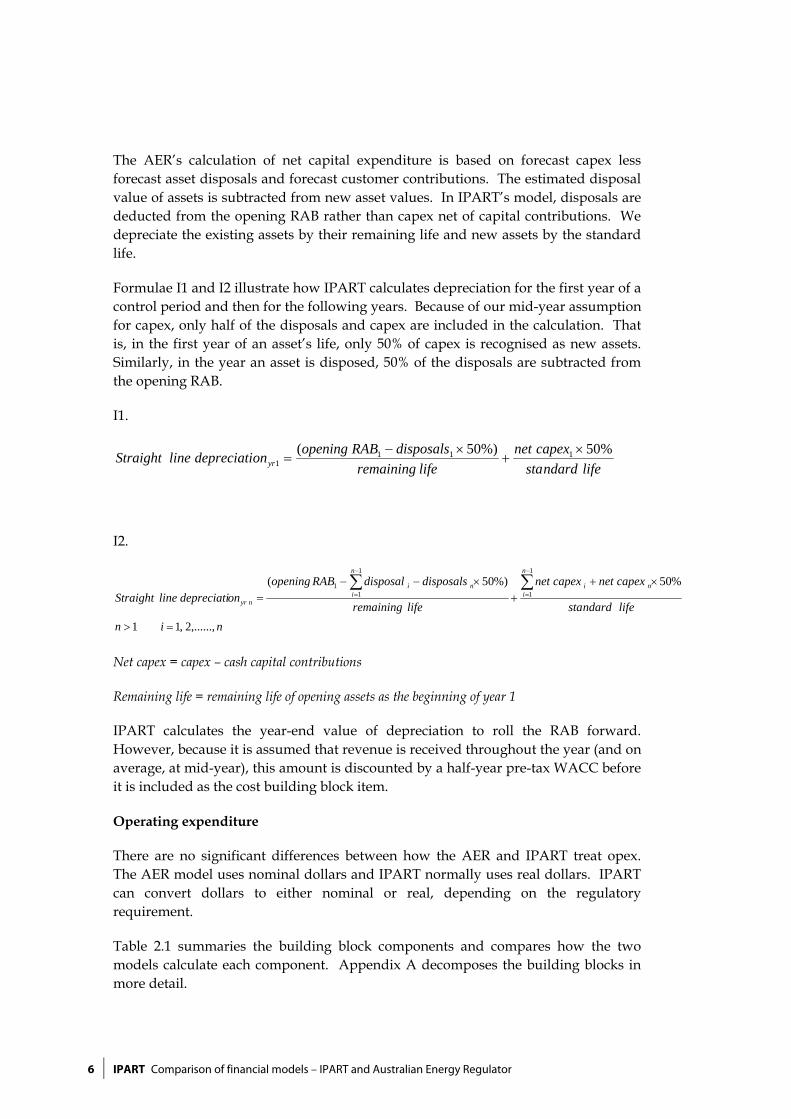
The AER’s calculation of net capital expenditure is based on forecast capex less forecast asset disposals and forecast customer contributions. The estimated disposal value of assets is subtracted from new asset values. In IPART’s model, disposals are deducted from the opening RAB rather than capex net of capital contributions. We depreciate the existing assets by their remaining life and new assets by the standard life.
Formulae I1 and I2 illustrate how IPART calculates depreciation for the first year of a control period and then for the following years. Because of our mid-year assumption for capex, only half of the disposals and capex are included in the calculation. That is, in the first year of an asset’s life, only 50% of capex is recognised as new assets. Similarly, in the year an asset is disposed, 50% of the disposals are subtracted from the opening RAB.
I1.
lifendardsta
capexnet
liferemaining
disposalsRABopeningondepreciatilineStraight yr
%50%)50( 1111
I2.
lifendardsta
capexnetcapexnet
liferemaining
disposalsdisposalRABopeningondepreciatilineStraight
n
n
iin
n
ii
nyr
%50%)50(1
1
1
11
nin ,......,2,11
Net capex = capex – cash capital contributions
Remaining life = remaining life of opening assets as the beginning of year 1
IPART calculates the year-end value of depreciation to roll the RAB forward. However, because it is assumed that revenue is received throughout the year (and on average, at mid-year), this amount is discounted by a half-year pre-tax WACC before it is included as the cost building block item.
Operating expenditure
There are no significant differences between how the AER and IPART treat opex. The AER model uses nominal dollars and IPART normally uses real dollars. IPART can convert dollars to either nominal or real, depending on the regulatory requirement.
Table 2.1 summaries the building block components and compares how the two models calculate each component. Appendix A decomposes the building blocks in more detail.

Comparison of financial models – IPART and Australian Energy Regulator IPART 7
Table 2.1 Building block components
Building block components In model Comments on the difference in calculation
AER IPART
Carry-over amounts Yes No Inclusion of carry-over amounts for DNSPs is a requirement of the National Electricity Rules.
Benchmark tax liability Yes No IPART does not include a benchmark tax liability because it is a pre-tax model.
Return on asset Yes Yes The AER applies a nominal vanilla WACC to a nominal RAB and makes an adjustment for inflation in depreciation. IPART applies a real WACC to the RAB.
IPART adjusts the year-end value of return on assets by discounting it by a half-year pre-tax WACC.
Return of asset (depreciation) Yes Yes The AER’s model adjusts depreciation for inflationary gain. IPART adjusts the year-end value of depreciation by discounting it by a half-year pre-tax WACC.
Return on working capital No Yes The AER excludes return on working capital due to its timing assumptions.
Opex Yes Yes There are no fundamental differences in the treatment of opex. The AER adjusts for inflation because it is a nominal model.
2.2.2 Timing assumptions
Assumptions about the timing of expenditure affect the treatment of capex and building block revenue. Under a “mid-year assumption”, it is assumed that revenue arises or expenditure occurs evenly throughout the regulatory year. A “year-end assumption” assumes that expenditure occurs or revenue arises on the final day of each regulatory year.
Table 2.2 shows the timing assumptions used by the PTRM and IPART models.

8 IPART Comparison of financial models – IPART and Australian Energy Regulator
Table 2.2 Timing assumptions
AER IPART
Assumptions Adjustments Assumptions Adjustments
Capex Mid-year assumption
Capex (1+real vanilla WACC)1/2
Mid-year assumption
Capex 50%
Cost building blocks
Year-end assumption
Mid-year assumption
Mid-year value of depreciation and return on assets
Eg year-end depreciation/ (1+ real pre-tax WACC)1/2
Return on working capital provided.
Note:
WACC) vanillareal (1)1( 21
WACCvanillareal
tax WACC)-pre real (1)1( 21
WACCtaxprereal . A nominal WACC is used in a nominal model.
The PTRM adopts a mid-year assumption for capex. The model calculates the return on capital based on the opening RAB for each year. Capex is not added to the RAB until the end of the year in which the expenditure is incurred. The mid-year assumption is put into effect by providing a half-year WACC allowance (see formula A2, page 8). The half-year WACC allowance is depreciated over the life of the asset. In comparison, instead of capitalising the return on assets, IPART gives the businesses a return of 50% of capex in revenue.
The AER’s PTRM adopts a year-end assumption for both opex and revenue - that is, that expenditure and revenue occur on the final day of each year. Therefore, no adjustment is made for opex and revenue.
IPART makes mid-year assumptions for all expenditure and revenue. Therefore, adjustments are made to both capex and revenue items. For capex, this assumption is effected in the calculations by assuming that half of the capex is incurred at the beginning of the year and the other half occurs at the end of the year. For this reason, only half of forecast capex is incorporated into the estimation of depreciation and the return on assets (see formulae I1 and I2, page 8) in the first year of that asset’s existence, and similarly for assets that are disposed.
For revenue, the mid-year assumption leads to the adjustment of the allowance for depreciation and return on assets by discounting them by six months of the pre-tax WACC. Given these strict timing assumptions, IPART recognises a need for an explicit working capital allowance and therefore includes a return on working capital in the cost building blocks.

Comparison of financial models – IPART and Australian Energy Regulator IPART 9
2.2.3 Asset roll forward
The AER has a separate Roll Forward Model (RFM) to determine the value of the opening regulatory asset base for distribution network service providers. The RFM rolls forward the RAB for each year of the regulatory period in question to reflect actual capex and depreciation incurred in each year. The closing RAB figure calculated by the RFM then becomes an input to the PTRM as the opening RAB for the following regulatory period. IPART includes calculations on asset roll forwards within the one model.
In relation to rolling forward the asset base to the start of the new determination period, the first difference is that the AER uses actual rather than allowed depreciation.5 IPART’s model permits a choice between actual or allowed depreciation, although regulatory practice since 2004 has generally been to use allowed rather than actual depreciation.
The second difference is that the AER fully compensates for the difference between actual and forecast net capex in the last year before the start of the existing determination.6. IPART does not make an explicit adjustment for this difference. However, IPART makes a partial adjustment when the RAB is rolled forward using allowed depreciation because a capex overspend, for example, will be rolled in before depreciation so that only the return on capex is foregone.
The AER’s approach is largely prescribed on the National Electricity Rules. The Rules require that the RAB should be adjusted for the difference between any estimated capex and actual capex for the last year of the previous control period and the adjustment must also remove any benefit or penalty associated with any difference between the estimated and actual capex.
In setting the opening RAB the AER recognises Capex on an “as-incurred” basis7. This approach is consistently adopted in the AER’s distribution models (RFM and PTRM). However in the transmission RFM and PTRM, a “hybrid” approach is adopted: the return on capex is calculated “as incurred” and return of capex is calculated “as commissioned”.8 In comparison, IPART’s building block model uses “as-incurred” capex .
Finally, the AER and IPART treat the ‘mid-year assumption’ differently. As noted above, the AER’s capex is rolled into the RAB inclusive of a half year WACC adjustment, whereas IPART recognises half of the capex for the adjustment.
5 “Actual” depreciation means depreciation that is calculated on the basis of actual net capex and
asset lives. “Allowed” depreciation means the depreciation that was forecast at the previous determination, but adjusted for actual inflation.
6 For example, the AER adjusts for the difference in 2003/04, the year before the beginning of the 2004/05 – 2008/09 determination period.
7 The "as-incurred" basis assumes that the economic life of an asset would commence at the time spending is incurred.
8 The "as-commissioned" basis assumes that the economic life of an asset would commence at the time an asset is commissioned and enters service.

10 IPART Comparison of financial models – IPART and Australian Energy Regulator
Table 2.3 Asset roll forward comparison
AER IPART
RAB roll forward to the start of the new determination period
Opening RAB
= closing RAB of previous year
+ actual capex (WACC adjusted) net of capital contributions and disposals
-actual straight line depreciation
+indexation on opening RAB
+ adjustment for the difference between actual and forecast net capex in year before start of existing determination
Opening RAB
= closing RAB of previous year
+ actual capex net of capital contributions
- actual disposals
- allowed depreciation (adjusted for inflation)
+ indexation on opening RAB plus 50% of capex and disposals
Forecast real RAB Opening real RAB
= closing real RAB of previous year
-real straight line depreciation of opening RAB
+ real capex (WACC adjusted) net of capital contributions and disposals
Opening real RAB
= closing real RAB of previous year
- real straight line depreciation of opening RAB , 50% of capex and 50% of disposals
+ real capex net of capital contributions
- real disposals
Forecast nominal RAB
Opening nominal RAB
= closing nominal RAB of previous year
-nominal straight line depreciation
+ nominal capex (WACC adjusted) net of capital contributions and disposals
+ indexation on opening RAB
Opening nominal RAB
= closing nominal RAB of previous year
- nominal straight line depreciation
+ nominal capex net of capital contributions
- nominal disposals
+ indexation on opening RAB plus 50% of capex and disposals
2.2.4 WACC calculation
The weighted average cost of capital (WACC) is the rate a company is expected to pay its debt holders (cost of debt) and shareholders (cost of equity) to finance its assets. WACC is one of the key inputs in the calculation of the X factors. Appendix B contains a more detailed explanation of WACC.

Comparison of financial models – IPART and Australian Energy Regulator IPART 11
Under the National Electricity Rules, the rate of return for electricity distribution networks must be calculated as a nominal post-tax WACC. Therefore, a nominal ‘vanilla’ WACC is used to determine the return on capital. This WACC is also used to discount cash flows over the regulatory period.
AER’s nominal vanilla WACC formula:
Nominal vanilla WACC = nominal post-tax cost of equity proportion of equity funding + nominal pre-tax cost of debt proportion of debt funding
IPART uses a real pre-tax WACC in its building block model. The real pre-tax WACC is used to determine the return on capital and to discount cash flows.
IPART’s real pre-tax WACC formula:
DE
Ddebtofttaxprenom
DE
E
T
equityofstcotaxpostnomWACCtaxpremNo
cos)1(1
fundingequityofproportionDE
E
fundingdebtofproportionDE
D
ratetaxstatutoryT
creditimputation
11
1
rateflationin
WACCtaxprenalnomiWACCtaxpreealR
The AER’s WACC calculation is included as a separate sheet in the AER’s PTRM, whilst IPART calculates the WACC in a separate model and it simply forms an input to the building block model. This has no impact on the WACC calculations or the model outputs. IPART's approach to WACC calculation is usually discussed in detail in our reports.

12 IPART Comparison of financial models – IPART and Australian Energy Regulator
2.2.5 Pricing mechanisms
The NER require prices for DNSPs to be set based on a CPI - X approach. The Rules provide 5 optional pricing mechanisms.9 Under all forms of pricing control, the X factors must be set such that the following conditions are met:
The annual revenue requirement (ARR) and forecast revenues are equal in NPV terms (P0 is the balancing X factor).
The value of expected revenues and the ARR in the final year of the regulatory period must be as close as reasonably possible.
The current PTRM provides for 3 price control mechanisms:
1. Weighted average price cap (WAPC). X factors are set to escalate prices and derive a forecast revenue amount.
2. Revenue cap. X factors derive a nominal smoothed maximum allowed revenue for each year of the regulatory control period.
3. Revenue yield (average revenue cap, in $/MWh). X factors derive a nominal revenue yield value for each year of the regulatory control period. The value of the revenue yield is multiplied by the forecast energy throughput to derive forecast total revenue.
The PTRM is constructed to produce the X factors that are applicable to revenue caps, price caps and revenue yield forms of control.
Under the Independent Pricing and Regulatory Tribunal Act 1992, IPART is permitted to fix maximum prices or establish a methodology for fixing maximum prices for monopoly services. As such, IPART uses price cap mechanisms for the monopoly service providers that are regulated under the Act (including water and passenger rail).10 In the water sector, IPART has in the past used four different price setting methods:
Glide path.
Revenue = cost each year.
NPV equivalence.
P0 glide path.11
IPART’s model shows how prices are derived given the preferred approach to price setting. For IPART, X factors/prices do not necessarily have to be set to achieve NPV neutrality. Whether or not we seek NPV neutrality depends on the business and the particular considerations attending a pricing review.
9 For details on the five options allowed, see clause 6.2.5 (b) of the NER. 10 Some sectors, including energy, are regulated under other legislation. 11 It is noted that the P0 glide path may yield the same results as the NPV equivalence method. An
NPV neutral position can be reached when P0 is large enough (in absolute terms).

Comparison of financial models – IPART and Australian Energy Regulator IPART 13
2.3 Features of IPART’s and the AER’s spreadsheet models
The AER’s building block model is simpler than IPART’s (eg, contains fewer calculations and worksheets) partly because many elements of cost and price setting are set by the National Electricity Rules and do not need to be informed by the model. It is also built for use by both the AER and distribution network businesses. DNSPs use the PTRM to calculate their estimated annual revenue requirements (which forms part of their pricing submissions). The AER uses the PTRM to make its determinations of DNSPs’ revenue requirements.
The model includes a cash flow analysis, which serves as a check to ensure consistency of outcomes with the assumptions adopted in the building block calculations. The model does not contain other financial analyses, customer profile information or pricing calculations.
IPART’s pricing models are more complex than the AER’s as they are constructed predominantly for use by IPART and regulatory staff and used to facilitate regulatory decision-making. The majority of calculations are contained in the one model to avoid errors.
IPART’s model includes a profit and loss analysis, balance sheet analysis and cash flow analysis. In addition to the financial statement analyses, IPART calculates credit ratios to provide an indication of a particular scenario’s impact on the credit-worthiness of the regulated business. The model also has data management functions, ie, provisions to store different sets of inputs (eg, opex, capex and demand). These functions enable users to choose the relevant inputs for analysis.
Table 2.4 matches the corresponding elements of the AER’s PTRM and IPART’s metropolitan water model. Appendices C and D contain pictorial ‘maps’ of the two models, showing the relationship between the major work sheets in each model.

14 IPART Comparison of financial models – IPART and Australian Energy Regulator
Table 2.4 Matching the corresponding components of the AER's model to IPART's model
Model component Worksheets in the model
AER IPART
Inputs Input Import
Cost assumptions
Pricing Assumptions
Pricing mechanisms
- setting tariffs X factor Scenario (inputs)
Tariffs (detailed calculations)
RAB roll forward
- Roll forward to the start of the new determination period
RFM model RAB worksheet
- Forecast RAB Assets Regulatory Assets Costs and revenues
- Costs Assets and Analysis Costs
- Revenues Forecast revenues Revenues
WACC WACC N/A (separate model) Other analysis Analysis Book Assets
Financial Statements
Ratios
Bills

Comparison of financial models – IPART and Australian Energy Regulator IPART 15
Appendices

16 IPART Comparison of financial models – IPART and Australian Energy Regulator

Comparison of financial models – IPART and Australian Energy Regulator IPART 17
A Building block components

18IPA
RT Comparison of financial m
odels – IPART and A
ustralian Energy Regulator
Table A.1 Building block components
AER’s PTRM IPART’s metropolitan water model
Building block components
Formulae Related formulaea
Formula Related formula
Return of asset
(Depreciation)
nominal regulatory depreciation = nominal straight-line depreciation - inflation on opening RAB
A1, A2, Regulatory depreciation = (straight-line depreciation + allocation of corporate depreciation ) / (1+ real pre-tax WACC)1/2 b
I1, I2
Return on asset Return on asset = return on equity + return on debt Return on asset = (opening RAB + capex net of capital contribution 50% - disposals 50%) inflation index + allocation of corporate return on assets) / (1+ real pre-tax WACC)1/2 b
Return on equity Return on equity = end period nominal residual RAB of equity post-tax nominal return on equity (pre-imputation)
A1, A2, A3, A4, A5, A6, A7
N/A
Return on debt Return on debt = end period nominal residual RAB of debt pre-tax nominal return on debt
A1, A2, A3, A4, A5, A6, A8
N/A
Return on working capital
NA Return on working capital = (real pre-tax WACC net working capital) / (1+ real pre-tax WACC)
½ 2 b
Carry-over amounts Carry-over amounts = Carry-over amounts cumulative inflation index
N/A
Benchmark tax liability Benchmark tax liability = tax payable - value of imputation credits
N/A
Opex Opex (excludes carry-over amounts) = (controllable opex + corporate + other + debt raising costs) cumulative inflation index
Opex = water opex + wastewater opex+stormwater opex + corporate opex + bulk water purchase costc
a Related formulae expands the formulae in Appendix A.1 further into its components. These can be found in Appendix A.2.
b When nominal building block costs are calculated, a nominal pre-tax WACC is used to calculate the return on working capital and to discount the return on and of assets to mid-year values.
c Bulk water purchase costs only applicable as the IPART model that is used in this comparison is for the metropolitan-water businesses.

19 Com
parison of financial models – IPART and Australian Energy Regulator IPA
RT
Table A.2 Related formulae
Items Formulae
A1. Nominal straight-line depreciation Nominal straight-line depreciation = real straight-line depreciation cumulative inflation index
A2. Real straight-line depreciation
lifendardsta
WACCvanillarealcapexnetforecast
lifemainingre
OpeningRABondepreciatilineStraightaleR
21
1
Forecast net capex = capex - capital contributions – asset disposals
I1. Straight-line depreciation (Year 1)
lifendardsta
capexnet
liferemaining
disposalsRABopeningondepreciatilineStraight yr
%50%)50( 111
Net capex = capex - capital contributions I2. Straight-line depreciation (Year n)
lifendardsta
capexnetcapexnet
liferemaining
disposalsdisposalRABopeningondepreciatilineStraight
n
n
iin
n
ii
nyr
%50%)50(1
1
1
11
nin ,......,2,11
Net capex = capex - capital contributions
A3.End period nominal residual RAB of equity or debt End period nominal residual RAB of equity or debt = end period nominal residual RAB proportion of equity or debt funding
A4. End period nominal residual RAB End period nominal residual RAB = end period real residual RAB cumulative inflation index
A5. End period real residual RAB End period real residual RAB = end period real residual RAB of previous year - real straight line depreciation + real capex adjustment
A6. Real capex adjustment Real capex adjustment = forecast net capex (1+real vanilla WACC) 1/2
A7. Post-tax nominal return on equity (pre-imputation) Post-tax nominal return on equity (pre-imputation) = nominal risk free rate + equity beta market risk premium
A8. Post-tax nominal return on debt (pre-imputation) Pre-tax nominal return on debt = nominal risk free rate + cost of debt margin
Note:
WACC) vanillareal (1)1( 21
WACCvanillareal
20 IPART Comparison of financial models – IPART and Australian Energy Regulator
B Weighted average cost of capital (WACC)
The cost of capital is weighted by the return required by the two sources of funding available to a business - equity and debt, and their proportion used by the business. ‘Equity’ refers to funds raised from the owners of the business, the shareholders. ‘Debt’ refers to any borrowings of the regulated business.
Pre-tax real WACC or post-tax nominal WACC
The WACC can be calculated before or after tax, and can be expressed in real or nominal terms. Theoretically, the calculation of the WACC as pre-tax or post-tax should have little impact on the revenue outcome for the regulated business, provided the same tax rate is assumed.
In either case, the effective or statutory tax rate may be used. IPART has used the statutory tax rate of 30% in all previous determinations.
WACC parameters
There are a number of input parameters to consider in determining an appropriate WACC range. Some of these parameters are directly determined by the market, while others are determined by IPART according to a preferred theoretical approach.
The calculation of the cost of capital under the WACC framework requires the estimation of the following parameters:
1. Parameters determined by financial market data:
risk free rate (Rf)
debt margin (RD - Rf)
adjustment for expected inflation (Π).
2. Parameters determined through other methods:
the market risk premium (MRP) (Rm - Rf)
the correlation between common equity returns and that of the overall market (βe equity beta)
the level of gearing (D debt, E equity)
the value of imputation credits (γ gamma).
The parameters of the WACC are related to each other. For instance, a higher level of gearing implies a higher debt margin and a higher equity beta than would otherwise be the case.
These parameters are combined through the formula below, to give the pre-tax WACC.

Comparison of financial models – IPART and Australian Energy Regulator IPART 21
11
).().(1.1
1
ED
ER
ED
E
t
R
WACCd
e
22 IPART Comparison of financial models – IPART and Australian Energy Regulator
C Map of AER’s Post Tax Revenue model

Input
● Opening RAB ● Forecast Capex ● Forecast Opex ● Cost of capital ● Price revenue constraint ● Energy delivered forecast ● Base year prices per tariff component ● Forecast sales quantities
Roll Forward Model (RFM)
X factor
● Building block components ● Goal seek P_0 (WAPC) ● Goal seek P_0 (revenue cap) ● Goal seek P_0 (revenue yield)
Analysis
● Annual revenue requirement ● Cash flow analysis Cash flow to equity Cash flow to debt Cash flow to asset Return on equity ● Regulatory control period analysis
WACC
● Risk free rate ● Inflation rate ● Debt margin ● Cost of debt ● Market risk premium ● Tax rate ● Proportion of equity funding ● Proportion of debt funding ● Equity beta ● Nominal vanilla WACC ● Real vanilla WACC
● Real Capex ● Nominal Capex ● Real asset values ● Real straight line depreciation ● Nominal asset values ● Nominal tax values ● Tax depreciation
Assets
● Forecast sales quantities ● Forecast prices ● Forecast revenues
Forecast revenues

24 IPART Comparison of financial models – IPART and Australian Energy Regulator
D Map of IPART’s metropolitan water model

Other Calculations
Financial Report Analysis
Book Assets
Financial Statements ● Profit and loss ● Balance sheet ● Cash flow
Ratios NSW treasury financial ratios
Inputs Import
Cost Assumptions● Opex ● Capex ● Cash capital contributions ● Asset disposals ● Working capital
Pricing Assumptions ● Customer profile ● CSO rebates and reimbursements
Scenario(Key Decisions)
RAB Roll Forward
Regulatory Assets (Forecast RAB Roll Forward)
● Calculation of return on assets ● Calculation of RAB and depreciation
● Calculation of regulatory asset lives
RAB (Historical RAB Roll Forward)
● Regulatory asset lives ● Calculation of rolled forward RAB ● Calculation of depreciation
Costs and Revenues
Costs ● Opex
● Capex ● Cash capital contributions
● Asset disposals
Revenues ● Revenue calculation options
− Building Block
− Tariffs entered by user ● Return on assets and working capital
Pricing
Tariffs ● Customer profile ● Calculation of various tariffs
Bills