A presentation to IPART...NSW electricity generation (announced, Nov 2011) $3.3-$6.5 billion Port...
17
10 August 2012 Brendan Lyon Chief Executive Funding infrastructure projects A presentation to IPART Regulation & Reform: IPART after 20 years
Transcript of A presentation to IPART...NSW electricity generation (announced, Nov 2011) $3.3-$6.5 billion Port...

10 August 2012Brendan Lyon
Chief Executive
Funding infrastructure projects
A presentation to IPART
Regulation & Reform: IPART after 20 years

About IPA
• Peak industry body (since December 2005)
• Policy reform and priority project focus
• 150+ members (both public & private)
• National advocacy and research
Further information: www.infrastructure.org.au

A broad sector overview

Rapid population growth
Source: IPA/IBIS World (Meeting the 2050 Freight Challenge)
Population Projections to 2050 – Medium Growth

Investment Task
RBS - $455 billion
ANZ - $600 billion
IPA study - $700 billion
Citigroup - $770 billion
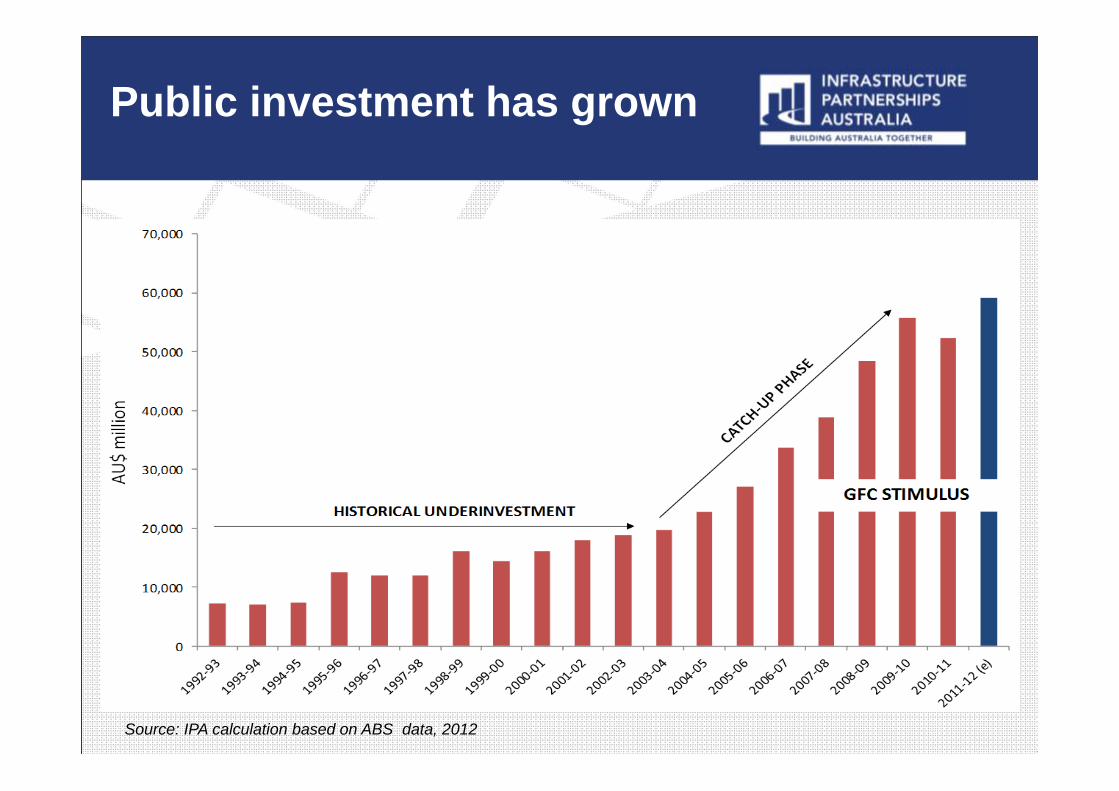
Public investment has grown
Source: IPA calculation based on ABS data, 2012

But it’s not sustainable…
Source: Standard & Poors 2009

There is limited capacity
Source: IPA analysis
Balance Sheet Capacity ‐ Standard & Poors’ AAA ($ Millions)

Generational opportunities –electricity/ports/water
Positive steps - including NSW asset utilisation taskforce
Demonstrated success –VIC, SA and recently NSW
Brownfield Opportunities

Recent privatisations Price
QR National (2010) (QLD) $4.6 billion
Queensland Motorways (transferred to QIC – 2010) (QLD)
$3 billion
Sydney desalination plant (NSW) $2.3 billion
Port of Brisbane (2010) (QLD) $2.3 billion
Abbot Point (2010) (QLD) $1.8 billion
Forestry Plantations Qld (QLD) $603 million
Privatisation to date….

Announced & Expected privatisations Estimated Price
NSW electricity generation (announced, Nov 2011) $3.3-$6.5 billion
Port Botany (NSW) $2-3 billon
South Australian Forests (SA) $600 million (In market)
Aurora Energy Retail (announced May 2012) $270-$326 million
Port Kembla (NSW) (announced 2012-13 Budget) $400m-500m
Tolled road corridors (NSW) Unknown
Port of Newcastle (NSW) Unknown
WA Forests Unknown
Forests NSW Unknown
And a substantial pipeline

Publicly-owned electricity assets
Estimatedsales value
Investment task
% of total state capital spend
NSW transmission & distribution
$29 – 34 billion
$15 billion over four years
24 per cent
QLD retail, generation & transmission & distribution
$41 – 47 billion
$8.3 billion over three years
22 per cent
TAS generation & transmission & distribution
$6.3 – 7.6 billion
$535 million over five years
n/a
Electricity in focus

Allocative efficiency
Electricity network capitalised expenditure 2001 to 2014($ per connection)
Source: EUAA, 2011

Balance sheet reform
Average annual revenue & operating expense growth (across all levels of government) (per cent)
Source: IPA analysis based on ABS data
5.6
4
6.6 6.8
0
1
2
3
4
5
6
7
8
2001-02 to 2010-11 2005-06 to 2010-11Average annual revenue growth (10 years) Average operating expense growth (5 years)

Positive signs
6.1
8
5.6
10.4
6.9
3.72.9
2
4.5
-0.7-2
0
2
4
6
8
10
12
NSW VIC QLD WA SA
2007-08 - 2011-12 2012-13 - 2015-16
Average annual operating expense growth –four years to 2011‐12 & four years to 2015‐16
Source: IPA analysis based on state budget papers
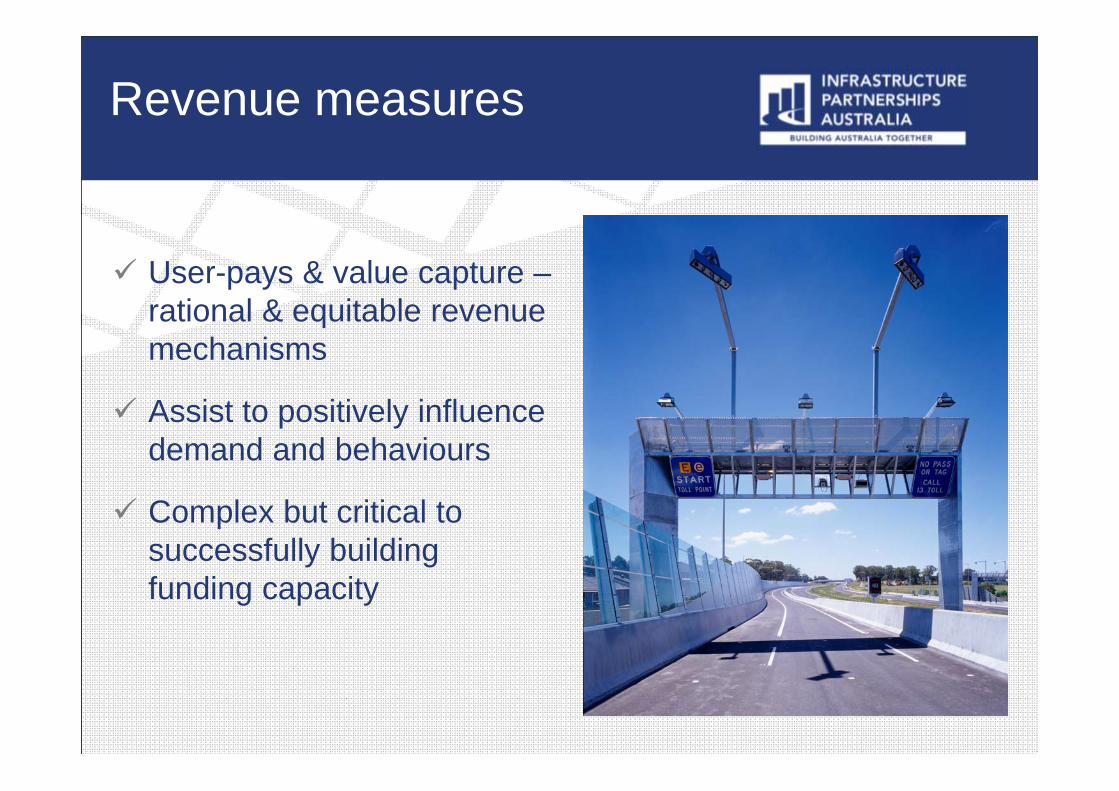
Revenue measures
User-pays & value capture –rational & equitable revenue mechanisms
Assist to positively influence demand and behaviours
Complex but critical to successfully building funding capacity

Closing remarks