Comparison of dual-Doppler lidar measurements of wind with ... · PDF fileComparison of...
16
Comparison of dual-Doppler lidar measurements of wind with helicopter measurements Hironori Iwai 1 , Shoken Ishii 1 , Nobumitsu Tsunematsu 1 , Kohei Mizutani 1 , Yasuhiro Murayama 1 , Toshikazu Itabe 1 , Izumi Yamada 2 , Naoki Matayoshi 3 , Dai Matsushima 4 , Weiming Sha 5 , Takeshi Yamazaki 5 , Toshiki Iwasaki 5 1 National Institute of Information and Communications Technology (NICT) 2 Electronic Navigation Research Institute (ENRI) 3 Japan Aerospace Exploration Agency (JAXA) 4 Chiba Institute of Technology 5 Tohoku University Acknowledgments This research was funded by the Japan Ministry of Education, Culture, Sports, Science and Technology (PI: Prof. T. Iwasaki, 19204046). The authors are grateful to the staff of the Sendai Aviation Weather Station for providing the data from the surface meteorological sensors.
Transcript of Comparison of dual-Doppler lidar measurements of wind with ... · PDF fileComparison of...

Comparison of dual-Doppler lidar measurements of wind
with helicopter measurementsHironori Iwai1, Shoken Ishii1, Nobumitsu Tsunematsu1, Kohei Mizutani1, Yasuhiro Murayama1, Toshikazu Itabe1, Izumi Yamada2, Naoki Matayoshi3, Dai Matsushima4, Weiming Sha5, Takeshi Yamazaki5, Toshiki Iwasaki5
1National Institute of Information and Communications Technology (NICT)2Electronic Navigation Research Institute (ENRI)3Japan Aerospace Exploration Agency (JAXA)4Chiba Institute of Technology 5Tohoku University
AcknowledgmentsThis research was funded by the Japan Ministry of Education, Culture, Sports, Science and Technology (PI: Prof. T. Iwasaki, 19204046). The authors are grateful to the staff of the Sendai Aviation Weather Station for providing the data from the surface meteorological sensors.
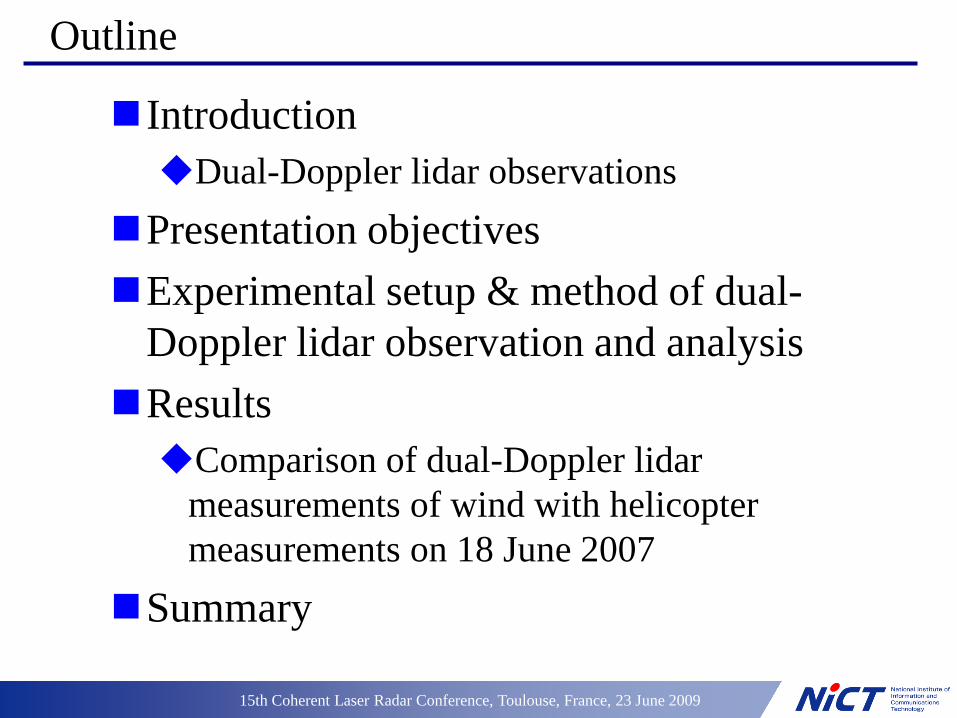
Outline
IntroductionDual-Doppler lidar observations
Presentation objectivesExperimental setup & method of dual-
Doppler lidar observation and analysisResultsComparison of dual-Doppler lidar
measurements of wind with helicopter measurements on 18 June 2007
Summary
15th Coherent Laser Radar Conference, Toulouse, France, 23 June 2009

Radiosonde
Wind profiler
Introduction : Dual-Doppler lidar observationsDrechsel et al. (2009) Calhoun et al. (2006)
They compared the extracted vertical wind profiles retrieved from the dual lidar measurements to vertical wind profiles of other instruments.
• 3D wind fields retrieved from multiple PPI scans of two Doppler lidars by Multiple Doppler Synthesis and Continuity Adjustment Technique (MUSCAT)
• Comparison of MUSCAT wind fields with radiosonde/wind profiler
• “virtual towers” : vertical profiles of horizontal wind retrieved from intersecting RHI scans of two Doppler lidars
• Comparison of virtual tower with radar/sodar profiler

Presentation objectives
15th Coherent Laser Radar Conference, Toulouse, France, 23 June 2009
•To show the experimental setup during Sendai Airport experiment campaign and method of dual-Doppler lidar observation and analysis method.
•To present results of comparison of extracted horizontal wind profiles retrieved from the dual-Doppler analyses with horizontal wind profilesof helicopter measurements.
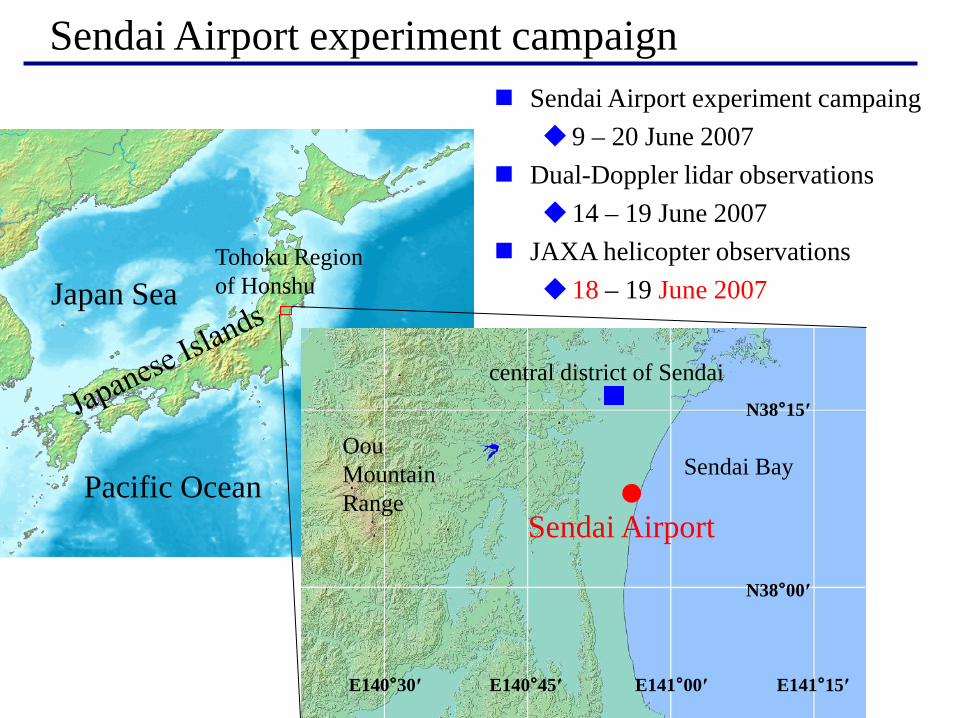
N38°15′
central district of Sendai
Sendai Airport
OouMountainRange
Tohoku Region of Honshu
Sendai BayPacific Ocean
N38°00′
E140°30′ E140°45′ E141°00′ E141°15′
Sendai Airport experiment campaign Sendai Airport experiment campaing
9 – 20 June 2007 Dual-Doppler lidar observations
14 – 19 June 2007 JAXA helicopter observations
18 – 19 June 2007Japan Sea

Installation site
Pacific Ocean
terminal building
Wind speed and direction sensorsTemperature and Dew point sensor
NICT lidar & Tohoku Univ.
Sensors
ENRI lidarTemperature and Dew point sensor
RWY09
RWY27
Surface meteorological sensors of Sendai Aviation Weather Station
MID
W
N
S
Eindustrial complex
cultivated land
cultivated land
15th Coherent Laser Radar Conference, Toulouse, France, 23 June 2009

Transceiver unit : Mitsubishi Electric Co.Scanner control & data processing system :
Mitsubishi Electric Co.wavelength 1.54 μmpulse repetition frequency 4000 Hzaccumulated shot number 500range resolution 29.9 mminimum range 80.0 mmaximum range 2472.0 mscan rate 6.0 deg/sec
Transceiver unit : Coherent Technologies Inc.Scanner control & data processing system : NICT
wavelength 2.012 μmpulse repetition frequency 100 Hzaccumulated shot number 50range resolution 90 mminimum range 315 mmaximum range ~10 kmscan rate 2.0 deg/sec
NICT lidar ENRI lidar
NICT lidar & ENRI lidar
Rooftop of ENRI Iwanuma Branch
To observe local winds at various sites To observe wake vortices of airplanes
Transportable

JAXA’s research helicopter (MuPAL-ε)
Normal mode Research mode
Main Rotor Diameter
12.2 m
Maximum Takeoff Weight
4,500 kg
Payload 1,464 kg 1,226 kg
Pilot + Crew 2+8 2+3
Maximum speed 140 ktHygrometer
Static pressure holes
Measurement component
Sensor Accuracy Range Resolution Sampling frequency
3-axis air speed Sonic Co.DA-600 /TR-99HC (probe)
0.1 m/s 0 – 60 m/s 0.005 m/s 40 Hz
Temperature -10 – 40 °C 0.025 °C
3-axis ground speed
Tamagawa Seiki Co.TA7426
0.1 m/s ±128.61 m/s 0.01 m/s 50 Hz
Dewpoint EdgeTechModel 137
±1 °C -50 – 90 °C 0.05 °C 50 Hz
Pressure Rosemount542CB
±2hPa -300 – 6096 m
0.16 hPa 50 Hz
Mitsubishi Heavy Industries MH2000A
Ultrasonic anemometer / thermometer (installed at the tip of the nose boom)

Surface meteorological data on 18 June 2007
Solar radiation
Wind direction
Wind speed
Temperature/ dew point
Dual-Doppler lidar and helicopter observations were conducted from 8:00 to 9:46 JST
southeasterly sea-breeze flow

PacificOcean
-1-2 0 1 2 3 4 5
0
1
2
-1
-2
-3
-4
ENRI
NICT
Dis
tanc
e fro
m N
ICT
lidar
(km
)
Distance from NICT lidar (km)
U,X
V,Y
N
140.88 140.90 140.92 140.94Longitude (°E)
38.12
38.14
38.16
Latit
ude
(°N
)
Dual-Doppler lidar observation and analysis
NICT lidar : Sector PPI scanelevation : 0.65, 1.0, 1.4, 1.8, 2.2,
2.6, 3.0, 3.5, 4.2, 5.0 degazimuth : 60~180deg,
resolution ~1deg~10 minutes / cycle
ENRI lidar : CAPPI scanelevation : 0.5, 1.0, 1.5, 2.0, 2.5,
3.0, 3.5, 4.0, 4.5, 5.0 degazimuth : 118~478deg,
resolution ~0.4deg~10 minutes / cycle
The x direction and u component of wind are parallel to the sea-breeze flow, and the y direction and v component are normal to the sea-breeze flow. The radial velocity components for each lidar are interpolated to Cartesian grid point using the Cressman weighting function.
Dual-Doppler analysis domain & grid spacingx : 0 - 3.9 km, ∆x = 100my : -3.3 - 1.7 km, ∆y = 100mz : 0 - 200m, ∆z = 25m
Scan strategies

SDBO JJJJJ +++=
( )obsrr
kjiOO VVJ −= ∑
,,21 λ
2
,,21 DJ
kjiDD ∑= λ
( ) ( ) ( )
∇+∇+∇= ∑ ∑∑
kji kjiws
kjivsusS wλvλuλJ
,, ,,
22
,,
2222
21
zw
yv
xuD
∂∂
+∂∂
+∂∂
=ρρρ
This 3D variational method introduced by Gao et al. (1999) is a procedure that minimizes a cost function J=J(u,v,w), as follows :
Difference between the analyzed radial velocity (Vr) and the observed radial velocity (Vr
obs)
Weak anelastic mass constraint on the analyzed wind field
Smoothness constraint
( ) ( ) ( )
−+−+−= ∑∑∑ 2
,,
2
,,
2
,,21
bkji
wbbkji
vbbkji
ubB wwλvvλuuλJ
3D variational method (3DVAR)
Background term. (ub, vb, wb) is the background velocity to be derived from ENRI lidar data by a modefied VAD analysis (Banta et al. 2002).

8:00 8:128:10 8:22 8:24
8:36
8:34
8:46
8:04:37-8:05:52 8:11:02-8:12:17 8:31:09-8:32:24
8:36:43-8:37:58
150m 100m 100m
25m8:43:32-8:44:47
50m
8:48 9:008:58 9:10
8:50:24-8:51:39 8:57:15-8:58:30100m150m
9:12 9:249:22 9:34 9:36 9:46
9:15:10-9:16:25 9:27:57-9:29:12 9:34:55-9:36:1050m 150m 100m
9:43:50-9:45:0550m
Observation schedule
Dual-Doppler lidar JAXA helicopterstart end
start - endheight
Total 11 flight passes and about 500 samples

Interpolation of JAXA helicopter data to Cartesian grid point
The horizontal resolution of the JAXA heliborne sensor is about 1.25 m and differs from dual-Doppler analysis.
To eliminate the difference in the horizontal resolution, the wind data measured by the JAXA heliborne sensor are averaged on the Cartesian grid using the radii of influence for the Cressman weighting function applied in dual-Doppler analysis.
3D wind fileds Flight pass @ 150 m AGL
w(m/s)
u(m/s)
v(m/s)
Vd(deg)

Comparison of 3DVAR wind fields with helicopterDual-Doppler lidar:8:36 - 8:46JAXA helicopter:8:36:43 - 8:37:58@ 25 m AGL
Dual-Doppler lidar:8:36 - 8:46JAXA helicopter:8:43:32 - 8:44:47@ 50 m AGL
Dual-Doppler lidar:8:24 - 8:34JAXA helicopter:8:31:09 - 8:32:24@ 100 m AGL
Dual-Doppler lidar:9:36 - 9:46JAXA helicopter:9:43:50 - 9:45:05@ 50 m AGL
·The individual differences of horizontal wind speed and wind direction on each grid points are larger.→ Different temporal and spatial resolution of the measurement systems. ·There is a tendency that the differences of horizontal wind speed and wind direction on each individual grid points are larger in the area where the intersection angle of beam of two Doppler lidars is small or large.

u (m/s) v (m/s) Horizontal wind speed
(m/s)
Horizontal wind direction
(deg)standard deviation 0.65 0.77 0.75 16.0
bias 0.38 0.41 0.11 10.1mean 0.61 0.67 0.55 13.8
Statistical errors
Standard deviation, bias (average over differences), and mean (average over absolute values of differences) in wind components (u and v), horizontal wind speed, and horizontal wind direction, between dual-Doppler lidar and JAXA helicopter.
σNICT+σENRI
σu+σv= cosec2β
If σu=σv and β=30 or 150 degrees,σu=σv=0.76
Davies-Jones (1979) : The relationship between the intersection angle β of beams of two Doppler radars and error variance of horizontal wind speed (σu, σv).
σNICT= 0.2m/s , σENRI= 0.5m/s

Summary In this paper we described details of the retrieval method of 3D
wind filed from dual-Doppler lidar data. The horizontal wind profiles retrieved from the dual-Doppler
analyses were compared with those measured by the JAXA heliborne sensor.
The differences of horizontal wind speed and wind direction of less than 0.11 m/s and 10.1°, on average, with standard deviations not exceeding 0.75 m/s and 16°, respectively.
Future works The next step is to compare the vertical wind component retrieved from the dual-
Doppler analyses to those measured by the JAXA heliborne sensor. Since the order of magnitude of the vertical wind component is small and sensitive to the helicopter movement during the flight, it is necessary to carefully calibrate the vertical wind component measured by the JAXA heliborne sensor.
The comparison of 3D wind fields retrieved from dual-Doppler analysis to those measured by the JAXA heliborne sensor on other days should be performed.
15th Coherent Laser Radar Conference, Toulouse, France, 23 June 2009