Comparison of Different Otolith Shape Descriptors and Morphometrics00
13
ORIGINAL ARTICLE Comparison of different otolith shape descriptors and morphometrics for the identification of closely related species of Lutjanus spp. from the Persian Gulf ZAHRA SADIGHZADEH 1 *, VICTOR M. TUSET 2 , TOORAJ VALINASSAB 3 , MOHAMMAD R. DADPOUR 4 & ANTONI LOMBARTE 2 1 Marine Biology Department, Faculty of Marine Science & Technology, Islamic Azad University, Tehran, Iran; 2 Institut de Cie `ncies del Mar (CSIC), Barcelona, Catalonia, Spain; 3 Department of Resource Management, Iranian Fisheries Research Organization (IFRO), Tehran, Iran; and 4 Department of Horticultural Sciences, Faculty of Agriculture, University of Tabriz, Tabriz, Iran Abstract The anatomical and morphometric (shape indices, contour descriptors and otolith weight) characterizations of sagittal otoliths were investigated in 11 species of Lutjanus spp. inhabiting the Persian Gulf. This is the first study that compares the efficiency of three different image analysis techniques for discriminating species based on the shape of the outer otolith contour, including elliptical Fourier descriptors (EFD), fast Fourier transform (FFT) and wavelet transform (WT). Sagittal otoliths of snappers are morphologically similar with some small specific variations. The use of otolith contour based on wavelets (WT) provided the best results in comparison with the two other methods based on Fourier descriptors, but only the combination of the all three methods (EFD, FFT and WT) was useful to obtain a robust classification of species. The species prediction improved when otolith weight was included. In relation to the shape indices, only the aspect ratio provided a clear grouping of species. Key words: Otolith, morphology, Fourier, wavelets, Lutjanidae, Persian Gulf Introduction The Persian Gulf is a semi-enclosed water body connected to the Oman Sea through the strait of Hormuz, which is 56 km wide at its narrowest point and has an average depth of 35 m (Reynolds 1993). The Oman Sea has an average depth of 700 m and is connected to the Indian Ocean through the Arabian Sea (Valinassab et al. 2006). Both are subtropical water masses located chiefly between 24308N and 49628E. The dominant large-scale current is a counter-clockwise movement, whereby less saline and less dense water enters at the strait of Hormuz at the surface and more saline and denser water leaves the area at the bottom (Hunter 1983; Reynolds 1993). After oil, fisheries represent the second most important natural resource, and the most important renewable natural resource in the region (Carpenter et al. 1997). A total of 12 species of snappers have been identified along the Iranian coast of the Persian Gulf and the Oman Sea, including Lutjanus johnii (Bloch, 1792) and Lutjanus malabaricus (Bloch & Schneider, 1801), the most abundant species (Vali- nassab et al. 2006, 2010). They play an important role in the ecology system of the reefs, mangrove swamps and seagrass beds (Aiken 1993; Appeldoorn & Meyers 1993; Baisre 1993; Claro et al. 2001). However, the biological and ecological knowledge of snappers of the area is scarce and is mainly focused on Lutjanus johnii (Valinassab 2006, 2010). Sharks and other large fishes are probably their main predators, but due to the lack of adequate morphological knowledge of their sagittal otoliths it was not possible to identify them in the stomach content where they represent the main remnants of *Correspondence: Zahra Sadighzadeh, Marine Biology Department, Faculty of Marine Science & Technology, Islamic Azad University, Tehran, 1477893855, Iran. E-mail: [email protected] Published in collaboration with the University of Bergen and the Institute of Marine Research, Norway, and the Marine Biological Laboratory, University of Copenhagen, Denmark Marine Biology Research, 2012; 8: 802814 (Accepted 5 April 2012; Published online 14 August 2012; Printed 24 August 2012) ISSN 1745-1000 print/ISSN 1745-1019 online # 2012 Taylor & Francis http://dx.doi.org/10.1080/17451000.2012.692163 Downloaded by [Centre Mediterrani D'investig] at 00:04 21 August 2012
-
Upload
patricia-moran -
Category
Documents
-
view
19 -
download
1
description
asas
Transcript of Comparison of Different Otolith Shape Descriptors and Morphometrics00
ORIGINAL ARTICLE
Comparison of different otolith shape descriptors and morphometricsfor the identification of closely related species of Lutjanus spp. from thePersian Gulf
ZAHRA SADIGHZADEH1*, VICTOR M. TUSET2, TOORAJ VALINASSAB3,
MOHAMMAD R. DADPOUR4 & ANTONI LOMBARTE2
1Marine Biology Department, Faculty of Marine Science & Technology, Islamic Azad University, Tehran, Iran; 2Institut de
Ciencies del Mar (CSIC), Barcelona, Catalonia, Spain; 3Department of Resource Management, Iranian Fisheries Research
Organization (IFRO), Tehran, Iran; and 4Department of Horticultural Sciences, Faculty of Agriculture, University of Tabriz,
Tabriz, Iran
AbstractThe anatomical and morphometric (shape indices, contour descriptors and otolith weight) characterizations of sagittalotoliths were investigated in 11 species of Lutjanus spp. inhabiting the Persian Gulf. This is the first study that compares theefficiency of three different image analysis techniques for discriminating species based on the shape of the outer otolithcontour, including elliptical Fourier descriptors (EFD), fast Fourier transform (FFT) and wavelet transform (WT). Sagittalotoliths of snappers are morphologically similar with some small specific variations. The use of otolith contour based onwavelets (WT) provided the best results in comparison with the two other methods based on Fourier descriptors, but onlythe combination of the all three methods (EFD, FFT and WT) was useful to obtain a robust classification of species. Thespecies prediction improved when otolith weight was included. In relation to the shape indices, only the aspect ratioprovided a clear grouping of species.
Key words: Otolith, morphology, Fourier, wavelets, Lutjanidae, Persian Gulf
Introduction
The Persian Gulf is a semi-enclosed water body
connected to the Oman Sea through the strait of
Hormuz, which is 56 km wide at its narrowest point
and has an average depth of 35 m (Reynolds 1993).
The Oman Sea has an average depth of 700 m and is
connected to the Indian Ocean through the Arabian
Sea (Valinassab et al. 2006). Both are subtropical
water masses located chiefly between 24�308N and
49�628E. The dominant large-scale current is a
counter-clockwise movement, whereby less saline
and less dense water enters at the strait of Hormuz
at the surface and more saline and denser water leaves
the area at the bottom (Hunter 1983; Reynolds
1993). After oil, fisheries represent the second most
important natural resource, and the most important
renewable natural resource in the region (Carpenter
et al. 1997). A total of 12 species of snappers have
been identified along the Iranian coast of the Persian
Gulf and the Oman Sea, including Lutjanus johnii
(Bloch, 1792) and Lutjanus malabaricus (Bloch &
Schneider, 1801), the most abundant species (Vali-
nassab et al. 2006, 2010). They play an important role
in the ecology system of the reefs, mangrove swamps
and seagrass beds (Aiken 1993; Appeldoorn &
Meyers 1993; Baisre 1993; Claro et al. 2001).
However, the biological and ecological knowledge of
snappers of the area is scarce and is mainly focused on
Lutjanus johnii (Valinassab 2006, 2010).
Sharks and other large fishes are probably their
main predators, but due to the lack of adequate
morphological knowledge of their sagittal otoliths it
was not possible to identify them in the stomach
content where they represent the main remnants of
*Correspondence: Zahra Sadighzadeh, Marine Biology Department, Faculty of Marine Science & Technology, Islamic Azad University,
Tehran, 1477893855, Iran. E-mail: [email protected]
Published in collaboration with the University of Bergen and the Institute of Marine Research, Norway, and the Marine Biological Laboratory,
University of Copenhagen, Denmark
Marine Biology Research, 2012; 8: 802�814
(Accepted 5 April 2012; Published online 14 August 2012; Printed 24 August 2012)
ISSN 1745-1000 print/ISSN 1745-1019 online # 2012 Taylor & Francis
http://dx.doi.org/10.1080/17451000.2012.692163
Dow
nloa
ded
by [
Cen
tre
Med
iterr
ani D
'inve
stig
] at
00:
04 2
1 A
ugus
t 201
2
the fish prey (Harkonen 1986; Smale et al. 1995;
Volpedo & Echeverrıa 2000; Assis 2003; Campana
2004; Tuset et al. 2008).
The otolith is an acellular concretion compound,
mainly of calcium carbonate, crystallized in aragonite
and other inorganic salts, which develop over a
protein matrix (Carlstrom 1963; Blacker 1969; De-
gens et al. 1969; Cermeno et al. 2006). They are
located in the inner ear of vertebrates in close
association with the sensitive maculae of the labyr-
inthine compartments (Cordier & Dalcq 1954;
Weichert & Prech 1981; Hildebrand 1988; Jobling
1995). The otolith shape has a high degree of inter-
specific variation, which can be used to identify the
species (Nolf 1985; Harkonen 1986; Smale et al.
1995; Volpedo & Echeverrıa 2000; Assis 2003;
Campana 2004; Tuset et al. 2008). Several methods
such as Fourier analysis, wavelets and curvature scale
space analysis have been used for automatic identifi-
cation of species (Parisi-Baradad et al. 2005; Piera
et al. 2005; Martı-Puig et al. 2010; Capoccioni et al.
2011; Tuset et al. in press). Our study intends to
represent a useful method to recognize snapper species
in the stomach content of their predators using
otoliths. Therefore, the aims of this article are (i) to
characterize morphologically and morphometrically
the sagittal otoliths of snappers of Lutjanus spp. of the
Persian Gulf and (ii) to test and compare three
different methods (elliptic fourier descriptors, fast
Fourier transform and wavelet transform) to discrimi-
nate species using otolith contour and otolith weight.
Materials and methods
Sampling
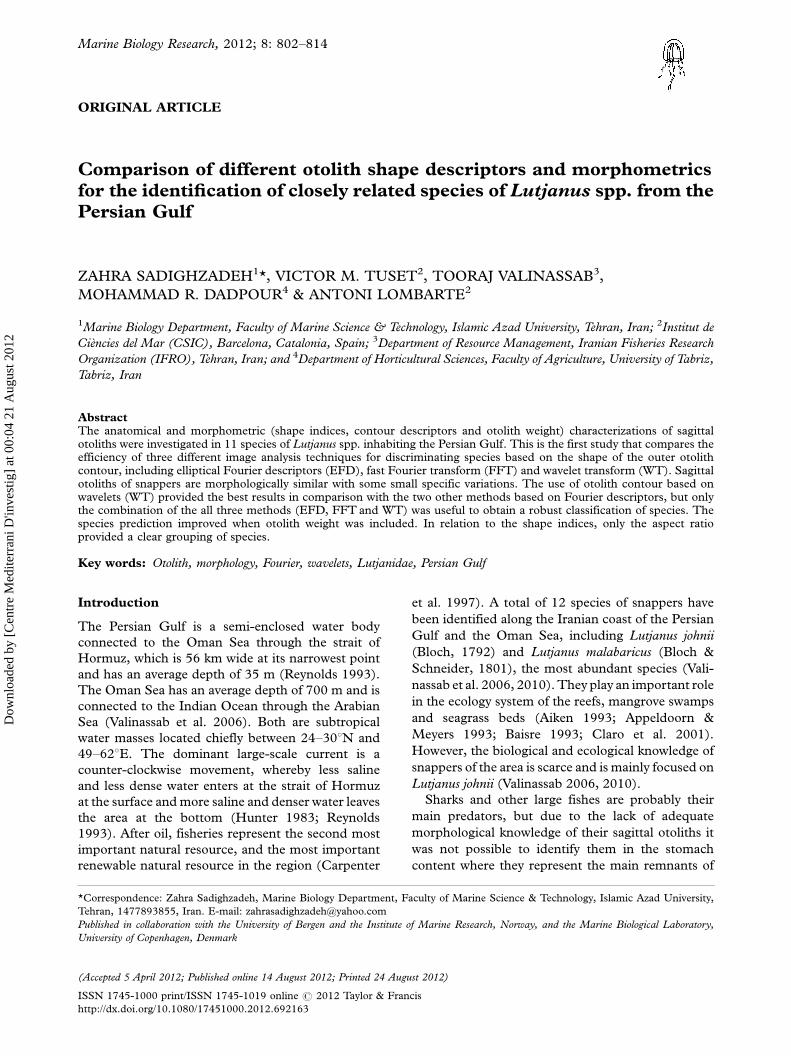
Eleven species of snappers of the genus Lutjanus were
collected from the Strait of Hormuz (Figure 1)
with the help of local fisheries. These included
Lutjanus argentimaculatus (Forsskal, 1775) (n�13),
Lutjanus ehrenbergii (Peters, 1869) (n�61), Lutjanus
Figure 1. Map of the Persian Gulf (NE Indian Ocean) showing the area from where Lutjanus spp. were collected.
Identification of snappers using otoliths 803
Dow
nloa
ded
by [
Cen
tre
Med
iterr
ani D
'inve
stig
] at
00:
04 2
1 A
ugus
t 201
2
erythropterus Bloch, 1790 (n�9), Lutjanus
fulviflamma (Forsskal, 1775) (n�11), Lutjanus johnii
(n�93), Lutjanus lemniscatus (Valenciennes, 1828)
(n�23), Lutjanus lutjanus Bloch, 1790 (n�23),
Lutjanus malabaricus (n�47), Lutjanus rivulatus
(Cuvier, 1828) (n�12) and Lutjanus russellii
(Bleeker, 1849) (n �32). Total fish length (TL in
cm) was measured for all individuals. Their otoliths
were removed, washed, dried and stored in plastic
vials. They were also weighed (OW) to the nearest 0.01
g. Due to lack of sufficient specimens of Lutjanus
bengalensis (Bloch, 1790), this species was omitted
from the mathematical analysis.
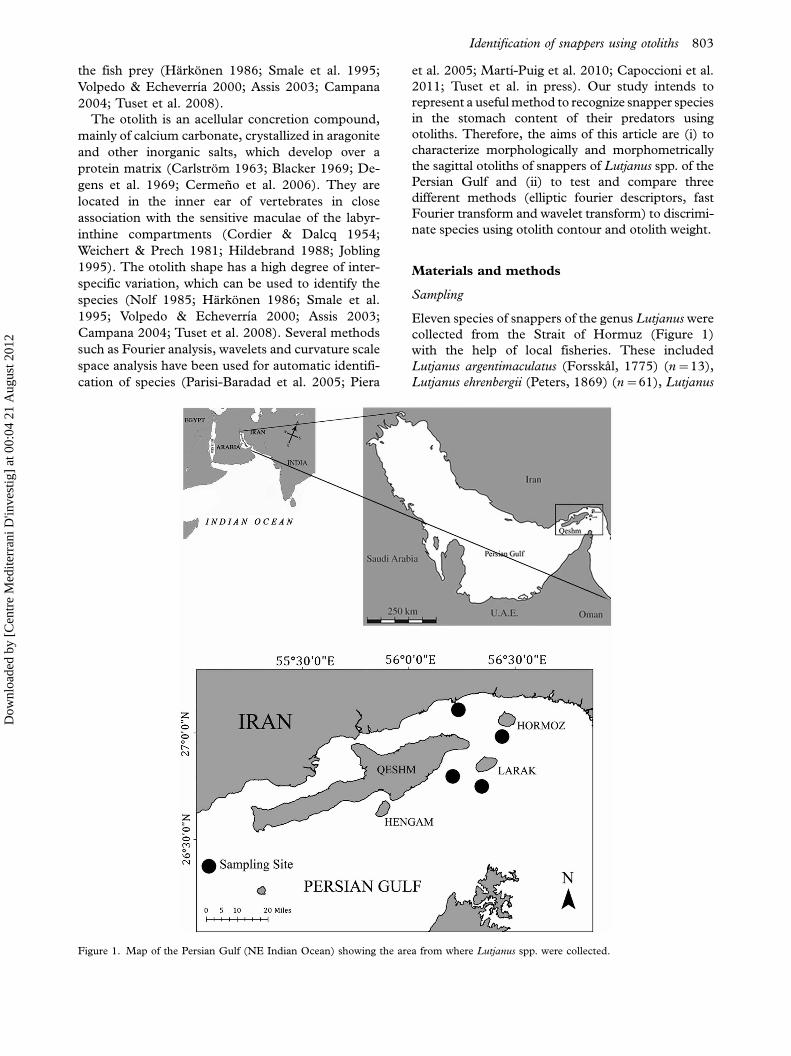
Morphometry and morphology of otolith sagittae
Otoliths from the left side of the fish were orientated
with the inner side (sulcus acusticus) upwards and
rostrum to the right for digitizing using a microscope
attached to an image analyser with a magnification
depending on the size of the otolith. All images were
captured with an embedded 1-mm scale which was
used to avoid magnification effects in the morpho-
metric calculations. Otolith length (OL in mm),
height (OH in mm), area (OA in mm2) and perimeter
(OP in mm) (Figure 2) were measured using Image-
Pro Plus version 4.1.0 software (Media Cybernetics
Inc.). Shape indices were obtained by combining size
parameters (Russ 1990; Tuset et al. 2003): aspect
ratio (OH/OL), compactness (OP2/OA) and rectan-
gularity (OA/(OL*OH)), applying an ANOVA fol-
lowed by Student Newman�Keuls test for multiple
comparisons of means at a 5% significance level
(PB0.05). Descriptive statistics of fish and otolith
variables by species are given in Table I. The otolith
descriptions follow Tuset et al. (2008).
Elliptical Fourier descriptors (EFD)
The otolith outline was extracted by using the
Shape program (Iwata & Ukai 2002). The software
generates 20 harmonics, using elliptical Fourier
descriptors (EFD), whose combinations allow
reconstructing of the otolith contour (Kuhl &
Giardina 1982; Tracey et al. 2006; Farias et al.
2009). Each harmonic was composed of four coeffi-
cients and therefore 80 coefficients were obtained for
each individual. The Shape package automatically
normalizes the contour in relation to the first
harmonic and consequently they become invariant
to size, rotation and starting point, which causes the
degeneration of the three first coefficients to fixed
values: a1�1, b1�c1�0 (Kuhl & Giardina 1982;
Iwata & Ukai 2002). For this reason, each otolith
contour was drawn by only 77 coefficients. The first
nine harmonics (FDs 4�12) were used to rebuild the
outline attaining more than 90% of the shape
variation. The minimum number of harmonics is
assembled by plotting the percentage of accumulated
variance explained by the nth harmonic vs. the
harmonic number, n (Stransky et al. 2008).
Fast Fourier transform (FFT)
The otolith silhouette was traced in a counter
clockwise direction and digitized into 512 x�y
equidistant coordinates by using the tip of the otolith
rostrum as a common starting point for the coordi-
nates (Age & Shape Software, Infaimon SL, Spain)
of the software Image Pro Plus. A fast Fourier
transform (FFT) was calculated as a Cartesian
FFT. The Cartesian FFT uses the x�y coordinates
as complex numbers (a� ib), where a is the real
component and ib the imaginary component, repre-
senting the amplitudes of the cosine and sine waves,
Figure 2. Mesial surface of sagittal otoliths of Lutjanus spp. illustrating features considered.
804 Z. Sagighzadeh et al.
Dow
nloa
ded
by [
Cen
tre
Med
iterr
ani D
'inve
stig
] at
00:
04 2
1 A
ugus
t 201
2
respectiv
ely(P
ieraet
al.
2005).
The
resulta
nt
512
set
of
com
plex
nu
mbers
or
descrip
tors
were
subse-
qu
ently
norm
alized
for
differen
cesin
oto
lithpositio
n
by
setting
the
0th
descrip
tor
to0,
an
dfo
rsize
an
d
rota
tion
of
the
oto
lithby
div
idin
gall
the
descrip
tors
with
the
firstd
escripto
r(S
mith
1992;
Berg
eniu
s
etal.
2005).
The
norm
alized
descrip
tors
(a?�ib?)
were
used
toca
lcula
teth
eabso
lute
valu
e(h
arm
on
ic)
of
each
descrip
tor
(Christo
pher
&W
aters
1974):
Horm
onic¼
ffiffiffiffiffia0n
p2þ
ib0
ðÞ
2n
The
nu
mber
of
Fou
rierd
escripto
rsreq
uired
was
determ
ined
when
accu
mu
lated
varia
nce
expla
ined
at
least
90%
.T
herefo
re,it
was
necessa
ryto
captu
reth
e
first133
descrip
tors.
Beca
use
the
Cartesia
nd
escrip-
tors
are
asy
mm
etrical
aro
un
dth
em
idd
lefreq
uen
cy,
both
end
softh
earra
yare
requ
iredin
the
recon
struc-
tion
.C
on
sequ
ently,
oto
lithou
tline
shape
was
recon
-
structed
by
usin
gth
efirst
two
an
dla
sttw
o
descrip
tors,
the
firstth
reean
dla
stth
reed
escripto
rs,
an
dso
on
un
tilth
efirst
an
dla
st133
descrip
tors
were
used
(Berg
eniu
set
al.
2005).
Wavelet
transform
(WT
)
The
WT
isbased
on
expan
din
gth
eco
nto
ur
into
a
fam
ilyof
fun
ction
sobta
ined
as
the
dila
tion
san
d
tran
slatio
ns
of
au
niq
ue
fun
ction
kn
ow
nas
am
oth
er
wav
elet(M
alla
t1991).
These
fun
ction
sd
escribe
both
insp
ace
an
dw
ave
nu
mber,
the
most
pro
min
ent
featu
resof
the
curv
e.T
he
sign
als
of
wav
eletshave
differen
tam
plitu
des,
hen
cesm
all
(low
)w
aven
um
-
bers
(frequ
encies)
are
asso
ciated
with
asm
ooth
ly
vary
ing
con
tou
r,w
hile
larg
ew
aven
um
bers
are
asso
-
ciated
with
varia
tion
on
asm
all
spatia
lsca
le(P
arisi-
Bara
dad
etal.
2005,
2010).
To
obta
inth
eoto
lith
con
tou
r,a
tota
lof
512
Cartesia
nco
ord
inates
on
each
of
the
orth
ogon
al
pro
jection
s,w
hich
isa
perp
end
icula
rim
age
of
an
object
(Sch
warzh
an
s
1980;N
olf
1985),
were
extra
ctedu
sing
Age
&S
hape
pro
gra
m(In
faim
on
SL
,S
pain
)so
ftware
Image
Pro
Plu
s.T
he
wav
eletsfo
ur,
five
an
dsix
were
selectedas
the
represen
tativ
esof
the
oto
lithco
nto
ur.
Sta
tistical
analy
ses
Norm
ality
of
varia
bles
an
dhom
ogen
eityof
varia
nces
for
each
EF
Dco
efficient,
FF
Tharm
on
icor
WT
poin
t,w
ereex
am
ined
by
usin
gK
olm
ogoro
v�S
mirn
ov’s
and
Leven
e’stests,
respectively.
Data
were
transfo
rmed
usin
g1/x
or
log
10 ,
when
the
variables
did
not
meet
the
assum
ptio
ns.
Inth
ecase
of
the
WT
,
the
num
ber
ofvariab
lesw
asso
hig
hth
atth
ose
who
did
not
meet
the
assum
ptio
ns
were
elimin
ated.A
nalysis
of
covarian
ce(A
NC
OV
A)
test(P
B0.0
5)
was
perfo
rmed
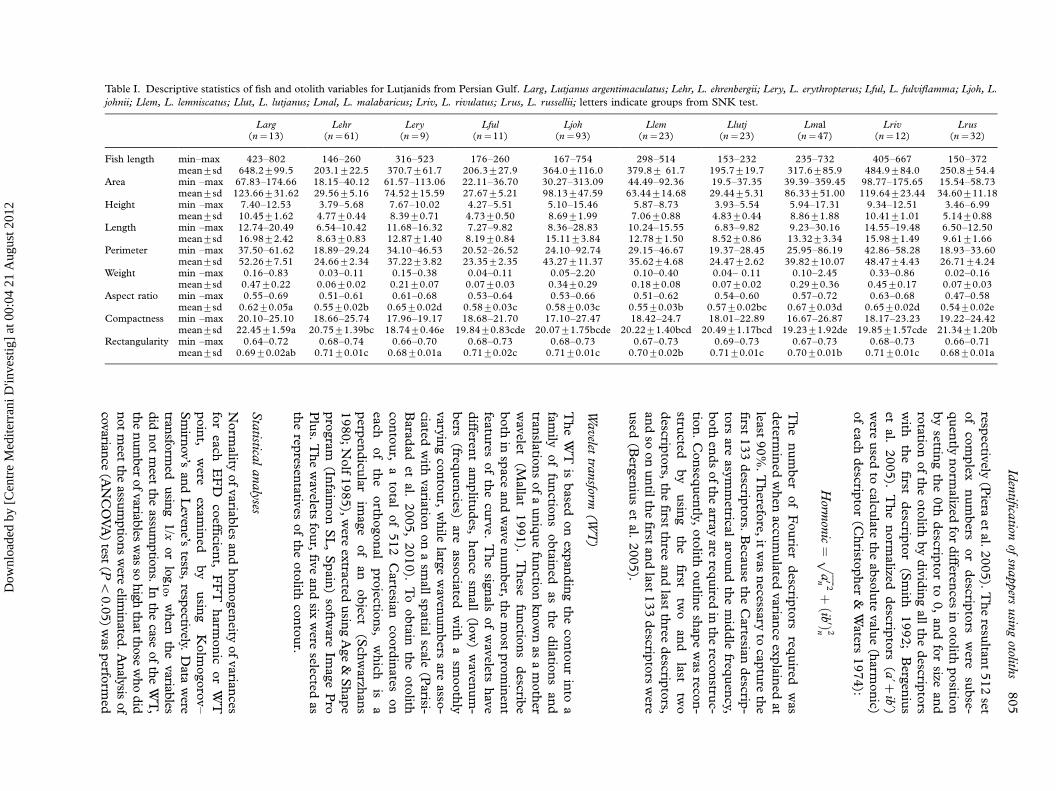
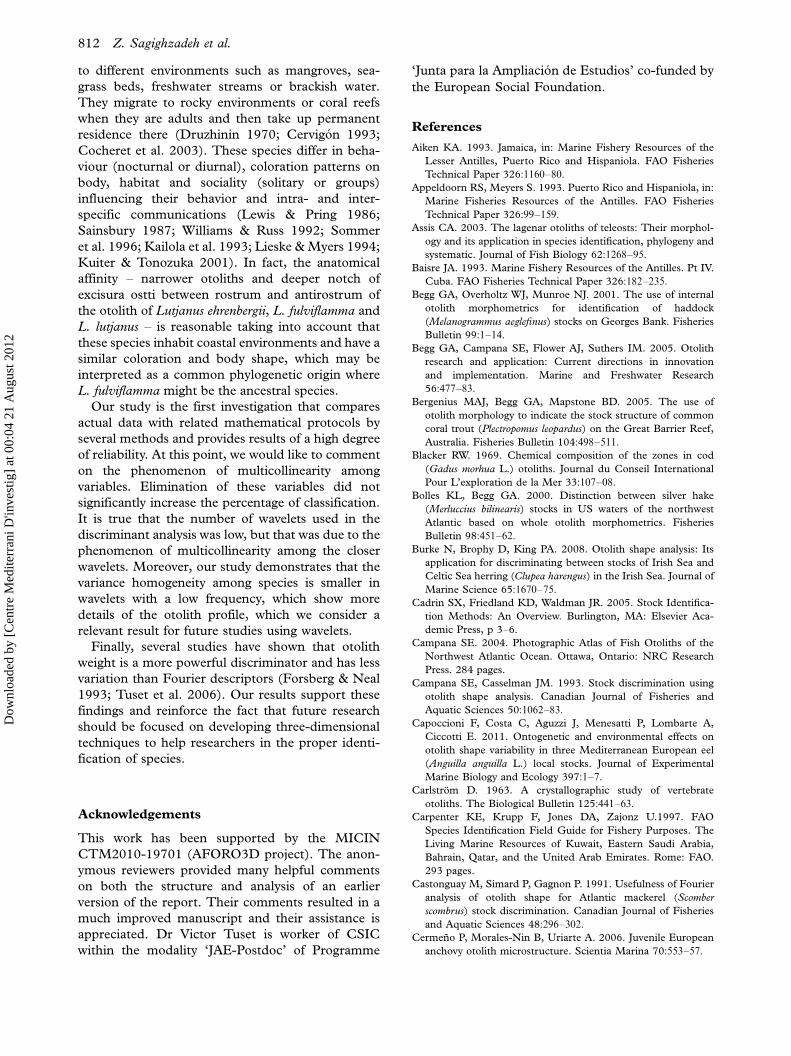
Table I. Descriptive statistics of fish and otolith variables for Lutjanids from Persian Gulf. Larg, Lutjanus argentimaculatus; Lehr, L. ehrenbergii; Lery, L. erythropterus; Lful, L. fulviflamma; Ljoh, L.
johnii; Llem, L. lemniscatus; Llut, L. lutjanus; Lmal, L. malabaricus; Lriv, L. rivulatus; Lrus, L. russellii; letters indicate groups from SNK test.
Larg Lehr Lery Lful Ljoh Llem Llutj Lmal Lriv Lrus(n�13) (n�61) (n�9) (n�11) (n�93) (n�23) (n�23) (n�47) (n�12) (n�32)
Fish length min�max 423�802 146�260 316�523 176�260 167�754 298�514 153�232 235�732 405�667 150�372mean9sd 648.2999.5 203.1922.5 370.7961.7 206.3927.9 364.09116.0 379.89 61.7 195.7919.7 317.6985.9 484.9984.0 250.8954.4
Area min �max 67.83�174.66 18.15�40.12 61.57�113.06 22.11�36.70 30.27�313.09 44.49�92.36 19.5�37.35 39.39�359.45 98.77�175.65 15.54�58.73mean9sd 123.66931.62 29.5695.16 74.52915.59 27.6795.21 98.13947.59 63.44914.68 29.4495.31 86.33951.00 119.64923.44 34.60911.18
Height min �max 7.40�12.53 3.79�5.68 7.67�10.02 4.27�5.51 5.10�15.46 5.87�8.73 3.93�5.54 5.94�17.31 9.34�12.51 3.46�6.99mean9sd 10.4591.62 4.7790.44 8.3990.71 4.7390.50 8.6991.99 7.0690.88 4.8390.44 8.8691.88 10.4191.01 5.1490.88
Length min �max 12.74�20.49 6.54�10.42 11.68�16.32 7.27�9.82 8.36�28.83 10.24�15.55 6.83�9.82 9.23�30.16 14.55�19.48 6.50�12.50mean9sd 16.9892.42 8.6390.83 12.8791.40 8.1990.84 15.1193.84 12.7891.50 8.5290.86 13.3293.34 15.9891.49 9.6191.66
Perimeter min �max 37.50�61.62 18.89�29.24 34.10�46.53 20.52�26.52 24.10�92.74 29.15�46.67 19.37�28.45 25.95�86.19 42.86�58.28 18.93�33.60mean9sd 52.2697.51 24.6692.34 37.2293.82 23.3592.35 43.27911.37 35.6294.68 24.4792.62 39.82910.07 48.4794.43 26.7194.24
Weight min �max 0.16�0.83 0.03�0.11 0.15�0.38 0.04�0.11 0.05�2.20 0.10�0.40 0.04� 0.11 0.10�2.45 0.33�0.86 0.02�0.16mean9sd 0.4790.22 0.0690.02 0.2190.07 0.0790.03 0.3490.29 0.1890.08 0.0790.02 0.2990.36 0.4590.17 0.0790.03
Aspect ratio min �max 0.55�0.69 0.51�0.61 0.61�0.68 0.53�0.64 0.53�0.66 0.51�0.62 0.54�0.60 0.57�0.72 0.63�0.68 0.47�0.58mean9sd 0.6290.05a 0.5590.02b 0.6590.02d 0.5890.03c 0.5890.03c 0.5590.03b 0.5790.02bc 0.6790.03d 0.6590.02d 0.5490.02e
Compactness min �max 20.10�25.10 18.66�25.74 17.96�19.17 18.68�21.70 17.10�27.47 18.42�24.7 18.01�22.89 16.67�26.87 18.17�23.23 19.22�24.42mean9sd 22.4591.59a 20.7591.39bc 18.7490.46e 19.8490.83cde 20.0791.75bcde 20.2291.40bcd 20.4991.17bcd 19.2391.92de 19.8591.57cde 21.3491.20b
Rectangularity min �max 0.64�0.72 0.68�0.74 0.66�0.70 0.68�0.73 0.68�0.73 0.67�0.73 0.69�0.73 0.67�0.73 0.68�0.73 0.66�0.71mean9sd 0.6990.02ab 0.7190.01c 0.6890.01a 0.7190.02c 0.7190.01c 0.7090.02b 0.7190.01c 0.7090.01b 0.7190.01c 0.6890.01a
Iden
tification
ofsn
appers
usin
gotolith
s805
Dow
nloa
ded
by [
Cen
tre
Med
iterr
ani D
'inve
stig
] at
00:
04 2
1 A
ugus
t 201
2

to determine the effect of species (the independent
variable) and fish length (the covariate) on EFD
descriptors. ‘Species’ was considered as the main
factor and ‘fish length’ as the covariate. When a
significant regression coefficient was detected and
homogeneity was observed among groups, then the
effect of fish length (TL) could be removed from
each measurement using this relationship:
Oij; adj ¼ Oij þ b � TLij � MTLj
� �;
where Oij, adj�otolith morphological measurement
of ith fish adjusted to mean fish length of group j;
Oij�original otolith morphological measurement for
ith fish from group j; b �slope of the relationship Oij;
TLij, common to all groups; TLij�fish length of ith
fish in group j; and MTLj�average fish length within
group j. If slopes differed among groups, the correc-
tion for TL was made separately for each group using
the above equation by replacing the common slope
(b) with the group-specific slope (bj). These correc-
tions were effective for scaling all morphological
variables of all otoliths to their predicted TL group
mean (Campana & Casselman 1993; Bolles & Begg
2000; Begg et al. 2001; DeVries et al. 2002;
Bergenius et al. 2005).
Otolith length was normalized to avoid allometric
effects of this parameter in the otolith weight, taking
into account the allometric relationship. A standar-
dized fish length of 22.0 cm was used as the
reference for all species (Lombarte & Lleonart
1993; Lleonart et al. 2000; Tuset et al. 2006).
Multivariate analysis of variance (MANOVA) was
used to test the hypothesis of no difference in otolith
shape between species. A canonical discriminant
function analysis (DFA) was also carried out to verify
the differences between species using the above-
mentioned variables. In the first stage a single-factor
ANOVA was carried out to determine which variables
discriminate among species to rank the potential
predictors. For the second stage, multicollinearity
was avoided in the DFA analysis by obtaining a
matrix correlation and then, eliminating the variables
with a high correlation (r�0.5) and small F-score
from ANOVA. The hypothesis that the between-
group covariances are equal was tested for all models.
The matrices were not homogeneous and the indivi-
dual within-group matrices were used, thus a quad-
ratic discriminant function was computed (Friedland
et al. 1994; Tuset et al. 2006). The classification
accuracy of each DFA was evaluated by leave-one-out
cross-validation (Nishimoto et al. 2010).
Results
Anatomical description
Morphologically, the sagittal otoliths of Lutjanus
spp. are similar with small specific variations
(Figures 3�5). For example, the otolith shape could
be pentagonal (L. argentimaculatus, L. erythropterus,
L. fulviflamma and L. russellii), elliptical
(L. bengalensis, L. ehrenbergii, L. lemniscatus) or could
change from pentagonal to elliptical (L. erythropterus,
L. johnii, L. malabaricus and L. rivulatus) or vice
versa (L. lutjanus).
In all species, the sulcus acusticus is heterosulcoid,
ostial with median position. The ostium is typically
funnel-like, except for L. bengalensis (rectangular),
L. johniiandL. malabaricus (funnel-like to rectangular).
It can be shorter than the cauda (L. argentimaculatus,
L. bengalensis, L. ehrenbergii, L. erythropterus,
L. fulviflamma and L. lutjanus), or approximately as
long as the cauda (L. johnii, L. lemniscatus,
L. malabaricus, L. rivulatus and L. russellii). The cauda
is tubular ending close to the posterior ventral margin.
The species L. malabaricus, L. johnii and
L. lutjanus show a cauda that is slightly curved, while
in the remaining species it is strongly or markedly
flexed.
The anterior margin noticeably varies and can
change with ageing: round in L. rivulatus, round-
angled in L. malabaricus, blunt to peaked in L.
ehrenbergii, peaked in L. lutjanus and L. lemniscatus,
peaked to angled in L. argentimaculatus, peaked to
round in L. erythropterus, L. russellii and angled in L.
bengalensis, L. fulviflamma and L. johnii.
The rostrum is short and broad in all species,
although the tip differs between and within species:
blunt (L. bengalensis, L. ehrenbergii, L. malabaricus and
L. russellii), pointed (L. ehrenbergii, L. erythropterus,
L. johnii, L. lemniscatus and L. lutjanus) round
(L. argentimaculatus, L. erythropterus, L. rivulatus and
L. russellii), oblique (L. fulviflamma) or angled
(L. johnii); with an antirostrum poorly defined or small,
broad and pointed; while the excisura can be wide
without or with a deep and acute notch. Finally, the
posterior region is oblique in most of species but
angled in L. johnii, L. lutjanus and L. malabaricus.
Shape indices
The three shape indices (aspect ratio, compactness and
rectangularity) showed significant differences among
groups of species. The aspect ratio was the index most
variable showing higher mean values in Lutjanus
argentimaculatus, L. erythropterus, L. malabaricus and
L. rivulatus and lowest in L. russellii. By contrast, the
compactness and rectangularity was less apparent for
the groups (Table I, Figure 6).
806 Z. Sagighzadeh et al.
Dow
nloa
ded
by [
Cen
tre
Med
iterr
ani D
'inve
stig
] at
00:
04 2
1 A
ugus
t 201
2

Figure 3. Sagittal otoliths of Lutjanus spp. from the Persian Gulf. A, L. argentimaculatus (42.3�63.2�80.2 cm TL); B, L. bengalensis
(21 cm TL); C, L. ehrenbergii (14.6�20.3�26 cm TL); D, L. erythropterus (31.6�38.7�52.3 cm TL). Scale bars �1 mm.
Identification of snappers using otoliths 807
Dow
nloa
ded
by [
Cen
tre
Med
iterr
ani D
'inve
stig
] at
00:
04 2
1 A
ugus
t 201
2

Figure 4. Sagittal otoliths of Lutjanus spp. from the Persian Gulf. A, L. fulviflamma (17.6�21.4�26 cm TL); B, L. johnii (16.7�46�75.4 cm
TL); C, L. lemniscatus (29.8�40.5�51.4 cm TL); D, L. lutjanus (15.3�19.1�23.2 cm TL). Scale bars �1 mm.
808 Z. Sagighzadeh et al.
Dow
nloa
ded
by [
Cen
tre
Med
iterr
ani D
'inve
stig
] at
00:
04 2
1 A
ugus
t 201
2

Figure 5. Sagittal otoliths of Lutjanus spp. from the Persian Gulf. A, L. malabaricus (23.5�45.9�73.2 cm TL); B, L. rivulatus (40.5�53.7�66.7 cm TL); C, L. russellii (15�25.9�37.2 cm TL). Scale bars �1 mm.
Identification of snappers using otoliths 809
Dow
nloa
ded
by [
Cen
tre
Med
iterr
ani D
'inve
stig
] at
00:
04 2
1 A
ugus
t 201
2

Otolith weight and contour
For the three methods applied (EFD, FFT and WT)
to characterize the otolith contour, the number of
coefficients implied in the mathematical analyses were
very low. In the case of EFD, the shape variability was
fulfilled only with the first 9 coefficients, while a total
of 53 of 1024 FFT harmonics meet the criteria
adequately. Finally, only 8 of 1536 wavelets were
used, of which most corresponded to the wavelet
number four because wavelets five and six were
characterized by a high variability among species
and fish length. However, the otolith weight was the
most important factor for species discrimination
(ANOVA F �113.21, P B0.001).
The FFT was the weakest method for species
discrimination, with a classification success of 47.8%
of cases (Table II). Only the otoliths of Lutjanus
argentimaculatus and L. lemniscatus were identified
above 70%, while L. fluviflamma, L. johnii, L. lutjanus,
L. malabaricus and L. rivulatus were assigned below
40%. The EFD and WT noticeably improved the
identification of the most species increasing the total
percentage to 57.5% and 65.5%, respectively
(Table II); however, it was not the same in L.
lemniscatus, L. erythropterus and L. ehrenbergii. Finally,
the joint application of the three methods allowed a
classification success of 77.6% to be reached. In this
case, the percentage of classification was above 70%,
except for L. fulviflammawhere it was 36.4% (Table II).
Discussion
Several different methods were tested in the statis-
tical DFA cross-validation procedures to determine
otolith shape identification of species. The results of
the morphological study indicate that otoliths of
snappers from the Persian Gulf are very similar in
morphological terms (shape, type of sulcus acusti-
cus, ostium and cauda), but do show differences in
the anterior and posterior rims of the otolith. Up to
now, only Rivaton & Bourret (1999) had provided
images of otoliths of some species of snappers
(Lutjanus argentimaculatus, L. fulviflamma, L. lutjanus
and L. russellii) from the Indian Ocean. Finally,
although the analysis of the otolith outline revealed a
high variability in the most species, only the combi-
nation of all methods provided strong results. The
ability to distinguish between otoliths of these
species is an important finding since species identi-
fication has proven difficult when these species co-
occur in the stomach contents of predators.
The advantage of this multiscale analysis (WT) is
that it enables us to identify single morphological
points (landmarks) located on the x-axis along the
contour where the rostrum is the origin of the
contour (Parisi-Baradad et al. 2005; Piera et al.
2005; Lombarte et al. 2006). The differences
observed in the ventral margin between rostrum
and post-rostrum and did not depend on the fish
length. On the contrary, EFD and FFT only give a
global approximation of outline variability (Reig-
Bolanos et al. 2010). However, EFD does not
require equal intervals along the outline and there-
fore can accommodate significantly more complex
shapes than polar Fourier functions, which describe
and characterize outlines better (e.g. Kuhl &
Giardina 1982; Lestrel 1997; Stransky & MacLellan
2005; Tracey et al. 2006; Stransky et al. 2008).
Notwithstanding, Marti-Puig et al. (2010) asserted
that although EFD can represent any contour when
Figure 6. Box plots for the shape indices (aspect ratio, compact-
ness and rectangularity) by Lutjanus spp. from the Persian Gulf.
(see Table 1 for abbreviation explanations).
810 Z. Sagighzadeh et al.
Dow
nloa
ded
by [
Cen
tre
Med
iterr
ani D
'inve
stig
] at
00:
04 2
1 A
ugus
t 201
2

a large number of coefficients are used, but in
practice the application of the number of descriptors
is limited to a certain low value (e.g. Parisi-Bardad
et al. 2005; Tracey et al. 2006; Burke et al. 2008;
present study) representing an approximation to the
original silhouette to a lesser degree than other
analyses. This becomes obvious in the presence of
a close similarity between species. Our results
support the hypothesis that Fourier transcription
methods are more efficient when discriminating
between groups or stocks of fish, but are not when
the aim is to identify and classify closer species.
However, the statistical results of the study showed
that combinations of these methods could be very
useful to discriminate species.
Otolith shape is affected by ecological, ontogenetic,
environmental and genetic factors (Morales-Nin
1987; Castonguay et al. 1991; Gago 1993; Friedland
& Reddin 1994; Lombarte et al. 2003; Cadrin &
Friedland 2005). In this framework, juvenile and
subadult fishes of many snappers of the Persian Gulf
and the Oman Sea exhibit a high grade of adaptability
Table II. Results of cross-validation using leave-one-out method for classifying Lutjanus spp. from the Persian Gulf. EFD, elliptical Fourier
descriptors; FFT, fast Fourier transform; WT, wavelets.
Predicted group membership (percentage)
Actual group Larg Lehr Lery Lful Ljoh Llem Llut Lmal Lriv Lrus
EFD�otolith weight
L. argentimaculatus (Larg) 92.3 7.7
L. ehrenbergii (Lehr) 55.7 6.6 24.6 1.6 3.3 1.6 6.6
L. erythropterus (Lery) 44.4 22.2 22.2 11.1
L. fulviflamma (Lful) 18.2 45.5 9.1 27.3
L. johnii (Ljoh) 9.8 55.4 10.9 19.6 2.2 2.2
L. lemniscatus (Llem) 8.7 4.3 56.5 4.3 26.1
L. lutjanus (Llut) 21.7 4.3 56.5 13.0 4.3
L. malabaricus (Lmal) 8.5 2.1 25.5 6.4 46.8 6.4 4.3
L. rivulatus (Lriv) 8.3 16.7 8.3 66.7
L. russellii (Lrus) 3.2 22.6 74.2
FFT�otolith weight
L. argentimaculatus (Larg) 92.3 7.7
L. ehrenbergii (Lehr) 60.7 3.3 16.4 1.6 8.2 1.6 4.9 3.3
L. erythropterus (Lery) 11.1 66.7 11.1 11.1
L. fulviflamma (Lful) 36.4 9.1 36.4 9.1 9.1
L. johnii (Ljoh) 1.1 5.4 6.5 37.0 8.7 28.3 12.0 1.1
L. lemniscatus (Llem) 4.3 73.9 4.3 17.4
L. lutjanus (Llut) 26.1 26.1 17.4 30.4
L. malabaricus (Lmal) 2.1 4.3 4.3 27.7 2.1 34.0 23.4 2.1
L. rivulatus (Lriv) 8.3 16.7 41.7 25.0 8.3
L. russellii (Lrus) 3.2 38.7 58.1
WT�otolith weight
L. argentimaculatus (Larg) 100.0
L. ehrenbergii (Lehr) 47.5 3.3 26.2 8.2 3.3 3.3 3.3 3.3 1.6
L. erythropterus (Lery) 55.6 11.1 11.1 11.1 11.1
L. fulviflamma (Lful) 18.2 9.1 45.5 9.1 18.2
L. johnii (Ljoh) 2.2 4.3 81.5 2.2 5.4 3.3 1.1
L. lemniscatus (Llem) 8.7 4.3 4.3 65.2 17.4
L. lutjanus (Llut) 13.0 4.3 4.3 4.3 47.8 13.0 13.0
L. malabaricus (Lmal) 6.4 10.6 10.6 59.6 8.5 4.3
L. rivulatus (Lriv) 8.3 8.3 16.7 66.7
L. russellii (Lrus) 3.2 3.2 3.2 19.4 71.0
EFD�FFT�WT�otolith weight
L. argentimaculatus (Larg) 92.3 7.7
L. ehrenbergii (Lehr) 75.4 11.5 1.6 9.8 1.6
L. erythropterus (Lery) 77.8 11.1 11.1
L. fulviflamma (Lful) 36.4 36.4 18.2 9.1
L. johnii (Ljoh) 2.2 1.1 81.5 2.2 10.9 2.2
L. lemniscatus (Llem) 4.3 82.6 13.0
L. lutjanus (Llut) 13.0 4.3 78.3 4.3
L. malabaricus (Lmal) 4.3 12.8 6.4 70.2 2.1 4.3
L. rivulatus (Lriv) 8.3 8.3 83.3
L. russellii (Lrus) 3.2 12.9 83.9
Identification of snappers using otoliths 811
Dow
nloa
ded
by [
Cen
tre
Med
iterr
ani D
'inve
stig
] at
00:
04 2
1 A
ugus
t 201
2
to different environments such as mangroves, sea-
grass beds, freshwater streams or brackish water.
They migrate to rocky environments or coral reefs
when they are adults and then take up permanent
residence there (Druzhinin 1970; Cervigon 1993;
Cocheret et al. 2003). These species differ in beha-
viour (nocturnal or diurnal), coloration patterns on
body, habitat and sociality (solitary or groups)
influencing their behavior and intra- and inter-
specific communications (Lewis & Pring 1986;
Sainsbury 1987; Williams & Russ 1992; Sommer
et al. 1996; Kailola et al. 1993; Lieske & Myers 1994;
Kuiter & Tonozuka 2001). In fact, the anatomical
affinity � narrower otoliths and deeper notch of
excisura ostti between rostrum and antirostrum of
the otolith of Lutjanus ehrenbergii, L. fulviflamma and
L. lutjanus � is reasonable taking into account that
these species inhabit coastal environments and have a
similar coloration and body shape, which may be
interpreted as a common phylogenetic origin where
L. fulviflamma might be the ancestral species.
Our study is the first investigation that compares
actual data with related mathematical protocols by
several methods and provides results of a high degree
of reliability. At this point, we would like to comment
on the phenomenon of multicollinearity among
variables. Elimination of these variables did not
significantly increase the percentage of classification.
It is true that the number of wavelets used in the
discriminant analysis was low, but that was due to the
phenomenon of multicollinearity among the closer
wavelets. Moreover, our study demonstrates that the
variance homogeneity among species is smaller in
wavelets with a low frequency, which show more
details of the otolith profile, which we consider a
relevant result for future studies using wavelets.
Finally, several studies have shown that otolith
weight is a more powerful discriminator and has less
variation than Fourier descriptors (Forsberg & Neal
1993; Tuset et al. 2006). Our results support these
findings and reinforce the fact that future research
should be focused on developing three-dimensional
techniques to help researchers in the proper identi-
fication of species.
Acknowledgements
This work has been supported by the MICIN
CTM2010-19701 (AFORO3D project). The anon-
ymous reviewers provided many helpful comments
on both the structure and analysis of an earlier
version of the report. Their comments resulted in a
much improved manuscript and their assistance is
appreciated. Dr Victor Tuset is worker of CSIC
within the modality ‘JAE-Postdoc’ of Programme
‘Junta para la Ampliacion de Estudios’ co-funded by
the European Social Foundation.
References
Aiken KA. 1993. Jamaica, in: Marine Fishery Resources of the
Lesser Antilles, Puerto Rico and Hispaniola. FAO Fisheries
Technical Paper 326:1160�80.Appeldoorn RS, Meyers S. 1993. Puerto Rico and Hispaniola, in:
Marine Fisheries Resources of the Antilles. FAO Fisheries
Technical Paper 326:99�159.Assis CA. 2003. The lagenar otoliths of teleosts: Their morphol-
ogy and its application in species identification, phylogeny and
systematic. Journal of Fish Biology 62:1268�95.Baisre JA. 1993. Marine Fishery Resources of the Antilles. Pt IV.
Cuba. FAO Fisheries Technical Paper 326:182�235.Begg GA, Overholtz WJ, Munroe NJ. 2001. The use of internal
otolith morphometrics for identification of haddock
(Melanogrammus aeglefinus) stocks on Georges Bank. Fisheries
Bulletin 99:1�14.Begg GA, Campana SE, Flower AJ, Suthers IM. 2005. Otolith
research and application: Current directions in innovation
and implementation. Marine and Freshwater Research
56:477�83.Bergenius MAJ, Begg GA, Mapstone BD. 2005. The use of
otolith morphology to indicate the stock structure of common
coral trout (Plectropomus leopardus) on the Great Barrier Reef,
Australia. Fisheries Bulletin 104:498�511.Blacker RW. 1969. Chemical composition of the zones in cod
(Gadus morhua L.) otoliths. Journal du Conseil International
Pour L’exploration de la Mer 33:107�08.Bolles KL, Begg GA. 2000. Distinction between silver hake
(Merluccius bilinearis) stocks in US waters of the northwest
Atlantic based on whole otolith morphometrics. Fisheries
Bulletin 98:451�62.Burke N, Brophy D, King PA. 2008. Otolith shape analysis: Its
application for discriminating between stocks of Irish Sea and
Celtic Sea herring (Clupea harengus) in the Irish Sea. Journal of
Marine Science 65:1670�75.Cadrin SX, Friedland KD, Waldman JR. 2005. Stock Identifica-
tion Methods: An Overview. Burlington, MA: Elsevier Aca-
demic Press, p 3�6.
Campana SE. 2004. Photographic Atlas of Fish Otoliths of the
Northwest Atlantic Ocean. Ottawa, Ontario: NRC Research
Press. 284 pages.
Campana SE, Casselman JM. 1993. Stock discrimination using
otolith shape analysis. Canadian Journal of Fisheries and
Aquatic Sciences 50:1062�83.Capoccioni F, Costa C, Aguzzi J, Menesatti P, Lombarte A,
Ciccotti E. 2011. Ontogenetic and environmental effects on
otolith shape variability in three Mediterranean European eel
(Anguilla anguilla L.) local stocks. Journal of Experimental
Marine Biology and Ecology 397:1�7.Carlstrom D. 1963. A crystallographic study of vertebrate
otoliths. The Biological Bulletin 125:441�63.Carpenter KE, Krupp F, Jones DA, Zajonz U.1997. FAO
Species Identification Field Guide for Fishery Purposes. The
Living Marine Resources of Kuwait, Eastern Saudi Arabia,
Bahrain, Qatar, and the United Arab Emirates. Rome: FAO.
293 pages.
Castonguay M, Simard P, Gagnon P. 1991. Usefulness of Fourier
analysis of otolith shape for Atlantic mackerel (Scomber
scombrus) stock discrimination. Canadian Journal of Fisheries
and Aquatic Sciences 48:296�302.Cermeno P, Morales-Nin B, Uriarte A. 2006. Juvenile European
anchovy otolith microstructure. Scientia Marina 70:553�57.
812 Z. Sagighzadeh et al.
Dow
nloa
ded
by [
Cen
tre
Med
iterr
ani D
'inve
stig
] at
00:
04 2
1 A
ugus
t 201
2
Cervigon F.1993. Los peces marinos de Venezuela. Volume 2.
Caracas,Venezuela: Fundacion Cientıfica Los Roques.
497 pages.
Christopher RA, Waters JA. 1974. Fourier series as a quantitative
descriptor of miospore shape. Journal of Paleontology 48:697�709.Claro R, Lindeman KC, Parenti LR. 2001. Ecology of the Marine
Fishes of Cuba. Washington, DC: Smithsonian Institution
Press. 253 pages.
Cocheret de la Moriniere E, Pollux BYA, Nagelkerken I, Van der
Velde G. 2003. Diet shifts Caribbean grunts (Haemulidae) and
snappers (Lutjanidae) and the relation with nursery-to-coral
reef migrations. Estuarine Coastal and Shelf Science 57:
1079�89.Cordier R, Dalcq A. 1954. Organe stato-acoustique. Traite de
Zoologie 12:453�521.Degens ET, Deuser WG, Haedrich RL. 1969. Molecular struc-
ture and composition of fish otoliths. Marine Biology 2:105�13.DeVries DA, Grimes CB, Prager MH. 2002. Using otolith shape
analysis to distinguish eastern Gulf of Mexico and Atlantic
Ocean stocks of king mackerel. Fisheries Research 57:51�62.Druzhinin AD. 1970. The range and biology of snappers (Fam.
Lutjanidae). Journal of Ichthyology 10:717�35.Farias I, Vieira AR, Gordo LS, Figueiredo I. 2009. Otolith shape
analysis as a tool for stock discrimination of the black
scabbardfish, Aphanopus carbo Lowe, 1839 (Pisces: Trichiur-
idae), in Portuguese waters. Scientia Marina 73:47�53.Foresberg JE, Neal R. 1993. Estimating sex of pacific Halibut
(Hippoglossus stenolepis) using Fourier shape analysis of
otoliths. Technical report. The International Pacific Halibut
Commission 29:5�23.Friedland KD, Esteves C, Hansen LP, Lund RA. 1994. Dis-
crimination of Norwegian farmed, ranched and wild origin
Atlantic salmon, Salmo salar L., by image processing. Fisheries
Management and Ecology 1:117�28.Friedland KD, Reddin DG. 1994. Use of otolithy morphology in
stock discrimination of Atlantic salmon (Salmon salar). Cana-
dian Journal of Fisheries and Aquatic Sciences 51:91�98.Gago JF. 1993. Morphology of the saccular otoliths of six species
of lanternfishes of the genus Symbolophorus (Pisces: Mycto-
phidae). Bulletin of Marine Sciences 52:949�60.Harkonen T. 1986. Guide to the Otoliths of the Bony Fishes of the
Northeast Atlantic. Hellerup, Denmark: Danbiu ApS, 256 pages.
Hildebrand M. 1988. Analysis of Vertebrate Structure. New York,
NY: John Wiley and Sons. 654 pages.
Hunter JR. 1983. Aspects of the Dynamics of the Residual
Circulation of the Arabian Gulf. New York, NY: Plenum
Press, p 31�42.
Iwata H, Ukai Y. 2002. SHAPE: A computer program package for
quantitative evaluation of biological shapes based on elliptic
Fourier descriptors. Journal of Heredity 93:384�85.Jobling M. 1995. Environmental Biology of Fishes. London:
Chapman and Hall. 455 pages.
Kailola PJ, Williams MJ, Stewart PC, Reichelt RE, McNee A,
Grieve C. 1993. Australian Fisheries Resources. Canberra,
Australia: Bureau of Resource Sciences. 422 pages.
Kuhl FP, Giardina CR. 1982. Elliptic Fourier features of a closed
contour. Computer Graphics and Image Processing 18:236�58.Kuiter RH, Tonozuka T. 2001. Pictorial Guide to Indonesian Reef
Fishes. Part 1. Eels � Snappers, Muraenidae � Lutjanidae.
Australia: Zoonetics. 302 pages.
Lestrel PE.1997. Fourier Descriptors and their Applications in
Biology. London: Cambridge University Press. 466 pages.
Lewis AD, Pring CK. 1986. Freshwater and brackishwater fish and
fisheries of Fiji. In: Petr, T, editor. Reports and papers presented
at the Indo-Pacific Fishery Commission Expert Consultation
on inland fisheries of the larger Indo-Pacific islands. Bangkok,
Thailand: FAO Fisheries Reports (371). 258 pages.
Lieske E, Myers R. 1994. Collins Pocket Guide. Coral Reef
Fishes. Indo-Pacific & Caribbean including the Red Sea.
Haper Collins Publishers. 400 pages.
Lleonart J, Salat J, Torres GJ. 2000. Removing allometric effects
of body size in morphological analysis. Journal of Theoretical
Biology 205:85�93.Lombarte A, Lleonart J. 1993. Otolith size changes related with
body growth, habitat depth and temperature. Environmental
Biology of Fishes 37:297�306.Lombarte A, Torres GJ, Morales-Nin B. 2003. Specific Merluccius
otolith growth patterns related to phylogenetics and environ-
mental. Journal of the Marine Biological Association of the
United Kingdom 83:277�81.Lombarte A, Chic O, Parisi-Baradad V, Olivella R, Piera J,
Garcıa-Ladona E. 2006. A web-based environment from shape
analysis of fish otoliths. The AFORO database. Scientia
Marina 70:147�52.Mallat S. 1991. Zero crossings of a wavelet transform. IEEE
Transactions on Information Theory 37:1019�33.Martı-Puig P, Sole-Casals J, Reig-Bolano R, Zaiats V. 2010.
Mathematical morphology preprocessing to mitigate AWGN
effects: Improving pitch tracking performance in hard noise
conditions. In: Jordi SC Zaiats V, editors. Advances in Non-
linear Speech Processing. Dordrecht: Springer, p 163�70.
Morales-Nin BYO. 1987. The influence of environmental factors
on microstructure of otoliths of three demersal fish species
caught off Namibia. South African Journal of Marine Science
5:255�62.Nishimoto MM, Washburn L, Warner RR, Love MS, Paradis GL.
2010. Otolith elemental signatures reflect residency in coastal
water masses. Environmental Biology of Fishes 89:341�56.Nolf D. 1985. Otolithi piscium. In: HP Schultze editor. Handbook of
Paleoichthyology.NewYork,NY:GustavFisherVerlag.145pages.
Parisi-Baradad V, Lombarte A, Garcıa-Ladona E, Cabestany J,
Piera J, Chic O. 2005. Otolith shape contour analysis using
affine transformation invariant wavelet transforms and curva-
ture scale space representation. Marine and Freshwater
Research 56:795�804.Parisi-Baradad V, Manjabacas A, Lombarte A, Olivella R, Chic O,
Piera J, et al. 2010. Automatic taxon identification of teleost
fishes in an otolith online database. Fisheries Research 105:13�20.
Piera J, Parisi-Baradad V, Garcıa-Ladona E, Lombarte A,
Recasens L, Cabestany J. 2005. Otolith shape feature extrac-
tion oriented to automatic classification with open distributed
data. Marine and Freshwater Research 56:805�14.Reig-Bolanos R, Marti-Puig P, Lombarte A, Soria JA, Parisi-
Baradad V. 2010. A new otolith image contour descriptor
based on partial reflection. Environmental Biology of Fishes
89:579�88.Reynolds M. 1993. Physical oceanography of the Gulf, Strait of
Hormuz, and the Gulf of Oman: Results from the Mt Mitchell
expedition. Marine Pollution Bulletin 27:35�59.Rivaton J, Bourret P. 1999. Les otolithes des poissons de l’Indo-
Pacifique. IRD. Documents Scientifiques et Techniques 2. 378
pages.
Russ JC. 1990. Computer Assisted Microscopy: The Measure-
ment and Analysis of Images. New York, NY: Plenum Press.
453 pages.
Sainsbury KJ. 1987. Assessment and management of the demersal
fishery on the continental shelf of northwestern Australia. In:
Polovina JJ, Ralston S, editors. Tropical Snappers and Group-
ers. Biology and Fisheries Management. London: Westview
Press, p 465�503.
Schwarzhans W. 1980. Die tertiare Teleosteer-Fauna Neusee-
lands, rekonstruiert anhand von Otolithen. Berliner Geowis-
senschaftliche Abhandlungen 26:1�211.
Identification of snappers using otoliths 813
Dow
nloa
ded
by [
Cen
tre
Med
iterr
ani D
'inve
stig
] at
00:
04 2
1 A
ugus
t 201
2

Smale MJ, Watson G, Hecht T. 1995. Otolith atlas of southern
African marine fishes. Ichthyological Bulletin of the J.L.B.
Smith Institute of Ichthyology 1. 253 pages.
Smith MK. 1992. Regional differences in otolith morphology of
the deep slope red snapper (Eteus carbunculus). Canadian
Journal of Fisheries and Aquatic Sciences 49:795�804.Sommer C, Schneider W, Poutiers JM. 1996. FAO Species
Identification Field Guide for Fishery Purposes. The Living
Marine Resources of Somalia. Rome: FAO. 376 pages.
Stransky C, MacLellan SE. 2005. Species separation and
zoogeography of redfish and rockfish (genus Sebastes) by otolith
shape analysis. Canadian Journal of Fisheries and Aquatic
Sciences 62:2265�76.Stransky C, Murta AG, Schlickeisen J, Zimmermann C. 2008.
Otolith shape analysis as a tool for stock separation of horse
mackerel (Trachurus trachurus) in the Northeast Atlantic and
Mediterranean. Fisheries Research 89:159�66.Tracey SR, Lyle JM, Duhamel G. 2006. Application of elliptical
Fourier analysis of otolith form as a tool for stock identifica-
tion. Fisheries Research 77:138�47.Tuset VM, Lombarte A, Assis CA. 2008. Otolith atlas for the
western Mediterranean, north and central eastern Atlantic.
Scientia Marina 72:7�198.Tuset VM, Lombarte A, Gonzalez JA, Pertusa JF, Lorente MJ.
2003. Comparative morphology of the sagittal otolith in
Serranus spp. Journal of Fish Biology 63:1491�504.
Tuset VM, Rosin PL, Lombarte A. 2006. Sagittal otolith shape
used in the identification of fishes of the genus Serranus.
Fisheries Research 81:316�25.Tuset VM, Azzurro E, Lombarte A. Identification of Lessepsian
fish species using the sagittal otolith. Scientia Marina 76:
289�99.
Valinassab T, Daryanabard R, Dehghani R, Pierce GJ. 2006.
Abundance of demersal fish resources in the Persian Gulf and
Oman Sea. Journal of the Marine Biological Association of the
United Kingdom 86:1455�62.Valinassab T, Adjeer M, Momeni M. 2010. Biomass estimation of
demersal fishes in the Persian Gulf and Oman Sea by swept
area method. Final report (in Persian). Iranian Fisheries
Research Organization Press. 370 pages.
Volpedo AV, Echeverrıa DD. 2000. Catalogo y claves de otolitos
para la identificacion de peces del Mar Argentino. 1. Peces de
Importancia Economica. Editorial Dunken, Buenos Aires. 88
pages.
Weichert CK, Presch W. 1981. Elementos de anatomia de los
cordados. Mexico: McGraw-Hill. 529 pages.
Williams DMcB, Russ GR.1992. Review of the data on fishes of
commercial and recreational fishing interest on the Great
Barrier Reef. Volume 1. Great Barrier Reef Marine Park
Authority. Townsville. 103 pages.
Editorial responsibility: Franz Uiblein
814 Z. Sagighzadeh et al.
Dow
nloa
ded
by [
Cen
tre
Med
iterr
ani D
'inve
stig
] at
00:
04 2
1 A
ugus
t 201
2


![A Survey of 2D and 3D Shape Descriptors · [2], [3], [30], and [54]. In this survey paper, we present and summarize several important 2D and 3D shape descriptors which have undergone](https://static.fdocuments.net/doc/165x107/60a9373a715c9c203f650ae8/a-survey-of-2d-and-3d-shape-descriptors-2-3-30-and-54-in-this-survey.jpg)