1D and 2D Shape Descriptors Applied in Fabric Drape Computer ...
10
Gabrijelčič Tomc H, Hladnik A. 1D and 2D Shape Descriptors Applied in Fabric Drape Computer Simulatio. FIBRES & TEXTILES in Eastern Europe 2015; 23, 6(114): 92-101. DOI: 10.5604/12303666.1167425 92 1D and 2D Shape Descriptors Applied in Fabric Drape Computer Simulation Helena Gabrijelčič Tomc, Aleš Hladnik Department of Textiles, Graphic Arts and Design, Faculty of Natural Sciences and Engineering, University of Ljubljana, Snežniška 5, 1000 Ljubljana, Slovenia, E-mail: [email protected] [email protected] Abstract Fabric drape simulations accomplished by computer graphics software can provide the basis for effective communication among designers, manufacturers and other players in the apparel industry. The goal of our study was to investigate various 1D and 2D shape descriptors used to characterize renderings of 3D drape simulations in dependence on the geometry of collision objects and fabric type. Image processing routines were imple- mented to extract and compute the shape descriptors while principal components analysis was applied to interpret the relationships among the parameters studied. Drapes on cube, octahedron and prism were found to behave in a distinctively different manner compared to those produced using the other six collision objects: cone, cylinder, dodecahedron, gen- gon, sphere, and tube. A first principal component can be, to a large extent, represented by the following mutually strongly correlated 2D shape descriptors: area, major axis length, minor axis length, equivalent diameter, and perimeter. Analysis using 1D shape descrip- tors confirms these findings and additionally suggests that rubber-based drapes contain the lowest number of folds while those on polyester, wool, and sometimes silk and/or satin are characterized by the highest number of drape folds. These results were confirmed by visual examination of the drapes simulated. Key words: drape simulation, fabric, shape descriptors, computer graphics, principal com- ponents analysis, image processing. components analysis (PCA) was applied to examine and interpret the relationships among the parameters studied. Rather than focusing on individual descriptors, our intention was to get an overview of the system and to compare the applicabil- ity of 1D and 2D shape descriptors for its characterization. Fabric modelling and simulation In 3D computer graphics, fabric and cloth are considered dynamic objects due to their interaction with internal and external forces. A typical example of an internal force is self-collision, which can be simulated by a collision of fabric segments themselves. External forces in- clude gravitation, collision (interaction with a rigid or soft object), wind and tur- bulence [2, 3]. Computer assisted modelling of fabric and its drape has its origins in the 1980s. The first experiments and studies adopt- ed a geometric approach [4] where e.g. a rectangular piece of fabric was mod- elled as a material hanging in three di- mensions when supported by any number of constraint points [5]. In later investi- gations more realistic and physically- based models were developed. Feynman utilized a set of energy equations based on the theory of elastic shells, distribut- ed over a grid of points [6]. Several re- searchers implemented finite difference techniques [7] or a finite element method [8 - 10] to produce fabric simulations. etary or open-source computer graphics tools for 3D modelling, animation, light- ing, and rendering such as 3ds Max ® or Maya ® , which, due to their multilayer texturing maps and complex shading, il- lumination and rendering algorithms, are able to display even the finest details of fabric (e.g. fibres, specific surface phe- nomena, etc.). Using an appropriate ren- dering engine, it is almost impossible for the human eye to distinguish between the result of a fabric simulation and its appearance on an actual photograph. In these virtual environments, correspond- ence between the software’s internal pa- rameters and physical properties of real fabric is occasionally problematic due to the lack of documentation of the former. In spite of the drawbacks mentioned, ad- vantages of using either type of simula- tion tool in research and for production purposes are numerous: flexible design and prototyping,experimenting with var- ious input settings, type and number of samples, which would be impossible to perform using real equipment and sam- ples, cost reduction, prompt and effective communication between the designer, manufacturer and client [1]. The goal of the study presented was to investigate various 1D and 2D shape de- scriptors used to characterize renderings of 3D drape simulations in dependence on the geometry of collision objects and fabric properties. Image processing rou- tines were implemented to obtain and compute shape descriptors, and principal DOI: 10.5604/12303666.1167425 n Introduction 3D virtual fabric prototyping comprises computer aided design, computer aided manufacturing and computer aided en- gineering (CAD, CAM, CAE). Such prototyping enables testing of various types of mechanical motion, simulation of behaviour, fitting of fabric and clothes to virtual models of the human body and furniture and visualization of aesthetic appeal. Moreover the use of personalized 3D avatars improves the customization of these prototyping products. Specialized CAD software packages for fabric and textile modelling and simu- lation, such as Lectra and Optitex, have been during the past decade continuously improved and upgraded, in particular the modules for computer aided simu- lation of mechanical properties of real fabrics. Accurate virtual representation of fabric improves the textile design pro- cess due to its increased flexibility and customization as well as reduced pro- duction costs, since less raw material is needed for generation of physical pro- totypes. In spite of the marked develop- ment of these CAD systems, the realistic visualization and visual appearance of simulated fabrics and apparel are some- times still suboptimal. On the other hand, fabric modelling and simulation can also be performed by means of either propri-
Transcript of 1D and 2D Shape Descriptors Applied in Fabric Drape Computer ...

Gabrijelčič Tomc H, Hladnik A. 1D and 2D Shape Descriptors Applied in Fabric Drape Computer Simulatio.FIBRES & TEXTILES in Eastern Europe 2015; 23, 6(114): 92-101. DOI: 10.5604/12303666.1167425
92
1D and 2D Shape Descriptors Applied in Fabric Drape Computer Simulation
Helena Gabrijelčič Tomc, Aleš Hladnik
Department of Textiles, Graphic Arts and Design, Faculty of Natural Sciences and Engineering,
University of Ljubljana, Snežniška 5, 1000 Ljubljana, Slovenia, E-mail: [email protected]
AbstractFabric drape simulations accomplished by computer graphics software can provide the basis for effective communication among designers, manufacturers and other players in the apparel industry. The goal of our study was to investigate various 1D and 2D shape descriptors used to characterize renderings of 3D drape simulations in dependence on the geometry of collision objects and fabric type. Image processing routines were imple-mented to extract and compute the shape descriptors while principal components analysis was applied to interpret the relationships among the parameters studied. Drapes on cube, octahedron and prism were found to behave in a distinctively different manner compared to those produced using the other six collision objects: cone, cylinder, dodecahedron, gen-gon, sphere, and tube. A first principal component can be, to a large extent, represented by the following mutually strongly correlated 2D shape descriptors: area, major axis length, minor axis length, equivalent diameter, and perimeter. Analysis using 1D shape descrip-tors confirms these findings and additionally suggests that rubber-based drapes contain the lowest number of folds while those on polyester, wool, and sometimes silk and/or satin are characterized by the highest number of drape folds. These results were confirmed by visual examination of the drapes simulated.
Key words: drape simulation, fabric, shape descriptors, computer graphics, principal com-ponents analysis, image processing.
components analysis (PCA) was applied to examine and interpret the relationships among the parameters studied. Rather than focusing on individual descriptors, our intention was to get an overview of the system and to compare the applicabil-ity of 1D and 2D shape descriptors for its characterization.
Fabric modelling and simulationIn 3D computer graphics, fabric and cloth are considered dynamic objects due to their interaction with internal and external forces. A typical example of an internal force is self-collision, which can be simulated by a collision of fabric segments themselves. External forces in-clude gravitation, collision (interaction with a rigid or soft object), wind and tur-bulence [2, 3].
Computer assisted modelling of fabric and its drape has its origins in the 1980s. The first experiments and studies adopt-ed a geometric approach [4] where e.g. a rectangular piece of fabric was mod-elled as a material hanging in three di-mensions when supported by any number of constraint points [5]. In later investi-gations more realistic and physically-based models were developed. Feynman utilized a set of energy equations based on the theory of elastic shells, distribut-ed over a grid of points [6]. Several re-searchers implemented finite difference techniques [7] or a finite element method [8 - 10] to produce fabric simulations.
etary or open-source computer graphics tools for 3D modelling, animation, light-ing, and rendering such as 3ds Max® or Maya®, which, due to their multilayer texturing maps and complex shading, il-lumination and rendering algorithms, are able to display even the finest details of fabric (e.g. fibres, specific surface phe-nomena, etc.). Using an appropriate ren-dering engine, it is almost impossible for the human eye to distinguish between the result of a fabric simulation and its appearance on an actual photograph. In these virtual environments, correspond-ence between the software’s internal pa-rameters and physical properties of real fabric is occasionally problematic due to the lack of documentation of the former. In spite of the drawbacks mentioned, ad-vantages of using either type of simula-tion tool in research and for production purposes are numerous: flexible design and prototyping,experimenting with var-ious input settings, type and number of samples, which would be impossible to perform using real equipment and sam-ples, cost reduction, prompt and effective communication between the designer, manufacturer and client [1].
The goal of the study presented was to investigate various 1D and 2D shape de-scriptors used to characterize renderings of 3D drape simulations in dependence on the geometry of collision objects and fabric properties. Image processing rou-tines were implemented to obtain and compute shape descriptors, and principal
DOI: 10.5604/12303666.1167425
n Introduction3D virtual fabric prototyping comprises computer aided design, computer aided manufacturing and computer aided en-gineering (CAD, CAM, CAE). Such prototyping enables testing of various types of mechanical motion, simulation of behaviour, fitting of fabric and clothes to virtual models of the human body and furniture and visualization of aesthetic appeal. Moreover the use of personalized 3D avatars improves the customization of these prototyping products.
Specialized CAD software packages for fabric and textile modelling and simu-lation, such as Lectra and Optitex, have been during the past decade continuously improved and upgraded, in particular the modules for computer aided simu-lation of mechanical properties of real fabrics. Accurate virtual representation of fabric improves the textile design pro-cess due to its increased flexibility and customization as well as reduced pro-duction costs, since less raw material is needed for generation of physical pro-totypes. In spite of the marked develop-ment of these CAD systems, the realistic visualization and visual appearance of simulated fabrics and apparel are some-times still suboptimal. On the other hand, fabric modelling and simulation can also be performed by means of either propri-

93FIBRES & TEXTILES in Eastern Europe 2015, Vol. 23, 6(114)
Rather than using such continuum me-chanics approaches, the model by Breen et al. [11] utilized interacting particles. They modelled fabric as a collection of particles that conceptually represents the crossing points of warp and weft threads in a plain weave. They were able to show that a microstructural model may be used to reproduce the macroscopic mechani-cal behavior of real flexible materials. Eberhardt et al. [12] also used a coupled particles’ system, but applied a different, faster technique to compute exact parti-cle trajectories. In addition, their system allows dynamic simulation that shows the effects of air resistance, wind, mov-ing bodies, and surface friction on falling fabric. Baraff and Witkin [13] developed a fabric simulation system that was con-siderably faster than those previously reported. This was due to their choice of an implicit – rather than explicit – numer-ical integration of an ordinary differential equation that describes fabric simulation, introduction of a simple, unified treat-ment of damping forces and other im-provements.
Fabric drape measurement and image processingFabric drape can be defined as the final configuration of a piece of fabric placed over a solid object [14] or, according to the standard, as the extent to which a fab-ric will deform when it is allowed to hang under its own weight [15]. It is the result of complex interactions among vari-ous factors, such as gravitation, fabric characteristics (fibre composition, yarn and fabric structure, weave type, type of finish), collision object geometry and is also related to fabric’s mechanical prop-erties [16]. In his experiments Mizutani et al. [17] proved that drape formation consists of three phases: fold generation, development and stabilisation. Drape assessment of a real or virtual fabric is in practice accomplished by some sort of a collision test – using e.g. a testing device called a Drapemeter [18] – dur-ing which a fabric specimen is allowed to fall under its own weight. Sanad et al. [19] provide a comprehensive overview of measurement methods that have been developed during the past decades for evaluating fabric drape. Instruments in-clude static, dynamic, photovoltaic and alternative drapemeters. Traditionally the most important drape parameter has been the drape coefficient (DC) [14], which is expressed as the ratio of a draped fabric’s shadow when it is par-tially supported to its undeformed flat state in terms of area and ranges between
0 and 100%. With the advance in meas-uring equipment and technology, other drape parameters have been proposed and successfully applied in practice. Digital image processing and -analysis routines have been frequently imple-mented to study and quantitatively assess fabric draping behaviour. The usual set-ting is to apply a digital camera attached to a drapemeter in order to acquire imag-es of draped fabric [20]. From the drape profile images, computer software allows one to obtain detailed data on various drape shape parameters and to gather sta-tistical information on the number, wave-length and amplitude of drape nodes.
In numerous studies, the performance of these tools was compared against that of conventional approaches used to quantify draping. In the investigations performed by Jeong and Phillips [21, 22], Kenkare and Plumlee [23], Behera et al. [24] and Hamdi et al. [25] the correlation between the conventional and image analysis method was found to be very good, with the latter often having a superior repeat-ability. Gnanavel and Ananthakrishnan [26] developed a 3D method for acquir-ing drape contours leading to excellent results when compared to a simple im-age processing approach. Using so called surfer software, contour lines, vector lines, 3D profile, volume, area and other information were generated, thus very accurately describing fabric drape. Fara-jikhah et al. [27] reported on the devel-opment of the shadow moiré aided 3-D reconstruction method to evaluate the drape of woven fabrics and compared the results with the standard drape coeffi-cient. Mirjalili and Ekhtiyari [28] utilized the projection of a tungsten-halogen light source on the fabric specimen followed by an image processing approach for fab-ric wrinkle (node) assessment. Tien-Wei et al. [29] adopted image processing and statistical methods to determine the peak-trough threshold of the drape fabric node. Dynamic drape images of different wool fabrics were processed with the purpose to determine the fabric node number and fabric drape coefficient. Recently, Pay-vandy [30] used image processing and fractal analysis based on the count box-ing method to evaluate an image of fabric drape.
Since in our study images had been gen-erated by means of computer software, image processing was utilized solely for obtaining contours of the renderings of fabrics that were in contact with a par-ticular collision object and for extracting
corresponding 2D and 1D shape descrip-tors. In addition, no attempt was made to compare these results to those obtained for the real fabric or textiles. Principal components analysisPrincipal components analysis (PCA) is a frequently used data exploration and/or data reduction statistical tool [31]. The basic idea of PCA is the transforma-tion of a multivariate dataset into a lower dimensional space of new, „composite”, variables, referred to as principal com-ponents (PC). PCs are linear combina-tions of the original variables and are completely uncorrelated – orthogonal – to each other. The number of PCs ex-tracted equals that of original variables, but it is generally the first few, often only two or three, PCs that account for most of the variability in the data since higher ones mainly represent data noise and can therefore be neglected. By plotting two PCs it is possible to detect patterns and (dis)similarities between the sam-ples – so called scores plot – as well as to visualize linear relationships among the original variables using a loadings plot.
As in virtually every other field of sci-ence and engineering, PCA has also been successfully implemented in textile sci-ence research. Recently Hamdi et al. [32] adopted PCA to detect similarities and differences between fabric parameters such as thickness, weight and bending rigidity on the one hand and drape pa-rameters – drape coefficient and number of nodes – on the other. PCA was im-plemented as a feature dimensionality reduction tool in the study conducted by Bouman et al. [33]. The authors devel-oped a method for estimating the mate-rial properties of fabric from a video through the use of features that capture spatiotemporal statistics in a video’s mo-tion field.
n ExperimentalThe testing scene was set up in 3ds Max®, professional software for 3D computer modelling, texturing, render-ing, animation and creation of special ef-fects. In addition to its widespread use in computer games and 3D animated mov-ies, the software has been extensively implemented for apparel simulations and generation of virtual fabric and cloth in the automotive industry, for realistic ar-chitecture visualizations and other pur-poses.

FIBRES & TEXTILES in Eastern Europe 2015, Vol. 23, 6(114)94
xlight3 = -100, ylight3 = -105, zlight3 = 200, xlight4 = 100, ylight4 = 105, zlight4 = 200 and two target cameras (50 mm lenses) with the following positions: xcamera1 = 0, ycamera1 = 0, zcamera1 = 250 and xcamera2 = -160, ycamera2 = -170, zcamera2 = 100. The renderings were generated from the top and side views, respectively. Nine virtual collision objects (Figure 2) over which different types of simulated fab-ric material (see below) were draped, were created: cone, cube, cylinder, do-decahedron, gengon, octahedron, prism, sphere and tube. All collision objects had the same bounding box dimensions: 50 cm (length) × 50 cm (width) × 50 cm (height), located in the centre of the vir-tual room (x = 0, y = 0) with the bottom surface placed at z = 0.
In addition to the collision objects’ geom-etry, the type of fabric also varied. Ten different types of virtual „material” with default parameter settings were selected from the software database: cashmere, cotton, flannel, leather, polyester, rubber, satin, silk, spandex and wool. Only some of the parameters shown in Table 1 may correspond to mechanical properties of actual fabrics (UV bend, thickness, shear, density), but the magnitude of this cor-relation is unfortunately not disclosed to the user. The parameters are internal pa-
in the four corners with coordinates xlight1 = -100, ylight1 = 105, zlight1 = 200, xlight2 = -100, ylight2 = -105, zlight2 = 200,
The scene (Figure 1) consisted of a square virtual room with four stand-ard omni lights positioned diagonally
Figure 1. Scene setting: A) collision object with fabric, B) and C) target cameras.
Figure 3. Cotton draping as a function of the collision object’s geometry (top) and drapes on a dodecahedron as a function of fabric mate-rial (bottom).
Figure 2. Basic collision objects’ geometric parameters: length (l), height (h), width (w), radius (r).
A)
B)
C)

95FIBRES & TEXTILES in Eastern Europe 2015, Vol. 23, 6(114)
rameters of the software’s Cloth modifier [34] and are, with the exception of the pa-rameter density, whose values are given in g/cm2, dimensionless. UV bend refers to the fabric’s resistance to bending; the higher this value is set, the less the fabric will be able to bend. U B-Curve and U B-Curve are related to the resist-ance to bending when the fabric folds. UV stretch and shear denote resistance to stretching and shearing, respectively. Density is the weight of the fabric per unit area. Damping represents the de-gree of fabric „sluggishness”: fabric with more damping will come to rest sooner than one with less damping. Thickness defines the virtual thickness of a fabric for the purpose of detecting cloth-to-cloth collisions. Repulsion is related to the amount of force used to repel other fabric objects. Air resistance refers to the fabric resistance to air. Dynamic fric-tion and static friction denote correspond-ing frictions between the fabric and solid objects, while self friction represents friction between the fabric and itself.
The 3D drape simulation procedure con-sisted of several steps. First a simple
plane object (length = 100 cm, width = 100 cm) consisting of 2500 rectangular segments was transformed into a dynam-ic object by the software’s cloth modifier. Next two external forces were taken into account: gravity and collision. The latter was simulated using a collision test, i.e. the free fall of a fabric from a height of 75 cm onto a 50 cm high collision object. Only the last – 100th – frame of the 3D simulation was used in further analysis.
Simulations were rendered from the top viewport, thus allowing, as with conven-tional drapemeters, analysis of a 2D pro-jection of fabric drapes. Rendering was accomplished by the software’s default rendering engine (Scanline) and default settings without advanced rendering op-tions.
As an example of the resulting 2D pro-jections of the final, i.e. 100th, frame of each of the 90 (= 9 collision objects × 10 fabrics) renderings, Figure 3 shows cot-ton drape as a function of the collision object’s geometry (top row) and drapes on a dodecahedron as a function of fab-ric material (bottom row). In addition,
the number of folds was recorded for each collision object / fabric material pair (Table 2).
Image processing steps were then car-ried out on the 90 renderings obtained. First eleven typical 2D shape descriptors [35] were extracted from the boundaries (contours) of the images rendered: area, eccentricity, equivalent diameter, extent, form factor, major axis length, major by minor, minor axis length, orientation, perimeter, and solidity (Table 3). Next boundaries were converted into their 1D representations – known as signatures – by computing the centroid of a given boundary shape followed by plotting the distance from the centroid to the boundary r as a function of the polar an-gle θ (Figure 4). These 1D shape descrip-tors can be regarded as characteristic fin-gerprints for individual collision object/ fabric material combinations. Data for both 1D and 2D shape descriptors were finally subject to PCA to investigate the complex interrelationships among the fabric materials, collision objects and the corresponding shape descriptors more in detail. The results are presented and discussed in the following sections.
Table 1. Virtual fabric parameter settings used in the study. Codes for individual fabric materials are given in parentheses.
Parameter Cashmere(F1)
Cotton(F2)
Flannel(F3)
Leather(F4)
Polyester(F5)
Rubber(F6)
Satin(F7)
Silk(F8)
Spandex(F9)
Wool(F10)
UV Bend 4 25 125 200 65 5 35 15 20 85U B-Curve 0.00 0.00 0.00 0.00 0.00 0.25 0.00 5.00 0.01 0.00V B-Curve 0.00 0.00 0.00 0.00 0.00 0.25 0.00 5.00 0.10 0.00UV Stretch 15 75 250 400 25 1 5 25 35 100Shear 10.0 225.0 500.0 500.0 10.0 0.5 1.0 75.0 83.9 200.0Density 0.001 0.010 0.050 0.075 0.005 0.005 0.001 0.005 0.007 0.009Damping 0.01 0.10 0.10 0.10 0.01 0.10 0.01 0.01 0.10 0.50Thickness 0.0 0.2 0.6 0.7 0.0 1.0 0.0 9.0 0.0 0.9Repulsion 1 2 1 3 1 1 1 1 1 2Air resistance 0.001 0.020 0.010 0.010 0.020 0.050 0.010 0.015 0.005 0.020Dynamic friction 0.3 0.1 0.3 0.3 0.3 0.4 0.1 0.1 0.3 0.6Static friction 0.5 0.5 0.6 0.5 0.5 0.6 0.3 0.2 0.6 0.8Self friction 0.50 0.50 0.75 0.40 0.60 0.80 0.20 0.10 0.70 1.00
Table 2. Number of folds found for an individual collision object / fabric material combinations. MEAN and STDEV refer to the mean and standard deviation values, respectively.
Object/Fabric Cashmere Cotton Flanell Leather Polyester Rubber Satin Silk Spandex Wool MEAN STDEVCone 8 10 10 9 6 12 4 8 9 7 8.3 2.3Cube 6 8 8 8 6 8 4 4 8 6 6.6 1.6Cylinder 10 14 12 12 8 12 5 8 11 9 10.1 2.6Dodecahedron 10 10 11 10 6 12 4 10 10 8 9.1 2.4Gengon 12 12 12 10 8 12 6 10 12 8 10.2 2.2Octahedron 8 8 8 8 8 8 4 8 8 8 7.6 1.3Prism 5 7 5 7 5 8 3 5 5 5 5.5 1.4Sphere 11 10 12 10 6 12 4 8 11 7 9.1 2.7Tube 12 12 12 11 8 12 4 10 12 8 10.1 2.7
MEAN 9.1 10.1 10.0 9.4 6.8 10.7 4.2 7.9 9.6 7.3STDEV 2.5 2.3 2.5 1.6 1.2 2.0 0.8 2.1 2.3 1.2

FIBRES & TEXTILES in Eastern Europe 2015, Vol. 23, 6(114)96
of the respective collision objects. If we keep the collision object constant and allow the fabric material to change (Figure 3, bottom), however, differenc-es among the renderings become much smaller and are evidently caused by in-ternal characteristics of the material it-self. By transforming the shapes of the objects located in the final frames of the collision object/fabric material rendered images into 2D and 1D descriptors fol-lowed by PCA, we wanted to further explore this complex multivariate data system.
If we first focus on the PC1-PC2 scores plot for 2D shape descriptors (Figure 5), we can immediately observe the clus-tering of several (groups of) data points corresponding to collision object/fabric material pairs. For example, cube-based drapes located on the right-hand side of the diagram, especially Polyester-Cube (F5), Satin-Cube (F7), Wool-Cube (F10), and Silk-Cube (F8) are characterized by high values of their perimeter, ma-jor axis length, minor axis length, area and equivalent diameter, since these 2D descriptors are located in similar posi-tions, i.e. on the right-hand side, of the PC1-PC2 loadings plot (Figure 7). Simi-lar conclusions can be made regarding the drapes on an octahedron, such as Rubber-Octahedron (F6), Spandex-Octa-hedron (F9), Cotton-Octahedron (F2) and descriptors solidity, form factor and ori-entation due to their location on the left-hand side of Figures 5 and 7. Likewise, drapes created on a prism – most notably Flannel-Prism (F3), Spandex-Prism (F9), Leather-Prism (F4), and Cotton-Prism (F2) – form another group of data points that share a common pattern: high values of eccentricity and major by minor (bot-tom parts of scores and loadings plots). Drapes on the remaining six collision
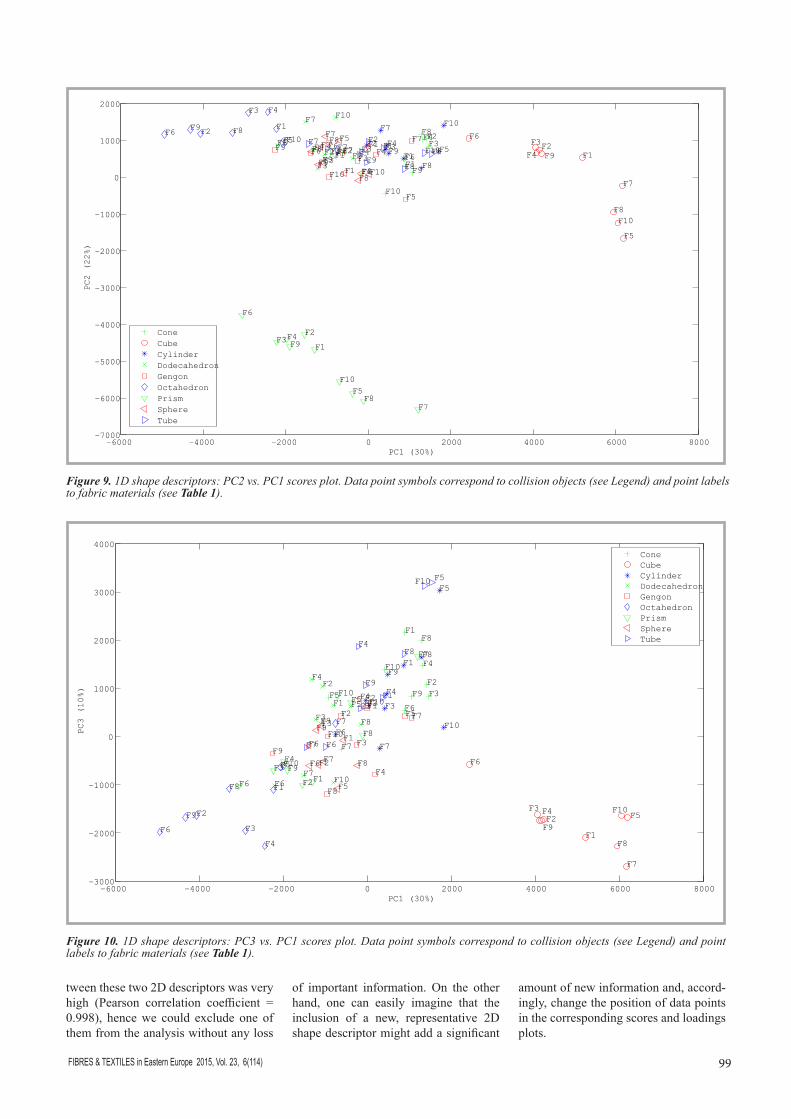
90 samples x 3100 variables (distances r at 3100 discrete, evenly spaced polar an-gle θ values), are displayed in Figures 9 and 10. The extraction of PCs was carried out on the covariance matrix, i.e. using the original data. Symbol, colour and la-bel coding of the samples is the same as with 2D shape descriptors. Here we are only interested in PC1 - PC2 and PC1 - PC3 scores plots, while the correspond-ing loading plots are irrelevant for our discussion and are not displayed. PC1, PC2 and PC3 together explain 62% (30% + 22% + 10%) of the total data variance.Figure 11 contains PC1-PC2 scores plots for each of the nine collision objects used in the study. See the Discussion for the interpretation of these diagrams.
n Discussion As demonstrated by the single-fabric material – i.e. cotton – visualization example (Figure 3, top), the shape of the fabric on the images rendered is strongly influenced by the geometry
n ResultsTable of 90 collision object/fabric mate-rial combinations (samples) and 11 2D shape descriptors were transformed by PCA, resulting in the scores and loadings plots presented in Figures 5, 6 and 7. Note that the PCs were extracted based on the correlation matrix, i.e. the variables were standardised prior to performing the analysis to compensate for differenc-es in the ranges of original variables. In order to ease interpretation of the scores plots, the individual samples are given different symbols and colours according to the collision objects they refer to, while labels F1, F2, …, F10 correspond to in-dividual fabric materials (see Table 1). The first three PCs, as can be seen from Figure 8, which shows the contribution of original variables to PCs, cumulative-ly account for roughly 86% (39% + 28% + 19%) of overall data variance.
PCA results for the dataset of 1D shape descriptors, i.e. of the table consisting of
Figure 4. From the 2D to 1D boundary representation: distance from the centroid to the boundary r as a function of the polar angle θ for the Cotton-Sphere combination.
Table 3. 2D shape descriptors used in the study.
Shape descriptor Range Explanation Computation formulaArea, px2 276696 - 662423 Number of pixels in the region. -Eccentricity, - 0.029 - 0.572 Ratio of the distance between the foci of the ellipse and its major axis length. -Equivalent diameter, px 594 - 918 Diameter of a circle with the same area as the region. (4*Area/pi)1/2
Extent, - 0.315 - 0.666 Ratio of pixels in the region to pixels in the total bounding box. Area/Bounding box areaForm factor, - 0.256 - 0.754 Measure of circularity. 4*pi*Area/Perimeter2
Major axis length, px 623 - 1114 Length (in pixels) of the major axis of the ellipse that has the same normalized second central moments as the region. -
Major by minor, - 1.000 - 1.219 Ratio of major axis length to minor axis length. Major axis length/Minor axis length
Minor axis length, px 602 - 977 Length (in pixels) of the minor axis of the ellipse that has the same normalized second central moments as the region. -
Orientation, deg -88.2 - 76.4 Angle (in degrees ranging from -90 to 90) between the x-axis and the major axis of the ellipse that has the same second moments as the region. -
Perimeter, px 2760 - 4736 Distance around the boundary of the region. -Solidity, - 0.539 - 0.945 Proportion of the pixels in the convex hull that are also in the region. Area/Convex area
dist
ance
r
angle θ

97FIBRES & TEXTILES in Eastern Europe 2015, Vol. 23, 6(114)
objects – cone, cylinder, dodecahedron, gengon, sphere, and tube – are located more or less centrally without any clear
pattern, therefore indicating a resem-blance in terms of their shape descrip-tors. These results are in perfect agree-
ment with Figure 3, which shows very similar circular shapes of cotton-based drapes for these six collision objects. On
Figure 5. 2D shape descriptors: PC2 vs. PC1 scores plot. Data point symbols correspond to collision objects (see Legend) and point labels to fabric materials (see Table 1).
−6 −4 −2 0 2 4 6−6
−5
−4
−3
−2
−1
0
1
2
3
4
PC1 (39%)
PC2 (28%)
F1
F1
F1
F1
F1
F1
F1
F1
F1
F2
F2
F2
F2
F2
F2
F2
F2F2 F3
F3
F3
F3
F3
F3
F3
F3
F3 F4
F4
F4
F4
F4
F4
F4
F4
F4
F5F5
F5
F5
F5
F5
F5
F5
F5F6
F6
F6F6
F6F6
F6
F6
F6
F7F7
F7
F7
F7
F7
F7
F7
F7 F8
F8
F8
F8
F8F8
F8
F8
F8
F9
F9
F9
F9
F9F9
F9
F9 F9
F10
F10
F10
F10
F10
F10
F10
F10
F10
ConeCubeCylinderDodecahedronGengonOctahedronPrismSphereTube
−6 −4 −2 0 2 4 6−5
−4
−3
−2
−1
0
1
2
3
4
PC1 (39%)
PC3 (19%)
F1F1
F1
F1
F1
F1
F1
F1
F1 F2
F2
F2
F2
F2F2
F2
F2
F2F3
F3
F3
F3
F3
F3
F3F3
F3
F4
F4
F4
F4
F4
F4
F4F4
F4
F5F5
F5
F5
F5
F5
F5
F5
F5
F6
F6
F6F6
F6
F6
F6F6
F6
F7F7
F7
F7
F7F7
F7
F7
F7
F8
F8
F8
F8
F8
F8
F8
F8
F8
F9F9
F9
F9
F9F9
F9F9
F9
F10
F10
F10
F10
F10
F10
F10
F10
F10
ConeCubeCylinderDodecahedronGengonOctahedronPrismSphereTube
Figure 6. 2D shape descriptors: PC3 vs. PC1 scores plot. Data point symbols correspond to collision objects (see Legend) and point labels to fabric materials (see Table 1).

FIBRES & TEXTILES in Eastern Europe 2015, Vol. 23, 6(114)98
the other hand, drape shapes involv-ing the other three collision objects – the cube and octahedron with their square-like and prism with its triangle-like geometries – are distinctly different.
Further relationships and associations among individual 2D shape descriptors
become apparent when one examines Figure 8, where their contributions to PC1, PC2, PC3 and to the sum of PC4 to PC11 – residuals – are shown graphi-cally. PC1 can be almost entirely rep-resented by the five strongly correlated descriptors mentioned above, with high positive projections (loadings between
0
0.2
0.4
0.6
0.8
1
Area
Maj
orAx
isLe
ngth
Min
orAx
isLe
ngth
Ecce
ntric
ity
Orie
ntat
ion
Equi
vDia
met
er
Solid
ity
Exte
nt
Perim
eter
Form
Fact
or
Maj
orBy
Min
or
Con
tribu
tion
PC1 (39%) PC2 (28%) PC3 (19%) Residuals (14%)
Figure 8. Contribution of individual 2D shape descriptors to the first three PCs. The term Residuals refers to the descriptors’ contribution to higher, less important PCs (PC4 to PC11).
0.4 and 0.5, see Figure 7) to this PC: area, major axis length, minor axis length, equivalent diameter and perim-eter. Next solidity is the descriptor with the biggest contribution to PC2; extent also has a high PC2 loading, but con-tributes significantly to higher PCs that explain far less data variability. Finally eccentricity and major by minor are heavily correlated (Pearson correla-tion coefficient = 0.966) descriptors with similarly strong contributions to both PC2 and PC3 (compare Figure 7 left and right). Orientation seems to be the only 2D shape descriptor that does not carry any important information about our system and could probably be omitted.
When performing PCA on 1D shape de-scriptors – signatures – rather than on 2D descriptors, the general constellation of PC1-PC2 object/fabric pairs shown in Figure 9 does not differ significantly from that displayed in Figure 5. Again, drapes on a cube, octahedron and prism behave in a distinctively different man-ner compared to those produced using the other six collision objects, and form clusters of points that are even more clearly separated from the remaining data cloud in the upper-central part of Figure 9. Minor but important differ-ences between results for 2D and 1D de-scriptors, however, exist and are mainly due to the following reason: Our selec-tion of 2D descriptors that would hope-fully successfully represent characteris-tics of individual collision object/fabric material combinations was somewhat ar-bitrary. For instance, as shown in Figure 7, it turned out that the choice of both area and equivalent diameter was unnec-essary, since the linear correlation be-
−0.2 −0.1 0 0.1 0.2 0.3 0.4 0.5−0.4
−0.3
−0.2
−0.1
0
0.1
0.2
0.3
0.4
0.5
PC1 (39%)
PC2
(28%
)
Area
MajorAxisLengt
MinorAxisLeng
Eccentricity
Orientation EquivDiameter
SolidityExtent
Perimeter
FormFactor
MajorByMinor−0.2 −0.1 0 0.1 0.2 0.3 0.4 0.5
−0.5
−0.4
−0.3
−0.2
−0.1
0
0.1
0.2
0.3
PC1 (39%)
PC3
(19%
)
Area
MajorAxisLengt
MinorAxisLeng
Eccentricity
Orientation
EquivDiameterSolidity
Extent
Perimeter
FormFactor MajorByMinor
Figure 7. 2D shape descriptors: loadings plots PC2 vs. PC1 (left) and PC3 vs. PC1 (right).
99FIBRES & TEXTILES in Eastern Europe 2015, Vol. 23, 6(114)
tween these two 2D descriptors was very high (Pearson correlation coefficient = 0.998), hence we could exclude one of them from the analysis without any loss
of important information. On the other hand, one can easily imagine that the inclusion of a new, representative 2D shape descriptor might add a significant
amount of new information and, accord-ingly, change the position of data points in the corresponding scores and loadings plots.
−6000 −4000 −2000 0 2000 4000 6000 8000−3000
−2000
−1000
0
1000
2000
3000
4000
PC1 (30%)
PC3 (10%)
F1
F1
F1
F1 F1
F1F1
F1
F1F2
F2
F2F2
F2
F2
F2
F2
F2F3
F3
F3F3
F3
F3
F3
F3
F3
F4
F4
F4F4
F4
F4
F4
F4
F4
F5
F5
F5
F5F5
F5
F5
F5
F5
F6
F6
F6
F6
F6
F6
F6
F6
F6 F7
F7
F7
F7
F7F7
F7
F7F7
F8
F8
F8
F8
F8F8
F8
F8
F8
F9
F9
F9
F9
F9
F9
F9
F9
F9
F10
F10
F10
F10
F10
F10
F10F10
F10
ConeCubeCylinderDodecahedronGengonOctahedronPrismSphereTube
Figure 10. 1D shape descriptors: PC3 vs. PC1 scores plot. Data point symbols correspond to collision objects (see Legend) and point labels to fabric materials (see Table 1).
−6000 −4000 −2000 0 2000 4000 6000 8000−7000
−6000
−5000
−4000
−3000
−2000
−1000
0
1000
2000
PC1 (30%)
PC2
(22%
)
F1F1F1F1
F1
F1
F1
F1
F1F2
F2F2F2 F2
F2
F2
F2 F2 F3 F3F3
F3F3
F3
F3
F3F3
F4
F4F4F4 F4
F4
F4
F4
F4F5
F5
F5F5
F5
F5
F5
F5F5F6
F6
F6F6
F6
F6
F6
F6 F6 F7
F7
F7F7
F7F7
F7
F7F7
F8
F8
F8F8
F8F8
F8
F8F8F9
F9F9F9
F9
F9
F9
F9 F9
F10
F10
F10F10
F10
F10
F10
F10
F10
ConeCubeCylinderDodecahedronGengonOctahedronPrismSphereTube
Figure 9. 1D shape descriptors: PC2 vs. PC1 scores plot. Data point symbols correspond to collision objects (see Legend) and point labels to fabric materials (see Table 1).

FIBRES & TEXTILES in Eastern Europe 2015, Vol. 23, 6(114)100
−1000 −500 0 500 1000 1500−600
−400
−200
0
200
400
600
800
1000
1200
PC1 (30%)
PC2 (22%)
F1
F2
F3
F4
F5
F6
F7
F8
F9
F10
Cone
2000 2500 3000 3500 4000 4500 5000 5500 6000 6500−2000
−1500
−1000
−500
0
500
1000
1500
PC1 (30%)
PC2 (22%)
F1F2F3
F4
F5
F6
F7
F8
F9
F10
Cube
−1000 −500 0 500 1000 1500 2000200
400
600
800
1000
1200
1400
1600
PC1 (30%)
PC2 (22%)
F1
F2F3F4
F5F6
F7
F8
F9
F10Cylinder
−2500 −2000 −1500 −1000 −500 00
200
400
600
800
1000
1200
1400
1600
1800
PC1 (30%)
PC2 (22%)
F1F2
F3
F4
F5
F6
F7
F8
F9
F10Dodecahedron
−2500 −2000 −1500 −1000 −500 0 500 1000 1500−800
−600
−400
−200
0
200
400
600
800
1000
PC1 (30%)
PC2 (22%)
F1
F2
F3
F4
F5
F6
F7F8
F9
F10
Gengon
−5000−4500−4000−3500−3000−2500−2000−1500−1000−500600
800
1000
1200
1400
1600
1800
PC1 (30%)
PC2 (22%)
F1
F2
F3 F4
F5
F6
F7
F8F9
F10
Octahedron
−4000 −3000 −2000 −1000 0 1000 2000−6500
−6000
−5500
−5000
−4500
−4000
−3500
PC1 (30%)
PC2 (22%)
F1
F2F3F4
F5
F6
F7F8
F9
F10
Prism
−1400 −1200 −1000 −800 −600 −400 −200 0 200−200
0
200
400
600
800
1000
1200
PC1 (30%)
PC2 (22%)
F1
F2
F3
F4
F5
F6
F7
F8
F9
F10
Sphere
−1500 −1000 −500 0 500 1000 1500 2000200
300
400
500
600
700
800
900
1000
PC1 (30%)
PC2 (22%)
F1
F2
F3
F4 F5
F6
F7
F8
F9
F10
Tube
Figure 11. 1D shape descriptors: PC2 vs. PC1 scores plots for individual collision objects. Data point symbols correspond to collision objects (see Legend) and point labels to fabric materials (see Table 1).
No such problems exist with 1D shape descriptors, since they are extracted di-rectly from the shape of the boundaries of object/fabric images, as explained in the Experimental part. Each signature can therefore be regarded as a virtually unique representation of that particular object/fabric pair. In order to more close-ly examine the effect of fabric material on drape simulation, we therefore decided to study PC1-PC2 scores plots based on 1D – rather than on 2D – shape descriptors separately for each of the nine collision objects (Figure 11). A detailed inspec-tion of these diagrams reveals that a very similar pattern can be found on (at least) six of these plots – those corresponding to a cube, cylinder, dodecahedron, octa-hedron, prism, and tube: rubber-based drapes can be found on the left-hand side; drapes on flannel, cashmere, cot-ton, leather, and spandex are located in the middle, and polyester, wool, and sometimes silk and/or satin on the right-hand side of each diagram. This finding is
in a very good agreement with the num-ber of folds that was found on individual drape simulations (Table 2); this number is on average the highest for rubber-based drapes and the lowest for those charac-terized by the four fabric materials men-tioned above. An explanation for such a behavior can be found in the fact that virtual polyester, wool, silk and satin tend to form comparatively higher bending stiffness, while rubber is an example of a very elastic, deformable „material” that tends to create many folds when in con-tact with a collision object. When looking at the software’s internal parameters (Ta-ble 1), one can see that there is no evident explanation for similarities between poly-ester, silk and wool based virtual fabric, whereas rubber deviates from the rest of the textiles with respect to the following characteristics: UV stretch/compress, shear, air resistance and self friction. It has to be emphasized, however, that these „software” parameters correspond only to a limited extent to the real physical
characteristics of the actual fabric ma-terials, such as weave type, elongation or bending. Nevertheless the results of the research presented provide valuable insights into the behavior of various „ma-terials” under (simulated) collision condi-tions of a selected software simulator.
n ConclusionsOur study demonstrates that the 1D and 2D shape descriptors selected can suc-cessfully characterize drape simulation renderings in dependence on the two factors studied: geometry of collision objects and fabric type. PCA performed on 2D descriptors revealed that PC1 was almost entirely represented by five highly correlated descriptors: area, major axis length, minor axis length, equivalent diameter and perimeter; solidity was the descriptor with the biggest contribu-tion to PC2, while eccentricity and major by minor were heavily correlated descrip-

101FIBRES & TEXTILES in Eastern Europe 2015, Vol. 23, 6(114)
tors with similarly strong contributions to both PC2 and PC3.
The collision object’s geometry was identified as the key parameter determin-ing the shape of the virtual fabrics. In par-ticular, cube, octahedron and prism-based fabrics were found to be distinctively dif-ferent from those using the remaining six objects. Although fabric material played a subordinate role, a closer analysis (PCA of 1D descriptors) revealed that drapes on rubber polyester, wool, and silk and/or satin produced image shapes that differed markedly from those associated with the other material types. It remains to be seen if experiments with real fabrics can confirm these findings.
References1. Plumlee TM, Eischen J, Kenkare N,
Pandurangan P. Evaluating 3D Drape Simulations: Methods and Metrics, 2003. http://www.ncsu.edu/project/ntcprojects/projects/F02-S08/Paper_Indedec_Sept03.pdf.
2. Magnenat-Thalmann, N. (Ed.). Modeling and Simulating Bodies and Garments. 1st ed. London: Springer-Verlag, 2010, p. 71-128.
3. Kočevar TN, Gabrijelčič Tomc H. Comparison of 3D Textile Simulations with Evaluation of Usability of Two Applications and Image Analysis of Renderings. Tekstilec 2013; 56(4): 323–334.
4. Dhande SG, Rao PVM, Tavakkoli S, Moore CL. Geometric Modeling of Draped Fabric Surfaces. In: IFIP TC5/WG5.2/WG5.10 CSI International Conference on Computer Graphics: Graphics, Design and Visualization, Amsterdam, North Holland, 1993, pp. 349-356.
5. Weil J. The synthesis of Cloth object. Computer Graphics (Proc Siggraph) 1986; 20(4): 49−54.
6. Feynman CR. Modelling the Appearance of Cloth. Master dissertation. Massachusetts Institute of Technology, Cambridge, UK, 1986.
7. Terzopoulos D, Platt J, Barr A, Fleisher K. Elastically deformable models. Computer Graphics 1987; 21(4): 205-214.
8. Collier JR, Collier BJ, O’Toole G, Sargand SM. Drape Prediction by means of Finite-element Analysis. Journal of Textile Institute 1991; 82(1): 96-107.
9. Kang TJ, Yu WR. Drape Simulation of Woven Fabric by Using the Finite-element Method. The Journal of The Textile Institute 1995; 86(4): 635-648.
10. Sul IH, Kang TJ. Improvement of drape simulation speed using constrained fabric collision. International Journal of Clothing Science and Technology 2004; 16(1/2): 43-50.
11. Breen ED, House HD, Wozny JM. Predicting the drape of woven cloth using interacting particles. In: SIGGRAPH ‘94, New York, USA, 1994, pp. 365-372.
12. Eberhardt B, Weber A, Strasser W. A fast flexible particle system model for cloth draping. IEEE, Computer Graphic and Application 1996; 16(5) : 51−59.
13. Baraff D, Witkin A. Large steps in cloth simulation. In: SIGGRAPH’ 98. Computer Graphics, Annual Conference Series. Orlando, July 19–24, 1998, pp. 43−54; http://www.cs.cmu.edu/~baraff/papers/sig98.pdf.
14. Hu J. (Ed.). Fabric testing (1st ed.). Woodhead Publishing Series in Textiles (Boca Raton), 2008, pp. 114-117.
15. BS 5058:1973. British Standards Institution. Method for the assessment of drape fabrics. London: British Standard Institution.
16. Žunič Lojen D, Jevšnik S. Some aspects of fabric Drape. Fibres & Textiles in Eastern Europe 2007; 15(63): 39-45.
17. Mizutani C, Amano T, Sakaguchi Y. A new apparatus for the study of fabric drape. Textile Research Journal 2005; 75(1): 81–87.
18. Cusic GE. The Measurement of Fabric Drape. Journal of Textile Institute 1968; 56(11): 253−260.
19. Sanad R, Cassidy T, Cheung V. Fabric and Garment Drape Measurement - Part 1. Journal of Fibre Bioengineering & Informatics 2012; 5(4): 341–358.
20. Sanad R, Cassidy T, Cheung V, Evans E. Fabric and Garment Drape Measurement - Part 2. Journal of Fibre Bioengineering and Informatics 2013; 6(1): 1-22.
21. Jeong YJ. A Study of Fabric-drape Behaviour with Image Analysis Part I: Measurement, Characterisation, and Instability. Journal of the Textile Institute 1998; 89(1): 59−69.
22. Jeong YJ, Phillips DG. A Study of Fabric-drape Behaviour with Image Analysis. Part II: The Effects of Fabric Structure and Mechanical Properties on Fabric Drape. Journal of the Textile Institute 1998; 89(1): 70−79.
23. Kenkare N, Plumlee TM. Fabric Drape Measurements: a modified Method Using Digital Image Processing. Journal of Textile and Apparel, Technology and Measurement 2005; 4(3): 1-8; h t t p : / / f acu l t y.mu .edu . sa /pub l i c /uploads/1345907225.1717Plumlee_full_148_05.pdf.
24. Behera BK, Mishra R. Objective measurement of fabric appearance using digital image processing. Journal of Textile Institute 2006; 97(2): 147-153.
25. Hamdi T, Ghith A, Fayala F. Study of drape parameter using image analysis. International Journal of Engineering Science and Technology 2013; 5(7): 1456− 1464.
26. Gnanavel P, Ananthakrishnan T. Development of a Three Dimensional Approach to Acquire a Drape Contour and Studies on Influential Factors. Fibres & Textiles in Eastern Europe 2013; 21(100): 137-143.
27. Farajikhah S, Madanipour K, Saharkhiz S, Latifi M. Shadow Moiré Aided 3-D Reconstruction of Fabric Drape. Fibres and Polymers 2012; 13(7): 928-935.
28. Mirjalili, S., A., Ekhtiyari, E. Wrinkle Assessment of Fabric Using Image Processing, Fibres & Textiles in Eastern Europe 2010; 18(82): 60-63.
29. Tien-Wei S, Pin-Ning W, Jer-Yan L. Subjective and Objective Evaluation Methods to defined the Peack-trough Treshold of the Drape Fabric Node. Textile Research Journal 2009; 79(13): 1223-1234.
30. Payvandy P. Evaluation of Fabric Drape Coefficient Using Image Processing and Fractal Dimension. In: MVIP 2011; 7th Iranian conference on machine vision and image processing, Iran University of Science and Technology, 16-17 November 2011; http://www.pedram-payvandy.com/paper/conf33.pdf.
31. Jolliffe IT. Principal Component Analysis. 2nd ed. Series: Springer Series in Statistics, Springer, NY, 2002, p. 28.
32. Hamdi T, Ghith A, Fayala F. A Principal Component Analysis (PCA) Method for predicting the Correlation between some fabric Parameters and the Drape. AUTEX Research Journal 2014; 14(1): 22-27.
33. Bouman KL, Xiao B, Battaglia P, Freeman WT. Estimating the material properties of fabric from video. In: Computer Vision (ICCV), 2013 IEEE International Conference. Massachusetts Inst. of Technol., Cambridge, MA, USA, 2013. p. 1984-1991. http://people.csail.mit.edu/klbouman/pw/papers_and_presentations/iccv2013_bouman.pdf.
34. Cloth properties, 3ds Max, Autodesk; http://docs.autodesk.com/3DSMAX/15/ENU/3ds-Max-Help/index.html?url=files/GUID-0067DEB6-968E-4CD8-B019-C0E638CFA151.htm,topicNumber=d30e73198.
35. Properties of image regions, MATLAB; h t tp : / /www.mathworks .com/he lp /images/ref/regionprops.html.
Received 07.01.2015 Reviewed 22.04.2015