COMPARISON OF BOREHOLE AND SURFACE RESISTIVITY · PDF fileCOMPARISON OF BOREHOLE AND SURFACE...
27
GEOTHERMAL TRAINING PROGRAMME Reports 2013 Orkustofnun, Grensasvegur 9, Number 14 IS-108 Reykjavik, Iceland 261 COMPARISON OF BOREHOLE AND SURFACE RESISTIVITY AT THEISTAREYKIR, NE-ICELAND Long Hui Centre for Hydrogeology and Environmental Geology Survey China Geological Survey Qiyi Middle Road 1305, Baoding 071051 CHINA [email protected] ABSTRACT Resistivity logs from five boreholes in the Theistareykir high-temperature geothermal field and resistivity from surface exploration are compared in this report. The resistivity is also compared to the first appearance of alteration minerals. The available resistivity logs from each section of drilling are combined for each well and inserted into Petrel, a 3D modelling software, for viewing geological and geophysical data. A 3D model of the resistivity which had previously been found by 3D inversion of MT soundings from field work performed by ÍSOR had previously been inserted into Petrel. The resistivity well logs are averaged to the same resolution as the TEM and MT model. The previous study of TEM and MT resistivity from Theistareykir shows a conventional resistivity structure for a high-temperature geothermal system in Iceland, consisting of a low resistivity cap underlain by a high- resistivity core in the uppermost 2 km and a deep seated low-resistivity layer. The resistivity in boreholes and resistivity from the inversion of TEM and MT have slight differences but, in general, show a very good correlation in all of the studied wells. The study also confirmed what had previously been shown that lower resistivity was linked with smectite-zeolite zonation and the higher resistivity with chlorite and epidote-amphibole deeper down in the wells, which show alteration with increasing temperature, respectively. 1. INTRODUCTION The Theistareykir high-temperature geothermal field is located in the volcanic zone in NE-Iceland and has abundant geothermal surface manifestations (Figure 1). The active part of the geothermal area is located in the eastern part of the Theistareykir fissure swarm. Hydrothermal alteration is also evident on the western side of the swarm, but surface thermal activity seems to have died out there some 1000 years ago (Grönvold and Karlsdóttir, 1975). The geothermal activity covers a 10.5 km 2 area; the most intense activity is on the northwest and northern slopes of Mt. Baejarfjall and in the pastures extending from there northwards to the western part of Mt. Ketilfjall. If the old alteration in the western part of the swarm is considered to be a part of the thermal area, its coverage is nearly 20 km 2 (Ármannsson et al., 1986; Saemundsson, 2007).
Transcript of COMPARISON OF BOREHOLE AND SURFACE RESISTIVITY · PDF fileCOMPARISON OF BOREHOLE AND SURFACE...

GEOTHERMAL TRAINING PROGRAMME Reports 2013 Orkustofnun, Grensasvegur 9, Number 14 IS-108 Reykjavik, Iceland
261
COMPARISON OF BOREHOLE AND SURFACE RESISTIVITY
AT THEISTAREYKIR, NE-ICELAND
Long Hui Centre for Hydrogeology and Environmental Geology Survey
China Geological Survey Qiyi Middle Road 1305, Baoding 071051
CHINA [email protected]
ABSTRACT
Resistivity logs from five boreholes in the Theistareykir high-temperature geothermal field and resistivity from surface exploration are compared in this report. The resistivity is also compared to the first appearance of alteration minerals. The available resistivity logs from each section of drilling are combined for each well and inserted into Petrel, a 3D modelling software, for viewing geological and geophysical data. A 3D model of the resistivity which had previously been found by 3D inversion of MT soundings from field work performed by ÍSOR had previously been inserted into Petrel. The resistivity well logs are averaged to the same resolution as the TEM and MT model. The previous study of TEM and MT resistivity from Theistareykir shows a conventional resistivity structure for a high-temperature geothermal system in Iceland, consisting of a low resistivity cap underlain by a high-resistivity core in the uppermost 2 km and a deep seated low-resistivity layer. The resistivity in boreholes and resistivity from the inversion of TEM and MT have slight differences but, in general, show a very good correlation in all of the studied wells. The study also confirmed what had previously been shown that lower resistivity was linked with smectite-zeolite zonation and the higher resistivity with chlorite and epidote-amphibole deeper down in the wells, which show alteration with increasing temperature, respectively.
1. INTRODUCTION The Theistareykir high-temperature geothermal field is located in the volcanic zone in NE-Iceland and has abundant geothermal surface manifestations (Figure 1). The active part of the geothermal area is located in the eastern part of the Theistareykir fissure swarm. Hydrothermal alteration is also evident on the western side of the swarm, but surface thermal activity seems to have died out there some 1000 years ago (Grönvold and Karlsdóttir, 1975). The geothermal activity covers a 10.5 km2 area; the most intense activity is on the northwest and northern slopes of Mt. Baejarfjall and in the pastures extending from there northwards to the western part of Mt. Ketilfjall. If the old alteration in the western part of the swarm is considered to be a part of the thermal area, its coverage is nearly 20 km2 (Ármannsson et al., 1986; Saemundsson, 2007).

Long Hui 262 Report 14
There are nine geothermal exploration wells in the Theistareykir geothermal field, five of which are involved and processed in this project, ThG-01, ThG-02, ThG-03, ThG-04 and ThG-09. ThG-01, ThG-02, ThG-03 and ThG-09 are vertical wells and ThG-04 is a directional well. The main purpose of this project was to compare resistivity in boreholes to resistivity from surface exploration at Theistareykir in NE-Iceland (Figure 2). The well logs were compared to a 3D resistivity model from a previous study found by inversion of TEM and MT electromagnetic soundings (Karlsdóttir et al., 2012). The well logs in the five boreholes which had been collected in different sections of drilling were depth corrected and combined to form a continuous well log for the relevant wells. The resistivity of the basaltic rock was found to have a strong relationship to hydrothermal alteration which is mainly dependent on formation temperature (e.g. Árnason et al., 1987; 2000). Therefore, the relationship between hydrothermal alteration and resistivity was also studied. 2. BACKGROUND 2.1 Geology of Iceland The world's known geothermal resources are mainly located in three main areas: 1) Circum Pacific geothermal belt, from the Mid-Atlantic ridge eastwards across the Mediterranean; 2) the Middle East to Yunnan, China, Tibet geothermal belt; and 3) the African Great Rift Valley and the Red Sea Rift Valley geothermal belt (Lu et al., 2012). These zones are active crustal anomalies, including volcanoes and earthquakes. Iceland belongs to the Mid-Atlantic ridge geothermal belt in the North Atlantic area near the Arctic Circle. This is the boundary between the North American and Eurasian tectonic plates. The two plates are moving apart at a rate of about 2 cm per year. As a result of its location, Iceland is one of the most tectonically active places on Earth, resulting in a large number of volcanoes and hot springs.
FIGURE 1: The location of Theistareykir high-temperature field in NE-Iceland in the eastern

Report 14 263 Long Hui
Earthquakes are frequent, but rarely cause serious damage due to strict building regulations. More than 200 volcanoes are located within the active volcanic zones (Björnsson et al., 2010) stretching through the country from the southwest and south to the northeast, shown in Figure 1. At least 30 of them have erupted since the country was settled. In the western belt 12 high-temperature geo-thermal fields are located from Reykjanes to Langjökull and Hofs-jökull; 17 high-temperature geothermal fields are located in the eastern belt from Vestmannaeyjar, Mýr-dalsjökull, and Vatna-jökull to Krafla and Theistareykir. In the volcanic zones there are at least 20 high-temperature areas containing steam fields with underground tempe-ratures reaching 200°C within 1000 m depth (Figure 1). These areas are directly linked to the active volcanic systems. About 250 separate low-temperature areas with temperatures not exceeding 150°C in the uppermost 1000 m are found mostly in the areas flanking the active zone. To date, over 600 hot springs with temperature over 20°C have been located (Björnsson et al., 2010). It can be seen from Figure 1 that all of the high-temperature geothermal fields are located within the active volcanic zones passing through Iceland (shown in brown colour) where the bedrock is very young geologically or less than 0.8 million years. The low-temperature geothermal fields are located outside the active volcanic zones. The most exploited fields are crowded together in the southwest of Iceland and the others are found almost all over the country. The bedrocks in the low temperature areas are older than the active volcanic zones where the high-temperature geothermal areas are located.
FIGURE 2: A geothermal map of the Theistareykir geothermal system and division into five sub-areas (adapted from Saemundsson, 2007;
and Ármannsson et al., 1986)

Long Hui 264 Report 14
2.2 Geology at Theistareykir The regional geology has been described in detail by Saemundsson (2007) that added to, and expanded on, the work of Torfason in Gíslason, et al. (1984). The local geology is summarized in Figure 2, adapted from Saemundsson (2007). The area is covered in lavas all of which, except for one, which originate from eruptions in the last stages of the Ice Age or shortly afterwards. The bedrock at Theistareykir area is divided into breccia (hyaloclastites) ridges formed by sub-glacial eruptions during the ice age, interglacial lava flows, and recent lava flows (younger than 10,000 years), all of which are basaltic (Ármannsson et al., 1986). The oldest hyaloclastite formations in the region are exposed in the west in Lambafjöll. In the vicinity of the geothermal centre at Theistareykir, Ketilfjall is the oldest hyaloclastite formation. It formed in a fissure eruption underneath the Quaternary ice-sheet on a 4 km long fissure, stretching from Lake Mývatn in the south and to the ocean in Öxarfjördur in the north (Saemundsson, 2007). Baejarfjall and Kvíhólafjöll are younger lavas or table-mountains formed by eruptions on short fissures or single volcanic events. The recent flows in the area are surprisingly old as only one of the flows is considered to be younger than 10,000 years old. This is Theistareykir lava (Figure 2) which is considered to be over 2500 years old. The lava flows have partially buried the sub-glacial table-mountains and ridges so their “roots” are hidden. The absence of younger volcanic products is intriguing when considering potential heat sources for the geothermal activity. Presumably intrusions at depth are providing the heat to drive the hydrothermal system. Ármannsson et al. (1986) divided the surface area with abundant geothermal manifestations into five sub-areas, shown in Figure 2, three of which (A, C and D) appeared promising for drilling; nine wells, five of which are included in this project, were drilled in these three sub-areas. 2.3 Borehole logging Geophysical well logging is done at the end of each drilled section of a borehole. In this project, 64" resistivity and 16" resistivity were mainly processed and studied while temperature, Caliper, gamma and Neutron-Neutron were partly processed and used to compare, and partly for depth correction. Two simultaneous resistivity measurements were made during the logging, 16" resistivity and 64" resistivity. The resistivity of the formation can be measured with several different measuring techniques at present. ÍSOR uses the so called normal configuration. The setup consists of four electrodes, two of which are fixed on the logging probe in the well (Stefánsson and Steingrímsson, 1990); the third one is placed at the surface (mud pit), and the armour of the logging cable is used as the fourth electrode. The two electrodes used for measuring the resistivity indirectly were located at 16" and 64" above a current electrode which was at the end of the cable (Haraldsdóttir et al., 2010). The 16" resistivity and 64" resistivity were calculated from a uniform current and measured the potential at the relevant electrode. The 16" resistivity was often higher than the 64" resistivity. The well logs penetrated the wall rock of the borehole, where the 64" resistivity showed a deeper penetration a little further into the formation than the 16" resistivity. The results were stored in two files as measured depth and a signal. Temperature logs were measured during and after drilling which were applied to locate feed zones and feed points and detect cross flow between aquifers. An important purpose of the temperature logs during drilling is to evaluate cooling due to injection of cold water into the well, and thereby obtain information to prevent other temperature sensitive logging tools from damage. In this project, formation temperatures from the ÍSOR database were used for getting a rough overview of the temperature in the area and view it in context with the results in the project. The formation temperatures had already been prepared by analysing the warm up temperature logs. The Caliper log is a measurement which can show information about a wells’ true diameter. The diameters from the Caliper log have often been shown to be larger than what the drill bit size would predict (Steingrímsson, 2011a). The Caliper logging probes are of many different types. The most

Report 14 265 Long Hui
common probes are with 3, 4 or 6 arms and up to tens of arms are used in special cases, for example inspection of the casing. The applications of the Caliper log are veryextensive, such as for the locations of cavities, evaluation of cementing, casing corrosion and casing damages, comparison of the Caliper logs with the lithological section of the borehole, and for finding the end of the casing in the logs to depth correct them in the presented project. ÍSOR uses 3 and 4 arms Caliper tools. From the 3 arms Caliper tool, the output is the averaged diameter at each depth, but the output from a 4 arms tool is X and Y diameters and can reveal if the well is elliptical and if possibly casing damages exist at some depth. The gamma ray log is a passive measurement, where a detector is lowered into the well to register the natural radiation from the surrounding geological formations (Steingrímsson, 2011b). The purpose of gamma ray logging is to distinguish between rock formations, while acidic rocks contain more radioactive isotopes or elements than basaltic rocks and sometimes an increase in gamma can be a sign of metamorphosed rocks. The neutron-neutron has one neutron source and one or two detectors, the latter one is called a dual neutron device (far and near sensors). Before processing the data, the units of gamma and neutron-neutron logs should first be checked for consistency in units, after which the logs are depth corrected. The logs are plotted in a graph with other geological wire line logs from the same well for evaluating the porosity of the formation and the geological sections found in the drill cuttings, distinguishing different rock types, determining the stratigraphy of the lithological section, thus identifying important information by comparing the different logs. 2.4 Boreholes at Theistareykir Extensive surface manifestations such as fumaroles, mud pools and sulphur deposition (Ármannsson, 2011) have been studied previously in the Theistareykir area (Figure 3). Detailed geological and geophysical surveys were carried out prior to drilling. A number of shallow wells were drilled to the depth of 100-200 m to survey groundwater patterns and to obtain a suitable source of cold water before drilling the deep exploration wells. Figure 3 reveals the locations and trajectories of drilled wells in the Theistareykir field at present and Table 1 shows information about the wells in the presented study, such as if the well is vertical or directional, time of drilling, total measured depth, elevation of the well top and finally the highest measured temperature and the corresponding measured depth in the well. Icelandic borehole reports show that Wells ThG-01, ThG-02 and ThG-03 are vertical wells drilled in 2002, 2003 and 2006 to the depth of 1953, 1723 and 2659 m, respectively. Well ThG-04 was drilled directionally in 2007, from the same well pad as Well ThG-01, towards the southeast beneath Mt. Baejarfjall, with a final depth of 2239 m. Wells ThG-05 to ThG-08 were not included in this project. Well ThG-09 was drilled as a vertical well with a final depth of 2194 m in 2012. The highest temperature and the corresponding depths are shown in Table 1, where it is clear that Well ThG-02 is the coldest of the wells in this study, but it is also shallow while the others have fairly similar temperatures.
TABLE 1: Information about boreholes in Theistareykir geothermal field
Well name
ID Type Drill time
Depth (m)
Elevation (m a.s.l.)
Highest temp(°C)/Depth(m)
ThG-01 60401 Vertical 2002 1953 352 331.6/1933 ThG-02 60402 Vertical 2003 1723 330 241.6/1697 ThG-03 60403 Vertical 2006 2659 400 380.1/2633 ThG-04 60404 Directional 2007 2239 352 319.5/2213 ThG-09 60409 Vertical 2012 2194 350 345.0/2163

Long Hui 266 Report 14
3. PREVIOUS STUDIES 3.1 Surface exploration Surface exploration started in the 1970s and continued intermittently to the middle of the 1980s (Gíslason et al., 1984). In the late 1990s, interest in the field increased again and the first deep exploratory well was drilled in the summer of 2002 (Table 1). Concomitant with exploratory drilling, additional field surveys were undertaken including TEM (Karlsdóttir et al., 2006) and MT (Karlsdóttir et al., 2012), and resistivity surveys (Gudmundsson et al., 2008). In addition, geological mapping in greater detail led to a much improved understanding of the age relationships of late quaternary and recent formations (Saemundsson, 2007). Mapping of fumaroles, mud-pools and gas-seeps and monitoring of gas and fluids in terms of abundances and isotopic constitution, has been an ongoing effort for the last three to four decades (e.g. Ármannsson et al., 2000; Ármannsson, 2004; and Ármannsson, 2011; Darling and Ármannsson, 1989). On the basis of the chemical and isotopic data, the geothermal field was subdivided into five distinct subfields, three of which were considered suitable for exploitation (Figure 2). The oxygen and hydrogen isotopic composition of steam condensates suggested that the fluid is recharged from further inland with a contribution from local precipitation (Darling and Ármannsson, 1989).
FIGURE 3: The trajectories of boreholes at Theistareykir geothermal field; A dot indicates a vertical well and red lines show the trajectories of directional wells
(adapted from Ármannsson, 2011)

Report 14 267 Long Hui
3.2 Mineral alteration Primary minerals usually tend to alter to secondary minerals due to hydrothermal alteration that are either stable or meta-stable in geothermal environments. Hydrothermal alteration is affected by permeability, temperature, duration of hydrothermal activity, rock type, pressure and fluid composition. It has been shown that the stability of many hydrothermal alteration minerals is highly dependent upon temperature through a large number of studies in different areas. Identification of temperature dependent alteration minerals during drilling gives very useful evidence regarding the temperature range to be expected in a well. Mineral alteration indicates the temperature at the time of formation at which they were formed (Kristmannsdóttir, 1979; Franzson, 1994). Geothermal systems are, however, dynamic with repeated cycles of warming and cooling, so there is not always a perfect match between mineral alteration and the present formation temperature. The analytical methods used to identify the alteration minerals are stereo microscope, petrographic microscope, X-ray diffractometer, fluid inclusion and electron microprobe analyses. Special tools and machines are used in these methods to study and identify alteration minerals and their relationship qualitatively or quantitatively after samples are selected from the available and/or selected lithologic units. Previous studies of hydrothermal alteration are temperature dependent and often relate well with the respective formation temperature (Franzson, 1994). As can be seen from Figure 4, a smectite-zeolite zone dominates at a wide temperature range between 50 and 200°C, then transforms downwards into mixed-layer clays in the range of about 200-230°C, where it transforms to chlorite at 230°C. Chlorite-epidote alteration forms at a temperature range between 240 and 280°C while epidote-actinolite forms between 280 and 350°C. Previous studies showed that the resistivity characteristics of a high-temperature field are a low-resistivity cap underlain by a high-resistivity core as seen at Nesjavellir (Árnason et al., 1987). In Figure 5, the low resistivity is reflected in the smectite-zeolite zone, while the high resistivity is reflected in the chlorite zone and the chlorite-epidote zone. These changes conform to the transformation of smectite to chlorite which involves changes of crystal types and, most importantly, the rapid decrease in the water contents of the alteration assemblage. The resistivity of the formation has been related to a small amount of the conductive minerals contained in rocks which enhances the conductivity of the formation, causing the resistivity to be low. On the other hand, the open layer structure of smectite provides a good dimensional channel for ion conduction. Ions can migrate between layers under the action of adsorption of polar molecules, contributing to low resistivity, hence, the ionic change capacity in the crystals. The low-resistivity cap is a highly conductive layered silicate with a high ionic change capacity, whereas the chlorite and chlorite-epidote zones are bound in a more resistive crystalline lattice. The main hydrothermal minerals in the Theistareykir high-temperature geothermal field are smectite, zeolite, chlorite, epidote, amphibole, feldspar and quartz (Anette K. Mortensen et al. at ÍSOR, unpublished work). The alteration pattern suggests a progressive increase in temperature with depth.
FIGURE 4: Rock temperature, alteration zones and the corresponding rock alteration (Franzson, 1994)

Long Hui 268 Report 14
The strata observed in the wells shows thick basaltic sequences (tuff, breccias and dikes). The number of intrusions and possible intrusions increases with depth, especially at the lowest part of the wells. 3.3 Resistivity from surface exploration, TEM and MT 3.3.1 Resistivity of geothermal systems in Iceland Resistivity found from the inversion of TEM and MT surface surveys of high-temperature geothermal systems in the basaltic rocks of the volcanic zones of Iceland generally reveals similar resistivity structures which correlate with the alteration mineralogy zoning (Árnason et al., 2000). A low-resistivity cap was observed on the upper margins of the reservoirs, underlain by a high-resistivity core. Extensive comparison of this resistivity structure to well data has revealed a consistent correlation to the zones of dominant alteration minerals, where the low-resistivity cap coincides with the smectite-zeolite zone and the transition to the high-resistivity core within the mixed layer clay zone. Within the high-resistivity core, chlorite and epidote are the dominant alteration minerals. The alteration mineralogy is, on the other hand, mostly related to temperature. This has the important consequence that the resistivity structure can be interpreted directly in terms of temperature while the alteration formed possibly by historic temperature. The upper boundary of the low-resistivity cap is generally found where the temperature is in the range of 50–100°C and the transition to a high-resistivity core occurs at temperatures in the range of 230–250°C (Árnason et al., 2000). The magnetotelluric method uses time variations of the Earth’s magnetic field to investigate the resistivity structure of the Earth’s interior (Karlsdóttir et al., 2012). The time varying magnetic field represents electromagnetic waves that penetrate the earth. By simultaneously measuring natural variations, mutually perpendicular horizontal components of the magnetic and electric fields which are coupled through Maxwell’s equations, the subsurface resistivity can be found by inversion. The electric and magnetic field variations are measured as a function of time i.e. as a time series. The time series are composed of a sum of harmonic (sinusoidal) components of different periods (frequencies). Short period (high frequency) waves are attenuated at a shallow depth, hence, do not penetrate deep, but the longer the period (lower the frequency) the deeper the waves probe into the earth. It means the electrical parameters must be measured on a longer period of fields to probe deeper into the earth. In processing the MT data, the time series are sorted into different frequencies (by Fourier transformation) and the relationship between the electric and magnetic fields gives information about the resistivity at different depths. MT can, therefore, penetrate from shallow depths to a depth of several tens of kilometres (Karlsdóttir et al., 2012).
FIGURE 5: The relationship between resistivity, alteration zones and temperature (Árnason et al., 1987; 2000)

Report 14 269 Long Hui
Wherever MT measurements have been conducted in the volcanic zones in Iceland, a deep-seated low- resistivity layer at a 10–15 km depth has been seen. The upper boundary (10 Ωm) of this low- resistivity layer arches up to a depth as shallow as 2–3 km beneath high-temperature geothermal systems. As the low-resistivity layer is thought to reflect high temperatures, it is interpreted as providing information on the upwelling of heat into geothermal systems. Plume-like low-resistivity anomalies in limited areas beneath the deep low-resistivity layer, as seen in TEM and MT measurements at Upptyppingar (Vilhjálmsson et al., 2008), also support the idea of active heat up-flow. The hydrothermal alteration reflects the alteration caused by the heating of the rocks and reflects the peak temperature experienced by the system at the present or in the past. Resistivity measurements reveal the alteration, hence, the temperature, provided there is equilibrium between the alteration and the present temperature. In case of cooling, the resistivity will reflect the temperature at which the alteration was formed. Whether the resistivity indicates the present temperature of the system will only be confirmed by drilling (Karlsdóttir and Vilhjálmsson, 2011). 3.3.2 Resistivity in Theistareykir geothermal field Resistivity surveys have been undertaken with the TEM, AMT and MT methods at the Theistareykir high-temperature geothermal field on several occasions. The first survey was performed in the 1970s into the early 80s with DC methods (Grönvold and Karlsdóttir, 1975; Gíslason et al., 1984). The first TEM survey was performed by ÍSOR in 2004 with an addition in 2006 (Karlsdóttir et al., 2006). In the summer of 2007, Mannvit and KMS Technologies did an AMT/MT survey at Theistareykir (Yu et al. 2008a; 2008b) but the results could not be used due to insufficient recording of data in the field. Finally, ÍSOR made TEM and MT measurements in 2009 (Karlsdóttir and Vilhjálmsson, 2011) and continued with an MT survey of the area in 2009–2011, followed by 1D interpretation of the MT data along with the existing TEM data. The survey was done over two periods, 62 MT soundings during the summer of 2009 and 25 MT soundings during the summer of 2011. Furthermore, 14 new MT soundings were performed in the summer of 2012 and two of the 2011 soundings were repeated. The total number of MT sites is, therefore, 101 along with TEM sounding sites (Karlsdóttir et al., 2012). A joint 1D inversion of the MT and TEM data was presented in 2011 by Karlsdóttir and Vilhjálmsson. The static shift corrected MT data was then inverted to 3D (Karlsdóttir et al., 2012). The 3D model indicates that a low-resistivity structure (<10 Ωm) is located at a depth of 400-600 m, elongated in an east-west direction from Mt. Baejarfjall in the east towards Mt. Maelifell in the west. Below this low-resistivity structure, the resistivity increases sharply. Similar structures were detected by gravity and magnetic field studies (Ármannsson et al., 1986). The 3D inversion of TEM/MT resistivity data from Theistareykir showed a conventional resistivity structure for a high-temperature system, a low-resistivity cap underlain by a high-resistivity core. The low-resistivity cap reaches the surface at Theistareykir, where also the highest elevation of the high-resistivity core is seen. A deep seated low-resistivity body, indicating the heat source of the geothermal system, is present under Ketilfjall, extending from there north and northeast. This is the most prominent low-resistivity body at depth and it domes up under the southern part of Ketilfjall up to 2 km b.s.l. depth. Other low-resistivity bodies are present at greater depths, under Stórahversmór and the southeast part of Baejarfjall. Two distinctive low-resistivity bodies extend from the low-resistivity cap in the northern part of the survey area down to 10 km depth b.s.l. It is tempting to connect these phenomena to the Húsavik Fracture Zone where it infiltrates the Theistareykir fissure swarm and even to crustal deformation detected in the area in 2007–2008 (Karlsdóttir et al., 2012). Figure 6 shows an example of a 3D-presentation from Petrel software showing the 5 geothermal wells in the Theistareykir geothermal field in this study. The 64" resistivity for the selected wells is also shown on the well tracks.

Long Hui 270 Report 14
4. DATA PREPARATION 4.1 Correction of well logs Geothermal wells are drilled either vertically or directionally. The exploration wells in Theistareykir high-temperature geothermal field are drilled in four stages where the casings are: surface casing, safety casing and production casing. The deepest part is the production part of the well cased with a slotted liner. Mud or water circulation is used while drilling down to the production part and water circulation applied in the production part of the wells. Cementing is needed in each section above the production part of the wells to anchor the casing to the formation. The height of the drill rigs and the casing depth with reference to flans, top of cellar or ground surface in different sections of each well at Theistareykir are revealed in Table 2. Depth must be corrected in the resistivity measurements and other borehole measurements so that the measured depths of all measurements in a well are consistent and the ground surface is the common reference point. The main part of this project was to correct and prepare the well logs for further processing. In all of the well logs during drilling, the platform of the drill rigs was used as a common reference, but after drilling the ground surface was the common reference. Following is a summary of significant corrections that were made:
1) The depths of measurements were adjusted from drilling platforms down to the ground surface. The depth of measurements from the drilling period needed to be corrected from the platform down to the surface. Well logs were measured from the platforms and their depths needed to be reduced by the height of the platforms. The heights of different drill rigs are shown in Table 2.
FIGURE 6: The 5 selected boreholes at Theistareykir with measured 64" resistivity from the project study; the resistivity scale (1-2000 Ωm) is logarithmic, shown in the upper right corner;
the 1 Ωm is red, 10 Ωm yellowish, 100 Ωm green and 1000 Ωm blue

Report 14 271 Long Hui
TABLE 2: Summary of the wells for correction in Theistareykir field
Well name
Section Circulation
fluid Drill rig
Height of drill rig (m)
Casing depth w.r.t. flans (m)
Casing depth w.r.t. top of cellar or grs. (m)
ThG-01
Pre-drilling mud Sleipnir 6.0 69.1 69.9 1 mud Sleipnir 6.0 188.7 189.5 2 water Sleipnir 6.0 609.5 610.3 3 water Sleipnir 6.0 1924.2 1925.0
ThG-02
Pre-drilling water Sleipnir 6.0 101.5 102.3 1 mud Sleipnir 6.0 270.0 270.8 2 water Sleipnir 6.0 611.1 611.9 3 water Sleipnir 6.0 1704.9 1705.7
ThG-03
Pre-drilling mud Jötunn 6.9 — — 1 mud Jötunn 6.9 247.8 248.6 2 mud Jötunn 6.9 756.7 748.9 3 water Jötunn 6.9 — —
ThG-04
Pre-drilling mud Jötunn 6.9 — 66.2 1 mud Jötunn 6.9 262.1 262.9 2 mud Jötunn 6.9 823.7 824.5 3 water Jötunn 6.9 — —
ThG-09
Pre-drilling mud Geysir 6.8 103.0 103.8 1 mud Geysir 6.8 296.8 297.6 2 mud Geysir 6.8 816.9 817.7 3 water Geysir 6.8 — —
2) The casing depth needs to be known in order to make the adjustment of the depth measurements to the end of the casings, which could be detected in some of the well logs. The casing depth is, however, in some cases expressed in drilling reports based on drilling platforms, in some places compared to the edge of the basement or ground surface and in some cases it is assumed to be the borehole flans. The casing depths of different sections of each well can be seen in Table 2. In this project, the flans to the top of the cellar, in the design figure for Well ThG-03, is 0.800 m and was used for Wells ThG-01 to ThG-04. In the design figure for Well ThG-09, this seemed to be 0.811 m, only used for that well.
3) The resistivity logs were not corrected in this study but should be corrected for well Caliper, temperature and fluid conductivity. The circulation fluid used while drilling varies so its conductivity needs to be measured and given for a fixed temperature for the corrections. The resistivity of the fluid as well as the formations depends upon temperature. The ÍSOR software for correcting the resistivity can be used on a UNIX system only, which is not available for UNU Fellows.
4) Finally, the logs of similar kind from different sections in one well were put together in one file after the corrections were made. These continuous logs were imported into the Petrel 3D software where the data was connected to the well paths through their measured depth.
4.2 Petrel – previous work The Petrel software was used in the presented project and its relevant features are described briefly below. Figure 6 shows an example of a 3D-presentation from Petrel software. Petrel is a shared earth model tool developed by Schlumberger to discover reservoir patterns through a common data model (Schlumberger, 2008). In one application, geophysics, geology, petrophysics, production data and seismic events can be imported into Petrel to generate visual and easy access. The

Long Hui 272 Report 14
powerful features of Petrel not only allow users to improve understanding of the internal details of the reservoir, but also describe the spatial distribution of the reservoir properties as well as seamlessly integrate data and a reservoir numerical simulator, all according to the inserted data for modelling. 4.2.1 A 3D resistivity model Two resistivity models found by joint inversion of TEM and MT data had previously been inserted into Petrel. The 25×25 grid is with TEM and MT from a 1D inversion but the 250×250 from a 3D inversion, and the resolution is different in the two models. A 3D inversion of the MT data can give more reliable and detailed results than a 1D inversion (Karlsdóttir et al., 2012). Therefore, the 250×250 grid 3D model was used in this project. Four resistivity maps from the report by Karlsdóttir et al. (2012) are presented in Figures 7-10 in order to show the character of the resistivity structure of the geothermal system, both horizontally and vertically, in Theistareykir high-temperature geothermal field. The geothermal system is characterized by a low-resistivity cap underlain by a high-resistivity core. The results also revealed a low-resistivity layer at depth, arching up under the centre of the geothermal system with the upper border (10 Ωm) at 4–5 km depth. The black dots show the locations of the TEM and MT stations in Figures 7 and 8. Figure 7 shows the resistivity at 250 m above sea level. It shows the low resistivity with red colour and the high resistivity with blue colour. In this case the blue colour represents the unaltered rocks on the surface outside the geothermal field, whereas the red colour shows the top of the emerging low-resistivity cap over the geothermal area. Figure 8 shows the resistivity at 2000 m b.s.l. It shows the low-resistivity zone at depth appearing in the northeast part. There are several hints of low resistivity, such as Ketilfjall, Baejarfjall, Stórahversmór and the Tjarnarás area. Low resistivity a little to the right of the middle of the figure is under Ketilfjall, north of Baejarfjall (see Figure 2). Well ThG-03 (Figure 3) is located west of Ketilfjall. The prominent low resistivity bodies in the northwest part of the map are the anomalies allegedly connected to the Húsavík transform fault. In Figure 9, a cross-section of resistivity through Theistareykir and Bóndhólsskard from west to east, (the green line 125 shown in Figure 2), indicates the low-resistivity cap that reaches the surface in the middle of the figure and tilts towards the east. The high-resistivity core covers the middle stratum and low resistivity appears again at depth in the eastern part which indicates the main heat source or the Ketilfjall resistivity anomaly. It also shows an anomaly at greater depth under Stórahversmór in the western part. In Figure 10, a cross-section of resistivity through Theistareykir and Baejarfjall from south to north (the green line 1625 shown in Figure 2) shows the low-resistivity cap; the low resistivity is underlain by a high-resistivity core. It also shows the low resistivity at depth, i.e. the Ketilfjall anomaly or the main heat source to the north and a smaller anomaly at more depth under Baejarfjall.

Report 14 273 Long Hui
FIGURE 7: Resistivity at 250 m a.s.l. (Karlsdóttir et al., 2012)
FIGURE 8: Resistivity at 2000 m b.s.l. (Karlsdóttir et al., 2012)
FIGURE 9: A W-E resistivity cross-section through Theistareykir and
Ketilfjall down to 5 km depth (above) and down to 15 km depth (below) (Karlsdóttir et al., 2012)
FIGURE 10: A resistivity cross-section from south to north, through Baejarfjall and Ketilfjall down to 5 km depth (above) and down to 15 km
depth (below) (Karlsdóttir et al., 2012)
Long Hui 274 Report 14
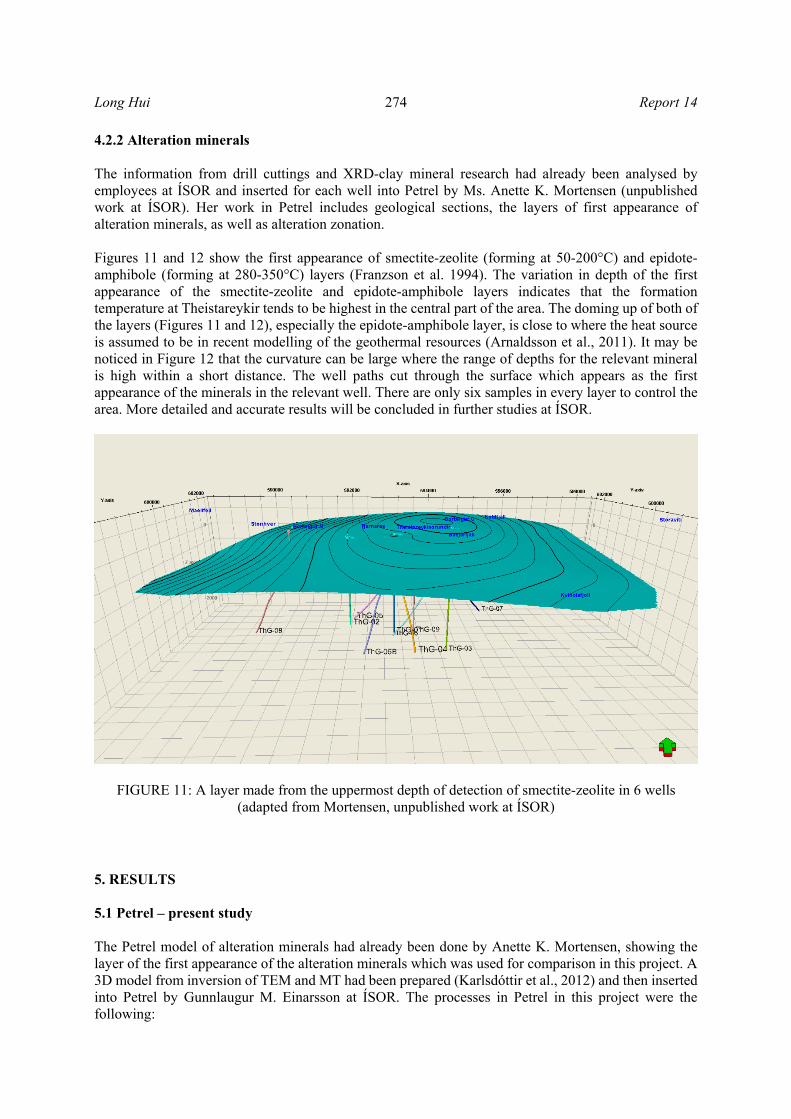
4.2.2 Alteration minerals The information from drill cuttings and XRD-clay mineral research had already been analysed by employees at ÍSOR and inserted for each well into Petrel by Ms. Anette K. Mortensen (unpublished work at ÍSOR). Her work in Petrel includes geological sections, the layers of first appearance of alteration minerals, as well as alteration zonation. Figures 11 and 12 show the first appearance of smectite-zeolite (forming at 50-200°C) and epidote-amphibole (forming at 280-350°C) layers (Franzson et al. 1994). The variation in depth of the first appearance of the smectite-zeolite and epidote-amphibole layers indicates that the formation temperature at Theistareykir tends to be highest in the central part of the area. The doming up of both of the layers (Figures 11 and 12), especially the epidote-amphibole layer, is close to where the heat source is assumed to be in recent modelling of the geothermal resources (Arnaldsson et al., 2011). It may be noticed in Figure 12 that the curvature can be large where the range of depths for the relevant mineral is high within a short distance. The well paths cut through the surface which appears as the first appearance of the minerals in the relevant well. There are only six samples in every layer to control the area. More detailed and accurate results will be concluded in further studies at ÍSOR.
5. RESULTS 5.1 Petrel – present study The Petrel model of alteration minerals had already been done by Anette K. Mortensen, showing the layer of the first appearance of the alteration minerals which was used for comparison in this project. A 3D model from inversion of TEM and MT had been prepared (Karlsdóttir et al., 2012) and then inserted into Petrel by Gunnlaugur M. Einarsson at ÍSOR. The processes in Petrel in this project were the following:
FIGURE 11: A layer made from the uppermost depth of detection of smectite-zeolite in 6 wells (adapted from Mortensen, unpublished work at ÍSOR)

Report 14 275 Long Hui
1) Firstly, corrected 16" and 64" resistitivity, Caliper, gamma and Neutron-Neutron well logs were
inserted as measured depth and value and linked to the well paths. 2) Secondly, both 16" and 64" resistivity well logs were averaged to the same resolution as the 3D
model from TEM and MT, using the Scale up property section in Petrel. 3) Finally, the measured 16" and 64" resistivity well logs, the averaged 16" and 64" resistivity and
the “pseudo logs” from the TEM and MT model were combined in a log-plot in the main study in this project, as seen in Haraldsdóttir et al. (2010; 2012), with a similar scale for comparison. In addition, the alteration mineral zones and intrusions were included in the log-plots.
The depth is shown as true vertical depth (TVD) and the “pseudo logs”, which are made from the TEM/MT model, have a different scale from the resistivity scales of the resistivity well logs, since the values are log(resistivity). The scale of the well logs ranges from 1 to 2000 Ωm while the corresponding scale of the resistivity from the TEM/MT inversion and the deduced “pseudo logs” is 0 to 3.3. For example, for resistivity values 1 and 2000 Ωm, log 1=0 and log 2000=3.3. The plots were made similar by using log and linear scales for those. 5.2 Well logs in boreholes The well logs were plotted together on a log plot to identify important information, e.g. geological sections, and to process for further analysis. In this study, one example of processed well logs from Well ThG-01 at Theistareykir is shown in Figure 13. The depth is the true vertical depth with respect to sea level. From left to right, the graph shows the alteration mineral zones, the geological sections, the intrusions and the formation temperature, caliper, gamma, and Neutron-Neutron, but the 64" resistivity and 16" resistivity are plotted together with a logarithmic scale in Figure 13. The formation temperatures of Wells ThG-01, ThG-02, ThG-03, and ThG-04 had been found previously and are shown in Figure 14. The rock temperature in ThG-01 increases continuously with depth in Figures 13 and 14 up to 331.6°C. The alteration minerals indicate the geothermal temperature when they were formed, so comparing them with the present formation temperature indicates if a geothermal system is in balance, warming or cooling.
FIGURE 12: A layer made from the uppermost depth of detection of epidote-amphibole in 6 wells (adapted from Mortensen, unpublished work at ÍSOR)

Long Hui 276 Report 14
The Caliper logs of Wells ThG-01 and ThG-03 were measured with a 3 arm probe, whereas Wells ThG-02, ThG-04 and ThG-09 were measured with a 4 arm probe. For example, there is a cavity at 60 m b.s.l. where the caliper shows an obviously higher peak. From the gamma and Neutron-Neutron logs, several peaks with high values, e.g. at depth 580 m and 1360 m b.s.l., probably indicate acidic layers or intrusions intersecting basaltic rocks. In general, higher gamma ray represents acidic characteristic and higher Neutron-Neutron log indicates low porosity. The corresponding higher resistivity peaks in 16" and 64" resistivity logs are shown together in the last column in Figure 13. 5.3 Rock temperature in the Theistareykir geothermal system The rock temperature in Wells ThG-01, ThG-02, ThG-03, ThG-04 and ThG-09 (ÍSOR database) is shown in Figure 14 for comparison with the resistivity and alteration temperature. Well ThG-02 is the coldest of the boreholes but is shallow with respect to other boreholes at Theistareykir. It is warmer at a deeper depth in Well ThG-05B which lies under Well ThG-02. Wells ThG-01, ThG-03, ThG-04 and ThG-09 are warmer than Well ThG-02 and their locations are in the centre and eastern part of the research area shown in Figure 3.
(-400)
-200
0
200
400
600
800
1000
1200
1400
(1600)
(1700)
SSTVD
1:5498
Sm
-Zeo
Chl
Chl
-Ep
Ep-
Act
Ep-
Act
Alt er at ion zonat ion Volcanic Facies Intrusion 0 400Formation Temp 0. 00 500. 00Caliper ( Caliper Point well dat a) 300 1300Neut r on-neut r on ( NN Point well dat a) 0. 00 50. 00G am m a (G am m a point well dat a) 0.10 2000.00R16
0.10 2000.00R64
ThG-01 [SSTVD]
Ep
-Am
ph
FIGURE 13: Well logs: Caliper, gamma, N-N, 16" and 64" resistivity of Well ThG-01 at
Theistareykir, as well as alteration zones, geological sections, intrusions and rock temperature (Mortenson et al. at ÍSOR,
unpublished work at ÍSOR)
-500
0
500
1000
1500
2000
2500
0 100 200 300 400
Temperature()
TVDSS(m b.s.l)
ThG-09
ThG-04
ThG-03
ThG-02
ThG-01
FIGURE 14: Estimated rock temperature in boreholes at Theistareykir

Report 14 277 Long Hui
5.4 Comparison of borehole and surface resistivity as well as alteration minerals 5.4.1 Comparison of resistivity in boreholes and from surface exploration Simplified log plots for the 5 selected wells are shown in Figures 15-19. The diagrams in the figures show alteration minerals, intrusions and possible intrusions, 64" resistivity, 16" resistivity, averaged 64" resistivity, averaged 16" resistivity and “pseudo-logs” from the TEM and MT electrical soundings, in that order. The averaged 64" and 16" resistivity and the “pseudo-logs” from the inversion of TEM/MT model have the same resolution. Wells ThG-01 and ThG-04 are located at the same drill pad. The upper part of a well is vertical down to the kick off depth. The upper parts of these two wells are vertical down to 200 m b.s.l. and, from Figures 15 and 18, the resistivity logs look similar to each other. The 16" resistivity of Wells ThG-01, ThG-02, ThG-03 and ThG-04 is a little higher than the 64" resistivity. But 16" resistivity is lower than 64" resistivity at a depth from the top to 50 m a.s.l. in Well ThG-09, and inverses below 50 m a.s.l. The “pseudo-logs” from the inversion of TEM and MT electrical soundings has the same trend in these 5 wells, first lower than 16" and 64" resistivity and then higher at a certain depth of each well. On the whole, the 64" resistivity, 16" resistivity, averaged 64" resistivity, averaged 16" resistivity and the “pseudo-logs” have a slight difference but are a very good match.
FIGURE 15: Well ThG-01: Alteration minerals, intrusions, 64" resistivity, 16" resistivity, averaged 64", averaged 16"and the “pseudo-logs” from TEM/MT; the resistivity colours scale is
similar to the scale in Figure 4 (1-2000 Ωm). The resistivity scale is logarithmic from 1 to 2000 Ωm and the “pseudo log” scale is
linear from 0 to 3.3 (see text)

Long Hui 278 Report 14
The 64" and 16" resistivity logs are high at different depths (e.g. at 1380 and 1540 m b.s.l. in Well ThG-01, at 950 and 1625 m b.s.l. in Well ThG-03 and at 100 and 375 m b.s.l. in Well ThG-04) and coincide with intrusions or possible intrusions shown with blue lines in the figures. The comparison of averaged logs and the resistivity from TEM/MT shows that they match well with each other and have a similar variation trend with increasing depth. For example, the averaged 64" resistivity, averaged 16" resistivity and the “pseudo-logs” have lower values at a depth of around 50 m b.s.l. in Well ThG-01 (Figure 15). The values of the “pseudo-logs” are very low in the same well in the smectite-zeolite zone, but continue getting lower down to the grid cell at around 50 m b.s.l. Farther down, in the chlorite-epidote zone, the TEM/MT resistivity starts to increase and tends to be higher than the averaged resistivity which has different values. The resistivity in the epidote-amphibole zone increases with depth both in the “pseudo logs” and the averaged resistivity logs. The comparison of averaged 64" and 16" resistivity and the “pseudo-logs” from TEM/MT model shows the change trend is a little bit different in Well ThG-02 (Figure 16). The averaged 64" and 16" resistivity decreases at depth of around 100 m b.s.l. but the “pseudo-log” decreases at depth of around 250 m b.s.l., and is possibly shifted and should correspond to each other.
FIGURE 16: ThG-02: Alteration minerals, 64" resistivity, 16" resistivity, averaged 64", averaged 16" and the “pseudo-logs” from
TEM/MT are shown side by side; the resistivity colours scale is similar to the scale in Figure 4 (1-2000 Ωm); the resistivity scale is
logarithmic from 1 to 2000 Ωm and the “pseudo log” scale is linear from 0 to 3.3 (see text)

Report 14 279 Long Hui
The averaged 64" resistivity decreases a little at a depth of around 500 m b.s.l. but the averaged 16" resistivity and the “pseudo-logs” increase. This is a very little increase and probably within the error limits of these averaged values. Resistivity and alteration minerals could not be compared due to a lack of alteration minerals in Well ThG-02. The comparison of averaged resistivity logs and the “pseudo-logs” resistivity from TEM/MT for Well ThG-03 shows a little different pattern but still good correlation down to the grid around 1300 m b.s.l., but the TEM/MT shows the unusual behaviour of decreasing at that depth and decreasing even more farther down. This is the deepest of the 5 wells and probably is showing the top of a low-resistivity plume in the 3D TEM/MT model reaching up from depth. The changes in the averaged 16" and 64" resistivity do not coincide totally, but those changes are small. They both increase gradually from 800 m depth, whereas the TEM/MT pseudo log decreases. The borehole logs are more reasonable and valid due to more exact in situ measurements. Besides, the increase in the well logs at the deepest part of the well coincides with the increase in frequency of detected intrusions or possible intrusions from drill cuttings at that depth. The averaged resistivity logs increase a little from the chlorite to the chlorite-epidote zone and do not change much until they come into the epidote-amphibole where they increase as can be clearly seen in Figure 17.
FIGURE 17: Well ThG-03: Alteration minerals, intrusions, 64" resistivity, 16" resistivity, averaged R64, averaged R16 and the
“pseudo-logs” from TEM/MT are shown side by side; the resistivity colours scale is similar to the scale in Figure 4 (1-2000 Ωm); the resistivity scale is logarithmic from 1 to 2000 Ωm and
the “pseudo log” scale is linear from 0 to 3.3 (see text)

Long Hui 280 Report 14
The comparison of averaged logs and the resistivity from TEM/MT shows a very good corresponding relationship for Well ThG-04 in Figure 18, especially the changes at depths of around 50 m and 300 m b.s.l. The 64" and 16" resistivity are extremely low around a depth of 650 m b.s.l., but the averaged cell is so big that it disappears in the higher values. The “pseudo-log” resistivity aapears lower at a depth of around 740 m b.s.l. which could correspond to the low resistivity in the measured logs a little higher. The “pseudo-log” resistivity is low and does not change much in the chlorite zone. The resistivities from the borehole and from surface exploration exhibit an increasing trend in the epidote-amphibole zone. In Figure 19 the averaged 64" resistivity, the averaged 16" resistivity and the “pseudo-log” have a good correlation with increasing depth in Well ThG-09. The 64" and 16" resistivity logs, at depths of above 50 m a.s.l., is extremely low, probably caused by different scales or some problems with measurements. The averaged 64" and 16" resistivity decreases at a depth of around 250 m b.s.l., but the “pseudo-log” resistivity decreases at a depth of around 100 m b.s.l., probably corresponding to each other. The averaged resistivity and “pseudo-log” show similar patterns down the well from the cell around 1000 m b.s.l. but, as in Well ThG-03, the TEM/MT is decreasing, but only at the deepest cell.
FIGURE 18: Well ThG-04: Alteration minerals, intrusions,64" resistivity, 16" resistivity, averaged R64, averaged R16 and the
“pseudo-logs” from TEM/MT; the resistivity colours scale is similar to the scale in Figure 4 (1-2000 Ωm); the resistivity scale is
logarithmic from 1 to 2000 Ωm and the “pseudo log” scale is linear from 0 to 3.3 (see text)

Report 14 281 Long Hui
5.4.2 Comparison of resistivity and alteration minerals In Table 3 the alteration minerals are linked to the temperature during their formation (based on Kristmannsdóttir, 1979, and Franzson, 2010). The depths of the alteration zones in Wells ThG-01, ThG-03 and ThG-04 were used to get information about the rock temperature at similar depth. These are shown for comparison in Table 3. The resistivity increases with increasing alteration (mixed-layer clay, chlorite, chlorite-epidote and epidote-amphibole), generally below the smectite-zeolite zone, but at different depths in different wells. In this project, the resistivity logs were not available from the first section of the wells where the smectite-zeolite zone is located (Figures 15-19). The resistivity increases below the chlorite in Wells ThG-01, ThG-02 and ThG-04, below the mixed-layer clay in Well ThG-03, but the resistivity changes from higher to lower at several intervals in the wells. 5.4.3 Well correlation The wells in Figure 20 are in the eastern part of Theistareykir high-temperature geothermal field and lie from west to east (Figure 3), i.e. Wells ThG-02, ThG-01, ThG-04 and ThG-03. The first appearance of alteration minerals from drill cuttings and XRD analysis is shown with lines across the figure. The figure shows the alteration mineral zones, averaged 64", averaged 16", also including the well log on top of the relevant averaged logs and the “pseudo-logs” from the 3D model from the inversion of TEM/MT for each well. The low-resistivity layer can be seen in the “pseudo logs” from the TEM and MT 3D model, high
FIGURE 19: Well ThG-09: 64" resistivity, 16" resistivity, averaged R64, averaged R16 and the “pseudo-log” from
TEM/MT; the resistivity colours scale is similar to the scale in Figure 4 (1-2000 Ωm); the resistivity scale is logarithmic from 1 to 2000 Ωm and the “pseudo log” scale is linear from
0 to 3.3 (see text)

Long Hui 282 Report 14
up in the wells, but this is only an indication as the measured resistivity was not measured in the first section of the wells where the low-resistivity zone is located.
TABLE 3: Comparison of rock temperature and alteration temperature
Alteration minerals
Franzson’s previous
study (°C)
ThG-01 (°C)/ Depth (m b.s.l.)
ThG-02 (°C)/Depth (m
b.s.l.)
ThG-03 (°C)/Depth (m
b.s.l.)
ThG-04 (°C)/ Depth (m b.s.l.)
Smectite-zeolites
50-200 140-200
-354 to -190 100-170
-300 to -180 140-200
-368 to -333 140-200
-339 to -242
Mixed-layer clay
200-230 — 170-190
-180 to -125 155-185
-333 to -253 185
-242 to -212
Chlorite 240-250 200-220
-190 to -95 —
200-220 -253 to -41
200-220 -212 to -129
Chlorite-epidote
250-280 220-260
-95 to 219 —
220-260 -41 to 718
220-260 -129 to 326
Epidote-amphibole
280-350 260-340
219 to 1953 —
255-340 718 to 2659
260-340 326 to 1169
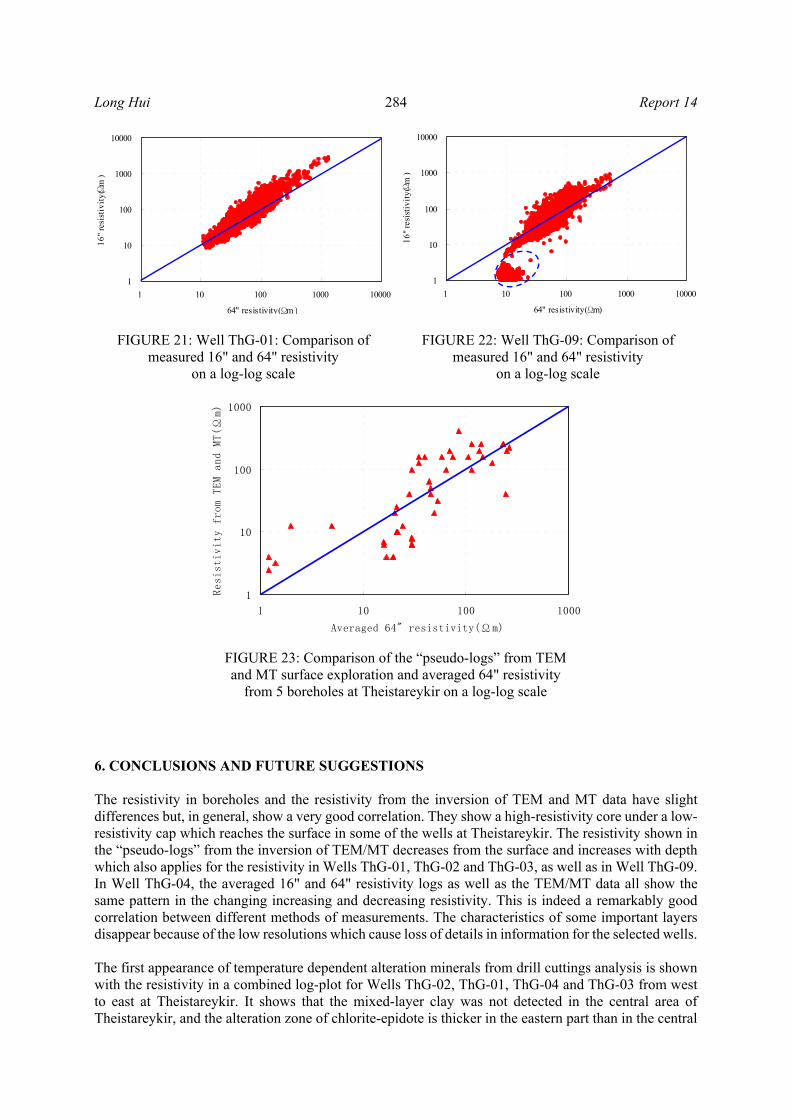
The first appearance of the alteration minerals in the chlorite zone appears at more depth in the western part (Well ThG-02) than in the middle of the area (Wells ThG-01 and ThG-04), and even at more depth farther northeast (Well ThG-03). The chlorite-epidote analysis in Well ThG-02 is incomplete due to lack of data and will, therefore, not be included. That zone does not show any great difference between the three remaining wells in the centre and northeast part of the area. On the other hand, its thickness appears to be greater towards the east based on the fact that epidote-amphibole appears at greater depths in Well ThG-04 than in Well ThG-01, and even deeper down in Well ThG-03 than in the other wells. The epidote-amphibole zone reaches to the bottom of each well, looking more extensive in Well ThG-04 than in the other wells because it is 800-1000 m deeper than the others. 5.5 Cross plot examples A cross plot can be useful for checking the consistency of data for numerous datasets, as well as for each well individually, and even for finding errors (Haraldsdóttir et al., 2010). Figures 21 and 22 show the comparisons of measured 16" resistivity and 64" resistivity with a log-log scale from boreholes ThG-01 and ThG-09, respectively. The graphs in the figures relate variables from the same type of measurements. The points are spread linearly in the log-log plot of well ThG-01, and the situation is similar in Wells ThG-02, ThG-03 and ThG-04. The values of 16" resistivity are higher than for 64" resistivity. Neither has the temperature influence on resistivity nor the influence of the well fluid been corrected for. In Figure 23, there are several points where the values of 64" resistivity are relatively higher with respect to the 16" resistivity, in general; the difference can be seen in one of the sections. It also can be seen in Figure 19 above 50 m a.s.l. There might have been a bad cable or some problems with the scales in the measurements. Figure 23 shows the cross plot of the “pseudo-logs” from the inversion of TEM and MT electrical soundings and averaged 64" resistivity from borehole measurements with the same resolution. Clearly there are much fewer points compared to the previous Figures 21 and 22 and are well-distributed around the 1:1 line. The values in the “pseudo-logs” are relatively higher than in the averaged 64" resistivity, possibly caused by the low resolution in the interpretation of the surface exploration, yet still have certain relevance.

Report 14 283 Long Hui
SSTVD 0
(-500)
-250
0
250
500
750
1000
1250
(1500)
(1750)
(2000)
(2250)
(2300)
SSTVD1:3471
Sm
-Zeo
MLC
Chl
Chl
-Ep
Alt er at ion zonat ion
1.00 2000.00R64 [U] (From property)
1.00 2000.00R641.00 2000.00R16 [U] (From property)
1.00 2000.00R16 0.0 3.3LogRes [U] (From property)
ThG-02 [SSTVD]
SSTVD 0
(-500)
-250
0
250
500
750
1000
1250
1500
(1750)
(2000)
(2250)
(2300)
SSTVD
1:3471
Sm
-Zeo
Chl
Chl
-Ep
Ep-
Act
Ep-
Act
Alt erat ion zonat ion
1.00 2000.00R64 [U] (From property)
1.00 2000.00R641.00 2000.00R16 [U] (From property)
1.00 2000.00R16 0.0 3.3LogRes [U] (From property)
ThG-01 [SSTVD]
SSTVD 0
(-500)
-250
0
250
500
750
1000
1250
1500
(1750)
(2000)
(2250)
(2300)
SSTVD1:3471
Sm
-Zeo
MLC
Chl
Chl
-Ep
Ep-
Act
Ep-
Act
Alt er at ion zonat ion 1.00 2000.00R641.00 2000.00R64 [U] (From property)
1.00 2000.00R161.00 2000.00R16 [U] (From property)
0.0 3.3LogRes [U] (From property)
ThG-04 [SSTVD]
SSTVD 0
(-500)
-250
0
250
500
750
1000
1250
1500
1750
2000
2250
(2300)
SSTVD1:3471
Sm-Zeo
MLC
Chl
Chl
-Ep
Ep-
Act
Alt erat ion zonat ion
1.00 2000.00R64 [U] (From property)
1.00 2000.00R641.00 2000.00R16 [U] (From property)
1.00 2000.00R16 0.0 3.3LogRes [U] (From property)
ThG-03 [SSTVD]
SSTVD 0
Sm-Zeo
Sm-Zeo
MLC
MLC
Chl
Chl
Chl-Ep
Chl-Ep
Ep-Amph
Ep-Amph
Sm-Zeo
Chl-Ep
Sm-Zeo
MLCChl
Chl-Ep
Ep-Amph
Chl
Sm-Zeo
MLC
Chl
Chl-Ep
Ep-Amph
Ep
-Am
ph
Ep-
Am
ph
Ep
-Am
ph
SSTVD 0
(-500)
-250
0
250
500
750
1000
1250
(1500)
(1750)
(2000)
(2250)
(2300)
SSTVD1:3471
Sm
-Zeo
MLC
Chl
Chl
-Ep
Alt er at ion zonat ion
1.00 2000.00R64 [U] (From property)
1.00 2000.00R641.00 2000.00R16 [U] (From property)
1.00 2000.00R16 0.0 3.3LogRes [U] (From property)
ThG-02 [SSTVD]
SSTVD 0
(-500)
-250
0
250
500
750
1000
1250
1500
(1750)
(2000)
(2250)
(2300)
SSTVD
1:3471
Sm
-Zeo
Chl
Chl
-Ep
Ep-
Act
Ep-
Act
Alt erat ion zonat ion
1.00 2000.00R64 [U] (From property)
1.00 2000.00R641.00 2000.00R16 [U] (From property)
1.00 2000.00R16 0.0 3.3LogRes [U] (From property)
ThG-01 [SSTVD]
SSTVD 0
(-500)
-250
0
250
500
750
1000
1250
1500
(1750)
(2000)
(2250)
(2300)
SSTVD1:3471
Sm
-Zeo
MLC
Chl
Chl
-Ep
Ep-
Act
Ep-
Act
Alt er at ion zonat ion 1.00 2000.00R641.00 2000.00R64 [U] (From property)
1.00 2000.00R161.00 2000.00R16 [U] (From property)
0.0 3.3LogRes [U] (From property)
ThG-04 [SSTVD]
SSTVD 0
(-500)
-250
0
250
500
750
1000
1250
1500
1750
2000
2250
(2300)
SSTVD1:3471
Sm-Zeo
MLC
Chl
Chl
-Ep
Ep-
Act
Alt erat ion zonat ion
1.00 2000.00R64 [U] (From property)
1.00 2000.00R641.00 2000.00R16 [U] (From property)
1.00 2000.00R16 0.0 3.3LogRes [U] (From property)
ThG-03 [SSTVD]
SSTVD 0
Sm-Zeo
Sm-Zeo
MLC
MLC
Chl
Chl
Chl-Ep
Chl-Ep
Ep-Amph
Ep-Amph
Sm-Zeo
Chl-Ep
Sm-Zeo
MLCChl
Chl-Ep
Ep-Amph
Chl
Sm-Zeo
MLC
Chl
Chl-Ep
Ep-Amph
Ep
-Am
ph
Ep-
Am
ph
Ep
-Am
ph
FIGURE 20: Correlation of Wells ThG-02, ThG-01, ThG-04 and ThG-03 at Theistareykir; alteration zones, 64" resistivity, averaged R64, 16" resistivity,
averaged R16 and “pseudo-log” from the inversion of TEM/MT for each well, as well as connection lines for the first appearance of each alteration mineral; the
colour scale is the same as that in Figure 4 (1-2000 Ωm)
Long Hui 284 Report 14
6. CONCLUSIONS AND FUTURE SUGGESTIONS The resistivity in boreholes and the resistivity from the inversion of TEM and MT data have slight differences but, in general, show a very good correlation. They show a high-resistivity core under a low-resistivity cap which reaches the surface in some of the wells at Theistareykir. The resistivity shown in the “pseudo-logs” from the inversion of TEM/MT decreases from the surface and increases with depth which also applies for the resistivity in Wells ThG-01, ThG-02 and ThG-03, as well as in Well ThG-09. In Well ThG-04, the averaged 16" and 64" resistivity logs as well as the TEM/MT data all show the same pattern in the changing increasing and decreasing resistivity. This is indeed a remarkably good correlation between different methods of measurements. The characteristics of some important layers disappear because of the low resolutions which cause loss of details in information for the selected wells. The first appearance of temperature dependent alteration minerals from drill cuttings analysis is shown with the resistivity in a combined log-plot for Wells ThG-02, ThG-01, ThG-04 and ThG-03 from west to east at Theistareykir. It shows that the mixed-layer clay was not detected in the central area of Theistareykir, and the alteration zone of chlorite-epidote is thicker in the eastern part than in the central
1
10
100
1000
10000
1 10 100 1000 10000
64" resistivity(Ωm )
16"
resi
stiv
ity(Ω
m )
FIGURE 21: Well ThG-01: Comparison of measured 16" and 64" resistivity
on a log-log scale
1
10
100
1000
10000
1 10 100 1000 10000
64" resistivity(Ωm)
16"
resi
stiv
ity(Ω
m )
FIGURE 22: Well ThG-09: Comparison of measured 16" and 64" resistivity
on a log-log scale
1
10
100
1000
1 10 100 1000
Averaged 64" resistivity(Ωm)
Resistivity from TEM and MT(Ω
m)
FIGURE 23: Comparison of the “pseudo-logs” from TEM and MT surface exploration and averaged 64" resistivity
from 5 boreholes at Theistareykir on a log-log scale

Report 14 285 Long Hui
part. The first detection of epidote-amphibole was lower in Well ThG-04 than in Wells ThG-01 and ThG-02, which indicates a lower state of alteration in the well further to the east. The gamma ray, Neutron-Neutron and resistivity logs in Well ThG-01 show a good relationship for acidic layers and intrusions, based on evidence from high gamma values caused by acidic characteristics, and high Neutron-Neutron values due to low porosity and a high resistivity value. The corrections for the influence of Caliper, temperature and fluid on resistivity logs need to be done in order to obtain more consistent results. Well ThG-02 has lower rock temperature than the other wells at similar depths. Resistivity and alteration minerals cannot be compared in that well due to a lack of information about the alteration minerals. More intense results will be found after studies with more data, such a study of the alteration minerals in Well ThG-09 in comparison with the other wells.
ACKNOWLEDGMENTS I would like to express my sincere gratitude to the UNU-GTP director, Mr. Lúdvík S. Georgsson, and retiring director, Dr. Ingvar B. Fridleifsson, for giving me the opportunity to participate in the six month Geothermal Training Programme, as well as the other UNU-GTP staff, Ms. Thórhildur Ísberg, Mr. Ingimar G. Haraldsson, Ms. Málfrídur Ómarsdóttir and Mr. Markús A. G. Wilde for their incredible support and assistance during the whole training in Iceland. Great thanks go to my supervisors, Dr. Svanbjörg Helga Haraldsdóttir and Ms. Ragna Karlsdóttir, for their patient supervision, instructions and guidelines throughout my project; I especially benefited from Svana’s attitude towards the work. Special thanks to Ms. Anette K. Mortensen at ÍSOR for her useful and helpful information about my project, and Mr. Gunnlaugur M. Einarsson at ÍSOR for preparing the 3D model from the inversion of TEM and MT electrical soundings. Thanks to all lecturers, staff members of ÍSOR and Orkustofnun for their comprehensive presentations, sharing of their knowledge and experiences, as well as to all of my dear classmates for the great and wonderful life we spent together in Iceland. Many thanks to Dr. Li Wenpeng, Dr. Guo Jianqiang, Dr. Sun Xiaoming, Dr. Cha Enlai and my institution (Centre for Hydrogeology and Environmental Geology Survey, which belongs to the China Geological Survey under the Ministry of Land and Resources) for approving and supporting me to attend the UNU training programme. Above all, I am very grateful to my family, especially my parents, for their full understanding, strong encouragement and continuous support for the whole period of my study and stay in Iceland.
REFERENCES
Ármannsson, H., 2004: Chemical aspects of exploration of the Theistareykir high temperature geothermal area, N-E Iceland. Proceedings of the 11th International Symposium on Water-Rock Interaction 2004, Taylor & Francis Group, London, 63-67 pp. Ármannsson, H., 2011: The Theistareykir geothermal system, North East Iceland. Case history. Paper presented at “Short Course VI on Exploration for Geothermal Resources”, organized by UNU-GTP, GDC and KenGen, Lake Naivasha, Kenya, 11 pp. Ármannsson, H., Gíslason, G. and Torfason H., 1986: Surface exploration of the Theistareykir high-temperature geothermal area with special reference to the application of geochemical methods. Applied Geochemistry, 1, 47-64.

Long Hui 286 Report 14
Ármannsson, H., Kristmannsdóttir, H., Torfason, H. and Ólafsson, M., 2000: Natural changes in unexploited high temperature geothermal areas in Iceland. Proceedings of the World Geothermal Congress 2000, Kyushu-Tohoku, Japan, 521-526pp. Arnaldsson, A. Halldórsdóttir, S., Kjaran, S.P. and Axelsson, G., 2011: Mathematical model of the Theistareykir geothermal system and first assessment of production capacity. ÍSOR – Iceland Geosurvey,Reykjavík, report ÍSOR-2011/049 (in Icelandic), 58pp. Árnason, K., Karlsdóttir, R., Eysteinsson, H., Flóvenz, Ó. G. and Gudlaugsson, S. Th., 2000: The resistivity structure of high-temperature geothermal systems in Iceland. Oral presentation at IGA, Proceedings of the World Geothermal Congress 2000, Kyushu-Tohoku, Japan, 923-928 pp. Árnason, K., Haraldsson, G.I, Johnsen, G.V., Thorbergsson, G., Hersir, G.P., Saemundsson, K., Georgsson, L.S., Rögnvaldsson, S.Th. and Snorrason, S.P., 1987: Nesjavellir–Ölkelduháls. Surface exploration. Orkustofnun,Reykjavík, report OS-87018/JHD-02 (in Icelandic), 112 pp. Björnsson, S., Gudmundsdóttir, I.D., and Ketilsson, J., 2010: Geothermal development and research in Iceland. Orkustofnun, Reykjavík, 39 pp, website: www.nea.is/media/utgafa/GD_loka.pdf. Darling W.G. and Ármannsson H., 1989: Stable Isotopic aspects of fluid-flow in the Krafla, Námafjall and Theistareykir geothermal systems of Northeast-Iceland. Chemical Geology, 76-3/4, 197-213. Franzson, H., 1994: Nesjavellir. Details about alteration in a geothermal system. Orkustofnun, Reykjavík, report OS-94021/JHD-06 (in Icelandic), 34 pp. Franzson, H., Árnason,K., Saemundsson,K. and Gunnlaugsson, E., 2010: The Hengill geothermal system. Proceedings of the World Geothermal Congress 2010, Bali, Indonesia, 9 pp. Gíslason G., Johnsen, G.V., Ármannsson, H., Torfason, H., and Árnason, K., 1984: Theistareykir – geothermal prospecting in a high temperature field. Orkustofnun, report OS-84089/JHD-16 (in Icelandic), 134 pp. Gudmundsson, Á., Gautason, B., Lacasse, C., Axelsson, G., Thorgilsson, G., Ármannsson, H., Tulinius, H., Saemundsson, K., Karlsdóttir, R., Kjaran, S.P., Pálmarsson, S.Ó., Halldórsdóttir, S. and Egilson, Th., 2008: Conceptual model of the Theistareykir field and a volumetric resource assessment. ÍSOR – Iceland GeoSurvey, Mannvit Engineering and Vatnaskil Consulting Engineers, Reykjavík, report ÍSOR-2008/024, 67 pp. Grönvold, K.,and Karlsdóttir, R., 1975: Theistareykir. An interim report on the surface exploration of the geothermal field. Orkustofnun, Reykjavík, report OS-JHD-7501 (in Icelandic), 37pp. Haraldsdóttir, S.H., Franzson, H. and Árnason, K., 2012: Preliminary study of down-hole resistivity from 72 boreholes in the S-Hellisheidi Geothermal Field, SW-Iceland, with respect to surface resistivity data and alteration minerals. Proceedings 37th Workshop on Geothermal Reservoir Engineering, Stanford University, Stanford, Ca, 10 pp. Haraldsdóttir, S.H., Franzson, H., Árnason, K., Einarsson G.M., and Björnsson, H., 2010: Comparison of down-hole and surface resistivity data from the Hellisheidi geothermal field, SW-Iceland. Proceedings of the World Geothermal Congress 2010, Bali, Indonesia, 25-29. Karlsdóttir R. and Vilhjálmsson, A.M., 2011: MT and TEM survey at Theistareykir in 2009. ÍSOR-Iceland GeoSurvey, Reykjavík, report ÍSOR-2011/021 (in Icelandic), 78 pp.

Report 14 287 Long Hui
Karlsdóttir R., Vilhjálmsson A.M., Árnason K. and TeklesenbetB., A., 2012: Theistareykir geothermal area, Northern Iceland, 3D inversion of MT and TEM data, ÍSOR – Iceland GeoSurvey, Reykjavík, report ÍSOR-2012/046, 173 pp. (TeklesenbetB?) Karlsdóttir, R., Eysteinsson, H., Magnússon, I.Th., Árnason, K., and Kaldal, I., 2006: TEM resistivity surveying at Theistareykir and Gjástykki in 2004-2006. ÍSOR-Iceland GeoSurvey, Reykjavík, report ÍSOR-2006/028 (in Icelandic), 88 pp. Kristmannsdóttir, H. Alteration of Basaltic Rocks by Hydrothermal-Activity at 100-300°C. Developments in Sedimentology, 1979 (17), 359-367. Lu Q.H., Zhang X.X., and He Z.Y., 2012:Geothermal development and analysis home and abroad. China Petrochemical 2012, abstracts, 39. Saemundsson, K., 2007: Geology of the Theistareykir area. ÍSOR-Iceland GeoSurvey, Reykjavík, report ÍSOR-07270, 23 pp. Schlumberger, 2008.“Petrel introduction course”, Schlumberger, course material, 555pp. Stefánsson, V. and Steingrímsson, B.S., 1990: Geothermal logging I, an introduction to techniques and interpretation (3rd ed.). Orkustofnun, Reykjavik, report OS-80017/JHD-09, 117 pp. Steingrímsson, B., 2011a: Geothermal well logging: Cement bond and Caliper logs. Paper presented at “Short Course on Geothermal Drilling, Resource Development and Power Plants”, organized by UNU-GTP and LaGeo, Santa Tecla, El Salvador, 9 pp. Steingrímsson, B., 2011b: Geothermal well logging: Geological wireline logs and fracture imaging. Paper presented at “Short Course on Geothermal Drilling, Resource Development and Power Plants”, organized by UNU-GTP and LaGeo, Santa Tecla, El Salvador, 11 pp. Vilhjálmsson, A.M., Flóvenz, Ó.G., Karlsdóttir, R., Árnason, K., Eysteinsson, H. and Saemundsson, K., 2008: Geophysical evidence for magmatic transport in the lower crust in Iceland. Paper presented at AGU conference 2008, paper no.MR43A-1803. Yu G., He L.F., He Z.X., Strack, K.M. and Tulinius, H., 2008a: Iceland Theistareykir 2-D MT survey. Data processing and interpretation. Mannvit, Reykjavík, and KMS Technologies, report, 64 pp. Yu G., He L.F., Yang Y.J., He Z.X., and Strack, K.M., 2008b: Iceland Theistareykir magnetotelluric (MT) survey data processing and interpretation. Mannvit, Reykjavík, and KMS Technologies, report, 103 pp.