Resistivity Surveying OhmMapper Capacitively Coupled Resistivity System (CCR)
Proceedings World Geothermal Congress 2010 Bali, Indonesia, 25-29 April 2010
1
Comparison of Down-Hole and Surface Resistivity Data from the Hellisheidi Geothermal Field, SW-Iceland
Svanbjörg Helga Haraldsdóttir, Hjalti Franzson, Knútur Árnason, Gunnlaugur M. Einarsson and Hédinn Björnsson Iceland GeoSurvey (ÍSOR), Grensásvegur 9, 108 Reykjavík, Iceland
Keywords: Resistivity-logs, 3D resistivity, MT, TEM, high temperature geothermal field, Hellisheidi, Iceland, Petrel.
ABSTRACT
Resistivity-logs from boreholes are compared to a previously interpreted resistivity model from TEM and MT electromagnetic soundings in the high temperature geothermal field at Hellisheidi, which is a part of the Hengill volcano system, SW-Iceland.
Previous studies of resistivity from the geothermal system in the Hengill area have shown a low resistivity cap on the outer margins of the reservoir underlain by higher resistivity and further down a deep conductor which is below the depth of the present study. The resistivity pattern was explained with conduction of temperature alteration minerals which remained when a geothermal system cooled, thus the resistivity could be regarded as a “maximum thermometer”.
A low resistivity layer is also present in the well-logs in this study. On the other hand the depth and extensions of the low resistivity zones do not coincide completely with the interpreted resistivity from the surface measurements. Farther down there are less similarities between the results where relatively thin low resistivity layers appear in the resistivity logs. At depth there is less resolution in the interpreted resistivity from TEM and MT and no such small patterns appear.
Examples of recent results of XRD-analysis of hydrothermal alteration clay minerals are shown with the well logs. Simplified geological profiles and hydrothermal alteration minerals were compared to the resistivity logs with promising results.
A remaining question yet to be confirmed is if borehole logging can be further interpreted with respect to present or previous temperature, even as early as at the end of drilling.
1. INTRODUCTION
The aim of the study presented in this paper is to compare resistivity-logs from selected boreholes at Hellisheidi in the southern part of the Hengill volcano system, SW-Iceland, (Figures 1 and 2) with interpreted resistivity from TEM and MT electromagnetic soundings from previous studies.
The Hengill volcano system consists of three volcanic centers, Hengill, Graendalur and Hrómundartindur. The last eruption was in Hengill approximately two thousand years ago (Franzson et. al. 2005, 2010/submitted).
There are already two geothermal power plants in the Hengill geothermal system, i.e. at Nesjavellir and
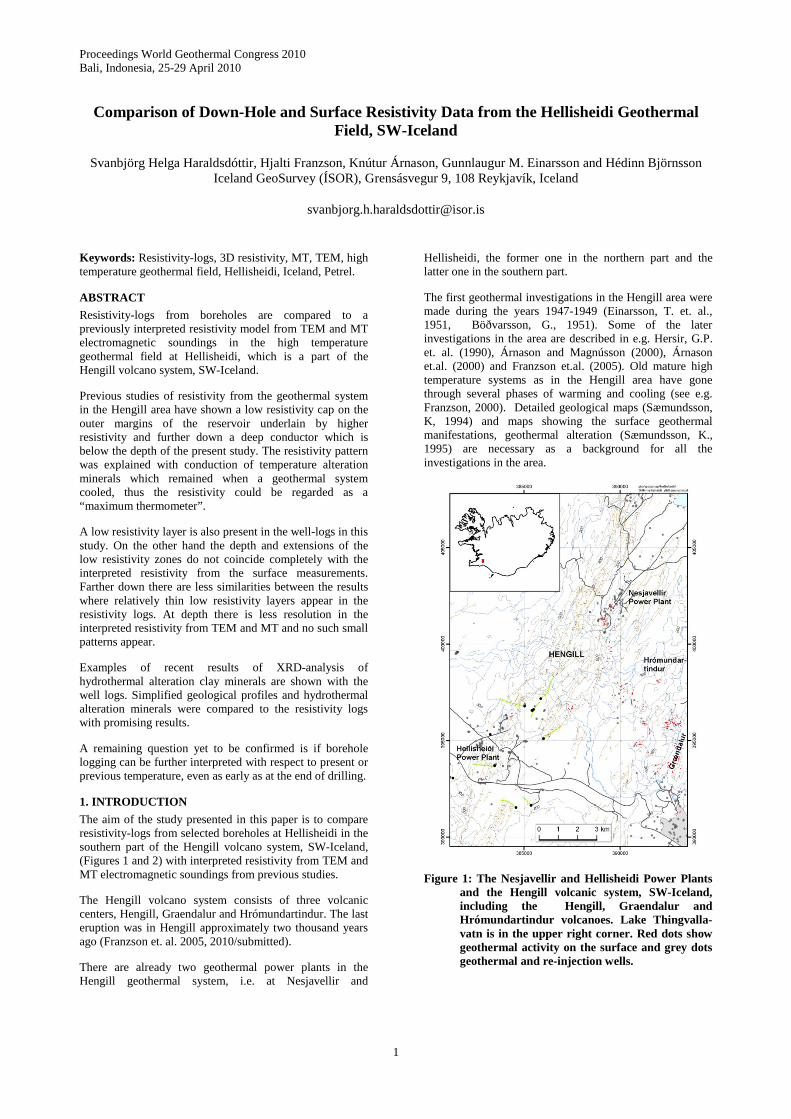
Hellisheidi, the former one in the northern part and the latter one in the southern part.
The first geothermal investigations in the Hengill area were made during the years 1947-1949 (Einarsson, T. et. al., 1951, Böðvarsson, G., 1951). Some of the later investigations in the area are described in e.g. Hersir, G.P. et. al. (1990), Árnason and Magnússon (2000), Árnason et.al. (2000) and Franzson et.al. (2005). Old mature high temperature systems as in the Hengill area have gone through several phases of warming and cooling (see e.g. Franzson, 2000). Detailed geological maps (Sæmundsson, K, 1994) and maps showing the surface geothermal manifestations, geothermal alteration (Sæmundsson, K., 1995) are necessary as a background for all the investigations in the area.
Figure 1: The Nesjavellir and Hellisheidi Power Plants and the Hengill volcanic system, SW-Iceland, including the Hengill, Graendalur and Hrómundartindur volcanoes. Lake Thingvalla-vatn is in the upper right corner. Red dots show geothermal activity on the surface and grey dots geothermal and re-injection wells.
Haraldsdóttir et al.
2
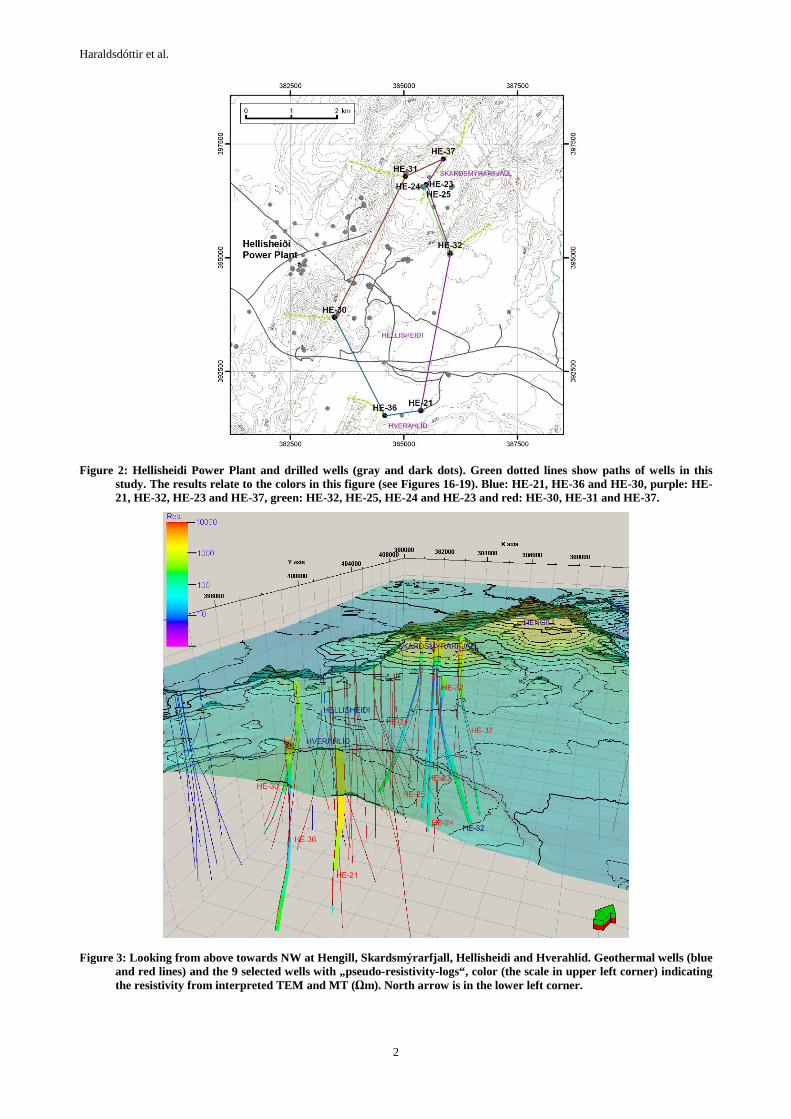
Figure 2: Hellisheidi Power Plant and drilled wells (gray and dark dots). Green dotted lines show paths of wells in this study. The results relate to the colors in this figure (see Figures 16-19). Blue: HE-21, HE-36 and HE-30, purple: HE-21, HE-32, HE-23 and HE-37, green: HE-32, HE-25, HE-24 and HE-23 and red: HE-30, HE-31 and HE-37.
Figure 3: Looking from above towards NW at Hengill, Skardsmýrarfjall, Hellisheidi and Hverahlíd. Geothermal wells (blue and red lines) and the 9 selected wells with „pseudo-resistivity-logs“, color (the scale in upper left corner) indicating the resistivity from interpreted TEM and MT (Ωm). North arrow is in the lower left corner.
Haraldsdóttir et al.
3
The main purpose of Reykjavík Energy is to provide hot water for central heating for Reykjavík city and its surroundings. Originally the geothermal water was mined from the low-temperature areas within Reykjavik but has expanded in more recent years to the nearby high-temperature area in Hengill which is used for geothermal heating and electricity.
High temperature wells are normally drilled in four stages; down to about 100 m for surface casing, to about 300 m for anchor casing and to 700-1100 m for the production casing, depending on the depth to the reservoir. The production section has a slotted liner, often down to 2000-3000 m depth (length in case of directional drilling). Mud circulation is frequently used while drilling down to the production casing and water or aerated circulation within the production part.
Borehole logging is done during and at the end of drilling each section of a geothermal well. These measurements include temperature, caliper, neutron-neutron (NN), gamma and resistivity-logs, as well as cement bond logging (CBL) for analyzing bonding after cementing a casing. In addition gyro-logging is done regularly during directional drilling to follow the build up of inclination and direction of the well. Only one borehole on each drill pad is lithologically logged to the depth of safety casing.
Studies of high temperature geothermal systems in Iceland have in general shown a low resistivity cap on the outer margins of the reservoir underlain by higher resistivity (Árnason et.al., 2000).
Recent results of studies from the Hengill area (Árnason et. al., in press) showed the low resistivity layer or cap underlain by higher resistivity as presented in previous studies, and further down, at 3-10 km depth, a deep conductor was detected, which is below the scope of this study. This was explained with alteration minerals having different conduction. In the low resistivity cap conductive alteration minerals in the smectite-zeolite zone dominated, which were formed at the heat range of about 50-200°C. At 200-240°C the zeolites disappear and the clay-mineral smectite is gradually replaced by mixed layer clay (mlc) and then into chlorite. The differences in resistivity were explained in the paper to be caused by loosely bound cations of the smectite and zeolite minerals which make them conductive, but the electrons are more strongly bound in the crystal lattice of chlorite, hence increasing the resistivity.
Alteration minerals indicate the geothermal temperature when they were formed. This does not always coincide with the true rock temperature. In Nielsson and Franzson (submitted) a recent study on the Hverahlid geology and hydrothermal alteration is introduced and in Helgadóttir et.al. (submitted) recent results about the alteration temperature and the true rock temperature in the Hellisheiði area were introduced. They found that parts of the geothermal system were cooling and parts of it were getting hotter. The resistivity has been found to be linked with the alteration minerals, therefore showing the alteration temperature and not the true rock temperature.
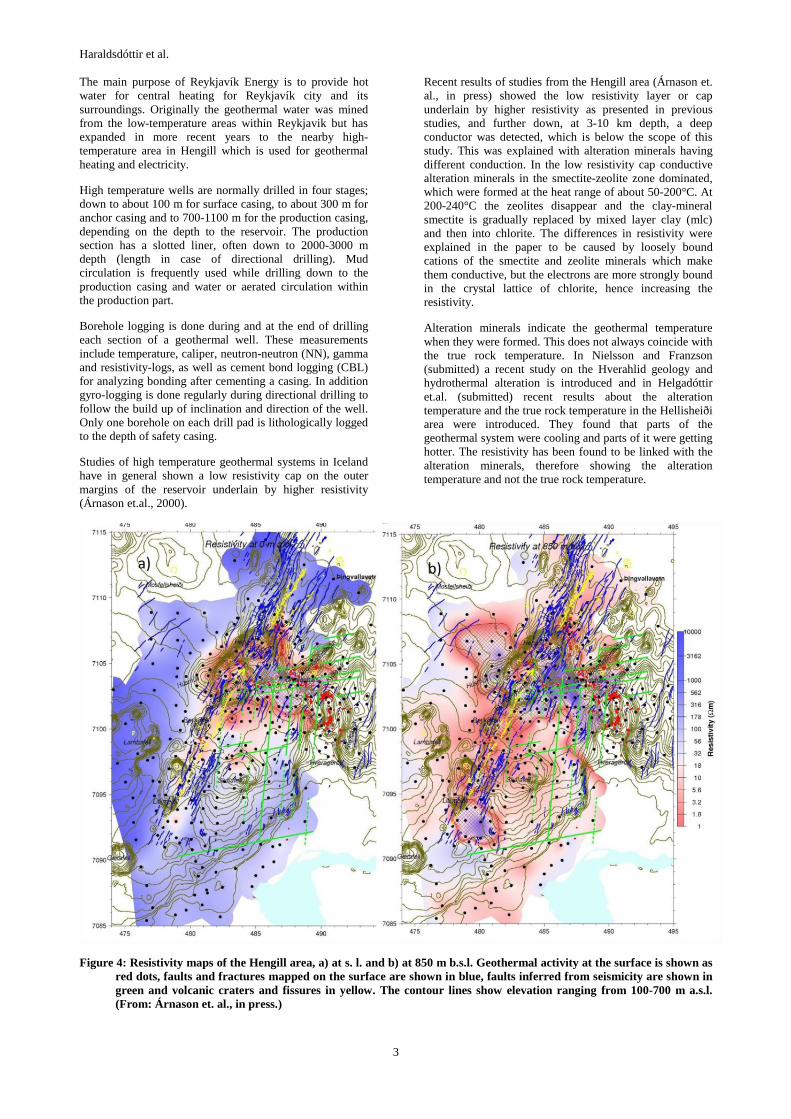
Figure 4: Resistivity maps of the Hengill area, a) at s. l. and b) at 850 m b.s.l. Geothermal activity at the surface is shown as red dots, faults and fractures mapped on the surface are shown in blue, faults inferred from seismicity are shown in green and volcanic craters and fissures in yellow. The contour lines show elevation ranging from 100-700 m a.s.l. (From: Árnason et. al., in press.)
Haraldsdóttir et al.
4
If a geothermal system cools the alteration minerals remain as well as the resistivity structure. The resistivity can therefore be regarded as a “maximum thermometer”, not necessarily representing the heat at present (Árnason et. al., in press). In this recent study additional investigations were made with MT and TEM in the southern part of the Hengill area, to get more detailed resistivity information. TEM measurements were added to make the net of measurements more complete as well as for overlapping of the TEM and MT measurements. The results were used to develop combined TEM and MT interpretations for resistivity. TEM only shows results down to approximately 1000 m below the surface, and only 500 m in case of low resistivity. MT on the other hand shows good results starting from ca. 500-1000 m depth and is used in this study down to three kilometers. In Figure 4 examples of the results of interpretations of TEM and MT are shown a) at sea level and b) at 850 m b.s.l.
Besides making an attempt to compare the resistivity found with these different methods, an interesting question was if the resistivity-logs could be correlated with various temperature dependant alteration minerals as was suggested by Árnason et. al. (in press). The processing of well-logs from Hellisheidi was initiated in 2009 and the 16” and 64” resistivity from 9 wells are introduced here. Here examples of results are shown but the study will be continued with further data processing, interpretation and comparison with results from from other Hellisheidi studies which are under way.
The integration of various well logs, cutting analysis, petrographic and XRD-analysis and other borehole data provide an insight into the geological surroundings of the geothermal reservoir.
Iceland GeoSurvey (ÍSOR) has taken care of geological and geophysical exploration prior to drilling wells in Hellisheiði as well as analyzing drill cuts and making borehole-logging during drilling. All of the measurements and investigations which this study is based on were done by Iceland GeoSurvey and National Energy Authority (OS) for Reykjavík Energy.
2. BACKGROUND
2.1 The Hengill Volcano System
Extensive active and fossil thermal surface manifestations (Figure 1) are found in the Hellisheidi area. Detailed geological and geophysical surveys were carried out prior to the drilling (e.g. Árnason et al. in press).
Over 70 wells have been drilled in the southern part of the Hengill volcano system, a mixture of exploration, production and reinjection wells. They are mostly directional, with up to four wells located at each drill pad. The high-temperature wells range in depth (length) from about 1000 to 3300 m. A number of cold groundwater wells have as well been drilled which are used during drilling and borehole logging.
A total of 28 exploration and production boreholes have been drilled in the Nesjavellir area, with depths ranging from a few hundred meters to 2200 m. The measured temperatures have reached up to a maximum of 380°C.
3. RESISTIVITY
3.1 Measuring and Processing Resistivity-Logs
The resistivity-logs in this study were measured using a normal configuration. The setup consists of four electrodes, two of which are fixed on the logging sonde in the well
(Stefánsson and Steingrímsson, 1990), the third one is placed at the surface and the armour of the logging cable is used as the fourth electrode. The two electrodes used for measuring the resistivity indirectly are located at 16” and 64” above a current electrode which is at the end of the cable. These are usually called 16” (R16) and 64” (R64) resistivity and calculated from a uniform current and measured potential at the relevant electrode. Details about the normal configuration and resistivity measurements may be seen in Well logging I (Stefánsson and Steingrímsson, 1990) and Fundamentals of well log interpretation (Serra, 1984).
As already mentioned logs are measured at the end of drilling each section of a well. The processing of the well-logs consists of corrections using software where the input and output files generally have the format depth, variable.
The data of the various files from a well section are first compared and the depth is corrected for consistency, using the surface as a reference point for all of the files. This is partly done by referring to the previous casing, partly by comparing the files.
The second step for the resistivity-logs is to correct them for well caliper, temperature and fluid conductivity. The circulation fluid used while drilling varies so its conduction at a fixed temperature is necessary for the corrections. The resistivity of the fluid as well as the rock formations depend on temperature. The software can handle calipers between 100 and 812 mm.
The third main step of processing the resistivity-logs consists of collecting the logs from the different sections in a well to get a continuous resistivity-log.
Contrasting layering detected in resistivity-logs from a borehole often coincides with variations in geological structures and geothermal alteration.
3.2 Interpreted Resistivity from TEM and MT
Interpretations of resistivity from electromagnetic soundings (TEM and MT) used for comparison in this study appear as points or layers below each of the measuring locations (Árnason et. al., in press). These often reach several kilometers below the surface, with thin layers in the upper part, increasing their thickness exponentially downwards.
3.3 Selected Resistivity-logs
Seven of the nine wells included in this study are directional. Only HE-21 and HE-24 are vertical wells and they are represented as points in Figures 2 and 3 where the paths of the directional wells are projected on the surface (green lines).
After the corrections of each resistivity-log and collecting the different sections of measurements to make one log of each type for each well, the continuous logs of 16” and 64” resistivity were imported into Petrel, a software derived from the petroleum industry.
3.4 Resistivity “pseudo-logs”
TEM and MT measurements used in this study have been made at 146 sites. The resulting 1D resistivity profiles were included in Petrel and interpolated to make a 3D resistivity model with increasing thicknesses of the layers with depth. The interpolation was made with a Kriging algorithm using a Gaussian semi-variogram and their horizontal range was 2500 m and the vertical range 2000 m.
Haraldsdóttir et al.
5
Along the path of each of the wells „pseudo-resistivity-logs“ were made by projecting the 3D-resistivity model onto the well-paths. The resistivity-logs from borehole logging, on the other hand, were averaged to have the same vertical resolution as the “pseudo-logs”.
4. RESULTS
4.1 Graphical Presentation of the Results
Gyro-logs showing the paths of the boreholes were first imported into Petrel after which all the well-logs were imported and linked to the relevant well-path. The resistivity- and other borehole-logs were inserted into Petrel as a function of measured depth (length). Through the coordinates of the well path in Petrel it is possible to switch automatically from measured depth over to depth b.s.l. The well-logs are presented here with sea level as a common reference called SSTVD in Petrel (standard sea level true vertical depth). The elevation of the well-tops varies hundreds of meters but the SSTVD scale helps in comparing common features between the wells.
Logs from each of the 9 wells (Figures 2 and 3) are shown in Figures 5-13, where resistivity is plotted using a logarithmic scale against depth in m b.s.l. The results shown in the figures include the corrected resistivity for the selected wells including both R16 (16” resistivity) and R64 (64” resistivity), which are in the first two columns, their averaged logs in the next two columns and in the last column the “pseudo-resistivity-log“ from the interpreted resistivity from MT and TEM measurements. The same resistivity scales are used in the figures, 1-10000 Ωm on a logarithmic scale, and the color code is the same in Figure 2. Simplified geological profiles are shown as well as clay alteration layers in two of the figures.
As mentioned earlier well logging in the first drilling sections of a well is only done in one well at each drill pad which explains partly why some of the selected well-logs are not continuous or do not reach the top. The top part should apply for all wells at a drill pad, since the wells are so close to each other.
An example of a 3D-presentation is in Figure 3 which shows a view of the drilled geothermal (red) and reinjection (blue) wells in the southern part of Hengill. The “pseudo-logs” (from TEM and MT) for the selected wells are also shown on the well tracks.
Two cross plots are presented in Figures 14 and 15 which show possibilities of a useful tool in analyzing future data in Petrel.
The first appearance of some of the temperature dependent alteration minerals from drill cuts analysis are shown in Figures 16-19. These are presented with a profile showing clay alteration minerals where available, R16, R64 and “pseudo-logs” from TEM and MT and the black lines indicate the location of feed points.
4.2 A Low Resistivity Zone
The resistivity logs show in general high resistivity at the top layers of the wells and a low resistivity zone underneath. The geological succession consists of lavas and hyaloclastites. The top layers are generally young and unaltered formations with water table lying at depth. The low resistivity zone can be seen both in the resistivity from borehole logging and the “pseudo-logs” from TEM and MT. The depth range of low resistivity in these resistivity-logs and “pseudo-logs” does not always coincide and they may vary in thickness. This can partly be explained by the
grid showing more resolution close to the surface than further down in the interpreted TEM and MT.
The averaged logs of R16 and R64 show relatively big differences from the primary logs e.g. with respect to the extension of low resistivity, showing clearly that information can be lost when reducing the resolution.
The low resistivity zone lies higher up in the geological succession in the “pseudo-logs” than in R16 and R64 in wells HE-23, HE-24, HE-25, HE-30 and HE-36. In wells HE-31, HE-32 and HE-37 the depths to the low resistivity zone are fairly similar in the resistivity-logs and the “pseudo-logs”. One of these wells is located below Skardsmýrafjall towards the south and two are towards the northwest and north of the top of Skardsmýrarfjall. HE-23, HE-24 and HE-25 are between them at the top of the mountain.
The low resistivity zone in the “pseudo-logs” seems to be fairly similar to the average resistivity logs (upscaled R16 and R64) except in HE-21. Two low resistivity zones are seen in the well logs as well as in the averaged R16 and R64 logs, where only one low resistivity zone is seen in the “pseudo-log” extended between the other two. The well, HE-21, is exceptional in several ways, e.g. with respect to the low resistivity zone, where the lowest 16” and 64” resistivity is at approximately 800-1050 m b.s.l. whereas the low resistivity in the other wells rarely extends below 500-600 m b.s.l. The possible reasons for this are explained in 4.3.
Both the averaged R16 and R64 and the “pseudo-logs” seem to have less extended low resistivity zone than the resistivity logs with full resolution.
Where additional low resistivity zones appear in the R16 and R64 logs farther down, as in HE-23 and HE-37, they do not appear in the “pseudo-logs”.
4.3 Resistivity, Feed Points and Alteration Minerals
Árnason et. al. (2000) showed a strong relation between resistivity and temperature dependent hydrothermal alteration in the Nesjavellir field. Basaltic rocks predominate in the Icelandic environment and the main minerals formed in these rocks are plagioclase, pyroxene, opaques and olivine. During glacials eruptives are quenched in glacial melt water resulting in glass becoming the dominant rock constituent. The glass and mineral phases show very variable sensitivity to alteration, where glass and olivine alters very readily, while other minerals are more resistant. Porosity and permeability are also important parameters in alteration, where highly porous rocks alter more readily than those with low values. That would imply that the highly porous hyalocalstites will alter much more readily than the tight and generally younger intrusions at depth. It must therefore be expected that resistivity will relate both to the type of alteration and the alteration intensity.
Feed points in a well can be detected from temperature logs and circulation losses during drilling. They often appear to coincide with the location of intrusions in the lower part of the reservoir (Franzson et. al., 2005). The intrusions are often linked with high resistivity while the feed points are often linked with low resistivity. If there is a corresponding pattern in the neutron-neutron log as in the resistivity logs, they can be used as an aid in defining or confirming feed points in a well.
Haraldsdóttir et al.
6
4.4 Simplified geology, alteration minerals and resistivity
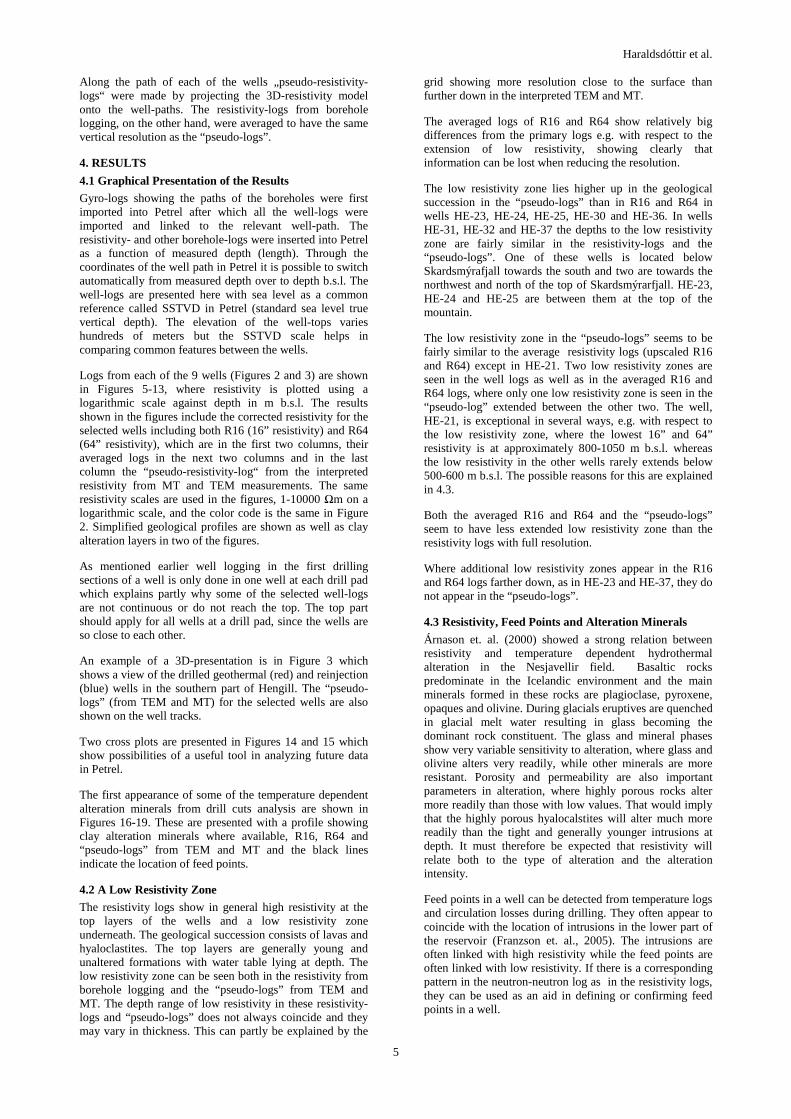
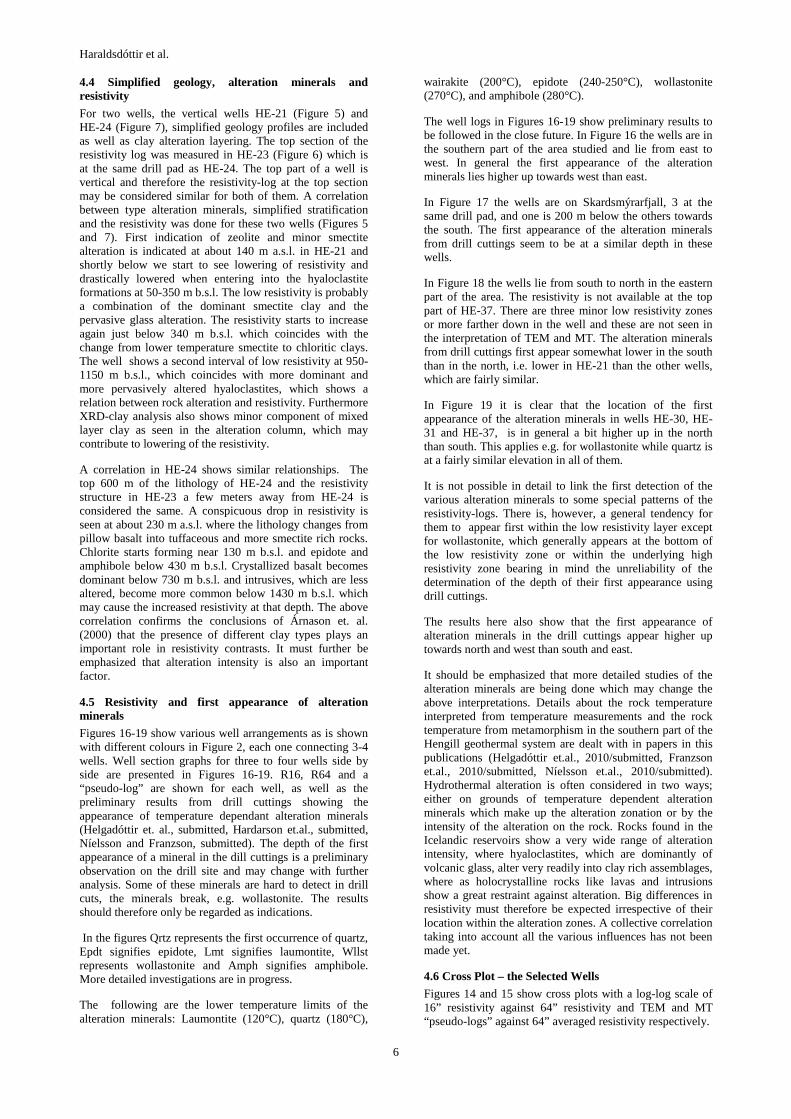
For two wells, the vertical wells HE-21 (Figure 5) and HE-24 (Figure 7), simplified geology profiles are included as well as clay alteration layering. The top section of the resistivity log was measured in HE-23 (Figure 6) which is at the same drill pad as HE-24. The top part of a well is vertical and therefore the resistivity-log at the top section may be considered similar for both of them. A correlation between type alteration minerals, simplified stratification and the resistivity was done for these two wells (Figures 5 and 7). First indication of zeolite and minor smectite alteration is indicated at about 140 m a.s.l. in HE-21 and shortly below we start to see lowering of resistivity and drastically lowered when entering into the hyaloclastite formations at 50-350 m b.s.l. The low resistivity is probably a combination of the dominant smectite clay and the pervasive glass alteration. The resistivity starts to increase again just below 340 m b.s.l. which coincides with the change from lower temperature smectite to chloritic clays. The well shows a second interval of low resistivity at 950-1150 m b.s.l., which coincides with more dominant and more pervasively altered hyaloclastites, which shows a relation between rock alteration and resistivity. Furthermore XRD-clay analysis also shows minor component of mixed layer clay as seen in the alteration column, which may contribute to lowering of the resistivity.
A correlation in HE-24 shows similar relationships. The top 600 m of the lithology of HE-24 and the resistivity structure in HE-23 a few meters away from HE-24 is considered the same. A conspicuous drop in resistivity is seen at about 230 m a.s.l. where the lithology changes from pillow basalt into tuffaceous and more smectite rich rocks. Chlorite starts forming near 130 m b.s.l. and epidote and amphibole below 430 m b.s.l. Crystallized basalt becomes dominant below 730 m b.s.l. and intrusives, which are less altered, become more common below 1430 m b.s.l. which may cause the increased resistivity at that depth. The above correlation confirms the conclusions of Árnason et. al. (2000) that the presence of different clay types plays an important role in resistivity contrasts. It must further be emphasized that alteration intensity is also an important factor.
4.5 Resistivity and first appearance of alteration minerals
Figures 16-19 show various well arrangements as is shown with different colours in Figure 2, each one connecting 3-4 wells. Well section graphs for three to four wells side by side are presented in Figures 16-19. R16, R64 and a “pseudo-log” are shown for each well, as well as the preliminary results from drill cuttings showing the appearance of temperature dependant alteration minerals (Helgadóttir et. al., submitted, Hardarson et.al., submitted, Níelsson and Franzson, submitted). The depth of the first appearance of a mineral in the dill cuttings is a preliminary observation on the drill site and may change with further analysis. Some of these minerals are hard to detect in drill cuts, the minerals break, e.g. wollastonite. The results should therefore only be regarded as indications.
In the figures Qrtz represents the first occurrence of quartz, Epdt signifies epidote, Lmt signifies laumontite, Wllst represents wollastonite and Amph signifies amphibole. More detailed investigations are in progress.
The following are the lower temperature limits of the alteration minerals: Laumontite (120°C), quartz (180°C),
wairakite (200°C), epidote (240-250°C), wollastonite (270°C), and amphibole (280°C).
The well logs in Figures 16-19 show preliminary results to be followed in the close future. In Figure 16 the wells are in the southern part of the area studied and lie from east to west. In general the first appearance of the alteration minerals lies higher up towards west than east.
In Figure 17 the wells are on Skardsmýrarfjall, 3 at the same drill pad, and one is 200 m below the others towards the south. The first appearance of the alteration minerals from drill cuttings seem to be at a similar depth in these wells.
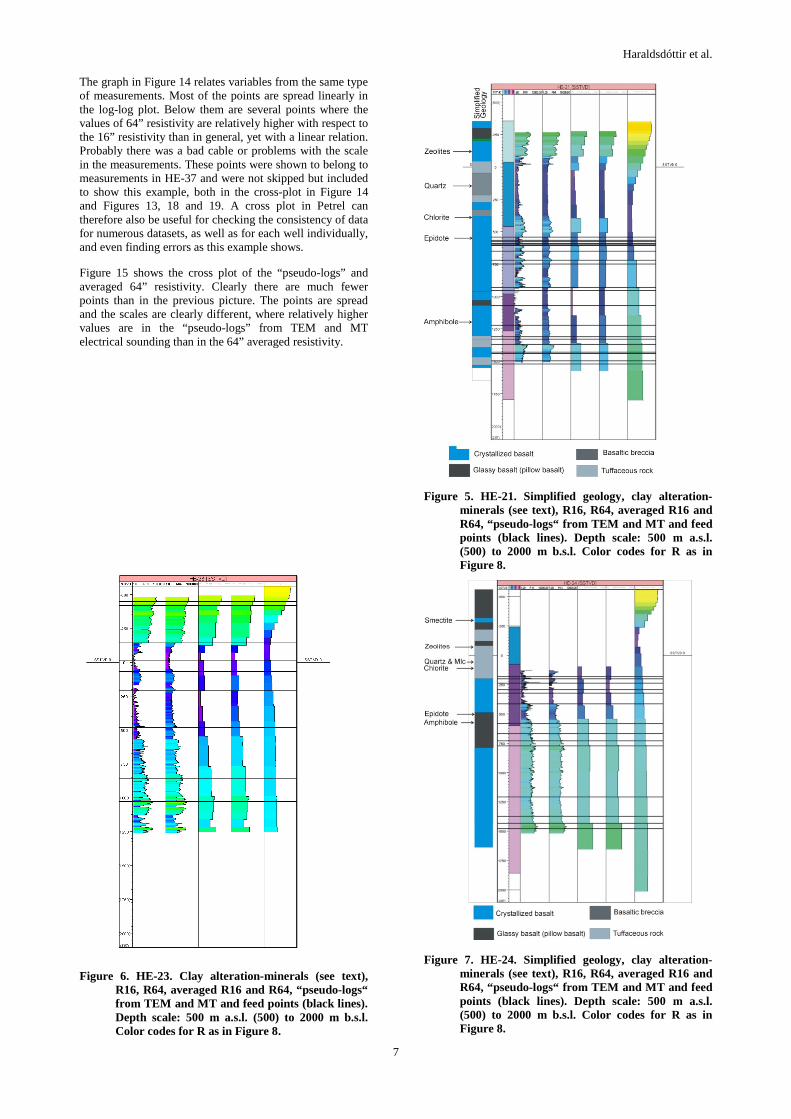
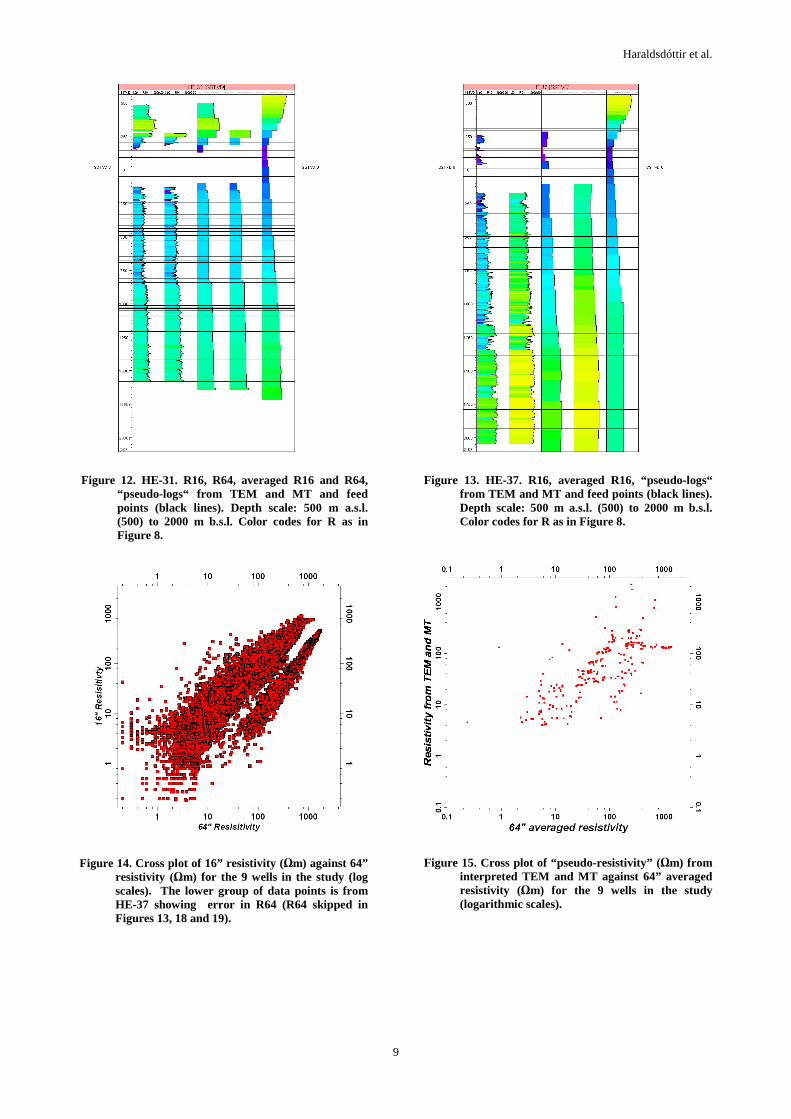
In Figure 18 the wells lie from south to north in the eastern part of the area. The resistivity is not available at the top part of HE-37. There are three minor low resistivity zones or more farther down in the well and these are not seen in the interpretation of TEM and MT. The alteration minerals from drill cuttings first appear somewhat lower in the south than in the north, i.e. lower in HE-21 than the other wells, which are fairly similar.
In Figure 19 it is clear that the location of the first appearance of the alteration minerals in wells HE-30, HE-31 and HE-37, is in general a bit higher up in the north than south. This applies e.g. for wollastonite while quartz is at a fairly similar elevation in all of them.
It is not possible in detail to link the first detection of the various alteration minerals to some special patterns of the resistivity-logs. There is, however, a general tendency for them to appear first within the low resistivity layer except for wollastonite, which generally appears at the bottom of the low resistivity zone or within the underlying high resistivity zone bearing in mind the unreliability of the determination of the depth of their first appearance using drill cuttings.
The results here also show that the first appearance of alteration minerals in the drill cuttings appear higher up towards north and west than south and east.
It should be emphasized that more detailed studies of the alteration minerals are being done which may change the above interpretations. Details about the rock temperature interpreted from temperature measurements and the rock temperature from metamorphism in the southern part of the Hengill geothermal system are dealt with in papers in this publications (Helgadóttir et.al., 2010/submitted, Franzson et.al., 2010/submitted, Níelsson et.al., 2010/submitted). Hydrothermal alteration is often considered in two ways; either on grounds of temperature dependent alteration minerals which make up the alteration zonation or by the intensity of the alteration on the rock. Rocks found in the Icelandic reservoirs show a very wide range of alteration intensity, where hyaloclastites, which are dominantly of volcanic glass, alter very readily into clay rich assemblages, where as holocrystalline rocks like lavas and intrusions show a great restraint against alteration. Big differences in resistivity must therefore be expected irrespective of their location within the alteration zones. A collective correlation taking into account all the various influences has not been made yet.
4.6 Cross Plot – the Selected Wells
Figures 14 and 15 show cross plots with a log-log scale of 16” resistivity against 64” resistivity and TEM and MT “pseudo-logs” against 64” averaged resistivity respectively.
Haraldsdóttir et al.
7
The graph in Figure 14 relates variables from the same type of measurements. Most of the points are spread linearly in the log-log plot. Below them are several points where the values of 64” resistivity are relatively higher with respect to the 16” resistivity than in general, yet with a linear relation. Probably there was a bad cable or problems with the scale in the measurements. These points were shown to belong to measurements in HE-37 and were not skipped but included to show this example, both in the cross-plot in Figure 14 and Figures 13, 18 and 19. A cross plot in Petrel can therefore also be useful for checking the consistency of data for numerous datasets, as well as for each well individually, and even finding errors as this example shows.
Figure 15 shows the cross plot of the “pseudo-logs” and averaged 64” resistivity. Clearly there are much fewer points than in the previous picture. The points are spread and the scales are clearly different, where relatively higher values are in the “pseudo-logs” from TEM and MT electrical sounding than in the 64” averaged resistivity.
Figure 6. HE-23. Clay alteration-minerals (see text), R16, R64, averaged R16 and R64, “pseudo-logs“ from TEM and MT and feed points (black lines). Depth scale: 500 m a.s.l. (500) to 2000 m b.s.l. Color codes for R as in Figure 8.
Figure 5. HE-21. Simplified geology, clay alteration-minerals (see text), R16, R64, averaged R16 and R64, “pseudo-logs“ from TEM and MT and feed points (black lines). Depth scale: 500 m a.s.l. (500) to 2000 m b.s.l. Color codes for R as in Figure 8.
Figure 7. HE-24. Simplified geology, clay alteration-minerals (see text), R16, R64, averaged R16 and R64, “pseudo-logs“ from TEM and MT and feed points (black lines). Depth scale: 500 m a.s.l. (500) to 2000 m b.s.l. Color codes for R as in Figure 8.

Haraldsdóttir et al.
8
Figure 8. HE-30. R16, R64, averaged R16 and R64, “pseudo-logs“ from TEM and MT and feed points (black lines). Depth scale: 500 m a.s.l. (500) to 2000 m b.s.l. The color codes in the upper left corner apply for all the resistivity-logs in the following pictures, 1-1000 Ωm.
Figure 10. HE-36. R16, R64, averaged R16 and R64, “pseudo-logs“ from TEM and MT and feed points (black lines). Depth scale: 500 m a.s.l. (500) to 2000 m b.s.l. Color codes for R as in Figure 8.
Figure 9. HE-25. R16, R64, averaged R16 and R64, “pseudo-logs“ from TEM and MT and feed points (black lines). Depth scale: 500 m a.s.l. (500) to 2000 m b.s.l. Color codes for R as in Figure 8.
Figure 11. HE-32. R16, R64, averaged R16 and R64, “pseudo-logs“ from TEM and MT and feed points (black lines). Depth scale: 500 m a.s.l. (500) to 2000 m b.s.l. Color codes for R as in Figure 8.
Haraldsdóttir et al.
9
Figure 12. HE-31. R16, R64, averaged R16 and R64, “pseudo-logs“ from TEM and MT and feed points (black lines). Depth scale: 500 m a.s.l. (500) to 2000 m b.s.l. Color codes for R as in Figure 8.
Figure 13. HE-37. R16, averaged R16, “pseudo-logs“ from TEM and MT and feed points (black lines). Depth scale: 500 m a.s.l. (500) to 2000 m b.s.l. Color codes for R as in Figure 8.
Figure 14. Cross plot of 16” resistivity (Ωm) against 64” resistivity (Ωm) for the 9 wells in the study (log scales). The lower group of data points is from HE-37 showing error in R64 (R64 skipped in Figures 13, 18 and 19).
Figure 15. Cross plot of “pseudo-resistivity” (Ωm) from interpreted TEM and MT against 64” averaged resistivity (Ωm) for the 9 wells in the study (logarithmic scales).

Haraldsdóttir et al.
10
Figure 16. HE-21, HE-36 and HE-30, in the southern part of the area, from east to west. R16, R64 and “pseudo-logs“ from interpretations of TEM and MT. Depth: 500 m a.s.l. (500) to 2000 m b.s.l. Color codes for R as in Figure 8.
Figure 17. HE-32, HE-25, HE-24 and HE-23, south of Skardsmýrarfjall and on the mountain. R16, R64 and “pseudo-logs“ from interpretations of TEM and MT. Depth: 500 m a.s.l. (500) to 2000 m b.s.l. Color codes for R as in Figure 8.

Haraldsdóttir et al.
11
Figure 18. HE-21, HE-32, HE-23 and HE-37, from south to north in the eastern part of the area. R16, R64 and “pseudo-logs“ from interpretations of TEM and MT. Depth: 500 m a.s.l. (500) to 2000 m b.s.l. Color codes for R as in Figure 8.
Figure 19. HE-30, HE-31 and HE-37, from south to north in the western part of the area. R16, R64 and “pseudo-logs“ from interpretations of TEM and MT. Depth: 500 m a.s.l. (500) to 2000 m b.s.l. Color codes for R as in Figure 8.
5. CONCLUSIONS AND FUTURE WORK
A fairly good correlation is found between resistivity-logs and “pseudo-logs” from electromagnetic sounding (TEM and MT). A low resistivity lay is everywhere present but its depth and extent varies between the different types of logs. One or more low resistivity zones are present in each of the R16 and R64 well logs. Their averaged resistivity logs coincide fairly well with the low resistivity layer in the
“pseudo-logs” except that the latter ones often lie tens of meters higher in the wells. A case where two extended low resistivity zones appeared in R16 and R64 (HE-21) only one appeared in the “pseudo-log” located between the other two but with relatively wide depth limits. Thinner low resistivity layers further down in the wells in R16 and R64 are not seen in the “pseudo-logs”.

Haraldsdóttir et al.
12
Both the averaged R16 and R64 and the “pseudo-logs” have a less extended low resistivity zone than the resistivity logs with full resolution. The logarithmic scale in the graphs hides to some extent the amplitude of the signal, which the average certainly does not and the resolution is lost by averaging.
Simplified geological profiles were presented for two of the wells as well as the clay alteration minerals from XRD-studies for the same wells. The correlation of these with the resistivity-logs showed to be good. The changes in resistivity were partly explained with changes in the alteration minerals, partly with geological layering, intrusions, fresher layers and hyaloclastites where porosity plays a major role as well.
Here only few examples of preliminary results from the wells in Hellisheidi are introduced. The future work includes correcting and collecting the remaining resistivity logs for each well, gradually leading to a resistivity model from the well-logs for the Hellisheidi area. It will be an interesting task to do correlations between the resistivity and other other types of well logs, the geological succession and results of alteration mineral studies such as XRD-analysis of clay which are under way. The study shows an example of what can be done, and the results are promising.
Comparing the resistivity resulting from electromagnetic soundings and resistivity logging will probably enhance the interpretation of the TEM-MT studies in future. The general pattern was similar but so were not the scales. Besides the results suffer from lack of resolution with dept, possibly important layers disappear in little resolution, not only in the pseudo-logs but also in the averaged R16 and R64 logs. In addition comparing the resistivity to the variations in alteration, lithology and temperature conditions will increase our skills in modeling the geothermal reservoir.
ACKNOWLEDGEMENTS
Reykjavík Power (OR) supported the project for this paper as well as Iceland GeoSurvey. Data from Einar Gunnlaugsson at OR, on the Hellisheidi, and the wells and Power Plant are acknowledged, to Páll Jónsson, Benedikt Steingrímsson and Gudni Axelsson for their advice and support at work, Peter E. Danielsen, Bjarni Kristinsson and Ragnar Bjarni Jónsson for their data preparation. This would not have been possible without the work of all the present and former employees of Iceland GeoSurvey (ÍSOR) who have worked with borehole logging and data preparation, as well as providing valuable information about previous data preparation and analysis. The geologists at ÍSOR have made enormous effort with drill cutting analysis.
REFERENCES
Árnason, K., Eysteinsson, H. and Hersir, G.P. Joint 1D inversion of TEM and MT data and 3D inversion of MT data in the Hengill area SW Iceland, Geothermics (In press).
Árnason, K. and Magnússon, I.Th. Jarðhiti við Hengil og á Hellisheiði. Niðurstöður viðnámsmælinga. Orkustofnun, OS-2001/091 (2001), 250.
Arnason, K., Karlsdottir, R., Eysteinsson, H., Flovenz, O.G., Gudlaugsson, S.Th. The resistivity structure of high-temperature geothermal systems in Iceland, Proceedings of the World Geothermal Congress 2000, Kyushu-Tohoku, Japan, (2000), 923-928.
Böðvarsson, G. Skýrsla um rannsóknir á jarðhita í Hengli, Hveragerði og nágrenni, árin 1947-1949. – Fyrri hluti.
Tímarit Verkfræðingafélags Íslands, 3-4 hefti, (1951), 1-48. (A report in Icelandic in the publication of the Icelandic association of engineers.)
Einarsson, T. Sigurgeirsson, Th., Tryggvason, T., Rist, s., Líndal, B. and Schwabe, H. Skýrsla um rannsóknir á jarðhita í Hengli, Hveragerði og nágrenni, árin 1947-1949. – Síðari hluti. Tímarit Verkfræðingafélags Íslands, 3-4 hefti, (1951), 49-82. (A report in Icelandic in the publication of the Icelandic association of engineers.)
Franzson, H. Hydrothermal Evolution of the Nesjavellir High-temperature System, Iceland. Proceedings of the World Geothermal Congress 2000, Kyushu-Tohoku, Japan, (2000), 2075-2080.
Fanzson, H., Kristjánsson, B.R., Gunnarsson, G., Björnsson, G.,Hjartarson, A., Steingrímsson, B., Gunnlaugsson, E. and Gíslason, G. The Hengill-Hellisheidi Geothermal Field. Development of a Conceptual Geothermal Model. Proceedings World Geothermal Congress, Antalya, Turkey, (2005).
Franzson, H., Árnason, K., Sæmundsson, K. and Gunnlaugsson E. The Hengill geothermal system. WGC-2010 Proceedings (2010 / Submitted).
Hardarson, B.S., Einarsson, G.M., Franzson, H., Helgadottir, H.M., Árnason, K., Ágústsson, K., Gunnlaugsson, E. and Kristjansson, B.R.: Geothermal Reinjection at the Hengill Triple Junction, SW Iceland. WGC-2010 Proceedings (2010 / Submitted).
Helgadóttir, H.M., Snæbjörnsdóttir, S.Ó., Níelsson, S. Gunnarsdóttir, S.H., Matthíasdóttir, T., Hardarson, B., Einarsson G.M., and Franzson, H.: Geology and Hydrothermal Alteration in the Reservoir of the Hellisheidi High Temperature System, SW-Iceland. WGC-2010 Proceedings, (2010 / Submitted).
Hersir, G.P., Björnsson, G., Björnsson, A. Eldstöðvar og jarðhiti á Hengilssvæðinu: jarðeðlisfræðileg könnun. Orkustofnun, OS-90031/JHD-06, (1990), 93.
Mortensen, A.K., Egilson, Th., Franzson, H., Richter, B., Ásmundsson, R.K., Steingrímsson, B., Danielsen, P.E., Thórisson, S. Hverahlíd - Hola HE-21, 3. áfangi. ÍSOR-20060/18, (2006), 79.
Nielsson, S. and Franzson, H. Geology and Hydrothermal alteration of the Hverahlid HT-system, SW-Iceland. WGC-2010 Proceedings, (2010 / Submitted).
Schlumberger. Petrel Introduction Course, (2008).
Serra, O. Fundamentals of well-log interpretation. 1. the acquisition of logging data. Elsevier science Publishers B.V., (1984), 423.
Stefánsson, V., and Steingrímsson, B.S., 1990: Geothermal logging I, an introduction to techniques and interpretation, 3rd edition. Orkustofnun, Reykjavík, report OS-80017/JHD-09, 117.
Sæmundsson, K. Hengill, jarðfræðikort (berggrunnur) 1:50000. Orkustofnun, Hitaveita Reykjavíkur og Landmælingar Íslands (1994). (A geological map of the Hengill area.)
Sæmundsson, K. Hengill, jarðhiti, ummyndun og grunnvatn, 1:25000. Orkustofnun, Hitaveita Reykjavíkur og Landmælingar Íslands (1994). (A map with geothermal manifestations, alteration and ground water in the Hengill area.)