Comparison between experimental data and … · Objectives: • To compare experimental data...
42
Comparison between experimental data and LedaFlow® for two-phase flow in pipelines Students: Fabio Lopez Hugo Pineda Supervisors: Nicolas Ratkovich Ricardo Carvalho July 15 th , 2013, Campinas - Brazil 1
-
Upload
duongquynh -
Category
Documents
-
view
222 -
download
0
Transcript of Comparison between experimental data and … · Objectives: • To compare experimental data...

Comparison between experimental data and LedaFlow® for two-phase flow in pipelines
Students:
Fabio Lopez
Hugo Pineda
Supervisors:
Nicolas Ratkovich
Ricardo Carvalho
July 15th, 2013, Campinas - Brazil1
Objectives:
• To compare experimental data against LedaFlow® in terms of:
– Flow patterns
– Void fraction
– Pressure gradient
• To compare empirical correlations against experimental data andLedaFlow® in terms of:
– Void fraction
– Pressure gradient
• To generate reliable synthetic data in LedaFlow® to train neuralnetworks.
2

Software tools used: LedaFlow®
1. Base case with the interface
3
2. Generation of .qs file and parametrization throught scripting

4
3. Several cases simulation with the command line
4. Export results of interest variables into .csv files
MATLAB®
– A program was developed to determine void fraction (67empirical correlations) and pressure drop (6).
– The program can group the data according to any of theparameters used.
– To select the correlation that best fits the data according toRMS error criteria.
– Calculation of the void fraction for operating conditions andfluids in the database by Pereyra 2012 and Choi 2012.
5

Data base:
• “An Efficient Drift-Flux Closure Relationship to Estimate LiquidHoldups of Gas-Liquid Two-Phase Flow in Pipes ”
– Choi et al. 2012
• 1136 data points used to compare experimental data againstLedaFlow® results in terms of void fraction and pressure drop.
6
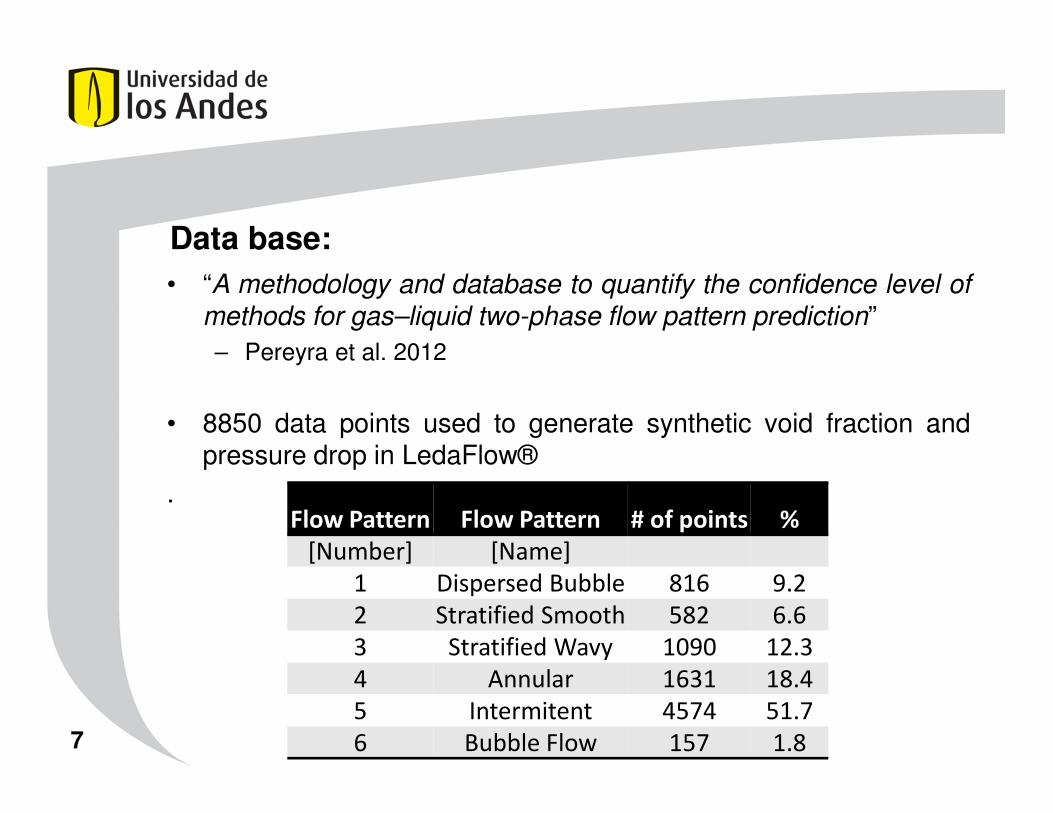
Data base:
• “A methodology and database to quantify the confidence level ofmethods for gas–liquid two-phase flow pattern prediction”
– Pereyra et al. 2012
• 8850 data points used to generate synthetic void fraction andpressure drop in LedaFlow®
.Flow Pattern Flow Pattern # of points %
[Number] [Name]
1 Dispersed Bubble 816 9.2
2 Stratified Smooth 582 6.6
3 Stratified Wavy 1090 12.3
4 Annular 1631 18.4
5 Intermitent 4574 51.7
6 Bubble Flow 157 1.87
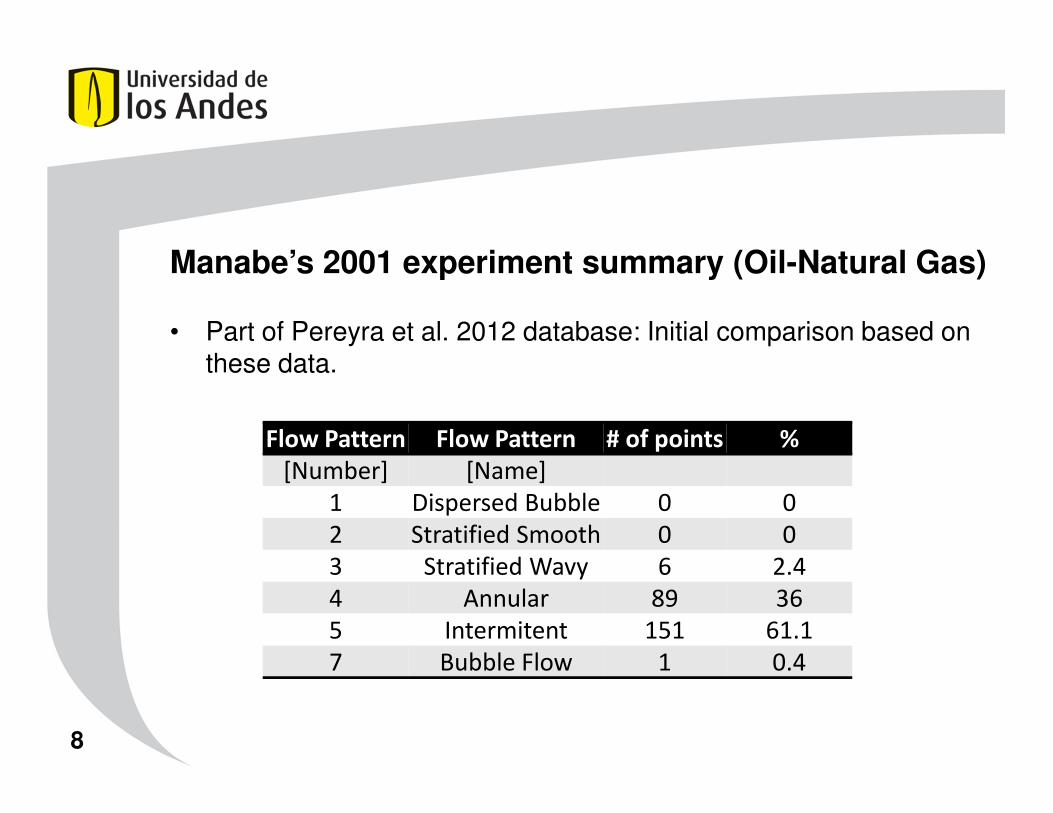
Manabe’s 2001 experiment summary (Oil-Natural Gas)
• Part of Pereyra et al. 2012 database: Initial comparison based on these data.
Flow Pattern Flow Pattern # of points %
[Number] [Name]
1 Dispersed Bubble 0 0
2 Stratified Smooth 0 0
3 Stratified Wavy 6 2.4
4 Annular 89 36
5 Intermitent 151 61.1
7 Bubble Flow 1 0.4
8

Manabe’s experiment summary (Oil-Natural Gas)
9
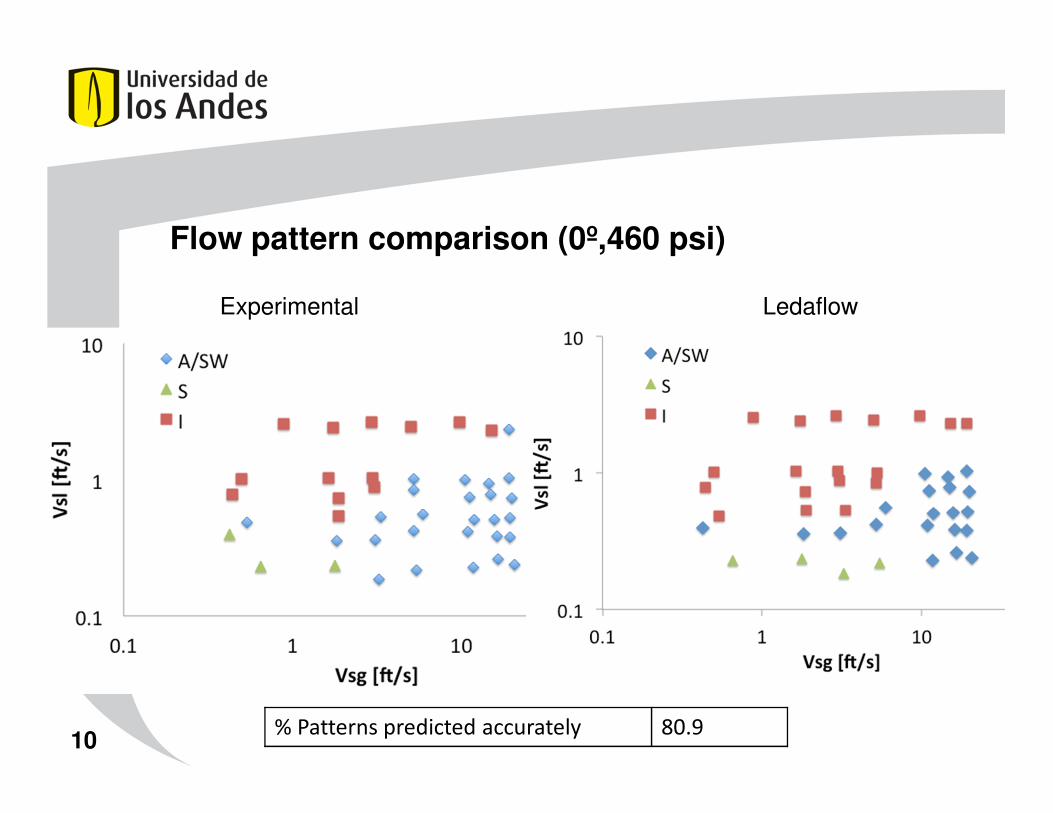
Flow pattern comparison (0º,460 psi)
10% Patterns predicted accurately 80.9
Experimental Ledaflow

Flow pattern comparison (90º,460 psi)
11% Patterns predicted accurately 92.7
Experimental Ledaflow
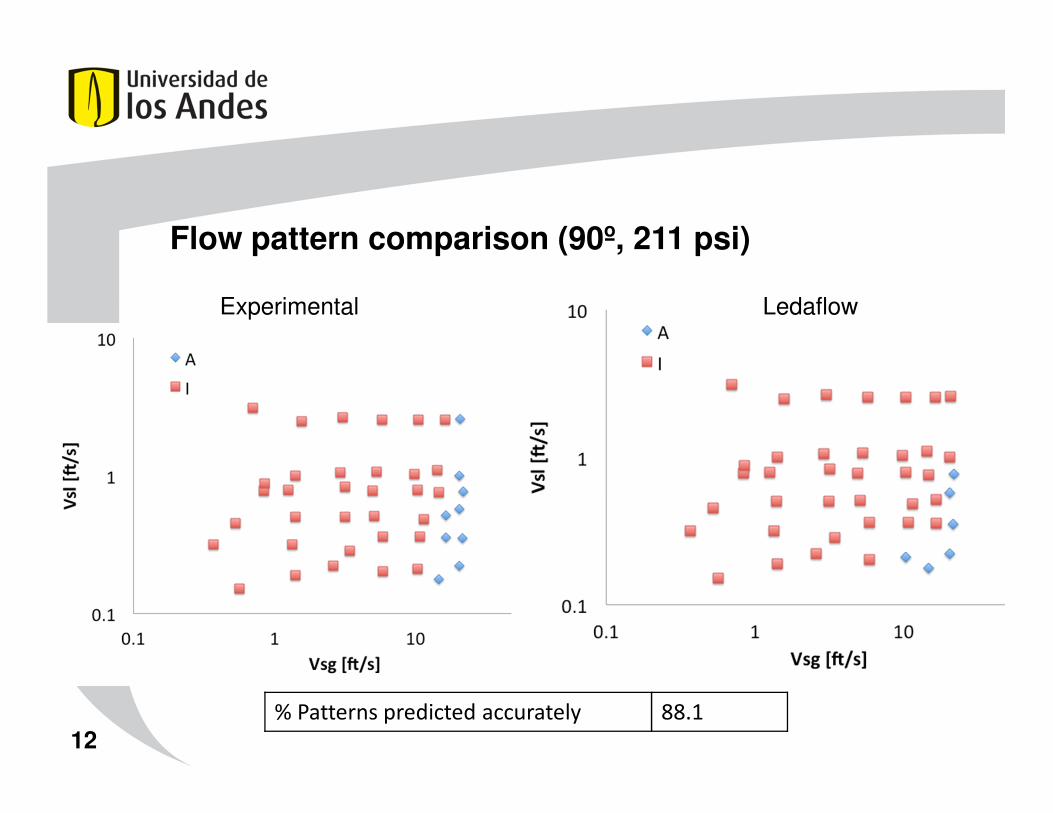
Flow pattern comparison (90º, 211 psi)
12
% Patterns predicted accurately 88.1
Experimental Ledaflow

13
Flow pattern comparison (1º, 465 psi)
Experimental Ledaflow
% Patterns predicted accurately 94.7
14
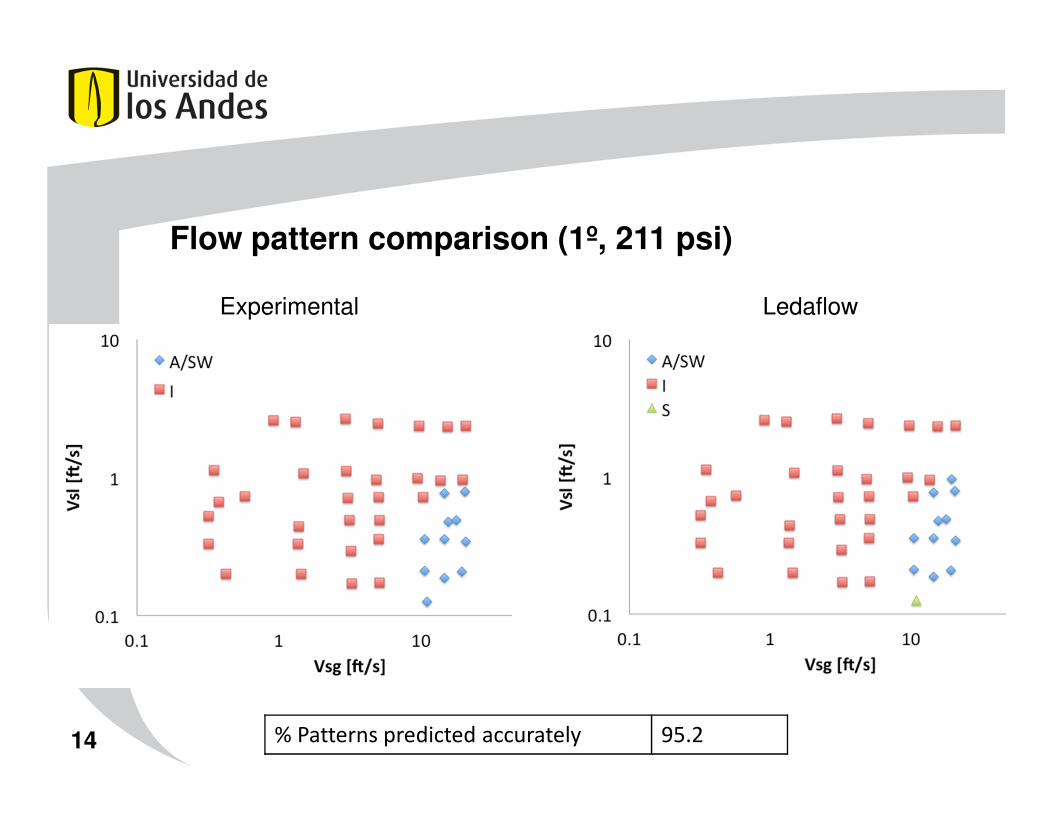
Flow pattern comparison (1º, 211 psi)
Experimental Ledaflow
% Patterns predicted accurately 95.2

Void fraction comparisonManabe (2001)Oil-Natural gas
15

LedaFlow® - Empirical correlations (0º, 211 psi)
16
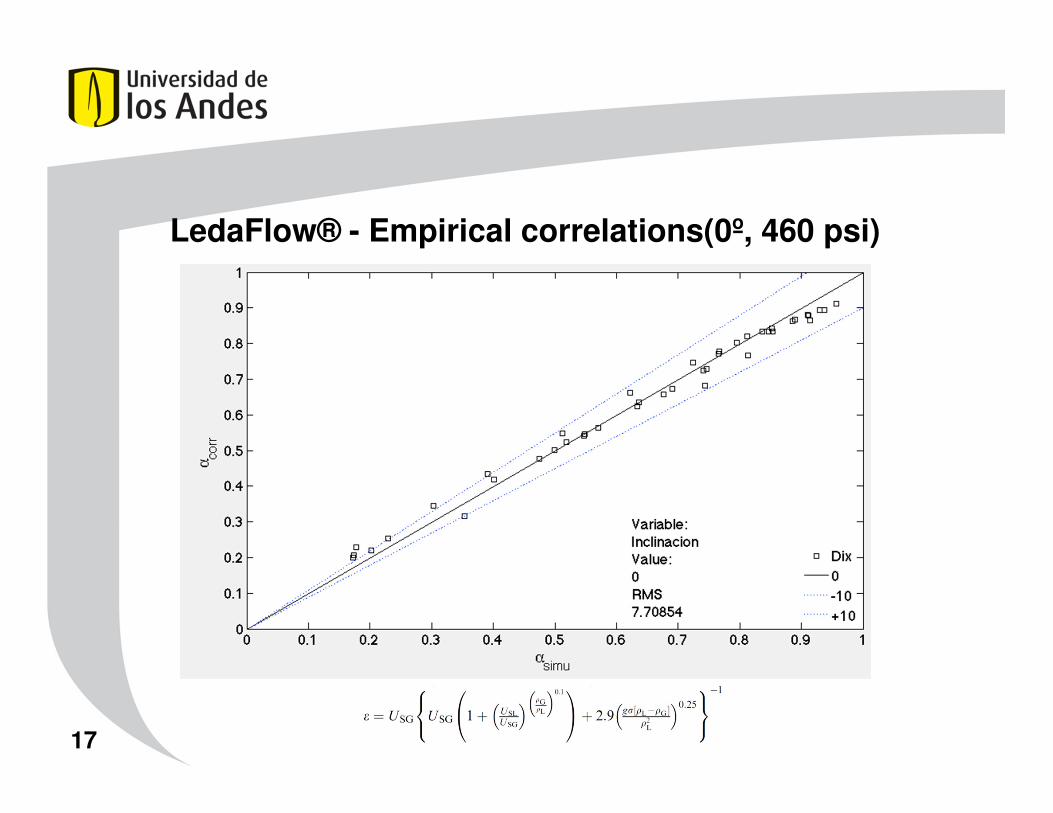
LedaFlow® - Empirical correlations(0º, 460 psi)
17

LedaFlow® - Empirical correlations (1º, 211 psi)
18
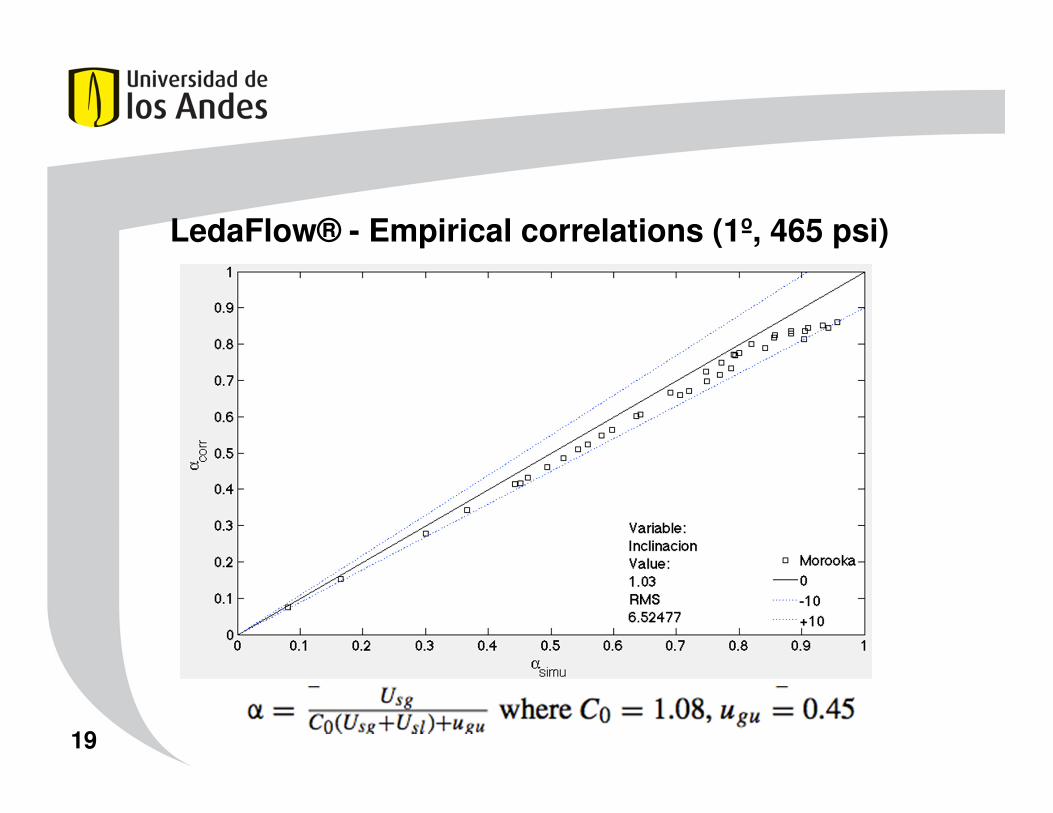
LedaFlow® - Empirical correlations (1º, 465 psi)
19
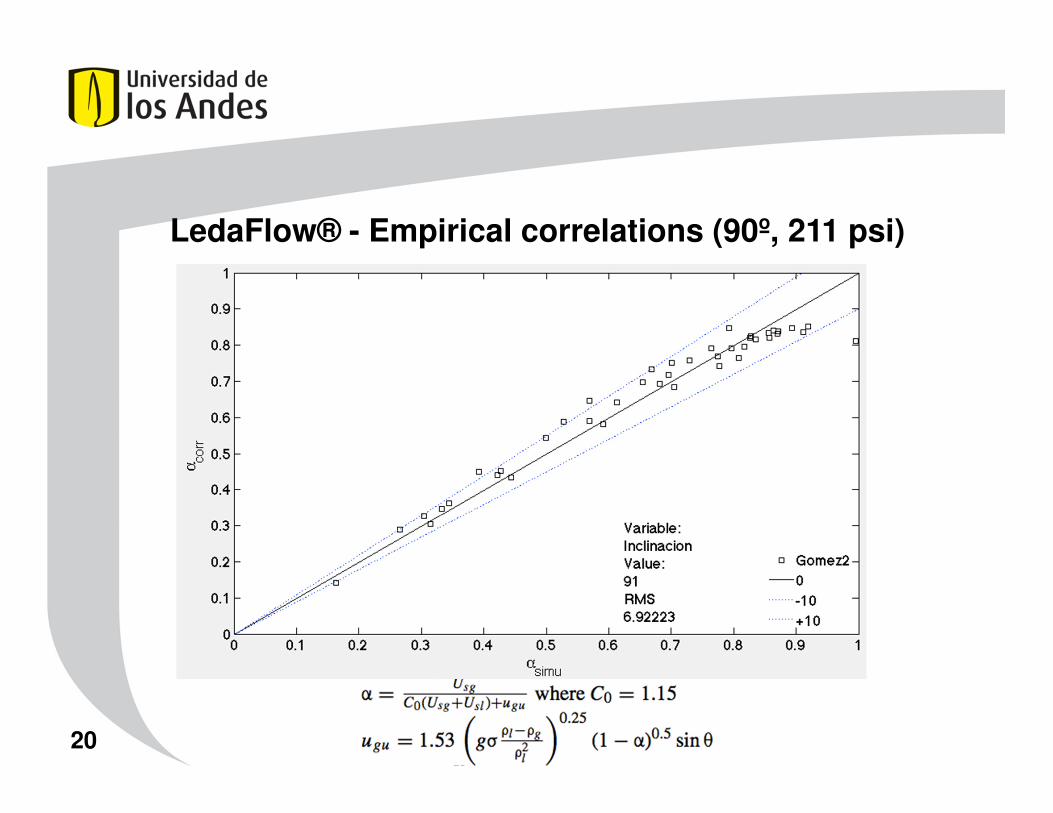
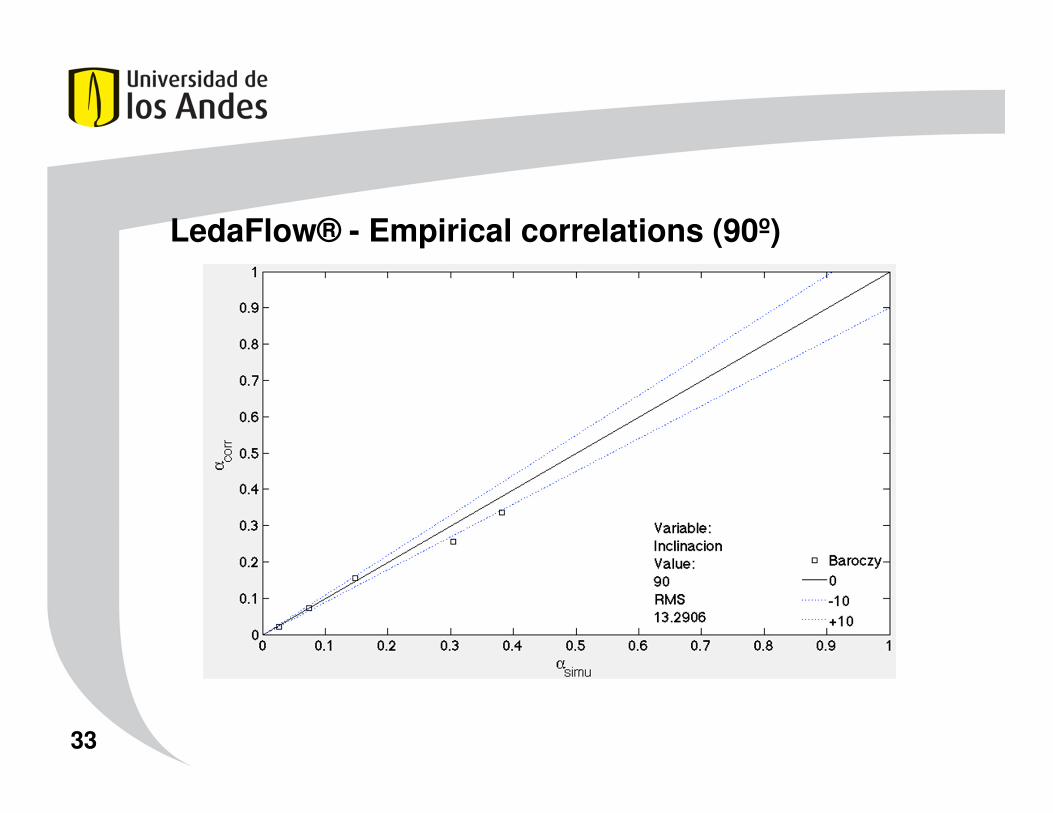
LedaFlow® - Empirical correlations (90º, 211 psi)
20

LedaFlow® - Empirical correlations (90º, 465 psi)
21

Void fraction comparisonGokcal (2005, 2008)
Oil-AirHorizontal pipe
22
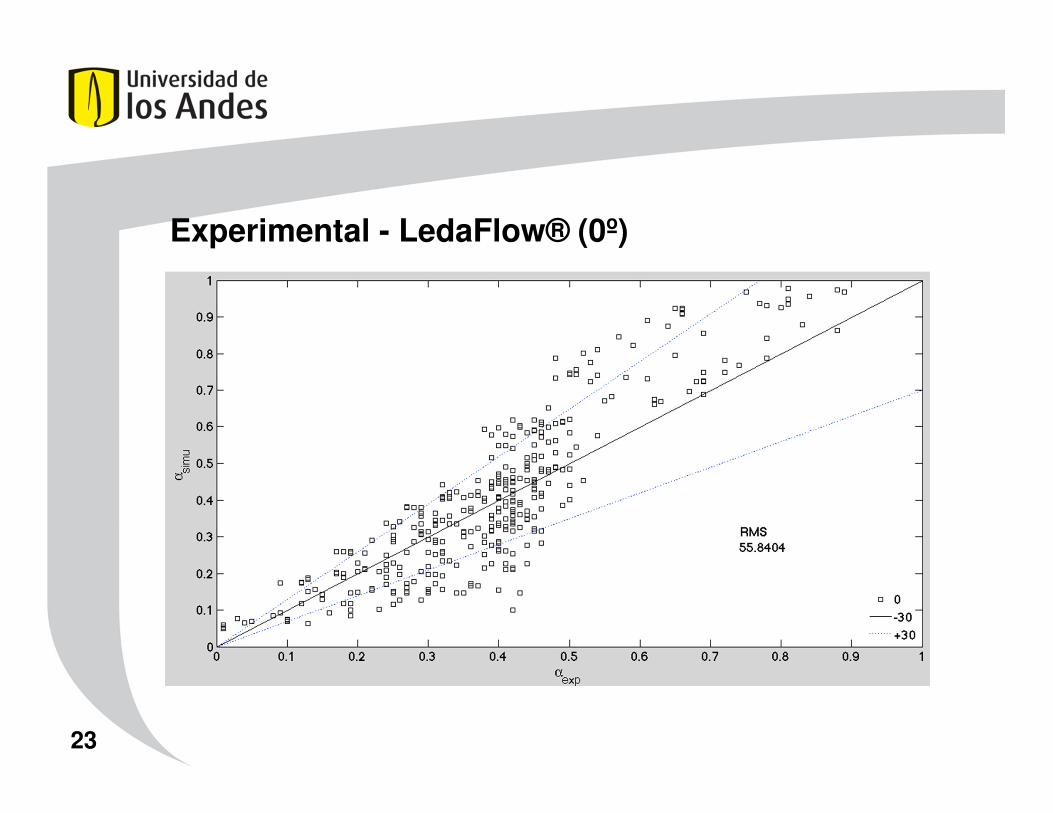
Experimental - LedaFlow® (0º)
23

Experimental - Empirical correlations (0º)
24

LedaFlow® - Empirical correlations (0º)
25

Void fraction comparisonFelizola (1992), Roumazeilles (1994)
Kerosene-AirInclined pipe
26

Experimental - LedaFlow® (-30º, -90º, 0.9 – 2 bar)
27

Experimental - Empirical correlations (-30º, -90º, 0.9 -2 bar)
28

LedaFlow® - Empirical correlations (-30º-90º, 0.9 - 2 bar)
29

Void fraction comparisonCarvalho (2013)
Oil-Air
30

31
Experimental - LedaFlow® (90º)

32
Experimental - Empirical correlations (90º)
33
LedaFlow® - Empirical correlations (90º)

34
Reference
RMS
Ledaflow
-Exp
RMS
Ledaflow-
Corr
RMS
Exp-
Corr
Remarks
Manabe 0º, 460 psi - 7.7 -
Void fraction data
not available
Manabe 0º, 211 psi - 5.9 -
Manabe 1º, 465 psi - 6.0 -
Manabe 1º, 211 psi - 5.3 -
Manabe 90º, 465 psi - 6.4 -
Manabe 90º, 211 psi - 6.6 -
Gokcal 55.4 13.7 24.6 Incomplete data
Roumazeilles & Felizola 12.2 8.2 12.6
Carvalho 6.5 12.4 10.5
Void fraction results summary
35
Pressure drop comparisonGokcal (2005, 2008)
Oil-Air

36
Experimental - LedaFlow® (0º)

37
Pressure drop comparisonFelizola(1992), Roumazeilles(1994)
Kerosene-Air
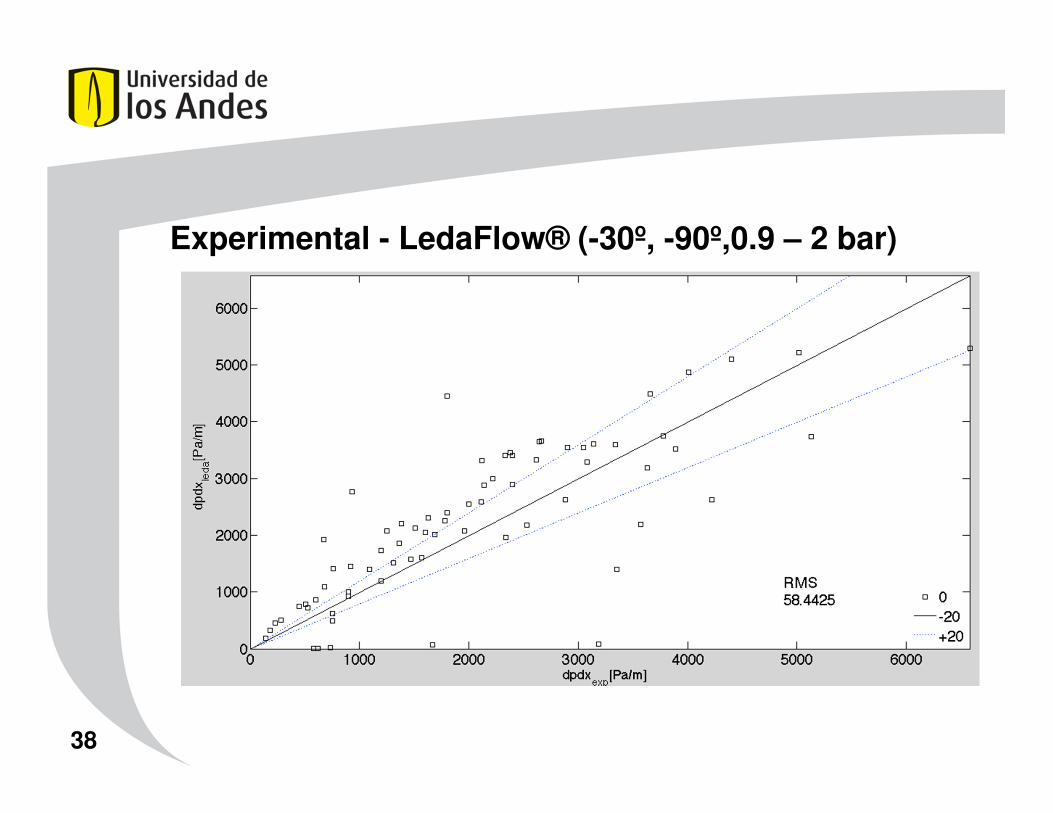
38
Experimental - LedaFlow® (-30º, -90º,0.9 – 2 bar)

Future Developments
39
Source Flow Pattern Void Fraction Pressure Drop
Pereyra X O O
Inoue’s X X O
Carvalho X X O
Choi O X X
Others O X X
O: Data to complete for neural network training
• To train neural networks for void fraction,
pressure drop and flow pattern determination.

Data base:
• Eduardo Inoue
.
40
Pattern # of data points %
Slug Flow 170 37.3
Vertical Annular 78 17.1
Intermitent 75 16.4
Horizontal Annular 57 12.5
Stratified 51 11.2
Vertical Dispersed Bubbles 25 5.5
Horizontal Dispersed Bubbles 0 0.0
Conclusions
41
• Ledaflow results are in good agreement with experimentalresults.
• Synthetic data generation with Ledaflow is a promising tool totrain neural networks provided the physical properties andoperating conditions are available.
• Ledaflow simulations can be adapted to match the requirementspresented by the neural network development.

Bibliography
• Choi, J; Pereyra, E; Sarica, C; Park, C; Kang, J. An Efficient Drift-Flux
Closure Relationship to Estimate Liquid Holdups of Gas-Liquid Two-
Phase Flow in Pipes. Energies. 2012, 5, 5294-5306.
• Woldesemayat, M; Ghajar, A. Comparison of Void Fraction Correlations
for Different Flow Patterns in Horizontal and Upward Inclined Pipes. Int.
J. Multiphase Flow. 2007, 6, 347-370.
• Pereyra, E; Torres, C; Mohan, R; Gomez, L; Kouba, G; Shoham, O. A
Methodology and Database to Quantify the Confidence Level of
Methods for Gas-Liquid Two-Phase Flow Pattern Prediction. Chem.
Eng. Research and Design. 2012, 90, 507-513.
• Godbole, P; Tang, C; Ghajar, A. Comparison of void fraction correlations
for different flow patterns in upward vertical two phase flow. Heat transfer Eng. 2011, 32, 843-860.
42