
Comparative Perceptions of the Undergraduate Experience NEW3
32
Comparative perceptions and experiences-UCUES 2008 1 Office of Student Research UCSD Comparative Perceptions of the Undergraduate Experience: Selected Findings from the 2008 University of California Undergraduate Experiences Survey (UCUES) Background In 2008, the University of California, San Diego (UCSD) participated in the fifth administration of the University of California Undergraduate Experiences Survey (UCUES). The UCUES is part of a major research effort in support of the Student Experience in the Research University in the 21st Century (SERU21) project. Established in summer 2001, SERU21 is based at the Center for Studies in Higher Education at UC Berkeley and is a collaborative project involving all the UC campuses. The first phase of SERU21 was jointly funded by the UC Office of the President and by campus student affairs divisions from each of UC's general undergraduate campuses. There are two primary objectives of the SERU21 Project: • To develop new data that can assist policy development and improve the undergraduate experience, and, • To create a new resource to promote scholarly research and reflection in this field. What is UCUES? The University of California Undergraduate Experience Survey (UCUES) is an online survey that UCSD undergraduate students have been invited to complete during the spring quarter in 2002, 2004, 2004, 2006, and 2008. The
Transcript of Comparative Perceptions of the Undergraduate Experience NEW3
Comparative perceptions and experiences-UCUES 2008 1 Office of Student Research UCSD
Comparative Perceptions of the Undergraduate Experience: Selected Findings from the 2008 University of California
Undergraduate Experiences Survey (UCUES)
Background
In 2008, the University of California, San Diego (UCSD) participated in
the fifth administration of the University of California Undergraduate
Experiences Survey (UCUES). The UCUES is part of a major research effort in
support of the Student Experience in the Research University in the 21st Century
(SERU21) project. Established in summer 2001, SERU21 is based at the Center
for Studies in Higher Education at UC Berkeley and is a collaborative project
involving all the UC campuses. The first phase of SERU21 was jointly funded by
the UC Office of the President and by campus student affairs divisions from each
of UC's general undergraduate campuses. There are two primary objectives of the
SERU21 Project:
• To develop new data that can assist policy development and improve the undergraduate experience, and,
• To create a new resource to promote scholarly research and reflection in this field.
What is UCUES?
The University of California Undergraduate Experience Survey (UCUES)
is an online survey that UCSD undergraduate students have been invited to
complete during the spring quarter in 2002, 2004, 2004, 2006, and 2008. The
Comparative perceptions and experiences-UCUES 2008 2 Office of Student Research UCSD
survey was originally supported financially at UCSD by the Vice Chancellor for
Student Affairs and logistically by the UCSD Office of Student Research and
Information (SRI). The success and value of the UCUES prompted system-wide
support by the UC Office of the President for the 2006 and 2008 administrations.
UCUES 2008 employed a modular design to allow for the inclusion of a
greater number of items and a decrease in individual response time. The
questionnaire contained a set of core questions administered to every respondent
plus five unique modules of additional questions that were randomly assigned to
subjects. The core questions focused primarily on topics related to academic
program review but also covered student demographics, use of time, campus life
perceptions and experiences, and general satisfaction with various dimensions of
the undergraduate experience. The four common modules include Academic
Engagement, Civic Engagement, Student Development, and Student Services. A
fifth module allowed individual campuses to survey their students on issues of
campus concern. The modular design enabled over 700 items to be included that
measured and assessed the UC student experience.
UCUES provides information about student behavior including their use of
time for working, studying, campus involvement, socializing, family; how they
participate academically (i.e. how much course material they read, collaborative
learning); self-ratings of academic and interpersonal skills; and involvement in
Comparative perceptions and experiences-UCUES 2008 3 Office of Student Research UCSD
community service. Students were asked to evaluate many different aspects of
campus life including student services, academic advising, campus climate,
courses and instruction, and interaction with faculty.
The instrument also gathers extensive data on student attitudes such as
their self-perceptions and goals, gains in learning and academic proficiency,
political beliefs and affiliation, and views of the role of the research university in
society at large. The UCUES also collects background information not available
from other student data sources, particularly family immigration background and
socioeconomic data.
For UCSD, the UCUES is a valuable resource. Information gathered
through UCUES is used by campus departments and units to assess a variety of
programs and services. These data are useful to inform our efforts to continually
improve the undergraduate experience. As a UC system-wide survey, the UCUES
provides a unique opportunity to compare the experiences of UCSD students to
other UC campuses. The availability of comparative data provides our campus
community with both normative and referential data that assist in the
interpretation and applicability of our findings to the improvement of
undergraduate life at UCSD.
The results from prior administrations of the UCUES are available from
the “Surveys” section of the UCSD Student Research and Information website:
Comparative perceptions and experiences-UCUES 2008 4 Office of Student Research UCSD
http://studentresearch.ucsd.edu/. This research brief focuses on
comparative perceptions of campus climate and broad measures of satisfaction
with the UCSD undergraduate experience disaggregated by student racial and
ethnic groupings.
Selected Findings
This summary provides selected climate and satisfaction comparison data
for UCSD students disaggregated by racial and ethnic grouping, and the norms
for the UCSD campus on the same items. In general, the UCUES findings
suggested limited practical differences between the responses of the identified
racial and ethnic groupings and the campus average. However, for certain items
there are instances where differences between the responses for the identified
racial and ethnic grouping and the campus norms comes close to or exceeds 10%
either positively or negatively. This research brief will discuss these selected
indicators and identify those responses that achieve or exceed a 10% difference in
response patterns by racial/ethnic grouping and the campus total.
Response rates to the UCUES were sufficiently high enough to suggest the
statistical reliability of the UCUES 2008 findings. Over 63,000 UC students
responded to the UCUES survey in 2008, and UCSD received over 8100
responses for the UCUES “core” survey, and approximately 2,300 responses for
the individual UCUES modules.
Comparative perceptions and experiences-UCUES 2008 5 Office of Student Research UCSD
Campus Climate and the Undergraduate Experience
As defined by CPEC (1990), campus climate is defined as the “the relative
significance of various factors that contribute or detract from an equitable and
high quality educational experience, particularly by women and students from
historically under-represented groups.” Inherent in this definition is the
importance of various factors influencing the perceived level of equity provided
in students’ educational experiences. Thus campus climate can be construed as a
broad, wide-ranging construct that must be assessed using different research
approaches and at various levels throughout an institution as complex as today’s
research university. This research summary provides a broad overview of
selected indicators of campus climate obtained from the UCUES disaggregated
by racial and ethnic groupings. Additional data for these same indicators
disaggregated by gender, first-generation student status, UCSD undergraduate
college, may be viewed on the UCSD Student Research and Information
website:
http://studentresearch.ucsd.edu/sriweb/Surveys/ucues.html
This report also includes supplemental tables in the appendix to provide
additional data on perceptions of campus climate and inter-group differences.
Comparative perceptions and experiences-UCUES 2008 6 Office of Student Research UCSD
Campus Climate and Experiences Indicators
Campus climate was assessed using different items to assess various
dimensions of campus life, including factor analyses that identified several
campus environmental and student behavioral and affective factors related to
campus climate and academic and social engagement and participation.
UCUES 2008 employed several items that assessed and measured various
perceptions of campus climate such as levels of satisfaction with the academic
and social experience, interaction with peers, faculty, and staff, participation in
campus activities, behaviors, diversity related activities, and learning outcomes
pertaining to self-reported gains in understanding and respect for socio-cultural
diversity.
Satisfaction with the Academic Experience
Satisfaction with the academic experience was assessed using several items
such as satisfaction with grades, academic engagement, gains in learning, and
overall satisfaction. Although the overall response rate to the 2008 UCUES was
generally strong, there are instances where group N’s are markedly imbalanced
and thus should be interpreted with caution. This caveat applies particularly to
African American and Native American student responses.
Comparative perceptions and experiences-UCUES 2008 7 Office of Student Research UCSD
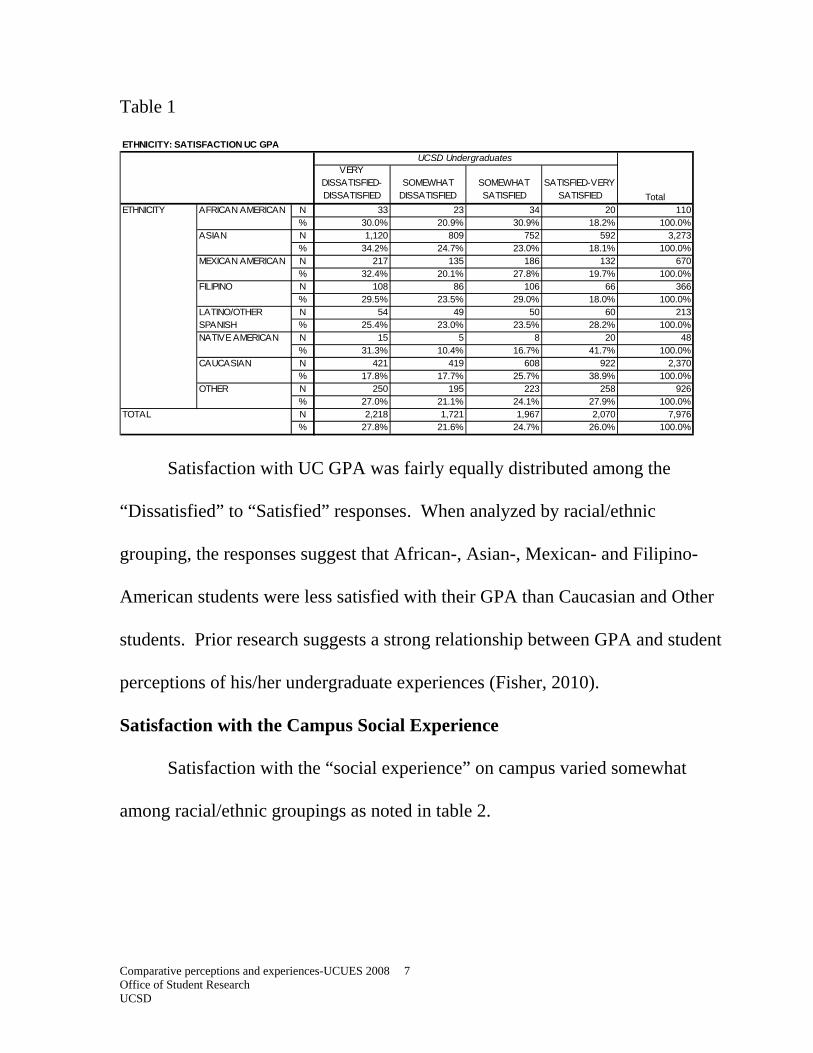
Table 1
VERY DISSATISFIED-DISSATISFIED
SOMEWHAT DISSATISFIED
SOMEWHAT SATISFIED
SATISFIED-VERY SATISFIED
N 33 23 34 20 110% 30.0% 20.9% 30.9% 18.2% 100.0%N 1,120 809 752 592 3,273% 34.2% 24.7% 23.0% 18.1% 100.0%N 217 135 186 132 670% 32.4% 20.1% 27.8% 19.7% 100.0%N 108 86 106 66 366% 29.5% 23.5% 29.0% 18.0% 100.0%N 54 49 50 60 213% 25.4% 23.0% 23.5% 28.2% 100.0%N 15 5 8 20 48% 31.3% 10.4% 16.7% 41.7% 100.0%N 421 419 608 922 2,370% 17.8% 17.7% 25.7% 38.9% 100.0%N 250 195 223 258 926% 27.0% 21.1% 24.1% 27.9% 100.0%N 2,218 1,721 1,967 2,070 7,976% 27.8% 21.6% 24.7% 26.0% 100.0%
ETHNICITY: SATISFACTION UC GPA
UCSD Undergraduates
TotalETHNICITY AFRICAN AMERICAN
ASIAN
MEXICAN AMERICAN
FILIPINO
LATINO/OTHER SPANISHNATIVE AMERICAN
CAUCASIAN
OTHER
TOTAL
Satisfaction with UC GPA was fairly equally distributed among the
“Dissatisfied” to “Satisfied” responses. When analyzed by racial/ethnic
grouping, the responses suggest that African-, Asian-, Mexican- and Filipino-
American students were less satisfied with their GPA than Caucasian and Other
students. Prior research suggests a strong relationship between GPA and student
perceptions of his/her undergraduate experiences (Fisher, 2010).
Satisfaction with the Campus Social Experience
Satisfaction with the “social experience” on campus varied somewhat
among racial/ethnic groupings as noted in table 2.
Comparative perceptions and experiences-UCUES 2008 8 Office of Student Research UCSD
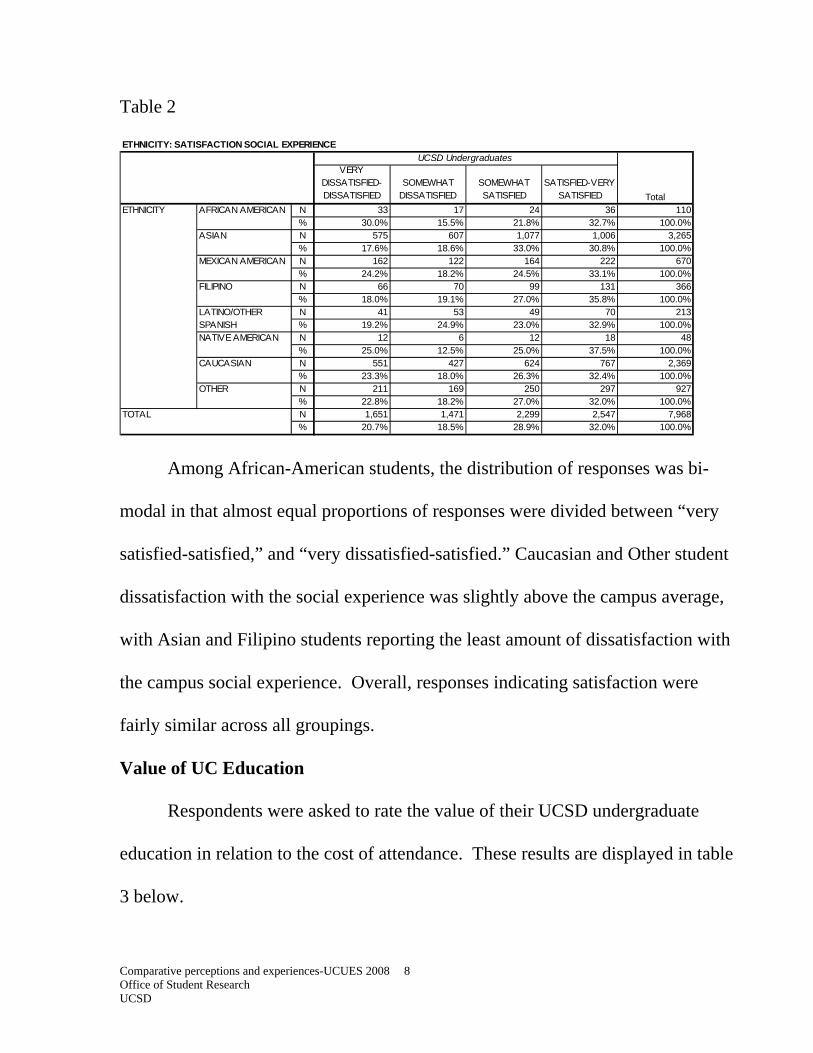
Table 2
VERY DISSATISFIED-DISSATISFIED
SOMEWHAT DISSATISFIED
SOMEWHAT SATISFIED
SATISFIED-VERY SATISFIED
N 33 17 24 36 110% 30.0% 15.5% 21.8% 32.7% 100.0%N 575 607 1,077 1,006 3,265% 17.6% 18.6% 33.0% 30.8% 100.0%N 162 122 164 222 670% 24.2% 18.2% 24.5% 33.1% 100.0%N 66 70 99 131 366% 18.0% 19.1% 27.0% 35.8% 100.0%N 41 53 49 70 213% 19.2% 24.9% 23.0% 32.9% 100.0%N 12 6 12 18 48% 25.0% 12.5% 25.0% 37.5% 100.0%N 551 427 624 767 2,369% 23.3% 18.0% 26.3% 32.4% 100.0%N 211 169 250 297 927% 22.8% 18.2% 27.0% 32.0% 100.0%N 1,651 1,471 2,299 2,547 7,968% 20.7% 18.5% 28.9% 32.0% 100.0%
LATINO/OTHER SPANISHNATIVE AMERICAN
CAUCASIAN
OTHER
TOTAL
ETHNICITY: SATISFACTION SOCIAL EXPERIENCE
UCSD Undergraduates
TotalETHNICITY AFRICAN AMERICAN
ASIAN
MEXICAN AMERICAN
FILIPINO
Among African-American students, the distribution of responses was bi-
modal in that almost equal proportions of responses were divided between “very
satisfied-satisfied,” and “very dissatisfied-satisfied.” Caucasian and Other student
dissatisfaction with the social experience was slightly above the campus average,
with Asian and Filipino students reporting the least amount of dissatisfaction with
the campus social experience. Overall, responses indicating satisfaction were
fairly similar across all groupings.
Value of UC Education
Respondents were asked to rate the value of their UCSD undergraduate
education in relation to the cost of attendance. These results are displayed in table
3 below.
Comparative perceptions and experiences-UCUES 2008 9 Office of Student Research UCSD
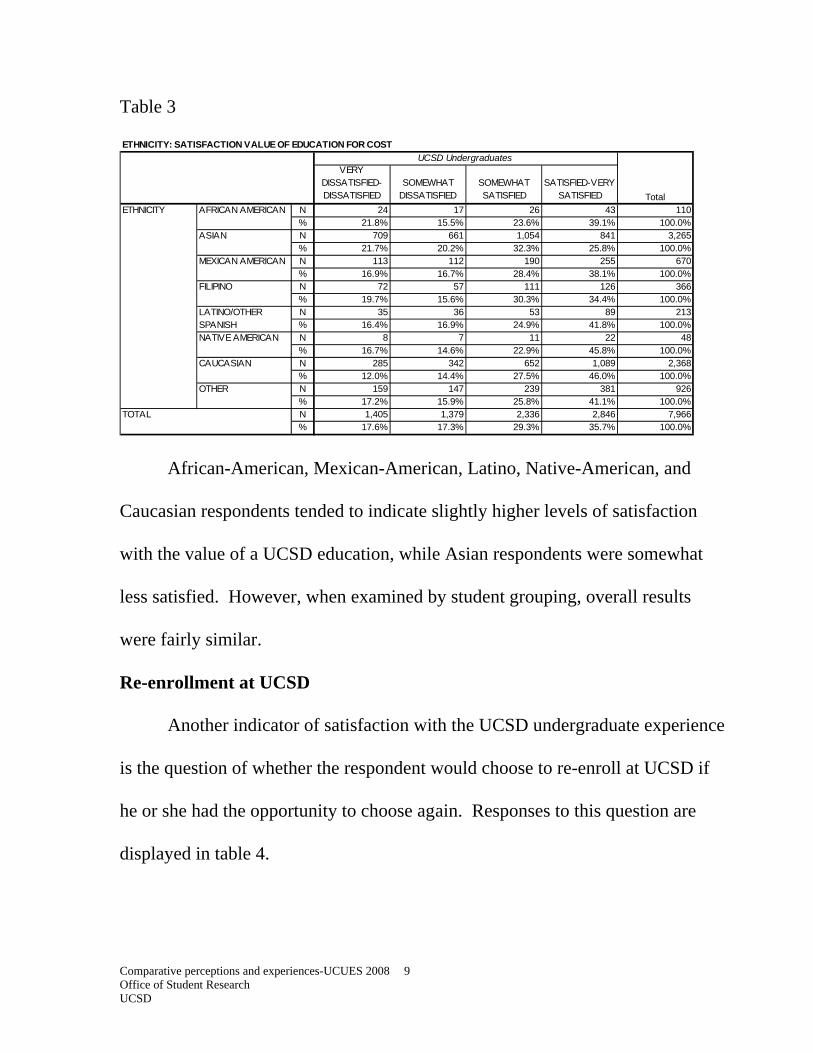
Table 3
VERY DISSATISFIED-DISSATISFIED
SOMEWHAT DISSATISFIED
SOMEWHAT SATISFIED
SATISFIED-VERY SATISFIED
N 24 17 26 43 110% 21.8% 15.5% 23.6% 39.1% 100.0%N 709 661 1,054 841 3,265% 21.7% 20.2% 32.3% 25.8% 100.0%N 113 112 190 255 670% 16.9% 16.7% 28.4% 38.1% 100.0%N 72 57 111 126 366% 19.7% 15.6% 30.3% 34.4% 100.0%N 35 36 53 89 213% 16.4% 16.9% 24.9% 41.8% 100.0%N 8 7 11 22 48% 16.7% 14.6% 22.9% 45.8% 100.0%N 285 342 652 1,089 2,368% 12.0% 14.4% 27.5% 46.0% 100.0%N 159 147 239 381 926% 17.2% 15.9% 25.8% 41.1% 100.0%N 1,405 1,379 2,336 2,846 7,966% 17.6% 17.3% 29.3% 35.7% 100.0%
ETHNICITY: SATISFACTION VALUE OF EDUCATION FOR COST
CAUCASIAN
OTHER
TOTAL
UCSD Undergraduates
TotalETHNICITY AFRICAN AMERICAN
ASIAN
MEXICAN AMERICAN
FILIPINO
LATINO/OTHER SPANISHNATIVE AMERICAN
African-American, Mexican-American, Latino, Native-American, and
Caucasian respondents tended to indicate slightly higher levels of satisfaction
with the value of a UCSD education, while Asian respondents were somewhat
less satisfied. However, when examined by student grouping, overall results
were fairly similar.
Re-enrollment at UCSD
Another indicator of satisfaction with the UCSD undergraduate experience
is the question of whether the respondent would choose to re-enroll at UCSD if
he or she had the opportunity to choose again. Responses to this question are
displayed in table 4.
Comparative perceptions and experiences-UCUES 2008 10 Office of Student Research UCSD
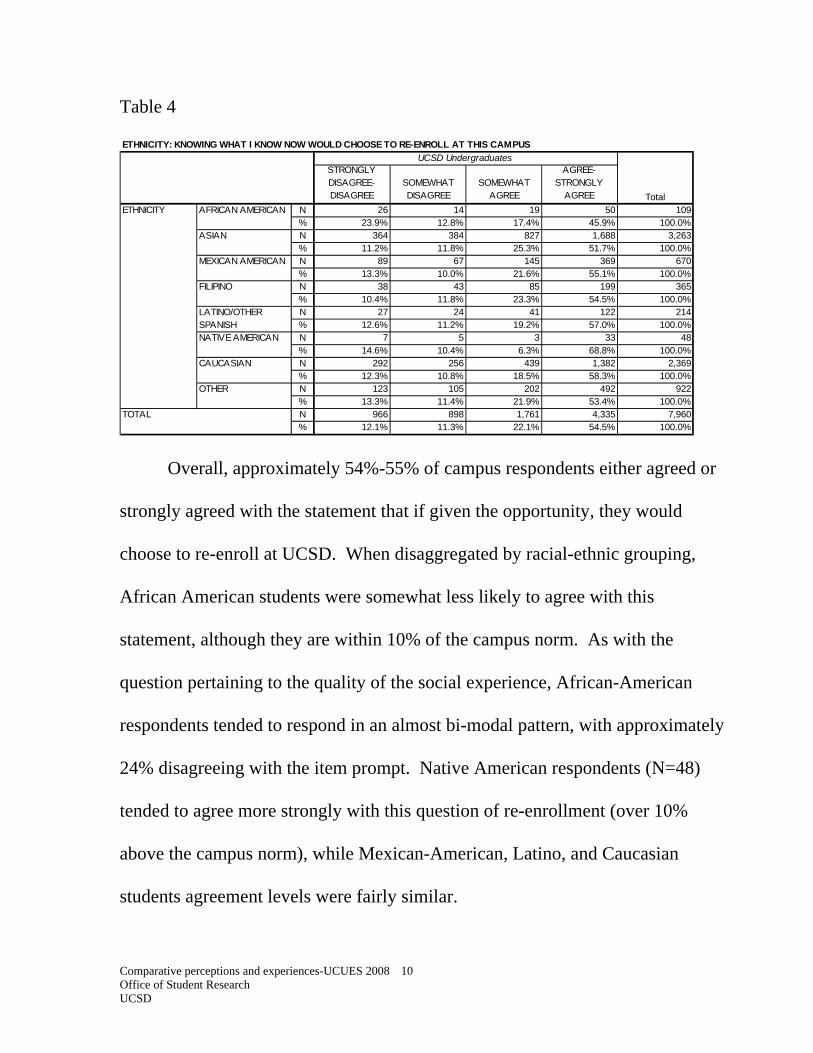
Table 4
STRONGLY DISAGREE-DISAGREE
SOMEWHAT DISAGREE
SOMEWHAT AGREE
AGREE-STRONGLY
AGREE
N 26 14 19 50 109% 23.9% 12.8% 17.4% 45.9% 100.0%N 364 384 827 1,688 3,263% 11.2% 11.8% 25.3% 51.7% 100.0%N 89 67 145 369 670% 13.3% 10.0% 21.6% 55.1% 100.0%N 38 43 85 199 365% 10.4% 11.8% 23.3% 54.5% 100.0%N 27 24 41 122 214% 12.6% 11.2% 19.2% 57.0% 100.0%N 7 5 3 33 48% 14.6% 10.4% 6.3% 68.8% 100.0%N 292 256 439 1,382 2,369% 12.3% 10.8% 18.5% 58.3% 100.0%N 123 105 202 492 922% 13.3% 11.4% 21.9% 53.4% 100.0%N 966 898 1,761 4,335 7,960% 12.1% 11.3% 22.1% 54.5% 100.0%
LATINO/OTHER SPANISHNATIVE AMERICAN
CAUCASIAN
OTHER
TOTAL
ETHNICITY: KNOWING WHAT I KNOW NOW WOULD CHOOSE TO RE-ENROLL AT THIS CAMPUS
UCSD Undergraduates
TotalETHNICITY AFRICAN AMERICAN
ASIAN
MEXICAN AMERICAN
FILIPINO
Overall, approximately 54%-55% of campus respondents either agreed or
strongly agreed with the statement that if given the opportunity, they would
choose to re-enroll at UCSD. When disaggregated by racial-ethnic grouping,
African American students were somewhat less likely to agree with this
statement, although they are within 10% of the campus norm. As with the
question pertaining to the quality of the social experience, African-American
respondents tended to respond in an almost bi-modal pattern, with approximately
24% disagreeing with the item prompt. Native American respondents (N=48)
tended to agree more strongly with this question of re-enrollment (over 10%
above the campus norm), while Mexican-American, Latino, and Caucasian
students agreement levels were fairly similar.
Comparative perceptions and experiences-UCUES 2008 11 Office of Student Research UCSD
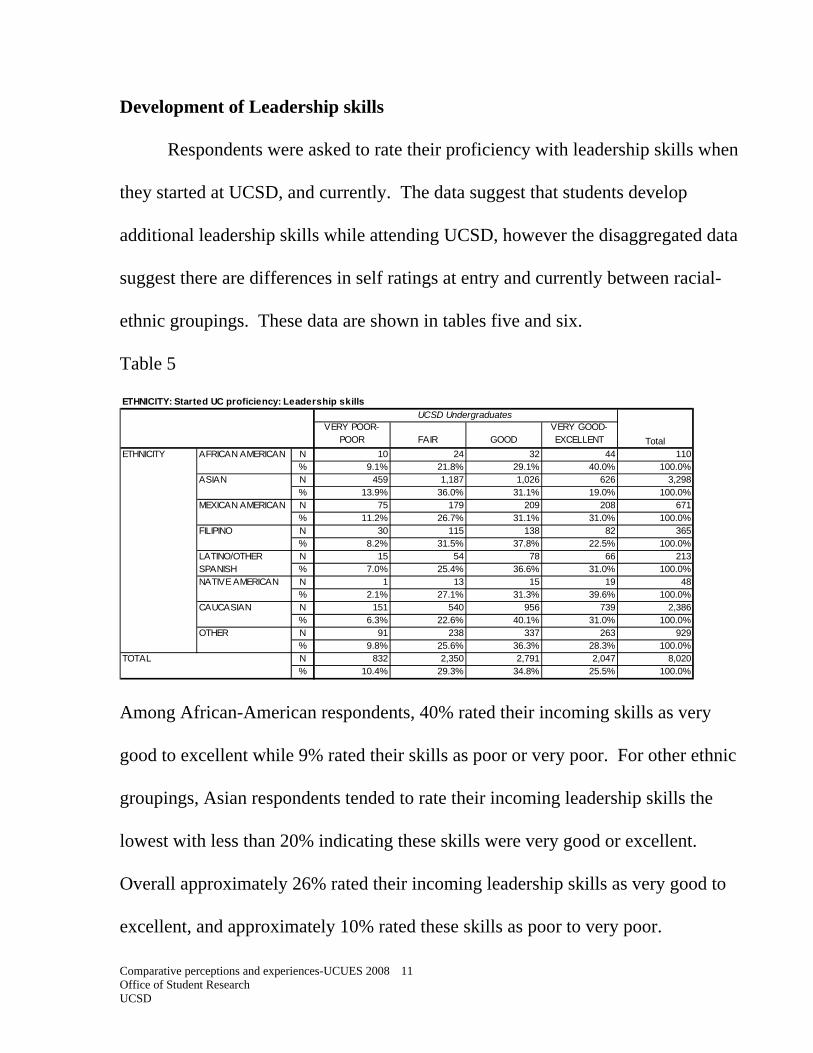
Development of Leadership skills
Respondents were asked to rate their proficiency with leadership skills when
they started at UCSD, and currently. The data suggest that students develop
additional leadership skills while attending UCSD, however the disaggregated data
suggest there are differences in self ratings at entry and currently between racial-
ethnic groupings. These data are shown in tables five and six.
Table 5
VERY POOR-POOR FAIR GOOD
VERY GOOD-EXCELLENT
N 10 24 32 44 110% 9.1% 21.8% 29.1% 40.0% 100.0%N 459 1,187 1,026 626 3,298% 13.9% 36.0% 31.1% 19.0% 100.0%N 75 179 209 208 671% 11.2% 26.7% 31.1% 31.0% 100.0%N 30 115 138 82 365% 8.2% 31.5% 37.8% 22.5% 100.0%N 15 54 78 66 213% 7.0% 25.4% 36.6% 31.0% 100.0%N 1 13 15 19 48% 2.1% 27.1% 31.3% 39.6% 100.0%N 151 540 956 739 2,386% 6.3% 22.6% 40.1% 31.0% 100.0%N 91 238 337 263 929% 9.8% 25.6% 36.3% 28.3% 100.0%N 832 2,350 2,791 2,047 8,020% 10.4% 29.3% 34.8% 25.5% 100.0%
ETHNICITY: Started UC proficiency: Leadership skills
UCSD Undergraduates
TotalETHNICITY AFRICAN AMERICAN
ASIAN
MEXICAN AMERICAN
FILIPINO
LATINO/OTHER SPANISHNATIVE AMERICAN
CAUCASIAN
OTHER
TOTAL
Among African-American respondents, 40% rated their incoming skills as very
good to excellent while 9% rated their skills as poor or very poor. For other ethnic
groupings, Asian respondents tended to rate their incoming leadership skills the
lowest with less than 20% indicating these skills were very good or excellent.
Overall approximately 26% rated their incoming leadership skills as very good to
excellent, and approximately 10% rated these skills as poor to very poor.
Comparative perceptions and experiences-UCUES 2008 12 Office of Student Research UCSD
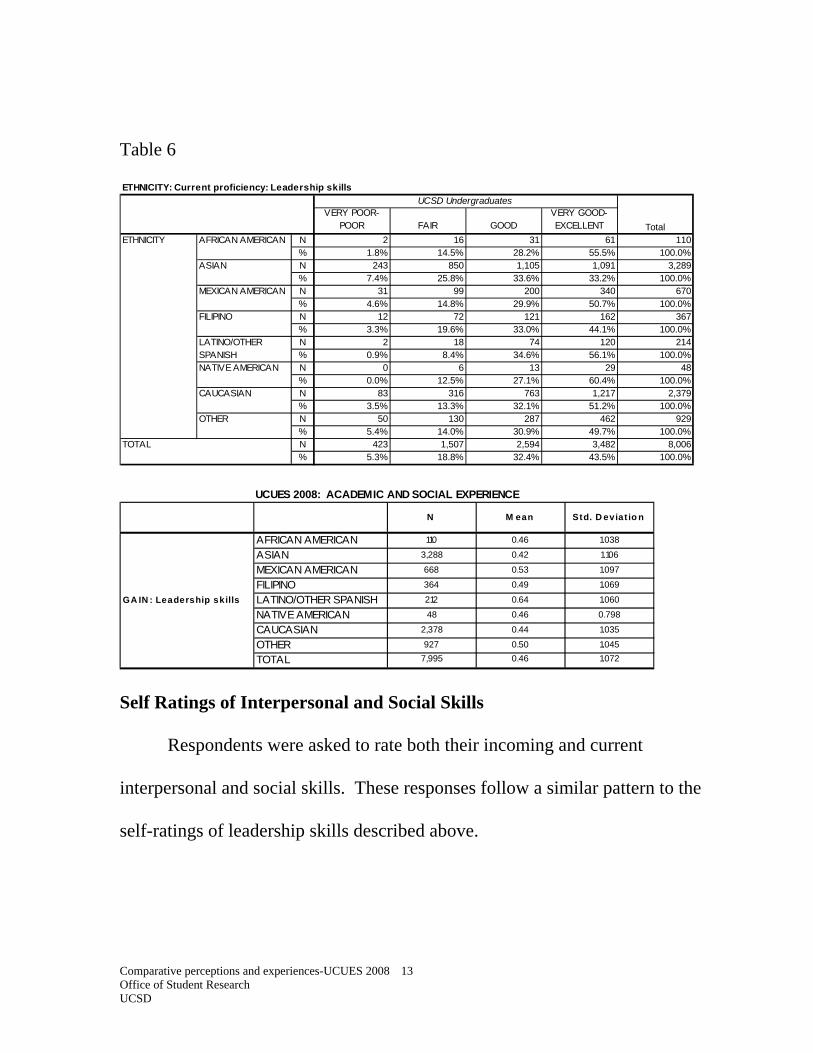
When prompted to rate their current leadership skills, respondents tended to
indicate growth in their self-rated leadership skills. This pattern was noted for all
racial-ethnic groupings. The distribution of current very-good to excellent
leadership skills generally followed the distribution found with their incoming
skills. African American, Mexican American, Latino, Native American and
Caucasian respondents rated their leadership skills similarly, with Asian
respondents ratings notably lower. It should be noted that these self-reported gains
may be due to several factors including maturation, participation in campus
activities, and leadership opportunities both on-and off-campus. The average
change or gain in self-ratings or development of leadership skills is displayed
below table 6. The average gain is computed by subtracting starting proficiency
from current proficiency. The self-reported gains in leadership skills are the
highest for Mexican-American and Latino respondents, while other groupings tend
to be similar to the campus average.
Comparative perceptions and experiences-UCUES 2008 13 Office of Student Research UCSD
Table 6
VERY POOR-POOR FAIR GOOD
VERY GOOD-EXCELLENT
N 2 16 31 61 110% 1.8% 14.5% 28.2% 55.5% 100.0%N 243 850 1,105 1,091 3,289% 7.4% 25.8% 33.6% 33.2% 100.0%N 31 99 200 340 670% 4.6% 14.8% 29.9% 50.7% 100.0%N 12 72 121 162 367% 3.3% 19.6% 33.0% 44.1% 100.0%N 2 18 74 120 214% 0.9% 8.4% 34.6% 56.1% 100.0%N 0 6 13 29 48% 0.0% 12.5% 27.1% 60.4% 100.0%N 83 316 763 1,217 2,379% 3.5% 13.3% 32.1% 51.2% 100.0%N 50 130 287 462 929% 5.4% 14.0% 30.9% 49.7% 100.0%N 423 1,507 2,594 3,482 8,006% 5.3% 18.8% 32.4% 43.5% 100.0%
LATINO/OTHER SPANISHNATIVE AMERICAN
CAUCASIAN
OTHER
TOTAL
ETHNICITY: Current proficiency: Leadership skills
UCSD Undergraduates
TotalETHNICITY AFRICAN AMERICAN
ASIAN
MEXICAN AMERICAN
FILIPINO
AFRICAN AMERICAN 110 0.46 1.038
ASIAN 3,288 0.42 1.106
MEXICAN AMERICAN 668 0.53 1.097
FILIPINO 364 0.49 1.069
LATINO/OTHER SPANISH 212 0.64 1.060
NATIVE AMERICAN 48 0.46 0.798
CAUCASIAN 2,378 0.44 1.035
OTHER 927 0.50 1.045
TOTAL 7,995 0.46 1.072
GA IN : Leadership skills
UCUES 2008: ACADEMIC AND SOCIAL EXPERIENCE
N M ean Std. D eviat io n
Self Ratings of Interpersonal and Social Skills
Respondents were asked to rate both their incoming and current
interpersonal and social skills. These responses follow a similar pattern to the
self-ratings of leadership skills described above.
Comparative perceptions and experiences-UCUES 2008 14 Office of Student Research UCSD
Table 7
VERY POOR-POOR FAIR GOOD
VERY GOOD-EXCELLENT
N 7 21 38 46 112% 6.3% 18.8% 33.9% 41.1% 100.0%N 336 1,054 1,160 741 3,291% 10.2% 32.0% 35.2% 22.5% 100.0%N 62 162 192 251 667% 9.3% 24.3% 28.8% 37.6% 100.0%N 25 90 132 117 364% 6.9% 24.7% 36.3% 32.1% 100.0%N 17 40 77 80 214% 7.9% 18.7% 36.0% 37.4% 100.0%N 1 8 19 20 48% 2.1% 16.7% 39.6% 41.7% 100.0%N 109 484 849 938 2,380% 4.6% 20.3% 35.7% 39.4% 100.0%N 77 189 344 319 929% 8.3% 20.3% 37.0% 34.3% 100.0%N 634 2,048 2,811 2,512 8,005% 7.9% 25.6% 35.1% 31.4% 100.0%
ETHNICITY: Started UC proficiency: Interpersonal (social) skills
UCSD Undergraduates
TotalETHNICITY AFRICAN AMERICAN
ASIAN
MEXICAN AMERICAN
FILIPINO
LATINO/OTHER SPANISHNATIVE AMERICAN
CAUCASIAN
OTHER
TOTAL
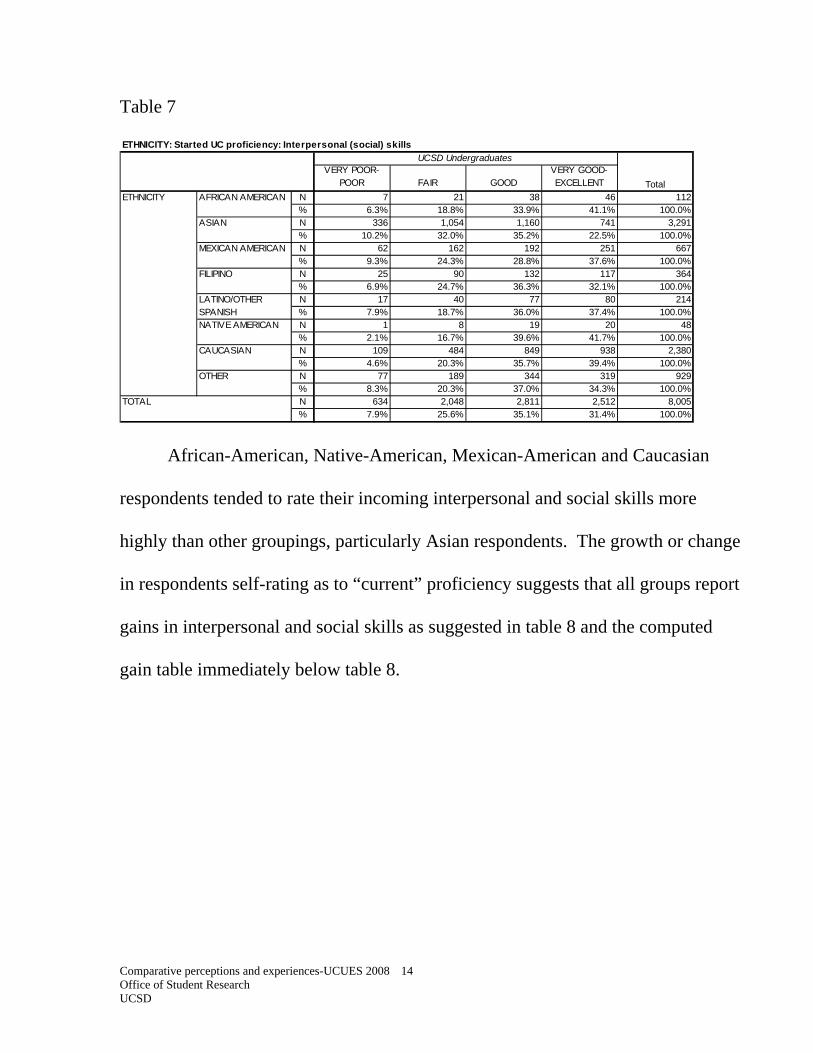
African-American, Native-American, Mexican-American and Caucasian
respondents tended to rate their incoming interpersonal and social skills more
highly than other groupings, particularly Asian respondents. The growth or change
in respondents self-rating as to “current” proficiency suggests that all groups report
gains in interpersonal and social skills as suggested in table 8 and the computed
gain table immediately below table 8.
Comparative perceptions and experiences-UCUES 2008 15 Office of Student Research UCSD
Table 8
VERY POOR-POOR FAIR GOOD
VERY GOOD-EXCELLENT
N 6 11 33 62 112% 5.4% 9.8% 29.5% 55.4% 100.0%N 147 499 1,116 1,527 3,289% 4.5% 15.2% 33.9% 46.4% 100.0%N 28 76 193 372 669% 4.2% 11.4% 28.8% 55.6% 100.0%N 8 36 108 214 366% 2.2% 9.8% 29.5% 58.5% 100.0%N 7 12 52 142 213% 3.3% 5.6% 24.4% 66.7% 100.0%N 2 6 11 29 48% 4.2% 12.5% 22.9% 60.4% 100.0%N 96 215 644 1,423 2,378% 4.0% 9.0% 27.1% 59.8% 100.0%N 31 95 261 542 929% 3.3% 10.2% 28.1% 58.3% 100.0%N 325 950 2,418 4,311 8,004% 4.1% 11.9% 30.2% 53.9% 100.0%
LATINO/OTHER SPANISHNATIVE AMERICAN
CAUCASIAN
OTHER
TOTAL
ETHNICITY: Current proficiency: Interpersonal (social) skills
UCSD Undergraduates
TotalETHNICITY AFRICAN AMERICAN
ASIAN
MEXICAN AMERICAN
FILIPINO
AFRICAN AMERICAN 112 0.33 1.410
ASIAN 3,284 0.60 1.095
MEXICAN AMERICAN 666 0.50 1.268
FILIPINO 364 0.63 1.082
LATINO/OTHER SPANISH 212 0.67 1.267
NATIVE AMERICAN 48 0.25 1.246
CAUCASIAN 2,377 0.40 1.147
OTHER 927 0.54 1.180
TOTAL 7,990 0.52 1.149
GA IN : Interperso nal (so cial) skills
UCUES 2008: ACADEMIC AND SOCIAL EXPERIENCE
N M ean Std. D eviat io n
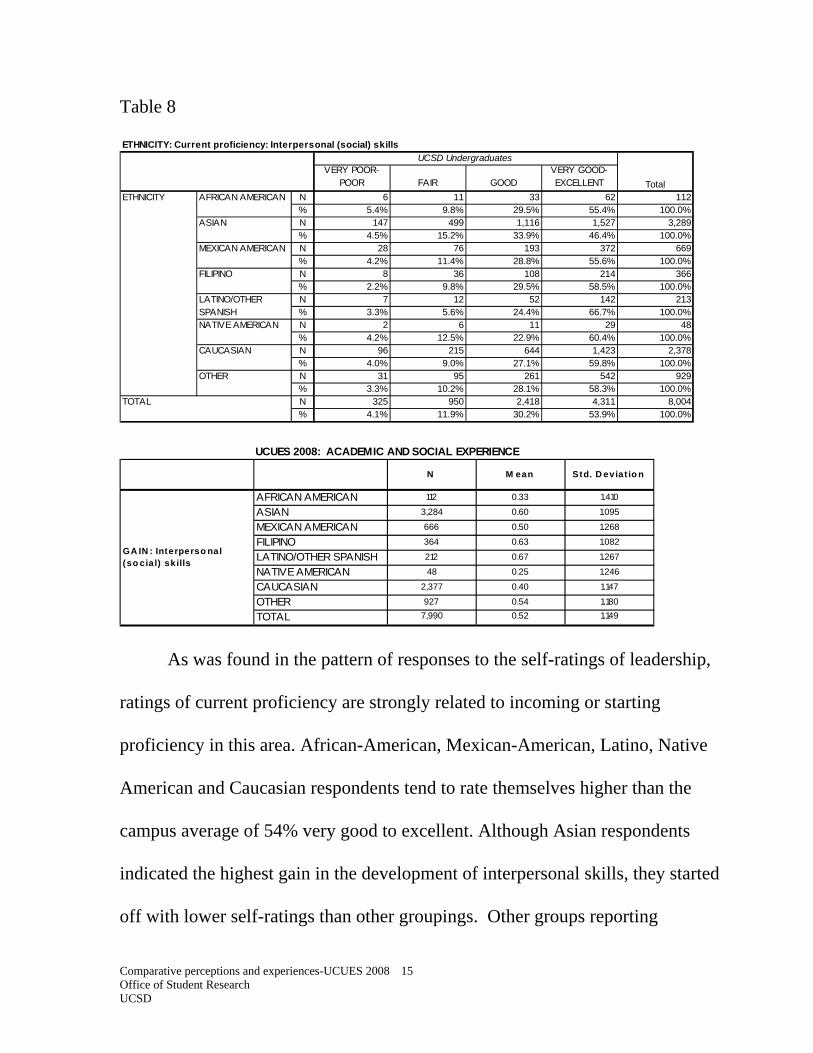
As was found in the pattern of responses to the self-ratings of leadership,
ratings of current proficiency are strongly related to incoming or starting
proficiency in this area. African-American, Mexican-American, Latino, Native
American and Caucasian respondents tend to rate themselves higher than the
campus average of 54% very good to excellent. Although Asian respondents
indicated the highest gain in the development of interpersonal skills, they started
off with lower self-ratings than other groupings. Other groups reporting
Comparative perceptions and experiences-UCUES 2008 16 Office of Student Research UCSD
substantial gains in the development of interpersonal and social skills are Mexican-
American, Filipino, Latino and Other respondents.
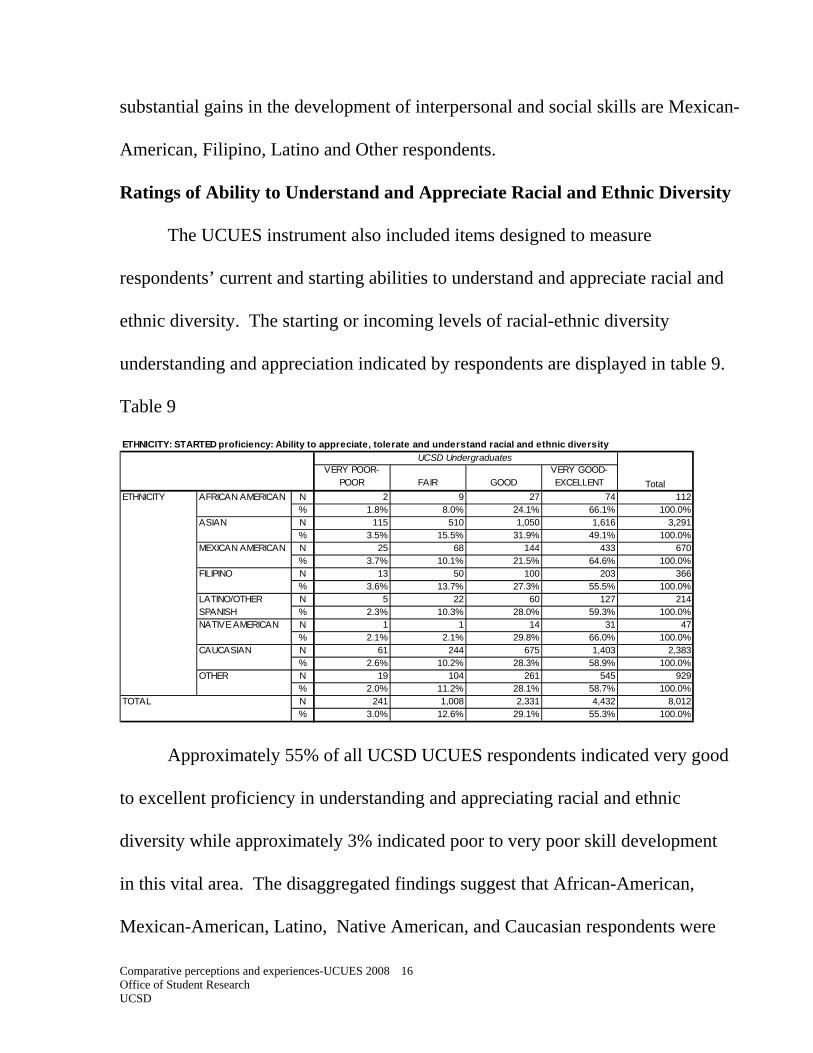
Ratings of Ability to Understand and Appreciate Racial and Ethnic Diversity
The UCUES instrument also included items designed to measure
respondents’ current and starting abilities to understand and appreciate racial and
ethnic diversity. The starting or incoming levels of racial-ethnic diversity
understanding and appreciation indicated by respondents are displayed in table 9.
Table 9
VERY POOR-POOR FAIR GOOD
VERY GOOD-EXCELLENT
N 2 9 27 74 112% 1.8% 8.0% 24.1% 66.1% 100.0%N 115 510 1,050 1,616 3,291% 3.5% 15.5% 31.9% 49.1% 100.0%N 25 68 144 433 670% 3.7% 10.1% 21.5% 64.6% 100.0%N 13 50 100 203 366% 3.6% 13.7% 27.3% 55.5% 100.0%N 5 22 60 127 214% 2.3% 10.3% 28.0% 59.3% 100.0%N 1 1 14 31 47% 2.1% 2.1% 29.8% 66.0% 100.0%N 61 244 675 1,403 2,383% 2.6% 10.2% 28.3% 58.9% 100.0%N 19 104 261 545 929% 2.0% 11.2% 28.1% 58.7% 100.0%N 241 1,008 2,331 4,432 8,012% 3.0% 12.6% 29.1% 55.3% 100.0%
ETHNICITY: STARTED proficiency: Ability to appreciate, tolerate and understand racial and ethnic diversity
CAUCASIAN
OTHER
TOTAL
UCSD Undergraduates
TotalETHNICITY AFRICAN AMERICAN
ASIAN
MEXICAN AMERICAN
FILIPINO
LATINO/OTHER SPANISHNATIVE AMERICAN
Approximately 55% of all UCSD UCUES respondents indicated very good
to excellent proficiency in understanding and appreciating racial and ethnic
diversity while approximately 3% indicated poor to very poor skill development
in this vital area. The disaggregated findings suggest that African-American,
Mexican-American, Latino, Native American, and Caucasian respondents were
Comparative perceptions and experiences-UCUES 2008 17 Office of Student Research UCSD
above the campus mean, while Asian respondents were below the campus mean.
Although these differences can be noted, no group exceeded or fell below the
campus mean by 10% or more.
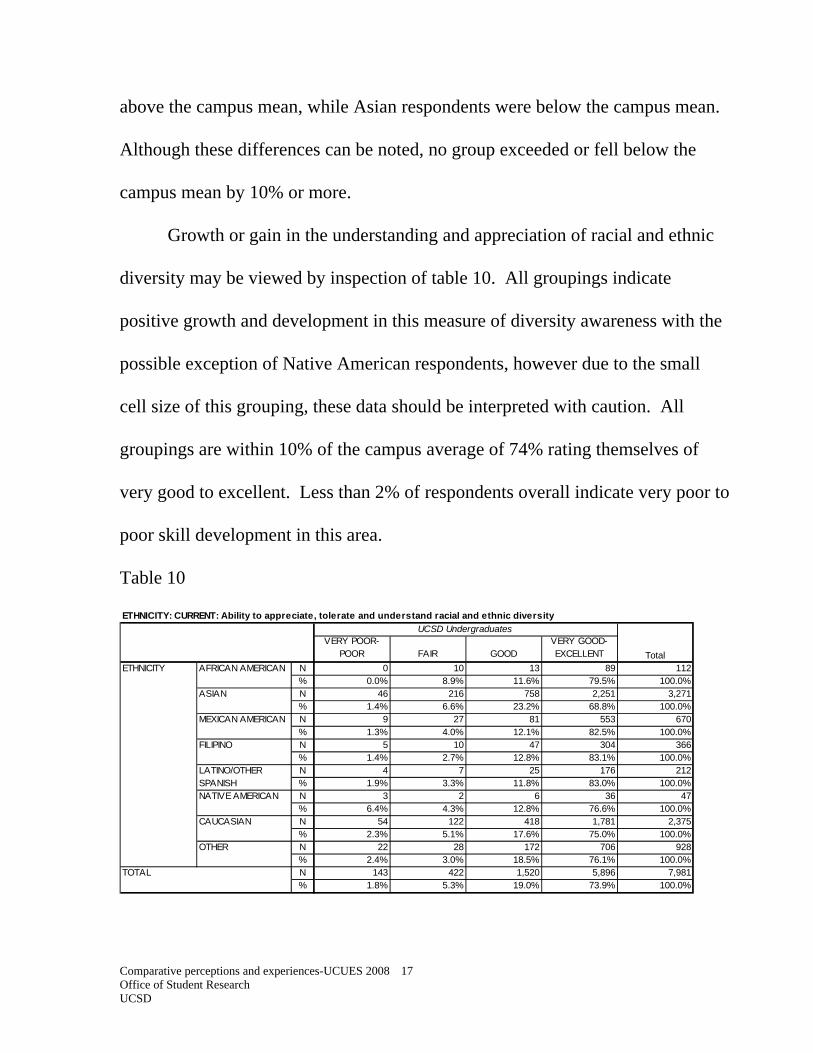
Growth or gain in the understanding and appreciation of racial and ethnic
diversity may be viewed by inspection of table 10. All groupings indicate
positive growth and development in this measure of diversity awareness with the
possible exception of Native American respondents, however due to the small
cell size of this grouping, these data should be interpreted with caution. All
groupings are within 10% of the campus average of 74% rating themselves of
very good to excellent. Less than 2% of respondents overall indicate very poor to
poor skill development in this area.
Table 10
VERY POOR-POOR FAIR GOOD
VERY GOOD-EXCELLENT
N 0 10 13 89 112% 0.0% 8.9% 11.6% 79.5% 100.0%N 46 216 758 2,251 3,271% 1.4% 6.6% 23.2% 68.8% 100.0%N 9 27 81 553 670% 1.3% 4.0% 12.1% 82.5% 100.0%N 5 10 47 304 366% 1.4% 2.7% 12.8% 83.1% 100.0%N 4 7 25 176 212% 1.9% 3.3% 11.8% 83.0% 100.0%N 3 2 6 36 47% 6.4% 4.3% 12.8% 76.6% 100.0%N 54 122 418 1,781 2,375% 2.3% 5.1% 17.6% 75.0% 100.0%N 22 28 172 706 928% 2.4% 3.0% 18.5% 76.1% 100.0%N 143 422 1,520 5,896 7,981% 1.8% 5.3% 19.0% 73.9% 100.0%
ETHNICITY: CURRENT: Ability to appreciate, tolerate and understand racial and ethnic diversity
UCSD Undergraduates
TotalETHNICITY AFRICAN AMERICAN
ASIAN
MEXICAN AMERICAN
FILIPINO
LATINO/OTHER SPANISHNATIVE AMERICAN
CAUCASIAN
OTHER
TOTAL
Comparative perceptions and experiences-UCUES 2008 18 Office of Student Research UCSD
AFRICAN AMERICAN 112 0.31 1.014
ASIAN 3,266 0.43 0.957
MEXICAN AMERICAN 668 0.44 1.036
FILIPINO 365 0.63 1.029
LATINO/OTHER SPANISH 211 0.48 0.875
NATIVE AMERICAN 47 0.13 0.992
CAUCASIAN 2,374 0.32 0.994
OTHER 927 0.35 0.979
TOTAL 7,970 0.39 0.982
GA IN : A bility to appreciate, to lerate and understand racial and ethnic diversity
UCUES 2008: ACADEMIC AND SOCIAL EXPERIENCE
N M ean Std. D eviat io n
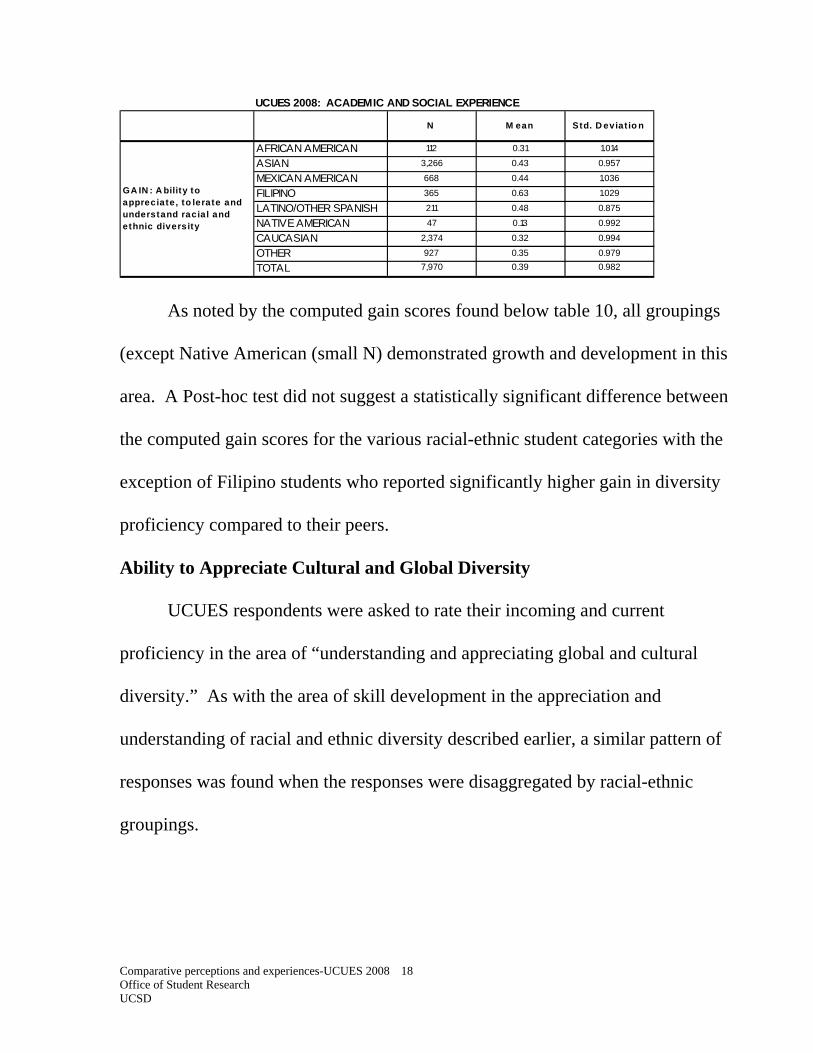
As noted by the computed gain scores found below table 10, all groupings
(except Native American (small N) demonstrated growth and development in this
area. A Post-hoc test did not suggest a statistically significant difference between
the computed gain scores for the various racial-ethnic student categories with the
exception of Filipino students who reported significantly higher gain in diversity
proficiency compared to their peers.
Ability to Appreciate Cultural and Global Diversity
UCUES respondents were asked to rate their incoming and current
proficiency in the area of “understanding and appreciating global and cultural
diversity.” As with the area of skill development in the appreciation and
understanding of racial and ethnic diversity described earlier, a similar pattern of
responses was found when the responses were disaggregated by racial-ethnic
groupings.
Comparative perceptions and experiences-UCUES 2008 19 Office of Student Research UCSD
Table 11
VERY POOR-POOR FAIR GOOD
VERY GOOD-EXCELLENT
N 2 14 41 55 112% 1.8% 12.5% 36.6% 49.1% 100.0%N 127 672 1,231 1,251 3,281% 3.9% 20.5% 37.5% 38.1% 100.0%N 21 87 210 354 672% 3.1% 12.9% 31.3% 52.7% 100.0%N 14 65 133 153 365% 3.8% 17.8% 36.4% 41.9% 100.0%N 7 24 76 105 212% 3.3% 11.3% 35.8% 49.5% 100.0%N 1 3 21 23 48% 2.1% 6.3% 43.8% 47.9% 100.0%N 73 372 866 1,067 2,378% 3.1% 15.6% 36.4% 44.9% 100.0%N 26 137 316 449 928% 2.8% 14.8% 34.1% 48.4% 100.0%N 271 1,374 2,894 3,457 7,996% 3.4% 17.2% 36.2% 43.2% 100.0%
ETHNICITY: Started UC proficiency: Ability to appreciate cultural and global diversity
UCSD Undergraduates
TotalETHNICITY AFRICAN AMERICAN
ASIAN
MEXICAN AMERICAN
FILIPINO
LATINO/OTHER SPANISHNATIVE AMERICAN
CAUCASIAN
OTHER
TOTAL
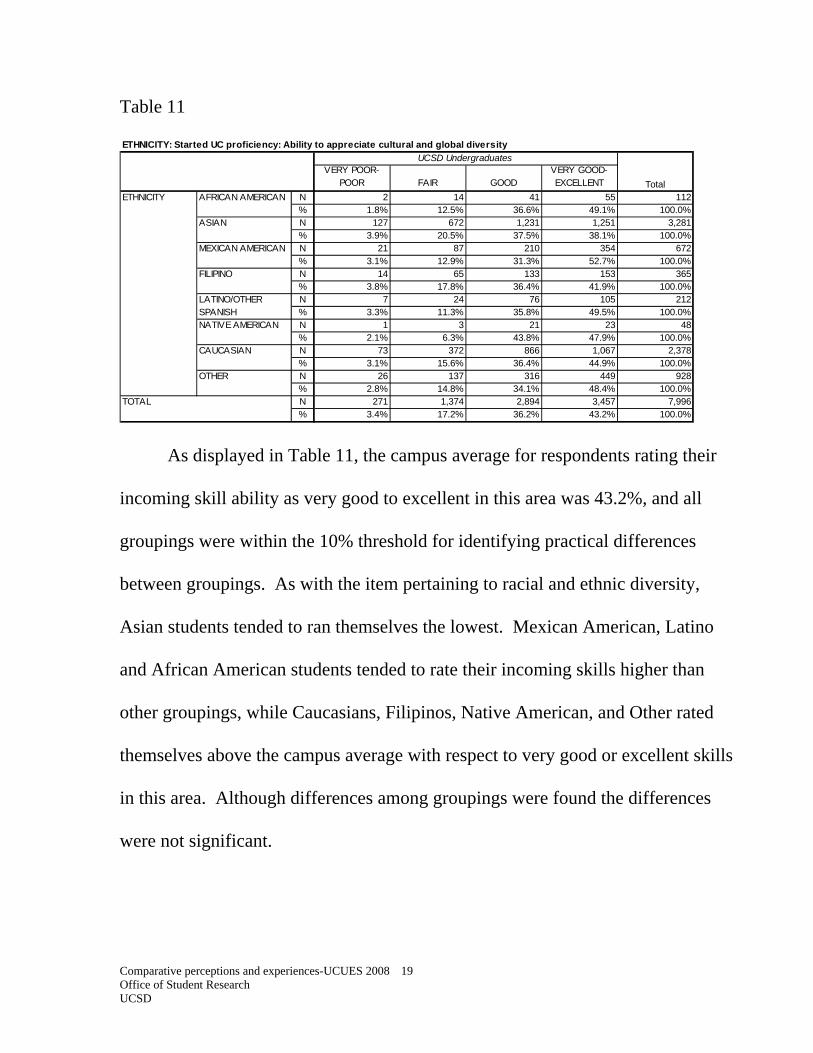
As displayed in Table 11, the campus average for respondents rating their
incoming skill ability as very good to excellent in this area was 43.2%, and all
groupings were within the 10% threshold for identifying practical differences
between groupings. As with the item pertaining to racial and ethnic diversity,
Asian students tended to ran themselves the lowest. Mexican American, Latino
and African American students tended to rate their incoming skills higher than
other groupings, while Caucasians, Filipinos, Native American, and Other rated
themselves above the campus average with respect to very good or excellent skills
in this area. Although differences among groupings were found the differences
were not significant.

Comparative perceptions and experiences-UCUES 2008 20 Office of Student Research UCSD
Table 12
VERY POOR-POOR FAIR GOOD
VERY GOOD-EXCELLENT
N 1 4 26 81 112% 0.9% 3.6% 23.2% 72.3% 100.0%N 54 313 977 1,933 3,277% 1.6% 9.6% 29.8% 59.0% 100.0%N 9 27 121 511 668% 1.3% 4.0% 18.1% 76.5% 100.0%N 3 24 77 262 366% 0.8% 6.6% 21.0% 71.6% 100.0%N 3 4 45 160 212% 1.4% 1.9% 21.2% 75.5% 100.0%N 2 1 11 34 48% 4.2% 2.1% 22.9% 70.8% 100.0%N 50 182 567 1,575 2,374% 2.1% 7.7% 23.9% 66.3% 100.0%N 16 54 207 651 928% 1.7% 5.8% 22.3% 70.2% 100.0%N 138 609 2,031 5,207 7,985% 1.7% 7.6% 25.4% 65.2% 100.0%
LATINO/OTHER SPANISHNATIVE AMERICAN
CAUCASIAN
OTHER
TOTAL
ETHNICITY: Current UC proficiency: Ability to appreciate cultural and global diversity
UCSD Undergraduates
TotalETHNICITY AFRICAN AMERICAN
ASIAN
MEXICAN AMERICAN
FILIPINO
AFRICAN AMERICAN 112 0.49 0.900
ASIAN 3,265 0.47 0.867
MEXICAN AMERICAN 667 0.54 0.985
FILIPINO 364 0.66 0.979
LATINO/OTHER SPANISH 211 0.57 0.844
NATIVE AMERICAN 48 0.42 0.794
CAUCASIAN 2,371 0.45 0.868
OTHER 926 0.46 0.907
TOTAL 7,964 0.48 0.888
GA IN : A bility to appreciate cultural and glo bal diversity
UCUES 2008: ACADEMIC AND SOCIAL EXPERIENCE
N M ean Std. D eviat io n
As noted in table 12 and the computed residuals between starting and current
cultural diversity appreciation skill development, all groupings reported skill
development in this competency. Post-hoc comparison testing did not suggest
significant differences in the self-reported gains of the various student groupings in
appreciating cultural diversity at the .05 level
Comparative perceptions and experiences-UCUES 2008 21 Office of Student Research UCSD
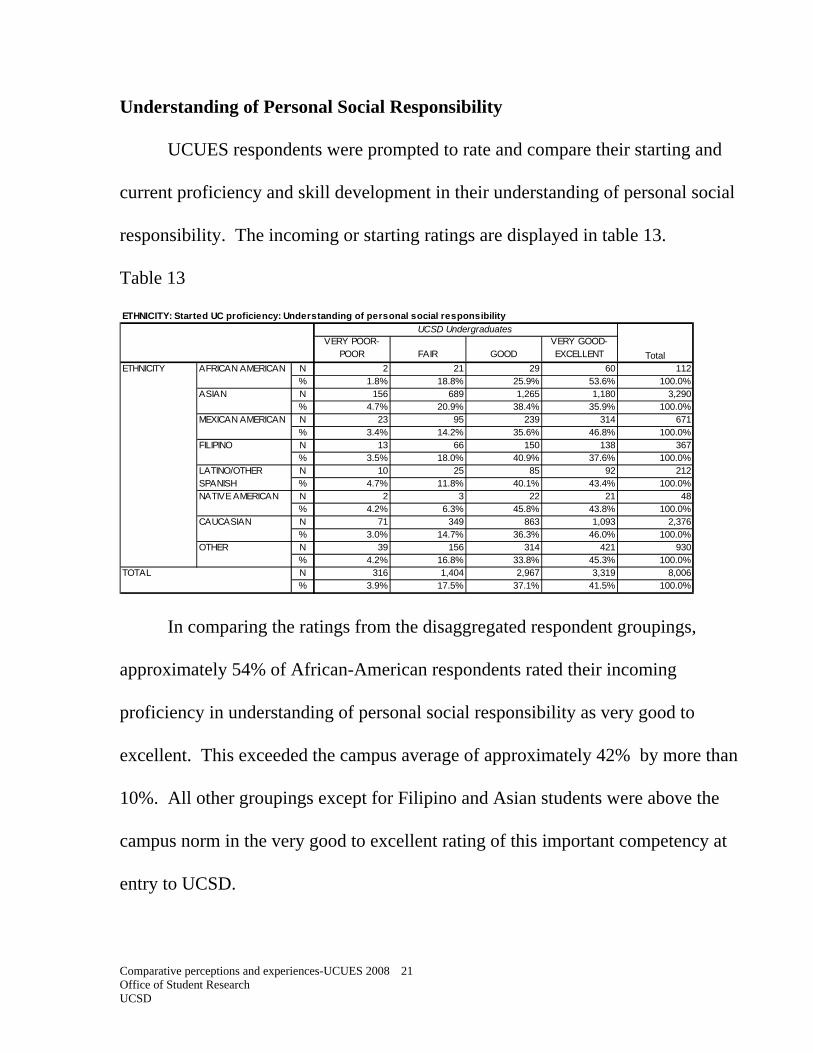
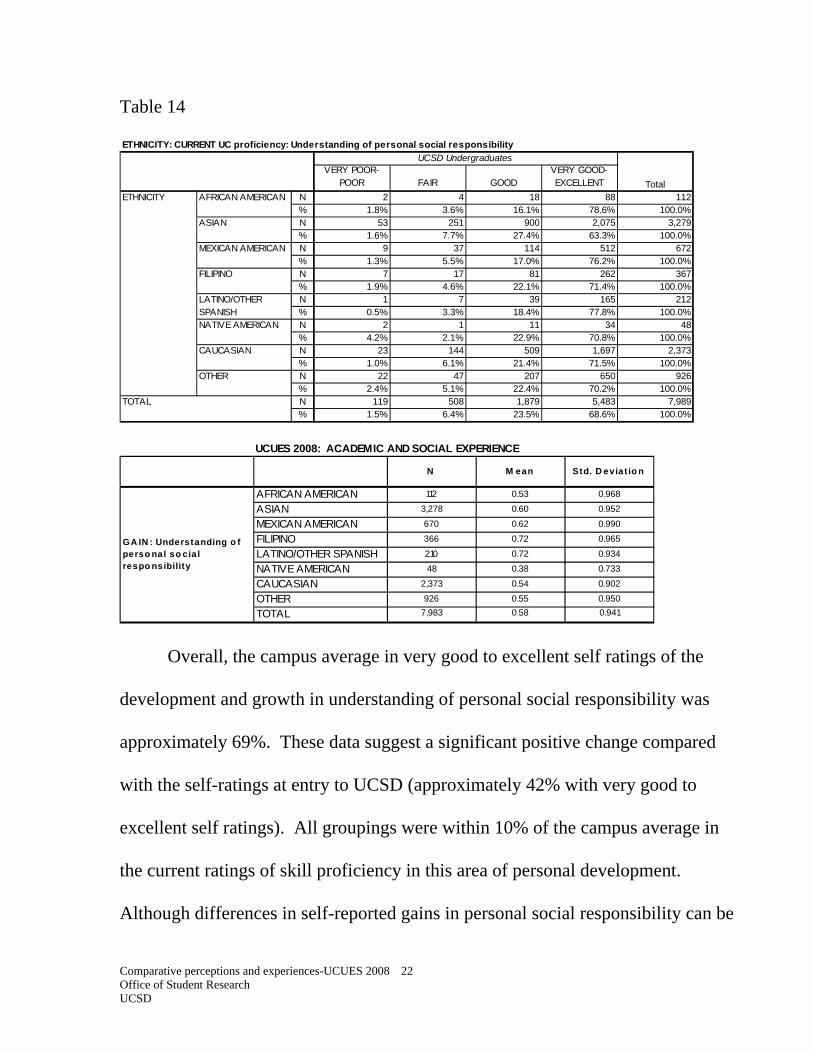
Understanding of Personal Social Responsibility
UCUES respondents were prompted to rate and compare their starting and
current proficiency and skill development in their understanding of personal social
responsibility. The incoming or starting ratings are displayed in table 13.
Table 13
VERY POOR-POOR FAIR GOOD
VERY GOOD-EXCELLENT
N 2 21 29 60 112% 1.8% 18.8% 25.9% 53.6% 100.0%N 156 689 1,265 1,180 3,290% 4.7% 20.9% 38.4% 35.9% 100.0%N 23 95 239 314 671% 3.4% 14.2% 35.6% 46.8% 100.0%N 13 66 150 138 367% 3.5% 18.0% 40.9% 37.6% 100.0%N 10 25 85 92 212% 4.7% 11.8% 40.1% 43.4% 100.0%N 2 3 22 21 48% 4.2% 6.3% 45.8% 43.8% 100.0%N 71 349 863 1,093 2,376% 3.0% 14.7% 36.3% 46.0% 100.0%N 39 156 314 421 930% 4.2% 16.8% 33.8% 45.3% 100.0%N 316 1,404 2,967 3,319 8,006% 3.9% 17.5% 37.1% 41.5% 100.0%
ETHNICITY: Started UC proficiency: Understanding of personal social responsibility
CAUCASIAN
OTHER
TOTAL
UCSD Undergraduates
TotalETHNICITY AFRICAN AMERICAN
ASIAN
MEXICAN AMERICAN
FILIPINO
LATINO/OTHER SPANISHNATIVE AMERICAN
In comparing the ratings from the disaggregated respondent groupings,
approximately 54% of African-American respondents rated their incoming
proficiency in understanding of personal social responsibility as very good to
excellent. This exceeded the campus average of approximately 42% by more than
10%. All other groupings except for Filipino and Asian students were above the
campus norm in the very good to excellent rating of this important competency at
entry to UCSD.
Comparative perceptions and experiences-UCUES 2008 22 Office of Student Research UCSD
Table 14
VERY POOR-POOR FAIR GOOD
VERY GOOD-EXCELLENT
N 2 4 18 88 112% 1.8% 3.6% 16.1% 78.6% 100.0%N 53 251 900 2,075 3,279% 1.6% 7.7% 27.4% 63.3% 100.0%N 9 37 114 512 672% 1.3% 5.5% 17.0% 76.2% 100.0%N 7 17 81 262 367% 1.9% 4.6% 22.1% 71.4% 100.0%N 1 7 39 165 212% 0.5% 3.3% 18.4% 77.8% 100.0%N 2 1 11 34 48% 4.2% 2.1% 22.9% 70.8% 100.0%N 23 144 509 1,697 2,373% 1.0% 6.1% 21.4% 71.5% 100.0%N 22 47 207 650 926% 2.4% 5.1% 22.4% 70.2% 100.0%N 119 508 1,879 5,483 7,989% 1.5% 6.4% 23.5% 68.6% 100.0%
ETHNICITY: CURRENT UC proficiency: Understanding of personal social responsibility
UCSD Undergraduates
TotalETHNICITY AFRICAN AMERICAN
ASIAN
MEXICAN AMERICAN
FILIPINO
LATINO/OTHER SPANISHNATIVE AMERICAN
CAUCASIAN
OTHER
TOTAL
AFRICAN AMERICAN 112 0.53 0.968
ASIAN 3,278 0.60 0.952
MEXICAN AMERICAN 670 0.62 0.990
FILIPINO 366 0.72 0.965
LATINO/OTHER SPANISH 210 0.72 0.934
NATIVE AMERICAN 48 0.38 0.733
CAUCASIAN 2,373 0.54 0.902
OTHER 926 0.55 0.950
TOTAL 7,983 0.58 0.941
GA IN : Understanding o f perso nal so cial respo nsibility
UCUES 2008: ACADEMIC AND SOCIAL EXPERIENCE
N M ean Std. D eviat io n
Overall, the campus average in very good to excellent self ratings of the
development and growth in understanding of personal social responsibility was
approximately 69%. These data suggest a significant positive change compared
with the self-ratings at entry to UCSD (approximately 42% with very good to
excellent self ratings). All groupings were within 10% of the campus average in
the current ratings of skill proficiency in this area of personal development.
Although differences in self-reported gains in personal social responsibility can be
Comparative perceptions and experiences-UCUES 2008 23 Office of Student Research UCSD
observed between respondent racial-ethnic groupings, none of the differences were
found to be statistically significant. Skill development for all groupings were fairly
similar, despite different self reported starting points or entry level skill.
Toward a Better Understanding of the Undergraduate Experience: Factor Scores Obtained from the 2008 UCUES instrument
As with prior analyses of the UCUES respondents across all campuses,
researchers and scholars at the Center for Studies in Higher Education at UC
Berkeley identified and derived several factors pertaining to the undergraduate
experience and campus climate (Chatman, 2009). A selection of these factors was
computed for the UCSD sample and factor scores derived to compare these scores
by racial-ethnic grouping.
The technical steps used in computing the factor score included:
(1) Responses by item are standardized to adjust for item response option
types,
(2) The mean of items in the factor or sub factor are computed for those
standardized responses, and,
(3) The resulting factor scores are standardized and reported on a scale with
a mean of 5 and standard deviation of 2.
The factor scores for UCSD and presented in this report use the same
convention developed by the CSHE research team. (Chatman, 2009).
Comparative perceptions and experiences-UCUES 2008 24 Office of Student Research UCSD
This report presents data for the underlying factors identified as
“Satisfaction with the Educational Experience,” “Sense of Belonging and
Satisfaction,” “Cultural Appreciation and Social Awareness,” “Academic
Preparation and Participation,” “Campus Climate for Diversity,” and “Climate for
Personal Characteristics.”
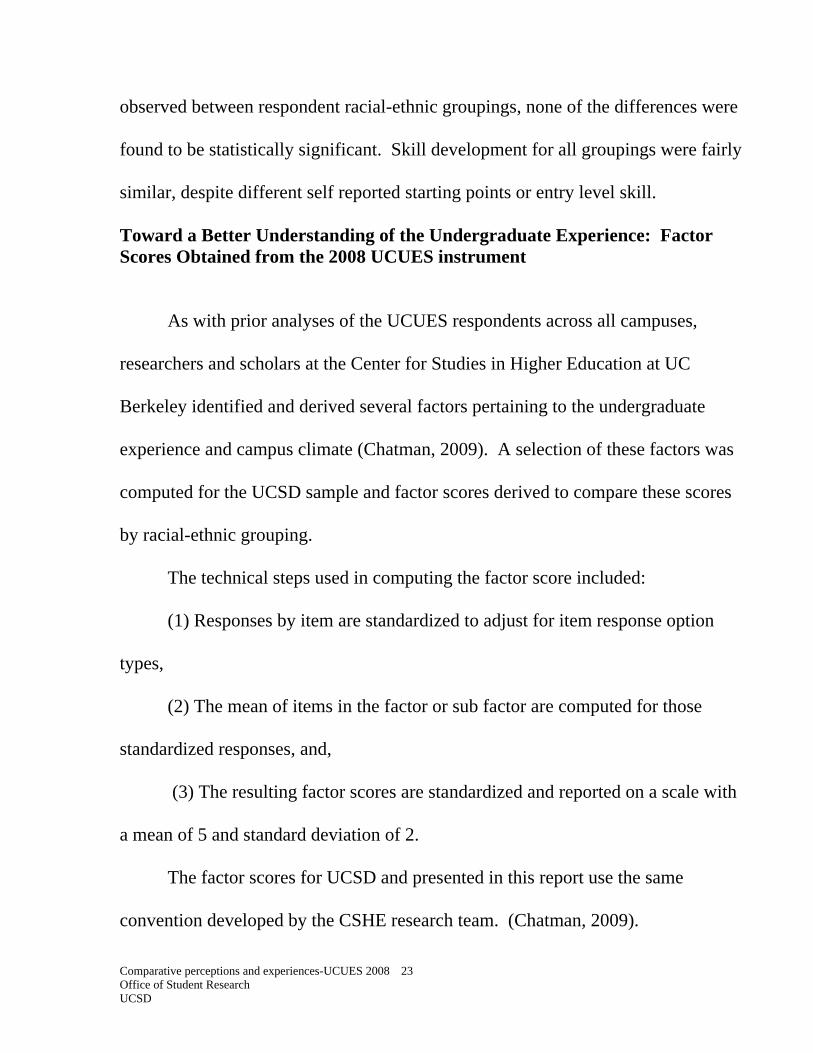
Satisfaction with the Educational Experience
The campus average for this factor was approximately 4.8 with a standard
deviation of 1.9. Comparison of factor scores for the educational experience
construct suggests that African-American, Mexican-American, Filipino, Latino,
Native American, and Caucasian students rate their educational experience more
positively than the Asian respondents. These data are shown in table 15.
Table 15
AFRICAN AMERICAN 110 4.90 1.878
ASIAN 3,250 4.51 1.851
MEXICAN AMERICAN 666 5.17 1.779
FILIPINO 361 4.86 1.781
LATINO/OTHER SPANISH 213 4.95 1.913
NATIVE AMERICAN 48 5.30 2.278
CAUCASIAN 2,356 5.16 1.817
OTHER 922 4.76 1.986
TOTAL 7,926 4.82 1.875
Satisfact io n with Educat io nal Experience 2008
UCUES 2008: ACADEMIC AND SOCIAL EXPERIENCE
N M ean Std. D eviat io n
Additional post-hoc analysis suggests that with the exception of Asian
respondents, there are no significant score differences between the remaining
racial-ethnic groupings on the educational experience factor.
Comparative perceptions and experiences-UCUES 2008 25 Office of Student Research UCSD
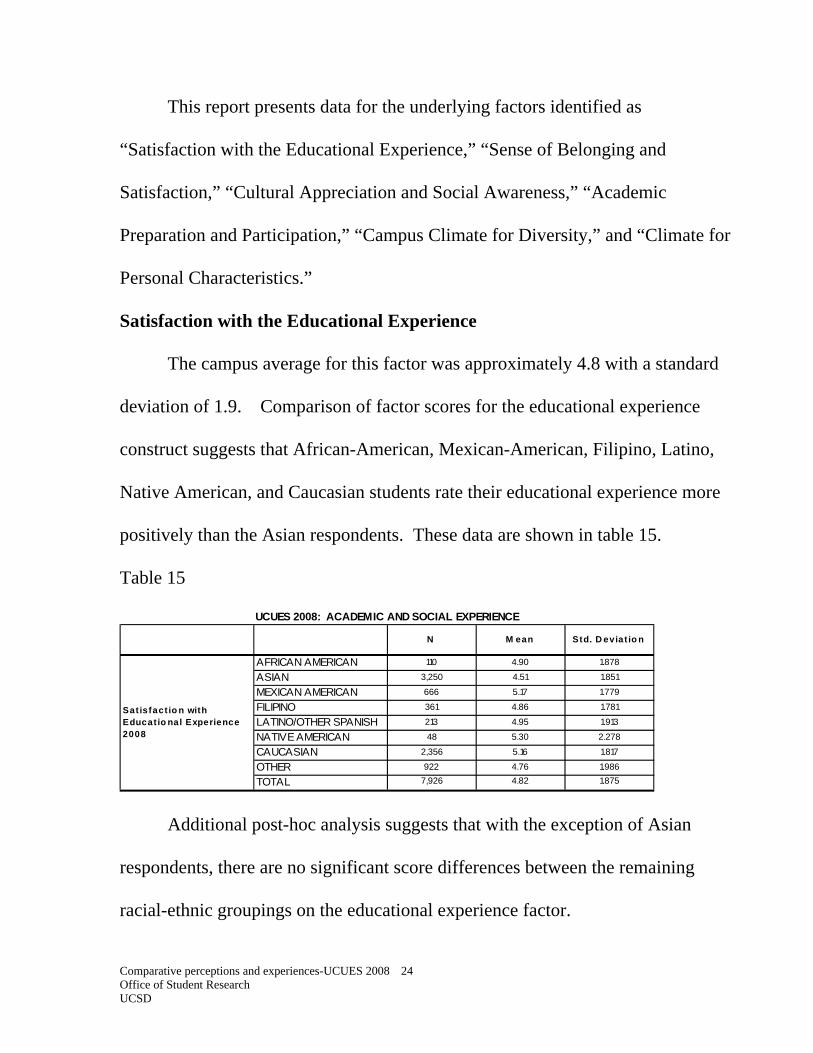
Sense of Belonging and Satisfaction
For the entire UCSD UCUES respondent sample, the average score for the
sense of belonging and satisfaction factor was approximately 4.4 with a standard
deviation of approximately 1.9. When analyzed by student grouping, African-
American and Asian respondents tended to obtain lower factor scores on this
construct compared with other respondent groupings and the campus average while
average scores obtained by Filipino, Mexican-American, Other, Latino, Native
American, and Caucasian students were significantly higher (p <.05). The
standard deviations found for certain racial-ethnic groupings suggests that there
was significant variability in the individual scores obtained for respondents from
their respective group (e.g., African-American, and Native-American).
Table 16
AFRICAN AMERICAN 110 3.82 2.149
ASIAN 3,272 4.14 1.899
MEXICAN AMERICAN 671 4.36 2.009
FILIPINO 366 4.29 1.870
LATINO/OTHER SPANISH 213 4.59 2.001
NATIVE AMERICAN 48 4.90 2.280
CAUCASIAN 2,371 4.78 2.025
OTHER 927 4.41 2.063
TOTAL 7,978 4.40 1.992
M ean Std. D eviat io n
Sense o f B elo nging and Sat isfact io n 2008
UCUES 2008: ACADEMIC AND SOCIAL EXPERIENCE
N

Comparative perceptions and experiences-UCUES 2008 26 Office of Student Research UCSD
Cultural Appreciation and Social Awareness
As shown in table 17, The mean score for UCSD respondents on this factor
score was 4.8 with a standard deviation of approximately 1.98. Analysis of this
score by racial-ethnic grouping suggests that with the possible exception of Asian
respondents, factor scores were fairly similar between the identified groupings.
This was confirmed by additional post-hoc analysis that did not find a statistically
significant difference in the remaining student groupings. (i.e., African American,
Mexican-American, Filipino, Latino, Native American, Caucasian, and Other had
similar factor scores on this construct.
Table 17
AFRICAN AMERICAN 112 5.27 1.893
ASIAN 3,292 4.49 2.027
MEXICAN AMERICAN 673 5.30 1.904
FILIPINO 368 5.23 1.825
LATINO/OTHER SPANISH 214 5.53 1.711
NATIVE AMERICAN 48 5.09 2.122
CAUCASIAN 2,384 4.98 1.925
OTHER 931 5.03 1.900
TOTAL 8,022 4.84 1.979
C ultural A ppreciat io n and So cial A wareness 2008
UCUES 2008: ACADEMIC AND SOCIAL EXPERIENCE
N M ean Std. D eviat io n
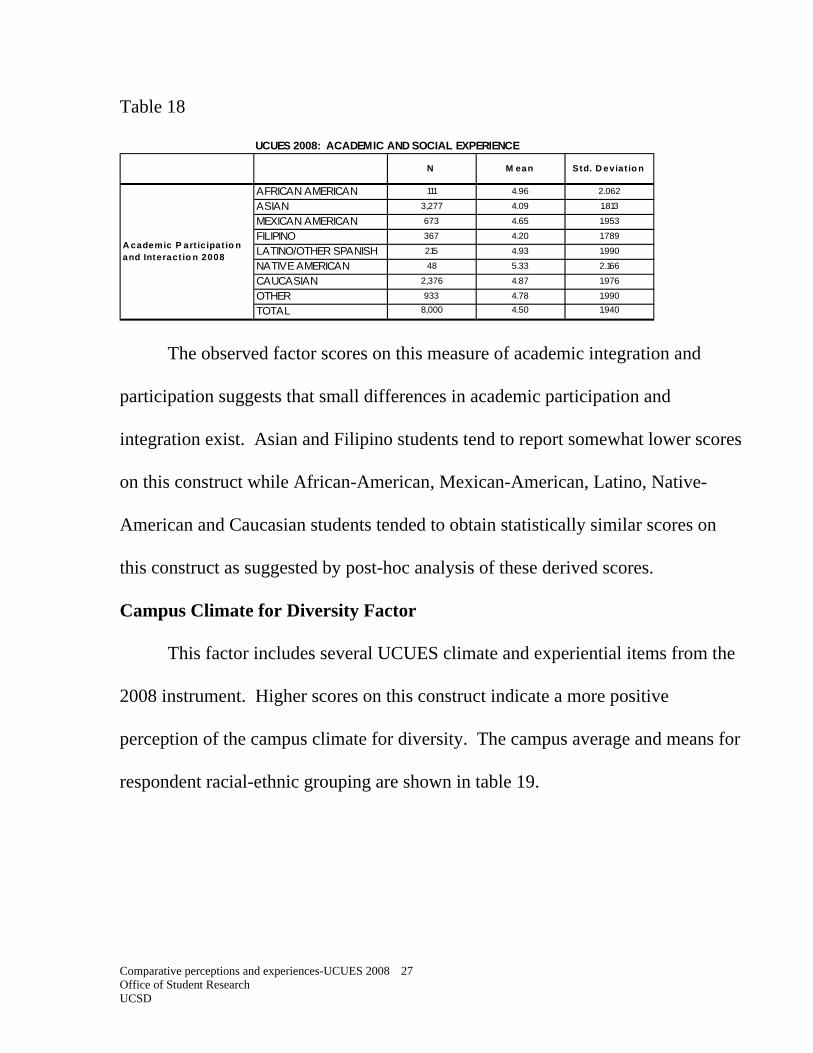
Academic Participation and Interaction
Factor scores for the UCSD respondent sample and by respondent racial-
ethnic groupings are displayed in table 18. The mean score on this construct was
approximately 4.5 with a standard deviation of approximately 1.94.
Comparative perceptions and experiences-UCUES 2008 27 Office of Student Research UCSD
Table 18
AFRICAN AMERICAN 111 4.96 2.062
ASIAN 3,277 4.09 1.813
MEXICAN AMERICAN 673 4.65 1.953
FILIPINO 367 4.20 1.789
LATINO/OTHER SPANISH 215 4.93 1.990
NATIVE AMERICAN 48 5.33 2.166
CAUCASIAN 2,376 4.87 1.976
OTHER 933 4.78 1.990
TOTAL 8,000 4.50 1.940
A cademic P art ic ipat io n and Interact io n 2008
UCUES 2008: ACADEMIC AND SOCIAL EXPERIENCE
N M ean Std. D eviat io n
The observed factor scores on this measure of academic integration and
participation suggests that small differences in academic participation and
integration exist. Asian and Filipino students tend to report somewhat lower scores
on this construct while African-American, Mexican-American, Latino, Native-
American and Caucasian students tended to obtain statistically similar scores on
this construct as suggested by post-hoc analysis of these derived scores.
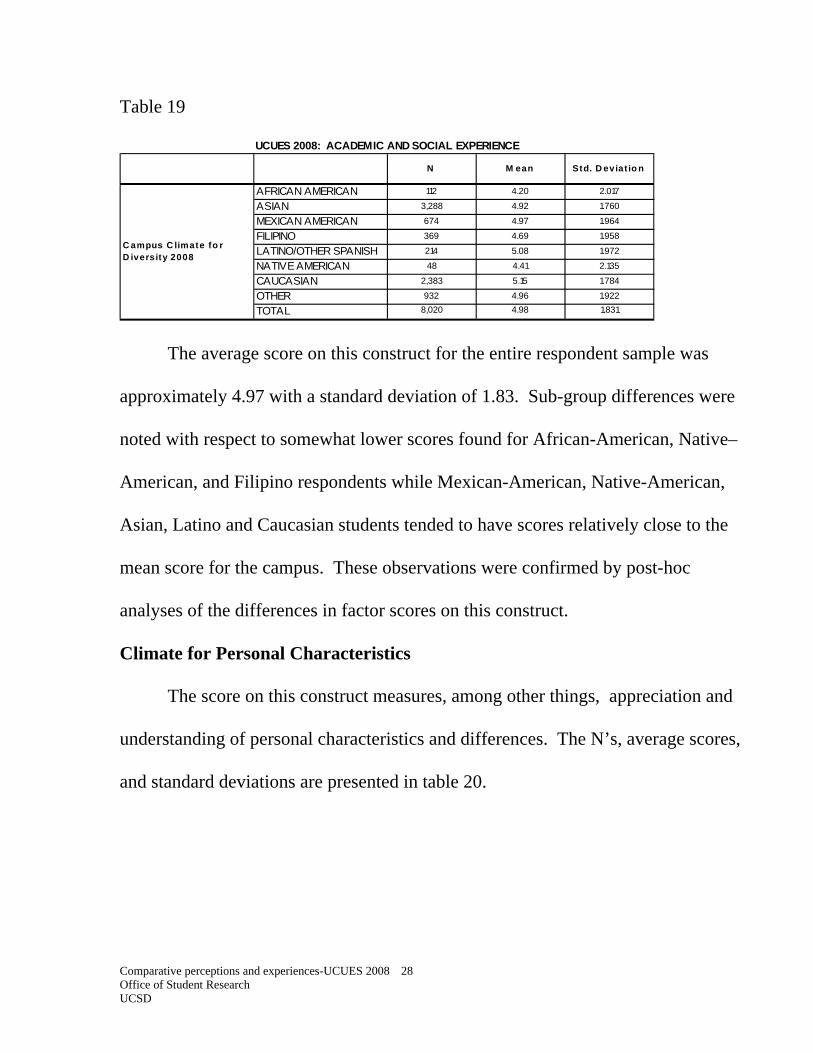
Campus Climate for Diversity Factor
This factor includes several UCUES climate and experiential items from the
2008 instrument. Higher scores on this construct indicate a more positive
perception of the campus climate for diversity. The campus average and means for
respondent racial-ethnic grouping are shown in table 19.
Comparative perceptions and experiences-UCUES 2008 28 Office of Student Research UCSD
Table 19
AFRICAN AMERICAN 112 4.20 2.017
ASIAN 3,288 4.92 1.760
MEXICAN AMERICAN 674 4.97 1.964
FILIPINO 369 4.69 1.958
LATINO/OTHER SPANISH 214 5.08 1.972
NATIVE AMERICAN 48 4.41 2.135
CAUCASIAN 2,383 5.15 1.784
OTHER 932 4.96 1.922
TOTAL 8,020 4.98 1.831
C ampus C limate fo r D iversity 2008
UCUES 2008: ACADEMIC AND SOCIAL EXPERIENCE
N M ean Std. D eviat io n
The average score on this construct for the entire respondent sample was
approximately 4.97 with a standard deviation of 1.83. Sub-group differences were
noted with respect to somewhat lower scores found for African-American, Native–
American, and Filipino respondents while Mexican-American, Native-American,
Asian, Latino and Caucasian students tended to have scores relatively close to the
mean score for the campus. These observations were confirmed by post-hoc
analyses of the differences in factor scores on this construct.
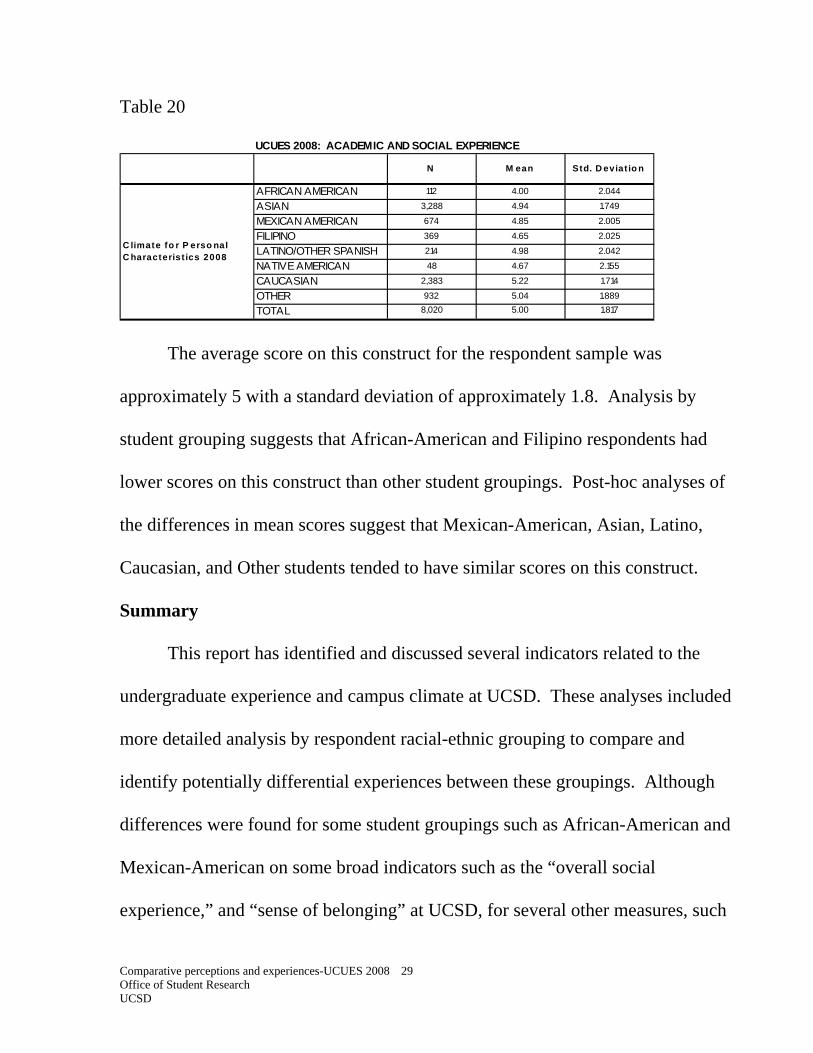
Climate for Personal Characteristics
The score on this construct measures, among other things, appreciation and
understanding of personal characteristics and differences. The N’s, average scores,
and standard deviations are presented in table 20.
Comparative perceptions and experiences-UCUES 2008 29 Office of Student Research UCSD
Table 20
AFRICAN AMERICAN 112 4.00 2.044
ASIAN 3,288 4.94 1.749
MEXICAN AMERICAN 674 4.85 2.005
FILIPINO 369 4.65 2.025
LATINO/OTHER SPANISH 214 4.98 2.042
NATIVE AMERICAN 48 4.67 2.155
CAUCASIAN 2,383 5.22 1.714
OTHER 932 5.04 1.889
TOTAL 8,020 5.00 1.817
C limate fo r P erso nal C haracterist ics 2008
UCUES 2008: ACADEMIC AND SOCIAL EXPERIENCE
N M ean Std. D eviat io n
The average score on this construct for the respondent sample was
approximately 5 with a standard deviation of approximately 1.8. Analysis by
student grouping suggests that African-American and Filipino respondents had
lower scores on this construct than other student groupings. Post-hoc analyses of
the differences in mean scores suggest that Mexican-American, Asian, Latino,
Caucasian, and Other students tended to have similar scores on this construct.
Summary
This report has identified and discussed several indicators related to the
undergraduate experience and campus climate at UCSD. These analyses included
more detailed analysis by respondent racial-ethnic grouping to compare and
identify potentially differential experiences between these groupings. Although
differences were found for some student groupings such as African-American and
Mexican-American on some broad indicators such as the “overall social
experience,” and “sense of belonging” at UCSD, for several other measures, such

Comparative perceptions and experiences-UCUES 2008 30 Office of Student Research UCSD
as reported gains in diversity related understanding and behaviors, satisfaction with
the educational experience, and cultural awareness, most groupings performed
similarly. Further attention may need to be devoted to improving the perceptions
of campus climate and the undergraduate experience on some dimensions such as
campus community, and the climate for diversity as suggested by the data
presented in this research report. As noted by Chatman (2008) in his analysis of
the overall UC system responses to the UCUES, this problem is not necessarily
unique to UCSD. He noted although climate indicators generally found that most
students felt a sense of belonging and general satisfaction with their interactions on
the campus, that special attention needs to be focused on the experiences of low
income and African American students. The campus findings for UCSD tend to
reflect these general conclusions and recommendations found by the study of
UCUES for all UC campuses.
Overall, rich or poor, religious or not religious, immigrant or Mayflower, Republican or Democrat, underrepresented minority or overrepresented majority, UC students feel that they belong at the University of California. In spite of strong scores across the board and only a few relative deficiencies, the University is encouraged to expand discussions about diversity, to launch a more thorough examination of campus climate generally, and to especially consider the experiences of low income and African American students. (Chatman, 2008)
Comparative perceptions and experiences-UCUES 2008 31 Office of Student Research UCSD
References
California Post-Secondary Education Commission (CPEC) (1990). Toward an Understanding of Campus Climate: A report to the legislature in response to assembly bill 4071. Commission report 90-19. Sacramento, CA.
Chatman, Steve (2008). Does Diversity Matter in the Education Process? An Exploration of Student Interactions by Wealth, Religion, Politics, Race, Ethnicity and Immigrant Status at the University of California by Steven Chatman. CSHE.5.2008. Berkeley, CA: The Center for Studies in Higher Education (CSHE) (Research and Occasional Papers Series)
Chatman, Steve (2009). Factor Structure and Reliability of the 2008 and 2009 SERU/UCUES Questionnaire Core. . SERU Project Technical Report (October 2009) Berkeley, CA: Center for Studies in Higher Education.
Fischer, Mary J.(2010) . A Longitudinal Examination of the Role of Stereotype Threat and Racial Climate on College Outcomes for Minorities at Elite Institutions. Social Psychology of Education: An International Journal, v13 n1 p19-40 Mar 2010
Comparative perceptions and experiences-UCUES 2008 32 Office of Student Research UCSD
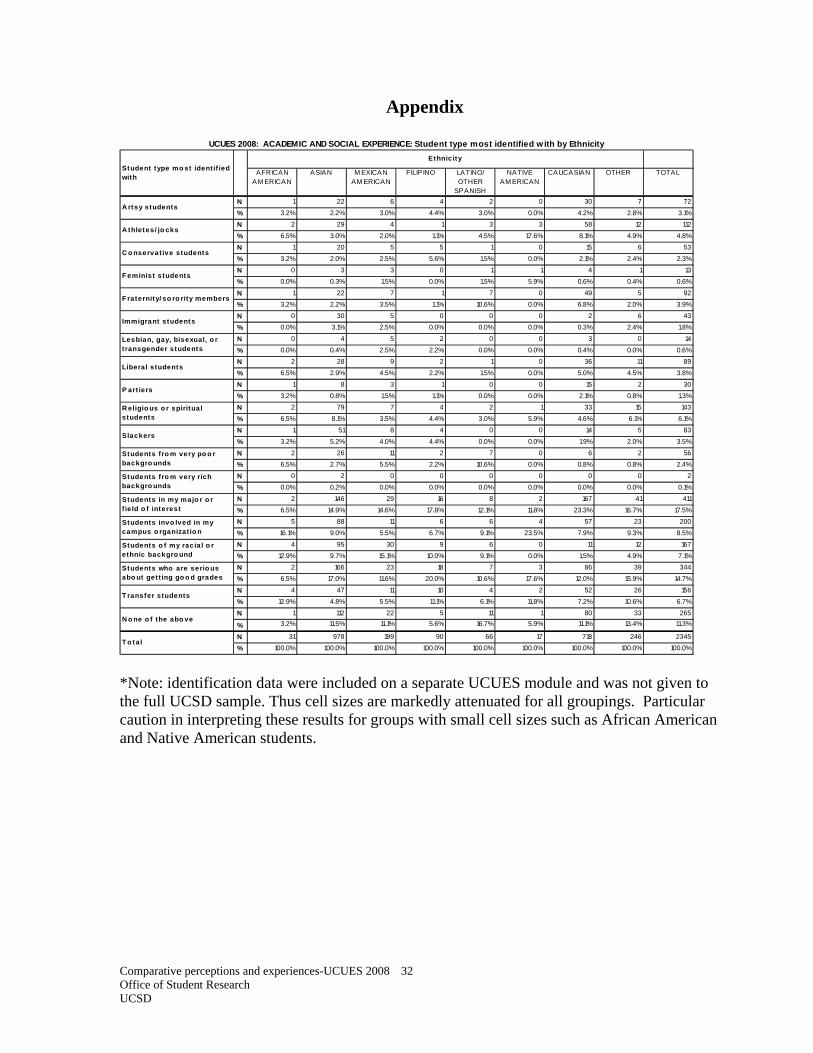
Appendix
AFRICAN AM ERICAN
ASIAN M EXICAN AM ERICAN
FILIPINO LATINO/ OTHER
SPANISH
NATIVE AM ERICAN
CAUCASIAN OTHER TOTAL
N 1 22 6 4 2 0 30 7 72
% 3.2% 2.2% 3.0% 4.4% 3.0% 0.0% 4.2% 2.8% 3.1%
N 2 29 4 1 3 3 58 12 112
% 6.5% 3.0% 2.0% 1.1% 4.5% 17.6% 8.1% 4.9% 4.8%
N 1 20 5 5 1 0 15 6 53
% 3.2% 2.0% 2.5% 5.6% 1.5% 0.0% 2.1% 2.4% 2.3%
N 0 3 3 0 1 1 4 1 13
% 0.0% 0.3% 1.5% 0.0% 1.5% 5.9% 0.6% 0.4% 0.6%
N 1 22 7 1 7 0 49 5 92
% 3.2% 2.2% 3.5% 1.1% 10.6% 0.0% 6.8% 2.0% 3.9%
N 0 30 5 0 0 0 2 6 43
% 0.0% 3.1% 2.5% 0.0% 0.0% 0.0% 0.3% 2.4% 1.8%
N 0 4 5 2 0 0 3 0 14
% 0.0% 0.4% 2.5% 2.2% 0.0% 0.0% 0.4% 0.0% 0.6%
N 2 28 9 2 1 0 36 11 89
% 6.5% 2.9% 4.5% 2.2% 1.5% 0.0% 5.0% 4.5% 3.8%
N 1 8 3 1 0 0 15 2 30
% 3.2% 0.8% 1.5% 1.1% 0.0% 0.0% 2.1% 0.8% 1.3%
N 2 79 7 4 2 1 33 15 143
% 6.5% 8.1% 3.5% 4.4% 3.0% 5.9% 4.6% 6.1% 6.1%
N 1 51 8 4 0 0 14 5 83
% 3.2% 5.2% 4.0% 4.4% 0.0% 0.0% 1.9% 2.0% 3.5%
N 2 26 11 2 7 0 6 2 56
% 6.5% 2.7% 5.5% 2.2% 10.6% 0.0% 0.8% 0.8% 2.4%
N 0 2 0 0 0 0 0 0 2
% 0.0% 0.2% 0.0% 0.0% 0.0% 0.0% 0.0% 0.0% 0.1%
N 2 146 29 16 8 2 167 41 411
% 6.5% 14.9% 14.6% 17.8% 12.1% 11.8% 23.3% 16.7% 17.5%
N 5 88 11 6 6 4 57 23 200
% 16.1% 9.0% 5.5% 6.7% 9.1% 23.5% 7.9% 9.3% 8.5%
N 4 95 30 9 6 0 11 12 167
% 12.9% 9.7% 15.1% 10.0% 9.1% 0.0% 1.5% 4.9% 7.1%
N 2 166 23 18 7 3 86 39 344
% 6.5% 17.0% 11.6% 20.0% 10.6% 17.6% 12.0% 15.9% 14.7%
N 4 47 11 10 4 2 52 26 156
% 12.9% 4.8% 5.5% 11.1% 6.1% 11.8% 7.2% 10.6% 6.7%
N 1 112 22 5 11 1 80 33 265
% 3.2% 11.5% 11.1% 5.6% 16.7% 5.9% 11.1% 13.4% 11.3%
N 31 978 199 90 66 17 718 246 2345
% 100.0% 100.0% 100.0% 100.0% 100.0% 100.0% 100.0% 100.0% 100.0%
Student type mo st ident if ied with
Ethnic ity
UCUES 2008: ACADEMIC AND SOCIAL EXPERIENCE: Student type most identified w ith by Ethnicity
Students invo lved in my campus o rganizat io n
A rtsy students
A thletes/ jo cks
C o nservat ive students
F eminist s tudents
F raternity/ so ro rity members
Immigrant students
Lesbian, gay, bisexual, o r transgender students
Libera l students
P art iers
R eligio us o r spiritual students
Slackers
Students fro m very po o r backgro unds
Students fro m very rich backgro unds
Students in my majo r o r f ie ld o f interest
Students o f my racia l o r ethnic backgro und
Students who are serio us abo ut gett ing go o d grades
T ransfer students
N o ne o f the abo ve
T o tal
*Note: identification data were included on a separate UCUES module and was not given to the full UCSD sample. Thus cell sizes are markedly attenuated for all groupings. Particular caution in interpreting these results for groups with small cell sizes such as African American and Native American students.


![scan new3[12]](https://static.fdocuments.net/doc/165x107/6235488a0f984830bb487127/scan-new312.jpg)


