Comparative Numerical Modeling of Inhaled Micron-sized Particle Deposition in Human and Rat Nasal...
12
http://informahealthcare.com/iht ISSN: 0895-8378 (print), 1091-7691 (electronic) Inhalation Toxicology, Early Online: 1–12 ! 2015 Taylor & Francis. DOI: 10.3109/08958378.2015.1088600 RESEARCH ARTICLE Comparative numerical modeling of inhaled micron-sized particle deposition in human and rat nasal cavities Yidan Shang, Jingliang Dong, Kiao Inthavong, and Jiyuan Tu School of Aerospace, Mechanical & Manufacturing Engineering, and Platform Technologies Research Institute (PTRI), RMIT University, Bundoora, VIC, Australia Abstract Micron-sized particle deposition in anatomically realistic models of a rat and human nasal cavity was numerically investigated. A steady laminar inhalation flow rate was applied and particles were released from the outside air. Particles showing equivalent total particle deposition fractions were classified into low, medium and high inertial particle. Typical particle sizes are 2.5, 9 and 20 mm for the human model and 1, 2 and 3 mm for the rat model, respectively. Using a surface-mapping technique the 3D nasal cavity surface was ‘‘unwrapped’’ into a 2D domain and the particle deposition locations were plotted for complete visual coverage of the domain surface. The total surface area comparison showed that the surface area of the human nasal model was about ten times the size of the rat model. In contrast, the regional surface area percentage analysis revealed the olfactory region of the rat model was significantly larger than all other regions making up 55.6% of the total surface area, while that of the human nasal model only occupying 10.5%. Flow pattern comparisons showed rapid airflow acceleration was found at the nasopharynx region and the nostril region for the human and rat model, respectively. For the human model, the main passage is the major deposition region for micro- particles. While for the rat model, it is the vestibule. Through comparing the regional deposition flux between human and rat models, this study can contribute towards better extrapolation approach of inhalation exposure data between inter-subject species. Keywords CFD, nasal cavity, particle deposition, rat–human extrapolation, surface-mapping History Received 3 July 2015 Revised 11 August 2015 Accepted 24 August 2015 Published online 23 September 2015 Introduction To evaluate the health risk by inhalation exposure, particle dosimetry models have been developed to predict the fate of inhaled airborne particles in the respiratory passages (Asgharian et al., 2014; Kelly et al., 2005). This requires information regarding the amount of particles escaping from the nasal cavity. Particles that deposit onto the nasal cavity have two possible uptake routes. They can cross the respira- tory epithelium and reach the underlying blood vessels, or be adsorbed through the olfactory epithelium, transporting along the olfactory bulb and reach the brain, as demonstrated in rat subjects (Bai et al., 2010; Oberdorster et al., 2004). The relevance of this data can be difficult to extrapolate to human subjects because of the different anatomical geometry—in humans the olfactory mucosa represents 5–10% of the total nasal mucosa but 50% in rats (Schroeter et al., 2008). Early in vivo studies of ultrafine particle deposition in rats using exposure chambers include Wolff et al. (1984) and Gerde et al. (1991). Later, Kelly et al. (2001a, 2002) investigated particle deposition fraction in rats where all particles were either directly inhaled or particles were inhaled naturally using head-only units and whole body chambers. The deposition fractions varied between the inhalation methods tested, since particle inhalability inherently differs for each method. This suggests that the breathing region and external nose should be considered in model studies. In vitro experiments using replica molds have also received intensive research efforts which investigated the influence of the human nasal cavity (Cheng et al., 1996; Dai et al., 2007; Golshahi et al., 2011) and the rat nasal cavity (Ahmed et al., 2012; Cheng et al., 1990; Kelly et al., 2001b) morphology on particle deposition. Computational fluid dynamics (CFD) modeling studies have determined airflow patterns, gas uptake and particle deposition in rats (Garcia & Kimbell, 2009; Jiang & Zhao, 2010; Schroeter et al., 2012; Wei et al., 2013), and humans (Dastan et al., 2014; Ghahramani et al., 2014; Ghalati et al., 2012; Inthavong et al., 2008; Oldham, 2000). These studies revealed the main deposition sites for different particle sizes, and used non-dimensional numbers (i.e. inertial parameter, Stokes number, and Peclet number) to incorporate the influence of particle size with combinations of flow rate and airway geometry. Interspecies modeling comparisons have been performed by Zhao et al. (2006) investigating the influence of sniffing conditions on odorant transport; Schroeter et al. (2008) Address for correspondence: Prof. Jiyuan Tu, School of Aerospace, Mechanical & Manufacturing Engineering, and Platform Technologies Research Institute (PTRI), RMIT University, PO Box 71, Bundoora, VIC 3083, Australia. Tel: +61-3-9925-6191. Fax: +61-3-9925-6108. E-mail: [email protected] Downloaded by [RMIT University] at 04:02 10 October 2015
description
Comparative Numerical Modeling of Inhaled Micron-sized Particle Deposition in Human and Rat Nasal Cavities
Transcript of Comparative Numerical Modeling of Inhaled Micron-sized Particle Deposition in Human and Rat Nasal...
http://informahealthcare.com/ihtISSN: 0895-8378 (print), 1091-7691 (electronic)
Inhalation Toxicology, Early Online: 1–12! 2015 Taylor & Francis. DOI: 10.3109/08958378.2015.1088600
RESEARCH ARTICLE
Comparative numerical modeling of inhaled micron-sized particledeposition in human and rat nasal cavities
Yidan Shang, Jingliang Dong, Kiao Inthavong, and Jiyuan Tu
School of Aerospace, Mechanical & Manufacturing Engineering, and Platform Technologies Research Institute (PTRI), RMIT University, Bundoora,
VIC, Australia
Abstract
Micron-sized particle deposition in anatomically realistic models of a rat and human nasal cavitywas numerically investigated. A steady laminar inhalation flow rate was applied and particleswere released from the outside air. Particles showing equivalent total particle depositionfractions were classified into low, medium and high inertial particle. Typical particle sizes are2.5, 9 and 20 mm for the human model and 1, 2 and 3 mm for the rat model, respectively. Usinga surface-mapping technique the 3D nasal cavity surface was ‘‘unwrapped’’ into a 2D domainand the particle deposition locations were plotted for complete visual coverage of the domainsurface. The total surface area comparison showed that the surface area of the human nasalmodel was about ten times the size of the rat model. In contrast, the regional surface areapercentage analysis revealed the olfactory region of the rat model was significantly larger thanall other regions making up �55.6% of the total surface area, while that of the human nasalmodel only occupying 10.5%. Flow pattern comparisons showed rapid airflow acceleration wasfound at the nasopharynx region and the nostril region for the human and rat model,respectively. For the human model, the main passage is the major deposition region for micro-particles. While for the rat model, it is the vestibule. Through comparing the regional depositionflux between human and rat models, this study can contribute towards better extrapolationapproach of inhalation exposure data between inter-subject species.
Keywords
CFD, nasal cavity, particle deposition,rat–human extrapolation, surface-mapping
History
Received 3 July 2015Revised 11 August 2015Accepted 24 August 2015Published online 23 September 2015
Introduction
To evaluate the health risk by inhalation exposure, particle
dosimetry models have been developed to predict the fate of
inhaled airborne particles in the respiratory passages
(Asgharian et al., 2014; Kelly et al., 2005). This requires
information regarding the amount of particles escaping from
the nasal cavity. Particles that deposit onto the nasal cavity
have two possible uptake routes. They can cross the respira-
tory epithelium and reach the underlying blood vessels, or be
adsorbed through the olfactory epithelium, transporting along
the olfactory bulb and reach the brain, as demonstrated in rat
subjects (Bai et al., 2010; Oberdorster et al., 2004). The
relevance of this data can be difficult to extrapolate to human
subjects because of the different anatomical geometry—in
humans the olfactory mucosa represents 5–10% of the total
nasal mucosa but 50% in rats (Schroeter et al., 2008).
Early in vivo studies of ultrafine particle deposition in rats
using exposure chambers include Wolff et al. (1984) and
Gerde et al. (1991). Later, Kelly et al. (2001a, 2002)
investigated particle deposition fraction in rats where all
particles were either directly inhaled or particles were inhaled
naturally using head-only units and whole body chambers.
The deposition fractions varied between the inhalation
methods tested, since particle inhalability inherently differs
for each method. This suggests that the breathing region and
external nose should be considered in model studies. In vitro
experiments using replica molds have also received intensive
research efforts which investigated the influence of the human
nasal cavity (Cheng et al., 1996; Dai et al., 2007; Golshahi
et al., 2011) and the rat nasal cavity (Ahmed et al., 2012;
Cheng et al., 1990; Kelly et al., 2001b) morphology on
particle deposition.
Computational fluid dynamics (CFD) modeling studies
have determined airflow patterns, gas uptake and particle
deposition in rats (Garcia & Kimbell, 2009; Jiang & Zhao,
2010; Schroeter et al., 2012; Wei et al., 2013), and humans
(Dastan et al., 2014; Ghahramani et al., 2014; Ghalati et al.,
2012; Inthavong et al., 2008; Oldham, 2000). These studies
revealed the main deposition sites for different particle sizes,
and used non-dimensional numbers (i.e. inertial parameter,
Stokes number, and Peclet number) to incorporate the
influence of particle size with combinations of flow rate
and airway geometry.
Interspecies modeling comparisons have been performed
by Zhao et al. (2006) investigating the influence of sniffing
conditions on odorant transport; Schroeter et al. (2008)
Address for correspondence: Prof. Jiyuan Tu, School of Aerospace,Mechanical & Manufacturing Engineering, and Platform TechnologiesResearch Institute (PTRI), RMIT University, PO Box 71, Bundoora,VIC 3083, Australia. Tel: +61-3-9925-6191. Fax: +61-3-9925-6108.E-mail: [email protected]
Dow
nloa
ded
by [
RM
IT U
nive
rsity
] at
04:
02 1
0 O
ctob
er 2
015
studying acrolein uptake; and Corley et al. (2012) which
considered high-resolution models of the respiratory airway
from nose to deep lung branches for vapor uptake analysis.
Although inhaled particle deposition characteristics have
been considerably studied both experimentally and numeric-
ally, limitations still exist in terms of deposition analysis and
data extrapolation among species. The nasal cavity is an
extremely complicated geometry that is difficult to visualize
without a 3D viewer. This makes particle deposition patterns
in nasal cavities inaccessible in some regions. Furthermore,
the anatomical geometries of the nasal cavity differ among
species causing different fluid–particle interactions and
leading to different deposition regions for the same particle
sizes.
This study aims to provide detailed particle deposition
characteristics of micron-sized particles within anatomically
accurate rat and human nasal passages, to reveal their
deposition similarities and differences. Unlike previous
studies, this article presents a systematic method to visualize
the respiratory surface by converting the 3D nasal cavity
surface into a 2D domain. This allows data access to the entire
wrapped nasal cavity walls. The outer face of both species is
included to account for realistic particle inhalation. This
comparative study can contribute towards improving extrapo-
lation from monitored exposures of laboratory animals to
possible human exposure scenarios, and better understanding
the cause-and-effect relationship between particle exposure
risk and health consequences.
Methods
Nasal models
Computational models of the human (48-year-old healthy
male) and rat (Sprague-Dawley, 400 g) nasal passages were
developed based on CT images. The models were truncated at
the anterior trachea to focus on particle deposition in the
upper respiratory tract. Figure 1a shows the airway recon-
structed from CT images. The models include both left and
right nasal passages, and the nasopharyngeal duct. Detailed
model reconstruction and its verification have been reported
in the author’s previous article (Inthavong et al., 2009). To
better represent the flow conditions at and around the nostril
inlets, the external nares, facial features, and the surrounding
environment near the face were included (Figure 1b) (Doorly
et al., 2008; Ge et al., 2013; Inthavong et al., 2012, 2013;
King & Inthavong, 2010).
The nasal surface were divided into seven regions based on
a combination of anatomical features and epithelial tissue
types (Gross et al., 1982; Schroeter et al., 2012, 2015). These
regions are: the (i) vestibule (squamous epithelium); (ii) upper
passage (mainly transitional epithelium); (iii) middle and (iv)
lower passage (mainly respiratory epithelium), (v) olfactory
(olfactory epithelium), (vi) septum and (vii) pharynx.
The surface-mapping technique originally developed by
Inthavong et al. (2014) was adopted to unwrap the nasal cavity
morphology from its 3D domain (Figure 2a and b) onto a
planar 2D domain and normalized its length and width
(Figure 2c and d). The model was first sliced along the
centerline of the nasal passage floor; where the lateral and
septal wall sides meet inferiorly. The 3D surface coordinates
were transformed into a new set of coordinates in 2D space,
which mimics the surfaces being unfurled and laid out with
the top and bottom boundaries representing the initial
centerline slice along the nasal passage floor, and the left
and right boundaries representing the nostril inlet, and
nasopharynx exit respectively. Finally, the 2D surface was
normalized into an orthogonal shape allowing direct com-
parisons between species.
The computational models were meshed using ICEM-CFD
(ANSYS�
Inc., Canonsburg, PA) with unstructured tetrahe-
dral elements. Prism layers were applied in near wall regions
to provide accurate near wall particle behavior. The number
of independent mesh elements for the human and rat models
were 3.8 million and 4.2 million, respectively.
Inhalation and particle deposition modelling
Physiological reasonable steady flow rates (15 L/min for the
human model and 0.4 L/min for the rat model) are used to
simulate rest breathing conditions (Kelly et al., 2004). The
flow was treated as laminar and incompressible using the
commercial CFD package, ANSYS-Fluent v14.5 (ANSYS�).
To ensure similarity with particle exposure experiments,
micron-sized particles were released in front of breathing
zone (Figure 1b). It was reported that particle deposition
fraction approaches 100% in human nasal cavities when
particle diameters420 mm (Inthavong et al., 2006), while for
rats, this occurs for particle diameters45 mm (Kelly et al.,
2001b). Therefore, this study is mainly focused on particle
diameter within the range of 0.5–20 mm for the human model
and 0.5–5 mm for the rat model.
The particle Stokes number (Stk) was calculated to
compare the different fluid–particle behavior caused by
interspecies differences between the human and rat models.
It is commonly used in respiratory deposition studies
(Inthavong et al., 2011; Schroeter et al., 2012; Si et al.,
2013; Wang et al., 2009) since it considers the flow rate,
particle, and airway geometry, which all contribute towards
the inertial character of the airborne micron particle. These
variables come together as
Stk ¼ �d2uc
18�dc
ð1Þ
where � is the particle density, d is the particle diameter, uc is
the equivalent characteristic air velocity, � is the fluid
viscosity and dc is the equivalent characteristic dimension
of the nasal passage. Substituting airflow rate Q ¼ uc�ð12 dcÞ2,
Equation (1) is transformed to:
Stk ¼ 2�d2Q
9��d3c
ð2Þ
The calculation of the Stk largely depends on a character-
istic diameter dc that is determined from the airway geometry,
which wields significant influence. In this study, the charac-
teristic diameter is estimated by the total nasal volume V and
the total nasal surface area S (Garcia et al., 2009; Golshahi
et al., 2011; Storey-Bishoff et al., 2008)
dc ¼ V=S ð3Þ
2 Y. Shang et al. Inhalation Toxicology, Early Online: 1–12
Dow
nloa
ded
by [
RM
IT U
nive
rsity
] at
04:
02 1
0 O
ctob
er 2
015

Figure 1. (a) Contiguous nasal airway passage (green) extracted from CT-scans. Additional anatomical features are overlayed in gray color for the outerface, and green color for bone structure. (b) CFD model showing the face-nasal cavity computational domain exposed to micron particles from thesurrounding air. The human nasal cavity used in this study is labeled as NC04 and the rat nasal cavity is RNC01.
Figure 2. (a) and (b) 3D domain of the human nasal cavity and (c) and (d) 2D unwrapped models of the Human NC04 and Rat RNC01 nasal modelsseparated, and labeled with seven major nasal anatomical types. As surfaces were significantly distorted in 2D domains during normalization, absolutesurface areas of the vestibule (I), main passage (II) and pharynx (III) are given.
DOI: 10.3109/08958378.2015.1088600 Micron-particle deposition in human/rat noses 3
Dow
nloa
ded
by [
RM
IT U
nive
rsity
] at
04:
02 1
0 O
ctob
er 2
015

Typical low, medium and high inertial particles were
defined according to their total deposition fractions �3, 40
and 100 in the human and rat nasal cavities. The correspond-
ing particle sizes are 2.5, 9 and 20 mm for the human model,
and 1, 2 and 3 mm for the rat model. However, the
corresponding Stokes numbers are quite different, with 3.0,
39.0 and 193.3 for human and 1.2, 4.8 and 10.9 for rat
(Table 1).
Particle deposition visualisation
Previous studies have demonstrated that particles deposit on
the skin-like squamous epithelium in the vestibule region can
be cleared from the nose, and those enter into nasopharynx
region are likely to deposit in lower respiratory tract therefore
damaging the lung (Schroeter et al., 2008). Three main nasal
areas (Figure 2) were defined to evaluate and compare the
nasal filtering function for all three typical particles. These
areas are: area-I (includes the nasal vestibule); area-II
(includes the main nasal passage) and area-III (includes the
nasopharynx).
Although regional particle deposition fraction analysis
have been extensively investigated in previous studies
(Schroeter et al., 2008, 2015; Garcia & Kimbell, 2009),
direct interspecies comparisons remains difficult due to the
inconsistency during the anatomical region mapping, geo-
metrical variations of nasal models and significant anatomy
differences between human and rat nasal models. To allow
direct comparisons, we visualize the particle deposition
pattern across the entire nasal cavity surface using the
unwrapped surface technique.
The particle deposition pattern was visualized using 10 000
particle deposition locations on the 3D transparent nasal
domain (side view and top view), and the corresponding
unwrapped 2D domain. In addition, cross-sectional particle
densities were extracted along the nasal passage to reflect the
deposition depth of hot spots. Therefore, particle deposition
hot spots can be visualized in 3D, 2D and 1D, which enables
an effective way to distinguish different sized particle
deposition patterns and quantify the particle deposition
penetration.
Results and discussion
Nasal cavity measurements and comparison
Anatomical measurements of the major epithelial regions
were compared between the human and rat models in Table 2.
The total surface area of the human model was almost 10
times of the rat model. The largest surface area coverage for
the human model were the middle (26.9%) and lower
passages (25.9%) which combined together to make up
approximately 52.8% of the total surface area. In contrast, the
rat middle and lower passage only took up 16.3% in total. The
largest area coverage for the rat model was the olfactory
region which contributes 55.6%, enabling the region to have
greater exposure to inhaled particles. This compared with the
human model that showed a value of 10.5%.
Comparisons with available data from literature were made
for the vestibule and olfactory regions. There is generally
good agreement for the human and rat model based on the
epithelia mapping. The rat vestibule and olfactory region is
slightly greater than the reported values in the literature.
Table 2. Geometrical comparison of major anatomical regions for rat and human nasal models.
Region ID Region name Surface area of ratRNC01 (mm2)
Percentage of surface area (%) Surface area of humanNC04 (mm2)
Percentage of surface area (%)
Present model Literature Present model Literature
1 Vestibule 134 5.8 4.4a, 4.0b, 3–4c 1571 7.9 8.2a, 6.2b
2 Upper passage 119 5.1 566 2.83 Middle passage 241 10.3 5343 26.94 Lower passage 140 6.0 5147 25.95 Olfactory 1294 55.6 41.8a, 40.6d, 50–52c 2097 10.5 9.5a
6 Septum 308 13.3 3939 19.97 Pharynx 89 3.9 1220 6.1Total area (mm2) 2325 100 19882 100
Rat NC04 Human NC04
Nasal volume (mm3) 653.2 25267.4Characteristic length dc (mm) 0.28 1.27
aSchroeter et al. (2008).bSchroeter et al. (2014).cGross et al. (1982).dGarcia and Kimbell (2009).
Table 1. Comparison of deposition fractions, particle sizes, inertial parameters and Stokes numbers for the rat and human models.
Inertial Deposition fraction Particle diameter (mm) Inertial parameter �d2Q (g mm2/s) Stokes No.
Rat (%) Human (%) Rat Human Rat Human Rat Human
Low 3 3.4 1 2.5 6.7 1562.5 1.2 3.0Medium 40 40 2 9 26.7 20250 4.8 39.0High 100 100 3 20 60 100000 10.9 193.3
4 Y. Shang et al. Inhalation Toxicology, Early Online: 1–12
Dow
nloa
ded
by [
RM
IT U
nive
rsity
] at
04:
02 1
0 O
ctob
er 2
015
These two regions were selected for comparison as they have
important roles in basic nasal functions. As the most anterior
part of nasal cavity, the vestibule is covered by vibrissae
(short and thick hairs), enhancing particle filtration while the
olfactory region is rich in olfactory sensory neurons and
capillaries, allowing olfaction. The nasal volume of the
human model is 39 times of the rat model. However, the
characteristic length of human model (1.27 mm) is only
around five times of the rat model (0.28 mm), indicating that
the nasal structure of rat is more complex than that of human
(Table 2).
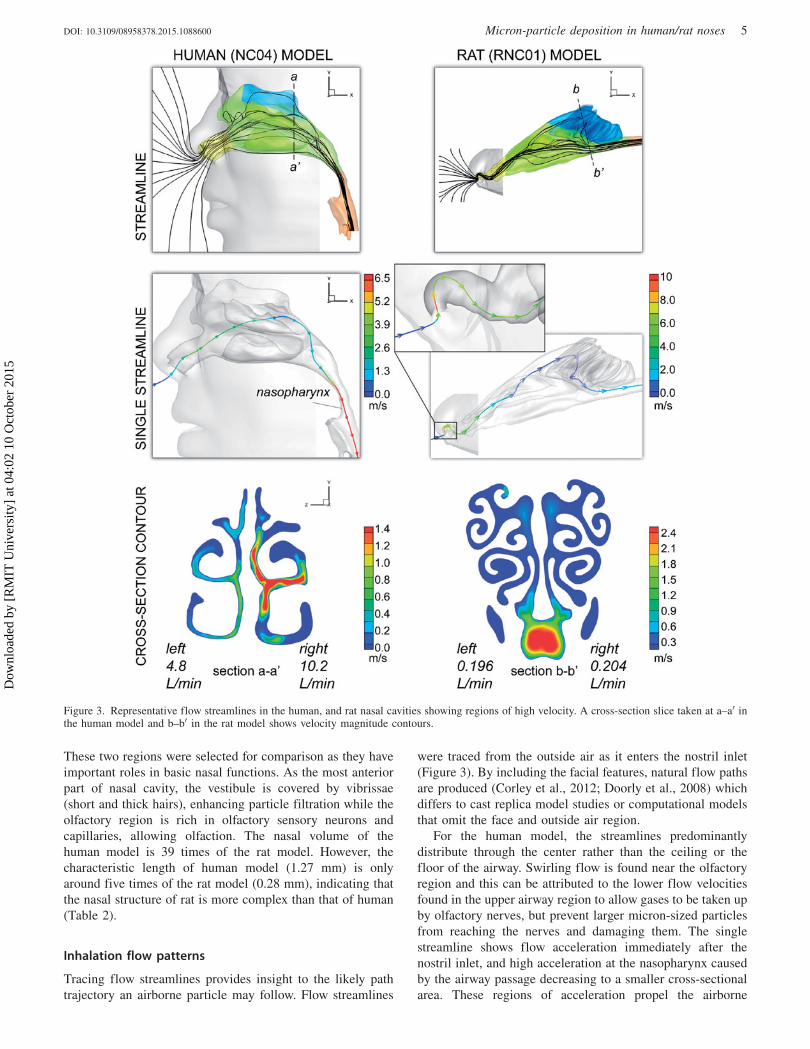
Inhalation flow patterns
Tracing flow streamlines provides insight to the likely path
trajectory an airborne particle may follow. Flow streamlines
were traced from the outside air as it enters the nostril inlet
(Figure 3). By including the facial features, natural flow paths
are produced (Corley et al., 2012; Doorly et al., 2008) which
differs to cast replica model studies or computational models
that omit the face and outside air region.
For the human model, the streamlines predominantly
distribute through the center rather than the ceiling or the
floor of the airway. Swirling flow is found near the olfactory
region and this can be attributed to the lower flow velocities
found in the upper airway region to allow gases to be taken up
by olfactory nerves, but prevent larger micron-sized particles
from reaching the nerves and damaging them. The single
streamline shows flow acceleration immediately after the
nostril inlet, and high acceleration at the nasopharynx caused
by the airway passage decreasing to a smaller cross-sectional
area. These regions of acceleration propel the airborne
Figure 3. Representative flow streamlines in the human, and rat nasal cavities showing regions of high velocity. A cross-section slice taken at a–a0 inthe human model and b–b0 in the rat model shows velocity magnitude contours.
DOI: 10.3109/08958378.2015.1088600 Micron-particle deposition in human/rat noses 5
Dow
nloa
ded
by [
RM
IT U
nive
rsity
] at
04:
02 1
0 O
ctob
er 2
015

particles forwards, increasing the particle inertia. This
increases the likelihood of particle impaction when the flow
streamline changes path and the particle inertia is too great.
This flow feature makes the anterior nasal half and the
nasopharynx region acting as a gravimetric sampling filter.
The cross section shows a flow preference to the left nasal
chamber which is caused by the larger volume found from the
scanned data, linked to the regulating nasal cycle.
For the rat model flow enters the nose and immediately
turns sharply, followed with a U-shaped turn and a further 90�
bend before entering the main nasal passage. These sharp
turns provides significant filtration function. The initial sharp
acceleration increases the velocity from the ambient zero
velocity to 10 m/s in the space of a few millimeters. In the
human model, the acceleration in the nostril region increases
the velocity to 2.5 m/s and in the nasopharynx increases to
6.5 m/s. The rapid velocity increase over a short distance in
the rat airway significantly increases the particle deposition
for micron-sized particles. This has significant implications
when direct comparisons are made for deposition models with
human nasal cavity airways that have a more relaxed
acceleration through the nasal vestibule.
Although the olfactory regions of both human and rat are
located in the dorso-posterior region, the olfactory region of
human is located superiorly relative to the nostril entry for
inhaled air while the rat model it is in-line with the nostril
entry. For the rat model particles or gases that are able to
penetrate the anterior nose are easily taken up by the olfactory
region, particularly since the region has 50% surface coverage
of the entire nasal cavity. The cross-section slice shows the rat
passage has a more complicated geometry. The flow
concentrated along the floor of the airway and this is because
the lower region connects to the pharynx.
Particle deposition fraction comparison
The particle deposition fraction was defined as the ratio of the
number of particles depositing in the nasal cavity to the total
amount of particles inhaled. This was plotted against the
particle inertial parameter I ¼ �d2Q where � is the particle
density (g/cm3), d is the particle diameter (mm) and Q is the
volume flow rate (cm3/s). Comparisons were made with
existing literature data to confirm the reliability of the
computational model simulations.
Figure 4 compares the simulation results for the human
NC04 model with: in vitro data from Kelly et al. (2004) that
used a human nasal replica made from MRI scans of a
Caucasian male subject; CFD simulations by Schroeter et al.
(2011) that modified Kelly et al. (2004)’s model into model
A, B and C with three different surface roughness; and in vivo
data by Hsu & Chuang (2012) that studied nine male and
female volunteers from Taiwan with ages ranging from 23 to
45. The predicted deposition fraction profile produced an
S-shaped inertial deposition curve and showed good agree-
ment with the existing data; especially well matched with
Model B from Schroeter et al. (2011). The deposition fraction
remains510% when the inertial parameter I5104 g�mm2/s. As
the inertial parameter I increases, the deposition profile
increases sharply and reaches complete deposition when
I4105 g�mm2/s.
Figure 5 compares the simulation results for the rat RNC01
model with: in vivo data from Kelly et al. (2001a) that studied
particle exposure experiments on 22 female Long-Evans rats;
and in vitro data from Kelly et al. (2001b) using a nasal
replica cast model from one Long-Evans rats. The compari-
son shows that for inertial parameter I510 g�mm2/s, the
numerical simulation slightly under predicts with the in vivo
results (triangle symbols) but fits better with the in vitro
Figure 4. Particle deposition fraction as afunction of the inertial parameter I compari-son between the results obtained from thehuman NC04 model simulation with data inthe literature.
6 Y. Shang et al. Inhalation Toxicology, Early Online: 1–12
Dow
nloa
ded
by [
RM
IT U
nive
rsity
] at
04:
02 1
0 O
ctob
er 2
015

results (circle symbols). For inertial parameter I410 g�mm2/s,
the numerical model compares well for both experimental
results with a slight under prediction when inertial parameter
I approaches 102 g�mm2/s.
Deposition in the human NC04 model
Figure 6 shows a majority of particles depositing in the main
nasal passage (II) capturing 2.12, 35.8 and 77.4% of particles
for the low, medium and high inertial, respectively.
Preferential deposition in this region occurs because the
airway opens up from the anterior nose allowing more
particles to access the main passage. Although the vestibule is
the second preferred deposition site, the deposition fractions
are negligible for low (0.95% deposition) and medium (2.85%
deposition) inertial particles. It increases significantly to 21%
for high inertial particles. The nasopharynx (III) region has
the lowest deposition for all particle sizes due to its posterior
location.
Figure 7 shows the deposition pattern in the human NC04
model. Deposition of 2.5 mm particles shows a large, widely
dispersed deposition pattern with a total deposition fraction of
3.5% (left chamber: 1.1%, right chamber: 2.4%). The
deposition pattern in 3D space is cast onto the 2D domain
Figure 5. Particle deposition fraction as afunction of the inertial parameter I compari-son between the results obtained from thehuman RNC01 model simulation with data inthe literature.
Figure 6. Regional particle deposition frac-tion comparison for the human NC04 modelusing semi-log axes.
DOI: 10.3109/08958378.2015.1088600 Micron-particle deposition in human/rat noses 7
Dow
nloa
ded
by [
RM
IT U
nive
rsity
] at
04:
02 1
0 O
ctob
er 2
015

which reveals the extent of dispersion (Figure 7c). This is
characteristic of low inertial particles that are more likely to
adapt to the changing inhaled flow paths as it is being
transported through the nasal cavity and penetrate the nasal
cavity further. For a particle size of 9 mm, the total deposition
fraction is 40.0% (left chamber: 17.7%, right chamber: 22.3%)
as the particle inertia is increased. This leads to fewer
particles able to follow the airflow, and its deposition pattern
region reduces. For 20 mm particles, deposition fraction
reaches 100% with a majority 70% depositing in the right
chamber. Particles are mainly concentrated in the main nasal
passage (area II) by direct impaction. The deposition pattern
cast onto the 2D domain shows local concentration of
particles near the entrance to the main nasal passage. In
both cavities, deposition occurs on the nasal septal wall side.
More particles deposited in the right chamber compared to the
left chamber for all three particle sizes tested. This was
mainly due to the asymmetric geometry of the human NC04
model, where its right nasal chamber is slightly larger than the
left, allowing more airflow through with less flow resistance
(which was found in the cross section contour in Figure 3).
We analyzed the mass flow attribution in each chamber which
showed a 32:68% flow rate distribution in the left to right
chambers. Figure 7� shows particle deposition is more
disperse and broad in the right cavity compared to the left
cavity. One major reason is the degree of the uneven flow
rates between the two chambers producing irregular path
trajectories. Particles prefer to deposit at sites where the
airflow velocity decreases sharply. This is consistent with the
cross-sectional contour of the human model in Figure 3
(bottom-left panel) where the airflow in the right cavity
exhibits much higher velocity gradient than that in the left
cavity, causing particles to scatter more around the cavity.
The deposition penetration distribution in Figure 7(d)
indicates that particles are concentrated in four hot spots
labeled as ‘‘A’’, ‘‘B’’, ‘‘C’’ and ‘‘D’’ in the human nasal
cavity. Location ‘‘A’’ and ‘‘D’’ are located at the top of
vestibule of right cavity and posterior septum of right cavity,
respectively. These regions in the right chamber are prefer-
ential deposition sites for all three particles. Further inspec-
tion of the geometry shows that region is a consequence of the
airflow entering the nostril inlet at higher momentum, while
location ‘‘D’’ exhibits a minor deviated septum causing flow
disturbance.
Location ‘‘B’’ has high deposition of high inertial particles
(20 mm) only for both chambers. This location is located at the
‘‘nasal valve’’ which is close to the common boundary of
vestibule and septum of both cavities. Location ‘‘C’’ exhibits
high deposition for medium (9 mm) and high (20 mm) inertial
particles. The deposition occurs at the anterior septum for
both chambers and at the common boundary of septum and
upper passage of left cavity.
Figure 7. Particle deposition patterns for the human NC04 model in the 3D domain (a and b), 2D planar domain (c) and deposition penetrationdistribution (d). Particle sizes are colored based on the low (2.5 mm, blue), medium (9 mm, green) and high inertial (20 mm, red) according to theirdeposition fractions reported. The x-coordinate in (d) is normalized by the maximum penetration depth from nostril to naso-pharynx.
8 Y. Shang et al. Inhalation Toxicology, Early Online: 1–12
Dow
nloa
ded
by [
RM
IT U
nive
rsity
] at
04:
02 1
0 O
ctob
er 2
015

Rat RNC01 model
Local deposition fractions for the rat model (Figure 8) exhibit
a different profile to the human model. For all particles,
deposition predominantly occurs in the vestibule (I) region
with deposition fractions of 2.4, 38.9 and 100% for the low,
medium, and high particle inertial, respectively. This suggests
that the region behaves as a significant particle filter. This
correlates with the anatomy which shows highly curved and
narrowing vestibules that accelerate the air from stagnant
velocity to a peak of 10 m/s within the curved vestibule. The
influence on a 3 mm particle is profound displaying complete
inertial impaction at the nostril bend, thus offering a good
protection for the olfactory region and the lung.
The high velocity combined with the small airway
geometry in the rat model produces highly sensitive behavior
for incremental changes in particle size. When the particle
size reduces from 3 mm to 2 mm the deposition fraction
decreases from 100 to 40% and a further reduction to 1 mm
produces only 3% deposition. The implication is that experi-
mental rat studies become highly susceptible to variability in
the controlling the production of monodispersed particles for
exposure. In this study using the rat model RNC01, particles
spanning a few microns in size exhibit vastly different
deposition behavior. The micron particle size range sensitivity
will increase further in general if the peak velocity is greater,
and the airway geometry is smaller. Conversely the size range
will be greater when the peak velocity is smaller and the
airway geometry is generally larger, as found for the human
model NC04.
The deposition patterns for the rat RNC01 model
(Figure 9) showed significant differences to those in the
human model. The majority of high (3 mm) and medium
(2 mm) inertia particles deposited at the sharp bend of the
nasal vestibule, and only the finest 1 mm particles penetrated
and dispersed through the main nasal passages. This is
primarily due to the rapid acceleration of air as it enters the
nose which is then confronted with two curvatures in
the airway resembling an 180� bend and a 90� bend.
This anatomical feature creates a natural filtering function,
trapping inertial particles on the upper wall of the nostril
bend. This is exemplified by deposition of the 3 mm particles
occurring on the upper wall of the nostril bend, and the 2 mm
particles depositing across the narrow radial strip around the
nostril inlet. For 1 mm particles a more distributed pattern
occurs through the nasal cavity, although this also exhibits a
preference for the nostril inlet region. Schroeter et al.’s (2012)
simulations indicated particles do not achieve 100% depos-
ition fraction until particle sizes reach 5 mm, which is much
larger than the 3 mm found in this study. We believe this is due
to the larger Sprague-Dawley rat size used in Schroeter et al.
(2012), which had a weight 50% heavier than the rat used in
this study. A larger specimen would have wider nasal
passages, allowing slower velocity magnitude and lower
resistances.
The deposition penetration distribution in Figure 9(d)
shows three high concentration spots (‘‘A’’, ‘‘B’’ and ‘‘C’’)
which are all located at the vestibule region. The 3 mm
particles have direct impaction concentrated at upper region
of the first nostril bend (location ‘‘A’’) when inhaled into
nostrils with high-speed airflow. With lower inertia, 2 mm
particles penetrate slightly further and deposit on the lateral
wall (location ‘‘B’’) located between the first and second
nostril bends. Although 1 mm particles pass through the first
bend, the majority of them are captured at the second bend at
location ‘‘C’’. Apart from the vestibule, the olfactory region
also exhibits some significant deposition (location ‘‘D’’) but
this only occurs for 1 mm particles.
A comparison of the deposition fractions for the low,
medium and high inertial particles shows reasonably consist-
ent values between the rat and human models. The deposition
fraction is highly sensitivity to particle size for rats as there is
a jump from 3 to 100% for an increase from 1 to 3 mm
particles. In comparison, the same increase in deposition
fraction in the human model occurs from a particle size of
2.5 to 20 mm. The rat airway geometry is relatively symmetric
in this RNC01 model. The cross sectional contour in Figure 3
Figure 8. Regional particle deposition frac-tion comparison for the rat RNC01 modelusing semi-log axes.
DOI: 10.3109/08958378.2015.1088600 Micron-particle deposition in human/rat noses 9
Dow
nloa
ded
by [
RM
IT U
nive
rsity
] at
04:
02 1
0 O
ctob
er 2
015

shows �0.2 L/min air flow through each chamber, which
produced nearly equal amounts of particle deposition in both
chambers.
Extrapolation from rat to human
We calculate the deposition fraction in the seven anatomical/
epithelial tissue regions defined in Figure 2. The deposition
fraction is then normalized by the regional area fraction
(which is simply the regional area divided by the total surface
area). This creates a deposition flux value and can be written
as
f ¼ nregional=ntotal
Aregional=Atotal
Where nregional is the quantity of particles deposit in a
particular region and ntotal is the quantity of particles inhaled
into the nasal cavity. Aregional is the regional area and Atotal is
the total nasal surface area.
Table 3 summarizes the deposition flux for the human and
rat model to evaluate the possible deposition extrapolation for
low, medium and high inertial particles. In general, for all
particles, highest f value is found in the vestibule region.
While the upper passage typically exhibits the lowest
deposition flux. To enable direct deposition data extrapola-
tion, regional scaling factor is introduced as the variations
between the rat and human models are not linear for each
region. Scaling factors X are calculated based on the ratio of
the f of the human model to the rat model. The values show
Figure 9. Particle deposition patterns for the rat RNC01 model in the 3D domain (a and b), 2D planar domain (c) and deposition penetrationdistribution (d). Particle sizes are colored based on the low (1 mm, blue), medium (2 mm, green) and high inertial (3 mm, red) according to theirdeposition fractions reported. The x-coordinate in (d) is normalized by the maximum penetration depth from nostril to naso-pharynx.
Table 3. Comparison of particle deposition dose-metric (deposition per unit area) between rat and human.
Inertial Low Medium High
Region names f (rat) f (human) Scaling factor f (rat) f (human) Scaling factor (X) f (rat) f (human) Scaling factor (X)
Vestibule 0.42 0.12 0.29 6.8 0.46 0.068 17 2.1 0.12Upper passage 0.0035 0.0056 1.6 0.013 0.0024 0.18 0 0 N/AMiddle passage 0.012 0.039 3.3 0.016 0.9 56 0 0.32 N/ALower passage 0.009 0.01 1.1 0.0082 0.047 5.7 0 0.15 N/AOlfactory 0.0045 0.004 0.89 0.011 0.035 3.2 0 0.13 N/ASeptum 0.0082 0.017 2.1 0.012 0.98 82 0 2.4 N/APharynx 0.0073 0.053 7.3 0.015 0.26 17 0 0.25 N/A
Particle deposition flux f: Regional deposition fraction/regional area fraction.
10 Y. Shang et al. Inhalation Toxicology, Early Online: 1–12
Dow
nloa
ded
by [
RM
IT U
nive
rsity
] at
04:
02 1
0 O
ctob
er 2
015

that direct extrapolation is not applicable for high inertial
particles since no particles with size 3 mm or greater can
penetrate the rat vestibule. The maximum scaling factor
(X¼ 82) occurs in the septum region for medium inertial
particles. This is mainly attributes to the medium inertial
particles can travel deeper downstream in the human nasal
model, while majority of them are filtered by the vestibule
region for the rat model. Similarly, due to this efficient
filtration, the vestibule shows a minimum scaling factor
(X¼ 0.068) for medium inertial particles. For low inertial
particles, upper passage, lower passage and olfactory regions
exhibit the closest 1:1 matching for data extrapolation.
Conclusion
Results obtained from exposure studies using rat models are
typically extrapolated to human subjects. The objective of
this study was to gain further insight for extrapolating
inhalation exposure data between inter-subject species. The
anatomy, airflow, and particle deposition in a rat and human
nasal cavity was investigated using CFD. Anatomy com-
parisons showed that the cavity surface area of the human
model was about ten times the size of the rat. The largest
surface area coverage for the human was the middle and
lower passages which combined to make up 52.8% of the
total surface area, while for the rat model, the olfactory
region made up 55.6% of the total surface area. These
regions were also the preferential sites for deposition of
2.5 mm particles. The other major anatomical difference is
the shape of the nasal vestibule which plays a significant
role in producing the inhaled airflow streamlines. A sharp
U-turn (180�) bend is found in the rat model which
accelerates the inhaled air to a peak velocity of 10 m/s
despite an inhalation rate of 0.4 L/min. Comparatively the
human model exhibits a 90� bend at the nasal vestibule and
accelerates the flow to 2.5 m/s for an inhalation rate of
15 L/min. To account for these differences we used the total
deposition fraction to determine appropriate particle sizes
for low, medium, and high inertial properties. It was found
that the particle size range suitable to represent these three
inertial regimes was 2.5 to 20 mm for the human model and
1 to 3 mm for the rat model. This places stringent limitations
for particle size selections for rat inhalation exposure
studies. We introduced a deposition flux parameter which
compares the deposition fraction per regional area fraction
for the human and rat models. A direct comparison showed
that a scaling factor was needed in order to extrapolate the
deposition data from one species to another. Low inertial
particles show the closest scaling factor of 1:1 matching.
Although this study only investigated a single subject
specific model for rat and human species, the key anatom-
ical differences and deposition pattern is expected to be
reasonably common across different models.
Acknowledgements
The authors would like to thank Dr Rui Chen and Dr
Chunying Chen from the Chinese Academy of Science for
their fruitful discussions. Also, special thanks are given to Mr
Ke Sun for his kind assistance in the early model reconstruc-
tion stage.
Declaration of interest
The authors report no conflict of interest. The authors alone
are responsible for the content and writing of this article.
Jingliang Dong especially thanks for the financial support
received from the RMIT University in the scheme of Higher
Degree by Research Publications Grant.
This work was financially supported by the Australian
Research Council (ARC project ID DP120103958) and the
National Natural Science Foundation of China (NSFC
21277080).
References
Ahmed A, Prime D, Burnell PKP, Hogger P. (2012). Development of anin vitro model to assess deposition of aerosol particles in arepresentative replica of the rat’s respiratory tract. J Aerosol MedPulm Drug Deliv 25:169–78.
Asgharian B, Price OT, Oldham M, et al. (2014). Computationalmodeling of nanoscale and microscale particle deposition, retentionand dosimetry in the mouse respiratory tract. Inhal Toxicol 6:829–42.
Bai R, Zhang L, Liu Y, et al. (2010). Pulmonary responses to printertoner particles in mice after intratracheal instillation. Toxicol Lett199:288–300.
Cheng K, Cheng Y, Yeh H, et al. (1996). In vivo measurements of nasalairway dimensions and ultrafine aerosol deposition in the human nasaland oral airways. J Aerosol Sci 27:785–801.
Cheng Y, Hansen G, Su Y, et al. (1990). Deposition of ultrafine aerosolsin rat nasal molds. Toxicol Appl Pharmacol 106:222–33.
Corley RA, Kabilan S, Kuprat AP, et al. (2012). Comparativecomputational modeling of airflows and vapor dosimetry in therespiratory tracts of rat, monkey, and human. Toxicol Sci 128:500–16.
Dai YT, Chang CP, Tu LJ, Hsu DJ. (2007). Development of a Taiwanesehead model for studying occupational particle exposure. Inhal Toxicol19:383–92.
Dastan A, Abouali O, Ahmadi G. (2014). CFD simulation of total andregional fiber deposition in human nasal cavities. J Aerosol Sci 69:132–49.
Doorly DJ, Taylor DJ, Schroter RC. (2008). Mechanics of airflow in thehuman nasal airways. Respir Physiol Neurobiol 163:100–10.
Garcia GJM, Kimbell JS. (2009). Deposition of inhaled nanoparticles inthe rat nasal passages: dose to the olfactory region. Inhal Toxicol 21:1165–75.
Garcia GJM, Tewksbury EW, Wong BA, Kimbell JS. (2009).Interindividual variability in nasal filtration as a function of nasalcavity geometry. J Aerosol Med Pulm Drug Deliv 22:139–55.
Ge Q, Li X, Inthavong K, Tu J. (2013). Numerical study of the effects ofhuman body heat on particle transport and inhalation in indoorenvironment. Building Environ 59:1–9.
Gerde P, Cheng Y, Medinsky M. (1991). In vivo deposition of ultrafineaerosols in the nasal airway of the rat. Fundam Appl Toxicol 16:330–6.
Ghahramani E, Abouali O, Emdad H, Ahmadi G. (2014). Numericalanalysis of stochastic dispersion of micro-particles in turbulent flowsin a realistic model of human nasal/upper airway. J Aerosol Sci 67:188–206.
Ghalati P, Keshavarzian E, Abouali O, et al. (2012). Numerical analysisof micro- and nano-particle deposition in a realistic human upperairway. Comput Biol Med 42:39–49.
Golshahi L, Noga ML, Thompson RB, Finlay WH. (2011). In vitrodeposition measurement of inhaled micrometer-sized particles inextrathoracic airways of children and adolescents during nosebreathing. J Aerosol Sci 42:474–88.
Gross EA, Swenberg JA, Fields S, Popp JA. (1982). Comparativemorphometry of the nasal cavity in rats and mice. J Anatomy 135:83–8.
Hsu DJ, Chuang MH. (2012). In-vivo measurements of micrometer-sizedparticle deposition in the nasal cavities of Taiwanese adults. AerosolSci Technol 46:631–8.
Inthavong K, Ge QJ, Li A, Tu JY. (2013). Source and trajectories ofinhaled particles from a surrounding environment and its deposition inthe respiratory airway. Inhal Toxicol 25:280–91.
DOI: 10.3109/08958378.2015.1088600 Micron-particle deposition in human/rat noses 11
Dow
nloa
ded
by [
RM
IT U
nive
rsity
] at
04:
02 1
0 O
ctob
er 2
015

Inthavong K, Ge QJ, Li XD, Tu JY. (2012). Detailed predictions ofparticle aspiration affected by respiratory inhalation and airflow.Atmospheric Environ 62:107–17.
Inthavong K, Shang YD, Tu JY. (2014). Surface mapping for visualiza-tion of wall stresses during inhalation in a human nasal cavity. RespirPhysiol Neurobiol 190:54–61.
Inthavong K, Tian ZF, Li HF, et al. (2006). A numerical study of sprayparticle deposition in a human nasal cavity. Aerosol Sci Technol 40:1034–45.
Inthavong K, Tu JY, Ahmadi G. (2009). Computational modelling ofgas-particle flows with different particle morphology in the humannasal cavity. J Computat Multiphase Flows 1:57–82.
Inthavong K, Tu JY, Heschl C. (2011). Micron particle depositionin the nasal cavity using the v(2)-f model. Computers Fluids 51:184–8.
Inthavong K, Wen J, Tian ZF, Tu JY. (2008). Numerical study of fibredeposition in a human nasal cavity. J Aerosol Sci 39:253–65.
Jiang J, Zhao K. (2010). Airflow and nanoparticle deposition in rat noseunder various breathing and sniffing conditions: a computationalevaluation of the unsteady effect: computational of unsteady turbulent.J Aerosol Sci 41:1030–43.
Kelly J, Bobbitt C, Asgharian B. (2001a). In vivo measurement of fineand coarse aerosol deposition in the nasal airways of female Long-Evans rats. Toxicol Sci 64:253–8.
Kelly J, Kimbell J, Asgharian B. (2001b). Deposition of fine and coarseaerosols in a rat nasal mold. Inhal Toxicol 13:577–88.
Kelly JT, Asgharian B, Kimbell JS, Wong BA. (2004). Particledeposition in human nasal airway replicas manufactured by differentmethods. Part I: inertial regime particles. Aerosol Sci Technol 38:1063–71.
Kelly JT, Asgharian B, Wong BA. (2005). Inertial particle deposition ina monkey nasal mold compared with that in human nasal replicas.Inhal Toxicol 17:823–30.
Kelly JT, Tewksbury EW, Wong BA, Asgharian B. (2002). Nasal andlung deposition of fine and coarse particles in rats. Annals OccupatHygiene 46:346–9.
King SE, Inthavong CM, Tu KJ. (2010). Inhalability of micron particlesthrough the nose and mouth. Inhal Toxicol 22:287–300.
Oberdorster G, Sharp Z, Atudorei V, et al. (2004). Translocation ofinhaled ultrafine particles to the brain. Inhal Toxicol 16:437–45.
Oldham MJ. (2000). Computational fluid dynamic predictions andexperimental results for particle deposition in an airway model.Aerosol Sci Technol 32:61–71.
Schroeter J, Kimbell J, Asgharian B, et al. (2012a). Computational fluiddynamics simulations of submicrometer and micrometer particledeposition in the nasal passages of a Sprague-Dawley rat. J AerosolSci 43:31–44.
Schroeter JD, Campbell J, Kimbell JS, et al. (2014). Effects ofendogenous formaldehyde in nasal tissues on inhaled formaldehydedosimetry predictions in the rat, monkey, and human nasal passages.Toxicol Sci 138:412–24.
Schroeter JD, Garcia GJM, Kimbell JS. (2011). Effects of surfacesmoothness on inertial particle deposition in human nasal models.J Aerosol Sci 42:52–63.
Schroeter JD, Kimbell JS, Gross EA, et al. (2008). Application ofphysiological computational fluid dynamics models to predictinterspecies nasal dosimetry of inhaled acrolein. Inhal Toxicol 20:227–43.
Schroeter JD, Tewksbury EW, Wong BA, Kimbell JS. (2015).Experimental measurements and computational predictions of regio-nal particle deposition in a sectional nasal model. J Aerosol Med PulmDrug Deliv 28:20–9.
Si XHA, Xi JX, Kim J, et al. (2013). Modeling of release position andventilation effects on olfactory aerosol drug delivery. Respir PhysiolNeurobiol 186:22–32.
Storey-Bishoff J, Noga M, Finlay WH. (2008). Deposition of microm-eter-sized aerosol particles in infant nasal airway replicas. J AerosolSci 39:1055–65.
Wang SM, Inthavong K, Wen J, et al. (2009). Comparison of micron- andnanoparticle deposition patterns in a realistic human nasal cavity.Respir Physiol Neurobiol 166:142–51.
Wei ZH, Xu ZX, Li B, Xu FQ. (2013). Numerical simulation of airwaydimension effects on airflow patterns and odorant deposition patternsin the rat nasal cavity. PLoS One 8:e770570. doi:10.1371/journal.pone.0077570.
Wolff R, Kanapilly G, Gray R, Mcclellan R. (1984). Deposition andretention of inhaled aggregate 67Ga2O3 particles in beagle dogs,Fischer-344 rats, and CD-1 mice. Am Ind Hyg Assoc J 45:377–81.
Zhao K, Dalton P, Yang GC, Scherer PW. (2006). Numerical modelingof turbulent and laminar airflow and odorant transport during sniffingin the human and rat nose. Chem Senses 31:107–18.
12 Y. Shang et al. Inhalation Toxicology, Early Online: 1–12
Dow
nloa
ded
by [
RM
IT U
nive
rsity
] at
04:
02 1
0 O
ctob
er 2
015