comparative modeling and molecular dynamics studies on tar rna ...
66
COMPARATIVE MODELING AND MOLECULAR DYNAMICS STUDIES ON TAR RNA BINDING PROPERTIES OF HUMAN IMMUNODEFICIENCY VIRUS TAT PROTEIN A THESIS SUBMITTED IN PARTIAL FULFILLMENT OF THE REQUIREMENTS FOR THE DEGREE OF Master of Technology In Chemical Engineering (Biochemical Engineering & Biotechnology) By SRIPAD CHANDAN PATNAIK (ROLL NO. 20600001) Department of Chemical Engineering National Institute of Technology Rourkela-769008, Orissa, India 2008
Transcript of comparative modeling and molecular dynamics studies on tar rna ...
COMPARATIVE MODELING AND MOLECULAR DYNAMICS STUDIES ON TAR RNA
BINDING PROPERTIES OF HUMAN IMMUNODEFICIENCY VIRUS TAT PROTEIN
A THESIS SUBMITTED IN PARTIAL FULFILLMENT
OF THE REQUIREMENTS FOR THE DEGREE OF
Master of Technology
In
Chemical Engineering
(Biochemical Engineering & Biotechnology)
By
SRIPAD CHANDAN PATNAIK
(ROLL NO. 20600001)
Department of Chemical Engineering
National Institute of Technology
Rourkela-769008, Orissa, India
2008
COMPARATIVE MODELING AND MOLECULAR DYNAMICS STUDIES ON
TAR RNA BINDING PROPERTIES OF HUMAN IMMUNODEFICIENCY
VIRUS TAT PROTEIN
A THESIS SUBMITTED IN PARTIAL FULFILLMENT
OF THE REQUIREMENTS FOR THE DEGREE OF
Master of Technology
In
Chemical Engineering
(Biochemical Engineering & Biotechnology)
By
SRIPAD CHANDAN PATNAIK
(ROLL NO. 20600001)
Under the Guidance of
Prof. Gyana R. Satpathy
Department of Biotechnology and Medical Engineering
Department of Chemical Engineering
National Institute of Technology
Rourkela-769008, Orissa, India
2008

National Institute of Technology
Rourkela
CERTIFICATE
This is to certify that the thesis entitled, “Comparative modeling and molecular dynamics
studies on TAR RNA binding properties of human immunodeficiency virus Tat protein”
submitted by Sri Sripad Chandan Patnaik in partial fulfillment of the requirements for the award
of Master of Technology in Chemical Engineering with specialization in “Biochemical
Engineering & Biotechnology” at the National Institute of Technology, Rourkela (Deemed
University) is an authentic work carried out by him under my supervision and guidance.
To the best of my knowledge, the matter embodied in the thesis has not been submitted to any
other University / Institute for the award of any Degree or Diploma.
Date Prof. Gyana R. Satpathy
Department of Biotechnology & Medical Engineering,
National Institute of Technology,
Rourkela –769008.
i
ACKNOWLEDGEMENT
I express my gratitude and deep regards to my guide Prof. Gyana Ranjan Satpathy for his
valuable guidance, constant encouragement and kind co-operation throughout period of work
which has been instrumental in the success of the dissertation. Thank you for your patience and
understanding. I must also acknowledge our HOD, Dr. Kartik Chandra Biswal for giving this
excellent opportunity to complete it successfully. I express my most sincere heartfelt gratitude to
Dr. Subhankar Paul for his ready and able guidance for preparing the report.
Thanks to all my classmates for their love and support. I would like to thank my parents
for supporting me to do complete my masters degree in all ways.
Sripad Chandan Patnaik
20600001
M.Tech.
ii
----Contents----
S.No Topic Page No
Acknowledgement i
Contents ii-iii
Abstracts iv
List of figures v
List of Tables vi
1. Introduction 1
2. Literature Review 3
2.1. Human Immunodeficiency Virus (HIV) 3
2.1.1. Structure of the HIV 4
2.1.2. Genes 5
2.2. Genetic variability 7
2.3. Genomic diversity of clades 8
2.4. Drug and vaccine design 9
2.5. RNA structure and Binding affinity 12
2.6. TAR-Tat interaction 12
2.7. Molecular phylogenetics 15
2.8. Structural prediction 16
2.8.1 Homology modeling 16
2.9 Molecular dynamics simulation 18
2.9.1. Force field functions 20
2.9.2. Full Electrostatic Computation 22
2.9.3. Numerical Integration 22
3. Methods 24
3.1 Sequence and alignment 24
3.2 Homology modeling and structure analysis 26

iii
3.3 Molecular dynamics simulation 26
4. Result and disscussion 28
4.1. Sequence divergence 28
4.2. Structural variability 30
4.3. Dynamics of residue patches and active pockets 33
5. Conclusion 39
6. References 41
Appendix-1 Codes for structural modeling 50
Appendix-2 Codes for molecular dynamics simulation 51
iv
Abstract
Macromolecules undergo changes with time and condition thereby affecting the structural
and functional properties. These sequential and structural changes can be enumerated by
comparative methods using the sequences and structural models. Molecular dynamics
simulations are used to investigate dynamics and interactions of proteins in aqueous solution. We
have studied the sequential variations in HIV-1 Trans-activating regulatory protein (Tat) among
different strains and isolates taken from different geographical areas. Then these variations are
modeled in consensus structures, so that each of the disparity can be suitably studied. Molecular
dynamics simulation is carried out on each of these models to study the residual motions and
interaction fluctuations. The results are compared and the functional implications of each of
these transforms are studied. We have identified intra molecular interactions of importance for
structure stabilization. The results show the functional characteristics of the protein or part of it is
precisely reflected in its structural interactions and molecular dynamics flexibility.
Key words: Modeling, Molecular dynamics simulation, NAMD, Modeller, CHARMM, Tat,
TAR RNA, Hydrogen interaction, RMSD.

v
LIST OF FIGURES
Figure No. Title Page No.
1 Structure of Human Immunodefficiency Virus 4
2 Genetic organization of HIV 6
3 Phylogenetic Tree of the SIV and HIV viruses 11
4 Subtype diversity of HIV-1 infections prevalent worldwide 11
5 Outline of steps for homology modeling process 18
6 Molecular dynamics simulation algorithm 20
7 Internal coordinates for bonded interactions 21
8 Constructed phylogeny of the Tat data showing geographical
variation
28
9 The Tat consensus structures from 32 protein sequences modeled on
PDB: 1tbc.
30
10 A view of the first helix (residue ~16-20) of the consensus structures
and their hydrogen interactions with other neighboring residues
31
11 The view of second helix (residue ~ 26-30) of the consensus
structures and their hydrogen interactions with other neighboring
residues
32
12 Root mean square deviation (RMSD) of the models plotted as a
function of simulation time of 2 ns
34
13 Structural flexibility shown as RMSFs of all Cα atoms of the models
from the last 800 ps of unrestrained simulations
34
14 Variation in average fluctuation (RSMF) of Cα atoms of residues
constituting (a) helical domains (b) Arginine Rich Domain (ARD),
cystein residues and (c) all structural domains of Tat protein across
the models from the last 800 ps of unrestrained simulations.
36
15 Total energy (E) of the models plotted as a function of simulation
time indicated as number of time steps (TS)
37

vi
LIST OF TABLES
Tables No. Title Page No.
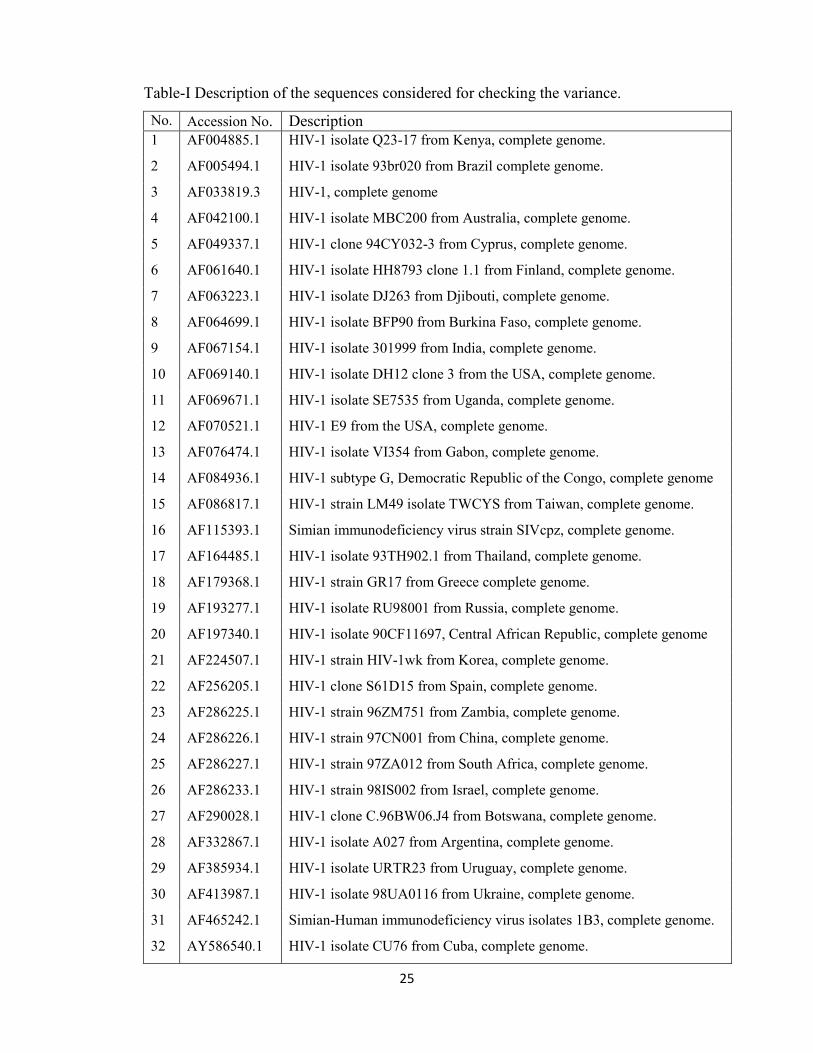
I Description of the sequences considered for checking the variance 25
II Conservancy of amino acid positions across the sequences. Partially
conserved groups are all the positively scoring groups that occur in
the Gonnet Pam250 matrix.
29
III Variation of amino acid positions across the modeled structures 30
IV Distance between the modeled sequences calculated by Protdist 30
V Hydrogen interactions formed in the RNA binding motif (48-59)
across the models.
33
VI Comparisons of residual variations (RMSFs) of Cα atoms of the
models at selected positions (Table-III) from the last 400 ps of
unrestrained simulations
35
1
Chapter 1
1. Introduction
Human immunodeficiency virus (HIV) is a retrovirus that causes acquired
immunodeficiency syndrome (AIDS). The life cycle of HIV inside the human host is
complex and precise consisting many macromolecular interactions and activations. Each
function is the window to next function performing role of molecular check point.
Inhibiting one step effects the next impeding the cycle of viral replication and
propagation [1]. One of such interaction between trans-activator of transcription (Tat) and
transactivation responsive (TAR) region is responsible for initiation of transcription of
viral RNA [2]. The interaction is vital for viral replication and propagation. The Tat
protein suitably attaches itself to the TAR RNA hairpin structure to initiate the process.
As the structural properties of the macromolecules involved guide the functional features
carrying out the interaction, the three dimensional structure of both Tat and TAR is
important for proper activation.
Macromolecules undergo changes with time and condition thereby affecting the
structural and functional properties. The changes are due to various environmental
conditions or process anomalies. These sequential and structural changes can be
enumerated by comparative methods using the sequences and structural models.
Molecular dynamics simulations are used to investigate dynamics and interactions of
proteins in aqueous solution. We have considered the both of the above circumstances.
First we have discussed the variability of the protein and incorporated these variabilities
while modeling consensus structures based on a common template. In the second part we
have done a dynamics study of these changes while keeping in mind the functional and
conformational role they carry out in normal biochemical circumstances. In this way we
have studied the importance of structural positions and their changes in a comparative
manner.
HIV shows a high rate of variation in its genome. The virus differs significantly
among its subgroups, generations, geographical area and with time. There is also a
definite change in carrying out the function of the virus with these alterations. This is one
of the major reasons for the failure of developing a drug against the HIV, as a drug
effective for one group may not act against the other. Finding a constant feature both in
macromolecular structure and life cycle of the virus is important for developing strategies
2
against the virus. The sequential and structural variations have to be studied for pointing
out these constant features.
We have studied the sequential variations in HIV-1 TAR RNA element and Tat
among different strains and isolates taken from different geographical areas. As the
sequences are taken from different geographical areas they show variations in sequence
and structure. Then these variations are modeled in consensus structures, so that each of
the disparity can be suitably studied. Though the models are similar they differ in
residues at important positions. Structures are compared at each segment and the
structural aspect of each residual change is observed. Molecular dynamics simulation is
carried out on each of these protein models to study the residual motions and interaction
fluctuations with time. The results are compared and the functional implications of each
of these transforms are studied. We have identified importance of intra molecular
interactions for structure stabilization. The results show the functional characteristics of
the protein or part of it are precisely reflected in its structural interactions and molecular
dynamics flexibility.

3
Chapter 2
2. Literature review
2.1. Human immunodeficiency virus (HIV)
The first case of AIDS was first detected on June 5, 1981, when the U.S. Centers for
Disease Control and Prevention reported a cluster of Pneumocystis pneumonia caused by
a form of Pneumocystis carinii, now recognized as a distinct species Pneumocystis
jirovecii, in five homosexual men in Los Angeles [3]. In 1982, the CDC introduced the
term AIDS to describe the newly recognized syndrome.
In 1983, scientists led by Luc Montagnier at the Pasteur Institute in France first
iosolated the virus that causes AIDS. They called it lymphadenopathy-associated virus
(LAV) [4]. A year later a team led by Robert Gallo of the United States confirmed the
discovery of the virus, but they renamed it human T lymphotropic virus type III (HTLV-
III) [5]. In 1986 the virus was named human immunodeficiency virus (HIV) [6]. Infection
with HIV occurs by the transfer of blood, semen, vaginal fluid, pre-ejaculate, or breast
milk. Within these bodily fluids, HIV is present as both free virus particles and virus
within infected immune cells. The three major routes of transmission are unprotected
sexual intercourse, contaminated needles, and transmission from an infected mother to
her baby at birth, or through breast milk [7].
HIV was classified as a member of the genus Lentivirus, part of the family of
Retroviridae [8]. Lentiviruses have many common morphologies and biological
properties. Many species are infected by lentiviruses, which are characteristically
responsible for long-duration illnesses with a long incubation period. Lentiviruses are
transmitted as single-stranded, positive-sense, enveloped RNA viruses. Upon entry of the
target cell, the viral RNA genome is converted to double-stranded DNA by a virally
encoded reverse transcriptase that is present in the virus particle. This viral DNA is then
integrated into the cellular DNA by a virally encoded integrase so that the genome can be
transcribed. Once the virus has infected the cell, two pathways are possible: either the
virus becomes latent and the infected cell continues to function, or the virus becomes
active and replicates, and a large number of virus particles are liberated that can then
infect other cells [9].
HIV primarily infects vital cells in the human immune system such as helper T
cells (specifically CD4+ T cells), macrophages and dendritic cells. HIV infection leads to
4
low levels of CD4+ T cells through three main mechanisms: firstly, direct viral killing of
infected cells; secondly, increased rates of apoptosis in infected cells; and thirdly, killing
of infected CD4+ T cells by CD8 cytotoxic lymphocytes that recognize infected cells.
When CD4+ T cell numbers decline below a critical level, cell-mediated immunity is lost,
and the body becomes progressively more susceptible to opportunistic infections. If
untreated, eventually most HIV-infected individuals develop AIDS and die [10, 1, 7]. But
the prognosis may be varied with viral starins.
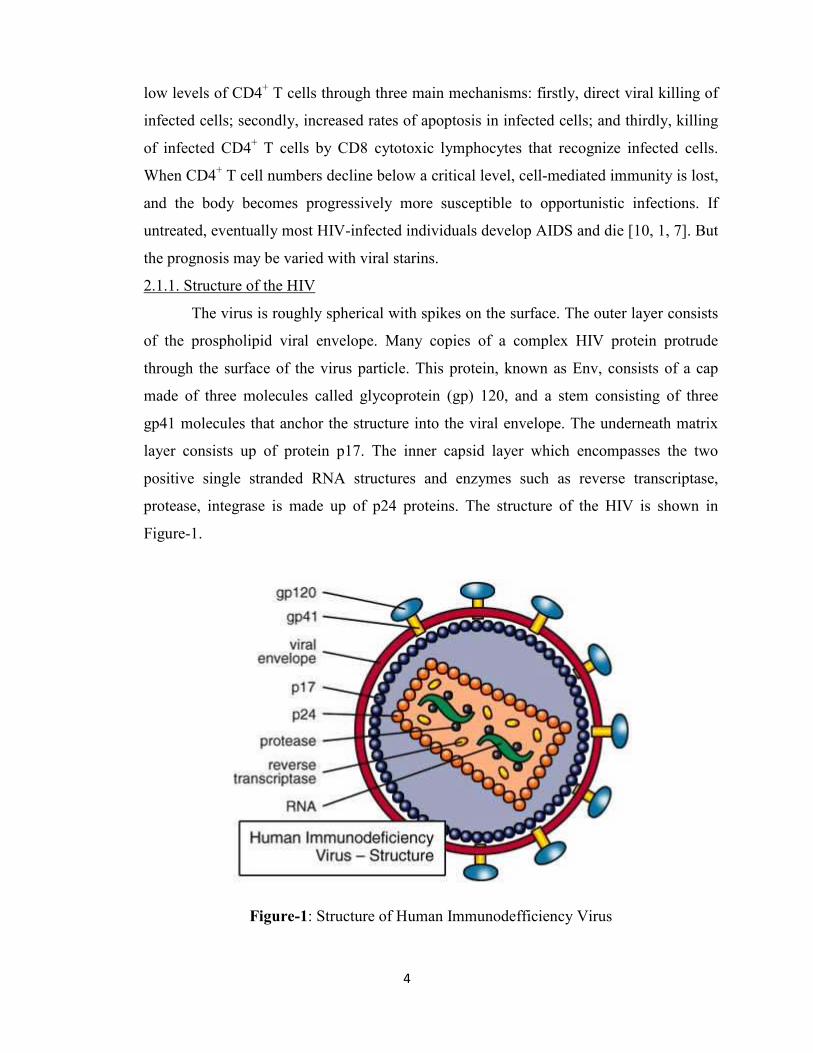
2.1.1. Structure of the HIV
The virus is roughly spherical with spikes on the surface. The outer layer consists
of the prospholipid viral envelope. Many copies of a complex HIV protein protrude
through the surface of the virus particle. This protein, known as Env, consists of a cap
made of three molecules called glycoprotein (gp) 120, and a stem consisting of three
gp41 molecules that anchor the structure into the viral envelope. The underneath matrix
layer consists up of protein p17. The inner capsid layer which encompasses the two
positive single stranded RNA structures and enzymes such as reverse transcriptase,
protease, integrase is made up of p24 proteins. The structure of the HIV is shown in
Figure-1.
Figure-1: Structure of Human Immunodefficiency Virus
5
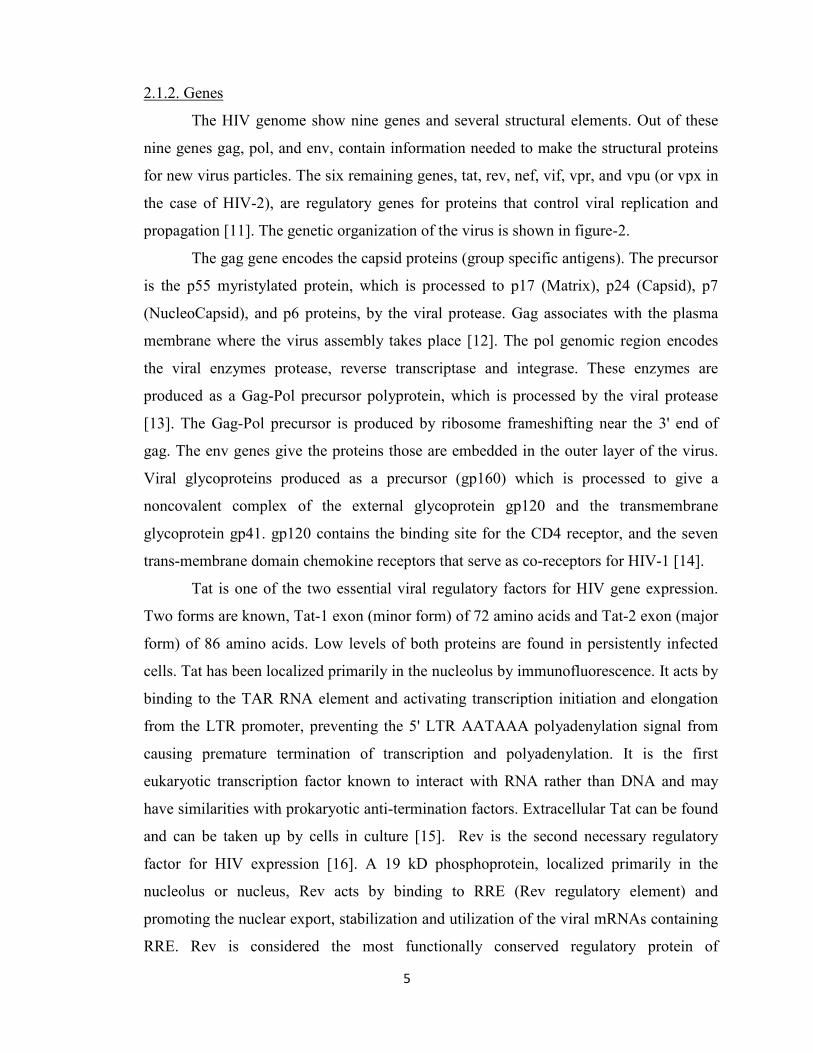
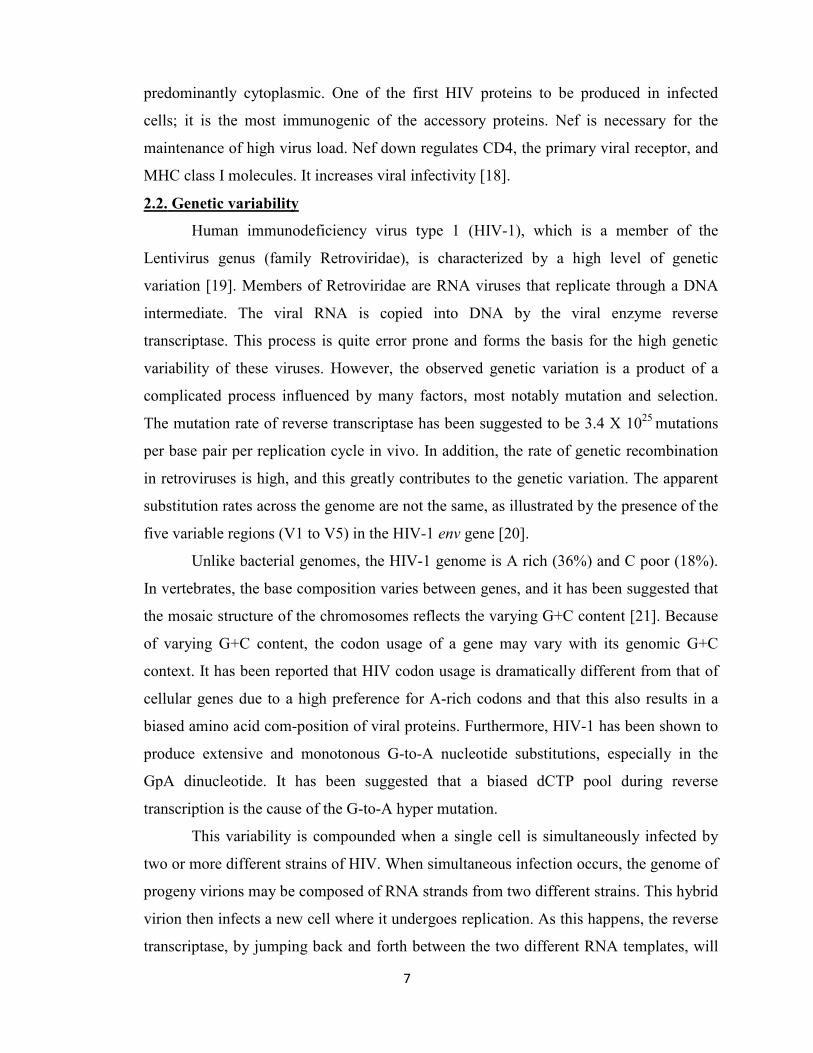
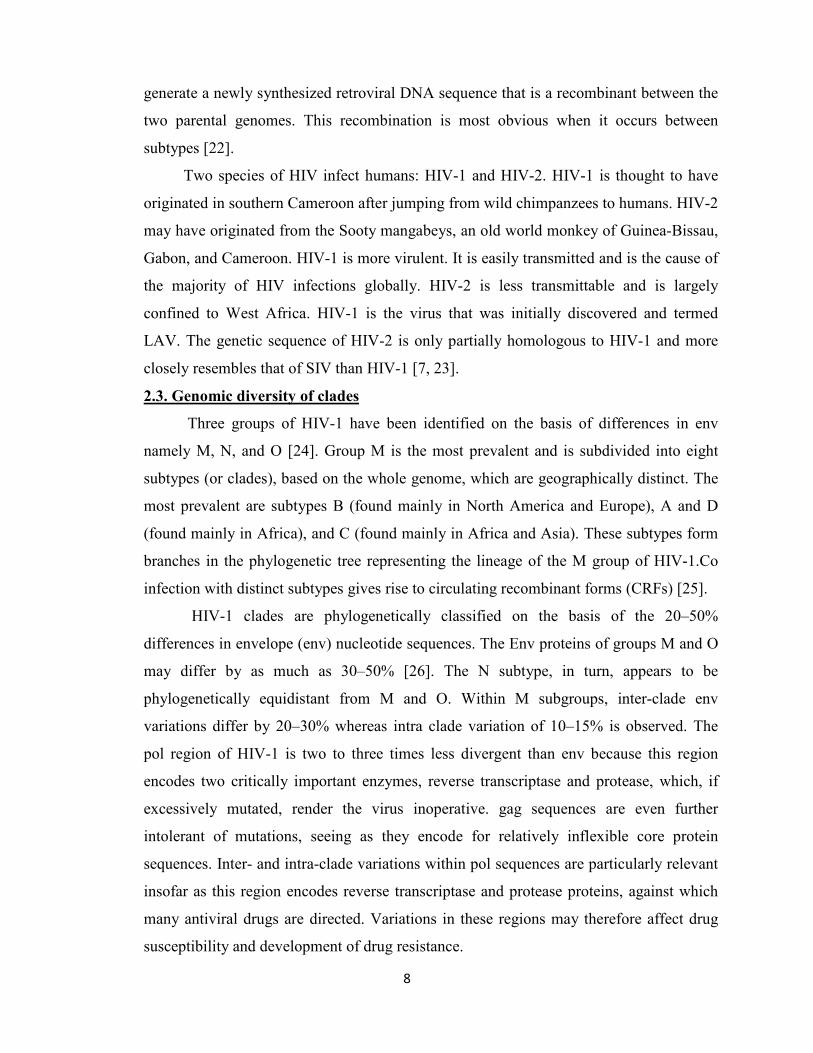
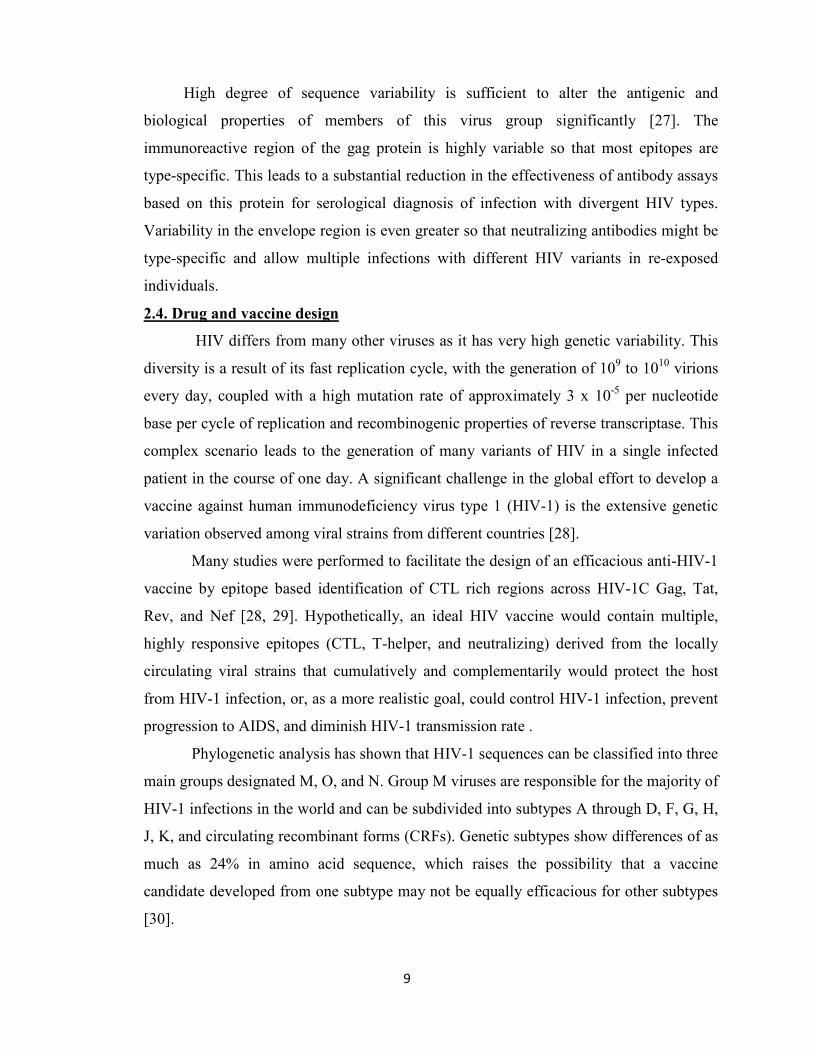
2.1.2. Genes
The HIV genome show nine genes and several structural elements. Out of these
nine genes gag, pol, and env, contain information needed to make the structural proteins
for new virus particles. The six remaining genes, tat, rev, nef, vif, vpr, and vpu (or vpx in
the case of HIV-2), are regulatory genes for proteins that control viral replication and
propagation [11]. The genetic organization of the virus is shown in figure-2.
The gag gene encodes the capsid proteins (group specific antigens). The precursor
is the p55 myristylated protein, which is processed to p17 (Matrix), p24 (Capsid), p7
(NucleoCapsid), and p6 proteins, by the viral protease. Gag associates with the plasma
membrane where the virus assembly takes place [12]. The pol genomic region encodes
the viral enzymes protease, reverse transcriptase and integrase. These enzymes are
produced as a Gag-Pol precursor polyprotein, which is processed by the viral protease
[13]. The Gag-Pol precursor is produced by ribosome frameshifting near the 3' end of
gag. The env genes give the proteins those are embedded in the outer layer of the virus.
Viral glycoproteins produced as a precursor (gp160) which is processed to give a
noncovalent complex of the external glycoprotein gp120 and the transmembrane
glycoprotein gp41. gp120 contains the binding site for the CD4 receptor, and the seven
trans-membrane domain chemokine receptors that serve as co-receptors for HIV-1 [14].
Tat is one of the two essential viral regulatory factors for HIV gene expression.
Two forms are known, Tat-1 exon (minor form) of 72 amino acids and Tat-2 exon (major
form) of 86 amino acids. Low levels of both proteins are found in persistently infected
cells. Tat has been localized primarily in the nucleolus by immunofluorescence. It acts by
binding to the TAR RNA element and activating transcription initiation and elongation
from the LTR promoter, preventing the 5' LTR AATAAA polyadenylation signal from
causing premature termination of transcription and polyadenylation. It is the first
eukaryotic transcription factor known to interact with RNA rather than DNA and may
have similarities with prokaryotic anti-termination factors. Extracellular Tat can be found
and can be taken up by cells in culture [15]. Rev is the second necessary regulatory
factor for HIV expression [16]. A 19 kD phosphoprotein, localized primarily in the
nucleolus or nucleus, Rev acts by binding to RRE (Rev regulatory element) and
promoting the nuclear export, stabilization and utilization of the viral mRNAs containing
RRE. Rev is considered the most functionally conserved regulatory protein of

6
lentiviruses. Rev cycles rapidly between the nucleus and the cytoplasm. Viral infectivity
factor (vif) is a basic protein of typically 23 kD. It promotes the infectivity but not the
production of viral particles. In the absence of Vif the produced viral particles are
defective, while the cell-to-cell transmission of virus is not affected significantly. Found
in almost all lentiviruses, Vif is a cytoplasmic protein, existing in both a soluble cytosolic
form and a membrane-associated form. The latter form of Vif is a peripheral membrane
protein that is tightly associated with the cytoplasmic side of cellular membranes [17].
Figure-2: Genetic organization of HIV
Vpr (viral protein R) is a 96-amino acid (14 kD) protein, which is incorporated
into the virion. It interacts with the p6 Gag part of the Pr55 Gag precursor. Vpr detected
in the cell is localized to the nucleus. Proposed functions for Vpr include the targeting the
nuclear import of preintegration complexes, cell growth arrest, transactivation of cellular
genes, and induction of cellular differentiation. In HIV-2 and SIV the Vpx gene is
apparently the result of a Vpr gene duplication. Vpu (viral protein U) is unique to HIV-1,
SIVcpz. There is no similar gene in HIV-2. Vpu is a 16-kd (81-amino acid) type I integral
membrane protein with at least two different biological functions: (a) degradation of CD4
in the endoplasmic reticulum, and (b) enhancement of virion release from the plasma
membrane of HIV-1-infected cells [11]. Nef is a multifunctional 27-kd myristylated
protein produced by an ORF located at the 3' end of the primate lentiviruses. Nef is
7
predominantly cytoplasmic. One of the first HIV proteins to be produced in infected
cells; it is the most immunogenic of the accessory proteins. Nef is necessary for the
maintenance of high virus load. Nef down regulates CD4, the primary viral receptor, and
MHC class I molecules. It increases viral infectivity [18].
2.2. Genetic variability
Human immunodeficiency virus type 1 (HIV-1), which is a member of the
Lentivirus genus (family Retroviridae), is characterized by a high level of genetic
variation [19]. Members of Retroviridae are RNA viruses that replicate through a DNA
intermediate. The viral RNA is copied into DNA by the viral enzyme reverse
transcriptase. This process is quite error prone and forms the basis for the high genetic
variability of these viruses. However, the observed genetic variation is a product of a
complicated process influenced by many factors, most notably mutation and selection.
The mutation rate of reverse transcriptase has been suggested to be 3.4 X 1025 mutations
per base pair per replication cycle in vivo. In addition, the rate of genetic recombination
in retroviruses is high, and this greatly contributes to the genetic variation. The apparent
substitution rates across the genome are not the same, as illustrated by the presence of the
five variable regions (V1 to V5) in the HIV-1 env gene [20].
Unlike bacterial genomes, the HIV-1 genome is A rich (36%) and C poor (18%).
In vertebrates, the base composition varies between genes, and it has been suggested that
the mosaic structure of the chromosomes reflects the varying G+C content [21]. Because
of varying G+C content, the codon usage of a gene may vary with its genomic G+C
context. It has been reported that HIV codon usage is dramatically different from that of
cellular genes due to a high preference for A-rich codons and that this also results in a
biased amino acid com-position of viral proteins. Furthermore, HIV-1 has been shown to
produce extensive and monotonous G-to-A nucleotide substitutions, especially in the
GpA dinucleotide. It has been suggested that a biased dCTP pool during reverse
transcription is the cause of the G-to-A hyper mutation.
This variability is compounded when a single cell is simultaneously infected by
two or more different strains of HIV. When simultaneous infection occurs, the genome of
progeny virions may be composed of RNA strands from two different strains. This hybrid
virion then infects a new cell where it undergoes replication. As this happens, the reverse
transcriptase, by jumping back and forth between the two different RNA templates, will
8
generate a newly synthesized retroviral DNA sequence that is a recombinant between the
two parental genomes. This recombination is most obvious when it occurs between
subtypes [22].
Two species of HIV infect humans: HIV-1 and HIV-2. HIV-1 is thought to have
originated in southern Cameroon after jumping from wild chimpanzees to humans. HIV-2
may have originated from the Sooty mangabeys, an old world monkey of Guinea-Bissau,
Gabon, and Cameroon. HIV-1 is more virulent. It is easily transmitted and is the cause of
the majority of HIV infections globally. HIV-2 is less transmittable and is largely
confined to West Africa. HIV-1 is the virus that was initially discovered and termed
LAV. The genetic sequence of HIV-2 is only partially homologous to HIV-1 and more
closely resembles that of SIV than HIV-1 [7, 23].
2.3. Genomic diversity of clades
Three groups of HIV-1 have been identified on the basis of differences in env
namely M, N, and O [24]. Group M is the most prevalent and is subdivided into eight
subtypes (or clades), based on the whole genome, which are geographically distinct. The
most prevalent are subtypes B (found mainly in North America and Europe), A and D
(found mainly in Africa), and C (found mainly in Africa and Asia). These subtypes form
branches in the phylogenetic tree representing the lineage of the M group of HIV-1.Co
infection with distinct subtypes gives rise to circulating recombinant forms (CRFs) [25].
HIV-1 clades are phylogenetically classified on the basis of the 20–50%
differences in envelope (env) nucleotide sequences. The Env proteins of groups M and O
may differ by as much as 30–50% [26]. The N subtype, in turn, appears to be
phylogenetically equidistant from M and O. Within M subgroups, inter-clade env
variations differ by 20–30% whereas intra clade variation of 10–15% is observed. The
pol region of HIV-1 is two to three times less divergent than env because this region
encodes two critically important enzymes, reverse transcriptase and protease, which, if
excessively mutated, render the virus inoperative. gag sequences are even further
intolerant of mutations, seeing as they encode for relatively inflexible core protein
sequences. Inter- and intra-clade variations within pol sequences are particularly relevant
insofar as this region encodes reverse transcriptase and protease proteins, against which
many antiviral drugs are directed. Variations in these regions may therefore affect drug
susceptibility and development of drug resistance.
9
High degree of sequence variability is sufficient to alter the antigenic and
biological properties of members of this virus group significantly [27]. The
immunoreactive region of the gag protein is highly variable so that most epitopes are
type-specific. This leads to a substantial reduction in the effectiveness of antibody assays
based on this protein for serological diagnosis of infection with divergent HIV types.
Variability in the envelope region is even greater so that neutralizing antibodies might be
type-specific and allow multiple infections with different HIV variants in re-exposed
individuals.
2.4. Drug and vaccine design
HIV differs from many other viruses as it has very high genetic variability. This
diversity is a result of its fast replication cycle, with the generation of 109 to 1010 virions
every day, coupled with a high mutation rate of approximately 3 x 10⁻⁵ per nucleotide
base per cycle of replication and recombinogenic properties of reverse transcriptase. This
complex scenario leads to the generation of many variants of HIV in a single infected
patient in the course of one day. A significant challenge in the global effort to develop a
vaccine against human immunodeficiency virus type 1 (HIV-1) is the extensive genetic
variation observed among viral strains from different countries [28].
Many studies were performed to facilitate the design of an efficacious anti-HIV-1
vaccine by epitope based identification of CTL rich regions across HIV-1C Gag, Tat,
Rev, and Nef [28, 29]. Hypothetically, an ideal HIV vaccine would contain multiple,
highly responsive epitopes (CTL, T-helper, and neutralizing) derived from the locally
circulating viral strains that cumulatively and complementarily would protect the host
from HIV-1 infection, or, as a more realistic goal, could control HIV-1 infection, prevent
progression to AIDS, and diminish HIV-1 transmission rate .
Phylogenetic analysis has shown that HIV-1 sequences can be classified into three
main groups designated M, O, and N. Group M viruses are responsible for the majority of
HIV-1 infections in the world and can be subdivided into subtypes A through D, F, G, H,
J, K, and circulating recombinant forms (CRFs). Genetic subtypes show differences of as
much as 24% in amino acid sequence, which raises the possibility that a vaccine
candidate developed from one subtype may not be equally efficacious for other subtypes
[30].
10
Elucidation of the phylogenetic origins of simian and human immunodeficiency
viruses (SIV and LIV) is fundamental to the understanding of HIV pathogenesis and the
spread of AIDS worldwide. Lentiviruses similar to human immunodeficiency viruses
(HIVs) have been identified in a wide range of African primates including mangabeys
(Cercocebus), guenons (Cercopithecus), mandrills (Papio) and chimpanzees (Pan) [31].
Although related to HIV in their physical structure, genetic composition and replicative
properties, these simian immunodeficiency viruses SIV differ from the human AIDS
viruses in one fundamental aspect of their biology: they fail to induce clinical
immunodeficiency in their natural hosts. Understanding the molecular biology of these
viruses, their lack of pathogenicity despite persistent replication and the processes
responsible for their adaptation to a natural host may thus be important for achieving a
better understanding of the virulence of HIV in man and the mechanisms underlying
AIDS pathogenesis [32, 33].
Comparative analysis of TAR RNA structures in human and simian
immunodeficiency viruses reveals the conservation of certain structural features despite
the divergence in sequence [34]. Both the TAR elements of HIV-1 and SIV-chimpanzee
can be folded into relatively simple one-stem hairpin structures. Chemical and RNAase
probes were used to analyze the more complex structure of HIV-2 TAR RNA, which
folds into a branched hairpin structure. A surprisingly similar RNA conformation can be
proposed for SIV-mandrill, despite considerable divergence in nucleotide sequence. A
third structural presentation of TAR sequences is seen for SIV-african green monkey.
These results are generally consistent with the classification of HIV-SIV viruses in four
subgroups based on sequence analyses (both nucleotide- and amino acid-sequences).
However, some conserved TAR structures were detected for members of different virus
subgroups. RNA structure analysis might provide an additional tool for determining
phylogenetic relationships among the HIV-SIV viruses.

11
Figure-3: Phylogenetic Tree of the SIV and HIV viruses.
Figure-4: Subtype diversity of HIV-1 infections prevalent worldwide [27].

12
2.5. RNA Structure and Binding affinity
The functional diversity of RNA reflects diversity in its three-dimensional
structure. Knowledge of the three-dimensional structures and general rules for RNA
folding will be invaluable for deducing more detailed mechanisms of all RNA functions
[35]. In the absence of high-resolution data, robust phylogenetic methods were developed
to obtain secondary structure, and ingenious biochemical experiments were used to define
nucleotide accessibility and to detect long range tertiary interactions [36]. RNA is
nowadays the only molecule with the two properties of being a depository of genomic
information with catalytic potential. Chemical catalysis requires a precise positioning of
atoms in space and, therefore, RNA must achieve complex tertiary folds in order to reach
transition states [37].
Binding of proteins and ligands to the RNA motif is purely based on the structure.
Binding affinity of the components which defines stability of the complex is dependent
on binding energy. This binding energy is a function of structure, charge and temperature
(entropy). RNA sequences contain signatures specific for three dimensional motifs which
participate in recognition and binding [38]. In regulatory pathways, RNA molecules exist
in equilibria between transient structures differentially stabilized by effectors such as
proteins or cofactors. Therefore, RNA molecules display their potential as drug targets on
different levels, namely in three-dimensional folds, in structural equilibria and in RNA-
protein interfaces [39].
The investigation of ligand-RNA interactions by computational approaches is
dependent on the availability of three-dimensional models of RNA targets based on X-
ray, NMR or phylogenetic data. Enormous progress in RNA synthesis and structure
determination methods have helped to overcome many of the difficulties in obtaining
NMR or crystal structures of RNA [40].
2.6. TAR-Tat interaction
The HIV trans-activating regulatory protein (Tat) protein carries out efficient
transcriptional activation of viral long terminal repeat-linked genes by binding an RNA
target structure termed TAR [1]. Tat-mediated trans-activation largely operates by
increasing elongation efficiency of nascent transcripts or coordinating initiation and
elongation from the HIV long terminal repeat (LTR). Presence of Tat protein is required
for the total transcription, in the absence of which the short transcripts predominates [2,
13
41]. Deletion analysis of the viral LTR showed that the genetic element responsible for
Tat activity, the trans-activation responsive region (TAR), is generally located
downstream of the initiation site for transcription nucleotides +1 and +59 [15]. It also
interacts with the Cyclin T1 (CycT1) subunit of the positive transcription elongation
factor complex, P-TEFb inducing co-operative binding of the P-TEFb complex onto
nascent HIV-1 TAR RNA [42].
The simplest explanation for the nature of Tat to activate transcription from viral
LTRs that carry TAR elements is that Tat binds directly to TAR RNA. After purification
of recombinant Tat it is demonstrated that it is able to specially recognize TAR RNA
[43]. Subsequently, it was noted that synthetic peptides carrying the basic domain of Tat
are also able to bind directly to TAR RNA [44].
Despite extensive efforts, the crystals of HIV-1 Tat have not been obtained [15].
The best information about the three-dimensional structure of Tat is based on nuclear
magnetic resonance (NMR) [45, 46]. The Tat sequence can be subdivided into several
distinct regions on the basis of its amino acid composition and the nature of its role in
basic function [47, 48]: a N-terminal activation region (NT, amino acids 1–19), a
cysteine-rich core domain (CRD, amino acids 20–31), a core region (amino acids 32–47),
a arginine rich RNA binding domain (ARD, amino acids 48-57), a glutamine-rich region
(QRD, amino acids 58–76) and the C-terminal (CT, amino acids 77-86).
The RNA binding property is clearly reflected in the structure of Tat protein. The
core, basic and glutamine rich region are all involved in RNA binding. The recent NMR
studies of HIV [47] and equine infectious anemia virus (EIAV) [49] Tat proteins show a
compact core structure and the close proximity between the N terminus and the basic
region. Addition of the core region of Tat to basic polypeptide mimics of Tat leads to
enhanced binding and a considerable improvement in the quality of the NMR spectra
[48]. This shows the binding affinity of Tat protein and in particular the basic region
towards the TAR RNA.
Binding is mediated by a ten amino acid basic domain that is rich in arginine and
lysines [50]. Circular dichroism and two-dimensional proton NMR studies of this hybrid
peptide indicate that the Tat basic domain forms a stable α-helix, whereas the adjacent
regulatory sequence is mostly in extended form. These findings suggest that the tendency
14
to form stable α-helices may be a common property of arginine and lysine rich RNA
binding domains [51].
Interactions and participating macromolecules undergo modification in relation to
time, condition and genomic strength of the organism [52]. Enumerating characteristics
and attributes to quantify these modifications is essential for quantifying these changes,
both structural and functional. Mathematical and computational tools can be useful for
analyzing these changes in interaction and its effect on viral lifecycle. Molecular
dynamics simulation is used in various studies to find out structural [54], binding [56, 99,
100] and functional properties of various systems like protein [54, 98], protein-ligand
complex [99, 56] and membrane molecules [96, 97]. Molecular dynamics is used in
defining the binding pathways of proteins with other macro molecules [101, 102].
Similarly several dynamics studies have been done taking Tat protein alone or complex
with TAR RNA element or other macromolecules [53, 54]. The studies show the
dynamics and intermolecular interaction among the different region of the protein [54].
These studies also demonstrate the relationship between the residual motion and
functional role of the residue. The molecular dynamics study also shows the flexibility of
both TAR RNA and basic arginine rich peptide while forming a complex [55, 56]. An
interdomain motion is observed in the simulation of free TAR, which is absent in the case
of bound TAR, leading to the conclusion that the free conformation of TAR is
intrinsically more flexible than the bound conformation. Free energy analysis, which
includes salvation contributions, was used to evaluate the influence of van der Waals and
electrostatic terms on formation of the complex and on the conformational rearrangement
from free to bound TAR [56]. Reyes et. al have investigated the differences in previously
studied structures and trajectories, particularly in the formation of the U-A-U base triple,
the dynamic flexibility of the Tat peptide, and the interactions at the binding interface.
They have also calculated the relative binding of different Tat peptide mutants to TAR
RNA and found qualitative agreement with experimental studies. The molecular
dynamics simulations show that the starting structures in which KkN binds to the major
groove of TAR (as it is the case for the Tat-TAR complex of HIV-1) are unstable [53].
Molecular dynamics simulation studies along with docking suggest that several attractive
interactions between the native Tat (1-9) and dipeptidyl peptidase IV lead to a stable
complex and that the reduced affinity of both L6-Tat (1-9) and I5-Tat (1-9) derivatives
15
might be caused by conformational alterations in comparison to the parent peptide [103].
In an attempt to shed light on the molecular basis of the functional differences found for
Tat mutants a series of molecular dynamics simulations have performed on modified Tat
proteins from HIV-1 strain Z2. Remarkable correlation is found between the degree of
structure conservation and the transactivation capabilities of Tat mutants [104]. The
studies illustrate the relation between structural dynamics of the protein and its residues
with its function and activation. The nature of the dynamics is varied according to the
residue position, sequence and structure.
2.7. Molecular Phylogenetics
Mutation takes place in genome of every organism. The single nucleotide shift is
due to the insertion or deletion of the nucleotides. These mutations are randomly caused
by error in the replication machinery and are essential for the natural selection process.
By comparing the sequence of the genome (DNA) or the functional elements (RNA,
protein) of different isolates or species conclusion about the evolutionary relationship,
functional and structural variations can be drawn [57].
Molecular phylogenetic analysis detects evolutionary relationships among
organisms. Phylogenetic trees can represent these relationships. A phylogenetic tree is a
graph consisting of nodes and branches where only one branch connects any two adjacent
nodes. The nodes represent the taxonomic unit. The algorithms use sequences of DNA,
RNA or protein to construct the trees. These sequences are first prepared, shorted and
aligned. The quality of these alignments affects the reliability of the tree.
The most commonly used methods to construct phylogenies include parsimony,
maximum likelihood, and MCMC-based Bayesian inference [58]. Distance-based
methods construct trees based on overall similarity which is often assumed to
approximate phylogenetic relationships. All methods depend upon a mathematical model
describing the evolution of characters observed in the species included. They are usually
used for molecular phylogeny where the characters are aligned nucleotide or amino acid
sequences. The use of phylogenetics in viral studies has increased dramatically in the last
years. When estimating phylogenetic relationships among DNA sequences, the use of a
model of nucleotide substitution is necessary. While maximum parsimony assumes a
model of evolution in an implicit manner taking the number of mutation required to
convert one sequence to another, distance methods and maximum likelihood explicitly

16
estimate parameters according to the model of evolution specified [59, 60]. Distance
methods estimate only the substitution rate, while maximum likelihood estimates all the
parameters of the model. Many viral evolutionary studies have focused on the HIV-1
virus. Likewise, many genes show a bias in transitions over transversions, again affecting
the rate of change from one nucleotide to another.
An important factor that affects the accuracy of tree reconstruction is whether the
data analyzed actually contain useful phylogenetic signal, a term that is used generally to
denote whether related organisms tend to resemble each other with respect to their
genetic material or phenotypic traits [61, 62].
2.8. Structural Prediction
The experimental methods used for determining structure, including NMR and
X-ray crystallography, are time consuming and can depend on initial secondary structure
models for developing constructs. The structure can also be predicted computationally by
inter relating various physical, chemical and mathematical rules, and considering various
factors. Mathematical models and algorithms are needed for incorporating those rules
into a physical structure. Parameters those define the structure have to be selected for
creating these rules [63]. The methods devised for predicting the structure are
comparative or homology modeling and ab initio method with computer algorithm.
Comparative protein modelling uses previously solved structures as starting points, or
templates. Ab initio- or de novo- protein modelling methods seek to build three-
dimensional protein models based on physical principles rather than on previously
solved structures. Structure is usually determined by the comparative analysis of multiple
homologous sequences. When homologous sequences are not available, free energy
minimization by dynamic programming can be used to predict the structure of a single
sequence [64]. Till now homology modeling gives more accurate protein structures than
any other method.
2.8.1. Homology modeling
Comparative or homology modeling uses experimentally determined protein
structures to predict the conformation of other proteins with similar amino acid
sequences. Small changes in the sequences is accordingly reflected in the structure. Till
now homology modeling remains most accurate method to predict the protein structure
[65]. Although several procedures exist in the public domain, the choice of the right

17
method is not unambiguous. Study shows that Modeller gave best results amongst the
chosen protocols [66]. Modeler produces protein homology models, given a template and
sequence alignment. The structures are predicted based on distance restraints obtained
from the template, from the database of crystal structures in the PDB, and from a
molecular force field. Ligand structures and constraints such as disulfide bonds and cis-
prolines can be incorporated into the model building step. Loops are generated de novo,
by a process that incorporates knowledge-based potentials from known crystal structures
[67]. Homology modeling consists of building a protein model using a structural
template, the template being a protein of known structure. The basic outline of the
procedure is shown in Figure 5. The sequences of the two proteins, the target (or
unknown) protein and the template, are first aligned. The Cα coordinates of the aligned
residues from the template are then copied over to the target to form the skeletal
backbone. The residue side chains, and relative insertions and deletions, are then modeled
using automated or semi-automated procedures. Finally, the protein model thusly
obtained may be subjected to energy minimization or molecular dynamics to relax
unfavorable contacts. The quality of the sequence alignment is critical in determining
model quality [68]. The quality of the homology model is dependent on the quality of the
sequence alignment and template structure. The approach can be complicated by the
presence of alignment gaps (commonly called indels) that indicate a structural region
present in the target but not in the template, and by structure gaps in the template that
arise from poor resolution in the experimental procedure (usually X-ray crystallography)
used to solve the structure. Model quality declines with decreasing sequence identity; a
typical model has ~2 Å agreement between the matched Cα atoms at 70% sequence
identity but only 4-5 Å agreement at 25% sequence identity. Regions of the model that
were constructed without a template, usually by loop modeling, are generally much less
accurate than the rest of the model, particularly if the loop is long. Errors in side chain
packing and position also increase with decreasing identity, and variations in these
packing configurations have been suggested as a major reason for poor model quality at
low identity [69].

18
Figure-5: Outline of steps for homology modeling process.
Molecular dynamics simulation
Molecular dynamics (MD) is a form of computer simulation in which atoms and
molecules are allowed to interact for a period of time under known laws of physics,
giving a view of the motion of the atoms. Molecular dynamics probes the relationship
between molecular structure, movement and function [70]. Molecular dynamics is a
specialized discipline of molecular modeling and computer simulation based on statistical
mechanics Computational methods have been used in biology for sequence analysis, all-
atom simulation, and more recently for modeling biological networks. Of these three
techniques, all-atom simulation is currently the most computationally demanding, in
terms of compute load, communication speed, and memory load [71]. The molecular
dynamics method was first introduced by Alder and Wainwright in the late 1950's [70] to
study the interactions of hard spheres. Many important insights concerning the behavior
of simple liquids emerged from their studies.
Molecular dynamics simulations generate information at the microscopic level,
including atomic positions and velocities. Statistical mechanics is required for the
conversion of this microscopic information to macroscopic observables such as pressure,
energy, heat capacities, etc. Statistical mechanics is fundamental to the study of
biological systems by molecular dynamics simulation. In a molecular dynamics
simulation, the macroscopic properties of a system is explored through microscopic
simulations, for example, to calculate changes in the binding free energy of a particular
ligand, or to examine the energetics and mechanisms of conformational change. The
19
connection between microscopic simulations and macroscopic properties is made via
statistical mechanics which provides the rigorous mathematical expressions that relate
macroscopic properties to the distribution and motion of the atoms and molecules of the
N-body system. Molecular dynamics simulations provide the means to solve the equation
of motion of the particles and evaluate these mathematical formulas. With molecular
dynamics simulations, one can study both thermodynamic properties and/or time
dependent (kinetic) phenomenon [72, 73, 74].
In molecular dynamic simulations the atoms of a system move according to the
Newtonian equations of motion
�� � ����
Where Fi is the force exerted on particle i, mi is the mass of particle i and ai is the
acceleration of particle i. The force can also be expressed as the gradient of the potential
energy,
�� ����
Combining these two equations yields
�� � ��
��������
����
���
Where Utotal is the potential energy of the system. Newton’s equation of motion
can then relate the derivative of the potential energy to the changes in position as a
function of time.
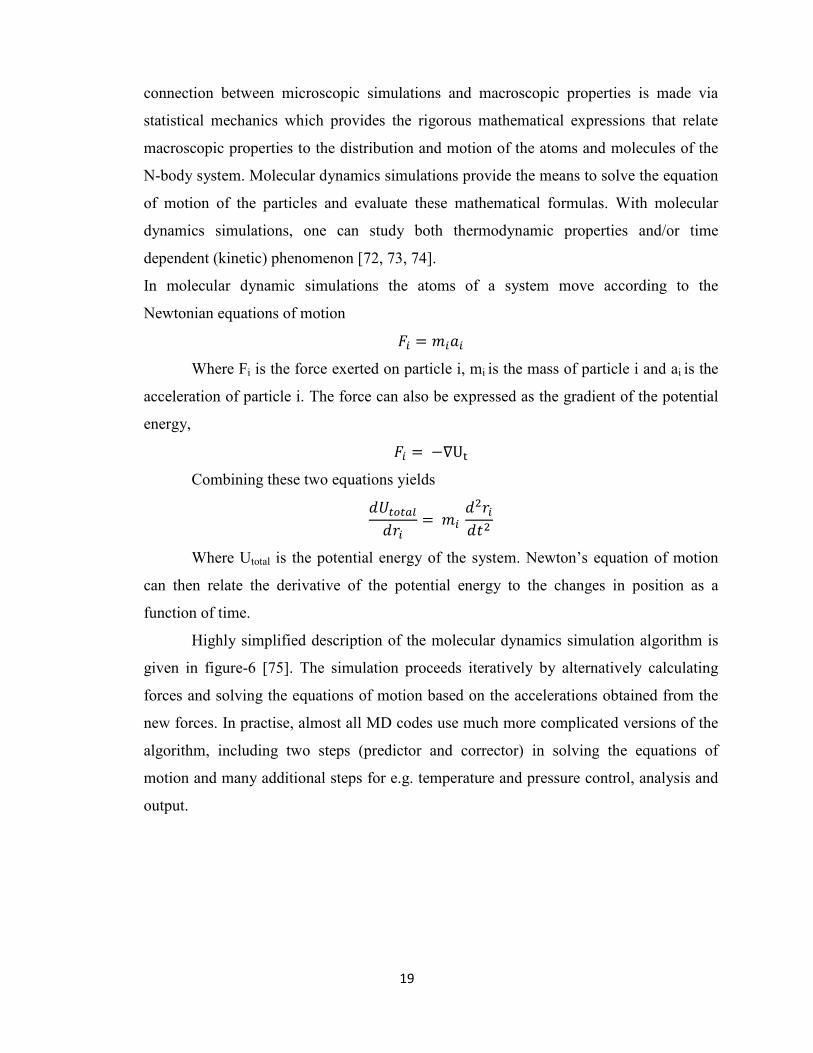
Highly simplified description of the molecular dynamics simulation algorithm is
given in figure-6 [75]. The simulation proceeds iteratively by alternatively calculating
forces and solving the equations of motion based on the accelerations obtained from the
new forces. In practise, almost all MD codes use much more complicated versions of the
algorithm, including two steps (predictor and corrector) in solving the equations of
motion and many additional steps for e.g. temperature and pressure control, analysis and
output.

20
Figure-6: Molecular dynamics simulation algorithm [75]
2.9.1. Force Field Functions
The potential energy, represented through the MD “force field,” is the most
crucial part of the simulation because it must faithfully represent the interaction between
atoms, yet be cast in the form of a simple mathematical function that can be calculated
quickly. For an all-atom MD simulation, one assumes that every atom experiences a force
specified by a model force field accounting for the interaction of that atom with the rest
of the system. Today, such force fields present a good compromise between accuracy and
computational efficiency. NAMD employs a common potential energy function that has
the following contributions [105]:
� � �� ������� ��������� ����������� ������ �������� �
Where bonds counts each covalent bond in the system, angles are the angles
between each pair of covalent bonds sharing a single atom at the vertex, and dihedral
describes atom pairs separated by exactly three covalent bonds with the central bond
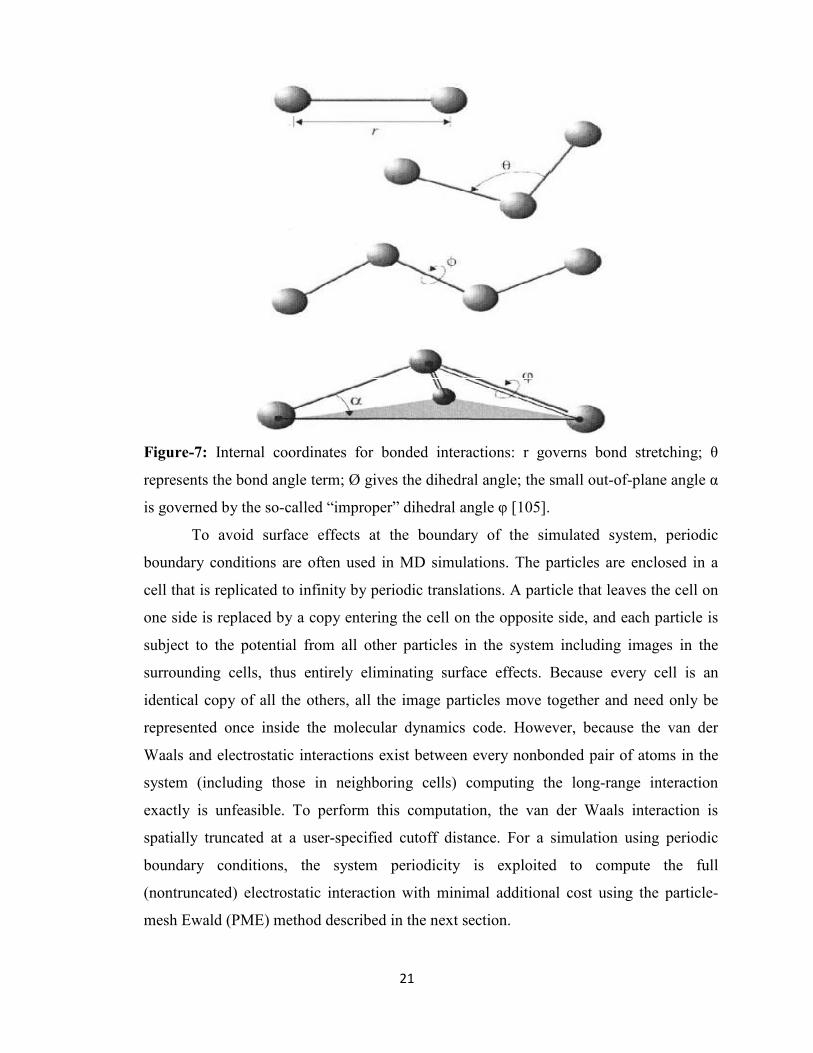
subject to the torsion angle Ø (Fig. 7). An “improper” dihedral term governing the
geometry of four planar, covalently bonded atoms is also included as depicted in Figure-
7. The final two terms in equation describe interactions between nonbonded atom pairs,
which correspond to the van der Waal’s forces (approximated by a Lennard–Jones
potential) and electrostatic interactions, respectively.
21
Figure-7: Internal coordinates for bonded interactions: r governs bond stretching; θ
represents the bond angle term; Ø gives the dihedral angle; the small out-of-plane angle α
is governed by the so-called “improper” dihedral angle φ [105].
To avoid surface effects at the boundary of the simulated system, periodic
boundary conditions are often used in MD simulations. The particles are enclosed in a
cell that is replicated to infinity by periodic translations. A particle that leaves the cell on
one side is replaced by a copy entering the cell on the opposite side, and each particle is
subject to the potential from all other particles in the system including images in the
surrounding cells, thus entirely eliminating surface effects. Because every cell is an
identical copy of all the others, all the image particles move together and need only be
represented once inside the molecular dynamics code. However, because the van der
Waals and electrostatic interactions exist between every nonbonded pair of atoms in the
system (including those in neighboring cells) computing the long-range interaction
exactly is unfeasible. To perform this computation, the van der Waals interaction is
spatially truncated at a user-specified cutoff distance. For a simulation using periodic
boundary conditions, the system periodicity is exploited to compute the full
(nontruncated) electrostatic interaction with minimal additional cost using the particle-
mesh Ewald (PME) method described in the next section.

22
2.9.2. Full Electrostatic Computation
Ewald summation is a description of the long-range electrostatic interactions for a
spatially limited system with periodic boundary conditions [106]. The infinite sum of
charge-charge interactions for a charge-neutral system is conditionally convergent,
meaning that the result of the summation depends on the order in which it is taken. Ewald
summation specifies the order as follows: sum over each box first, then sum over spheres
of boxes of increasingly larger radii. Ewald summation is considered more reliable than a
cutoff scheme, although it is noted that the artificial periodicity can lead to bias in free
energy, and can artificially stabilize a protein that should have unfolded quickly.
Dropping the prefactor 1/4πε, the Ewald sum involves the following terms:
EEwald = Edirect + Ereciprocal + Eself + Esurface
The particle–mesh Ewald (PME) method is a fast numerical method to compute
the Ewald sum [86]. The PME method does not conserve energy and momentum
simultaneously, but neither does the particle-particle/particle-mesh method or the
multilevel summation method. Momentum conservation can be enforced by subtracting
the net force from the reciprocal sum computation, albeit at the cost of a small long-time
energy drift.
2.9.3. Numerical Integration
Biomolecular simulations often require millions of time steps. Furthermore,
biological systems are chaotic; trajectories starting from slightly different initial
conditions diverge exponentially fast and after a few picoseconds are completely
uncorrelated. However, highly accurate trajectories are not normally a goal for
biomolecular simulations; more important is a proper sampling of phase space.
Therefore, for constant energy (NVE ensemble) simulations, the key features of an
integrator are not only how accurate it is locally, but also how efficient it is, and how well
it preserves the fundamental dynamical properties, such as energy, momentum, time-
reversibility.
Designing drugs or vaccine against Human immunodeficiency virus has been facing
failure due to the variability of the structural motifs against which the drugs are being
designed. Motif with constant structural features across strains, time and geographical
regions will be a very good target for which stable drugs or vaccines can be designed.
Phyllogenetic analysis will be helpful in finding such structures across diversities. In
23
comparison to structural genes and proteins like env and gag, regulatory protein (tat, rev)
and structural elements like TAR, RRE show more constancy in sequence and structure.
Targeting RNA has some advantages as compared with targeting proteins. More sites are
accessible at the RNA level; whereas the active site of a protein is often the only target.
Proteins that share a common substrate like ATP or ligands are difficult to inhibit
specifically. It is possible to develop multivalent drugs to target RNA or drugs that target
a RNA sequence that is essential for encoding an important sequence of a protein. RNA
elements TAR and RRE also have very conserve structural features which are effective
binding site for tat and rev protein respectively. The binding of these two proteins to their
respective elements is very crucial for replication and assembly of virus. Study of
structure and binding properties with molecular dynamics simulation methods will help
in designing strategies for inhibition of the virus spreading and migration.
24
Chapter 3
3. Methods
3.1. Sequence and alignment
The nucleotide and peptide sequences of the thirty two isolates described here
are available under EMBL accession numbers. The sequences of the Tat protein are
collected from Rfam database (http://www.sanger.ac.uk/cgi-bin/Rfam/) [76]. All
sequences are manually checked for anomalies using Bioedit program. Residues from
position 1 to 86 of the protein segment are only taken for alignment. Sequence variability
is considered while choosing the sequences. The sequences are selected from different
geographical regions and subgroups. A selective random approach was taken while
deciding a sequence from the database. The description of the sequences are given in
table-1.
The selected HIV and SIV tat sequences were aligned using ClustalW with
reference to Blossom-62 substitution matrix (http://www.ebi.ac.uk/clustalw) [77].
Distances between pairs of sequences were estimated using the Protdist program of the
Phylip package provided by Dr J. Felsenstein. Consensus sequence was generated from
the aligned sequences using cons program of Emboss package [78].
Residue wise comparison of the consensus sequence with the aligned sequences
was carried out by Bioedit. Assignment of residues at each position was determined by
comparing the residue frequency at the position in the aligned sequences and with that of
structures available at protein data bank. Three sequences were generated on the basis of
sequence based variation from the consensus sequence. The distance between the
sequences are compared with Protdist provided in the Phylip package with reference to
PAM matrix.
25
Table-I Description of the sequences considered for checking the variance.
No. Accession No. Description 1 AF004885.1 HIV-1 isolate Q23-17 from Kenya, complete genome.
2 AF005494.1 HIV-1 isolate 93br020 from Brazil complete genome.
3 AF033819.3 HIV-1, complete genome
4 AF042100.1 HIV-1 isolate MBC200 from Australia, complete genome.
5 AF049337.1 HIV-1 clone 94CY032-3 from Cyprus, complete genome.
6 AF061640.1 HIV-1 isolate HH8793 clone 1.1 from Finland, complete genome.
7 AF063223.1 HIV-1 isolate DJ263 from Djibouti, complete genome.
8 AF064699.1 HIV-1 isolate BFP90 from Burkina Faso, complete genome.
9 AF067154.1 HIV-1 isolate 301999 from India, complete genome.
10 AF069140.1 HIV-1 isolate DH12 clone 3 from the USA, complete genome.
11 AF069671.1 HIV-1 isolate SE7535 from Uganda, complete genome.
12 AF070521.1 HIV-1 E9 from the USA, complete genome.
13 AF076474.1 HIV-1 isolate VI354 from Gabon, complete genome.
14 AF084936.1 HIV-1 subtype G, Democratic Republic of the Congo, complete genome
15 AF086817.1 HIV-1 strain LM49 isolate TWCYS from Taiwan, complete genome.
16 AF115393.1 Simian immunodeficiency virus strain SIVcpz, complete genome.
17 AF164485.1 HIV-1 isolate 93TH902.1 from Thailand, complete genome.
18 AF179368.1 HIV-1 strain GR17 from Greece complete genome.
19 AF193277.1 HIV-1 isolate RU98001 from Russia, complete genome.
20 AF197340.1 HIV-1 isolate 90CF11697, Central African Republic, complete genome
21 AF224507.1 HIV-1 strain HIV-1wk from Korea, complete genome.
22 AF256205.1 HIV-1 clone S61D15 from Spain, complete genome.
23 AF286225.1 HIV-1 strain 96ZM751 from Zambia, complete genome.
24 AF286226.1 HIV-1 strain 97CN001 from China, complete genome.
25 AF286227.1 HIV-1 strain 97ZA012 from South Africa, complete genome.
26 AF286233.1 HIV-1 strain 98IS002 from Israel, complete genome.
27 AF290028.1 HIV-1 clone C.96BW06.J4 from Botswana, complete genome.
28 AF332867.1 HIV-1 isolate A027 from Argentina, complete genome.
29 AF385934.1 HIV-1 isolate URTR23 from Uruguay, complete genome.
30 AF413987.1 HIV-1 isolate 98UA0116 from Ukraine, complete genome.
31 AF465242.1 Simian-Human immunodeficiency virus isolates 1B3, complete genome.
32 AY586540.1 HIV-1 isolate CU76 from Cuba, complete genome.

26
3.2. Homology modeling and structure analysis
The protein structure databases were searched for the protein consensus sequence
using BLAST and PSI-BLAST. Initial sequential similarity of each modified consensus
sequence with sequence of the structures was carried out by ClustalX. Residue-by-residue
geometry and overall structure geometry was analyzed for checking stereo chemical
quality of downloaded protein data bank structures by Procheck [79]. Protein template for
homology modeling was selected considering the overall structural quality and sequential
and structural similarity with the consensus sequences. Blast [80] search among the
proteins of known 3D structure revealed that the three structures from protein data base
1tac, 1tbc and 1tiv showed the considerable sequence identity score with our sequences.
Out of these structures 1tac misses crucial cystein residues and 1tiv scores very less in
stereo chemical quality. Hence, in this study NMR structure of Tat (PDB code: 1tbc) [47]
was selected as a template and based on this structure the 3D consensus structures were
predicted.
The alignment of the sequences with the template structure was done using Bodil
[81]. The structures were generated from the sequence alignment and the structural
template using the Modeler program (http://salilab.org/modeller) [82]. The computed
structure of the Tat obtained was refined by energy minimization with NAMD 2.5
(http://www.ks.uiuc.edu/Research/namd) [83] for 10 ps with restraint on the backbone of
the protein taking CHARMM force field until the energy showed stability in sequential
repetition.
The conformational stability of the so predicted theoretical model was evaluated
sterically with Procheck [79]. The modeled structures are visualized and structurally by
Chimera [84]. The hydrogen interactions are predicted with constraint 0.4A and angle 20
degree.
3.3. Molecular dynamics simulation
Molecular dynamics simulations of the modeled proteins are were performed
using NAMD 2.5. The protein was immersed in a rectangular box of TIP3P waters [85]
providing a 5 Å buffer from the protein to the periodic boundary in each direction. The
bonded interactions were calculated at every time-step, the short-range nonbonded
interactions at every two time-steps, and the long-range electrostatics interactions at
every four time-steps. The pair-list of the non-bonded interaction was recalculated every
27
20 time-steps with a pair-list distance of 13.5 Å. The short-range non-bonded interactions
were defined as Van der Waals and electrostatics interactions between particles within 12
Å. A smoothing function was employed for the Van der Waals interactions at a distance
of 10Å. The long range electrostatic forces were calculated with the particle-mesh Ewald
[86]. CHARMM27 [87] force-field parameters were used in all simulations in this study.
Periodic boundary conditions and water wrapping were activated in the simulations. The
SHAKE routine with a tolerance of 10-8 Å was used in all simulations. In order to remove
spurious contacts, a set of 13,000 energy minimization steps were carried out. The first
3,000 steps were performed taking the protein backbone was fixed, minimizing all other
atoms. No constraints were applied during the last 10,000 steps, freely minimizing all
atoms.
The system was simulated for with 1 atm constant pressure and 310K constant
temperature (NPT) [88] using the Nose´-Hoover Langevin piston pressure control [89]
and the Langevin damping dynamics [90] respectively. In next 400 ps the restraint on the
protein backbone is removed completely in a stepwise manner. Then the system in is
simulated without any restraint for 1600 ps continuously. So a simulation of 2 ns is
achieved. The atomic coordinates and velocities were saved every 500 time-steps, and
coordinate trajectories were saved every 250 time-steps for subsequent data analysis. It
took approximately two day to achieve 1 ns simulation for the system using eight 1.15-
GHz EV7 processors on the HP micro tower.
28
Chapter 4
4. Results and Discussion
4.1. Sequence divergence
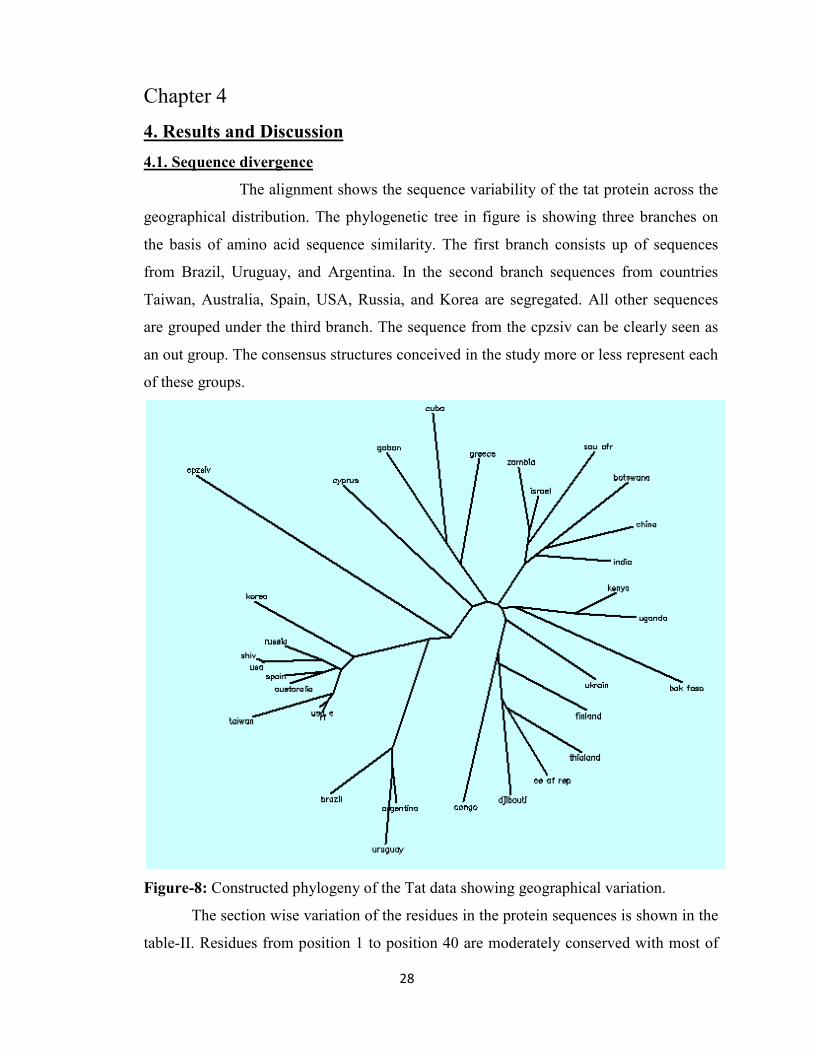
The alignment shows the sequence variability of the tat protein across the
geographical distribution. The phylogenetic tree in figure is showing three branches on
the basis of amino acid sequence similarity. The first branch consists up of sequences
from Brazil, Uruguay, and Argentina. In the second branch sequences from countries
Taiwan, Australia, Spain, USA, Russia, and Korea are segregated. All other sequences
are grouped under the third branch. The sequence from the cpzsiv can be clearly seen as
an out group. The consensus structures conceived in the study more or less represent each
of these groups.
Figure-8: Constructed phylogeny of the Tat data showing geographical variation.
The section wise variation of the residues in the protein sequences is shown in the
table-II. Residues from position 1 to position 40 are moderately conserved with most of

29
the positions are highly conserved and some are partially conserved with strong or weak
groups for substitution. The cystein residues are highly conserved as they are part of
structurally important sulphur bonds. The core region (aa 38–48), which is highly
conserved among other lentiviruses also shows high degree of conservancy.
Table-II: Conservancy of amino acid positions across the sequences. Partially conserved
groups are all the positively scoring groups that occur in the Gonnet Pam250 matrix. The
strong and weak groups are defined as strong score >0.5 and weak score =<0.5
respectively.
Sequence Conserved Partially
Conserved
Sequence Conserved Partially
Conserved
Strong
gr.
Weak
gr.
Strong
gr.
Weak
gr.
1-10 1,5,6,8,10 2,4,9 - 51-60 51-3,55,
56
- -
11-20 11,14-5,
18,20
13,17 16 61-70 - 66 65
21-30 21,25,27.
28,30
26 23 71-80 72 72,79 -
31-40 33,34,37,
38
- 40 81-86 - 82,85,86 83,84
41-50 41,42-50 - 43
The basic ARD region (aa 48-56) contains the nuclear localization signal of the
protein [91] and specifically interacts with a uridine-rich bulge motif in the RNA TAR
[48]. So, it shows high conservancy for maintaining functional viability of the protein.
The core region, which has been proposed to provide structural stabilization to the protein
[92] is least conserved. The structural stability, which is mostly dependent on residual
interactions, is maintained in expense of the residual substitution and in favor of stronger
interaction. The residues from 81 to 86 are moderately conserved.
Three consensus sequences are formed based on the position specific variability
of the residues. The positional variations of the residues among the models are shown in
table-III. As expected the variations are mainly concentrated at first and last sections of

30
the sequences. Out of 13 positional variations studied, the first eight (aa 3-35) show
residual substitution within strong groups (Table-II). These positions are inside the region
important for maintaining the functional viability of the protein. Any distant substitution
with unrelated amino acid may disrupt the activity. The distance between the sequences is
shown in the table IV. The sequence SA and C are maximum apart where as sequence SA
and B are least apart. As the SA is modeled on the sequences from South America and
the model B chiefly represents the sequences from Europe and North America the
similarities are justified.
Table-III: Variation of amino acid positions across the modeled structures.
Models
positions
3 7 12 19 21 23 24 35 61 64 67 68 77
SA L N N T P T R Y N T V S T
B P N N K A T N Q N T V S P
C P R K K A N K Q S D N P T
Table-IV: Distance between the modeled sequences calculated by Protdist.
Distance
Models SA B C
SA 0 0.0914 0.184
B 0.0914 0 0.125
C 0.184 0.125 0
4.2. Structural variability
Figure-9: The Tat consensus structures from 32 protein sequences (Table-I) modeled on
PDB: 1tbc. The helix 1 (blue) and helix 2 (green) are clearly visualized.
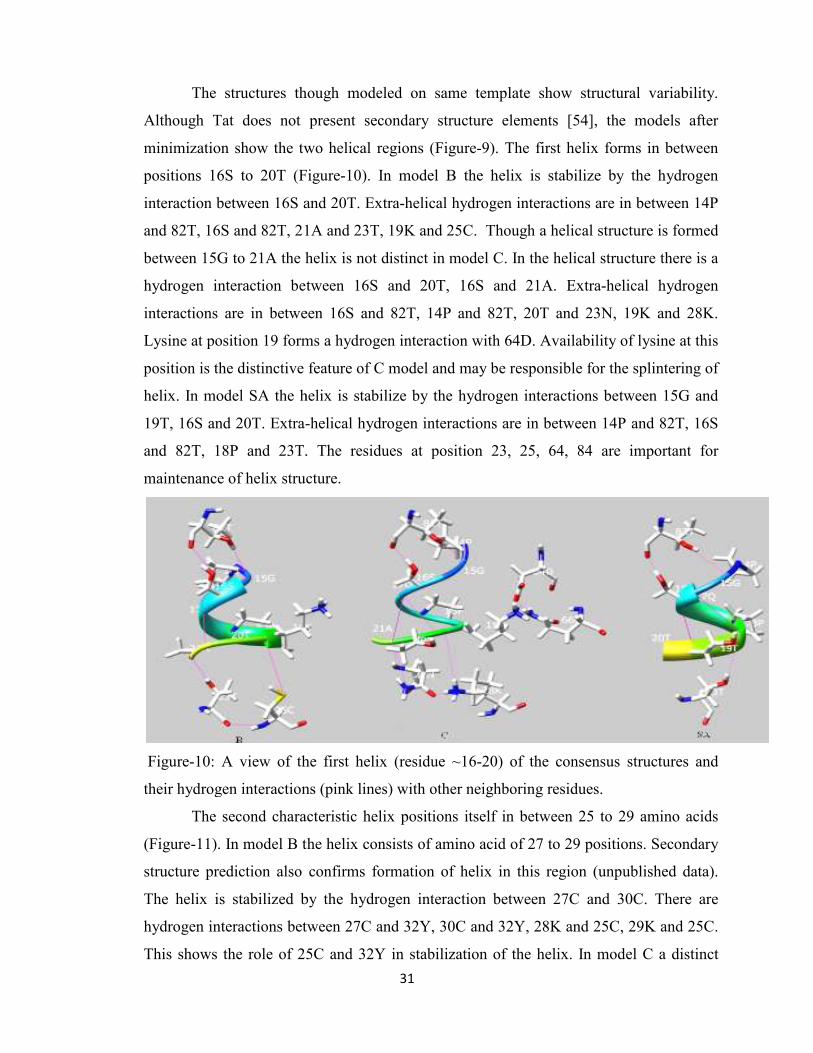
The structures though modeled on same template show structural v
Although Tat does not present secondary structure elements [
minimization show the two helical regions (Figure
positions 16S to 20T (Figure
interaction between 16S and 20T. Extra
and 82T, 16S and 82T, 21A and 23T, 19K and 25C. Though a helical structure is formed
between 15G to 21A the helix is not distinct in model C. In the helical s
hydrogen interaction between 16S and 20T, 16S and 21A. Extra
interactions are in between 16S and 82T, 14P and 82T, 20T and 23N, 19K and 28K.
Lysine at position 19 forms a hydrogen interaction with 64D. Availability of
position is the distinctive feature of C model and may be responsible for the splintering of
helix. In model SA the helix is stabilize by the hydrogen interactions between 15G and
19T, 16S and 20T. Extra-
and 82T, 18P and 23T. The residues at position 23, 25, 64, 84 are important for
maintenance of helix structure.
Figure-10: A view of the first helix (residue ~16
their hydrogen interactions (
The second characteristic helix positions itself in between 25 to 29 amino acids
(Figure-11). In model B the helix consists of amino acid of 27 to 29 positions. Secondary
structure prediction also confirms formation of helix in this region (unpublished data).
The helix is stabilized by the hydrogen interaction between 27C and 30C. There are
hydrogen interactions between 27C and 32Y, 30C and 32Y, 28K and 25C, 29K and 25C.
This shows the role of 25C and 32Y in stabilization of the helix. In model C a distinct
31
The structures though modeled on same template show structural v
Although Tat does not present secondary structure elements [54], the models after
minimization show the two helical regions (Figure-9). The first helix forms in between
positions 16S to 20T (Figure-10). In model B the helix is stabilize by the
interaction between 16S and 20T. Extra-helical hydrogen interactions are in between 14P
and 82T, 16S and 82T, 21A and 23T, 19K and 25C. Though a helical structure is formed
between 15G to 21A the helix is not distinct in model C. In the helical structure there is a
hydrogen interaction between 16S and 20T, 16S and 21A. Extra-helical hydrogen
interactions are in between 16S and 82T, 14P and 82T, 20T and 23N, 19K and 28K.
Lysine at position 19 forms a hydrogen interaction with 64D. Availability of
position is the distinctive feature of C model and may be responsible for the splintering of
helix. In model SA the helix is stabilize by the hydrogen interactions between 15G and
-helical hydrogen interactions are in between 14P and 82T, 16S
and 82T, 18P and 23T. The residues at position 23, 25, 64, 84 are important for
maintenance of helix structure.
: A view of the first helix (residue ~16-20) of the consensus structures and
their hydrogen interactions (pink lines) with other neighboring residues.
The second characteristic helix positions itself in between 25 to 29 amino acids
). In model B the helix consists of amino acid of 27 to 29 positions. Secondary
structure prediction also confirms formation of helix in this region (unpublished data).
The helix is stabilized by the hydrogen interaction between 27C and 30C. There are
ogen interactions between 27C and 32Y, 30C and 32Y, 28K and 25C, 29K and 25C.
This shows the role of 25C and 32Y in stabilization of the helix. In model C a distinct
The structures though modeled on same template show structural variability.
], the models after
). The first helix forms in between
). In model B the helix is stabilize by the hydrogen
helical hydrogen interactions are in between 14P
and 82T, 16S and 82T, 21A and 23T, 19K and 25C. Though a helical structure is formed
tructure there is a
helical hydrogen
interactions are in between 16S and 82T, 14P and 82T, 20T and 23N, 19K and 28K.
Lysine at position 19 forms a hydrogen interaction with 64D. Availability of lysine at this
position is the distinctive feature of C model and may be responsible for the splintering of
helix. In model SA the helix is stabilize by the hydrogen interactions between 15G and
between 14P and 82T, 16S
and 82T, 18P and 23T. The residues at position 23, 25, 64, 84 are important for
20) of the consensus structures and
The second characteristic helix positions itself in between 25 to 29 amino acids
). In model B the helix consists of amino acid of 27 to 29 positions. Secondary
structure prediction also confirms formation of helix in this region (unpublished data).
The helix is stabilized by the hydrogen interaction between 27C and 30C. There are
ogen interactions between 27C and 32Y, 30C and 32Y, 28K and 25C, 29K and 25C.
This shows the role of 25C and 32Y in stabilization of the helix. In model C a distinct
32
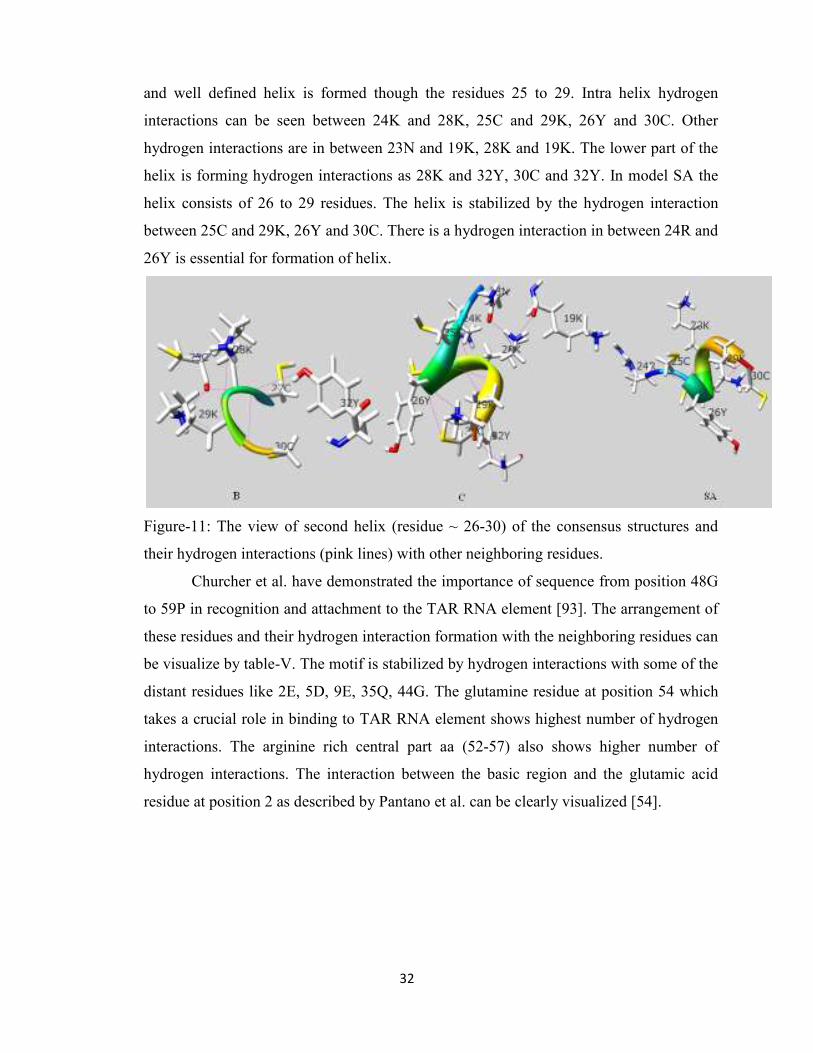
and well defined helix is formed though the residues 25 to 29. Intra helix hydrogen
interactions can be seen between 24K and 28K, 25C and 29K, 26Y and 30C. Other
hydrogen interactions are in between 23N and 19K, 28K and 19K. The lower part of the
helix is forming hydrogen interactions as 28K and 32Y, 30C and 32Y. In model SA the
helix consists of 26 to 29 residues. The helix is stabilized by the hydrogen interaction
between 25C and 29K, 26Y and 30C. There is a hydrogen interaction in between 24R and
26Y is essential for formation of helix.
Figure-11: The view of second helix (residue ~ 26-30) of the consensus structures and
their hydrogen interactions (pink lines) with other neighboring residues.
Churcher et al. have demonstrated the importance of sequence from position 48G
to 59P in recognition and attachment to the TAR RNA element [93]. The arrangement of
these residues and their hydrogen interaction formation with the neighboring residues can
be visualize by table-V. The motif is stabilized by hydrogen interactions with some of the
distant residues like 2E, 5D, 9E, 35Q, 44G. The glutamine residue at position 54 which
takes a crucial role in binding to TAR RNA element shows highest number of hydrogen
interactions. The arginine rich central part aa (52-57) also shows higher number of
hydrogen interactions. The interaction between the basic region and the glutamic acid
residue at position 2 as described by Pantano et al. can be clearly visualized [54].

33
Table-V: Hydrogen interactions formed in the RNA binding motif (48-59) across the
models. The interaction (H.B) is shown between the residues (res.) among the models.
B C SA
Res. H.B Res. H.B Res. H.B
48G 48G 48G 50K
49R 44G(2), 33H(2) 49R 44G, 32Y,67N 49R 44G(2)
50K 52R, 2E 50K 52R 50K 48G, 2E
51K 51K 53R, 54Q(2) 51K
52R 50K,54Q,55R 52R 50K 52R 54Q, 55R
53R 54Q, 35Q 53R 51K, 35Q 53R 54Q
54Q 52R, 53R,57R 54Q 51K, 56R 54Q 52R,53R, 56R
55R 5D 55R 5D 55R 52R, 5D
56R 9E 56R 54Q, 9E, 63Q 56R 54Q, 9E
57R 54Q 57R 60Q 57R 68S
58T 58T 58T
59P 59P 63Q 59P 65H
4.3. Dynamics of residue patches and active pockets
Three molecular dynamics simulations of two nanosecond each were carried out
on the models in order to investigate their stability and dynamical properties. Each
systems were simulated without constraints and reached equilibrium after approximately
1.2 ns of constant pressure and temperature equilibration at 1 atm and 310 K.
Correspondingly, the trajectory time from 0–1.2 ns is referred to as the “equilibration
phase” and from 1.2–2 ns is referred to as the ‘‘dynamics phase’’ (Figure-12). Plots of
the time evolution of the root mean square deviation (RMSD), where each trajectory
frame was aligned to the initial starting structure in order to remove any rotational or
translational motion, indicate that equilibration was achieved for all systems. The overall
root-mean-square-fluctuations (RMSF) per residue was calculated during the dynamics
phase for each system based on Cα positions after alignment to the average equilibrated
structure, and the resulting RMSF difference plot shows the differences in RMS
fluctuations between the three systems (Figure-13). The average RMSFs of the residues
of models B, C and SA is 2.18, 1.16 and 1.48 respectively.

34
Figure-12: Root mean square deviation (RMSD) of the models plotted as a function of
simulation time of 2 ns.
Position of the residue and its interaction with other residues defines the structure
of the protein and also characterize its molecular dynamics motion. Residues adjacent to
glycine and proline show marked motion due to their conformational flexibility. The
presence of 5’GLGI3’ motif in between position 42 to 45 explains the increased
fluctuation of this region (Figure-13). The role of this region as a hinge between the
trans-activating core region and RNA binding ARD can be reasoned for this dynamics.
The location of polar uncharged amino acid aspargine at position 24 in model B instead
of a basic amino acid lysine and arginine as in model C and SA is responsible for
increased fluctuation of the residues near to the said position.
Figure-13: Structural flexibility shown as RMSFs of all Cα atoms of the models from the
last 800 ps of unrestrained simulations.
The residues from 48G to 59P consisting the RNA binding arginine rich domain
(ARD) are showing least motion as compared to other residues (Figure-14b). This pocket
0
0.5
1
1.5
2
2.5
3
3.5
4
4.5
0 500 1000 1500 2000 2500
CαRM
SD (Å)
Time (ps)
B
C
SA
0
1
2
3
4
5
0 20 40 60 80 100
CαRM
SF (Å)
Residue Number
B
C
SA
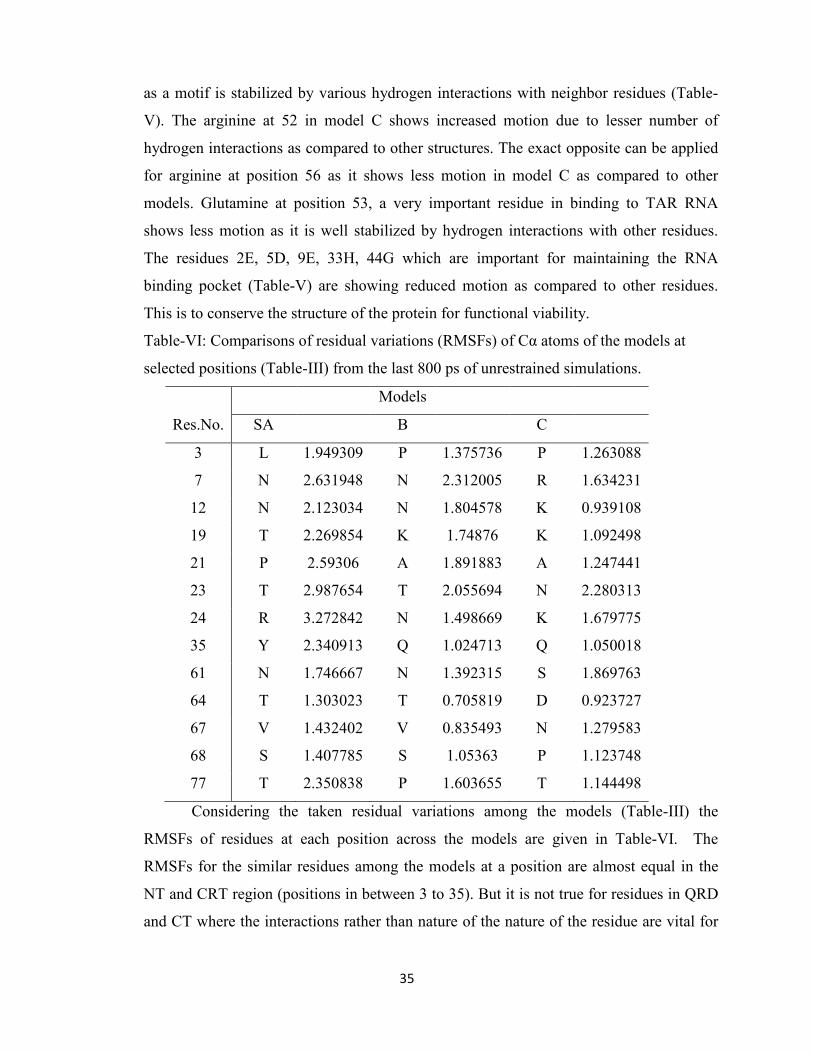
35
as a motif is stabilized by various hydrogen interactions with neighbor residues (Table-
V). The arginine at 52 in model C shows increased motion due to lesser number of
hydrogen interactions as compared to other structures. The exact opposite can be applied
for arginine at position 56 as it shows less motion in model C as compared to other
models. Glutamine at position 53, a very important residue in binding to TAR RNA
shows less motion as it is well stabilized by hydrogen interactions with other residues.
The residues 2E, 5D, 9E, 33H, 44G which are important for maintaining the RNA
binding pocket (Table-V) are showing reduced motion as compared to other residues.
This is to conserve the structure of the protein for functional viability.
Table-VI: Comparisons of residual variations (RMSFs) of Cα atoms of the models at
selected positions (Table-III) from the last 800 ps of unrestrained simulations.
Res.No.
Models
SA B C
3 L 1.949309 P 1.375736 P 1.263088
7 N 2.631948 N 2.312005 R 1.634231
12 N 2.123034 N 1.804578 K 0.939108
19 T 2.269854 K 1.74876 K 1.092498
21 P 2.59306 A 1.891883 A 1.247441
23 T 2.987654 T 2.055694 N 2.280313
24 R 3.272842 N 1.498669 K 1.679775
35 Y 2.340913 Q 1.024713 Q 1.050018
61 N 1.746667 N 1.392315 S 1.869763
64 T 1.303023 T 0.705819 D 0.923727
67 V 1.432402 V 0.835493 N 1.279583
68 S 1.407785 S 1.05363 P 1.123748
77 T 2.350838 P 1.603655 T 1.144498
Considering the taken residual variations among the models (Table-III) the
RMSFs of residues at each position across the models are given in Table-VI. The
RMSFs for the similar residues among the models at a position are almost equal in the
NT and CRT region (positions in between 3 to 35). But it is not true for residues in QRD
and CT where the interactions rather than nature of the nature of the residue are vital for
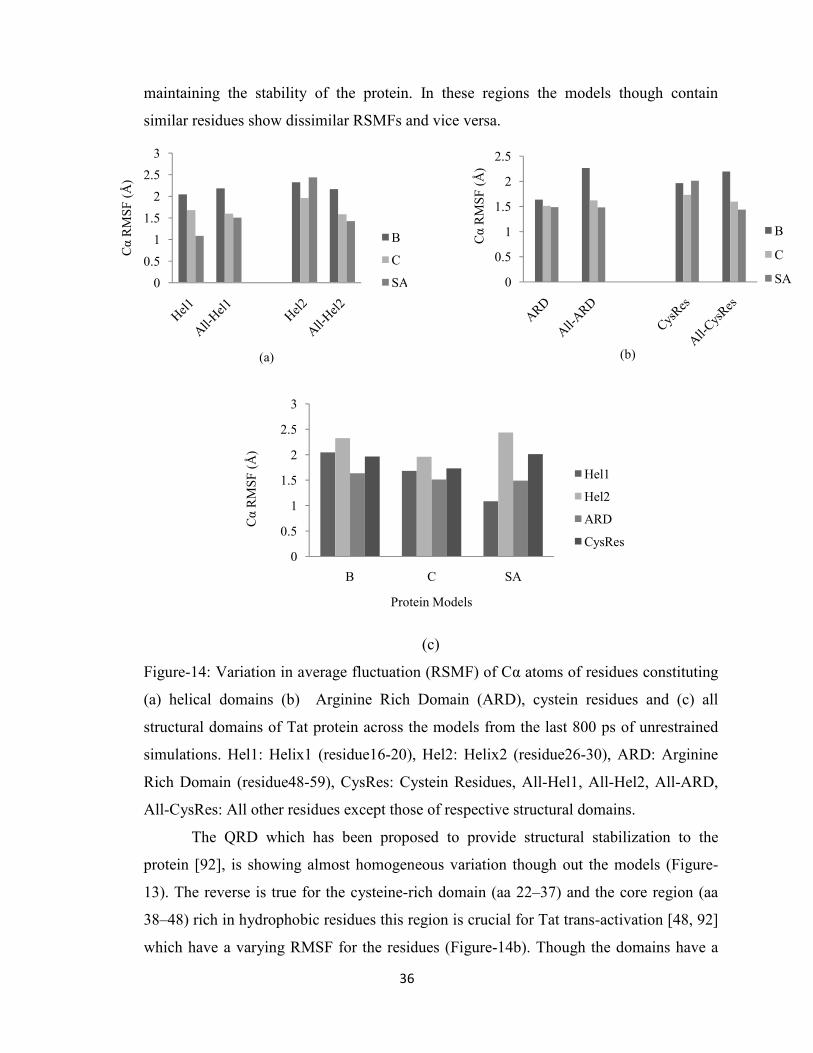
36
maintaining the stability of the protein. In these regions the models though contain
similar residues show dissimilar RSMFs and vice versa.
(c)
Figure-14: Variation in average fluctuation (RSMF) of Cα atoms of residues constituting
(a) helical domains (b) Arginine Rich Domain (ARD), cystein residues and (c) all
structural domains of Tat protein across the models from the last 800 ps of unrestrained
simulations. Hel1: Helix1 (residue16-20), Hel2: Helix2 (residue26-30), ARD: Arginine
Rich Domain (residue48-59), CysRes: Cystein Residues, All-Hel1, All-Hel2, All-ARD,
All-CysRes: All other residues except those of respective structural domains.
The QRD which has been proposed to provide structural stabilization to the
protein [92], is showing almost homogeneous variation though out the models (Figure-
13). The reverse is true for the cysteine-rich domain (aa 22–37) and the core region (aa
38–48) rich in hydrophobic residues this region is crucial for Tat trans-activation [48, 92]
which have a varying RMSF for the residues (Figure-14b). Though the domains have a
0
0.5
1
1.5
2
2.5
3
CαRM
SF (Å)
(a)
B
C
SA 0
0.5
1
1.5
2
2.5
CαRM
SF (Å)
(b)
B
C
SA
0
0.5
1
1.5
2
2.5
3
B C SA
CαRM
SF (Å)
Protein Models
Hel1
Hel2
ARD
CysRes
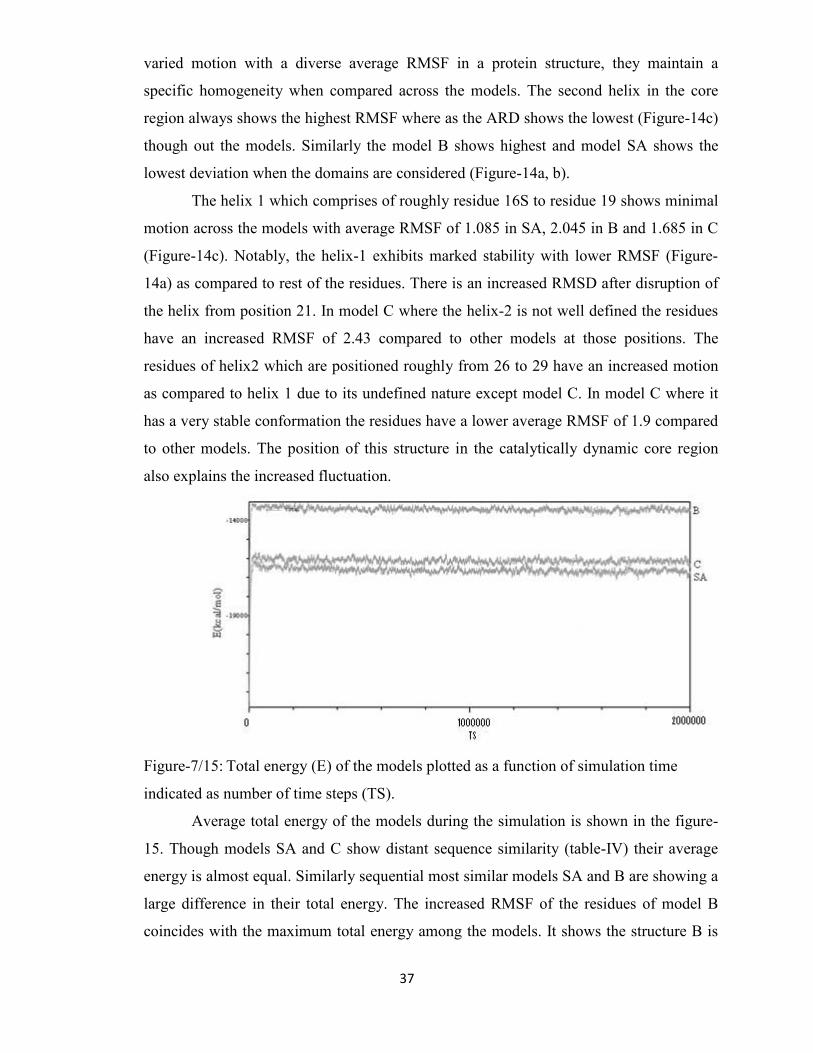
37
varied motion with a diverse average RMSF in a protein structure, they maintain a
specific homogeneity when compared across the models. The second helix in the core
region always shows the highest RMSF where as the ARD shows the lowest (Figure-14c)
though out the models. Similarly the model B shows highest and model SA shows the
lowest deviation when the domains are considered (Figure-14a, b).
The helix 1 which comprises of roughly residue 16S to residue 19 shows minimal
motion across the models with average RMSF of 1.085 in SA, 2.045 in B and 1.685 in C
(Figure-14c). Notably, the helix-1 exhibits marked stability with lower RMSF (Figure-
14a) as compared to rest of the residues. There is an increased RMSD after disruption of
the helix from position 21. In model C where the helix-2 is not well defined the residues
have an increased RMSF of 2.43 compared to other models at those positions. The
residues of helix2 which are positioned roughly from 26 to 29 have an increased motion
as compared to helix 1 due to its undefined nature except model C. In model C where it
has a very stable conformation the residues have a lower average RMSF of 1.9 compared
to other models. The position of this structure in the catalytically dynamic core region
also explains the increased fluctuation.
Figure-7/15: Total energy (E) of the models plotted as a function of simulation time
indicated as number of time steps (TS).
Average total energy of the models during the simulation is shown in the figure-
15. Though models SA and C show distant sequence similarity (table-IV) their average
energy is almost equal. Similarly sequential most similar models SA and B are showing a
large difference in their total energy. The increased RMSF of the residues of model B
coincides with the maximum total energy among the models. It shows the structure B is

38
less stable than other two models. It may be noted that the energy of a molecule is more
dependent on its structure and various interactions than its sequence.

39
Chapter 5
5. Conclusion
Human immunodeficiency virus (HIV) is a retrovirus that causes acquired
immunodeficiency syndrome. The life cycle of HIV inside the human host is complex
and precise consisting many macromolecular interactions and activations. Each function
is the window to next function performing role of molecular check point. Inhibiting one
step effects the next impeding the cycle of viral replication and function.
The structural basis for cyclin T1 interaction with Tat and TAR is still unclear.
Cyclin T1 is believed to interact with Tat through metal ions stabilized by essential
cysteine residues found in both proteins [94, 95]. Since the cysteine-rich and hydrophobic
regions of the free Tat protein are highly flexible, it seems likely that they undergo
conformational rearrangements during assembly of the ternary complex with cyclin T1.
The TAR RNA binding motif shows less structural dynamics and more conformational
stability (Figure-14b, Table-V). This may be the requirement for steady binding to the
RNA element. Again any change in core region shows decreased in stability. Taking the
model B which had more deviations in its core region (21-47) is least stable as it has
maximum total energy (figure-15). The reverse is true for the model SA where lesser
RMSD across the residues in this region shows higher stability of protein when energy is
considered. The role of the hydrogen interactions for maintaining functional and
structural viability of the protein is also clearly demonstrated (Table-V). Our study
defines three regions in Tat protein structure. The first region consists of residues 1 to 47
and vital for various catalytic function of the protein. This region is characterized by
minimal substitution or substitution by near group residues (Table-II, III), presence of
structural motifs for molecular recognition (Figure-10, 11) and high motion (Figure-13).
The second region (aa 48-59), which is responsible for RNA binding, shows no residual
variation (Table-II) and minimal molecular dynamics motion (Figure-6b, c). The region
is quite stable with many hydrogen interactions (Table-V). In the third region (aa 60-86)
the residual interactions takes the central role in place of residue itself (Table-VI). The
region has a stable conformation with least residual fluctuations (Figure-13).
Our results indicate that the presence of hydrogen interactions appreciably affects
the system dynamics, providing stabilization to some regions of the protein structure,
while causing increased fluctuations in other areas where the residues are not stabilized
by it. In addition to this residual position and the role of the domain in function of the

40
protein can be suitably correlated to the residual motion during molecular dynamics
simulation. The study also explains the pre binding stability of the active site of Tat
protein which is crucial for its intended function. Structural and sequential analysis of the
macromolecules both with time and conditional variance is needed for measuring the
state of variability of each molecule. Then relating these to the interaction data will
certainly point out the conserved sequential stages the viral progression. Then these
stages can be examined for inhibitory suitability by different ligands or other variables.
Acknowledgements
This work was done in the Bioinformatics Infrastructure Facility (BIF) available
in the Department of Biotechnology and Medical Engineering at National Institute of
Technology, Rourkela, funded by the Department of Biotechnology, India.
41
6. References
1) Greene W.C. “The molecular biology of human immunodeficiency virus type 1
infection” N Engl J Med 324(5) (1991): 308-317
2) Kao S.Y., Calman A.F., Luciw P.A., Peterlin B.M. “Anti-termination of transcription
within the long terminal repeat of HIV-1 by Tat gene product” Nature 330 (1987): 489-
493
3) Gottlieb M.S. “Pneumocystis pneumonia-Los Angeles. 1981” Am J Public Health 96
(2006): 980–982
4) Barré-Sinoussi F., Chermann J.C., Rey F., Nugeyre M.T., Chamaret S., Gruest J.,
Dauguet C., Axler-Blin C., Vézinet-Brun F., Rouzioux C., Rozenbaum W., Montagnier
L. “Isolation of a T-lymphotropic retrovirus from a patient at risk for acquired immune
deficiency syndrome (AIDS)” Science 20; 220(4599) (1983 May): 868-871.
5) Popovic M., Sarngadharan M.G., Read E. and Gallo R.C. "Detection, isolation, and
continuous production of cytopathic retroviruses (HTLV-III) from patients with AIDS
and pre-AIDS" Science 224 (4648) (1984): 497-500
6) Coffin J., Haase A., Levy J.A., Montagnier L., Oroszlan S., Teich N., Temin H.,
Toyoshima K., Varmus H., Vogt P. “What to call the AIDS virus?” Nature 321 (1986): 1-
7
7) Levy J.A. “Pathogenesis of human immunodeficiency virus infection” Microbiol Rev
57(1) (1993): 183-289
8) International Committee on Taxonomy of Viruses. 61.0.6. Lentivirus. National
Institutes of Health.
9) Smith J. A., Daniel R. "Following the path of the virus: the exploitation of host DNA
repair mechanisms by retroviruses". ACS Chem Biol 1 (4) (2006): 217-26.
10) Ho D.D., Pomerantz R.J., Kaplan J.C. “Pathogenesis of infection with human
immunodeficiency virus” N Engl J Med 317(5) (1987): 278-86
11) Landmarks of HIV genome,webpage,
http://www.hiv.lanl.gov/content/sequence/HIV/MAP/landmark.html
12) Göttlinger HG. “HIV-1 Gag: a Molecular Machine Driving Viral Particle Assembly
and Release.” HIV Sequence Compendium 2001 (2003). 2-28 Edited by: Kuiken C,
Foley B, Hahn B, Marx P, McCutchan F, Mellors JW, Wolinsky S, Korber B. Published
by: Theoretical Biology and Biophysics Group, Los Alamos National Laboratory, Los
Alamos, NM, LA-UR 02-2877
42
13) Ashorn P., McQuade T.J., Thaisrivongs S. “An inhibitor of the protease blocks
maturation of human and simian immunodeficiency viruses and spread of infection” Proc
Natl Acad Sci USA 87 (1990): 7472-7476.
14) Kwong P.D., Wyatt R., Robinson J., Sweet R., Sodroski J. and Hendrickson W.
“Structure of an HIV-1 gp120 envelope glycoprotein in complex with the CD4 receptor
and a neutralizing humanantibody” Nature 393 (1998): 649–59
15) Karn J. “Tat, a novel regulator of HIV transcription and latency” HIV Sequence
Compendium 2000 (2000): 2-18
16) Zapp M.L., Green M.R. “Sequence-specific RNA binding by the HIV-1 Rev protein”
Nature 342 (1989): 714-716
17) Yu Q., Landau N. R., and König R. “Vif and the Role of Antiviral Cytidine
Deaminases in HIV-1 Replication” HIV Sequence Compendium 2004 (2004): 2-14
18) Piguet V.and TronoV. “A Structure-function Analysis of the Nef Protein of Primate
Lentiviruses” HIV Sequence Compendium 2004 (2004): 2-28
19) Mansky L.M. and Temin H.M. “Lower in vivo mutation rate of Human
Immunodeficiency Virus type 1 than that predicted from the fidelityof purified reverse
transcriptase” J. Viro. 69 (8) (1995): 5087–5094
20) Leitner T., Kumar S. and Albert J. “Tempo and mode of nucleotide substitutions in
gag and env gene fragments in Human Immunodeficiency Virus type 1 populations with
a known transmission history” J. Viro 71(6) (1997): 4761–4770
21) Bernardi G., Olofsson B., Filipski J., Zerial M., Salinas J., Cuny G., Menunier-
Rotival M., and Rodier F. “The mosaic genome of warmblooded Vertebrates” Science
228 (1985): 953–958
22) Robertson D.L., Hahn B.H., Sharp P.M. "Recombination in AIDS viruses". J Mol
Evol. 40 (3 ) (1995): 249-259
23) Osmanov S., Pattou C., Walker N., Schwardlander B., Esparza J. “WHO-UNAIDS
Network for HIV Isolation and Characterization. Estimated global distribution and
regional spread of HIV-1 genetic subtypes in the year 2000” Acquir. Immune. Defic.
Syndr. 29 (2) (2002): 184-190
24) Perrin L., Kaiser L., Yerly S. “Travel and the spread of HIV-1 genetic variants”
Lancet Infect Dis. 3 (1) (2003): 22-27
25) Carr, J. K., Foley, B. T., Leitner, T., Salminen, M., Korber, B. and McCutchan, F.
(1998). “Reference Sequences Representing the Principal Genetic Diversity of HIV-1 in

43
the Pandemic” in Los Alamos National Laboratory (ed.): HIV Sequence Compendium
Los Alamos, New Mexico: Los Alamos National Laboratory: 10-19.
26) Wainberg M.A.” HIV-1 subtype distribution and the problem of drug resistance”
AIDS. 18 (2004): S63-S68
27) Spira S., Wainberg M.A., Loemba H., Turner D. and Brenner B.G. “Impact of clade
diversity on HIV-1 virulence, antiretroviral drug sensitivity and drug resistance” J.
Antimicro Chemotherapy 51(2003): 229-240
28) Thomson M.M., Perez-Alvarez L. and Najera R. "Molecular epidemiology of HIV-1
genetic forms and its significance for vaccine development and therapy". Lancet Infect.
Dis. 2 (8) (2002): 461-471
29) Novitsky V., Rybak N., McLane M.F., Gilbert P., Chigwedere P., Klein I., Gaolekwe
S., Chang S. Y., Peter T., Thior I., Ndung'u T., Vannberg F., Foley B.T., Marlink R., Lee
T. H., and Essex M. “Identification of Human Immunodeficiency Virus Type 1 Subtype
C Gag-, Tat-, Rev-, and Nef-Specific Elispot-Based Cytotoxic T-Lymphocyte Responses
for AIDS Vaccine Design” J Virol. 75(19) (2001): 9210–9228
30) Ndung'u T., Renjifo B., and Essex M. “Construction and Analysis of an Infectious
Human Immunodeficiency Virus Type 1 Subtype C Molecular Clone” J Virol.
75(11)(2001): 4964–4972
31) Daniel M.D., King N.W., Letvin N.L., Hunt R.D., Sehgal P.K., Desrosiers R.C. "A
new type D retrovirus isolated from macaques with an immunodeficiency syndrome".
Science 223 (4636) (1984): 602–5.
32) Kurth R. and Norley S. “Why don't the natural hosts of SIV develop simian AIDS?”
J. NIH Res. 8 (1996): 33-37
33) Baier M., Dittmar M.T., Cichutek K., Kurth R. "Development of vivo of genetic
variability of simian immunodeficiency virus" Proc. Natl. Acad. Sci. U.S.A. 88 (18)
(1991): 8126–30.
34) Berkhout B. “Structural features in TAR RNA of human and simian
immunodeficiency viruses: a phylogenetic analysis” Nucleic Acids Res. 11 (1993): 27–
31
35) Jaeger J.A., SantaLucia J. Jr., and Tinoco I.Jr. “Determination of rna structure and
Thermodynamics”, Annu. Rev. Biochem. 62 (1993):255-87
36) Uhlenbeck O.C., Pardi A., and Feigon J. “RNA Structure Comes of Age” Cell
90(1997)833–840
44
37) Westhof E. and Auffinger P. “RNA Tertiary Structure, Encyclopedia of Analytical
Chemistry” R.A. Meyers (Ed.) John Wiley & Sons Ltd, Chichester, 2000: 5222–5232
38) Batey R.T., Sagar M.B. and Doudna J.A. “Structural and energetic analysis of RNA
recognition by a universally conserved protein from the signal recognition particle” J.
Mol. Biol. 255 (2001):229-46
39) Hermann T. and Westhof E. “Rational Drug Design and High-Throughput
Techniques for RNA Targets” Combinatorial Chemistry & High Throughput Screening 3
(2000): 219-234
40) Batey R.T., Rambo R.P., Doudna J.A. “Tertiary Motifs in RNA Structure and
Folding” Angew Chem Int Ed Engl.38 (1999):2326-2343
41) Kessler M., Mathews M.B. “Premature termination and processing of human
immunodeficiency virus type 1-promoted transcripts” J Virol 66(1992): 4488-4496
42) Zhang J., Tamilarasu N., Hwang S., Garber M.E., Huq I., Jones K.A., Rana T.A.
“HIV-1 TAR RNA Enhances the Interaction between Tat and Cyclin T1” J Biol Chem
275 (2000):34314-34319
43) Dingwall C., Ernberg I., Gait M.J., Green S.M., Heaphy S., Karn J., Lowe A.D.,
Singh M., Skinner M.A., Valerio R. “Human immunodeficiency virus 1 Tat protein binds
transactivation-responsive region (TAR) RNA in vitro’’ Proc Natl Acad Sci USA 86
(1989):6925-6929
44) Weeks K.M., Ampe C., Schultz S.C., Steitz T.A., Crothers D.M. “Fragments of the
HIV-1 Tat protein specifically bind TAR RNA” Science 249 (1990):1281-1285
45) Bayer P., Kraft M., Ejchart A., Westendrop M., Frank R., Rosch P. “Structural
studies of HIV-1 Tat protein” J Mol Biol 247(1995): 529-535
46) Metzger A.U., Bayer P., Willbold D., Hoffmann S., Frank R.W., Goody R.S., Rösch
P. “The interaction of HIV-1 Tat (32-72) with its target RNA: a fluorescence and nuclear
magnetic resonance study” Biochem Biophys Res Comm 241 (1997): 31-36.
47) Ruben S., Perkins A., Purcell R., Joung K., Sia R., Burghoff R., Haseltine W.A.,
Rosen C.A. “Structural and functional characterization of human immunodeficiency virus
Tat protein” J Vir 63 (1989):1-8
48) Churcher M.J., Lamont C., Hamy F., Dingwall C., Green S.M., Lowe A.D., Butler
P.J.G., Gait M.J., Karn J. “High affinity binding of TAR RNA by the human
immunodeficiency type-1 Tat proteinrequires base-pairs in the RNA stem and amino acid
residues flanking the basic region” J Mol Biol 230 (1993): 90–110

45
49) Willbold D., Rosin-Abersfeld R., Sticht H., Frank R., Rosch P. “Structure of the
equine infectious anemia virus Tat Protein” Science 264 (1994):1584–1587
50) Olsen G.L., Edwards T.E., Deka P., Varani G., Sigurdsson S.T., Drobny G.P.
“Monitoring tat peptide binding to TAR RNA by solid-state” Nucleic Acids Res 33
(2005): 3447–3454
51) Mujeeb A., Bishop K., Peterlin B.M., Turck C., Parslowtllli T.G., James T.L. “NMR
structure of a biologically active peptide containing the RNA-binding domain of human
immunodeficiency virus type 1 Tat” Proc Nati Acad Sci USA 91 (1994): 8248-8252
52) Cornelissen M., Van Den Burg R., Zorgdrager F., Lukashov V., Goudsmit J. “pol
gene diversity of five Human Immunodeficiency Virus type 1 subtypes: evidence for
naturally occurring mutations that contribute to drug resistance, limited recombination
patterns, and common ancestry for subtypes B and D” J Vir71 (1997): 6348–6358
53) Mu Y., Stock G., “Conformational dynamics of RNA-peptide binding: a molecular
dynamics simulation study” Biophys J 90 (2006): 391–399
54) Pantano S., Tyagi M., Giacca M., Carloni P. “Molecular dynamics simulations on
HIV-1 Tat” Eur Biophys J 33 (2004): 344–351
55) Reyes C.M., Nifosi R., Frankel A.D., Kollman P.A. “Molecular dynamics and
binding specificity analysis of the Bovine Immunodeficiency Virus BIV Tat-TAR
complex” Biophys J 80 (2001): 2833–2842
56) Niffosi R., Reyes C.M. “Molecular dynamics studies of the HIV1 TAR and its
complex with arginamide” Nucleic Acids Res 28 (2000): 4944-4955
57) Cavalli-Sforza L.L. and Edwards A.W.F. "Phylogenetic analysis: Models and
estimation procedures". Evol. 21 (3) (1967): 550-570
58) Penny D., Hendy M.D. and Steel M.A. “Progress with methods for constructing
evolutionary trees” Trends in Ecology and Evolution 7 (1992): 73-79
59) Yang Z. “PAML: a program package for phylogenetic analysis by maximum
likelihood” Computer Applications in BioSciences 13 (1997): 555-556
60) Edwards A.W.F., and Cavalli-Sforza, L.L. “A method for cluster analysis”
Biometrics 211965(1965): 362-375
61) Zwickl D.J., Hillis D.M. "Increased taxon sampling greatly reduces phylogenetic
error". Systematic Biology 51 (2002): 588-598.
62) Blomberg S.P., Garland T. Jr, Ives A.R. "Testing for phylogenetic signal in
comparative data: behavioral traits are more labile". Evolution 57 (2003): 717-745.
46
63) Zhang Y. and Skolnick J. "The protein structure prediction problem could be solved
using the current PDB library" Proc Natl Acad Sci USA 102 (4) (2005): 1029-1034
64) Bowie J.U., Luthy R., Eisenberg D. "A method to identify protein sequences that fold
into a known three-dimensional structure". Science 253 (5016) (1991): 164-170
65) Marti-Renom M.A., Stuart A.C., Fiser A., Sanchez R., Melo F., Sali A. “Comparative
protein structure modeling of genes and genomes” Annu Rev Biophys Biomol Struct 29
(2000): 291-325
66) Reddy C.H., Vijayasarathy K., Srinivas E., Sastry G.M., Sastry G.N. “Homology
modeling of membrane proteins: A critical assessment” Computational Biology and
Chemistry 30 (2006): 120–126
67) Sali A. and Blundell T.L. Comparative protein modelling by satisfaction of spatial
restraints. J. Mol. Biol. 234 (1993.): 779–815
68) Nayeem A., Sitkoff D.and Krystek S. “A comparative study of available software for
high-accuracy homology modeling: From sequence alignments to structural models”
Protein Sci. 15 (2006): 808-824
69) Chung S.Y., Subbiah S. “A structural explanation for the twilight zone of protein
sequence homology” Structure 4 (1996): 1123–27.
70) Alder B. J., Wainwright T. E. "Studies in Molecular Dynamics. I. General Method".
J. Chem. Phys. 31 (2) (1959): 459
71) Sanbonmatsu K. Y. And Tung C.S. “High performance computing in biology:
multimillion atomsimulations of nanoscale systems” J Struct Biol. 157(3) ( 2007): 470–
480.
72) McQuarrie D., “Statistical Mechanics” Harper & Row, New York, 1976
73) Chandler D. Introduction to Modern Statistical Mechanics, Oxford University Press,
New York, 1987
74) Wilde R. E. and Singh S. “Statistical Mechanics, Fundamentals and Modern
Applications” John Wiley & Sons, Inc, New York, 1998
75) http://en.wikipedia.org/wiki/Molecular_dynamics
76) Finn R.D., Mistry J., Schuster-Böckler,B., Griffiths-Jones S., Hollich V., Lassmann
T., Moxon S., Marshall M., Khanna A., Durbin R., Eddy S.R., Sonnhammer E.L.L.,
Bateman A. “Pfam: clans, web tools and services” Nucleic Acids Res Database 34
(2006): D247-D251

47
77) Thompson J.D., Higgins D.G., Gibson T.J. “CLUSTAL W: improving the sensitivity
of progressive multiple sequence alignment through sequence weighting, position-
specific gap penalties and weight matrix choice” Nucleic Acids Res 22 (1994): 4673–
4680
78) Rice P., Longden I., Bleasby A. “EMBOSS: The European Molecular Biology Open
Software Suite” Trends in Genetics 16 (2000): 276—277
79) Laskowski R.A., Rullmannn J.A., Macarthur M.W., Kaptein R., Thornton J.M.
“AQUA and PROCHECK-NMR: programs for checking the quality of protein structures
solved by NMR” J Biomol NMR 8 (1996): 477-486
81) Lehtonen J.V., Still D.J., Rantanen V.V., Ekholm J., Björklund D., Iftikhar Z.,
Huhtala M., Repo S., Jussila A., Jaakkola J., Pentikäinen O., Nyrönen T., Salminen T.,
Gyllenberg M., Johnson M. “BODIL: a molecular modeling environment for structure-
function analysis and drug design” J Comput Aided Mol Des 18 (2004): 401-419
82) Eswar N., Marti-Renom M. A., Webb B., Madhusudhan M.S., Eramian D., Shen M.,
Pieper U., Sali A. “Current Protocols in Bioinformatics” John Wiley & Sons, Inc. (2000)
: 5.6.1-5.6.30
83) Kale L., Skeel R., Bhandarkar M., Brunner R., Gursoy A., Krawetz N., Phillips J.,
Shinozaki A., Varadarajan K., Schulten K. “NAMD2: greater scalability for parallel
molecular dynamics” J Comput Phys151 (1999): 283–312
84) Pettersen E.F., Goddard T.D., Huang C.C., Couch G.S., Greenblatt D.M., Meng E.C .
and Ferrin T.E. “UCSF Chimera - A Visualization System for Exploratory Research and
Analysis” J Comput Chem 25(13) (2004): 1605-1612
85) Jorgensen W.L., Chandrasekhar J., Madura J.D., Impey R.W., Klein M.L.
“Comparison of simple potential functions for simulating liquid water” J Chem Phys 79
(1983): 926–935.
86) Darden T., York D., Pedersen L. “Particle-mesh Ewald—ann_log(n) method for
Ewald sums in large systems” J Chem Phys 98 (1993): 10089–10092
87) MacKerell A.D., Bashford D., Bellott M., Dunbrack R.L., Evanseck J.D., Field M.J.,
Fischer S., Gao J., Guo H., Ha S., Joseph-McCarthy D., Kuchnir L. “All-atom empirical
potential for molecularmodeling and dynamics studies of proteins” J Phys Chem B 102
(1998): 3586–3616
88) Nose S. “A unified formulation of the constant-temperature molecular-dynamics
methods” J Chem Phys 81 (1984): 511–519

48
89) Hoover W.G. “Canonical dynamics: equilibrium phase-space distributions” Phys Rev
A 31 (1985): 1695–1697
90) Brunger A. “X-PLOR, Version 3.1: A System for X-Ray Crystallography and NMR”
Yale University, New Haven, CT (1992)
91) Friedler A., Friedler D., Luedtke N. W., Tor Y. and Loyter A., Gilon C. J. Biol Chem
275 (2000): 23783–23789
92) Kuppuswamy M., Subramanian T., Srinivasan A., Chinnadurai G. “Multiple
functional domains of Tat, the trans-activator of HIV-1, defined by mutational analysis”
Nucleic Acids Res17 (1989): 3551–3561
93) Churcher M.J., Lamont C., Hamy F., Dingwall C., Green S.M., Lowe A.D., Butler
P.J.G., Gait M.J., Karn J. “High affinity binding of TAR RNA by the human
immunodeficiency type-1 Tat protein requires base-pairs in the RNA stem and amino
acid residues flanking the basic region” J Mol Biol 230 (1993): 90–110
94) Bieniasz P.D., Grdina T.A., Bogerd H.P., Cullen B.R. “Recruitment of a protein
complex containing Tat and cyclin T1 to TAR governs the species specificity of HIV-1
Tat” EMBO J 17 (1998): 7056–7065
95) Garber M.E., Wei P., Jones K.A. “The interaction between HIV-1 Tat and human
cyclin T1 requires zinc and a critical cysteine residue that is not conserved in the murine
CycT1 protein” Cold Spring Harbor Symp Quant Biol 63 (1998): 371–380
96) Saladino A.C, Xu Y. and Tang P. “Homology modeling and molecular dynamics
simulations of transmembrane domain structure of human neuronal nicotinic
acetylcholine receptor” Biophysical Journal (2005): 1009–1017
97) Herce H.D. and Garcia A.E. “Molecular dynamics simulations suggest a mechanism
for translocation of the HIV-1 TAT peptide across lipid membranes” PNAS 107(2007):
20805–20810
98) Gumbart J. and Schulten K. “Molecular Dynamics Studies of the Archaeal
Translocon” Biophysical Journal 90 (2006): 2356–2367
99) Bastug T., Kuyucak S. “Molecular dynamics simulations of calcium binding in
gramicidin A” Chemical Physics Letters 424 (2006): 82–85
100) Amaro R.E., Swift R.V., McCammon J.A. “Functional and structural insights
revealed by molecular dynamics simulations of an essential RNA editing ligase in
Trypanosoma brucei” PLoS Neglected Tropical Diseases1 (2007): 1-10
49
101) Isralewitz B., Izrailev S. and Schulten K. “Binding pathway of retinal to bacterio-
opsin: a prediction by molecular dynamics simulations” Biophysical Journal 73 (1997):
2972-2979
102) Kosztin D., Izrailev S., Schulten K. “Unbinding of retinoic acid from its receptor
studied by steered molecular dynamics” Biophysical Journal 76 (1999): 188–197
103) Fengler A., Mrestani-Klaus C., Reinhold D., renger S., Ansorge S., Faust J., Neubert
K. and Brandt W. “Determination of the solution conformation of HIV-1 Tat(1-9)
peptides by means of molecular dynamics simulations considering NMR data and
docking studies into an active site model of DP IV” J. Mol. Model 4 (1998): 200 – 210
104) Pantano S., Tyagi M., Giacca M. and Carloni P. “Amino acid modification in the
HIV-1 Tat basic domain: insights from molecular dynamics and in vivo functional
studies” J. Mol. Biol. 318 (2002): 1331–1339
105) Phillips J.C., Braun R., Wang W., Gumbart J., Tajkhorshid E., Villa E., Chipot C.,
Skeel R.D., Kale L., Schulten K. “Scalable Molecular Dynamics with NAMD” J Comput
Chem 26 (2005): 1781–1802
106) Ewald P P. “Evaluation of optical and electrostatic lattice potentials” Ann. Phys.
Leipzig 64 1921: 253-287
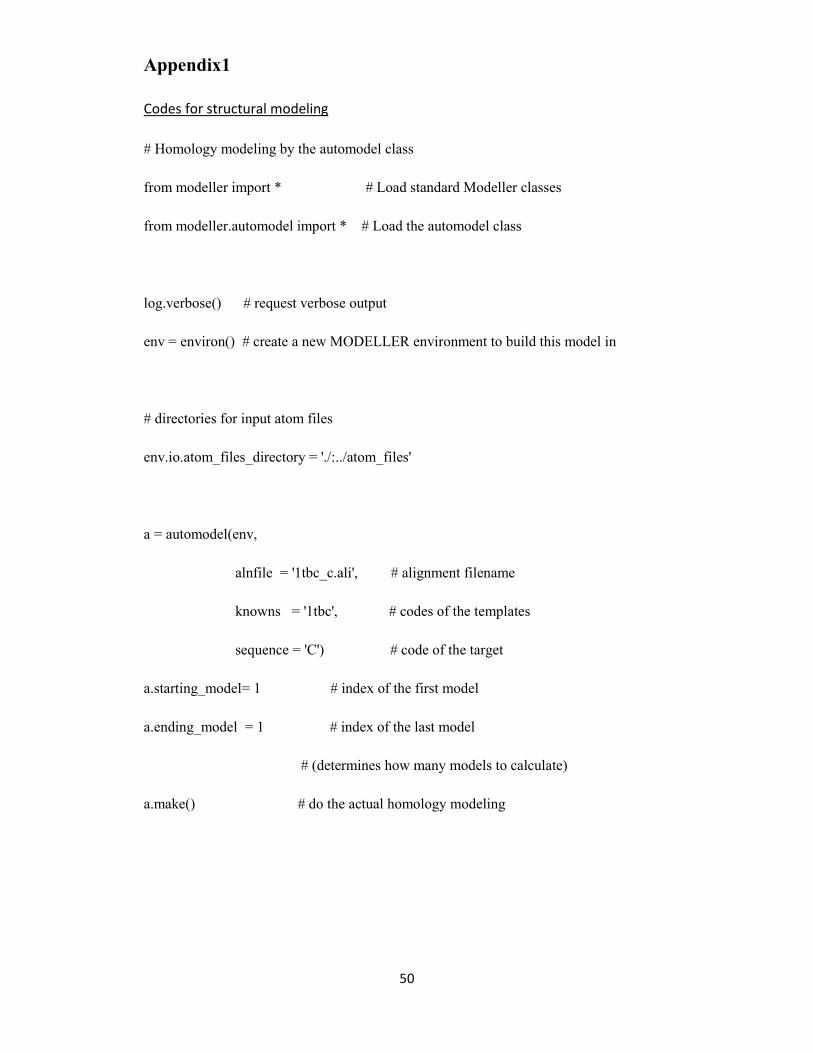
50
Appendix1
Codes for structural modeling
# Homology modeling by the automodel class
from modeller import * # Load standard Modeller classes
from modeller.automodel import * # Load the automodel class
log.verbose() # request verbose output
env = environ() # create a new MODELLER environment to build this model in
# directories for input atom files
env.io.atom_files_directory = './:../atom_files'
a = automodel(env,
alnfile = '1tbc_c.ali', # alignment filename
knowns = '1tbc', # codes of the templates
sequence = 'C') # code of the target
a.starting_model= 1 # index of the first model
a.ending_model = 1 # index of the last model
# (determines how many models to calculate)
a.make() # do the actual homology modeling
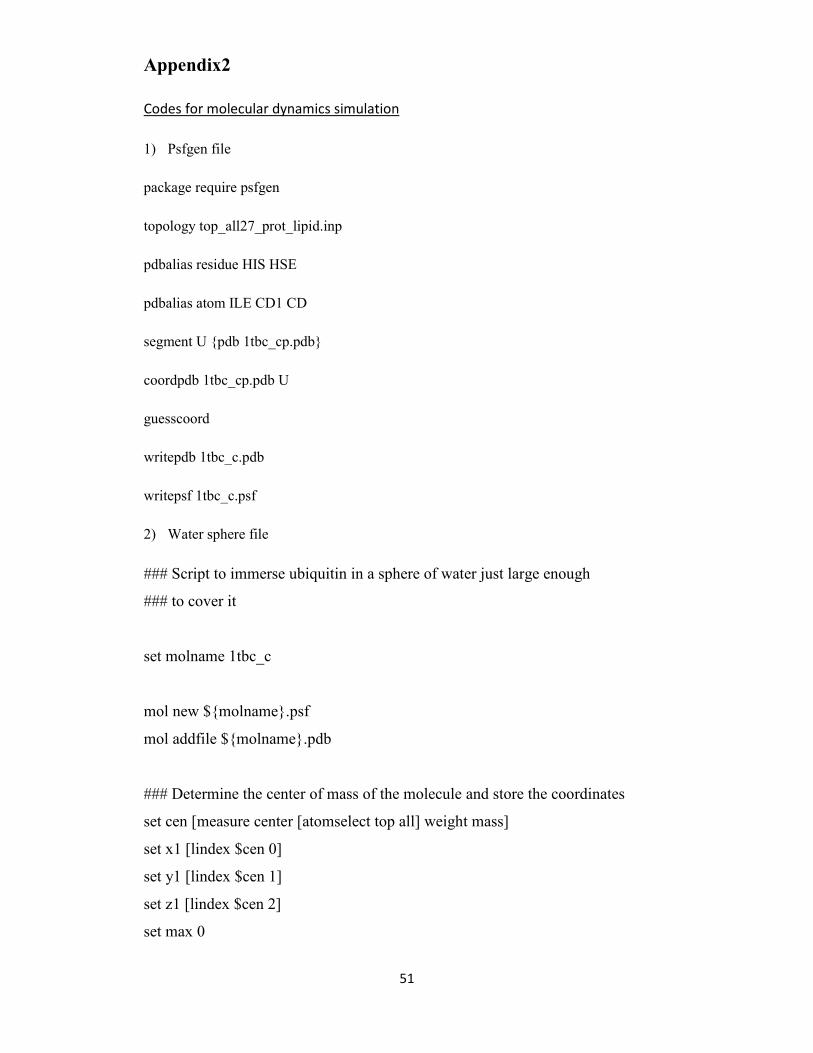
51
Appendix2
Codes for molecular dynamics simulation
1) Psfgen file
package require psfgen
topology top_all27_prot_lipid.inp
pdbalias residue HIS HSE
pdbalias atom ILE CD1 CD
segment U {pdb 1tbc_cp.pdb}
coordpdb 1tbc_cp.pdb U
guesscoord
writepdb 1tbc_c.pdb
writepsf 1tbc_c.psf
2) Water sphere file
### Script to immerse ubiquitin in a sphere of water just large enough
### to cover it
set molname 1tbc_c
mol new ${molname}.psf
mol addfile ${molname}.pdb
### Determine the center of mass of the molecule and store the coordinates
set cen [measure center [atomselect top all] weight mass]
set x1 [lindex $cen 0]
set y1 [lindex $cen 1]
set z1 [lindex $cen 2]
set max 0

52
### Determine the distance of the farthest atom from the center of mass
foreach atom [[atomselect top all] get index] {
set pos [lindex [[atomselect top "index $atom"] get {x y z}] 0]
set x2 [lindex $pos 0]
set y2 [lindex $pos 1]
set z2 [lindex $pos 2]
set dist [expr pow(($x2-$x1)*($x2-$x1) + ($y2-$y1)*($y2-$y1) + ($z2-$z1)*($z2-$z1),0.5)]
if {$dist > $max} {set max $dist}
}
mol delete top
### Solvate the molecule in a water box with enough padding (15 A).
### One could alternatively align the molecule such that the vector
### from the center of mass to the farthest atom is aligned with an axis,
### and then use no padding
package require solvate
solvate ${molname}.psf ${molname}.pdb -t 15 -o del_water
resetpsf
package require psfgen
mol new del_water.psf
mol addfile del_water.pdb
readpsf del_water.psf
coordpdb del_water.pdb
### Determine which water molecules need to be deleted and use a for loop
### to delete them
set wat [atomselect top "same residue as {water and ((x-$x1)*(x-$x1) + (y-$y1)*(y-$y1)
+ (z-$z1)*(z-$z1))<($max*$max)}"]
set del [atomselect top "water and not same residue as {water and ((x-$x1)*(x-$x1) + (y-
$y1)*(y-$y1) + (z-$z1)*(z-$z1))<($max*$max)}"]
set seg [$del get segid]
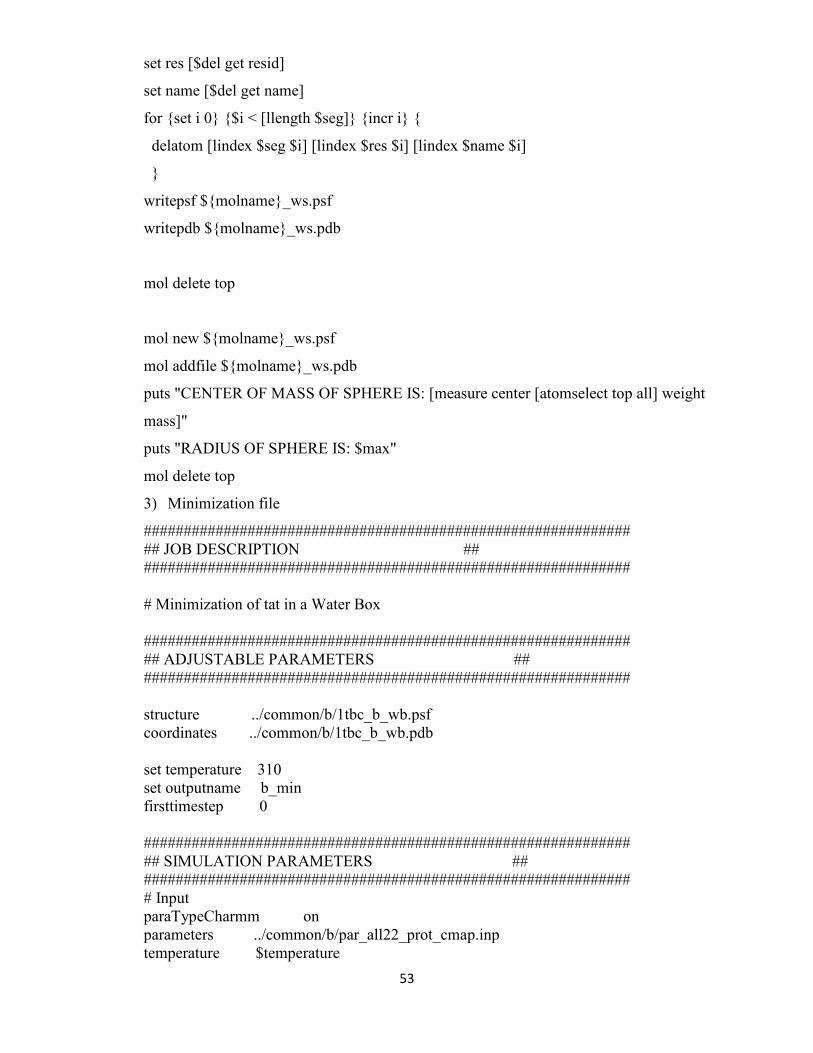
53
set res [$del get resid]
set name [$del get name]
for {set i 0} {$i < [llength $seg]} {incr i} {
delatom [lindex $seg $i] [lindex $res $i] [lindex $name $i]
}
writepsf ${molname}_ws.psf
writepdb ${molname}_ws.pdb
mol delete top
mol new ${molname}_ws.psf
mol addfile ${molname}_ws.pdb
puts "CENTER OF MASS OF SPHERE IS: [measure center [atomselect top all] weight
mass]"
puts "RADIUS OF SPHERE IS: $max"
mol delete top
3) Minimization file
############################################################# ## JOB DESCRIPTION ## ############################################################# # Minimization of tat in a Water Box ############################################################# ## ADJUSTABLE PARAMETERS ## ############################################################# structure ../common/b/1tbc_b_wb.psf coordinates ../common/b/1tbc_b_wb.pdb set temperature 310 set outputname b_min firsttimestep 0 ############################################################# ## SIMULATION PARAMETERS ## ############################################################# # Input paraTypeCharmm on parameters ../common/b/par_all22_prot_cmap.inp temperature $temperature
54
# Force-Field Parameters exclude scaled1-4 1-4scaling 1.0 cutoff 12. switching on switchdist 10. pairlistdist 13.5 # Integrator Parameters timestep 1.0 ;# 2fs/step nonbondedFreq 2 fullElectFrequency 4 stepspercycle 20 # Periodic Boundary Conditions cellBasisVector1 47.6 0. 0. cellBasisVector2 0. 42.7 0. cellBasisVector3 0. 0 36.9 cellOrigin -5.0 -0.85 5.3 wrapAll on # PME (for full-system periodic electrostatics) PME yes PMEGridSizeX 48 PMEGridSizeY 45 PMEGridSizeZ 40 # Constant Pressure Control (variable volume) useGroupPressure yes ;# needed for rigidBonds useFlexibleCell no useConstantArea no langevinPiston on langevinPistonTarget 1.01325 ;# in bar -> 1 atm langevinPistonPeriod 100. langevinPistonDecay 50. langevinPistonTemp $temperature constraints on consref ../common/b/1tbc_b_wb.pdb conskfile ../common/b/1tbc_b_wb.pdb conskcol B constraintScaling 1 # Output outputName $outputname restartfreq 500 ;# 500steps = every 1ps dcdfreq 500

55
xstFreq 250 outputEnergies 100 outputPressure 100 ############################################################# ## EXECUTION SCRIPT ## ############################################################# # Minimization minimize 3000 reinitvels $temperature
4) Parameter file for simulation
############################################################# ## JOB DESCRIPTION ## ############################################################# # Simulation of Tat ############################################################# ## ADJUSTABLE PARAMETERS ## ############################################################# structure ../common/c/1tbc_c_wb.psf coordinates ../common/c/1tbc_c_wb.pdb outputName c_eq1 # set temperature 310 # Continuing a job from the restart files if {1} { set inputname c_min binCoordinates $inputname.restart.coor binVelocities $inputname.restart.vel ;# remove the "temperature" entry if you use this! extendedSystem $inputname.xsc } firsttimestep 0 ############################################################# ## SIMULATION PARAMETERS ## ############################################################# # Input paraTypeCharmm on parameters ../common/c/par_all22_prot_cmap.inp # NOTE: Do not set the initial velocity temperature if you # have also specified a .vel restart file!
56
# temperature $temperature wrapWater on wrapAll on # Force-Field Parameters exclude scaled1-4 1-4scaling 1.0 cutoff 12. switching on switchdist 10. pairlistdist 13.5 # Integrator Parameters timestep 1.0 ;# 2fs/step nonbondedFreq 2 fullElectFrequency 4 stepspercycle 20 # Constant Temperature Control langevin on ;# do langevin dynamics langevinDamping 5 ;# damping coefficient (gamma) of 5/ps langevinTemp 310 langevinHydrogen no ;# don't couple langevin bath to hydrogens # Constant Pressure Control (variable volume) useGroupPressure yes ;# needed for 2fs steps useFlexibleCell no ;# no for water box, yes for membrane useConstantArea no ;# no for water box, yes for membrane langevinPiston on langevinPistonTarget 1.01325 ;# in bar -> 1 atm langevinPistonPeriod 100. langevinPistonDecay 50. langevinPistonTemp 310 constraints on consref ../common/c/1tbc_c_wb.pdb conskfile ../common/c/1tbc_c_wb.pdb conskcol B constraintScaling 1.0

57
restartfreq 500 ;# 500steps = every 1ps dcdfreq 500 xstFreq 250 outputEnergies 100 outputPressure 100 ############################################################# ## EXECUTION SCRIPT ## ############################################################# run 500000 ;# 50ps
![Double-stranded-RNA-dependent proteinkinase TAR RNA ... · signal uponcoexpression ofthe PKR[K296R]fusion proteins (Table 1). However, no colony color development was ob-served with](https://static.fdocuments.net/doc/165x107/5e1343e4de19f20838226f17/double-stranded-rna-dependent-proteinkinase-tar-rna-signal-uponcoexpression.jpg)