Comparative analysis on phase quantification … Comparative analysis...Comparative analysis on...
5
La Metallurgia Italiana - n. 4/2015 3 Controllo e caratterizzazione Comparative analysis on phase quantification methods in duplex stainless steels weldments M. Breda, J. Basoni, F. Toldo, C. Bastianello, S. A. Ontiveros Vidal, I. Calliari Duplex Stainless Steels (DSS) are biphasic steels of increasing interest, employment as structural materials in aggressive environments. In these steels, the austenite-to-ferrite phase ratio is maintained at about one – even if a slightly wider range between 40/60 and 60/40 is in any case accepted – giving the best combination of mechanical and corrosion-resistance properties. However, DSS must be handled with extreme care, especially if thermal cycles are involved, owing to the possible formation of dangerous secondary compounds that can highly worsen their excellent features. In industry, the production of big pipes requires manufacturing welding operations on steel plates or sheets and the end products must satisfy specific requirements. Therefore, since DSS properties depend on phase ratio, ferrite quantification at an industrial scale represents a topic of great interest, which must be as reliable as possible and, at the same time, of fast execution. In the present paper, different methods currently employed for ferrite estimation in DSS weldments are compared, in order to understand the limits deriving from each technique. Keywords: Stainless Steel - Welding - Metallography - Material analysis J. Basoni De Pretto Industrie S.r.l., Via Fogazzaro 5, 36015 Schio (VI) - Italy M. Breda, I. Calliari Industrial Engineering Department (DII), University of Padova Via Gradenigo 6A, 35131 Padova – Italy F. Toldo, C. Bastianello Laboratorio Prove Materiali San Marco Via Lago di Alleghe, 30/32 - 36015 Schio (VI)- Italy S. A. Ontiveros Vidal Instituto Tecnológico de Saltillo, Venustiano Carranza 24000, Tecnologico, 25280 Saltillo, Coahuila de Zaragoza – Mexico INTRODUCTION In the biphasic austeno-ferritic stainless steels, commonly named Duplex (DSS), the presence of equal volume frac- tions of the phases provides an excellent combination of mechanical properties and corrosion resistance, especially when compared with conventional stainless steels grades [1,2]. In Off-Shore engineering, their usage permits the design of components having smaller thicknesses – and therefore lighter – without compromising the corrosion re- sistance and avoiding the employment of expensive anti- corrosion coatings. In DSS, the balanced phase ratio can be obtained through an appropriate solution-annealing tre- atment in the temperature range 1050–1100°C followed by water quenching and, even if the 50/50 ratio is the de- sired one, phase amounts ranging from 40/60 to 60/40 are in any case accepted. However, if subjected to improper thermal cycles and especially in the temperature range 800–950°C, DSS are sensitive to secondary phases precipitation (intermetalli- cs, carbides, nitrides), which can determine drastic losses in their advantageous properties [1-8]. Therefore, the solu- tion treatment is usually performed after the forming ope- rations and, besides ensuring the achievement of the de- sired Duplex microstructure, it permits to re-dissolve any dangerous precipitate formed during the manufacturing cycle. However, weldments are not always treatable after components joining, especially when in-service operations are performed, and special care must be adopted for wel- ding purposes. In this regard, DSS must be managed as austenitic grades but using dedicated devices, avoiding the formation of undesired structures and considering that the solution-annealing treatment could not be performed when big parts are joined. After welding, DSS are required to be free from secondary phases and the austenite/ferrite volume fractions must be maintained within the desired forks, in order to guarantee the expected corrosion resistance and mechanical proper- ties. Therefore, the qualification tests require a systematic measurement of the ferrite percentage (%FE) in different parts of the joint – base material (BM), heat affected zone (HAZ) and fusion zone (FZ). The international reference
Transcript of Comparative analysis on phase quantification … Comparative analysis...Comparative analysis on...

La Metallurgia Italiana - n. 4/2015 3
Controllo e caratterizzazione
Comparative analysis on phase quantification methods in duplex stainless steels weldments
M. Breda, J. Basoni, F. Toldo, C. Bastianello, S. A. Ontiveros Vidal, I. Calliari
Duplex Stainless Steels (DSS) are biphasic steels of increasing interest, employment as structural materials in aggressive environments. In these steels, the austenite-to-ferrite phase ratio is maintained at about one – even
if a slightly wider range between 40/60 and 60/40 is in any case accepted – giving the best combination of mechanical and corrosion-resistance properties. However, DSS must be handled with extreme care, especially
if thermal cycles are involved, owing to the possible formation of dangerous secondary compounds that can highly worsen their excellent features. In industry, the production of big pipes requires manufacturing welding
operations on steel plates or sheets and the end products must satisfy specific requirements. Therefore, since DSS properties depend on phase ratio, ferrite quantification at an industrial scale represents a topic of great interest, which must be as reliable as possible and, at the same time, of fast execution. In the present
paper, different methods currently employed for ferrite estimation in DSS weldments are compared, in order to understand the limits deriving from each technique.
Keywords: Stainless Steel - Welding - Metallography - Material analysis
J. BasoniDe Pretto Industrie S.r.l.,
Via Fogazzaro 5, 36015 Schio (VI) - Italy
M. Breda, I. CalliariIndustrial Engineering Department (DII),
University of PadovaVia Gradenigo 6A, 35131 Padova – Italy
F. Toldo, C. BastianelloLaboratorio Prove Materiali San Marco
Via Lago di Alleghe, 30/32 - 36015 Schio (VI)- Italy
S. A. Ontiveros VidalInstituto Tecnológico de Saltillo,
Venustiano Carranza 24000, Tecnologico,25280 Saltillo, Coahuila de Zaragoza – Mexico
INTRODUCTION
In the biphasic austeno-ferritic stainless steels, commonly named Duplex (DSS), the presence of equal volume frac-tions of the phases provides an excellent combination of mechanical properties and corrosion resistance, especially when compared with conventional stainless steels grades [1,2]. In Off-Shore engineering, their usage permits the design of components having smaller thicknesses – and therefore lighter – without compromising the corrosion re-sistance and avoiding the employment of expensive anti-
corrosion coatings. In DSS, the balanced phase ratio can be obtained through an appropriate solution-annealing tre-atment in the temperature range 1050–1100°C followed by water quenching and, even if the 50/50 ratio is the de-sired one, phase amounts ranging from 40/60 to 60/40 are in any case accepted.However, if subjected to improper thermal cycles and especially in the temperature range 800–950°C, DSS are sensitive to secondary phases precipitation (intermetalli-cs, carbides, nitrides), which can determine drastic losses in their advantageous properties [1-8]. Therefore, the solu-tion treatment is usually performed after the forming ope-rations and, besides ensuring the achievement of the de-sired Duplex microstructure, it permits to re-dissolve any dangerous precipitate formed during the manufacturing cycle. However, weldments are not always treatable after components joining, especially when in-service operations are performed, and special care must be adopted for wel-ding purposes. In this regard, DSS must be managed as austenitic grades but using dedicated devices, avoiding the formation of undesired structures and considering that the solution-annealing treatment could not be performed when big parts are joined. After welding, DSS are required to be free from secondary phases and the austenite/ferrite volume fractions must be maintained within the desired forks, in order to guarantee the expected corrosion resistance and mechanical proper-ties. Therefore, the qualification tests require a systematic measurement of the ferrite percentage (%FE) in different parts of the joint – base material (BM), heat affected zone (HAZ) and fusion zone (FZ). The international reference

La Metallurgia Italiana - n. 4/20154
Memorie
standards assess how to evaluate %FE, but customers often necessitate dedicated procedures by adapting the standardized approach to their specific requirements. The most widely accepted international standard for phases quantification is Optical Microscopy (OM) after polishing and chemical etching, by following the provisions of ASTM E562-11 standards (manual point count), which provides information on selecting type of pattern and number of fields to be analyzed that ensure a well-defined relative accuracy. On the other hand, points counting through au-tomatic image analysis is otherwise possible, in accordan-ce with the provisions of ASTM E1245-03 standards (auto-matic image analysis). In both cases, the use of Scanning Electron Microscope (SEM) instead of OM is permitted.Phase quantification by image analysis on OM and SEM micrographs is often replaced by other simple – and faster – field-methods, among which the use of ferritoscope is the most popular. This technique is based on measuring the magnetic field generated by an induced-currents pro-be, by placing it in contact with the metal surface; since ferrite is a magnetic phase while austenite is amagnetic, this device provides %FE by measuring the magnetic re-sponse of the material. However, this method is very sen-sitive to the finishing of the contact surface and cannot be applied near edges or corners, owing to the distortion of the magnetic field. Moreover, the use of ferritoscope is li-mited to the investigation of wide areas of welds and base material, whereas HAZ is not readily controllable, due to its small size. In this method, results are given in units cal-led Ferrite Number (FN) and are automatically converted to %FE through an internal correlation.Another method for %FE determination is based on calcu-lations from phase diagrams, according to the AWS 5.4 assessments, by knowing the Cr equivalent (Creq) and Ni equivalent (Nieq) values of both base and filler materials derived from chemical analyses. A disadvantage of this method lies on the low accuracy level of the obtained va-lues, since the lines on diagrams are drawn only for some reference values and all points in between are evaluated graphically, implying many difficulties and a dependence on the adopted interpolation method. Moreover, if on one side BM and FZ compositions can be easily determined, the chemical analysis on HAZ cannot be executed, owing again to its small size.In the present paper, a comparison of the previously de-scribed method for %FE evaluation on SAF 2205 DSS wel-ded joints is reported, in terms of relative reliability and associated accuracy.
EXPERIMENTAL
The comparative study was carried out on two full-pene-tration qualification beads (Bead-1 and Bead-2), obtained by joining two types of SAF 2205 DSS (UNS S31803) base materials and adopting the same welding procedure. The base materials (compositions in Table 1) were of different manufacture, produced by traditional forging (forged ma-terial) and Hot Isostatic Pressure (HIP material), whereas the welding procedure involved the Gas Tungsten Arc Wel-ding (GTAW) process for the first passes (about 6 mm of deposited material), subsequently filled using the Shielded Metal Arc Welding (SMAW) technique.The qualification beads were prepared for metallographic investigation on a Leica DMRE OM by mechanical polishing and electrolytic etching at 5V using a solution composed of 30% NaOH in deionized water. In each sample, diffe-rent zones of the weldments were distinguished: BM (at about half thickness), upper HAZ (cover layers), lower HAZ (root layers), upper FZ and lower FZ. For the comparati-ve analysis, %FE was estimated taking into account four different methods: ASTM E562 manual counting points method using fixed parameters (magnification, grid and number of fields), ASTM E562 manual counting points me-thod using variable parameters, automatic image analysis (ASTM E562 and ASTM E1245) and manual image analysis (variable magnification). For the first three OM methods, a 500x magnification for all the investigated areas was maintained.The same zones of the weldments were observed using a Leica Cambridge Stereoscan 440 SEM operating in back-scattered-electron mode (BSE) at 29 kV; as it is known, the SEM-BSE observation allows distinguishing the micro-structural constituents according to their average atomic number and, therefore, ferrite (the lighter phase) appears darker than austenite (the heavier phase). In this case, the samples were slightly etched, in order to only better define phase boundaries, while the magnification was set as va-riable, according to the observed microstructure. For fer-rite quantification, the micrographs were edited using an image-analysis software by applying proper filters to im-prove phase contrasts and minimize grayscale threshold errors (the filtering procedure was set-up for the specific case).For the aim of the present work, %FE was also measured using a portable Fischer MP30 Ferritscope in the previou-sly defined areas, and calculated using phase diagrams (Schaeffler-Delong, ESPY and WRC-1992), after the eva-luation of the local chemical composition and considering the Creq and Nieq values.
C Si Mn Cr Ni Mo Cu P S N
forged 0.027 0.22 1.12 22.2 5.9 3.3 0.16 0.023 0.002 0.16
HIP 0.021 0.71 1.13 22.4 5.2 3.1 0.17 0.018 0.003 0.17
Table 1 – Chemical composition of the base materials [wt.%].
La Metallurgia Italiana - n. 4/2015 5
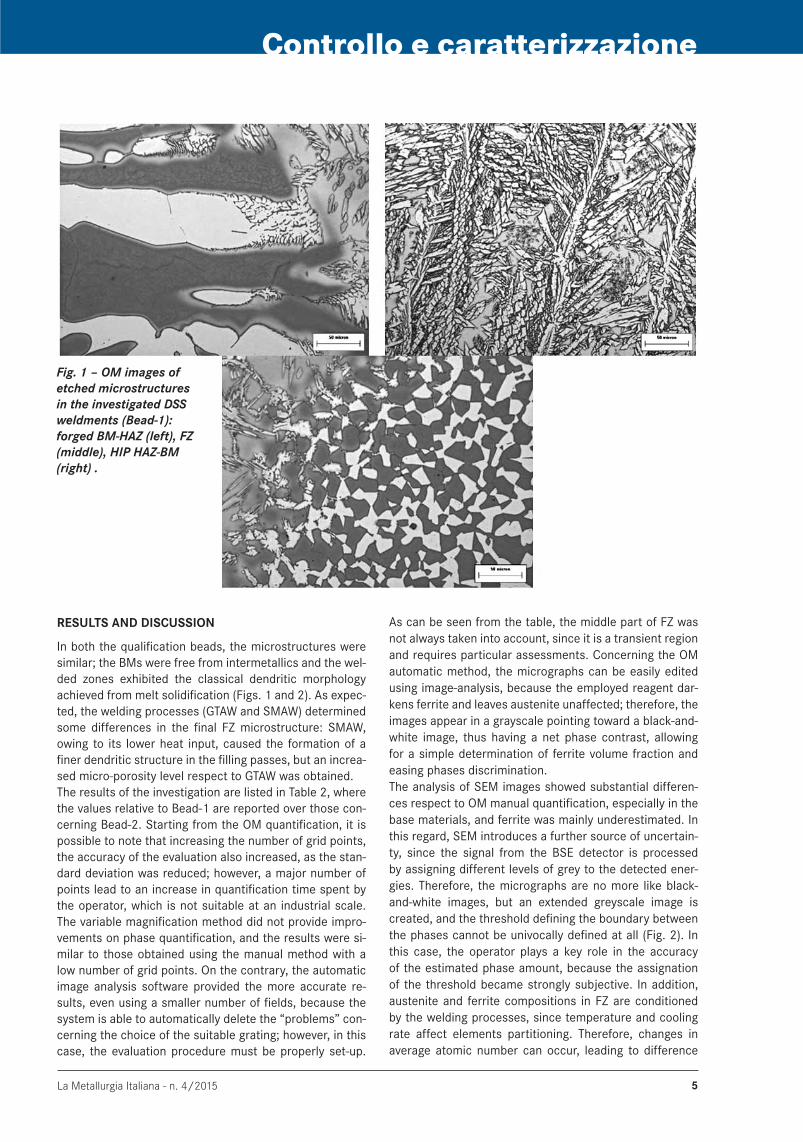
Fig. 1 – OM images of etched microstructures in the investigated DSS weldments (Bead-1):forged BM-HAZ (left), FZ (middle), HIP HAZ-BM (right) .
RESULTS AND DISCUSSION
In both the qualification beads, the microstructures were similar; the BMs were free from intermetallics and the wel-ded zones exhibited the classical dendritic morphology achieved from melt solidification (Figs. 1 and 2). As expec-ted, the welding processes (GTAW and SMAW) determined some differences in the final FZ microstructure: SMAW, owing to its lower heat input, caused the formation of a finer dendritic structure in the filling passes, but an increa-sed micro-porosity level respect to GTAW was obtained.The results of the investigation are listed in Table 2, where the values relative to Bead-1 are reported over those con-cerning Bead-2. Starting from the OM quantification, it is possible to note that increasing the number of grid points, the accuracy of the evaluation also increased, as the stan-dard deviation was reduced; however, a major number of points lead to an increase in quantification time spent by the operator, which is not suitable at an industrial scale. The variable magnification method did not provide impro-vements on phase quantification, and the results were si-milar to those obtained using the manual method with a low number of grid points. On the contrary, the automatic image analysis software provided the more accurate re-sults, even using a smaller number of fields, because the system is able to automatically delete the “problems” con-cerning the choice of the suitable grating; however, in this case, the evaluation procedure must be properly set-up.
As can be seen from the table, the middle part of FZ was not always taken into account, since it is a transient region and requires particular assessments. Concerning the OM automatic method, the micrographs can be easily edited using image-analysis, because the employed reagent dar-kens ferrite and leaves austenite unaffected; therefore, the images appear in a grayscale pointing toward a black-and-white image, thus having a net phase contrast, allowing for a simple determination of ferrite volume fraction and easing phases discrimination.The analysis of SEM images showed substantial differen-ces respect to OM manual quantification, especially in the base materials, and ferrite was mainly underestimated. In this regard, SEM introduces a further source of uncertain-ty, since the signal from the BSE detector is processed by assigning different levels of grey to the detected ener-gies. Therefore, the micrographs are no more like black-and-white images, but an extended greyscale image is created, and the threshold defining the boundary between the phases cannot be univocally defined at all (Fig. 2). In this case, the operator plays a key role in the accuracy of the estimated phase amount, because the assignation of the threshold became strongly subjective. In addition, austenite and ferrite compositions in FZ are conditioned by the welding processes, since temperature and cooling rate affect elements partitioning. Therefore, changes in average atomic number can occur, leading to difference
Controllo e caratterizzazione

La Metallurgia Italiana - n. 4/20156
Memorie
in the observed microstructure. In the present study, the quantification was slightly facilitated by the preliminary electrochemical etching, but the introduction of a large amount grayscales unavoidably leaded to an increase in estimation errors.Ferritoscope provided values that sometimes coincided and sometimes differed from those obtained through image methods; this was mainly due to the extent of the analysed volume (about 10 mm3), greater than that invol-ved using other techniques, and also to the amplification of the uncertainty in the conversion from FN to %FE. Final-ly, the values calculated from phase diagrams showed the greatest variability, which is related to the chosen method.
Method%FE (st.dev.)
Forged BM Upper HAZ Lower HAZ Upper FZ Middle FZ Lower FZ HIP BM
manual OM 16 pt. grid
(500x)
52 (12)51 (7)
60 (13)58 (8)
55 (9)57 (6)
37 (9)41 (10)
-30 (6)30 (9)
-
manual OM 96 pt. grid
(500x)
52 (5)50 (6)
61 (3)62 (4)
57 (5)58 (5)
32 (3)37 (4)
-30 (3)31 (3)
-
automatic OM
(500x)
54 (1)52 (1)
59 (1)59 (2)
60 (1)56 (2)
34 (2)38 (1)
55 (4)-
32 (2)32 (1)
33 (9)-
manual OM (var. magn.)
50 (7)56 (10)
- -36 (3)43 (5)
46 (3)37(6)
29 (4)34 (8)
56 (2)57 (2)
SEM(var. magn.)
44 (6)47 (7)
58 (7)64 (8)
59 (8)65 (9)
38 (4)43 (6)
40 (4)36 (9)
26 (5)32 (7)
49 (3)52 (2)
Ferritoscope 53 (1)58 (1)
- -37 (1)40 (2)
-32 (1)26 (1)
-
*Schaeffler 49 - -38 34
- - 49
ESPY 82 - -2825
- - 89
*WRC-1992 84 - -5651
- - 98
* Value in FN
Table 2 – Comparison of ferrite quantification methods (Bead-1 over Bead-2).
Fig. 2 – SEM images of etched microstructures (Bead-1): forged HAZ (left), upper FZ (middle), lower FZ (right).
Except for the Schaeffler-Delong diagram, the results were highly misaligned to that of OM, SEM and ferritoscope; this is intrinsically due to such diagrams, which have been developed to perform calculations on areas having a high concentrations of alloying elements, more similar to that of filler materials rather than the welded ones.
CONCLUSIONS
In the present paper, different methods currently emplo-yed for ferrite quantification in DSS weldments were com-pared, in order to understand the limits related to each technique. Analyses involving OM, SEM, ferritoscope and

La Metallurgia Italiana - n. 4/2015 7
phase diagrams were considered, and the related ferrite estimations were presented.From the results, it was revealed that OM is preferable for ferrite quantification if compared to SEM, both in base ma-terial and in the welded zone. In manual counting, several grid points must be adopted for a proper phase estimation and the uncertainty can be strongly reduced, but the in-creased counting time makes this method not readily ap-plicable when fast estimation are required. On the other hand, the automatic method provided the best results, but the procedure must be properly set-up; in this case, OM images are nearly black-and-white and, therefore, the subsequent analysis can be easily performed, since the th-reshold values are better defined and the “problems” con-cerning the choice of the suitable grating are automatically deleted by the program. On the contrary, SEM microgra-phs are grayscale images and phases quantification highly suffers from the assigned thresholds by the operator to phase boundaries. Moreover, since phases compositions are conditioned by the previous thermo-mechanical pro-cesses, difference in the observed microstructure may oc-cur by adopting the SEM-BSE observation method, owing to changes in the phase average atomic number.Finally, the investigation confirmed the low accuracy of fields-methods such as those deriving from phase dia-grams, whereas ferritoscope can be considered as an intermediate-accuracy technique, even if it requires large volumes to be measured. These methods, although simple and fast, cannot always assure a reliable ferrite quantifica-tion, owing to uncertainties intrinsic to the methods itself.
REFERENCES
[1] J. O. Nilsson. Super Duplex Stainless Steels. Mater Sci Tech 8 (1992), p. 685.
[2] R. N. Gunn. Duplex Stainless Steels: Microstructure, Properties and Applications. Abington Publishing, Cambridge, England (1997).
[3] J.O. Nilsson, A. Wilson. Influence of isothermal phase transformations on toughness and pitting corrosion of super duplex stainless steel SAF 2507. Mater Sci Tech 9 (1993), p. 545.
[4] I. Calliari, M. Zanesco, E. Ramous. Influence of isother-mal aging on secondary phases precipitation and tou-ghness of a duplex stainless steel SAF 2205. J Mater Sci 41 (2006), p. 7643.
[5] I. Calliari, G. Straffelini and E. Ramous. Investigation of secondary phase effect on 2205 DSS fracture tough-ness. Mater Sci Tech 26 (2010), p. 81.
[6] I. Calliari, M. Pellizzari and E. Ramous. Precipitation of secondary phases in super duplex stainless steel Ze-ron100 isothermally aged. Mater Sci Tech 27 (2011), p. 928.
[7] I. Calliari, M.Breda, E. Ramous, K. Brunelli, M.Pizzo, C. Menapace. Impact Toughness of an Isothermally Trea-ted Zeron®100 SDSS. J Mater Eng Perform 21 (2012), p. 2117.
[8] M. Pohl, O. Storz, Thomas Glogowski. Effect of inter-metallic precipitations on the properties of duplex stainless steel. Mater Charact 58 (2007), p. 65.
Controllo e caratterizzazione