Recurrence Quantification Analysis :Tutorial & application to eye-movement data
Recurrence Quantification Analysis for Extracting Features in Complex Systems
Satish T.S. BukkapatnamOklahoma State Universityhttp://www.okstate.edu/ceat/[email protected]
INFORMS 2004

2
AgendaIntroduction
Sensor-based Modeling
Problem Motivation and Background
Research Methodology
Implementation and Results
Summary, Benefits and Future Directions
3
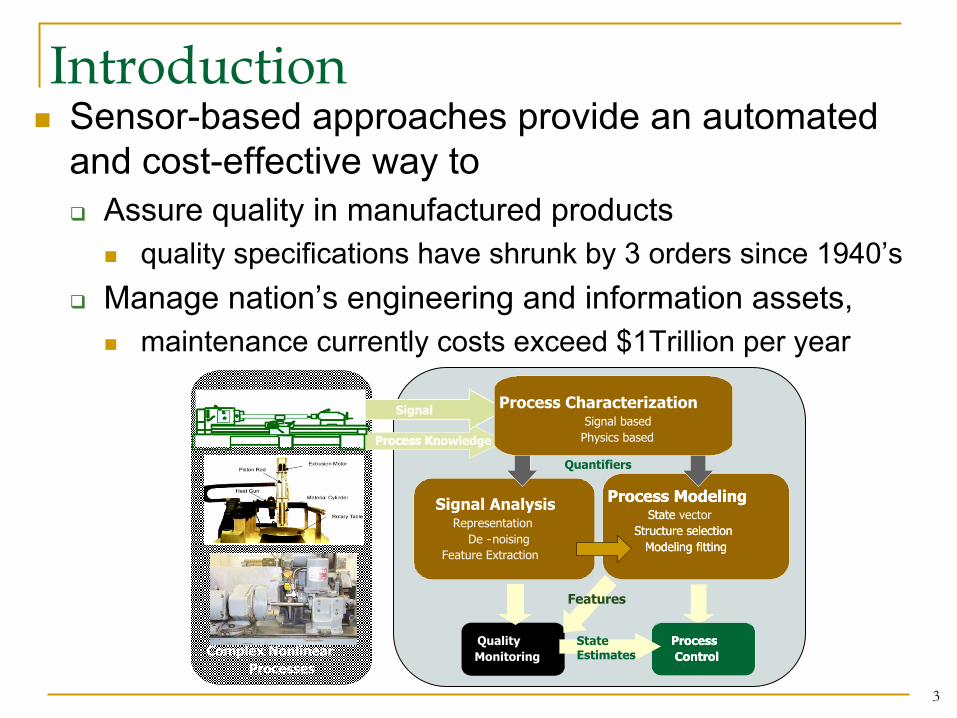
IntroductionSensor-based approaches provide an automated and cost-effective way to
Assure quality in manufactured productsquality specifications have shrunk by 3 orders since 1940’s
Manage nation’s engineering and information assets,maintenance currently costs exceed $1Trillion per year
Signal AnalysisRepresentation
De -noisingFeature Extraction
Process ModelingState vector
Structure selectionModeling fitting
Quality Monitoring
Process Control
Process Kn.
Signal
Process Knowledge
-
Process ModelingState
Structure selectionModeling fitting
Process ControlComplex Nonlinear
Processes
Process CharacterizationSignal based
Physics based
Quantifiers
Features
State Estimates

4
On-line Quality and Integrity MonitoringReal-world systems including various manufacturing machines and processes are complex
Nonlinear stochastic dynamicsnonstationarity, bursts and intermittencies in sensor data
Models and Representations capturing this complexity are imperative for effective monitoring and control
0 0.5 1 1.5 2 2.5 3 3.5 4
x 10-3
-1.5
-1
-0.5
0
0.5
1
1.5x 10
4
Acoustic Emissionfrom High-precision Machining
Vibration Time-Series fromGrinding Processesat Honeywell
Aggregate Network Packet TrafficTime-series
Optical profilometerdata of wire-saw cut silicon wafer surface from Siemens

5
Sensor-based Modeling ResearchAugments the statistical and qualitative reasoning foundations of conventional monitoring technologies with nonlinear dynamic systems theoryCaptures this complex process dynamics from sensor signals in the form of
Customized multi-scale representations and Formal nonlinear stochastic differential/difference equation (n-SDE) models
Statistics Qualitative Reasoning
Nonlinear Dynamic SystemsApplications
Traditional and Emerging Manufacturing Machines and ProcessesProcess stability, Degradation, Product surface monitoring
Structural health monitoring, Network traffic monitoring, Dynamics characterization

7
Agenda
Introduction
Problem Motivation & BackgroundChallenges to Quality and Integrity Monitoring
Attractor based Approaches
Research Methodology
Results and Discussion
Summary

8
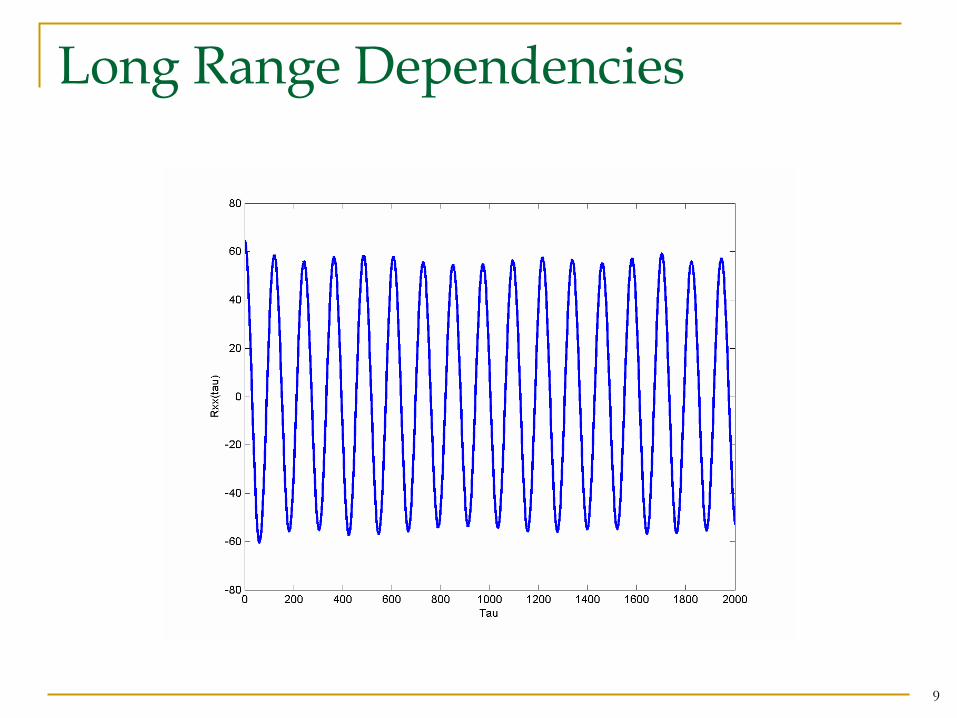
Sensor-data CharacteristicsNonstationary
Strong bursts
Continuous band of frequencies
Classical time-series models and signal representations not adequate
9
Long Range Dependencies
10
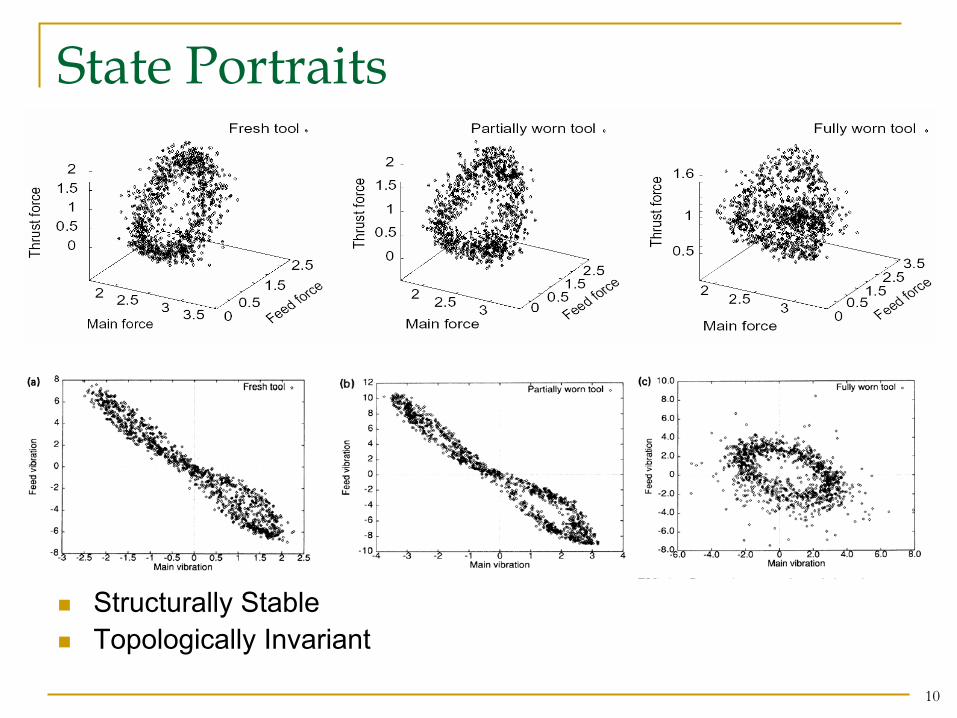
State Portraits
Structurally StableTopologically Invariant

11
Time Delay Plots
Ceramic tool, 100 Cr-Mo 6 Steel, Sampling rate: 40 MHz
AE Signals Lag = 4Accelerometer signals Lag = 2
12
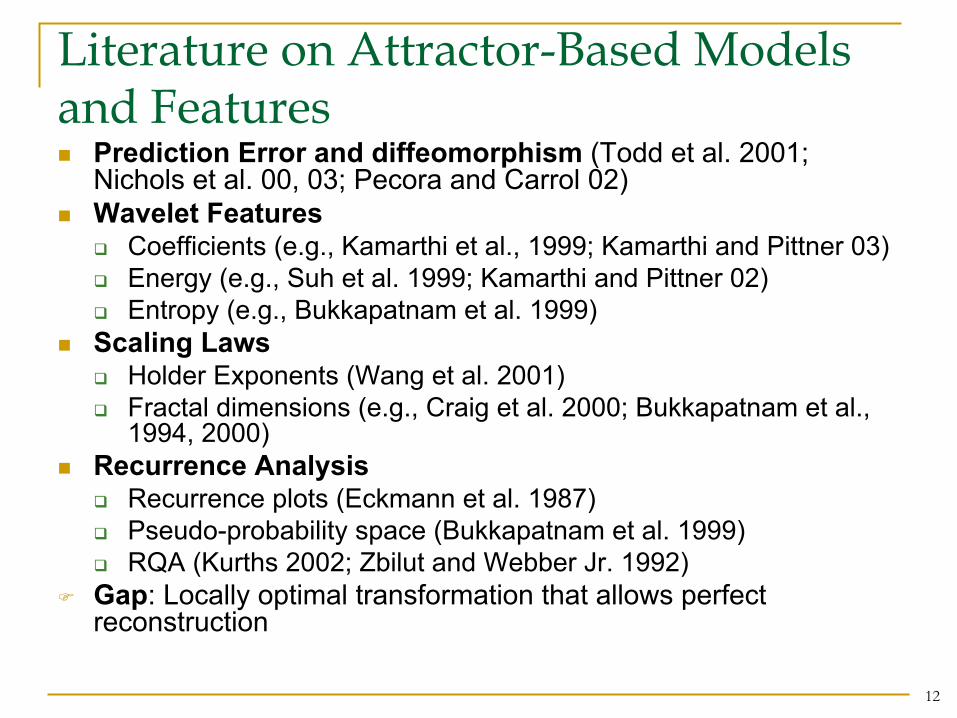
Literature on Attractor-Based Models and Features
Prediction Error and diffeomorphism (Todd et al. 2001; Nichols et al. 00, 03; Pecora and Carrol 02)Wavelet Features
Coefficients (e.g., Kamarthi et al., 1999; Kamarthi and Pittner 03)Energy (e.g., Suh et al. 1999; Kamarthi and Pittner 02)Entropy (e.g., Bukkapatnam et al. 1999)
Scaling LawsHolder Exponents (Wang et al. 2001)Fractal dimensions (e.g., Craig et al. 2000; Bukkapatnam et al.,1994, 2000)
Recurrence AnalysisRecurrence plots (Eckmann et al. 1987)Pseudo-probability space (Bukkapatnam et al. 1999)RQA (Kurths 2002; Zbilut and Webber Jr. 1992)
Gap: Locally optimal transformation that allows perfect reconstruction

13
Agenda
Introduction
Problem Motivation & Background
Research MethodologyRecurrence Quantification
Ensemble Extraction
Results and Discussion
Summary

14
Properties of Signals y(t)Emanates from an (chaotic) attractor ALet x(t) = f(x(0), t) a.s, be process trajectory
y(t) is a measurement of x(t) with x(0) ∈ A
Theorem: If ζ(t) ∈ A are reconstructed from lags of y(t), a diffeomorphism exists between A and observable subspace of A
15
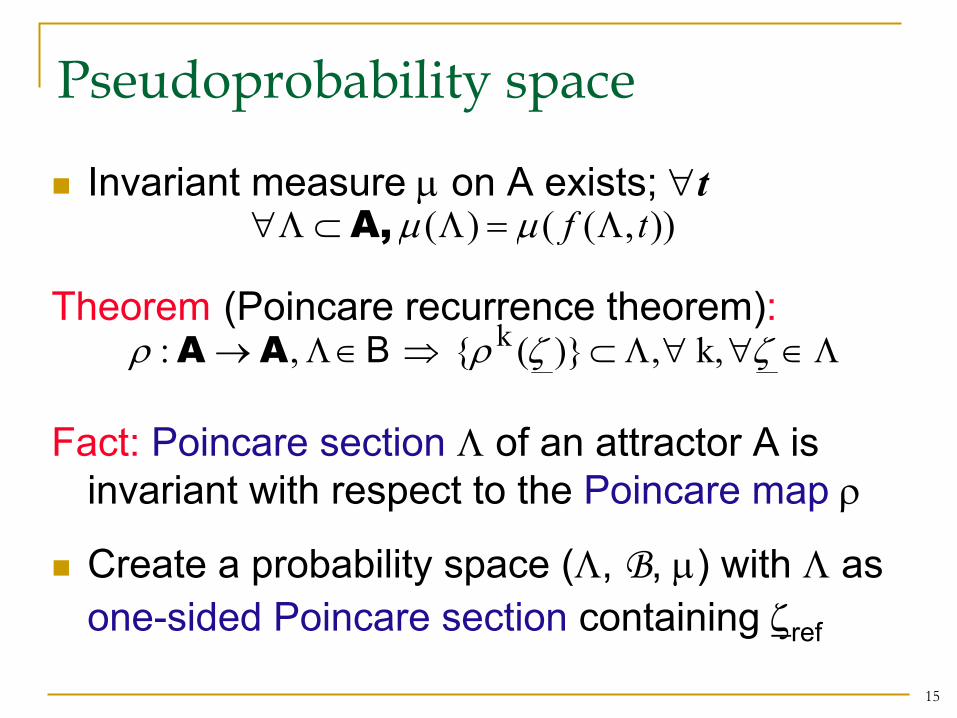
Pseudoprobability space
Invariant measure µ on A exists; ∀t
Theorem (Poincare recurrence theorem):
Fact: Poincare section Λ of an attractor A is invariant with respect to the Poincare map ρ
Create a probability space (Λ, B, µ) with Λ as one-sided Poincare section containing ζref
Λ∈∀∀Λ⊂⇒∈Λ→ ζζρρ k, ,)}({ ,: k BAA
)),(()( tf Λ=Λ⊂Λ∀ µµA,

16
Poincare section

17
Artificial ensemblesLocal evolutions from neighborhood of yref are independent realizations
18
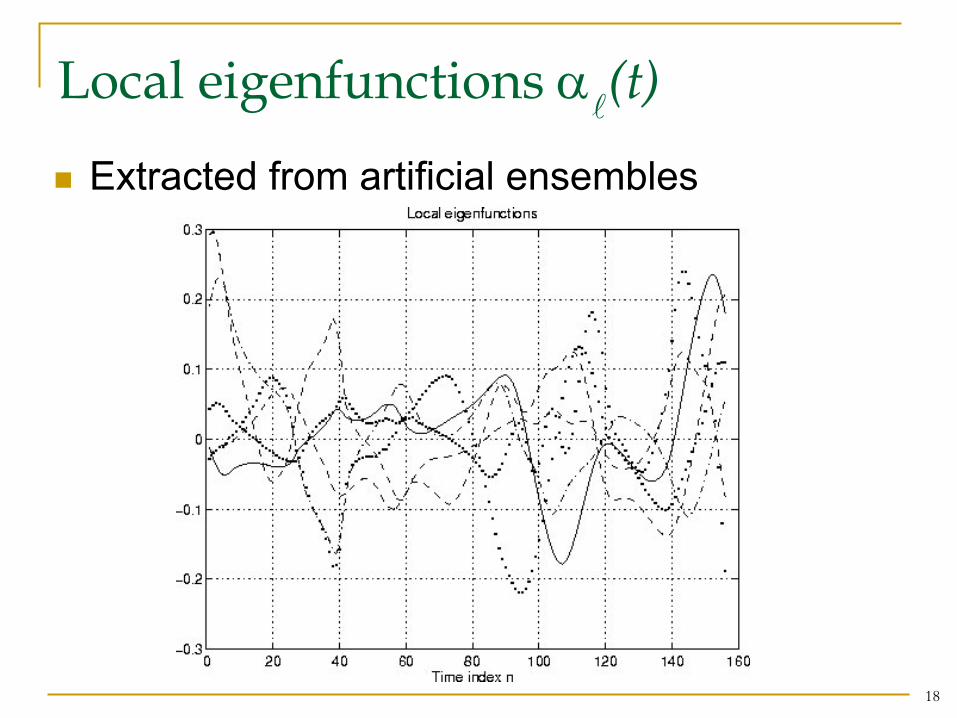
Local eigenfunctions αl(t)
Extracted from artificial ensembles
19
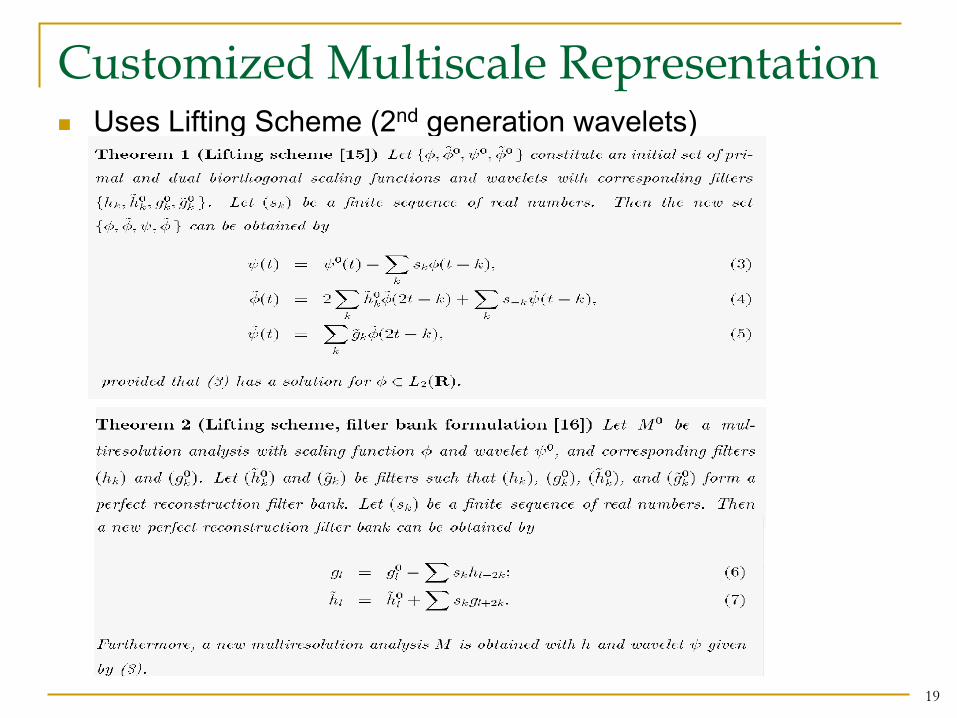
Customized Multiscale RepresentationUses Lifting Scheme (2nd generation wavelets)
20
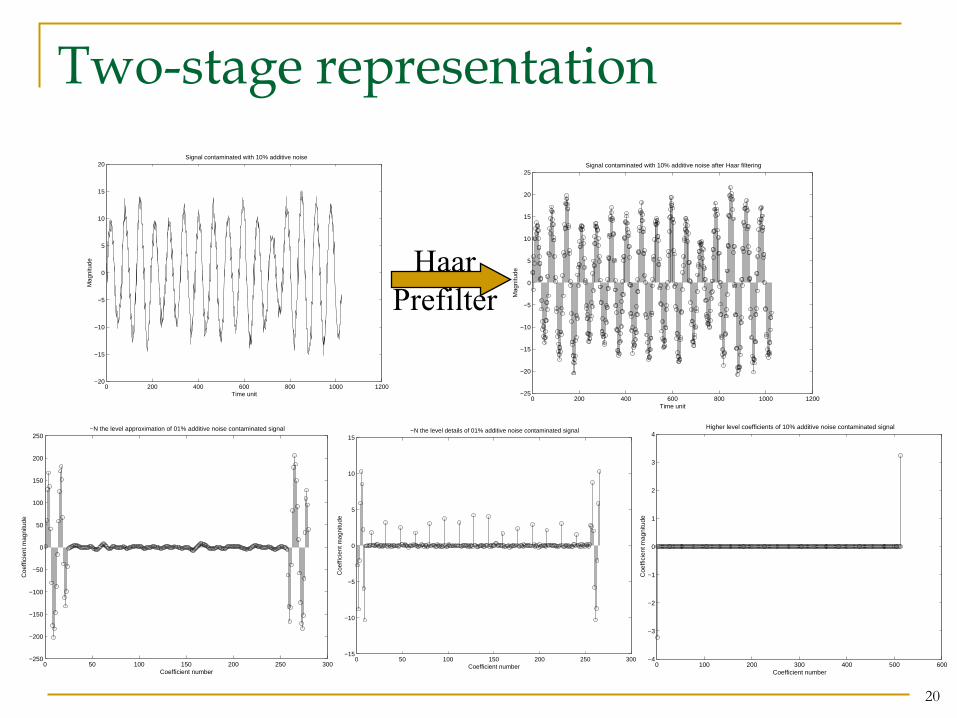
Two-stage representation
0 200 400 600 800 1000 1200−20
−15
−10
−5
0
5
10
15
20Signal contaminated with 10% additive noise
Time unit
Mag
nitu
de
0 200 400 600 800 1000 1200−25
−20
−15
−10
−5
0
5
10
15
20
25Signal contaminated with 10% additive noise after Haar filtering
Time unit
Mag
nitu
de
0 50 100 150 200 250 300−250
−200
−150
−100
−50
0
50
100
150
200
250−N the level approximation of 01% additive noise contaminated signal
Coefficient number
Coe
ffici
ent m
agni
tude
0 100 200 300 400 500 600−4
−3
−2
−1
0
1
2
3
4Higher level coefficients of 10% additive noise contaminated signal
Coefficient number
Coe
ffici
ent m
agni
tude
HaarPrefilter
0 50 100 150 200 250 300−15
−10
−5
0
5
10
15−N the level details of 01% additive noise contaminated signal
Coefficient number
Coe
ffici
ent m
agni
tude
21
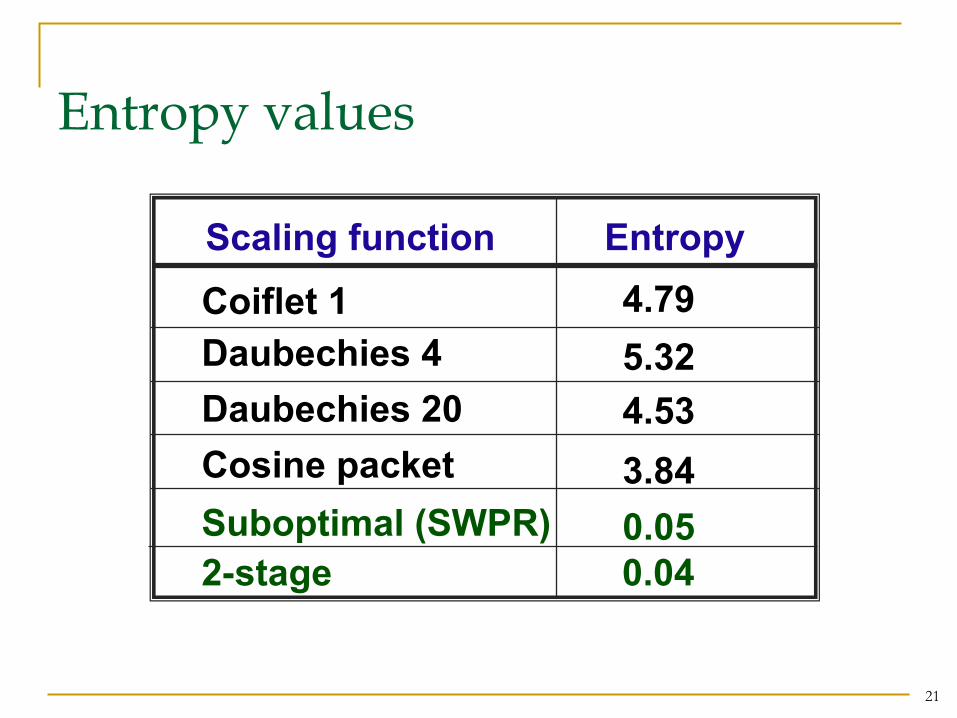
Entropy values
Scaling function EntropyCoiflet 1Daubechies 4Daubechies 20Cosine packetSuboptimal (SWPR)
4.795.324.533.840.05
2-stage 0.04

22
Further Improvement
Different strands have different local evolution patterns

23
Research ApproachStrandlets: Piecewise eigen representation
Recurrence Plot RQA
Local PCA
Characteristic Signal Strand for Lifting
Signal with Bursts
24
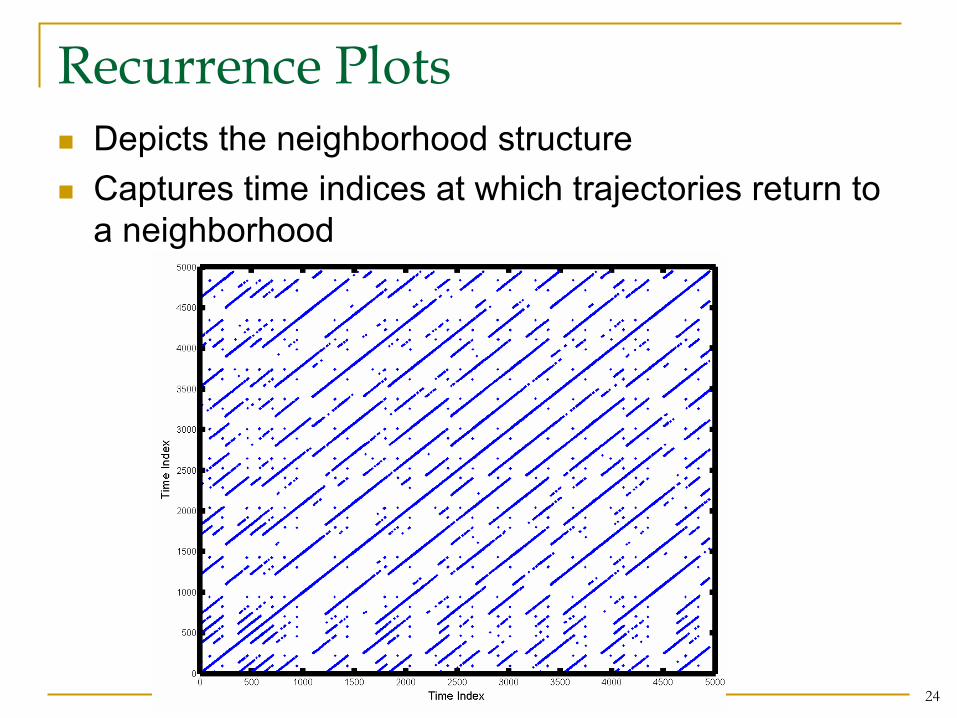
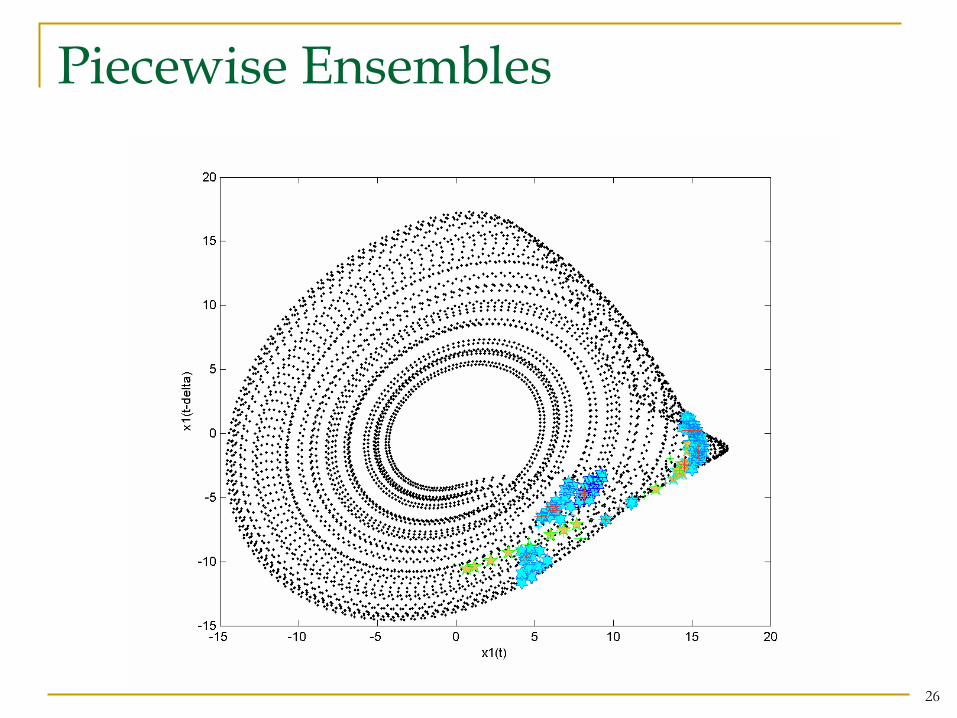
Recurrence PlotsDepicts the neighborhood structureCaptures time indices at which trajectories return to a neighborhood
25
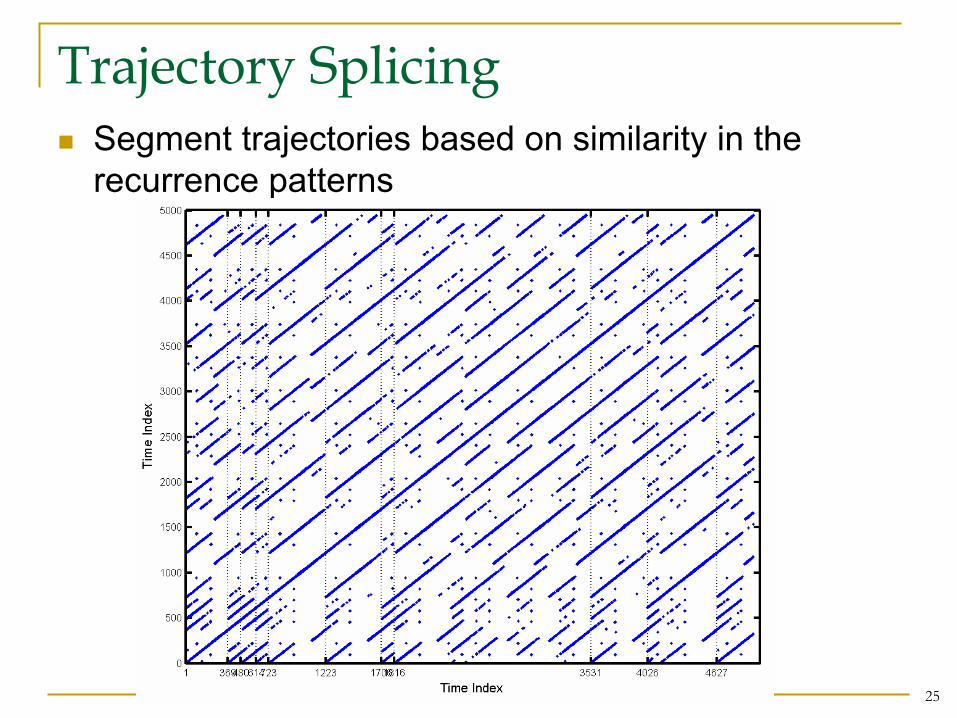
Trajectory SplicingSegment trajectories based on similarity in the recurrence patterns
26
Piecewise Ensembles

27
Piecewise Eigenfunctions
Capture the basic shape of the trajectory

28
Noise Reduction Result50-80% reduction in noise
Green line: Noisy trajectoryBlue line: Nominal trajectoryRed line: Recurrence-based De-noised trajectory

29
Results Under 30% Noise Contamination
Can blindly track the process (attractor)Knowledge of the noise-free trajectory is not necessary
30
Contributions
Theoretical contributionsNew approach to represent signals from nonlinear systemsOperationalization of recurrence concept
Contributions to practiceNew methods to reduce noise from signals when the process dynamics is unknownFeatures sensitive to local variations
31
Extensions Planned
Strandlet extraction from lifting piecewise eigenfunctionsImprovements in pattern matching methods to select strands
32
ApplicationsQuality monitoring in manufacturing machines and processes
Process TypeTraditional Manufacturing ProcessesEmerging Manufacturing Processes
AnomalyMacroscopic stability analysis using vibration sensor dataMicroscopic stability analysis using Acoustic EmissionMacroscopic quality product variability analysis
Integrity monitoring and coordination of infrastructure and lifeline systems
Structural SystemsLarge structural sensor networksSmart material and structural systems
Large-Scale NetworksCommunication networksTransportation and supply networks
33
Summary and Acknowledgments
Enhance current quality monitoring and improvement practice through a rigorous use of information from electro-vibro-photo-acoustic sensors
Use process physics and sensor data to optimize/adjust settingsFounded on Dynamic Systems, Statistics and Qualitative Reasoning foundations
Sponsors of this research thus far:National Science Foundation (NSF)Office of Naval Research (ONR)HoneywellHewlett PackardNational InstrumentsFordCaltrans
34
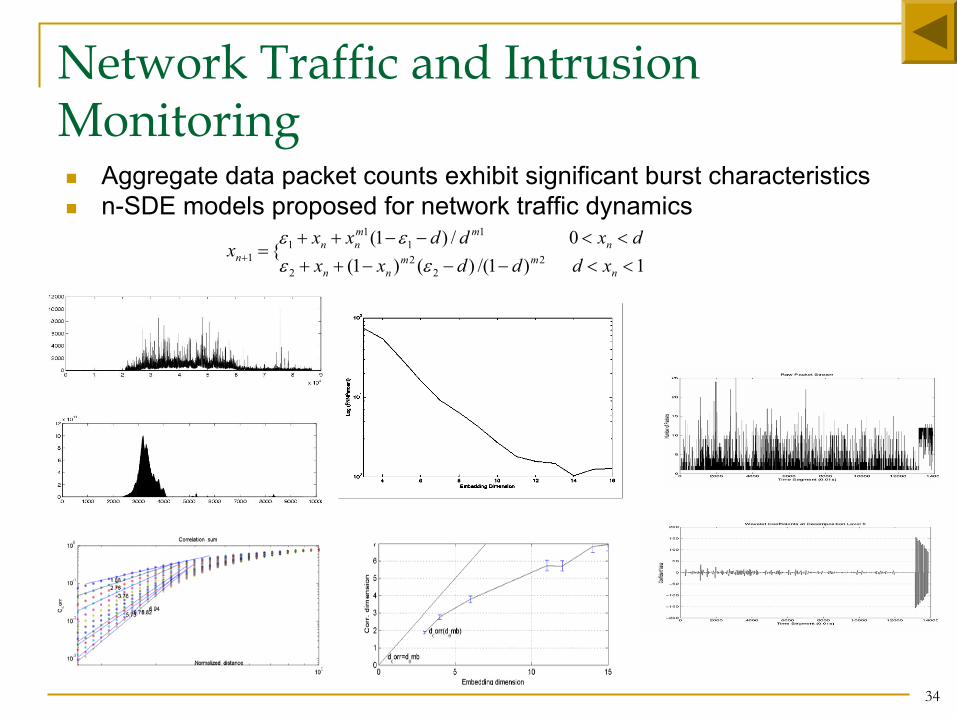
Network Traffic and Intrusion Monitoring
Aggregate data packet counts exhibit significant burst characteristicsn-SDE models proposed for network traffic dynamics
1)1/()()1(0/)1(
{ 22
22
11
11
1 <<−−−++<<−−++
=+n
mmnn
nmm
nnn xdddxx
dxddxxx
εεεε
35
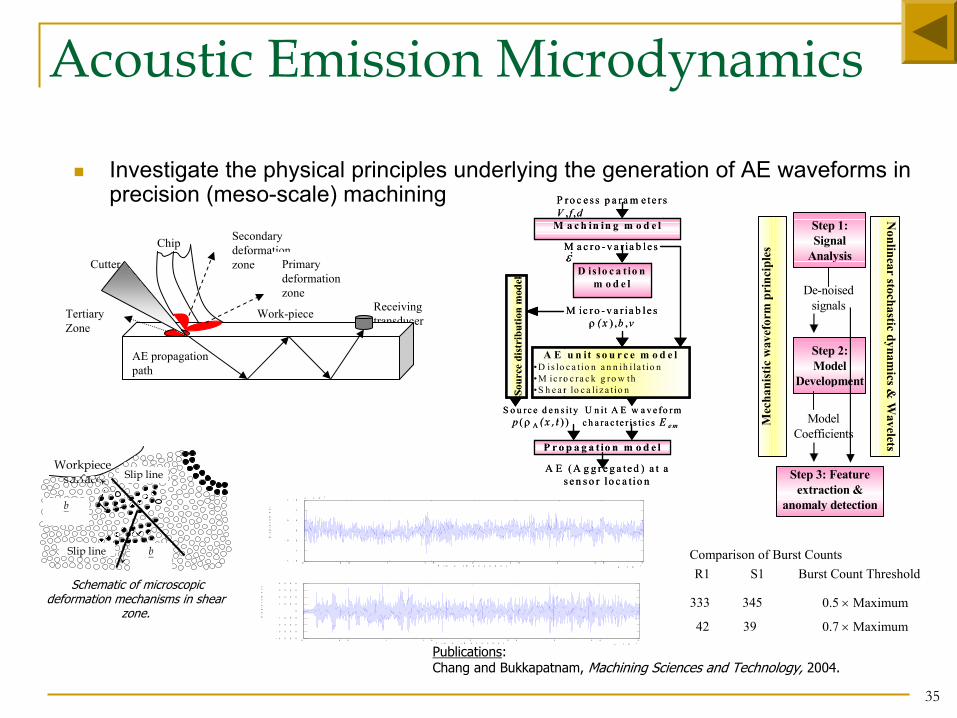
Investigate the physical principles underlying the generation of AE waveforms in precision (meso-scale) machining
M a c h in in g m o d e l
D is lo c a t io n m o d e l
P r o p a g a t io n m o d e l
ε&
M ic ro - v a r ia b l e sρ (x ) ,b ,v
M a c ro - v a r ia b l e s
P ro c e s s p a ra m e te r sV , f ,d
U n it A E w a v e fo r m c h a ra c te r is t ic s E e m
S o u rc e d e n s i t yp (ρ Α (x ,t ) )
A E (A g g r e g a te d ) a t a s e n s o r lo c a tio n
Sour
ce d
istr
ibut
ion
mod
el
A E u n it s o u r c e m o d e l•D is lo c a t io n a n n ih i la t io n•M ic ro c ra c k g ro w th•S h e a r lo c a liz a t io n
Workpiecesurface
Slip line
b
b
Slip line
Schematic of microscopic deformation mechanisms in shear
zone.
Work-piece under cutting
Chip
Receiving transducer
Cutter
Secondary deformation zone Primary
deformation zone
AE propagation path
Tertiary Zone
Model Coefficients
Step 1: Signal
Analysis
Mec
hani
stic
wav
efor
m p
rinc
iple
s
Step 2: Model
Development
Nonlinear stochastic dynam
ics & W
avelets
De-noised signals
Step 3: Feature extraction &
anomaly detection
0 0 . 5 1 1 . 5 2 2 . 5 3 3 . 5 4
x 1 0- 3
- 1 . 5
- 1
- 0 . 5
0
0 . 5
1
1 . 5x 1 0
4
T i m e ( S e c o n d s )
Dis
pla
ce
me
nt
0 0 . 5 1 1 . 5 2 2 . 5 3 3 . 5 4
x 1 0- 3
- 4 0 0 0
- 3 0 0 0
- 2 0 0 0
- 1 0 0 0
0
1 0 0 0
2 0 0 0
3 0 0 0
4 0 0 0
T i m e ( S e c o n d s )
Di
sp
la
ce
me
nt
Comparison of Burst CountsR1 S1 Burst Count Threshold
0.5 × Maximum
0.7 × Maximum
345333
3942
Acoustic Emission Microdynamics
Publications:Chang and Bukkapatnam, Machining Sciences and Technology, 2004.

36
Stability and Chatter in Machining of Plate Structures
Simulation and Experimental studyConsider coupled dynamics of tool and workpieceImpact at the beginning and end of cut and tool wear
Milling, Drilling and Turning Configurations
Table
Spindle
Tool
Workpiece
Amplifier
Accelerometer
X
Yx 0x
0y
y
O
φ
Ad
Workpiece
Tool
Publications: Bukkapatnam et al., ASME Transactions JMSE, 1999Bukkapatnam et al., Physical Review, 1995 Bukkapatnam et al., CIRP Mfg. Systems, 1999Bukkapatnam and Fofana, FAIM 2000 Bukkapatnam et al., ASME Transactions JDMC, 2000
0
0.5
1
1.5
22.5
33.5
4
4.5
0 1 2 3 4 5 6 7 8
width of cut, w (in 10^-3 m)
num
ber o
f tee
th, N
Stable N=2Stable to Finite Amplitude N=2
Unstable N=2Stable N=4
Stable to Finite Amplitude N=4Unstable N=4
0
0.2
0.4
0.6
0.8
1
1.2
35 40 45 50
Length of tool, l (in 10^-3 m)
Wid
th o
f cut
, w (i
n 10
^-3
m)
Stable
Unstable

37
CC Quality Monitoring
To detect anomalies in extrusion-based processes
Process Modeling
Quantitative Characterization
Qualitative Characterization
Lumped System Model Synthesis
Model-based Monitoring
Signal Analysis
Feature Extraction
and Anomaly Detection
Signals
Process physics
On-line SignalS
)()1( 21 tFxyxkxcx xxx =++++ αα&&& (1a)
)()1( 21 tFyyxkycy yyy =++++ ββ&&& (1b)
/fb bF Ve Dµ=
2 /MVMV rF Dπ= Τ
( )y V B fb MVF t F F F F= = + +)VbhVb(VF reeB ξγρ −= −1 2
)(0 Ttyyhh −−+=
)2
(4 2
2y
D
b
DV rfe
e &+=ωπ
γ
Filament
DriveWheels
ExtrudedMaterial
HeatingElements
Nozzle
NozzleBarrel
Platform
Velocity profile during extrusion
Side view
Front view
Side
tro
wel
Top trowel
Velocity profile after extrusion
z
x
z
y
Velocity profile during extrusion
Side view
Front view
Side
tro
wel
Top trowel
Velocity profile after extrusion
z
x
z
y
Fy(t)
mFx(t)
kcc
k
x
x. y y
.
Modeling
Results
Publications:Kwon, Bukkapatnam, Khoshnevis, Saito, Rapid Prototyping, 2002Bukkapatnam and Clark, ASME Transactions 2003 (under review)

38
NDE & Health MonitoringApplications to health monitoring and NDE
Incipient damage detection in connected structuresEffective features for damage/anomaly detection, e.g., Wavelet distortion energy, fractal quantifiersShown to be better than conventional modal analysis
Sensor-based Modeling
Dat
a A
cqui
sitio
n Computational Models and Relations from Literature
Characterization (Qualitative and Quantitative)
Signal Analysis Formal Modeling
Feature Extraction
Damage Detection and Location
Distortion Energy & basis functions Model Coefficients
Model Structures Quantifiers
Dat
a
Con
ditio
ned
sign
als
Instrumented Complex Structure
Publications:Bukkapatnam et al., SHM Journal, 2004
0”
2/16”
3/16”

39
Flank wear estimation
•••°°
Signalrepresentation
Signalseparation
Featureextraction
Flank wear measurements
Signalrepresentation
Signalseparation
Featureextraction
Fractalestimator
Offlinetraining
Onlineestimation
AE signalestimator
Over 90% accuracy in estimating flank wear in turning process(MSE < 0.0012 in)