Company Update November 2019 Post-ID - Leggett & Platt
29
Company Update November 2019 LEG (NYSE) www.leggett.com Statements in this presentation that are not historical in nature are “forward-looking.” These statements are identified either by their context or by use of words such as “anticipate,” “believe,” “estimate,” “expect,” “forecasted,” “intend,” “may,” “plan,” “should” or the like. All such forward-looking statements are expressly qualified by the cautionary statements described in this provision. We do not have, and do not undertake, any duty to update any forward-looking statement. Forward-looking statements should not be relied upon as a prediction of actual future events or results. Any forward- looking statement reflects only the beliefs of Leggett at the time the statement is made. All forward- looking statements are subject to risks and uncertainties which might cause actual events or results to differ materially from the forward-looking statements. Some of these risks and uncertainties include: uncertainty of the financial performance, including sales and sales growth; the Company’s and ECS’s ability to achieve their respective operating targets; projections of Company sales, earnings, EBIT margin, depreciation and amortization, capital expenditures, dividends, cash from operations, net interest expense, tax rate and diluted shares; price and product competition, the amount of share repurchases, demand for the Company's products, cost and availability of raw materials and labor, fuel and energy costs, general economic conditions, possible goodwill or asset impairment, anticipated restructuring-related costs, foreign currency fluctuation, cash repatriation, litigation risks and other risk factors in Leggett’s most recent Form 10-K and subsequent Form 10- Qs. Unless we indicate otherwise, we base the information concerning our markets/industry contained herein on our general knowledge of and expectations concerning those markets/industry, on data from various industry analyses, on our internal research, and on adjustments and assumptions that we believe to be reasonable. However, we have not independently verified data from market/industry analyses and cannot guarantee their accuracy or completeness. 2 Forward-Looking Statements
Transcript of Company Update November 2019 Post-ID - Leggett & Platt

Company UpdateNovember 2019
LEG (NYSE)www.leggett.com
Statements in this presentation that are not historical in nature are “forward-looking.” Thesestatements are identified either by their context or by use of words such as “anticipate,” “believe,”“estimate,” “expect,” “forecasted,” “intend,” “may,” “plan,” “should” or the like. All such forward-lookingstatements are expressly qualified by the cautionary statements described in this provision. We donot have, and do not undertake, any duty to update any forward-looking statement. Forward-lookingstatements should not be relied upon as a prediction of actual future events or results. Any forward-looking statement reflects only the beliefs of Leggett at the time the statement is made. All forward-looking statements are subject to risks and uncertainties which might cause actual events or resultsto differ materially from the forward-looking statements. Some of these risks and uncertaintiesinclude: uncertainty of the financial performance, including sales and sales growth; the Company’sand ECS’s ability to achieve their respective operating targets; projections of Company sales,earnings, EBIT margin, depreciation and amortization, capital expenditures, dividends, cash fromoperations, net interest expense, tax rate and diluted shares; price and product competition, theamount of share repurchases, demand for the Company's products, cost and availability of rawmaterials and labor, fuel and energy costs, general economic conditions, possible goodwill or assetimpairment, anticipated restructuring-related costs, foreign currency fluctuation, cash repatriation,litigation risks and other risk factors in Leggett’s most recent Form 10-K and subsequent Form 10-Qs. Unless we indicate otherwise, we base the information concerning our markets/industrycontained herein on our general knowledge of and expectations concerning those markets/industry,on data from various industry analyses, on our internal research, and on adjustments andassumptions that we believe to be reasonable. However, we have not independently verified datafrom market/industry analyses and cannot guarantee their accuracy or completeness.
2
Forward-Looking Statements

TSR Focused Mid-Cap Manufacturer
Targeting Total Shareholder Return in top third of S&P 500
~3% dividend yield; 48 consecutive annual increases
Strong balance sheet and cash flow
Leader in most markets; few large competitors
Poised for continued growth Internal initiatives + market growth + acquisitions
Management has “skin in the game” Significant stock owners; forego comp in exchange for shares Incentive comp aligned with TSR focus
⅓
3
Our Markets
U.S.67%
Europe11%
China10%
Canada6%
Others6%
Geographic Split1
(based on production)
Automotive17%
Aerospace3%
Hydraulic Cylinders2%
Work Furniture6%
Home Furniture8%
Flooring & Textiles17%
Bedding47%
Product Mix2
Consumer Durables
55%
Commercial/Industrial
25%
Automotive20%
Macro Market Exposure
1 Based on Leggett’s 2018 sales + ECS’s calendar year 2018 sales 2 Operating groups adjusted to reflect Jan 1, 2020 modified structure; %’s based on 2019 estimated sales
4
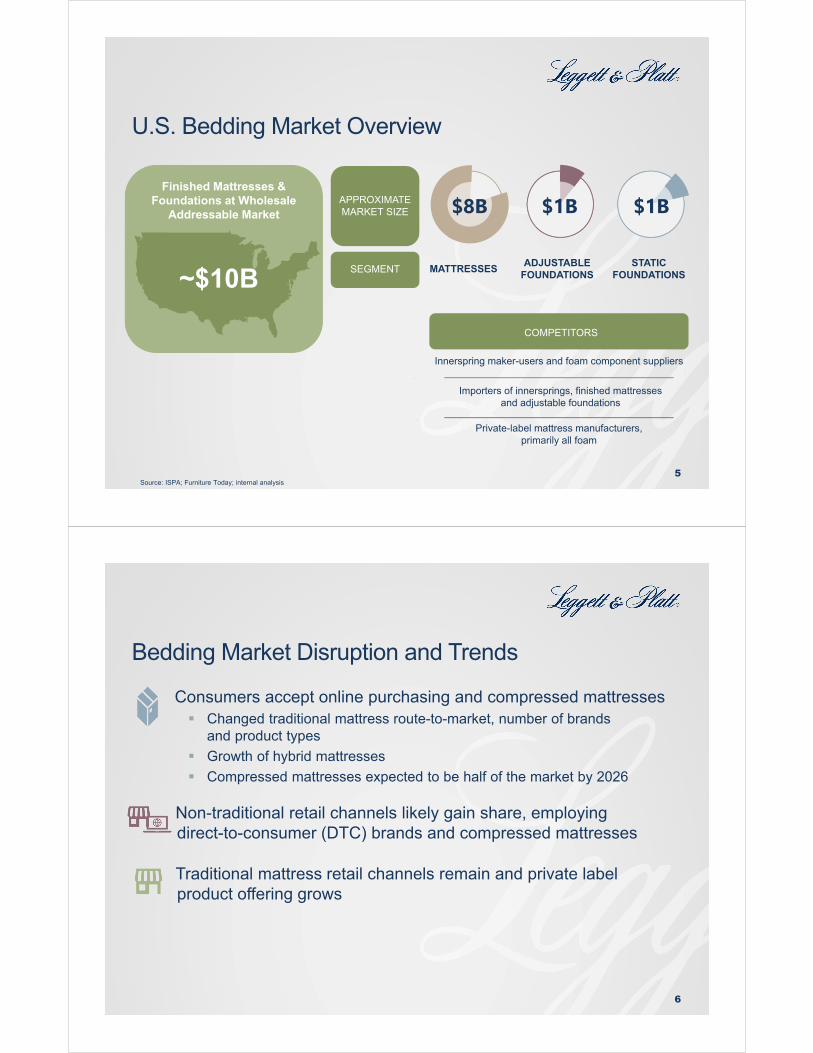
U.S. Bedding Market Overview
$8B
MATTRESSES
Innerspring maker-users and foam component suppliers
ADJUSTABLEFOUNDATIONS
COMPETITORS
SEGMENT
APPROXIMATE MARKET SIZE
Finished Mattresses & Foundations at Wholesale
Addressable Market
STATICFOUNDATIONS
$1B $1B
~$10B
Source: ISPA; Furniture Today; internal analysis
Importers of innersprings, finished mattresses and adjustable foundations
Private-label mattress manufacturers, primarily all foam
5
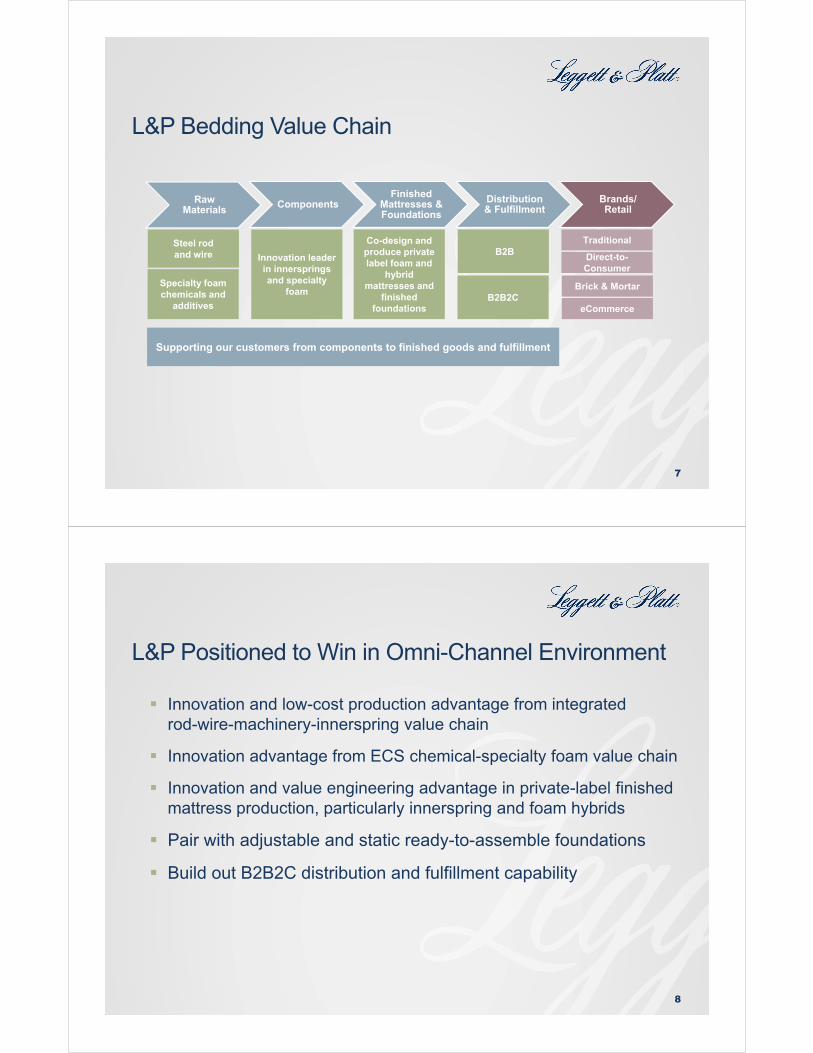
Bedding Market Disruption and Trends
6
Consumers accept online purchasing and compressed mattresses Changed traditional mattress route-to-market, number of brands
and product types
Growth of hybrid mattresses
Compressed mattresses expected to be half of the market by 2026
Non-traditional retail channels likely gain share, employing direct-to-consumer (DTC) brands and compressed mattresses
Traditional mattress retail channels remain and private label product offering grows
L&P Bedding Value Chain
7
Raw Materials
ComponentsFinished
Mattresses & Foundations
Distribution & Fulfillment
Brands/Retail
Steel rod and wire Innovation leader
in innersprings and specialty
foam
Co-design and produce private label foam and
hybrid mattresses and
finished foundations
B2B
Specialty foam chemicals and
additivesB2B2C
Traditional
Direct-to-Consumer
Brick & Mortar
eCommerce
Supporting our customers from components to finished goods and fulfillment
L&P Positioned to Win in Omni-Channel Environment
8
Innovation and low-cost production advantage from integrated rod-wire-machinery-innerspring value chain
Innovation advantage from ECS chemical-specialty foam value chain
Innovation and value engineering advantage in private-label finished mattress production, particularly innerspring and foam hybrids
Pair with adjustable and static ready-to-assemble foundations
Build out B2B2C distribution and fulfillment capability
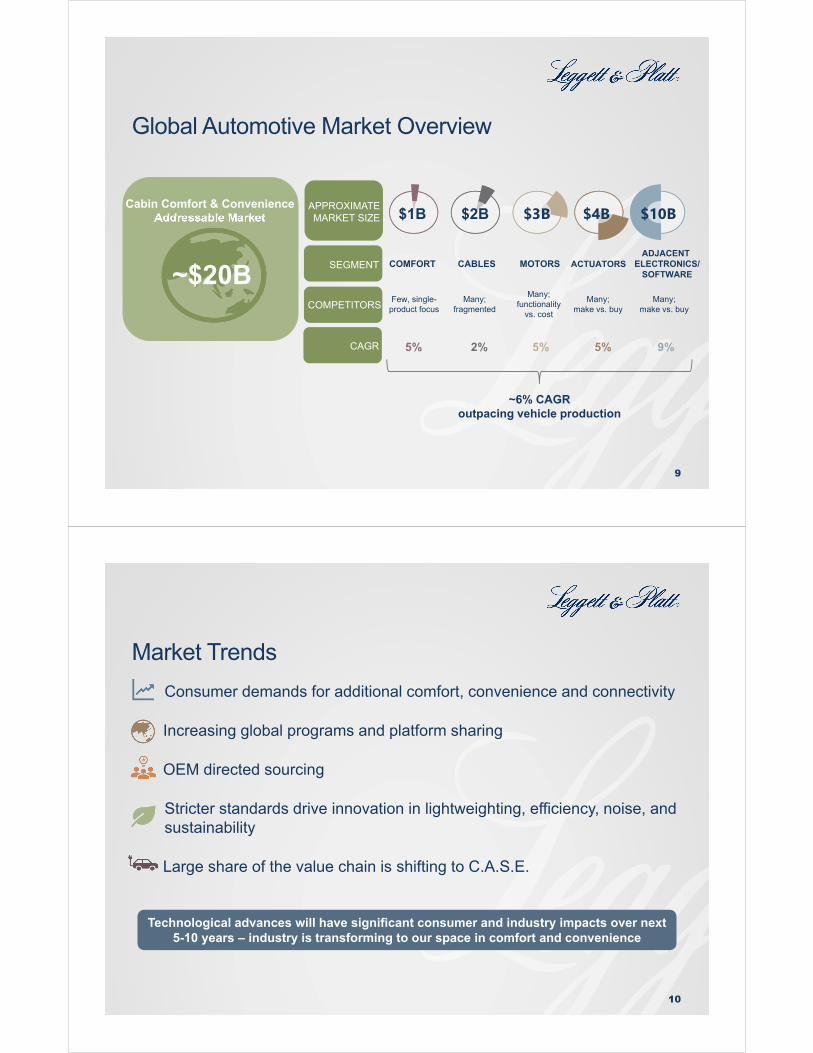
Global Automotive Market Overview
9
CAGR
COMPETITORS
SEGMENT
APPROXIMATE MARKET SIZE
Cabin Comfort & Convenience Addressable Market
~$20B
$3B$2B$1B
COMFORT
Few, single-product focus
Many; fragmented
CABLES ACTUATORSADJACENT
ELECTRONICS/SOFTWARE
Many;make vs. buy
5% 2% 5% 5%
MOTORS
Many; functionality
vs. cost
$4B
Many;make vs. buy
$10B
9%
~6% CAGRoutpacing vehicle production
Market Trends
10
Consumer demands for additional comfort, convenience and connectivity
Increasing global programs and platform sharing
OEM directed sourcing
Stricter standards drive innovation in lightweighting, efficiency, noise, and sustainability
Large share of the value chain is shifting to C.A.S.E.
Technological advances will have significant consumer and industry impacts over next 5-10 years – industry is transforming to our space in comfort and convenience
Trends Play to our Strengths
11
CCONNECTED
AAUTONOMOUS
SSHARED
EELECTRIFICATION
Vertical IntegrationBrand Reputation in Comfort Products
Intellectual Property/ Trade Secrets
Flexible Global Manufacturing
Advantages Are Rooted In Our Deep Industry Knowledge And Customer Engagement
Long-term growth above
industry production
Share leader in
targeted segments
Share leader in fast growing SUV and CUV
segments
Positioned for growthin convenience and
adjacent electronics/software
applications
The most complete seat
comfort subsystem supplier
The Results
12
Slide intentionally bank

TSR Framework &Financial Priorities
TSR in Top Third of S&P 500
14
Revenue Growth
Target: 6–9% annually
Margin Improvement
Growth in attractive markets, product
development, cost savings, efficiency
improvements
Dividend Yield
Payout target: ~50% of earnings
Stock Buybacks
With available cash
SO
UR
CE
S
Total Shareholder Return = (∆ Stock Price + Dividends) / Initial Price
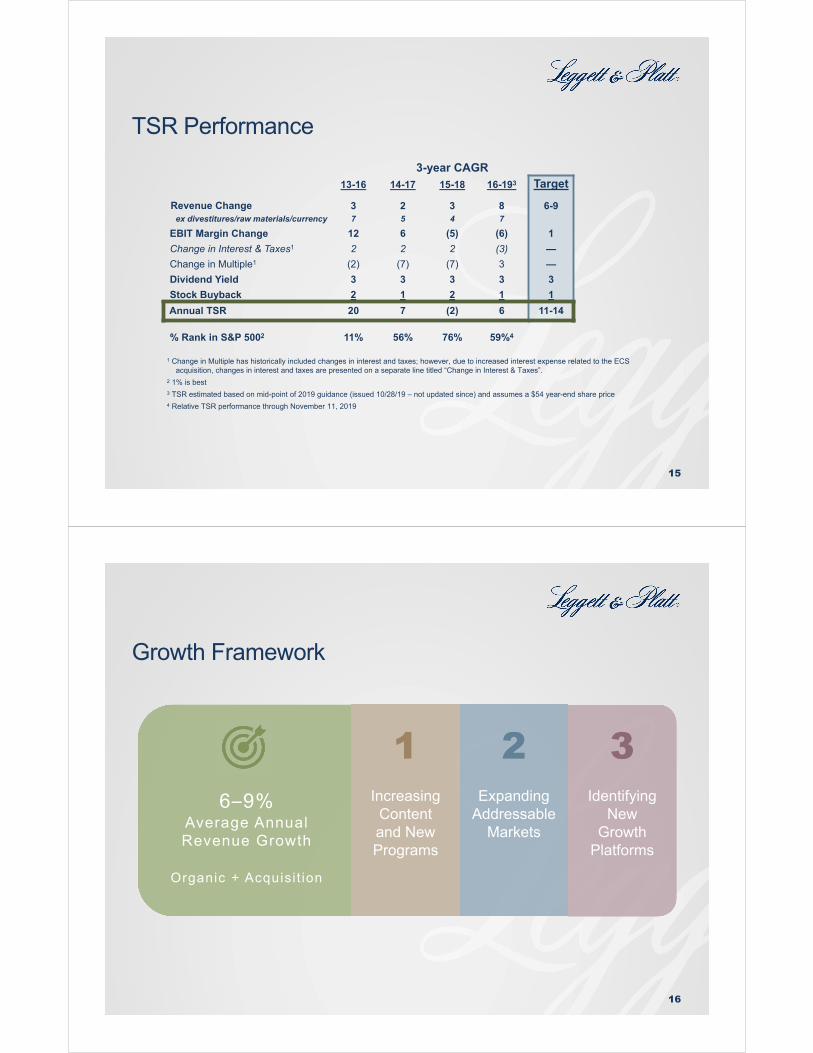
3-year CAGR
13-16 14-17 15-18 16-193 Target
Revenue Change 3 2 3 8 6-9ex divestitures/raw materials/currency 7 5 4 7
EBIT Margin Change 12 6 (5) (6) 1
Change in Interest & Taxes1 2 2 2 (3) —
Change in Multiple1 (2) (7) (7) 3 —
Dividend Yield 3 3 3 3 3
Stock Buyback 2 1 2 1 1
Annual TSR 20 7 (2) 6 11-14
% Rank in S&P 5002 11% 56% 76% 59%4
1 Change in Multiple has historically included changes in interest and taxes; however, due to increased interest expense related to the ECS acquisition, changes in interest and taxes are presented on a separate line titled “Change in Interest & Taxes”.
2 1% is best3 TSR estimated based on mid-point of 2019 guidance (issued 10/28/19 – not updated since) and assumes a $54 year-end share price4 Relative TSR performance through November 11, 2019
TSR Performance
15
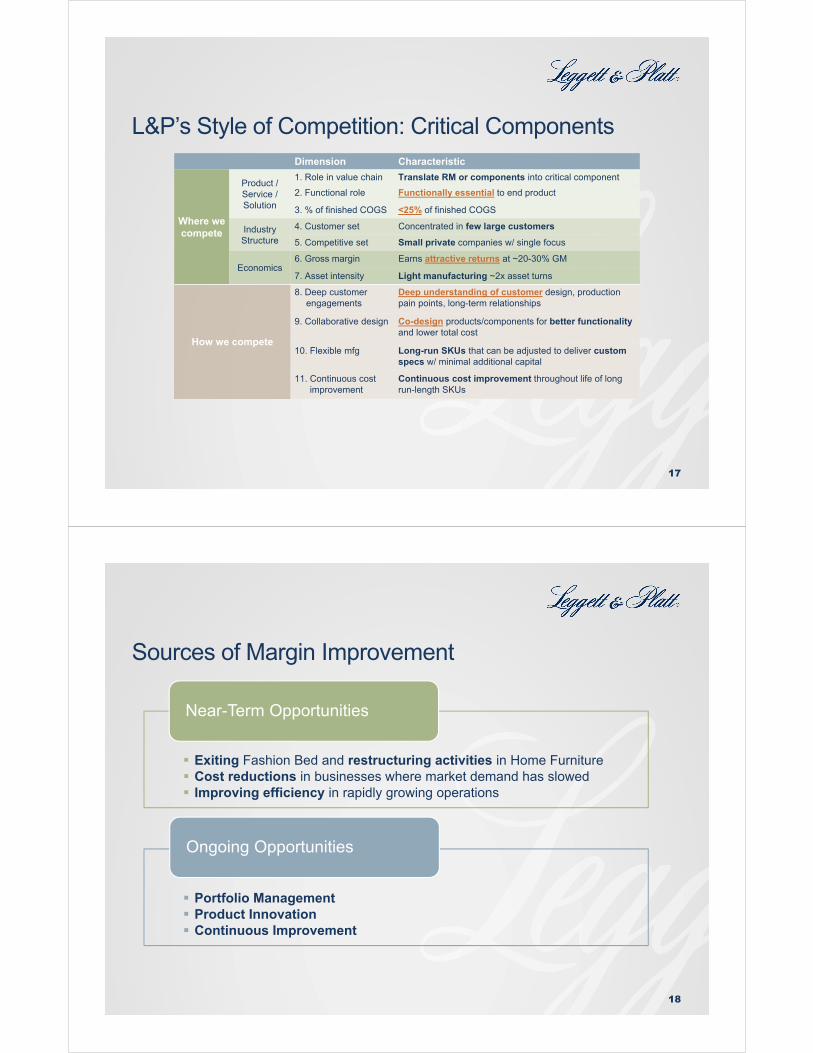
Growth Framework
16
6–9%Average Annual Revenue Growth
Organic + Acquisi t ion
Increasing Content and New Programs
ExpandingAddressable
Markets
Identifying New
Growth Platforms
1 2 3
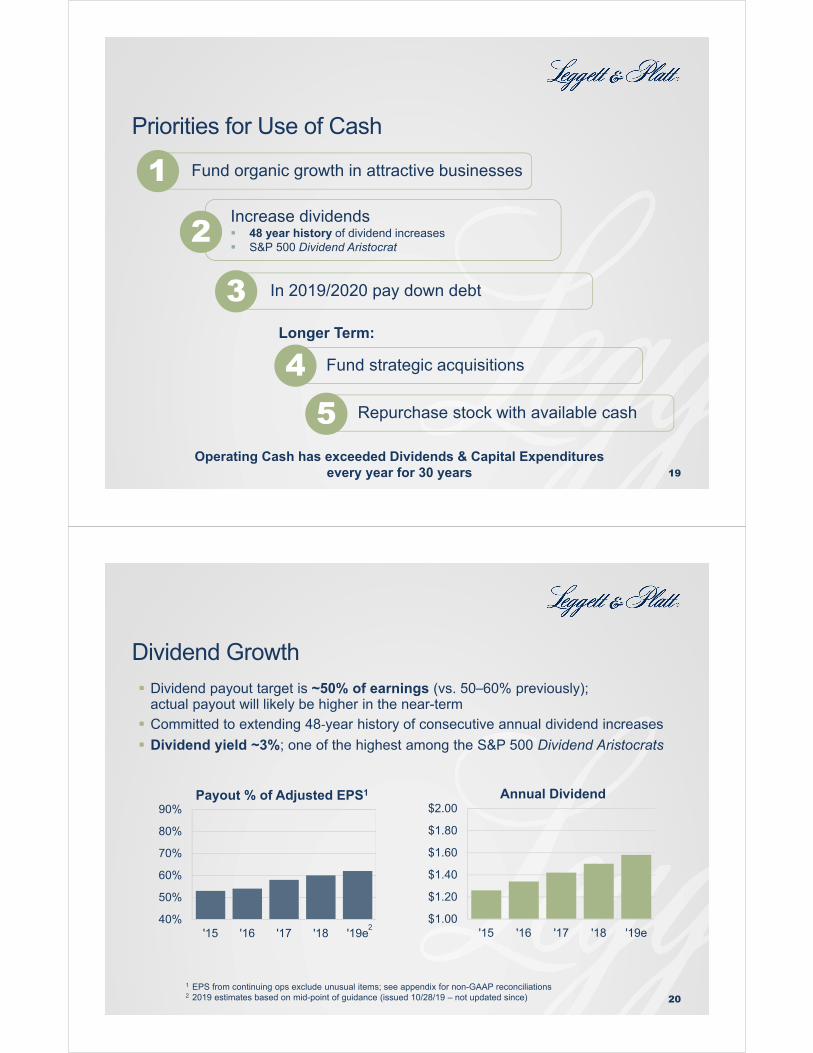
L&P’s Style of Competition: Critical Components
17
Dimension Characteristic
Where we compete
Product /Service /Solution
1. Role in value chain Translate RM or components into critical component
2. Functional role Functionally essential to end product
3. % of finished COGS <25% of finished COGS
IndustryStructure
4. Customer set Concentrated in few large customers
5. Competitive set Small private companies w/ single focus
Economics6. Gross margin Earns attractive returns at ~20-30% GM
7. Asset intensity Light manufacturing ~2x asset turns
How we compete
8. Deep customer engagements
Deep understanding of customer design, production pain points, long-term relationships
9. Collaborative design Co-design products/components for better functionality and lower total cost
10. Flexible mfg Long-run SKUs that can be adjusted to deliver custom specs w/ minimal additional capital
11. Continuous cost improvement
Continuous cost improvement throughout life of long run-length SKUs
Sources of Margin Improvement
18
Exiting Fashion Bed and restructuring activities in Home Furniture Cost reductions in businesses where market demand has slowed Improving efficiency in rapidly growing operations
Near-Term Opportunities
Portfolio Management Product Innovation Continuous Improvement
Ongoing Opportunities
Priorities for Use of Cash
19
Fund organic growth in attractive businesses1Increase dividends 48 year history of dividend increases S&P 500 Dividend Aristocrat
2
In 2019/2020 pay down debt
Fund strategic acquisitions
Repurchase stock with available cash
Longer Term:
3
45
Operating Cash has exceeded Dividends & Capital Expenditures every year for 30 years
Dividend Growth
20
Dividend payout target is ~50% of earnings (vs. 50–60% previously); actual payout will likely be higher in the near-term
Committed to extending 48‐year history of consecutive annual dividend increases
Dividend yield ~3%; one of the highest among the S&P 500 Dividend Aristocrats
40%
50%
60%
70%
80%
90%
'15 '16 '17 '18 '19e
Payout % of Adjusted EPS1
2$1.00
$1.20
$1.40
$1.60
$1.80
$2.00
'15 '16 '17 '18 '19e
Annual Dividend
1 EPS from continuing ops exclude unusual items; see appendix for non-GAAP reconciliations2 2019 estimates based on mid-point of guidance (issued 10/28/19 – not updated since)
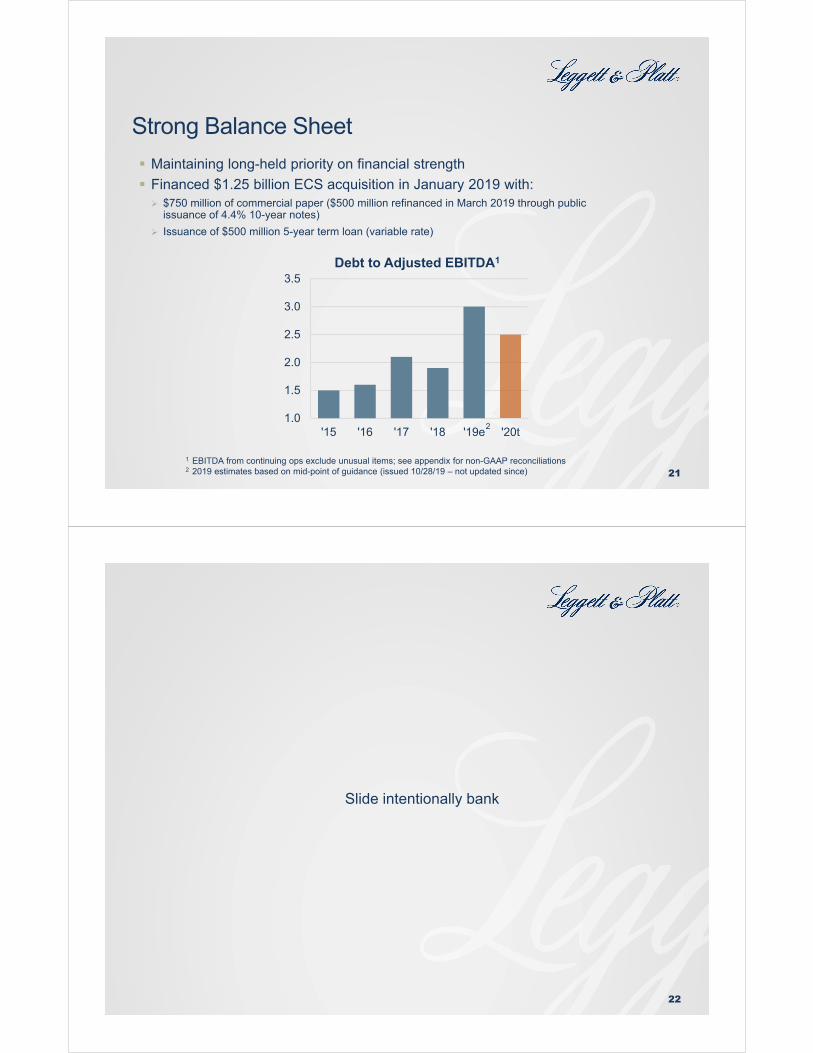
Strong Balance Sheet
21
Maintaining long-held priority on financial strength
Financed $1.25 billion ECS acquisition in January 2019 with: $750 million of commercial paper ($500 million refinanced in March 2019 through public
issuance of 4.4% 10-year notes)
Issuance of $500 million 5-year term loan (variable rate)
1.0
1.5
2.0
2.5
3.0
3.5
'15 '16 '17 '18 '19e '20t
Debt to Adjusted EBITDA1
2
1 EBITDA from continuing ops exclude unusual items; see appendix for non-GAAP reconciliations2 2019 estimates based on mid-point of guidance (issued 10/28/19 – not updated since)
22
Slide intentionally bank
Current Topics
Q3 2019 Highlights
24
Sales of $1.24 billion, up 14% Acquisitions (primarily ECS) added 16% to sales growth
Organic sales were down 2%
• Volume down 1% (4% from exited business)
Absent declines from exited business, volume up 3%
• Raw material-related pricing and currency impact decreased sales 1%
Adj. EPS1 of $.76, up vs. adj. EPS of $.66 in Q3‐18
Adj. EBIT1 of $144 million, up $24 million vs. Q3-18
Adj. EBIT1 margin of 11.9% vs. 11.4% in Q3-18
Cash from operations of $213 million, vs. $127 million in Q3-18
Debt to LEG & ECS 12-month pro forma adj. EBITDA1 of 3.15x (target is ~2.5x)
1 See appendix for non-GAAP reconciliations

2019 Guidance (issued 10/28/19 – not updated since)
25
Adj. EPS raised to $2.48–$2.63 (vs. prior range of $2.40–$2.63) Excludes expected restructuring-related charges of $.08
Sales guidance narrowed to $4.7–$4.8 billion (vs. prior range of $4.7–$4.85 billion); 10–12% growth vs. 2018 Organic sales expected to decline -3% to -5%; including -3% from exited business
in Fashion Bed and Home Furniture
Acquisitions should add 15%
Implied adjusted EBIT margin of 11.0–11.3%
Operating cash expected to exceed $550 million
Macro Indicators
26
Consumer confidence More crucial than home sales since majority (~2/3rds) of
bedding/furniture purchases are replacement of existing product
“Large ticket” purchases that are deferrable
Total housing turnover Combination of new and existing homes sales
Employment levels
Consumer discretionary spending
Interest rate levels
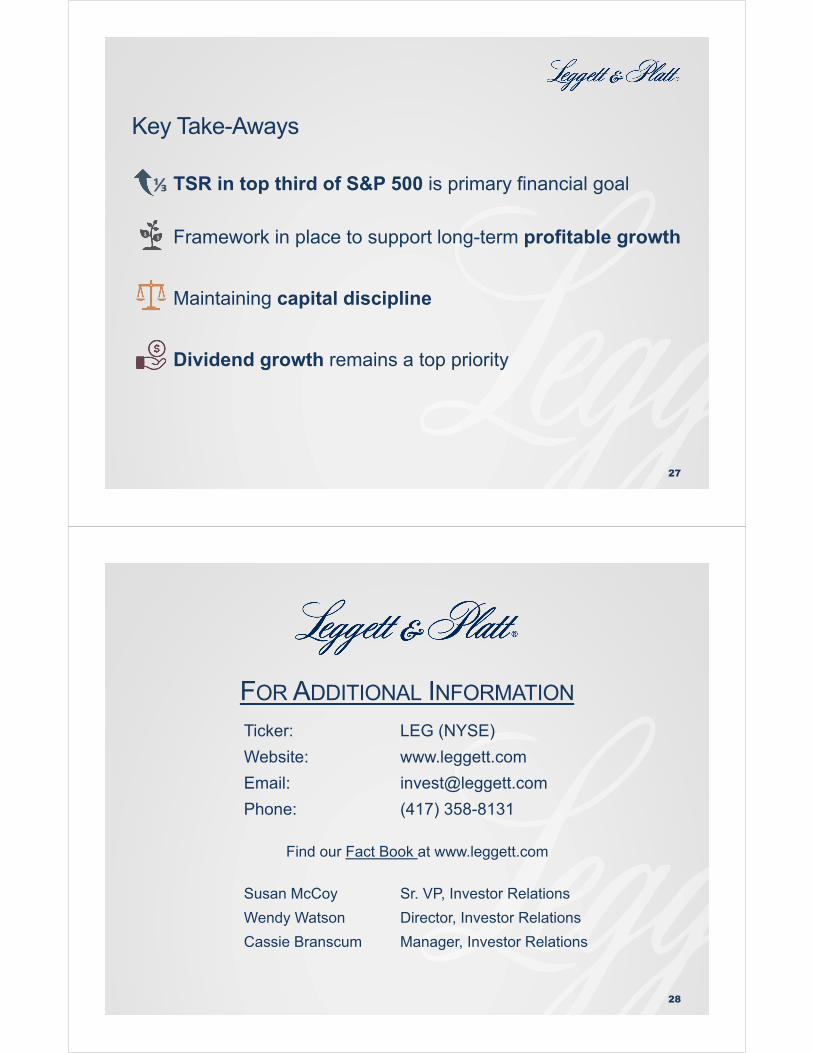
Key Take-Aways
27
TSR in top third of S&P 500 is primary financial goal
Framework in place to support long-term profitable growth
Maintaining capital discipline
Dividend growth remains a top priority
⅓
$$
28
FOR ADDITIONAL INFORMATION
Ticker: LEG (NYSE)
Website: www.leggett.com
Email: [email protected]
Phone: (417) 358-8131
Find our Fact Book at www.leggett.com
Susan McCoy Sr. VP, Investor Relations
Wendy Watson Director, Investor Relations
Cassie Branscum Manager, Investor Relations
Additional Information
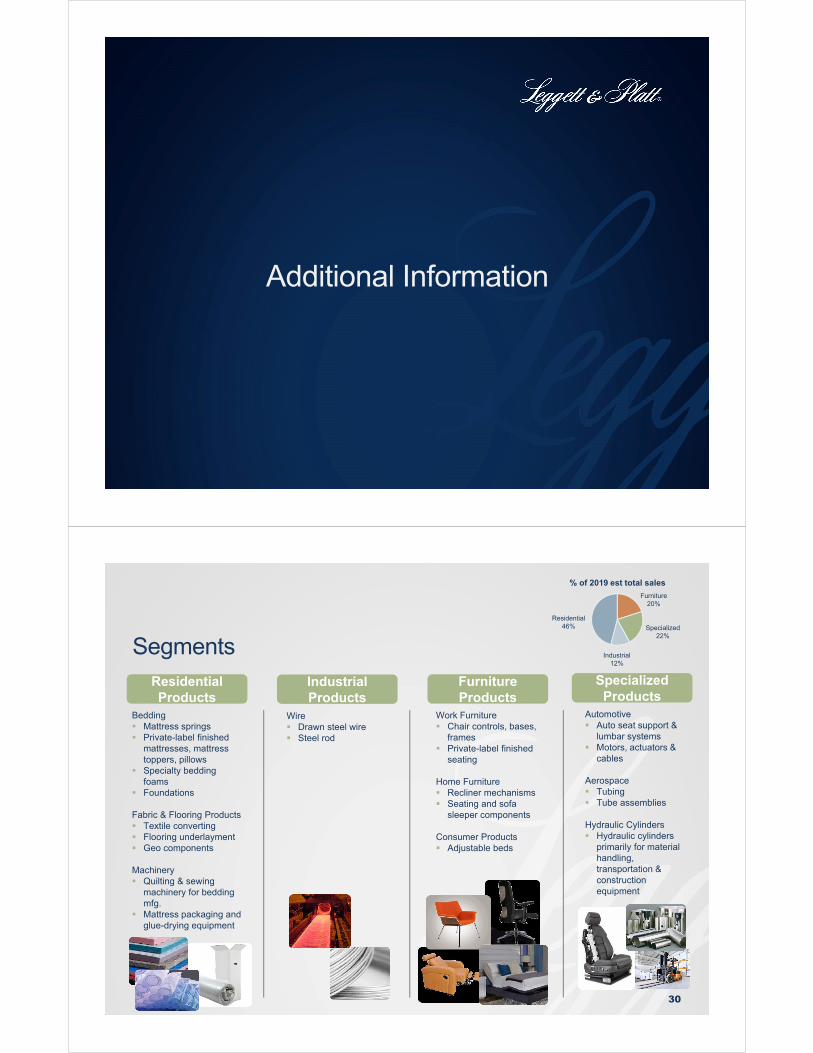
Segments
30
ResidentialProducts
IndustrialProducts
Furniture Products
Specialized Products
Bedding Mattress springs Private-label finished
mattresses, mattress toppers, pillows
Specialty bedding foams
Foundations
Fabric & Flooring Products Textile converting Flooring underlayment Geo components
Machinery Quilting & sewing
machinery for bedding mfg.
Mattress packaging and glue-drying equipment
Work Furniture Chair controls, bases,
frames Private-label finished
seating
Home Furniture Recliner mechanisms Seating and sofa
sleeper components
Consumer Products Adjustable beds
Wire Drawn steel wire Steel rod
Automotive Auto seat support &
lumbar systems Motors, actuators &
cables
Aerospace Tubing Tube assemblies
Hydraulic Cylinders Hydraulic cylinders
primarily for material handling, transportation & construction equipment
Residential46%
Furniture20%
Specialized22%
Industrial12%
% of 2019 est total sales
Customers Include
31
In North America:Adient HNI Mattress Firm Tempur SealyAshley Furniture JLG (Oshkosh) MCF TeslaBest Home Furniture Knoll Rooms-to-Go Toyota BoshokuBerkshire Hathaway La-Z-Boy Sanyo Toyota Industrial EquipCasper Lear Serta Tuft & NeedleEaton Lincoln Electric Simmons United TechnologiesHaworth Lowe’s Sleep Number WalmartHerman Miller Magna Steelcase Wayfair
In Europe and Asia:Dreams Hay Kuka Silentnight BedsEurasia Hilding Anders Natuzzi SteinhoffFaurecia Himolla Nestledown VolkswagenFritz Hansen Howe Profim
Diverse Customer Base – Low Concentration
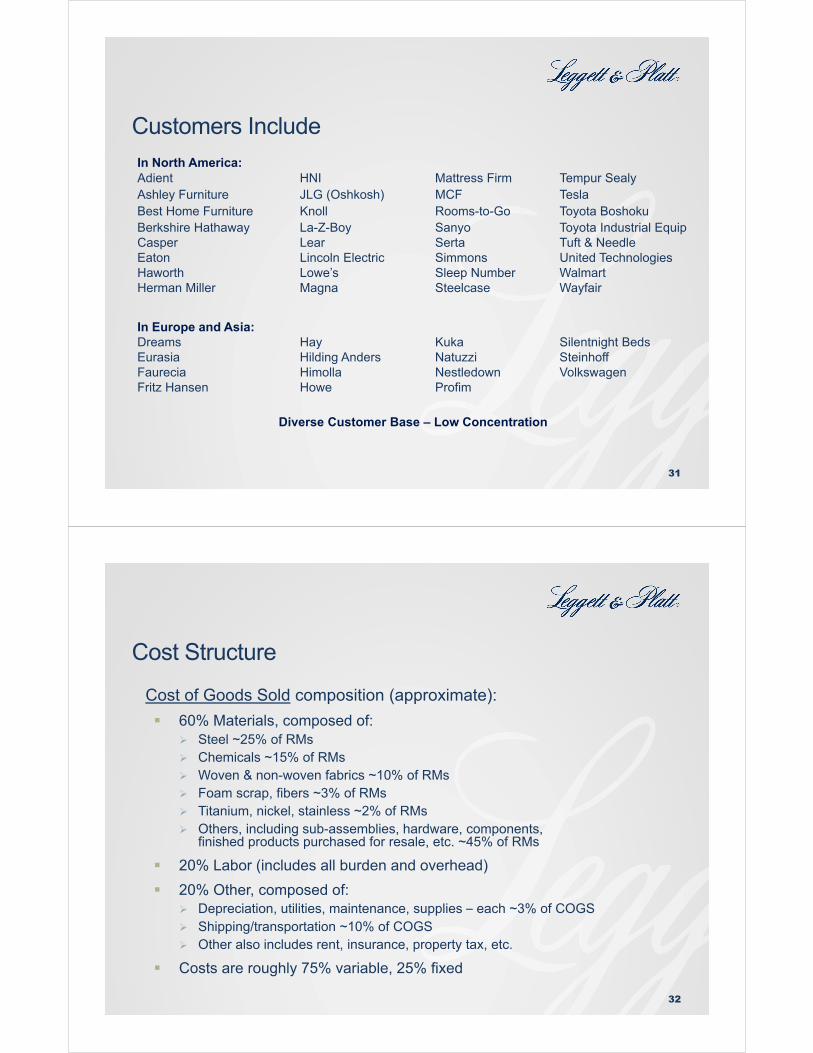
Cost Structure
32
Cost of Goods Sold composition (approximate):
60% Materials, composed of: Steel ~25% of RMs Chemicals ~15% of RMs Woven & non-woven fabrics ~10% of RMs Foam scrap, fibers ~3% of RMs Titanium, nickel, stainless ~2% of RMs Others, including sub-assemblies, hardware, components,
finished products purchased for resale, etc. ~45% of RMs
20% Labor (includes all burden and overhead)
20% Other, composed of: Depreciation, utilities, maintenance, supplies – each ~3% of COGS Shipping/transportation ~10% of COGS Other also includes rent, insurance, property tax, etc.
Costs are roughly 75% variable, 25% fixed
Steel Impact
33
Primary commodity exposure is steel; ~25% of RM’s
Main categories are scrap, rod, and flat-rolled
Many grades of scrap – market data is generally available
Limited credible data to track moves in other types of steel
Impact from inflation/deflation
Typically pass through; lag is ~90 days
LIFO accelerates inflation/deflation into COGS
Changes in metal margin (mkt price for rod - mkt price for scrap) also impact earnings
Our scrap cost and rod pricing moves with the market; large swings cause Industrial Products segment earnings volatility
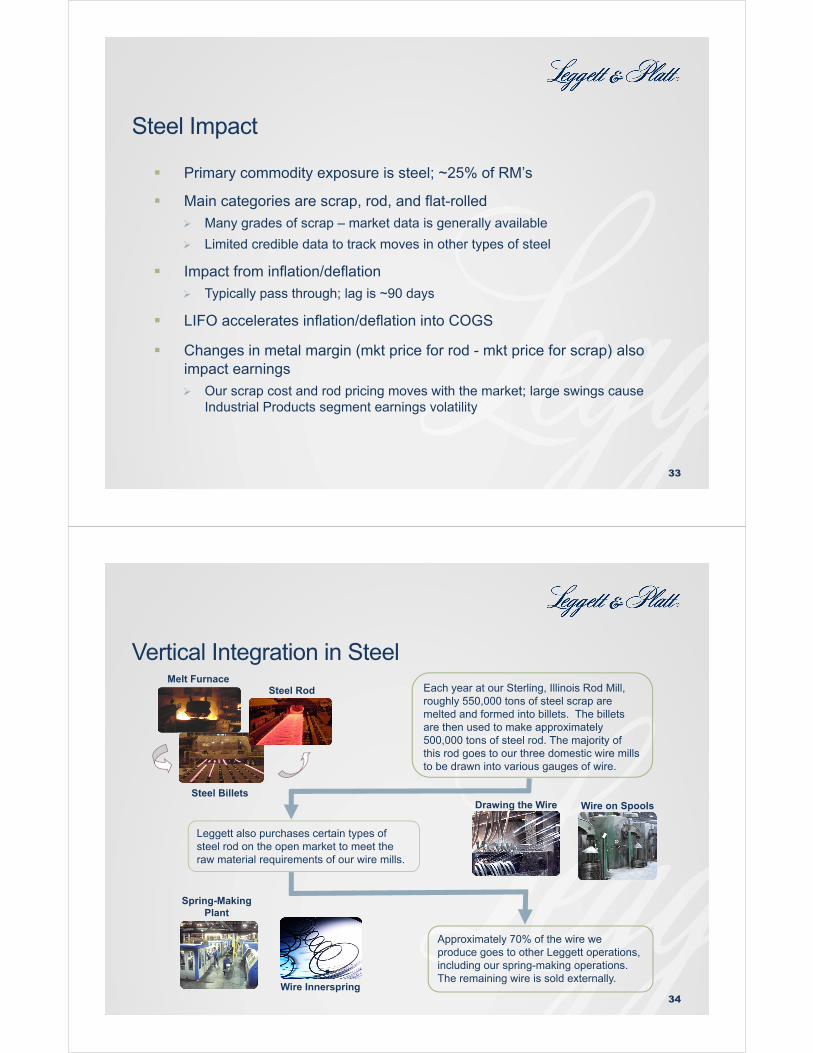
Vertical Integration in Steel
34
Melt Furnace
Steel Billets
Steel Rod Each year at our Sterling, Illinois Rod Mill, roughly 550,000 tons of steel scrap are melted and formed into billets. The billets are then used to make approximately 500,000 tons of steel rod. The majority of this rod goes to our three domestic wire mills to be drawn into various gauges of wire.
Leggett also purchases certain types of steel rod on the open market to meet the raw material requirements of our wire mills.
Approximately 70% of the wire we produce goes to other Leggett operations, including our spring-making operations. The remaining wire is sold externally.
Drawing the Wire Wire on Spools
Wire Innerspring
Spring-Making Plant
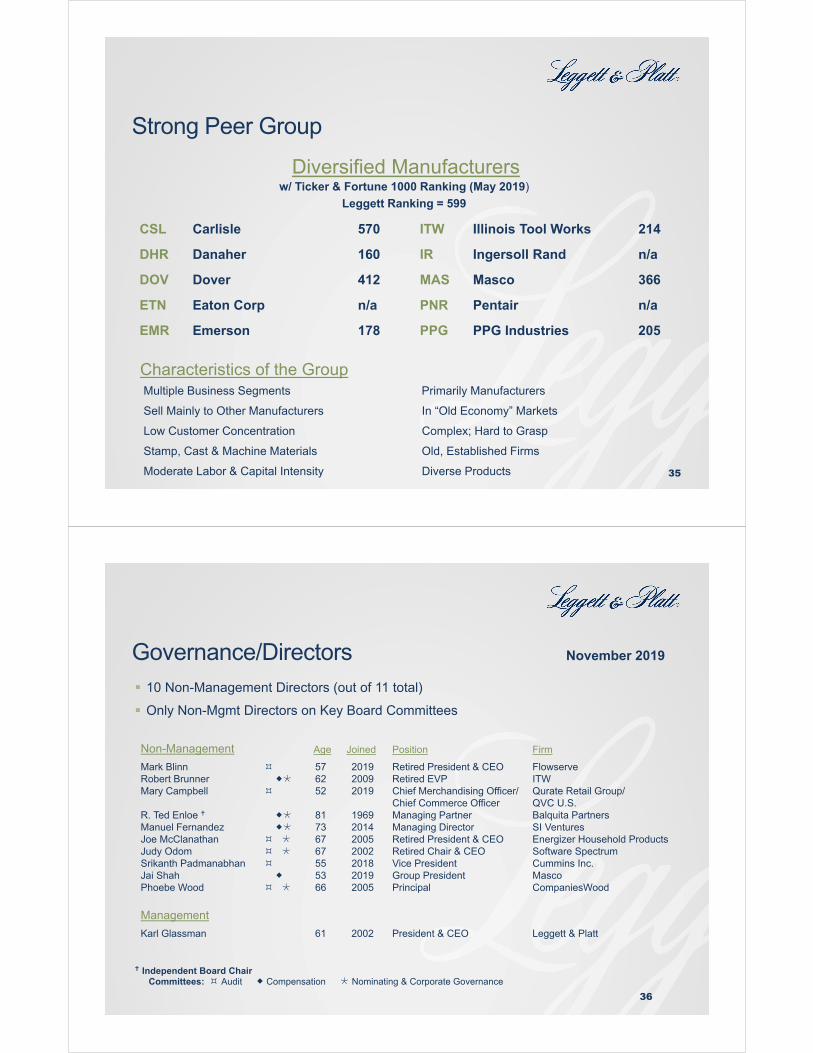
Strong Peer Group
35
Diversified Manufacturersw/ Ticker & Fortune 1000 Ranking (May 2019)
Leggett Ranking = 599
CSL Carlisle 570 ITW Illinois Tool Works 214
DHR Danaher 160 IR Ingersoll Rand n/a
DOV Dover 412 MAS Masco 366
ETN Eaton Corp n/a PNR Pentair n/a
EMR Emerson 178 PPG PPG Industries 205
Characteristics of the GroupMultiple Business Segments Primarily Manufacturers
Sell Mainly to Other Manufacturers In “Old Economy” Markets
Low Customer Concentration Complex; Hard to Grasp
Stamp, Cast & Machine Materials Old, Established Firms
Moderate Labor & Capital Intensity Diverse Products
10 Non-Management Directors (out of 11 total)
Only Non-Mgmt Directors on Key Board Committees
Independent Board ChairCommittees: Audit Compensation Nominating & Corporate Governance
36
Non-Management Age Joined Position Firm
Mark BlinnRobert BrunnerMary Campbell
R. Ted Enloe
Manuel FernandezJoe McClanathanJudy OdomSrikanth PadmanabhanJai ShahPhoebe Wood
576252
81736767555366
201920092019
1969201420052002201820192005
Retired President & CEORetired EVPChief Merchandising Officer/ Chief Commerce OfficerManaging PartnerManaging DirectorRetired President & CEORetired Chair & CEOVice PresidentGroup PresidentPrincipal
FlowserveITWQurate Retail Group/QVC U.S.Balquita PartnersSI VenturesEnergizer Household ProductsSoftware SpectrumCummins Inc.MascoCompaniesWood
Management
Karl Glassman 61 2002 President & CEO Leggett & Platt
Governance/Directors November 2019

Compensation Rewards Strong Performance
37
Annual Incentive Based on current year ROCE, free cash flow, and individual goals
Performance Stock Units Long-term equity-based, significant portion of total comp for execs
Three-year performance period with two equal measures • Relative TSR performance (vs. peer group of ~320 companies)
• Company or segment EBIT CAGR
Deferred Comp Program Opportunity (in December) to forego a portion of next year’s cash salary
and bonus to buy stock units
Role-Based Portfolio Management
38
Strategic Planning Process Assess market attractiveness and Leggett’s advantages
Used to determine portfolio role
Place each BU into Portfolio Role Grow, core, fix, or divest
Different goals for each• Grow: profitable Growth• Core: maximize Cash• Fix: rapidly Improve

39
Criteria for Role Assignments
GROW CORE FIX / DIVEST
1. COMPETITIVEPOSITION
Advantaged Solid, Stable Tenuous or Disadvantaged
2. MARKETATTRACTIVE?
Strong,Growing
Attractive, but with Lower
Growth Potential
Poor or Declining
3. FIT w/ LEGGETT Strong Strong Limited
4. RETURN (ROGI) Consistently > 12%
Stable,9-12%
Erratic or < WACC
5. BU SIZE &MATERIALITY
Large, Significant
Large, Significant
Inconsequential, Distracting
40
Expectations by Portfolio Role
Grow: Provide Profitable Growth; Return > WACC Invest capital in competitively advantaged positions
Identify major organic, M&A, or rollup investments
Core: Generate Cash; Return ≥ WACC Maintain stable, competitive positions to generate cash
Aggressively improve EBITDA and free cash flow
Profitably grow market share, but with minimal capex
Enhance productivity; reduce costs, overhead, working capital
Fix: Rapidly Restructure, else Exit Limited time to achieve return ≥ WACC, else divest / liquidate

Financial Information
$2,500
$3,000
$3,500
$4,000
$4,500
$5,000
'12 '13 '14 '15 '16 '17 '18 '19e
Net Sales(million $’s)
+8%
$100
$200
$300
$400
$500
$600
'12 '13 '14 '15 '16 '17 '18 '19e
EBIT(million $’s)
Amounts are from continuing operations and exclude unusual items. See appendix for non-GAAP reconciliations. 2019 estimates are based on mid-point of guidance (issued 10/28/19 – not updated since)
+11%
+2%
+9%+4% +5%
42
-4%
Sales and EBIT

$1.00
$1.25
$1.50
$1.75
$2.00
$2.25
$2.50
$2.75
'12 '13 '14 '15 '16 '17 '18 '19e
EPS ($’s per share)
-1% +1%+3%
+8%
+19%
+32%
43
+6%
Net Earnings and EPS
$100
$150
$200
$250
$300
$350
$400
'12 '13 '14 '15 '16 '17 '18 '19e
Net Earnings(million $’s)
Amounts are from continuing operations and exclude unusual items. See appendix for non-GAAP reconciliations. 2019 estimates are based on mid-point of guidance (issued 10/28/19 – not updated since)
44
Returns and TSR
0%
5%
10%
15%
20%
25%
'12 '13 '14 '15 '16 '17 '18 '19e
Return on Invested Capital
-5%
0%
5%
10%
15%
20%
25%
30%
'12 '13 '14 '15 '16 '17 '18
Leggett S&P 500
3-Year Avg TSR(at year end)
See appendix for return calculation 2019 estimates are based on mid-point of guidance (issued 10/28/19 – not updated since) TSR assuming dividends continually reinvested
45
0%
2%
4%
6%
8%
10%
12%
14%
16%
18%
20%
'14 '15 '16 '17 '18 '19e
Residential Industrial Furniture Specialized Total
Segment EBIT Margins
Amounts exclude unusual items. See appendix for non-GAAP reconciliations. 2019 estimates are based on mid-point of guidance (issued 10/28/19 – not updated since)
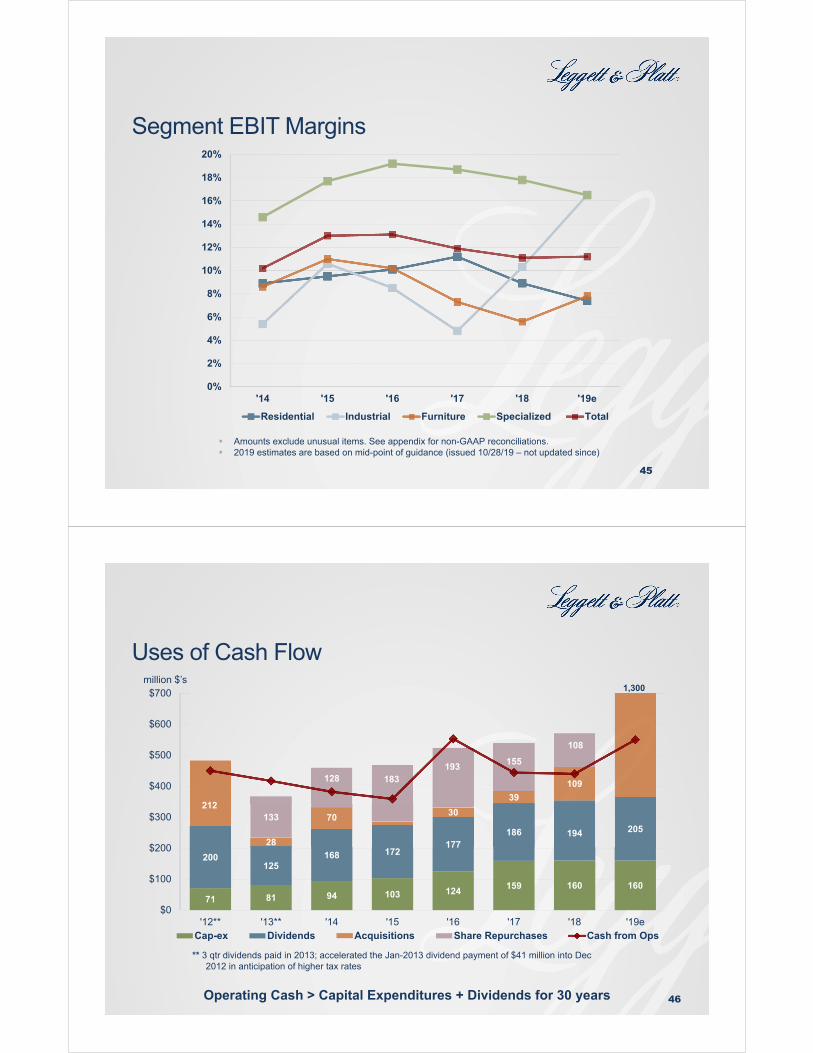
Uses of Cash Flow
46
71 81 94 103 124159 160 160
200125
168 172177
186 194 205
212
28
70 30
39
109
133
128 183193
155
108
$0
$100
$200
$300
$400
$500
$600
$700
'12** '13** '14 '15 '16 '17 '18 '19eCap-ex Dividends Acquisitions Share Repurchases Cash from Ops
1,300
** 3 qtr dividends paid in 2013; accelerated the Jan-2013 dividend payment of $41 million into Dec 2012 in anticipation of higher tax rates
Operating Cash > Capital Expenditures + Dividends for 30 years
million $’s

1 5 qtr dividends paid in 2012 and 3 qtr dividends paid in 2013; accelerated the Jan-2013 dividend payment of $41 million into Dec-2012 in anticipation of higher tax rates.
2 2017 Other Non-Cash includes $67 million in deemed repatriation taxes as a result of the Tax Cuts and Jobs Act3 2019 estimated net income is based on mid-point of guidance (issued 10/28/19 – not updated since)
Cash Flow Details$’s in millions 2012 2013 2014 2015 2016 2017 2018 2019e3
Net Income 251 200 101 329 286 293 306 335
Deprec & Amort 116 123 118 113 115 126 136 200
Def Income Taxes (22) (33) (40) 24 18 16 (3)
Impairment & Other 17 83 124 19 15 11 32
Working Capital 57 26 54 (171) 15 (80) (46) (15)
Other Non-Cash1 31 18 25 45 4 78 15 30
Cash from Operations 450 417 382 359 553 444 440 550
Uses of Cash
Capital Expenditures (71) (81) (94) (103) (124) (159) (160) (160)
Dividends2 (200) (125) (168) (172) (177) (186) (194) (205)
Acquisitions (212) (28) (70) (11) (30) (39) (109) (1,300)
Share Repurchases 6 (133) (128) (183) (193) (155) (108) (5)
47
Debt Structure (at 9/30/19)
48
$2.25 billion total debt 3.7% average rate, 6.3 years average maturity
$1 billion available commercial paper Expanded commercial paper program from $800 million to $1.2 billion
primarily to finance the ECS acquisition
Financed ECS acquisition in January 2019 with: $750 million of commercial paper ($500 million refinanced in March through
the public issuance of 4.4% 10-year notes)
Issuance of $500 million 5-year term loan
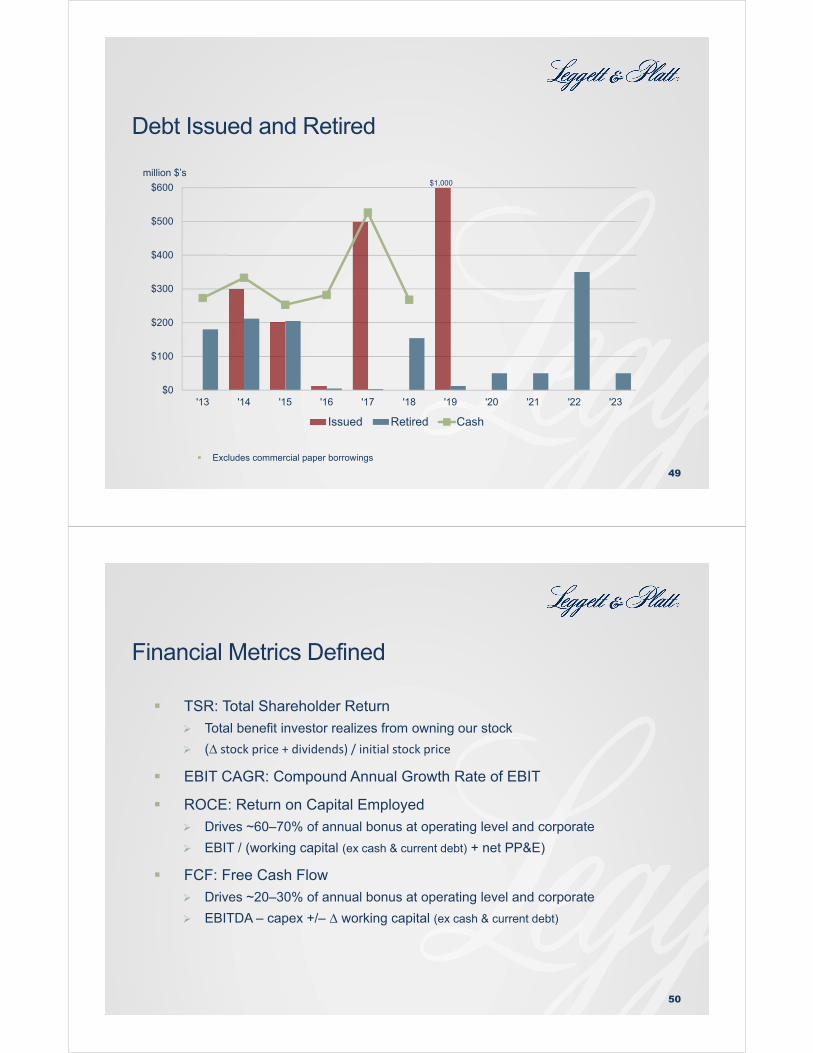
Debt Issued and Retired
49
$0
$100
$200
$300
$400
$500
$600
'13 '14 '15 '16 '17 '18 '19 '20 '21 '22 '23
Issued Retired Cash
million $’s$1,000
Excludes commercial paper borrowings
Financial Metrics Defined
50
TSR: Total Shareholder Return
Total benefit investor realizes from owning our stock
(∆ stock price + dividends) / initial stock price
EBIT CAGR: Compound Annual Growth Rate of EBIT
ROCE: Return on Capital Employed
Drives ~60–70% of annual bonus at operating level and corporate
EBIT / (working capital (ex cash & current debt) + net PP&E)
FCF: Free Cash Flow
Drives ~20–30% of annual bonus at operating level and corporate
EBITDA – capex +/– ∆ working capital (ex cash & current debt)
AppendixNon-GAAP Reconciliations
Non-GAAP Adjustments, Continuing Ops
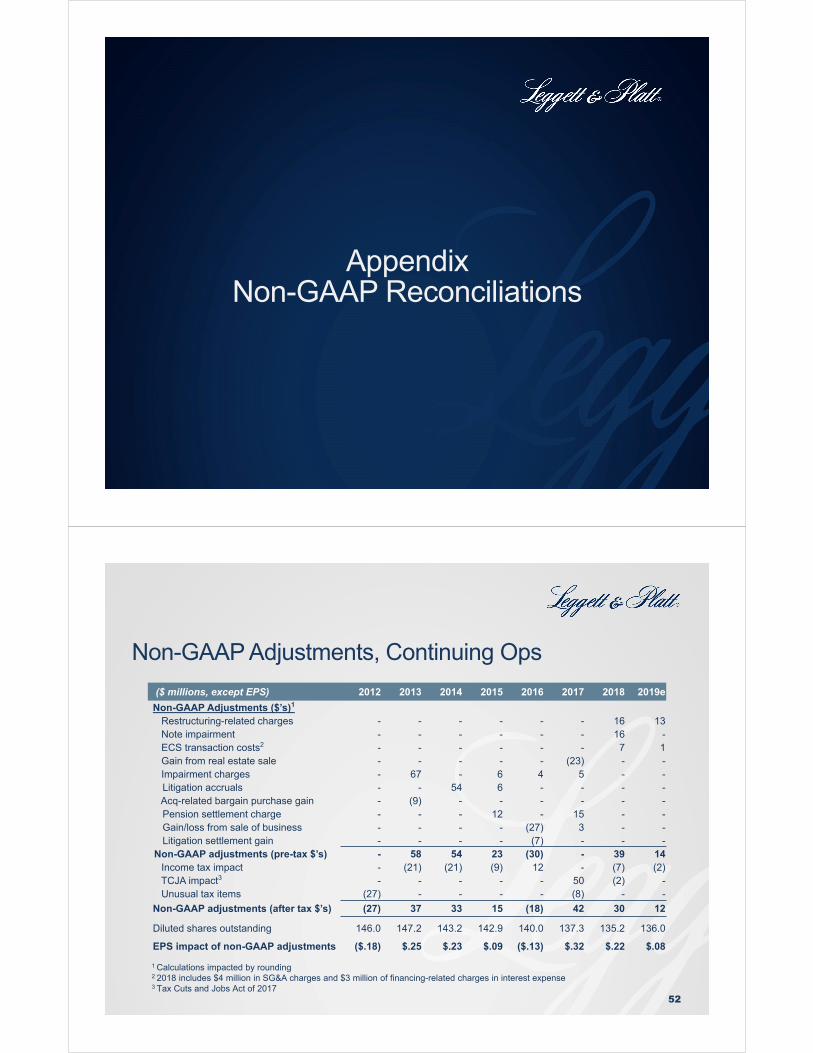
52
1 Calculations impacted by rounding2 2018 includes $4 million in SG&A charges and $3 million of financing-related charges in interest expense3 Tax Cuts and Jobs Act of 2017
($ millions, except EPS) 2012 2013 2014 2015 2016 2017 2018 2019e
Non-GAAP Adjustments ($’s)1
Restructuring-related charges - - - - - - 16 13Note impairment - - - - - - 16 -ECS transaction costs2 - - - - - - 7 1Gain from real estate sale - - - - - (23) - -Impairment charges - 67 - 6 4 5 - -Litigation accruals - - 54 6 - - - -Acq-related bargain purchase gain - (9) - - - - - -Pension settlement charge - - - 12 - 15 - -Gain/loss from sale of business - - - - (27) 3 - -Litigation settlement gain - - - - (7) - - -
Non-GAAP adjustments (pre-tax $’s) - 58 54 23 (30) - 39 14Income tax impact - (21) (21) (9) 12 - (7) (2)TCJA impact3 - - - - - 50 (2) -Unusual tax items (27) - - - - (8) - -
Non-GAAP adjustments (after tax $’s) (27) 37 33 15 (18) 42 30 12
Diluted shares outstanding 146.0 147.2 143.2 142.9 140.0 137.3 135.2 136.0
EPS impact of non-GAAP adjustments ($.18) $.25 $.23 $.09 ($.13) $.32 $.22 $.08
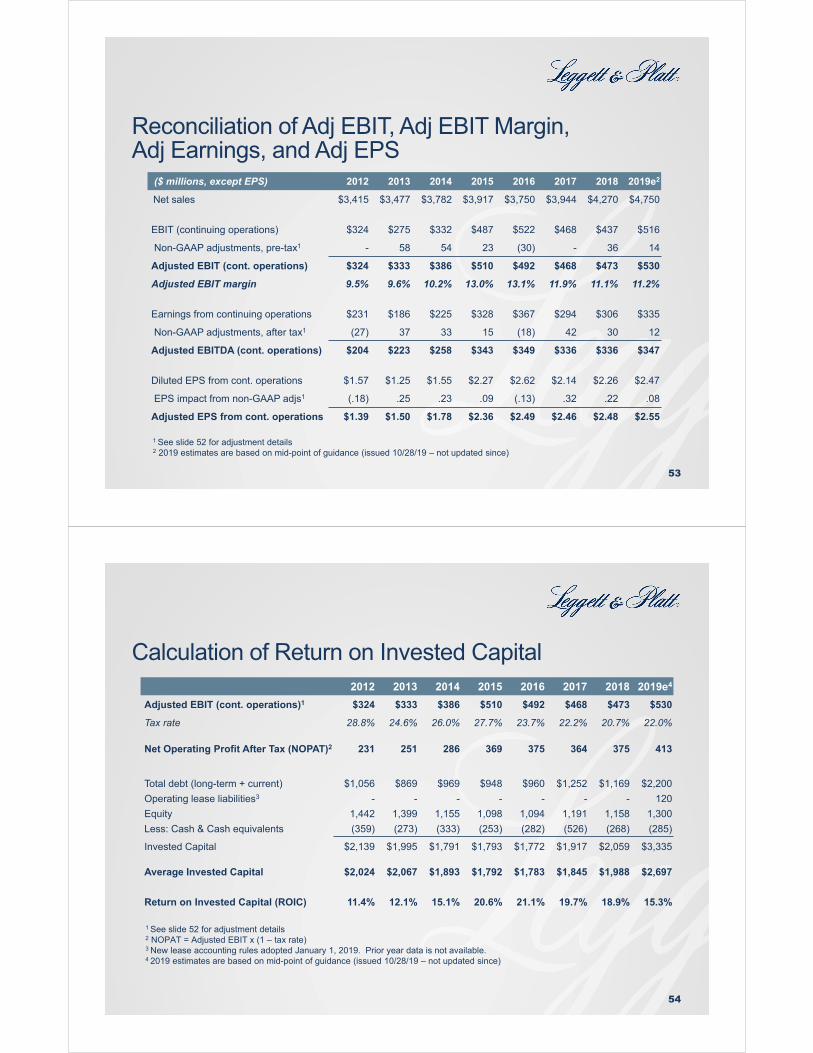
Reconciliation of Adj EBIT, Adj EBIT Margin,Adj Earnings, and Adj EPS
53
($ millions, except EPS) 2012 2013 2014 2015 2016 2017 2018 2019e2
Net sales $3,415 $3,477 $3,782 $3,917 $3,750 $3,944 $4,270 $4,750
EBIT (continuing operations) $324 $275 $332 $487 $522 $468 $437 $516
Non-GAAP adjustments, pre-tax1 - 58 54 23 (30) - 36 14
Adjusted EBIT (cont. operations) $324 $333 $386 $510 $492 $468 $473 $530
Adjusted EBIT margin 9.5% 9.6% 10.2% 13.0% 13.1% 11.9% 11.1% 11.2%
Earnings from continuing operations $231 $186 $225 $328 $367 $294 $306 $335
Non-GAAP adjustments, after tax1 (27) 37 33 15 (18) 42 30 12
Adjusted EBITDA (cont. operations) $204 $223 $258 $343 $349 $336 $336 $347
Diluted EPS from cont. operations $1.57 $1.25 $1.55 $2.27 $2.62 $2.14 $2.26 $2.47
EPS impact from non-GAAP adjs1 (.18) .25 .23 .09 (.13) .32 .22 .08
Adjusted EPS from cont. operations $1.39 $1.50 $1.78 $2.36 $2.49 $2.46 $2.48 $2.55
1 See slide 52 for adjustment details2 2019 estimates are based on mid-point of guidance (issued 10/28/19 – not updated since)
Calculation of Return on Invested Capital
54
1 See slide 52 for adjustment details2 NOPAT = Adjusted EBIT x (1 – tax rate)3 New lease accounting rules adopted January 1, 2019. Prior year data is not available.4 2019 estimates are based on mid-point of guidance (issued 10/28/19 – not updated since)
2012 2013 2014 2015 2016 2017 2018 2019e4
Adjusted EBIT (cont. operations)1 $324 $333 $386 $510 $492 $468 $473 $530
Tax rate 28.8% 24.6% 26.0% 27.7% 23.7% 22.2% 20.7% 22.0%
Net Operating Profit After Tax (NOPAT)2 231 251 286 369 375 364 375 413
Total debt (long-term + current) $1,056 $869 $969 $948 $960 $1,252 $1,169 $2,200
Operating lease liabilities3 - - - - - - - 120
Equity 1,442 1,399 1,155 1,098 1,094 1,191 1,158 1,300
Less: Cash & Cash equivalents (359) (273) (333) (253) (282) (526) (268) (285)
Invested Capital $2,139 $1,995 $1,791 $1,793 $1,772 $1,917 $2,059 $3,335
Average Invested Capital $2,024 $2,067 $1,893 $1,792 $1,783 $1,845 $1,988 $2,697
Return on Invested Capital (ROIC) 11.4% 12.1% 15.1% 20.6% 21.1% 19.7% 18.9% 15.3%

Calculation of Dividend Payout % of Adjusted EPS
55
1 See slide 52 for adjustment details2 2019 estimates are based on mid-point of guidance (issued 10/28/19 – not updated since)
2015 2016 2017 2018 2019e2
Diluted EPS from cont. operations $2.27 $2.62 $2.14 $2.26 $2.47
EPS impact from non-GAAP adjs1 .09 (.13) .32 .22 .08
Adjusted EPS from cont. operations $2.36 $2.49 $2.46 $2.48 $2.55
Annual dividend per share $1.26 $1.34 $1.42 $1.50 $1.58
Dividend payout % of diluted EPS from continuing operations
56% 51% 66% 66% 64%
Dividend payout % of adjusted EPS 53% 54% 58% 60% 62%
Calculation of Debt to Adjusted EBITDA
56
1 See slide 52 for adjustment details2 D&A is from continuing operations3 2019 estimates are based on mid-point of guidance (issued 10/28/19 – not updated since)
2014 2015 2016 2017 2018 2019e3
EBIT (cont. operations) $332 $487 $522 $468 $437 $516
Non-GAAP adjustments, pre-tax1 54 23 (30) - 36 14
Adjusted EBIT (cont. operations) 386 510 492 468 473 530
Depreciation and amortization2 118 113 115 126 136 200
Adjusted EBITDA $504 $623 $607 $594 $609 $730
Total Debt (long-term + current) $964 $945 $960 $1,252 $1,169 $2,200
Debt to Adjusted EBITDA 1.9 1.5 1.6 2.1 1.9 3.0
Non-GAAP Financial Measures
57
While we report financial results in accordance with accounting principles generally accepted in the U.S. (“GAAP”), this presentation includes non-GAAP measures. These include adjusted EBIT, adjusted EBIT margin, adjusted earnings, and adjusted EPS. We believe these non-GAAP measures are useful to investors in that they assist investors’ understanding of underlying operational profitability. Management uses these non-GAAP measures as supplemental information to assess the company’s operational performance.
We believe the presentation of debt to adjusted EBITDA provides investors a useful way to assess the time it would take the Company to pay off all of its debt, ignoring various factors including interest and taxes. Management uses this ratio as supplemental information to assess its ability to pay off its incurred debt.
The above non-GAAP measures may not be comparable to similarly titled measures used by other companies and should not be considered a substitute for, or more meaningful than, their GAAP counterparts.