Coming into Focus - Leggett & Platt
160
Coming into Focus 2008 Annual Report
Transcript of Coming into Focus - Leggett & Platt

Coming into Focus
2008 Annual Report
Strategy
• Total Shareholder Return (TSR) in top 1/3 of S&P 500 is primarystrategic objective; all decisions judged against impact to TSR
• Role-based portfolio management, based on business unit’s competitive advantages, market position, and financial health
• TSR derived from four activities: 1) margin improvement, 2) dividend yield, 3) revenue growth, and 4) stock buyback
• Achieve higher returns on remaining portfolio; pursue profitablelong-term growth
Leggett Distinctives
• Financial stability, strong balance sheet, solid cash flow• Strong market positions• Consistent dividend growth• Management with “skin in the game”
Track Record
• 2008 TSR in top 10% of the S&P 500• Dividends increased by 39% in 2008, and by 14% annual
average for 37 consecutive years – one of the best records among the S&P 500
• Credit rating in the A category for more than a decade
Cash Use Priorities; Dividend Policy
• Return more cash to shareholders through stock repurchases andannual dividend increases
• Pay 50% – 60% of net earnings as dividends• Reduced capex and acquisition spending
Financial Goals
• 12% – 15% TSR (total shareholder return) annually• 4% – 5% long-term annual sales growth • 11% EBIT margin• 30% – 40% net debt to net capital• Steady dividend increases
Capital Structure
• $2 – 3 billion market cap; $3 – 4 billion enterprise value• 28% net debt to net capital• 156 million shares outstanding at Dec. 31, 2008 • Standing authorization to buy back up to 10m shares annually
Stock Information
• Listed on NYSE; ticker = LEG; approximately 31,500 shareholders• Current indicated annual dividend of $1.00 per share• Dividend yield = 6.6% (on $15.19 year-end stock price)• 2008 price range of $12.03 – $24.60• 2008 daily volume averaged 2.8 million shares• About 10% of stock owned by management and employees,
directors, retirees, merger partners, and their family members • Compound annual TSR of 14% since 1967 IPO
Quick Facts
• 2008 sales from continuing ops. of $4.1 billion; 26% international• Broad customer base; mainly manufacturers and retailers • Few large competitors; almost none are public• 4 Reporting Segments; 10 Groups; 20 Business Units• 20,000 employees; over 160 manufacturing facilities in
18 countries
2008 Accomplishments
• Achieved 2008 TSR in the top 10% of S&P 500 companies• Generated $436 million of cash flow from operations• Divested 5 business units for more than $400 million cash• Implemented rigorous, BU-level strategic planning process• Reduced Store Fixtures BU to smaller core focused on metal fixtures• Maintained strong balance sheet despite severe economic downturn• Added new executive bonus linked solely to 3-year TSR• Modified BU bonus structure to reward return on investment• Significantly increased sales of Verticoil, our proprietary alternative
to generic innersprings• Increased quarterly dividend 39%; 37th consecutive annual increase• Repurchased 16 million shares, or 9%, of Leggett’s stock
Recognition
• Included as one of Standard & Poor’s “Dividend Aristocrats”; possess 13th longest record of annual dividend increases among the S&P 500
• Listed among Mergent’s Dividend Achievers• On Fortune’s list of America's Most Admired Companies; scored
in the top third of the companies listed• One of America’s Finest Companies according to the Staton
Institute, based on dividend record• Ranked as one of the top 25 innovators in the consumer products
segment by The Patent Board.
Profile
Diversified manufacturer that conceives, designs and produces a wide range of engineered components and products that can be found in most homes, offices, and automobiles, and in many retailstores. North America’s largest independent manufacturer of a variety of products including:• Components for bedding and residential furniture• Carpet padding• Components for office furniture• Drawn steel wire• Automotive seat support and lumbar systems
Brief History
• 1883: Partnership founded in Carthage, Missouri• 1901: Leggett & Platt was incorporated • 1967: Company went public; revenues of $13 million• 1979: Listed on New York Stock Exchange (LEG)• 1990: Revenues exceed $1 billion• 1998: Added to the FORTUNE 500• 1999: Included in the S&P 500 index• 2004: Revenues exceed $5 billion• 2008: Implement strategy change; 125th Anniversary
Peer Group
Eleven large, diversified manufacturing peers.Ticker Sales Name • CSL 3.0 Carlisle Companies (construction materials, transportation)
• CBE 6.5 Cooper Industries (electrical products, tools, hardware)
• DHR 12.7 Danaher Corporation (instrumentation, tools, components)
• DOV 7.6 Dover Corporation (industrial products, mfg. equipment)
• ETN 15.4 Eaton Corporation (hydraulic, electrical, truck)
• EMR 24.8 Emerson Electric Company (electrical, electronics)
• ITW 15.9 Illinois Tool Works (fluids, tooling, measurement)
• IR 13.2 Ingersoll-Rand (refrigeration, security, pneumatics)
• MAS 9.6 Masco (home and building products)
• PNR 3.4 Pentair (enclosures, tools, water products)
• PPG 15.8 PPG Industries (chemicals, glass, coatings)
Sales are in billions of dollars, for full year 2008.
Leggett & Platt at a Glance www.leggett.com
23201rrdD1R1.qxp:23201rrdD1R1 3/6/09 6:33 PM Page OC
1. Make TSR our key objective:
TSRTSR
CONTENTS
10 Financial Highlights
11 Letter to Shareholders
14 Six Year Financials
15 Stock Performance Graph
15 Corporate Officers
16 Navigating the 10K
Form 10K
Glossary (last page of 10K)
Dividend and Corporate Information (inside back cover)
Leggett at a Glance (back cover)
In late 2007 we unveiled our new strategic direction,
and committed ourselves to 5 key activities. In the
next few pages we remind you of those commitments,
and report on the progress we’ve made.
Dividend Information
Dividend Policy:
The Company targets dividend payout (over the long term) of approximately 50-60% of net earnings; however, payout has beenhigher recently, and will likely remain above targeted levels for the next few years. Leggett believes in consistently paying dividends,is proud of its dividend growth record, and expects to extend that record into the future. Quarterly dividends are usually declared inFebruary, May, August, and November, and paid about two weeks after the start of the following quarter. For 2009, the Company’santicipated payment dates are April 15, July 15, Oct. 15, and Jan. 15, 2010.
Dividend Record:
• 37 Consecutive Annual Increases (from 1971 to 2008)• Over 14% Compound Annual Growth Rate
Dividends have been paid on the Company’s common stockeach year since 1939. With dividends paid of $1.00 per share,2008 was our 37th consecutive year of increased dividends.Over this period dividends have doubled about every 5 years,yielding a compound average growth rate of over 14%. No other S&P 500 firm has achieved as long a string of consecutive dividend increases at the growth rate we have sustained.
Corporate Information
Mailing Address:
Leggett & Platt, IncorporatedPO Box 757Carthage, MO 64836-0757(417) 358-8131
Annual Meeting:
May 7, 2009, at 10:00 a.m. (local time),at the Company’s Wright ConferenceCenter, No. 1 Leggett Road, Carthage,Missouri.
Stockholder Inquiries:
Inquiries regarding dividend payments,lost dividend checks, stock transfers,address or name changes, duplicate mail-ings, lost stock certificates, or Form 1099information should be directed to theTransfer Agent.
Direct Deposit of Dividends:
The Company strongly encourages share-holders to have dividends depositeddirectly to their checking account, as thisreduces expenses. Please contact theTransfer Agent for more information.
Transfer Agent and Registrar:Wells Fargo Shareowner ServicesP.O. Box 64874St. Paul, MN 55164-0874Phone: (800) 468-9716www.wellsfargo.com/com/shareowner_services
Web Site:
www.leggett.com Press releases, Forms 10-K and 10-Q, theAnnual Report, corporate governanceinformation, and a variety of other itemsare available on the Investor Relationsportion of the Company’s website.
Form 10-K:
The Company’s Form 10-K is containedwithin this document. The exhibits to theForm 10-K are available on Leggett’s website, or may be obtained from InvestorRelations for a reasonable fee.
Independent Registered Public
Accounting Firm:
PricewaterhouseCoopers LLPSt. Louis, Missouri
Contacting the Audit Committee:
Should you become aware of any ques-tionable accounting, internal controls orauditing matters, you may report yourconcerns confidentially to the Company’sAudit Committee. You may request writtenacknowledgment of your written concern.Call: (888) 401-0536Write: L&P Audit Committee
Attn: Ray CavanaughP.O. Box 757Carthage, MO 64836
Email: [email protected]
Investor Relations:
General information about Leggett and its common stock may be obtained fromthe Investor Relations department:David M. DeSonier, Vice PresidentSusan R. McCoy, DirectorBonnie S. Young, SpecialistJanna M. Fields, Secretary
Web: www.leggett.comPhone: (417) 358-8131Fax: (417) 359-5114Email: [email protected]
Listed:
The New York Stock Exchange (ticker = LEG)
Stock Analyst Coverage:
Hilliard LyonsKansas City CapitalLongbow ResearchRaymond JamesStifel NicolausSunTrust Robinson Humphrey
Contacting the Board of Directors:
Individuals may email the Board at [email protected] or write to: L&P Board Chair, P.O. Box 637,Carthage, MO 64836. Mr. Fisher, theIndependent Chair, will receive all communications directly.
Dividend HistoryCents per share
01988 1993 1998 2003 2008
100
50
75
25
Dividend HistoryCents per share
23201rrdD1R1.qxp:23201rrdD1R1 3/9/09 7:42 AM Page IC
1
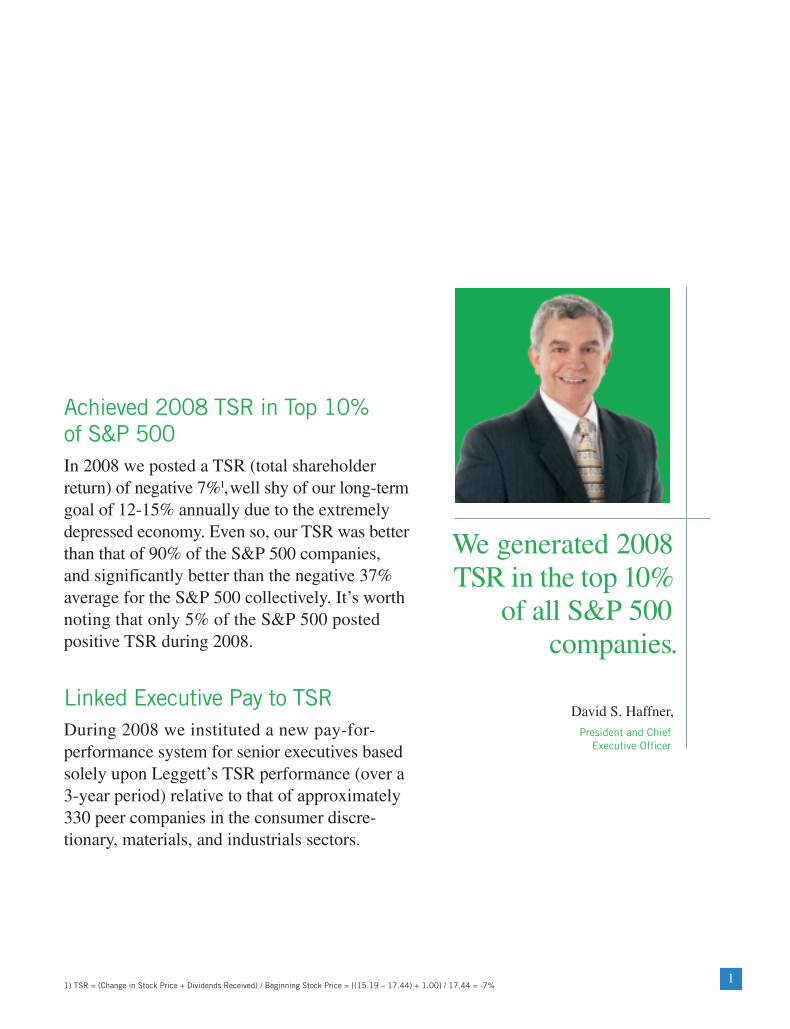
Achieved 2008 TSR in Top 10% of S&P 500In 2008 we posted a TSR (total shareholderreturn) of negative 7%1,well shy of our long-termgoal of 12-15% annually due to the extremelydepressed economy. Even so, our TSR was betterthan that of 90% of the S&P 500 companies, and significantly better than the negative 37%average for the S&P 500 collectively. It’s worthnoting that only 5% of the S&P 500 posted positive TSR during 2008.
Linked Executive Pay to TSRDuring 2008 we instituted a new pay-for-performance system for senior executives basedsolely upon Leggett’s TSR performance (over a3-year period) relative to that of approximately330 peer companies in the consumer discre-tionary, materials, and industrials sectors.
We generated 2008TSR in the top 10%
of all S&P 500 companies.
David S. Haffner, President and Chief
Executive Officer
1) TSR = (Change in Stock Price + Dividends Received) / Beginning Stock Price = [(15.19 – 17.44) + 1.00] / 17.44 = -7%
23201rrdD2R1_nar.qxp:23201rrdD2R1 3/9/09 7:47 AM Page 1

2. Return more cashto shareholders:
MoreCashMoreCash23201rrdD2R1_nar.qxp:23201rrdD2R1 3/9/09 8:14 AM Page 2
3
Increased the DividendEarly in 2008 we increased the quarterly dividendby 39%, from $.18 to $.25. At year-end, based ona stock price of $15.19, the dividend yield was6.6%. 2008 marked our 37th consecutive year ofhigher dividends, a record we expect to extendwell into the future.
Bought Back Our StockConsistent with our announced plans, we spent$290 million to repurchase 16 million shares,or 9%, of our stock. We ended the year with156 million shares of stock outstanding (versus191 million just four years ago).
Reduced Spending by 50%As anticipated, we reduced by 50% our combinedspending for capital investment and acquisitions.
We raised the dividend by 39% and bought back 9% of our stock.
39%39%higherdividendshigherdividends
23201rrdD2R1_nar.qxp:23201rrdD2R1 3/9/09 8:14 AM Page 3

3. Narrow our focus andimprove returns:
FocusFocus23201rrdD2R1_nar.qxp:23201rrdD2R1 3/9/09 8:15 AM Page 4
5
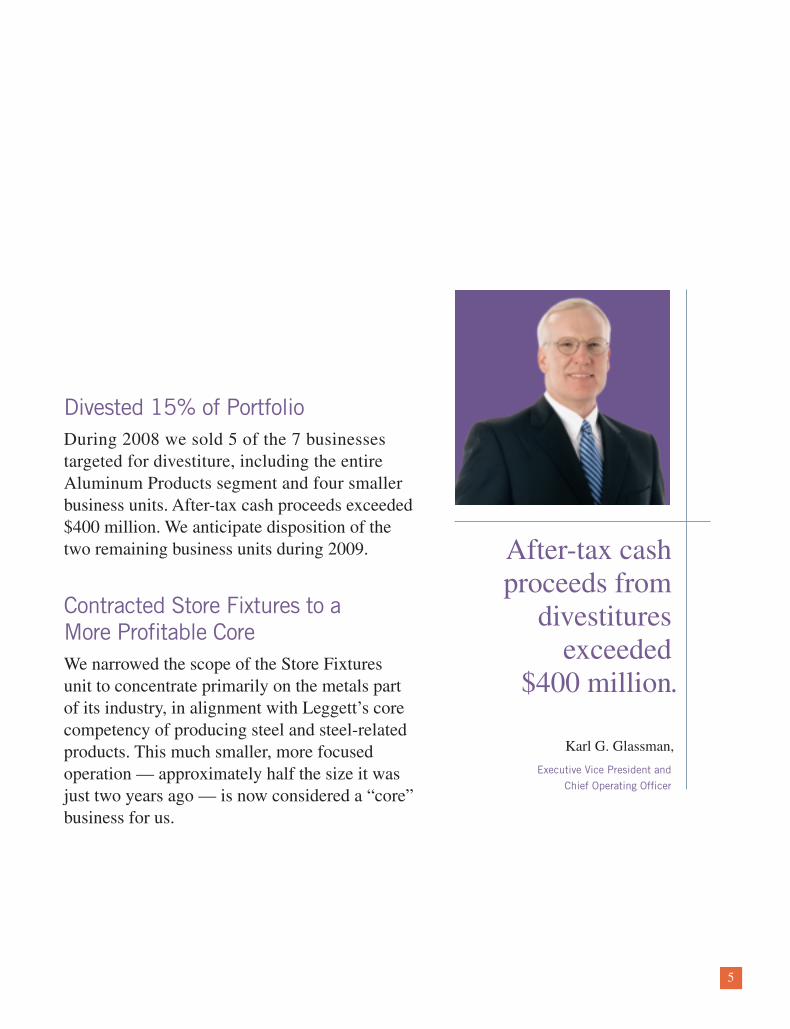
Divested 15% of PortfolioDuring 2008 we sold 5 of the 7 businesses targeted for divestiture, including the entireAluminum Products segment and four smallerbusiness units. After-tax cash proceeds exceeded$400 million. We anticipate disposition of thetwo remaining business units during 2009.
Contracted Store Fixtures to a More Profitable CoreWe narrowed the scope of the Store Fixturesunit to concentrate primarily on the metals partof its industry, in alignment with Leggett’s corecompetency of producing steel and steel-relatedproducts. This much smaller, more focusedoperation — approximately half the size it wasjust two years ago — is now considered a “core”business for us.
After-tax cash proceeds from
divestitures exceeded
$400 million.
Karl G. Glassman,
Executive Vice President and
Chief Operating Officer
23201rrdD2R1_nar.qxp:23201rrdD2R1 3/9/09 8:15 AM Page 5

4. Role-based portfoliomanagement:
PortfolioPortfolio23201rrdD2R1_nar.qxp:23201rrdD2R1 3/9/09 8:15 AM Page 6
7
Implemented New Strategic Planning ProcessWe implemented a formal, rigorous strategicplanning process that requires each BU (businessunit) to assess the attractiveness of its markets,determine what attributes are required “to win” in those markets, and assess Leggett’s competi-tive advantages.
Placed Each BU into PortfolioCategoryWe placed each BU into one of four portfolio categories (Grow, Core, Fix, or Divest) basedupon market attractiveness and competitive position. “Grow” BUs are expected to achievebetter than cost-of-capital returns and invest inprofitable growth. “Core” BUs are to maximizecash flow and improve profitability while minimizing their use of capital. “Fix” BUsmust rapidly improve, or they’ll move to the“Divest” category.
We assigned each unit to one of
four roles.
CoreCoreFixFixDivestDivest
Grow Grow
23201rrdD2R1_nar.qxp:23201rrdD2R1 3/9/09 8:15 AM Page 7

5. New strategy, but same principles:
StrengthStrength23201rrdD2R1_nar.qxp:23201rrdD2R1 3/9/09 8:16 AM Page 8
9
Financial Strength Amid Economic CrisisLeggett has long maintained a commitment toconservative financial practices. As a result,even during this time of tremendous financialchallenges in the markets, our balance sheetremains very strong. Leggett’s debt levels arebelow our long-term targets, no significant debtmatures until 2012, our debt has been rated inthe A category for over a decade, and we havean additional $500 million available under ourcurrent 3-year credit facility.
Management Continues to InvestLeggett encourages executives to invest in thecompany by offering them an opportunity (inDecember) to forfeit a portion of next year’ssalary and bonus in exchange for Leggett stock or options. In contrast to traditional programs that simply grant stock or options, this programrequires that executives use their own funds tomake purchases. As a group, executives typicallyforfeit cash salary and bonus of $4–5 millioneach year to purchase Leggett stock and options.
Our existingcredit facility
has an additional $500 million
available.
23201rrdD2R1_nar.qxp:23201rrdD2R1 3/6/09 5:53 PM Page 9
Leggett & Plattcelebrated its 125th anniversaryduring 2008.
10
Financial Highlights
Leggett & Platt (NYSE:LEG), a pioneer in the developmentof steel coil bedsprings, was founded as a partnershipin Carthage, Missouri in 1883 and incorporated in1901. Our stock was first publicly traded in 1967,and listed on the NYSE in 1979. Today, Leggett is adiversified manufacturer that conceives, designs andproduces a wide range of engineered components andproducts that can be found in most homes, offices, and automobiles, and also in many retail stores.
Our firm is composed of 20 business units,20,000 employee-partners, and more than 160 manufacturing facilities located in 18 countries.
Leggett & Platt, Incorporated(Dollar amounts in millions, except per share data)
Year ended December 31 2008 2007 % Change
Net sales from continuing operations $4,076 $4,250 (4)%Net cash provided by operating activities 436 614
EPS (earnings per diluted share) from continuing operations 0.73 0.33Adjusted EPS from continuing operations (1) 0.88 1.19 (26)%EPS (including discontinued operations) 0.62 (0.06)
Total assets 3,162 4,072 (22)%Long-term debt 851 1,001 (15)%Net debt to net capital 28.4% 28.0%Adjusted return on average shareholders’ equity (1) 8.3% 10.3%
TSR (total shareholder return) – 1 year (7.2)% (23.8)%– TSR percentile ranking among S&P 500 (1% is the best) 10% 82%
Cash dividends declared per share 1.00 0.78 28%End-of-year shares outstanding (millions) 155.8 168.7 (8)%
(1) Adjusted to exclude impairments, restructuring-related costs, one-time tax items, customer-related reserves, gains on sale, and other unusual items
23201rrdD2R1_nar.qxp:23201rrdD2R1 3/6/09 5:53 PM Page 10
11
Letter to Shareholders
“We aim to achieve12-15% annual TSRover the long term.”
annual TSRannual TSR
15%Fellow Shareholders,
For Leggett & Platt, there were two very significant
and opposing forces in play during 2008. On the
positive side, we successfully began implementing,
and benefiting from, Leggett’s most significant strategic
changes in quite some time. On the negative side,
the U.S. economy and stock market suffered from their
worst performance in decades.
Strategy Implementation. In November 2007 we unveiled plans to significantly
change the strategies that drive our company. Chief
among those changes was the adoption of Total
Shareholder Return (TSR1) as the company’s primary
strategic objective. We set a goal to consistently
achieve TSR within the top 1/3 of the S&P 500,
which we believe will require average annual TSR
of 12-15%.
In last year’s Letter to Shareholders we discussed how
we intended to improve TSR – by cleaning up our
portfolio, restraining spending, raising the dividend,
and buying back our stock. During 2008 your company
accomplished all of those objectives, and more:
• Divested 5 businesses and received after-tax cashproceeds in excess of $400 million.
• Reduced our Store Fixtures business unit to a moreprofitable core, now roughly one-half the size it wastwo years ago.
• Increased our quarterly dividend by 39%, effectiveJanuary 2008.
• Purchased 16 million shares, or 9%, of Leggett’soutstanding stock.
• Implemented an annual, formal, rigorous strategicplanning process at the business unit level.
• Assigned each business unit to one of four portfoliocategories: Grow, Core, Fix, or Divest.
• Significantly increased sales of our proprietaryalternative to generic bonnell innersprings.
• Reduced by 50% our combined annual spending on capital and acquisitions.
• Instituted a new bonus system for senior executives,solely based on our 3-year TSR relative to peers.
• “Deverticalized” two significant customers; we nowmanufacture components they used to make internally.
You can find short paragraphs describing many of these
achievements in the front part of this annual report.
1) TSR = (Change in Stock Price + Dividends Received) / Beginning Stock Price
15%
23201rrdD2R1_nar.qxp:23201rrdD2R1 3/9/09 8:17 AM Page 11
12
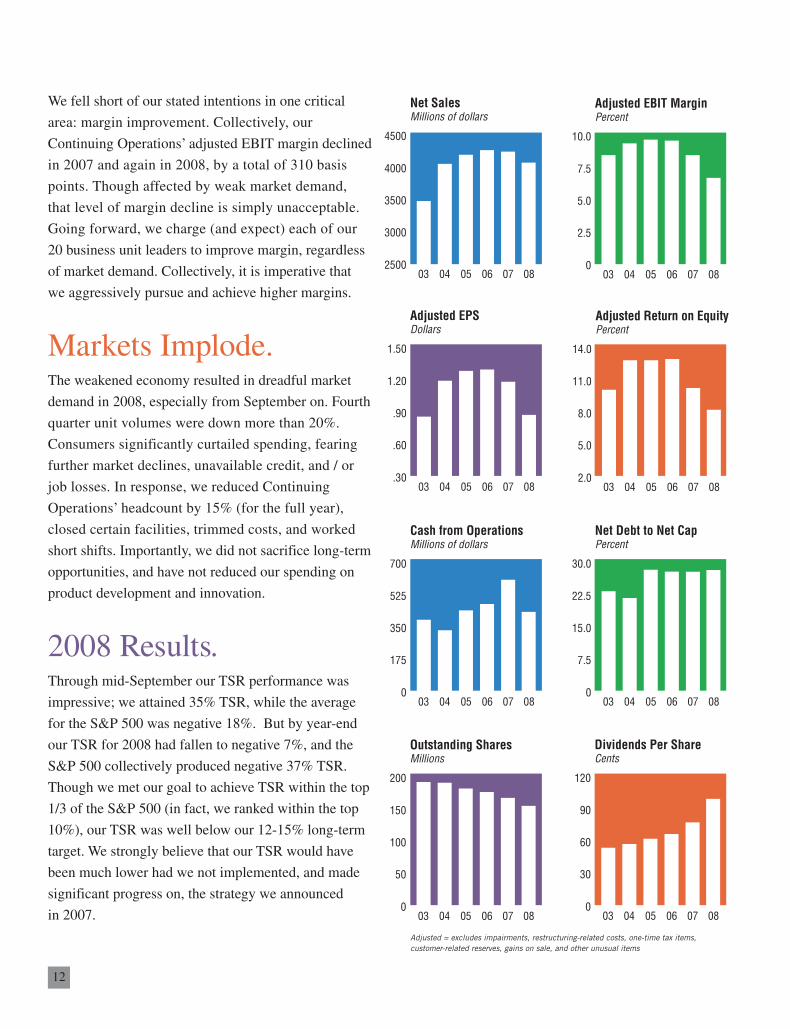
We fell short of our stated intentions in one critical
area: margin improvement. Collectively, our
Continuing Operations’ adjusted EBIT margin declined
in 2007 and again in 2008, by a total of 310 basis
points. Though affected by weak market demand,
that level of margin decline is simply unacceptable.
Going forward, we charge (and expect) each of our
20 business unit leaders to improve margin, regardless
of market demand. Collectively, it is imperative that
we aggressively pursue and achieve higher margins.
Markets Implode. The weakened economy resulted in dreadful market
demand in 2008, especially from September on. Fourth
quarter unit volumes were down more than 20%.
Consumers significantly curtailed spending, fearing
further market declines, unavailable credit, and / or
job losses. In response, we reduced Continuing
Operations’ headcount by 15% (for the full year),
closed certain facilities, trimmed costs, and worked
short shifts. Importantly, we did not sacrifice long-term
opportunities, and have not reduced our spending on
product development and innovation.
2008 Results.Through mid-September our TSR performance was
impressive; we attained 35% TSR, while the average
for the S&P 500 was negative 18%. But by year-end
our TSR for 2008 had fallen to negative 7%, and the
S&P 500 collectively produced negative 37% TSR.
Though we met our goal to achieve TSR within the top
1/3 of the S&P 500 (in fact, we ranked within the top
10%), our TSR was well below our 12-15% long-term
target. We strongly believe that our TSR would have
been much lower had we not implemented, and made
significant progress on, the strategy we announced
in 2007.
Net SalesMillions of dollars
2500
4500
3500
4000
3000
0403 0605 0807
Dividends Per ShareCents
0
120
60
90
30
0403 0605 0807
0
30.0
15.0
22.5
7.5
0403 0605 0807
Net Debt to Net CapPercent
Adjusted Return on EquityPercent
2.0
14.0
8.0
11.0
5.0
0403 0605 0807
0
10.0
5.0
7.5
2.5
0403 0605 0807
Adjusted EBIT MarginPercent
Outstanding SharesMillions
0
200
100
150
50
0403 0605 0807
Cash from OperationsMillions of dollars
0
700
350
525
175
0403 0605 0807
Adjusted EPSDollars
.30
1.50
.90
1.20
.60
0403 0605 0807
Adjusted = excludes impairments, restructuring-related costs, one-time tax items, customer-related reserves, gains on sale, and other unusual items
23201rrdD2R1_nar.qxp:23201rrdD2R1 3/6/09 5:53 PM Page 12
David S. Haffner
Chief Executive Officerand President
Karl G. Glassman
Chief Operating Officerand Executive Vice President
February 25, 2009
13
We reported full year 2008 EPS of $.62. Per share
earnings from Continuing Operations, excluding
unusual costs (e.g. restructuring, impairments, one-time
tax items, etc.) decreased from $1.19 in 2007 to $.88
in 2008, primarily due to extremely weak market
demand. Sales from Continuing Operations decreased
4% to $4.1 billion, with unit volume decreasing more
than 10% versus 2007 levels. Cash flow from operations
was $436 million, well in excess of the $283 million
used to fund dividends and capital expenditures.
Strong FinancialPosition. We are well situated to weather the current challenging
economic environment, even if it lasts for an extended
period. We entered 2009 in an extremely strong financial
position with: i) more than $500 million available under
our commercial paper program and revolver facility,
ii) debt levels below our long-term target, and iii) no
significant long-term debt maturing until 2012. Though
we may choose to ride out this economic storm by
keeping debt below target levels, we have the ability
to readily fund stock repurchases, capital investments,
and / or acquisitions, and easily remain within our
targeted debt range.
We have been (for two decades), and expect to continue,
funding dividends and capital expenditures solely from
operating cash flow, which for 2009 is anticipated to
exceed $300 million. We intend to use excess cash flow
primarily to repurchase shares of our stock; however,
we may complete those purchases at a slower pace than
previously anticipated, depending on the outlook for the
economy. We have a standing authorization from the
Board of Directors to purchase up to 10 million shares
of our stock annually.
2009 and the Future. We are not idly sitting by, waiting for markets to
improve. Instead, we are actively continuing to
implement our strategic plan. During 2009 we expect
to improve capacity utilization, reduce overhead,
complete the remediation of underperforming facilities,
constrain spending, increase the dividend, and buy back
our stock.
It is important to note, as we currently focus on
improving returns, that sales growth will not be a
critical objective for the near future; however, over
time we anticipate 4-5% annual sales growth. EBIT
margin should gradually increase to our 11% target,
but not by 2010 (as previously expected) unless
market demand improves rapidly.
Over the longer term, we expect to employ all four
elements that contribute to TSR – sales growth, margin
improvement, dividends, and share buybacks – and
believe this multi-faceted approach has a higher
probability of generating top-tier TSR. We are fully
committed to consistently producing annual TSR that
places Leggett in the upper one-third of the S&P 500.
23201rrdD2R1_nar.qxp:23201rrdD2R1 3/6/09 5:53 PM Page 13
14
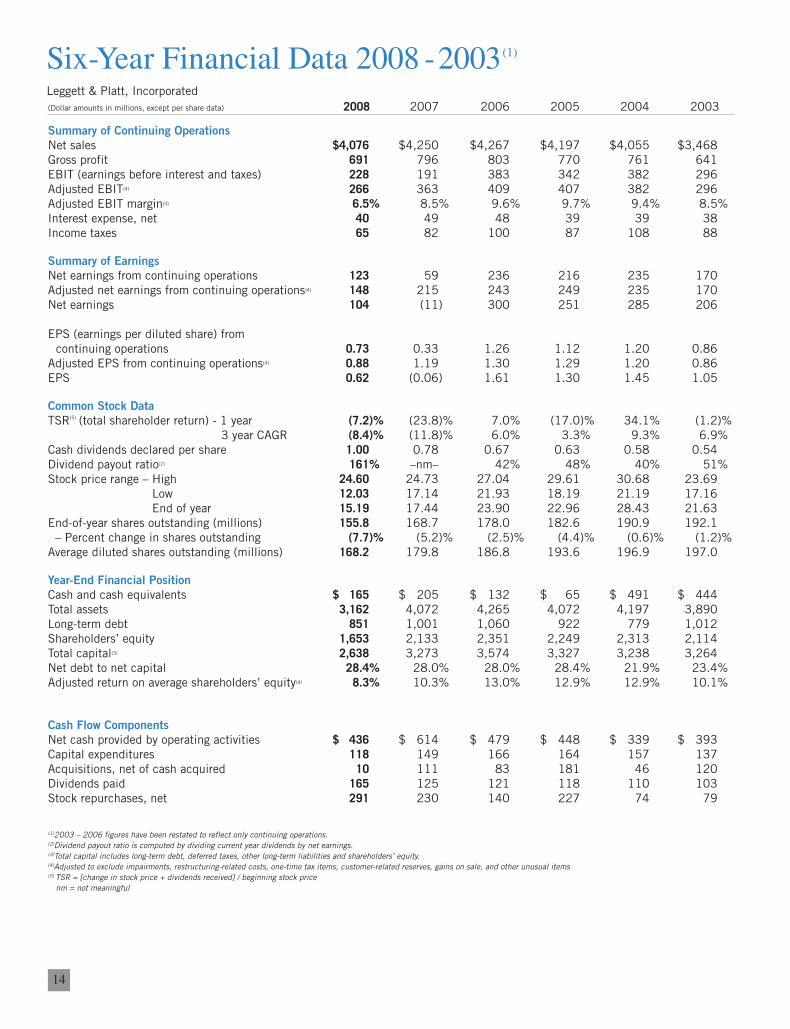
Six-Year Financial Data 2008 -2003(1)
(Dollar amounts in millions, except per share data) 2008 2007 2006 2005 2004 2003
Summary of Continuing Operations
Net sales $4,076 $4,250 $4,267 $4,197 $4,055 $3,468Gross profit 691 796 803 770 761 641EBIT (earnings before interest and taxes) 228 191 383 342 382 296Adjusted EBIT(4) 266 363 409 407 382 296Adjusted EBIT margin(4) 6.5% 8.5% 9.6% 9.7% 9.4% 8.5%Interest expense, net 40 49 48 39 39 38Income taxes 65 82 100 87 108 88
Summary of Earnings
Net earnings from continuing operations 123 59 236 216 235 170Adjusted net earnings from continuing operations(4) 148 215 243 249 235 170Net earnings 104 (11) 300 251 285 206
EPS (earnings per diluted share) fromcontinuing operations 0.73 0.33 1.26 1.12 1.20 0.86
Adjusted EPS from continuing operations(4) 0.88 1.19 1.30 1.29 1.20 0.86EPS 0.62 (0.06) 1.61 1.30 1.45 1.05
Common Stock Data
TSR(5) (total shareholder return) - 1 year (7.2)% (23.8)% 7.0% (17.0)% 34.1% (1.2)%3 year CAGR (8.4)% (11.8)% 6.0% 3.3% 9.3% 6.9%
Cash dividends declared per share 1.00 0.78 0.67 0.63 0.58 0.54Dividend payout ratio(2) 161% –nm– 42% 48% 40% 51%Stock price range – High 24.60 24.73 27.04 29.61 30.68 23.69
Low 12.03 17.14 21.93 18.19 21.19 17.16End of year 15.19 17.44 23.90 22.96 28.43 21.63
End-of-year shares outstanding (millions) 155.8 168.7 178.0 182.6 190.9 192.1– Percent change in shares outstanding (7.7)% (5.2)% (2.5)% (4.4)% (0.6)% (1.2)%
Average diluted shares outstanding (millions) 168.2 179.8 186.8 193.6 196.9 197.0
Year-End Financial Position
Cash and cash equivalents $ 165 $ 205 $ 132 $ 65 $ 491 $ 444Total assets 3,162 4,072 4,265 4,072 4,197 3,890Long-term debt 851 1,001 1,060 922 779 1,012Shareholders’ equity 1,653 2,133 2,351 2,249 2,313 2,114Total capital(3) 2,638 3,273 3,574 3,327 3,238 3,264Net debt to net capital 28.4% 28.0% 28.0% 28.4% 21.9% 23.4%Adjusted return on average shareholders’ equity(4) 8.3% 10.3% 13.0% 12.9% 12.9% 10.1%
Cash Flow Components
Net cash provided by operating activities $ 436 $ 614 $ 479 $ 448 $ 339 $ 393Capital expenditures 118 149 166 164 157 137Acquisitions, net of cash acquired 10 111 83 181 46 120Dividends paid 165 125 121 118 110 103Stock repurchases, net 291 230 140 227 74 79
(1)2003 – 2006 figures have been restated to reflect only continuing operations.(2)Dividend payout ratio is computed by dividing current year dividends by net earnings.(3)Total capital includes long-term debt, deferred taxes, other long-term liabilities and shareholders’ equity.(4)Adjusted to exclude impairments, restructuring-related costs, one-time tax items, customer-related reserves, gains on sale, and other unusual items(5) TSR = [change in stock price + dividends received] / beginning stock price
nm = not meaningful
Leggett & Platt, Incorporated
23201rrdD2R1_nar.qxp:23201rrdD2R1 3/6/09 5:53 PM Page 14
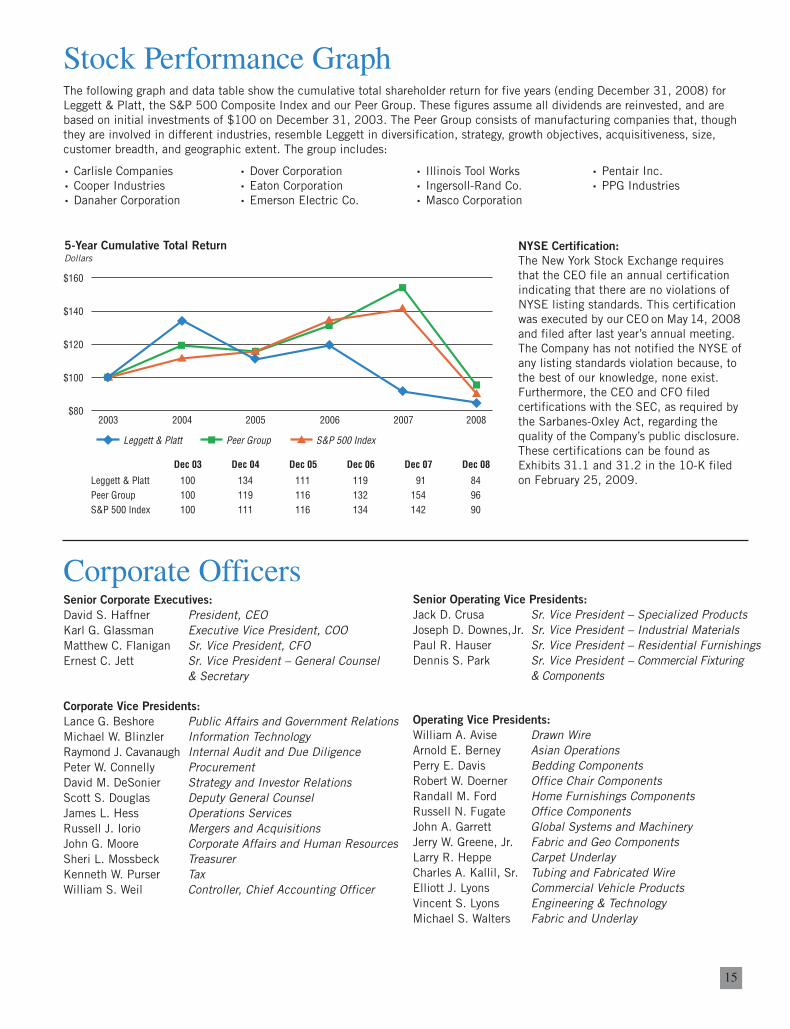
15
Stock Performance GraphThe following graph and data table show the cumulative total shareholder return for five years (ending December 31, 2008) forLeggett & Platt, the S&P 500 Composite Index and our Peer Group. These figures assume all dividends are reinvested, and arebased on initial investments of $100 on December 31, 2003. The Peer Group consists of manufacturing companies that, thoughthey are involved in different industries, resemble Leggett in diversification, strategy, growth objectives, acquisitiveness, size, customer breadth, and geographic extent. The group includes:
Senior Operating Vice Presidents:
Jack D. Crusa Sr. Vice President – Specialized ProductsJoseph D. Downes,Jr. Sr. Vice President – Industrial MaterialsPaul R. Hauser Sr. Vice President – Residential FurnishingsDennis S. Park Sr. Vice President – Commercial Fixturing
& Components
Operating Vice Presidents:
William A. Avise Drawn WireArnold E. Berney Asian OperationsPerry E. Davis Bedding ComponentsRobert W. Doerner Office Chair ComponentsRandall M. Ford Home Furnishings ComponentsRussell N. Fugate Office ComponentsJohn A. Garrett Global Systems and MachineryJerry W. Greene, Jr. Fabric and Geo ComponentsLarry R. Heppe Carpet UnderlayCharles A. Kallil, Sr. Tubing and Fabricated WireElliott J. Lyons Commercial Vehicle ProductsVincent S. Lyons Engineering & TechnologyMichael S. Walters Fabric and Underlay
Corporate OfficersSenior Corporate Executives:
David S. Haffner President, CEOKarl G. Glassman Executive Vice President, COOMatthew C. Flanigan Sr. Vice President, CFOErnest C. Jett Sr. Vice President – General Counsel
& Secretary
Corporate Vice Presidents:
Lance G. Beshore Public Affairs and Government RelationsMichael W. Blinzler Information TechnologyRaymond J. Cavanaugh Internal Audit and Due DiligencePeter W. Connelly Procurement David M. DeSonier Strategy and Investor RelationsScott S. Douglas Deputy General CounselJames L. Hess Operations ServicesRussell J. Iorio Mergers and AcquisitionsJohn G. Moore Corporate Affairs and Human ResourcesSheri L. Mossbeck TreasurerKenneth W. Purser TaxWilliam S. Weil Controller, Chief Accounting Officer
• Carlisle Companies• Cooper Industries• Danaher Corporation
• Dover Corporation• Eaton Corporation• Emerson Electric Co.
• Illinois Tool Works• Ingersoll-Rand Co.• Masco Corporation
• Pentair Inc.• PPG Industries
Leggett & PlattPeer GroupS&P 500 Index
100100100
Dec 03
134119111
Dec 04
111116116
Dec 05
119132134
Dec 06
191154142
Dec 07
849690
Dec 08
Leggett & Platt Peer Group S&P 500 Index
5-Year Cumulative Total ReturnDollars
$80
$100
$120
$140
$160
2003 2004 2005 2006 2007 2008
5-Year Cumulative Total ReturnDollars
NYSE Certification:
The New York Stock Exchange requiresthat the CEO file an annual certificationindicating that there are no violations ofNYSE listing standards. This certificationwas executed by our CEO on May 14, 2008and filed after last year’s annual meeting.The Company has not notified the NYSE ofany listing standards violation because, tothe best of our knowledge, none exist.Furthermore, the CEO and CFO filedcertifications with the SEC, as required bythe Sarbanes-Oxley Act, regarding thequality of the Company’s public disclosure.These certifications can be found asExhibits 31.1 and 31.2 in the 10-K filedon February 25, 2009.
23201rrdD2R1_nar.qxp:23201rrdD2R1 3/6/09 5:53 PM Page 15
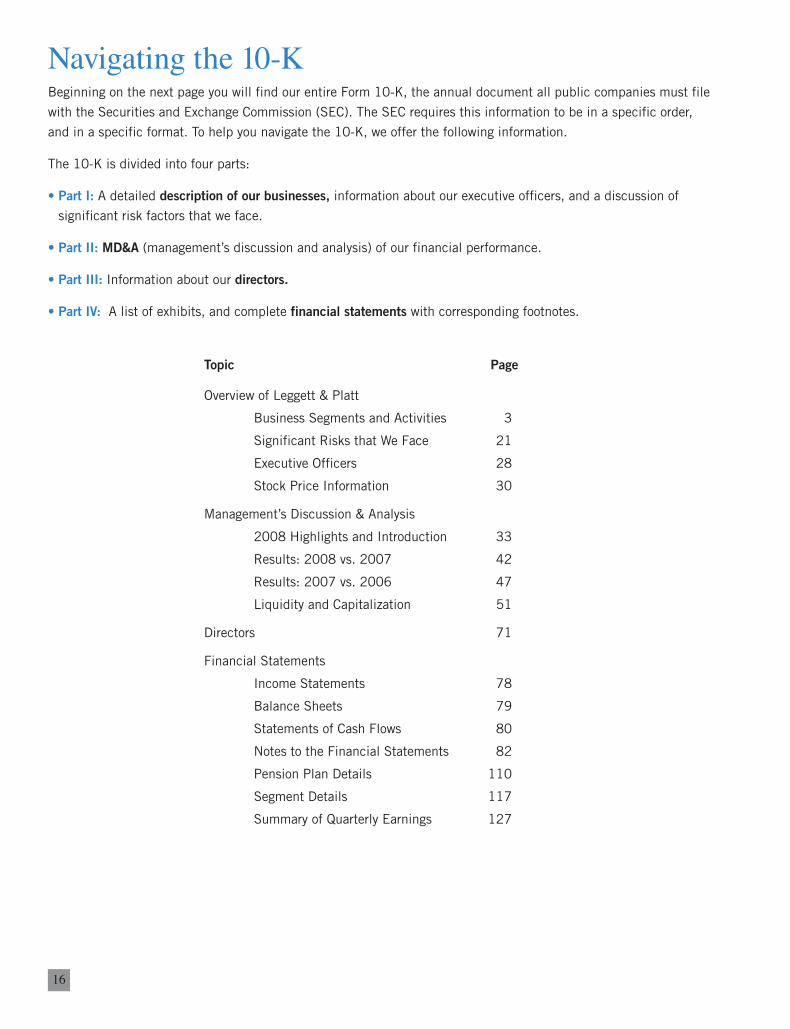
Navigating the 10-K Beginning on the next page you will find our entire Form 10-K, the annual document all public companies must file
with the Securities and Exchange Commission (SEC). The SEC requires this information to be in a specific order,
and in a specific format. To help you navigate the 10-K, we offer the following information.
The 10-K is divided into four parts:
• Part I: A detailed description of our businesses, information about our executive officers, and a discussion of
significant risk factors that we face.
• Part II: MD&A (management’s discussion and analysis) of our financial performance.
• Part III: Information about our directors.
• Part IV: A list of exhibits, and complete financial statements with corresponding footnotes.
Topic Page
Overview of Leggett & Platt
Business Segments and Activities 3
Significant Risks that We Face 21
Executive Officers 28
Stock Price Information 30
Management’s Discussion & Analysis
2008 Highlights and Introduction 33
Results: 2008 vs. 2007 42
Results: 2007 vs. 2006 47
Liquidity and Capitalization 51
Directors 71
Financial Statements
Income Statements 78
Balance Sheets 79
Statements of Cash Flows 80
Notes to the Financial Statements 82
Pension Plan Details 110
Segment Details 117
Summary of Quarterly Earnings 127
16
23201rrdD2R1_nar.qxp:23201rrdD2R1 3/6/09 6:31 PM Page 16
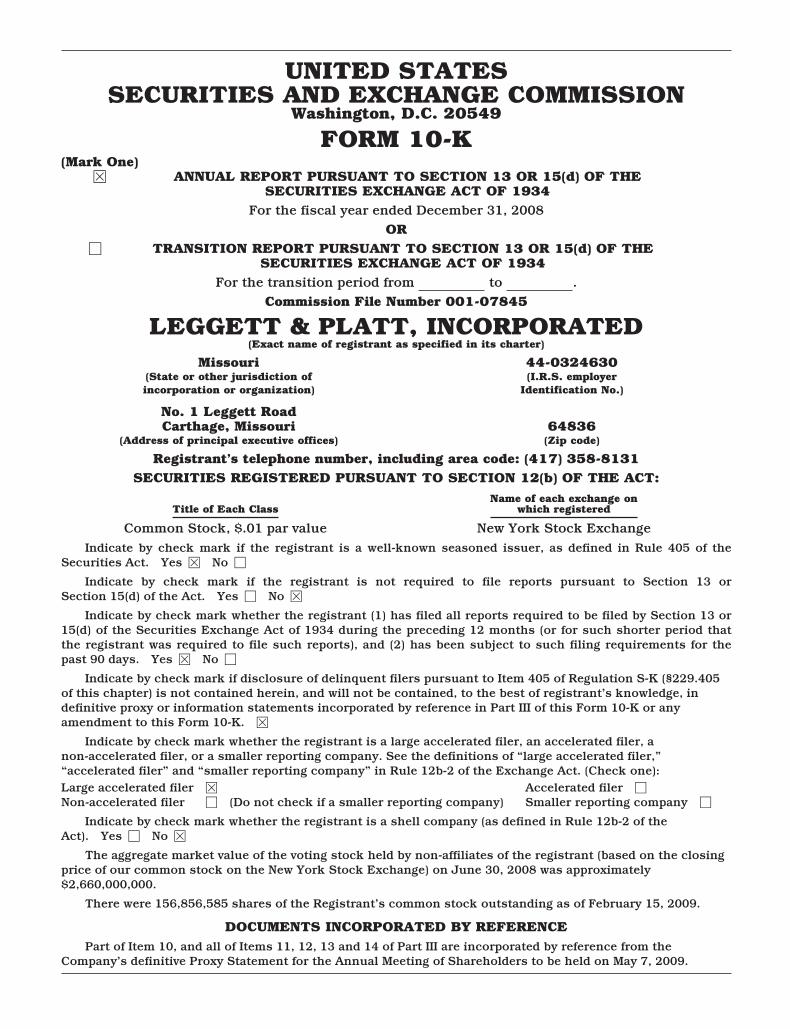
UNITED STATESSECURITIES AND EXCHANGE COMMISSION
Washington, D.C. 20549
FORM 10-K(Mark One)
È ANNUAL REPORT PURSUANT TO SECTION 13 OR 15(d) OF THESECURITIES EXCHANGE ACT OF 1934
For the fiscal year ended December 31, 2008OR
‘ TRANSITION REPORT PURSUANT TO SECTION 13 OR 15(d) OF THESECURITIES EXCHANGE ACT OF 1934
For the transition period from to .Commission File Number 001-07845
LEGGETT & PLATT, INCORPORATED(Exact name of registrant as specified in its charter)
Missouri 44-0324630(State or other jurisdiction ofincorporation or organization)
(I.R.S. employerIdentification No.)
No. 1 Leggett RoadCarthage, Missouri 64836
(Address of principal executive offices) (Zip code)
Registrant’s telephone number, including area code: (417) 358-8131SECURITIES REGISTERED PURSUANT TO SECTION 12(b) OF THE ACT:
Title of Each ClassName of each exchange on
which registered
Common Stock, $.01 par value New York Stock ExchangeIndicate by check mark if the registrant is a well-known seasoned issuer, as defined in Rule 405 of the
Securities Act. Yes È No ‘
Indicate by check mark if the registrant is not required to file reports pursuant to Section 13 orSection 15(d) of the Act. Yes ‘ No È
Indicate by check mark whether the registrant (1) has filed all reports required to be filed by Section 13 or15(d) of the Securities Exchange Act of 1934 during the preceding 12 months (or for such shorter period thatthe registrant was required to file such reports), and (2) has been subject to such filing requirements for thepast 90 days. Yes È No ‘
Indicate by check mark if disclosure of delinquent filers pursuant to Item 405 of Regulation S-K (§229.405of this chapter) is not contained herein, and will not be contained, to the best of registrant’s knowledge, indefinitive proxy or information statements incorporated by reference in Part III of this Form 10-K or anyamendment to this Form 10-K. È
Indicate by check mark whether the registrant is a large accelerated filer, an accelerated filer, anon-accelerated filer, or a smaller reporting company. See the definitions of “large accelerated filer,”“accelerated filer” and “smaller reporting company” in Rule 12b-2 of the Exchange Act. (Check one):Large accelerated filer È Accelerated filer ‘
Non-accelerated filer ‘ (Do not check if a smaller reporting company) Smaller reporting company ‘
Indicate by check mark whether the registrant is a shell company (as defined in Rule 12b-2 of theAct). Yes ‘ No È
The aggregate market value of the voting stock held by non-affiliates of the registrant (based on the closingprice of our common stock on the New York Stock Exchange) on June 30, 2008 was approximately$2,660,000,000.
There were 156,856,585 shares of the Registrant’s common stock outstanding as of February 15, 2009.
DOCUMENTS INCORPORATED BY REFERENCEPart of Item 10, and all of Items 11, 12, 13 and 14 of Part III are incorporated by reference from the
Company’s definitive Proxy Statement for the Annual Meeting of Shareholders to be held on May 7, 2009.
TABLE OF CONTENTSLEGGETT & PLATT, INCORPORATED—FORM 10-K
FOR THE YEAR ENDED DECEMBER 31, 2008Page
Number
Forward-Looking Statements . . . . . . . . . . . . . . . . . . . . . . . . . . . . . . . . . . . . . . . . . . . . . . . . . . . . 1
PART IItem 1. Business . . . . . . . . . . . . . . . . . . . . . . . . . . . . . . . . . . . . . . . . . . . . . . . . . . . . 3
Item 1A. Risk Factors . . . . . . . . . . . . . . . . . . . . . . . . . . . . . . . . . . . . . . . . . . . . . . . . . . 21
Item 1B. Unresolved Staff Comments . . . . . . . . . . . . . . . . . . . . . . . . . . . . . . . . . . . . . 24
Item 2. Properties . . . . . . . . . . . . . . . . . . . . . . . . . . . . . . . . . . . . . . . . . . . . . . . . . . . . 24
Item 3. Legal Proceedings . . . . . . . . . . . . . . . . . . . . . . . . . . . . . . . . . . . . . . . . . . . . . 26
Item 4. Submission of Matters to a Vote of Security Holders . . . . . . . . . . . . . . . . . . . 27
Supp. Item. Executive Officers of the Registrant . . . . . . . . . . . . . . . . . . . . . . . . . . . . . . . 28
PART IIItem 5. Market for Registrant’s Common Equity, Related Stockholder Matters and
Issuer Purchases of Equity Securities . . . . . . . . . . . . . . . . . . . . . . . . . . . . 30
Item 6. Selected Financial Data . . . . . . . . . . . . . . . . . . . . . . . . . . . . . . . . . . . . . . . . . 32
Item 7. Management’s Discussion and Analysis of Financial Condition and Resultsof Operation . . . . . . . . . . . . . . . . . . . . . . . . . . . . . . . . . . . . . . . . . . . . . . . . 33
Item 7A. Quantitative and Qualitative Disclosures About Market Risk . . . . . . . . . . . . . 68
Item 8. Financial Statements and Supplementary Data . . . . . . . . . . . . . . . . . . . . . . . 69
Item 9. Changes in and Disagreements With Accountants on Accounting andFinancial Disclosure . . . . . . . . . . . . . . . . . . . . . . . . . . . . . . . . . . . . . . . . . . 69
Item 9A. Controls and Procedures . . . . . . . . . . . . . . . . . . . . . . . . . . . . . . . . . . . . . . . . 69
Item 9B. Other Information . . . . . . . . . . . . . . . . . . . . . . . . . . . . . . . . . . . . . . . . . . . . . 70
PART IIIItem 10. Directors, Executive Officers and Corporate Governance . . . . . . . . . . . . . . . . 71
Item 11. Executive Compensation . . . . . . . . . . . . . . . . . . . . . . . . . . . . . . . . . . . . . . . . 73
Item 12. Security Ownership of Certain Beneficial Owners and Management andRelated Stockholder Matters . . . . . . . . . . . . . . . . . . . . . . . . . . . . . . . . . . . 73
Item 13. Certain Relationships and Related Transactions, and DirectorIndependence . . . . . . . . . . . . . . . . . . . . . . . . . . . . . . . . . . . . . . . . . . . . . . . 73
Item 14. Principal Accountant Fees and Services . . . . . . . . . . . . . . . . . . . . . . . . . . . . 73
PART IVItem 15. Exhibits, Financial Statement Schedules . . . . . . . . . . . . . . . . . . . . . . . . . . . 74
Signatures . . . . . . . . . . . . . . . . . . . . . . . . . . . . . . . . . . . . . . . . . . . . . . . . . . . . . . . . . . . . . . . . . . 129
Exhibit Index . . . . . . . . . . . . . . . . . . . . . . . . . . . . . . . . . . . . . . . . . . . . . . . . . . . . . . . . . . . . . . . . 131
Forward-Looking StatementsThis Annual Report on Form 10-K and our other public disclosures, whether written or
oral, may contain “forward-looking” statements including, but not limited to: projectionsof revenue, income, earnings, capital expenditures, dividends, capital structure, cash flowsor other financial items; possible plans, goals, objectives, prospects, strategies or trendsconcerning future operations; statements concerning future economic performance; andthe underlying assumptions relating to the forward-looking statements. These statementsare identified either by the context in which they appear or by use of words such as“anticipate,” “believe,” “estimate,” “expect,” “intends,” “may,” “plans,” “should” or thelike. All such forward-looking statements, whether written or oral, and whether made by usor on our behalf, are expressly qualified by the cautionary statements described in thisprovision.
Any forward-looking statement reflects only the beliefs of the Company or itsmanagement at the time the statement is made. Because all forward-looking statementsdeal with the future, they are subject to risks, uncertainties and developments whichmight cause actual events or results to differ materially from those envisioned or reflectedin any forward-looking statement. Moreover, we do not have, and do not undertake, anyduty to update or revise any forward-looking statement to reflect events or circumstancesafter the date on which the statement was made. For all of these reasons, forward-lookingstatements should not be relied upon as a prediction of actual future events, objectives,strategies, trends or results.
It is not possible to anticipate and list all risks, uncertainties and developments whichmay affect the future operations or performance of the Company, or which otherwise maycause actual events or results to differ from forward-looking statements. However, some ofthese risks and uncertainties include the following:
• our ability to maintain cash flow from operations and adequate liquidity in light ofthe recent distress in the financial markets and tightening of the credit markets(and the related impact on U.S. and global economies which has negativelyimpacted the demand for our products);
• our ability to maintain current credit ratings on our long-term debt and commercialpaper;
• factors that could impact raw materials and other costs, including the availabilityand pricing of steel rod and scrap and other raw materials, the availability of labor,wage rates and energy costs;
• our ability to pass along raw material cost increases through increased sellingprices;
• price and product competition from foreign (particularly Asian) and domesticcompetitors;
• our ability to improve operations and realize cost savings (including our ability tofix under-performing operations pursuant to our strategic plan);
1
• adverse changes in our competitive position, inflation, currency, political risk, U.S.or foreign laws or regulations, interest rates, housing turnover, employment levels,consumer sentiment, taxation and the like;
• factors that could affect the industries or markets in which we participate, such asgrowth rates and opportunities in those industries, or trends in capital spending;
• our ability to maintain profit margins if our customers change the quantity and mixof our components in their finished goods;
• a decline in the long-term outlook for any of our reporting units that could result ingoodwill impairment; and
• litigation including product liability and warranty, intellectual property, workers’compensation expense and alleged stock option backdating.
2
PART I
PART I
Item 1. Business.
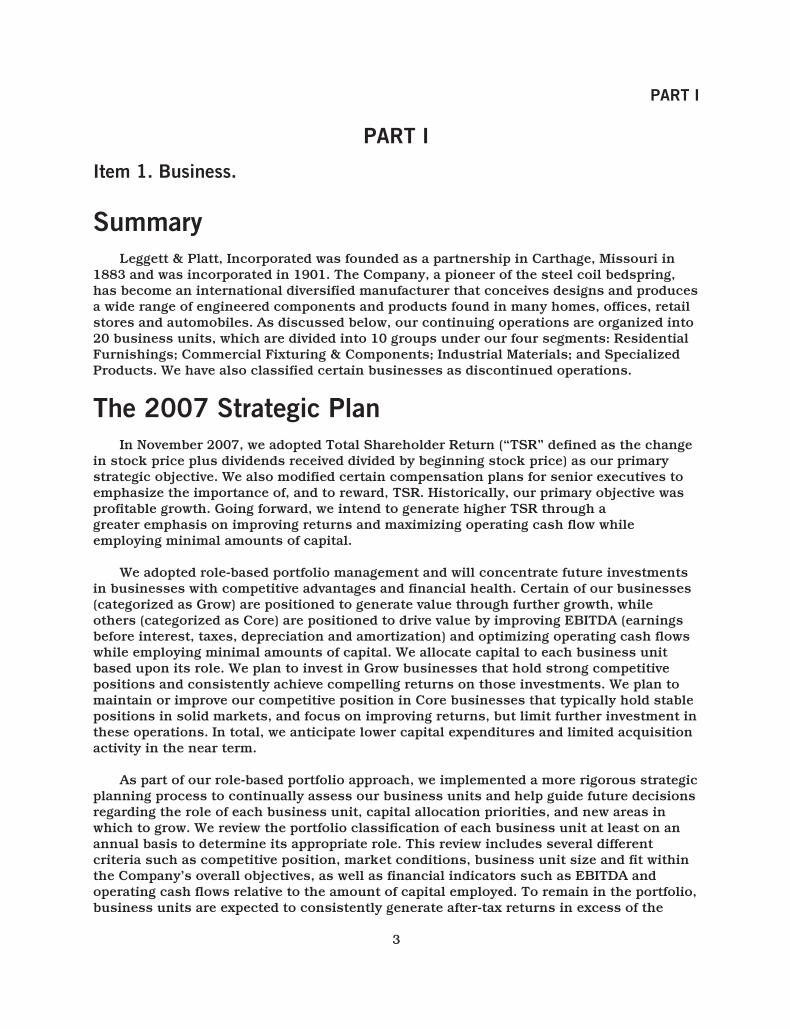
SummaryLeggett & Platt, Incorporated was founded as a partnership in Carthage, Missouri in
1883 and was incorporated in 1901. The Company, a pioneer of the steel coil bedspring,has become an international diversified manufacturer that conceives designs and producesa wide range of engineered components and products found in many homes, offices, retailstores and automobiles. As discussed below, our continuing operations are organized into20 business units, which are divided into 10 groups under our four segments: ResidentialFurnishings; Commercial Fixturing & Components; Industrial Materials; and SpecializedProducts. We have also classified certain businesses as discontinued operations.
The 2007 Strategic PlanIn November 2007, we adopted Total Shareholder Return (“TSR” defined as the change
in stock price plus dividends received divided by beginning stock price) as our primarystrategic objective. We also modified certain compensation plans for senior executives toemphasize the importance of, and to reward, TSR. Historically, our primary objective wasprofitable growth. Going forward, we intend to generate higher TSR through agreater emphasis on improving returns and maximizing operating cash flow whileemploying minimal amounts of capital.
We adopted role-based portfolio management and will concentrate future investmentsin businesses with competitive advantages and financial health. Certain of our businesses(categorized as Grow) are positioned to generate value through further growth, whileothers (categorized as Core) are positioned to drive value by improving EBITDA (earningsbefore interest, taxes, depreciation and amortization) and optimizing operating cash flowswhile employing minimal amounts of capital. We allocate capital to each business unitbased upon its role. We plan to invest in Grow businesses that hold strong competitivepositions and consistently achieve compelling returns on those investments. We plan tomaintain or improve our competitive position in Core businesses that typically hold stablepositions in solid markets, and focus on improving returns, but limit further investment inthese operations. In total, we anticipate lower capital expenditures and limited acquisitionactivity in the near term.
As part of our role-based portfolio approach, we implemented a more rigorous strategicplanning process to continually assess our business units and help guide future decisionsregarding the role of each business unit, capital allocation priorities, and new areas inwhich to grow. We review the portfolio classification of each business unit at least on anannual basis to determine its appropriate role. This review includes several differentcriteria such as competitive position, market conditions, business unit size and fit withinthe Company’s overall objectives, as well as financial indicators such as EBITDA andoperating cash flows relative to the amount of capital employed. To remain in the portfolio,business units are expected to consistently generate after-tax returns in excess of the
3
PART I
Company’s cost of capital. Business units may employ a variety of means to achieve higherreturns, including trimming expenses, introducing new products, improving productivity,adopting more disciplined pricing, reducing working capital, and consolidating assets.Business units that fail to attain minimum return goals typically will be moved to the Fixor Divest categories.
As part of our strategic plan, we eliminated approximately 20% of our revenue base, ofwhich 15% resulted from the divestiture of some operations and 5% from the pruning ofsome business and the closure of certain underperforming plants. The largest portion(approximately $485 million in annualized revenue) of the exit activities was the divestitureof the Company’s Aluminum Products segment which was sold in July 2008. The Companyalso sold four other business units in 2008—Wood Products and Fibers (previously in theResidential Furnishings segment); Plastics (previously in the Commercial Fixturing &Components segment); and the dealer portion of Commercial Vehicle Products (previouslyin the Specialized Products segment). Two additional business units are still targeted fordivestiture (Coated Fabrics and Storage Products). We are in discussions with potentialbuyers and expect to complete the remaining dispositions in the near term, althoughcurrent market conditions may impact the timing of these dispositions. To date, we havereceived after-tax cash proceeds of $408 million for the five divested businesses, notincluding subordinated notes and preferred stock.
In November 2007, the Store Fixtures business unit was placed in the Fix category andgiven a 12-month deadline by which to improve performance. As a part of this process, weeliminated approximately $100 million of the business unit’s least profitable revenue. Inthe third quarter of 2008, we concluded that the Store Fixtures business unit, in itscurrent form, was not capable of meeting our return requirements. Accordingly, wenarrowed the unit’s scope to focus primarily on the metals part of the fixtures industry, inalignment with the Company’s core competency of producing steel and steel-relatedproducts. We consolidated four wood store fixtures operations into two facilities, and willcontinue to produce a reduced amount of wood fixtures in order to meet the blendedrequirements (i.e. metal and wood) of certain of our customers. We also effected changesto senior management, further reduced the unit’s overhead and purged additionalcustomer accounts with unacceptable margins. These changes are expected to trim annualtrade sales for the Store Fixtures business unit from a run-rate in late 2008 ofapproximately $325 million to approximately $250-$275 million in 2009, and we expectannual returns to at least match our cost of capital. As a result of these changes, the unitis now considered a Core business within our portfolio. As such, its primary focus is tooptimize operating cash flow and improve profit while minimizing its use of capital.
Finally, we increased the quarterly dividend to the current rate of $.25 per share fromthe previous rate of $.18 per share and, in 2008, repurchased approximately 16 million, orapproximately 9%, of our shares outstanding at an average price of $18.70. In 2008, wefully exhausted our standing 10 million share annual repurchase authorization andpartially utilized our special authorization (which gave us the ability to purchase up to anadditional 20 million shares with proceeds from divestitures). We expect to continuepurchasing our shares, but the timing of the repurchases will depend upon several factors,including general economic and market conditions, the price of our stock and our workingcapital needs.
4
PART I
For information on asset impairments and restructuring costs associated with the2007 Strategic Plan see the discussion of “Asset Impairments and Restructuring-relatedCharges” in Item 7 Management’s Discussion and Analysis of Financial Condition andResults of Operation, on page 40, and Note C on page 91 and Note D on page 95 in theNotes to Consolidated Financial Statements.
Overview of Our Segments
Residential Furnishings Segment
Residential Furnishings
Furniture Group
Business Units: Business Units:
Furniture Hardware
Seating and Distribution
Consumer Products
Fabric & Carpet Underlay Group
Fabric Converting
Business Units:
Geo Components
Carpet Underlay
U.S. Spring
International Spring
Adjustable Beds
Bedding Group
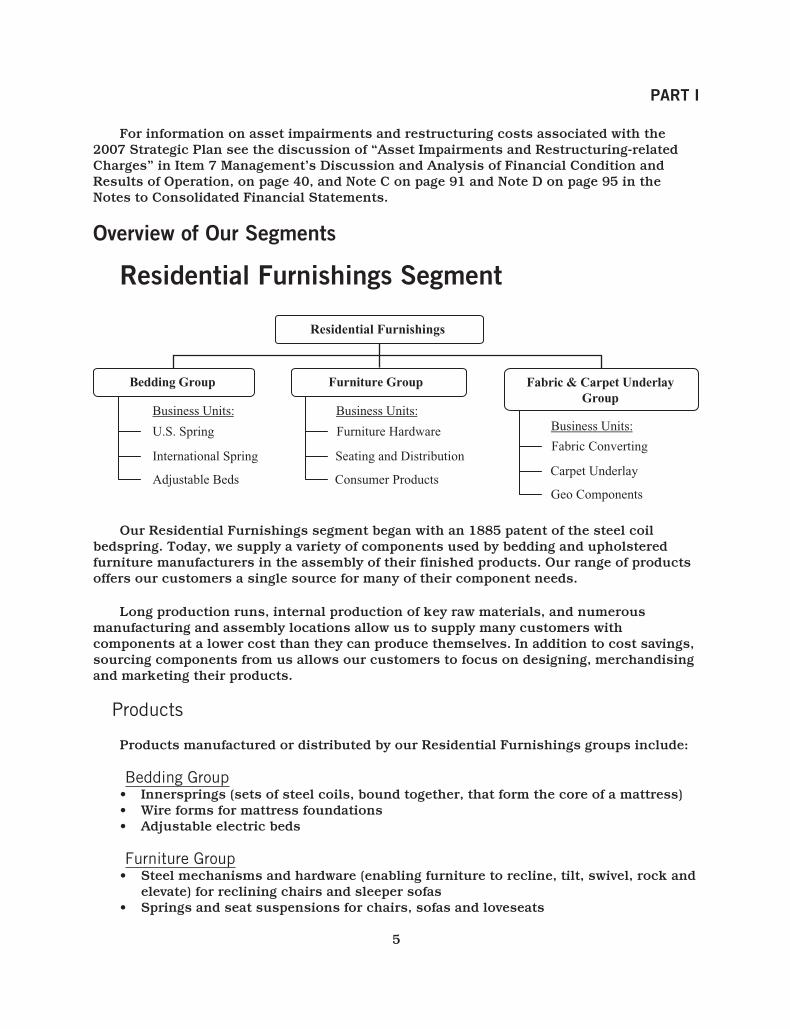
Our Residential Furnishings segment began with an 1885 patent of the steel coilbedspring. Today, we supply a variety of components used by bedding and upholsteredfurniture manufacturers in the assembly of their finished products. Our range of productsoffers our customers a single source for many of their component needs.
Long production runs, internal production of key raw materials, and numerousmanufacturing and assembly locations allow us to supply many customers withcomponents at a lower cost than they can produce themselves. In addition to cost savings,sourcing components from us allows our customers to focus on designing, merchandisingand marketing their products.
Products
Products manufactured or distributed by our Residential Furnishings groups include:
Bedding Group• Innersprings (sets of steel coils, bound together, that form the core of a mattress)• Wire forms for mattress foundations• Adjustable electric beds
Furniture Group• Steel mechanisms and hardware (enabling furniture to recline, tilt, swivel, rock and
elevate) for reclining chairs and sleeper sofas• Springs and seat suspensions for chairs, sofas and loveseats
5
PART I
• Steel tubular seat frames• Bed frames, ornamental beds, and “top-of-bed” accessories
Fabric & Carpet Underlay Group• Structural fabrics for mattresses, residential furniture and industrial uses• Carpet underlay materials (bonded scrap foam, felt, rubber and prime foam)• Geo components (synthetic fabrics and various other products used in ground
stabilization, drainage protection, erosion and weed control, as well as silt fencing)
Customers
Most of our Residential Furnishings customers are manufacturers of finished beddingproducts (mattresses and foundations) or upholstered furniture for residential use. Wealso sell many products, including ornamental beds, bed frames, adjustable beds, carpetunderlay, and top-of-bed accessories, directly to retailers and distributors. We sell geocomponents products primarily to dealers, contractors, landscapers, road constructioncompanies and government agencies.
Commercial Fixturing & Components Segment
Business Units:
Fixture & Display Group
Store Fixtures
Point-of-Purchase Displays
Commercial Fixturing & Components
Office Furniture Components Group
Business Units:
Office Furniture Components
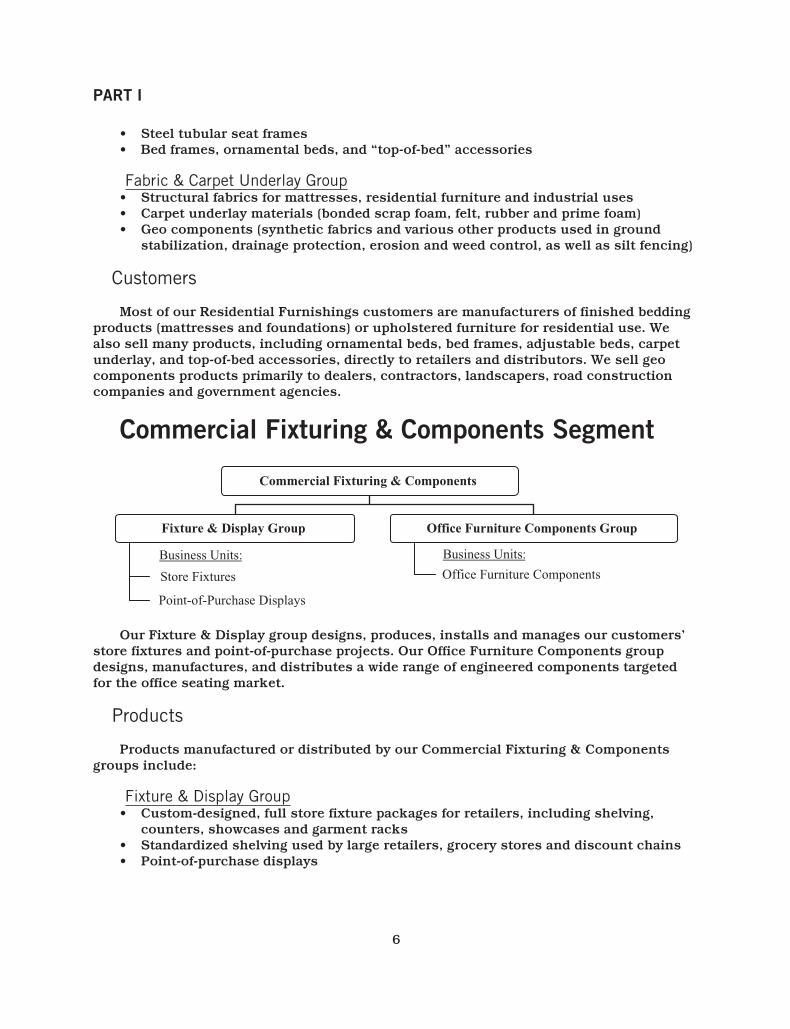
Our Fixture & Display group designs, produces, installs and manages our customers’store fixtures and point-of-purchase projects. Our Office Furniture Components groupdesigns, manufactures, and distributes a wide range of engineered components targetedfor the office seating market.
Products
Products manufactured or distributed by our Commercial Fixturing & Componentsgroups include:
Fixture & Display Group• Custom-designed, full store fixture packages for retailers, including shelving,
counters, showcases and garment racks• Standardized shelving used by large retailers, grocery stores and discount chains• Point-of-purchase displays
6
PART I
Office Furniture Components Group• Bases, columns, back rests, casters and frames for office chairs, and control
devices that allow office chairs to tilt, swivel and elevate
Customers
Customers of the Commercial Fixturing & Components segment include:• Retail chains and specialty shops• Brand name marketers and distributors of consumer products• Office, institutional and commercial furniture manufacturers
Industrial Materials Segment
Business Units:
Wire Group
Fabricated Wire
Business Units:
Wire Drawing
Wire Products
Industrial Materials
Tubing Group
Steel Tubing
Steel Rod
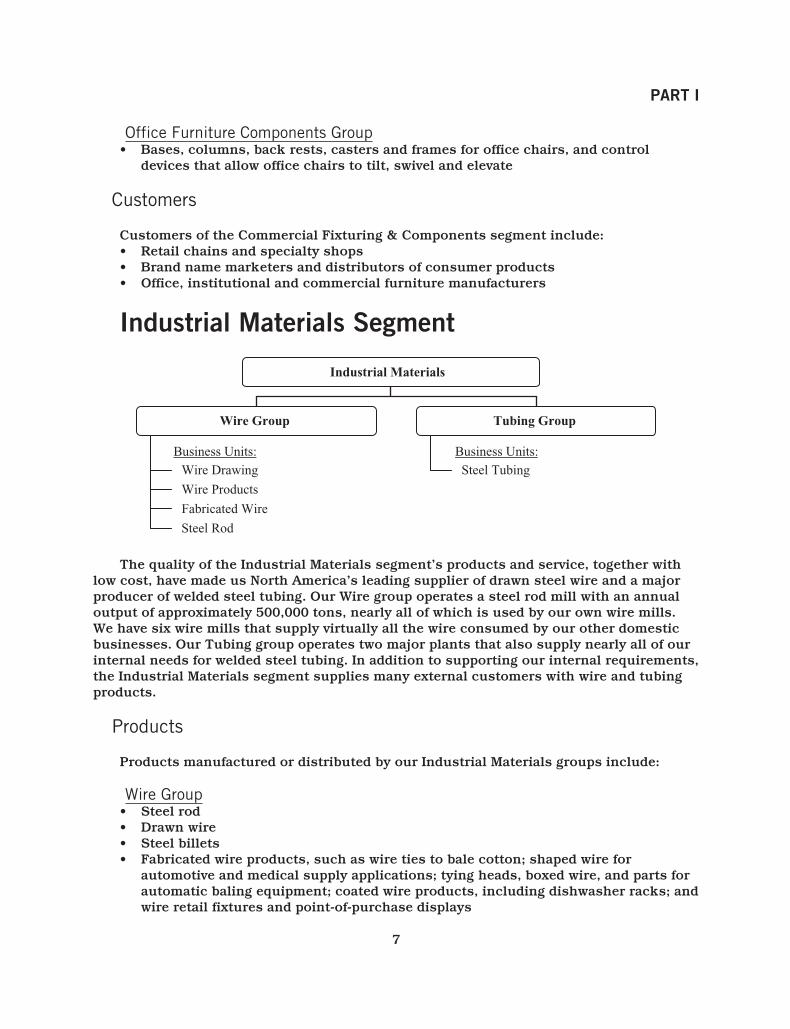
The quality of the Industrial Materials segment’s products and service, together withlow cost, have made us North America’s leading supplier of drawn steel wire and a majorproducer of welded steel tubing. Our Wire group operates a steel rod mill with an annualoutput of approximately 500,000 tons, nearly all of which is used by our own wire mills.We have six wire mills that supply virtually all the wire consumed by our other domesticbusinesses. Our Tubing group operates two major plants that also supply nearly all of ourinternal needs for welded steel tubing. In addition to supporting our internal requirements,the Industrial Materials segment supplies many external customers with wire and tubingproducts.
Products
Products manufactured or distributed by our Industrial Materials groups include:
Wire Group• Steel rod• Drawn wire• Steel billets• Fabricated wire products, such as wire ties to bale cotton; shaped wire for
automotive and medical supply applications; tying heads, boxed wire, and parts forautomatic baling equipment; coated wire products, including dishwasher racks; andwire retail fixtures and point-of-purchase displays
7
PART I
Tubing Group• Welded steel tubing• Fabricated tube components
Customers
We use about half of our wire output and about one-quarter of our welded steel tubingoutput to manufacture our own products. For example, we use our wire and steel tubing tomake:
• Bedding and furniture components• Motion furniture mechanisms• Commercial fixtures, point-of-purchase displays and shelving• Automotive seat components and frames
The Industrial Materials segment also has a diverse group of external customers,including:
• Bedding and furniture makers• Automotive seating manufacturers• Lawn and garden equipment manufacturers• Mechanical spring makers• Waste recyclers, waste removal businesses and cotton balers• Medical supply businesses
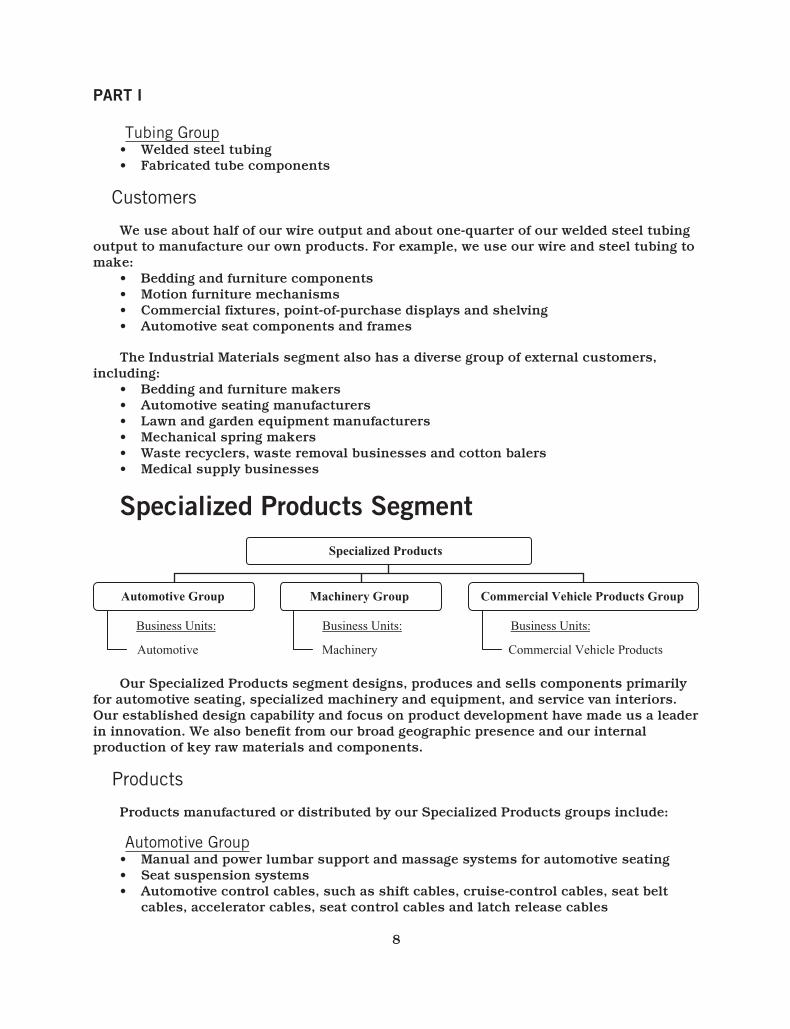
Specialized Products Segment
Automotive Group
Business Units:
Automotive
Specialized Products
Business Units:
Machinery Group
Machinery
Commercial Vehicle Products Group
Business Units:
Commercial Vehicle Products
Our Specialized Products segment designs, produces and sells components primarilyfor automotive seating, specialized machinery and equipment, and service van interiors.Our established design capability and focus on product development have made us a leaderin innovation. We also benefit from our broad geographic presence and our internalproduction of key raw materials and components.
Products
Products manufactured or distributed by our Specialized Products groups include:
Automotive Group• Manual and power lumbar support and massage systems for automotive seating• Seat suspension systems• Automotive control cables, such as shift cables, cruise-control cables, seat belt
cables, accelerator cables, seat control cables and latch release cables
8
PART I
• Low voltage motors and actuation assemblies• Formed metal and wire components for seat frames
Machinery Group• Full range of quilting machines for mattress covers• Machines used to shape wire into various types of springs• Industrial sewing/finishing machines
Commercial Vehicle Products Group• Van interiors (the racks, shelving and cabinets installed in service vans)• Docking stations that mount computers and other electronic equipment inside
vehicles• Specialty trailers used by telephone, cable and utility companies
Customers
Our primary customers for the Specialized Products segment include:• Automobile seating manufacturers• Bedding manufacturers• Telecom, cable, home service and delivery companies
Acquisitions and DivestituresHistorically, our typical acquisition targets have been small, private, profitable,
entrepreneurial companies that manufacture goods either within our existing product linesor “one step away” from those product lines and complementary to our existingbusinesses. As part of the 2007 Strategic Plan, we expect fewer and more strategicacquisitions to be completed. All acquisitions should create value by enhancing TSR; theyshould have clear strategic rationale and sustainable competitive advantage in attractivemarkets.
2008 Acquisitions
We had no significant acquisitions in 2008.
2007 Acquisitions
We acquired three businesses during 2007 with annualized sales of approximately$100 million broken down by segment as follows:
Commercial Fixturing & Components . . . . . . . . . . . . . . . . . . . . . $20 millionIndustrial Materials . . . . . . . . . . . . . . . . . . . . . . . . . . . . . . . . . . . . . $50 millionSpecialized Products . . . . . . . . . . . . . . . . . . . . . . . . . . . . . . . . . . . $30 million
In Commercial Fixturing & Components we added one business located in China whichproduces office chair controls. We also added one business to the Industrial Materialssegment, which produces coated wire products, including racks for dishwashers. Finally,
9
PART I
in the Specialized Products segment, we added a business which is a designer andassembler of docking stations that secure computer and other electronic equipment insidevehicles.
2006 Acquisitions
We acquired five businesses in 2006 with annualized sales of about $75 million. All ofthe transactions occurred in the Residential Furnishings segment. These acquisitionsbroadened our geographic presence and product offering in geo components, expanded ourcarpet underlay business, and added to our international spring operations.
For further information about acquisitions, see Note G on page 100 of the Notes toConsolidated Financial Statements.
2008 Divestitures
We divested five significant businesses in 2008 with annualized sales of approximately$780 million. The largest divestiture (approximately $485 million in annualized revenue)was the Aluminum Products segment which was sold in July 2008. We also sold four otherbusiness units in 2008 – Wood Products and Fibers (previously in the ResidentialFurnishings segment); Plastics (previously in the Commercial Fixturing & Componentssegment); and the dealer portion of Commercial Vehicle Products (previously in theSpecialized Products segment). Two additional business units are targeted for divestiture(Coated Fabrics and Storage Products). We are in discussions with potential buyers andexpect to complete the remaining dispositions in the near term, although current marketconditions may impact the timing of these dispositions. To date, we have received after-taxcash proceeds of approximately $408 million for the five divested businesses, notincluding subordinated notes and preferred stock. All of these businesses have beenclassified as discontinued operations.
2007 Divestitures
In the first quarter of 2007, we divested our Prime Foam Products business unit(previously in the Residential Furnishings segment) and received after-tax cash proceeds ofapproximately $70 million. Our former Prime Foam Products business unit had annualrevenue of approximately $190 million and has been classified as a discontinuedoperation.
For further information about divestitures and discontinued operations, see Note B onpage 88 of the Notes to Consolidated Financial Statements.
New Product DevelopmentIn 2007, we introduced a significant, new proprietary innerspring design to the bedding
market. This new patented product, Verticoil®, provides an attractive alternative to genericBonnell innersprings that have been available in the market for decades. Verticoil provides
10
PART I
our customers unique surface and structural features that we believe are preferable overthose of Bonnell innersprings. In addition to offering value to our customers, the uniquedesign of Verticoil® enables us to produce these innersprings using less steel wire, whichrepresents a cost savings that provides enhanced margins for Leggett.
We began ramping up production of Verticoil® in 2008, and conversion from Bonnellinnersprings to Verticoil® is continuing in 2009.
Segment Financial InformationFor information about sales to external customers, sales by product line, earnings
before interest and taxes, and total assets of each of our segments, refer to Note O on page117 of the Notes to Consolidated Financial Statements.
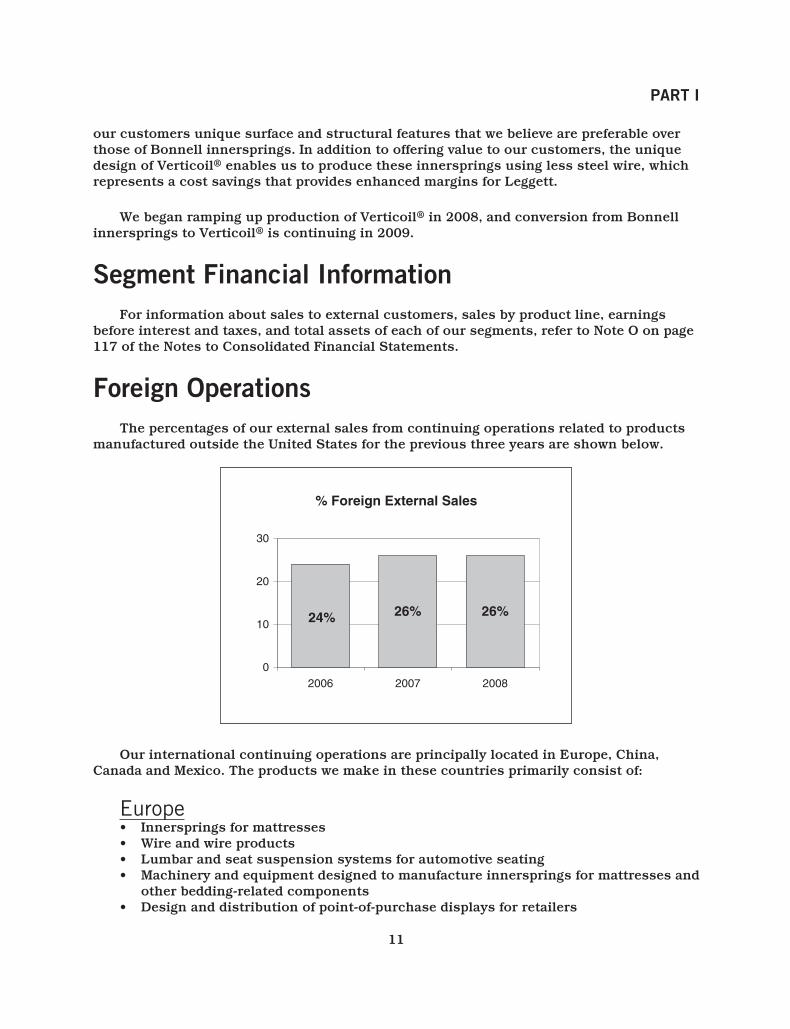
Foreign OperationsThe percentages of our external sales from continuing operations related to products
manufactured outside the United States for the previous three years are shown below.
% Foreign External Sales
0
10
20
30
24% 26% 26%
2006 2007 2008
Our international continuing operations are principally located in Europe, China,Canada and Mexico. The products we make in these countries primarily consist of:
Europe• Innersprings for mattresses• Wire and wire products• Lumbar and seat suspension systems for automotive seating• Machinery and equipment designed to manufacture innersprings for mattresses and
other bedding-related components• Design and distribution of point-of-purchase displays for retailers
11
PART I
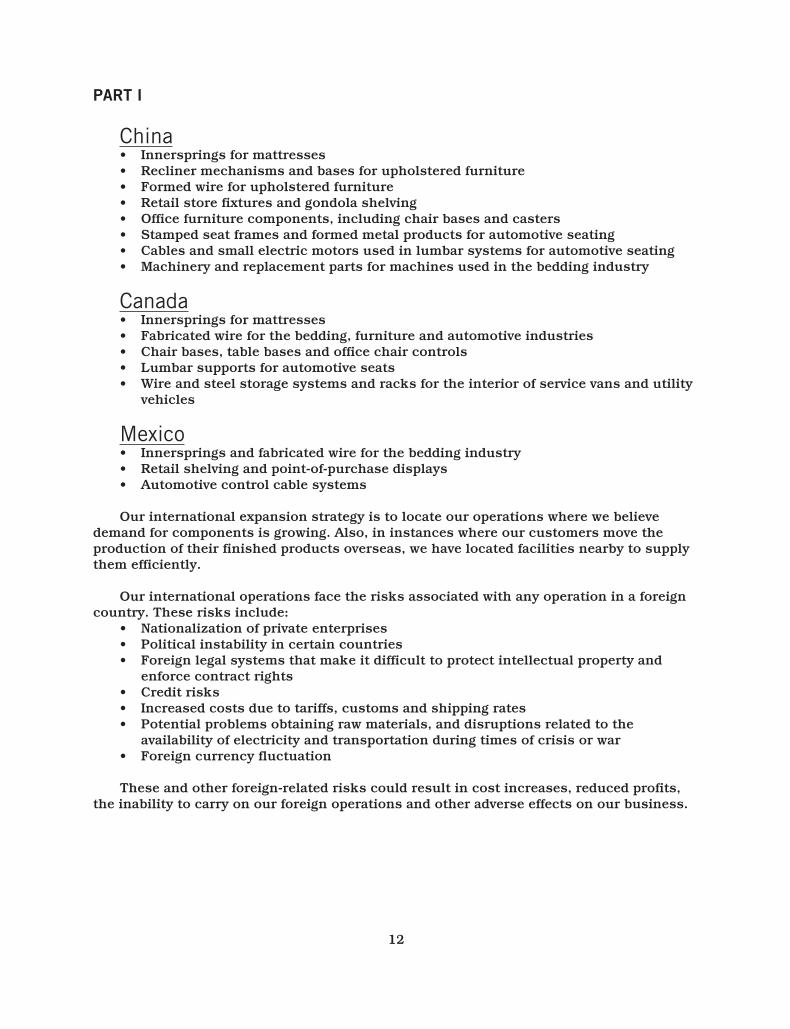
China• Innersprings for mattresses• Recliner mechanisms and bases for upholstered furniture• Formed wire for upholstered furniture• Retail store fixtures and gondola shelving• Office furniture components, including chair bases and casters• Stamped seat frames and formed metal products for automotive seating• Cables and small electric motors used in lumbar systems for automotive seating• Machinery and replacement parts for machines used in the bedding industry
Canada• Innersprings for mattresses• Fabricated wire for the bedding, furniture and automotive industries• Chair bases, table bases and office chair controls• Lumbar supports for automotive seats• Wire and steel storage systems and racks for the interior of service vans and utility
vehicles
Mexico• Innersprings and fabricated wire for the bedding industry• Retail shelving and point-of-purchase displays• Automotive control cable systems
Our international expansion strategy is to locate our operations where we believedemand for components is growing. Also, in instances where our customers move theproduction of their finished products overseas, we have located facilities nearby to supplythem efficiently.
Our international operations face the risks associated with any operation in a foreigncountry. These risks include:
• Nationalization of private enterprises• Political instability in certain countries• Foreign legal systems that make it difficult to protect intellectual property and
enforce contract rights• Credit risks• Increased costs due to tariffs, customs and shipping rates• Potential problems obtaining raw materials, and disruptions related to the
availability of electricity and transportation during times of crisis or war• Foreign currency fluctuation
These and other foreign-related risks could result in cost increases, reduced profits,the inability to carry on our foreign operations and other adverse effects on our business.
12
PART I
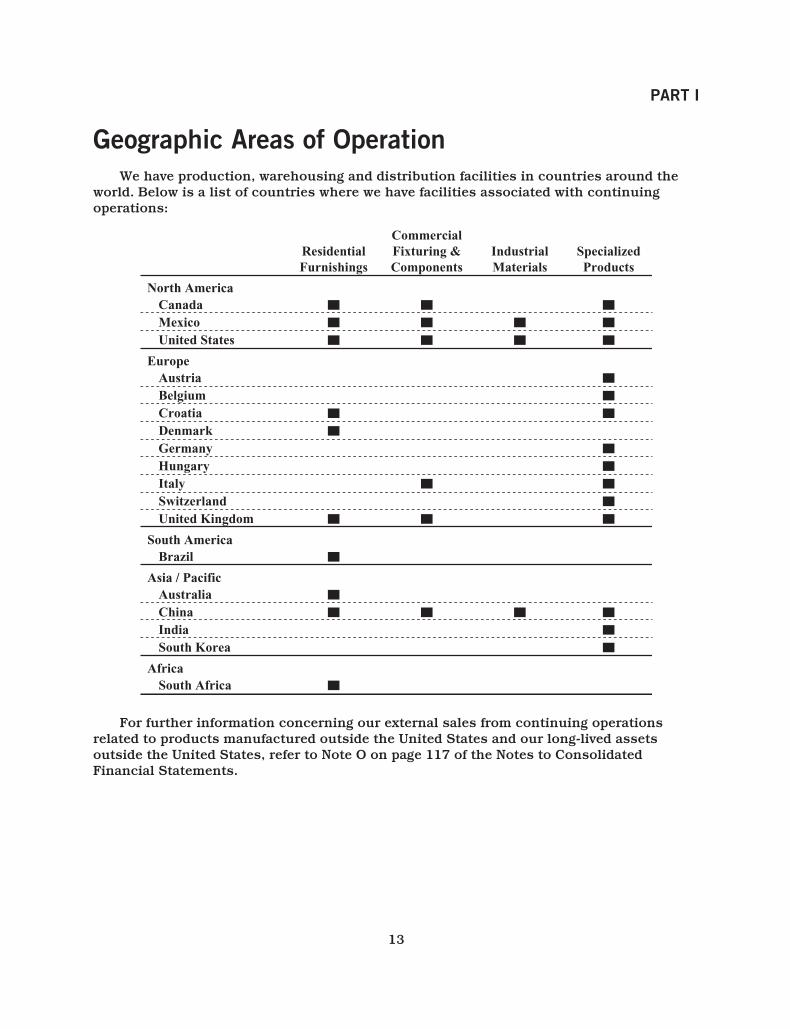
Geographic Areas of OperationWe have production, warehousing and distribution facilities in countries around the
world. Below is a list of countries where we have facilities associated with continuingoperations:
Canada Mexico United States
Austria Belgium Croatia Denmark Germany Hungary Italy Switzerland United Kingdom
Brazil
Australia China India South Korea
South Africa
North America
Europe
South America
Asia / Pacific
Africa
ResidentialFurnishings
CommercialFixturing &Components
IndustrialMaterials
SpecializedProducts
For further information concerning our external sales from continuing operationsrelated to products manufactured outside the United States and our long-lived assetsoutside the United States, refer to Note O on page 117 of the Notes to ConsolidatedFinancial Statements.
13
PART I
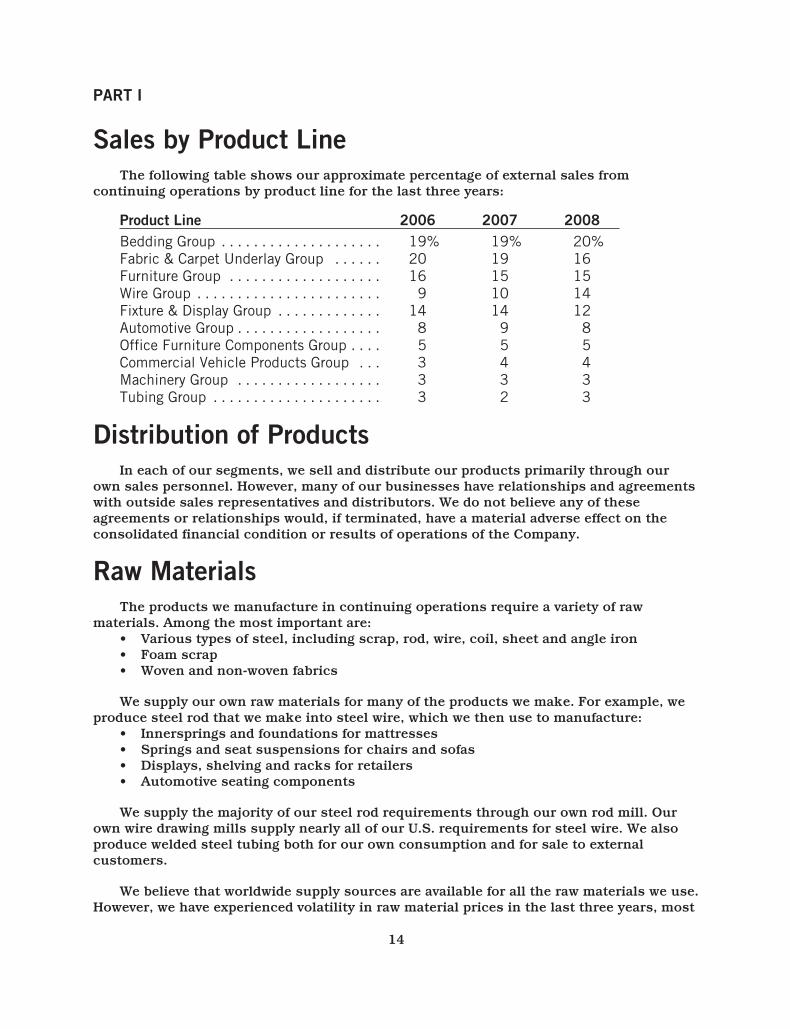
Sales by Product LineThe following table shows our approximate percentage of external sales from
continuing operations by product line for the last three years:
Product Line 2006 2007 2008Bedding Group . . . . . . . . . . . . . . . . . . . . 19% 19% 20%Fabric & Carpet Underlay Group . . . . . . 20 19 16Furniture Group . . . . . . . . . . . . . . . . . . . 16 15 15Wire Group . . . . . . . . . . . . . . . . . . . . . . . 9 10 14Fixture & Display Group . . . . . . . . . . . . . 14 14 12Automotive Group . . . . . . . . . . . . . . . . . . 8 9 8Office Furniture Components Group . . . . 5 5 5Commercial Vehicle Products Group . . . 3 4 4Machinery Group . . . . . . . . . . . . . . . . . . 3 3 3Tubing Group . . . . . . . . . . . . . . . . . . . . . 3 2 3
Distribution of ProductsIn each of our segments, we sell and distribute our products primarily through our
own sales personnel. However, many of our businesses have relationships and agreementswith outside sales representatives and distributors. We do not believe any of theseagreements or relationships would, if terminated, have a material adverse effect on theconsolidated financial condition or results of operations of the Company.
Raw MaterialsThe products we manufacture in continuing operations require a variety of raw
materials. Among the most important are:• Various types of steel, including scrap, rod, wire, coil, sheet and angle iron• Foam scrap• Woven and non-woven fabrics
We supply our own raw materials for many of the products we make. For example, weproduce steel rod that we make into steel wire, which we then use to manufacture:
• Innersprings and foundations for mattresses• Springs and seat suspensions for chairs and sofas• Displays, shelving and racks for retailers• Automotive seating components
We supply the majority of our steel rod requirements through our own rod mill. Ourown wire drawing mills supply nearly all of our U.S. requirements for steel wire. We alsoproduce welded steel tubing both for our own consumption and for sale to externalcustomers.
We believe that worldwide supply sources are available for all the raw materials we use.However, we have experienced volatility in raw material prices in the last three years, most
14
PART I
notably in steel. Early in 2007 the cost of steel scrap increased, leading to higher rodcosts. We implemented price increases to pass through some of these costs. In late 2007,once again we began experiencing higher steel costs, and significant increases occurred in2008. We implemented price increases to recover most of these higher costs. Market pricesbegan to abate late in 2008, but for certain types of steel, continued to be well above 2007levels.
The future pricing of raw materials is uncertain. The degree to which we are able tomitigate or recover higher costs, should they occur, could influence our future earnings.Also, if raw material costs decrease there may be downward pressure on selling prices,temporarily resulting in lower segment margins as we consume higher cost inventories.
Higher raw material costs have led some of our customers to modify their productdesigns, changing the quantity and mix of our components in their finished goods. In somecases, higher cost components have been replaced with lower cost components, causingus to shift production accordingly. This has primarily impacted profit margins in ourResidential Furnishings and Industrial Materials segments. We have responded bydeveloping new products (including new types of innersprings and box springs) that enableour customers to reduce their total costs, and in certain instances, provide higher marginand profit contribution for our operations.
Customer ConcentrationWe serve thousands of customers worldwide, sustaining many long-term business
relationships. In 2008, no customer accounted for more than 5% of our consolidatedrevenues from continuing operations. Our top 10 customers accounted for approximately20% of these consolidated revenues.
Specialized Products has one customer whose purchases accounted for approximately13% of the segment’s sales from continuing operations in 2008. The loss of this customermay have a material adverse effect upon the segment.
15
PART I
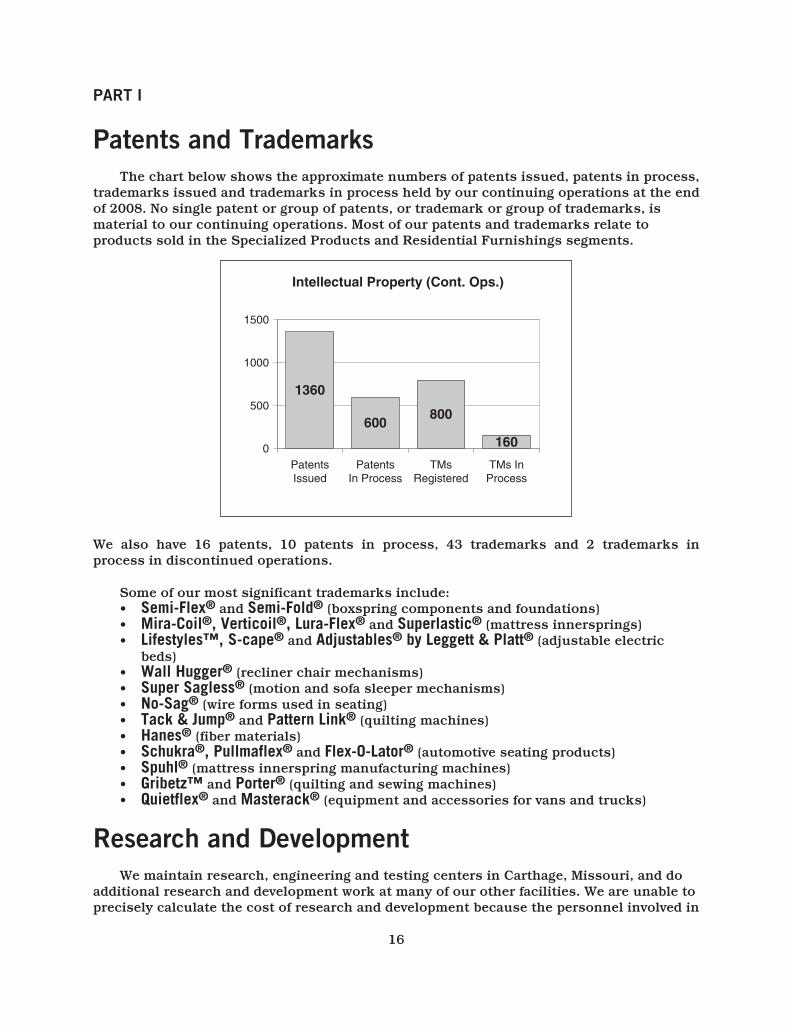
Patents and TrademarksThe chart below shows the approximate numbers of patents issued, patents in process,
trademarks issued and trademarks in process held by our continuing operations at the endof 2008. No single patent or group of patents, or trademark or group of trademarks, ismaterial to our continuing operations. Most of our patents and trademarks relate toproducts sold in the Specialized Products and Residential Furnishings segments.
Intellectual Property (Cont. Ops.)
0
500
1000
1500
PatentsIssued
PatentsIn Process
TMsRegistered
TMs InProcess
1360
800600
160
We also have 16 patents, 10 patents in process, 43 trademarks and 2 trademarks inprocess in discontinued operations.
Some of our most significant trademarks include:• Semi-Flex® and Semi-Fold® (boxspring components and foundations)• Mira-Coil®, Verticoil®, Lura-Flex® and Superlastic® (mattress innersprings)• Lifestyles™, S-cape® and Adjustables® by Leggett & Platt® (adjustable electric
beds)• Wall Hugger® (recliner chair mechanisms)• Super Sagless® (motion and sofa sleeper mechanisms)• No-Sag® (wire forms used in seating)• Tack & Jump® and Pattern Link® (quilting machines)• Hanes® (fiber materials)• Schukra®, Pullmaflex® and Flex-O-Lator® (automotive seating products)• Spuhl® (mattress innerspring manufacturing machines)• Gribetz™ and Porter® (quilting and sewing machines)• Quietflex® and Masterack® (equipment and accessories for vans and trucks)
Research and DevelopmentWe maintain research, engineering and testing centers in Carthage, Missouri, and do
additional research and development work at many of our other facilities. We are unable toprecisely calculate the cost of research and development because the personnel involved in
16
PART I
product and machinery development also spend portions of their time in other areas.However, we estimate the cost of research and development associated with continuingoperations was approximately $25 to $30 million in each of the last three years.
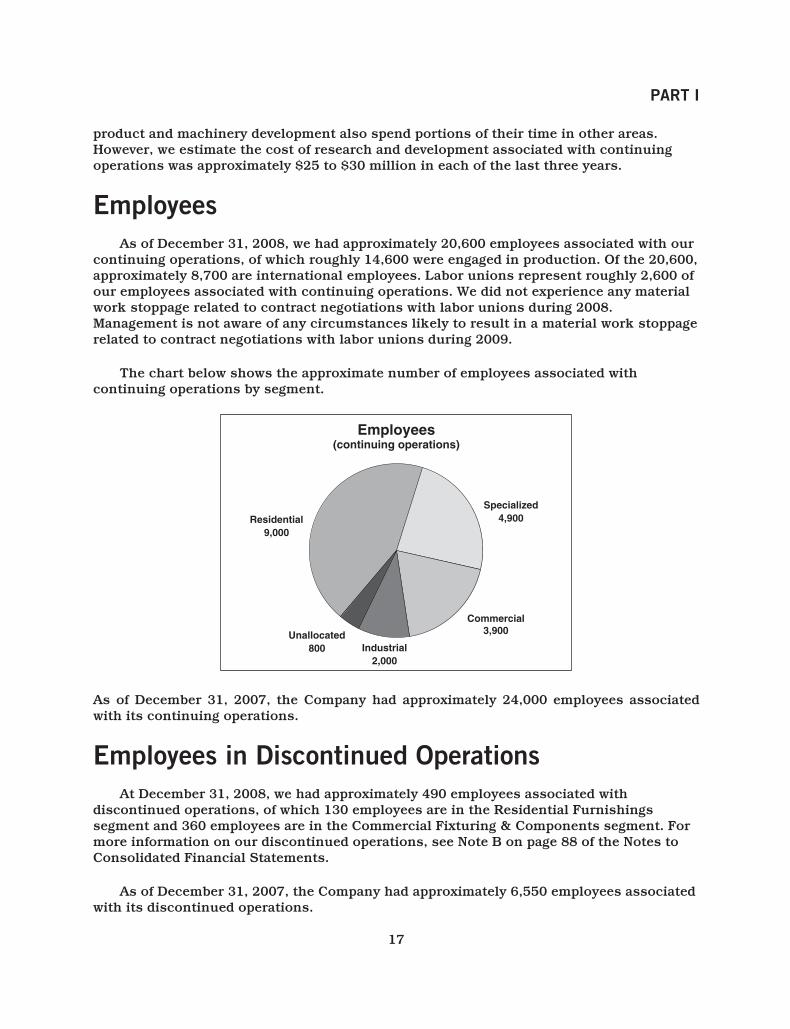
EmployeesAs of December 31, 2008, we had approximately 20,600 employees associated with our
continuing operations, of which roughly 14,600 were engaged in production. Of the 20,600,approximately 8,700 are international employees. Labor unions represent roughly 2,600 ofour employees associated with continuing operations. We did not experience any materialwork stoppage related to contract negotiations with labor unions during 2008.Management is not aware of any circumstances likely to result in a material work stoppagerelated to contract negotiations with labor unions during 2009.
The chart below shows the approximate number of employees associated withcontinuing operations by segment.
Employees(continuing operations)
Residential9,000
Unallocated800 Industrial
2,000
Commercial3,900
Specialized4,900
As of December 31, 2007, the Company had approximately 24,000 employees associatedwith its continuing operations.
Employees in Discontinued OperationsAt December 31, 2008, we had approximately 490 employees associated with
discontinued operations, of which 130 employees are in the Residential Furnishingssegment and 360 employees are in the Commercial Fixturing & Components segment. Formore information on our discontinued operations, see Note B on page 88 of the Notes toConsolidated Financial Statements.
As of December 31, 2007, the Company had approximately 6,550 employees associatedwith its discontinued operations.
17
PART I
CompetitionMany companies offer products that compete with those we manufacture and sell. The
number of competing companies varies by product line, but many of the markets for ourproducts are highly competitive. We tend to attract and retain customers through productquality, innovation, competitive pricing and customer service. Many of our competitors tryto win business primarily on price but, depending upon the particular product, weexperience competition based on quality, performance and availability as well.
We believe we are the largest independent manufacturer in North America, in terms ofrevenue, of the following:
• Components for residential furniture and bedding• Carpet underlay• Components for office furniture• Drawn steel wire• Automotive seat support and lumbar systems• Adjustable beds• Bedding industry machinery for wire forming, sewing and quilting
We face increasing pressure from foreign competitors as some of our customerssource a portion of their components and finished products from Asia. In instances whereour customers move production of their finished products overseas, we believe ouroperations should be located nearby to supply them efficiently. Accordingly, at the end of2008, Leggett operated 11 facilities in China.
In recent years we experienced increased competition in the U.S. from foreign beddingcomponent manufacturers. We reacted to this competition by selectively adjusting prices,and by developing new proprietary products that help our customers reduce total costs.The increased price competition for bedding components was partially due to lower wirecosts in China. Asian manufacturers benefit from cost advantages for commodities such assteel and chemicals. Foreign manufacturers also benefit from lenient regulatory climatesrelated to safety and environmental matters. In late 2007, we filed an antidumping suitrelated to innerspring imports from China, South Africa and Vietnam. We saw a distinctdecline in unfair imports during 2008 after the antidumping investigations began, and as aresult, we regained market share. The investigations were brought to a favorableconclusion in early 2009. We should see improved performance in our Bedding group asimported innersprings from these countries will now have to be sold at fair prices. Thecurrent antidumping duty rates on innersprings from these countries aresignificant, ranging from 116% to 234%, and will remain in effect for at least 5 years.
SeasonalityAs a diversified manufacturer, we generally have not experienced significant
seasonality. The timing of acquisitions, dispositions, and economic factors in any year candistort the underlying seasonality in certain of our businesses. Nevertheless, for theCompany as a whole, the second and third quarters typically have proportionately greatersales, while the first and fourth quarters are generally lower.
18
PART I
Our four segments tend to experience seasonality as follows:• Residential Furnishings: typically has the strongest sales in the second and third
quarters due to increased consumer demand for bedding and furniture during thoseperiods.
• Commercial Fixturing & Components: generally has heavy third quarter sales of itsstore fixture products, with the first and fourth quarters normally lower. This alignswith the retail industry’s normal construction cycle—the opening of new stores andcompletion of remodeling projects in advance of the holiday season.
• Industrial Materials: minimal variation in sales throughout the year.• Specialized Products: relatively little quarter-to-quarter variation in sales, although
the automotive business is somewhat heavier in the second and fourth quarters ofthe year and lower in the third quarter due to model changeovers and plantshutdowns in the automobile industry during the summer.
BacklogOur customer relationships and our manufacturing and inventory practices do not
create a material amount of backlog orders for any of our segments. Production andinventory levels are geared primarily to the level of incoming orders and projected demandbased on customer relationships.
Working Capital ItemsFor information regarding working capital items, see the discussion of “Cash from
Operations” in Item 7, Management’s Discussion and Analysis of Financial Condition andResults of Operation, on page 54.
Environmental RegulationOur operations are subject to federal, state, and local laws and regulations related to
the protection of the environment. We have policies intended to ensure that our operationsare conducted in keeping with good corporate citizenship and a commitment to protect theenvironment. While we cannot predict policy changes by various regulatory agencies,management expects that compliance with these laws and regulations will not have amaterial adverse effect on our competitive position, capital expenditures, consolidatedfinancial condition or results of operations.
Internet Access to InformationWe routinely post all material information to our website. Our annual reports on Form
10-K, quarterly reports on Form 10-Q, current reports on Form 8-K and all amendments tothose reports are made available, free of charge, on our website at http://www.leggett.comas soon as reasonably practicable after electronically filed with, or furnished to, theSecurities and Exchange Commission. In addition to these reports, the Company’sFinancial Code of Ethics, Code of Business Conduct and Ethics and Corporate GovernanceGuidelines, as well as charters for its Audit, Compensation, and Nominating and CorporateGovernance Committees of our Board of Directors can be found on our website. Each of
19
PART I
these documents is available in print, free of charge, to any shareholder who requests it.Information contained on our website does not constitute part of this Annual Report onForm 10-K.
Discontinued OperationsAs a result of our 2007 Strategic Plan, several of our businesses are disclosed in our
annual financial statements as discontinued operations since (i) the operations and cashflows of the businesses can be clearly distinguished and have been or will be eliminatedfrom our ongoing operations; (ii) the businesses have either been disposed of or areclassified as held for sale; and (iii) we do not, or will not have any significant continuinginvolvement in the operations of the businesses after the disposal transactions. Thediscontinued operations include:
• Aluminum Products segment. We divested this segment in July 2008. It produced andsold non-automotive aluminum, zinc and magnesium die castings, and new andrefurbished dies (also known as molds or tools) for all types and sizes of die castingmachines. It also provided machining, coating, finishing, sub-assembly and othervalue-added services for die cast components. These products and services weresold to (i) small engine and diesel engine builders; (ii) motorcycle, off-road andrecreational vehicle, truck and automobile makers; (iii) manufacturers of outdoorlighting fixtures, cable line amplifiers, wireless communications systems, and othercable and telecommunication products; (iv) consumer appliance and power toolmanufacturers; (v) producers of electric motors, computers and electronics; (vi) gasbarbeque grill manufacturers; and (vii) die cast manufacturers.
• Prime Foam Products unit, Wood Products unit, Fibers unit and the Coated Fabrics unit (eachpreviously reported in the Residential Furnishings segment).
(i) We divested the Prime Foam Products unit in the first quarter of 2007. Itprimarily produced commodity foam used for cushioning by bedding andupholstered furniture manufacturers.
(ii) We divested the Wood Products unit in the third quarter of 2008. It sold woodframes and cut-to-size dimension lumber to bedding manufacturers.
(iii) We divested the Fibers unit in the fourth quarter of 2008. It sold fibercushioning material primarily to bedding and upholstered furnituremanufacturers.
(iv) The Coated Fabrics unit sells non-slip rug underlay and shelf liners primarilyto retailers and distributors. This divestiture has not yet been completed.
• Plastics unit and the Storage Products unit (each previously reported in the CommercialFixturing & Components segment).
(i) The Plastics unit, which was divested in the third quarter of 2008, soldinjection molded plastic components primarily for manufacturers of lawn careequipment and power tools.
(ii) The Storage Products unit sells storage racks and carts used in the foodservice and healthcare industries. This divestiture has not yet been completed.
20
PART I
• An automotive seating components operation and the dealer portion of the Commercial VehicleProducts unit (each previously reported in the Specialized Products segment).
(i) The automotive seating components operation, which we divested in the firstquarter of 2008, sold welded assemblies, and wire and tubular frames forautomotive seating.
(ii) We divested the dealer portion of the Commercial Vehicle Products unit in thethird quarter of 2008. It sold truck bodies for cargo vans, flatbed trucks,service trucks and dump trucks primarily to end-users of light-to-medium dutycommercial trucks.
For further information on discontinued operations, see Note B on page 88 of the Notesto Consolidated Financial Statements.
Item 1A. Risk Factors.
Investing in our securities involves risk. Set forth below and elsewhere in this reportare risk factors that could cause actual results to differ materially from the resultscontemplated by the forward-looking statements contained in this report. We may amendor supplement these risk factors from time to time by other reports we file with the SEC.
We have exposure to economic and other factors that affect market demand for ourproducts.
As a supplier of products to a variety of industries, we are adversely affected by generaleconomic downturns. Our operating performance is heavily influenced by market demandfor our components and products. Market demand for the majority of our products is mostheavily influenced by consumer confidence. To a lesser extent, market demand is impactedby other broad economic factors, including disposable income levels, employment levels,housing turnover, energy costs and interest rates. All of these factors influence consumerspending on durable goods, and drive demand for our products. Some of these factors alsoinfluence business spending on facilities and equipment, which impacts approximatelyone quarter of our sales.
Demand weakness in the U.S. home-related, retail, and other markets has led to lowerunit order activity, sales and earnings in our businesses. Several factors, including a weakU.S. economy, higher energy costs, a depressed housing market, and low consumerconfidence contributed to conservative spending habits by U.S. consumers. Late in thethird quarter of 2008, our markets weakened appreciably as consumers further reined inspending during this period of credit concerns and stock market volatility. Short leadtimes in most of our markets allow for limited long-term visibility into demand trends;however, we currently expect market demand to be soft in 2009. If economic and marketconditions remain uncertain or deteriorate further, we may experience material negativeimpacts on our business, financial condition, operating cash flows and results ofoperations.
21
PART I
U.S. and global financial and credit market volatility could adversely affect ourfinancial position, results of operations, cash flows and liquidity.
We continue to monitor our financial position, results of operations, cash flows andliquidity in light of the recent distress in the financial and credit markets. Further changesin the financial or credit markets could adversely affect us in several different areas asdiscussed below.
Due to the recent tightening of credit markets and concerns regarding the availabilityof credit, our customers may be delayed in obtaining, or may not be able to obtain,necessary cash for their purchases. Additionally, our suppliers could be negativelyimpacted by the current credit and financial market conditions causing delays in productdeliveries to us. These delays could negatively impact our customers’ and/or suppliers’ability to conduct business and could adversely affect our unit volume and revenues, andtherefore harm our business, financial condition, results of operations, cash flows andliquidity.
Recent deterioration in the securities markets has also impacted asset values of ourdefined benefit plans. Plan assets and liabilities are measured at December 31 of each year.At December 31, 2008, our defined benefit plans were under-funded by approximately $29million, which represented 13% of the plans’ benefit obligations. Changes in the value ofplan assets did not have an impact on the 2008 income statement, however reduced benefitplan assets will result in increased costs in 2009 and may increase the amount oraccelerate the timing of required future funding contributions.
Cash equivalents, short-term investments and derivative financial instruments aresubject to market value and counterparty risks. Changes in the fair value of these itemsmay adversely impact our financial position, results of operations, cash flows and liquidity.These balances could also be impacted if the counterparties are unable to meet theircommitments in accordance with the terms of agreements.
Costs of raw materials could adversely affect our operating results.
Raw material cost increases (and our ability to respond to cost increases throughselling price increases) can significantly impact our earnings. We typically have short-termcommitments from our suppliers; therefore, our raw material costs move with the market.
Steel is our most significant raw material. In late 2007 we began seeing higher steelcosts, and further increases occurred in 2008. The global steel markets are very cyclical innature, and can result in large swings in pricing and margins from year to year. Ouroperations can also be impacted by changes in the cost of foam scrap. We experiencedsignificant fluctuations in the cost of this commodity in recent years.
When we experience significant increases in raw material costs, we implement priceincreases to recover the higher costs. Inability to recover cost increases (or a delay in therecovery time) can negatively impact our earnings.
Also, higher raw material costs led some of our customers to modify their productdesigns, changing the quantity and mix of our components in their finished goods. In some
22
PART I
cases, higher cost components were replaced with lower cost components. This hasprimarily impacted our Residential Furnishings and Industrial Materials product mix anddecreased profit margins. This trend could further negatively impact our results ofoperations.
Our debt instrument ratings may be further downgraded which will increase our cost ofborrowing, reduce our ability to issue commercial paper and may negatively impact ourliquidity.
We have maintained a debt rating in the “A” category (from Moody’s and Standard andPoor’s) on our term notes and public debt for over a decade. On November 12, 2008,Moody’s downgraded the Company’s long term debt rating from “A2” to “A3” and ourcommercial paper rating from “P1” to “P2” citing accelerating contraction in residentialand automotive related consumer spending. Also, on November 25, 2008, S&P downgradedthe Company’s long-term corporate credit and senior unsecured debt ratings from “A” to“A-” and our short-term and commercial paper ratings from “A-1” to “A-2” citing weakmarket conditions and financial policies that include a high dividend payout and sharerepurchases. In addition, both Moody’s and S&P assigned a negative outlook to each oftheir respective ratings. If the rating agencies were to further downgrade our debtinstruments, this may have a negative effect on our cost of borrowing, our ability to issuecommercial paper and ultimately on our liquidity. For further information regarding ourdebt ratings refer to page 58.
We may not be able to realize deferred tax assets on our balance sheet dependingupon the amount and source of future taxable income.
Our ability to realize deferred tax assets on our balance sheet is dependent upon theamount and source of future taxable income. Continued economic uncertainty couldchange our underlying assumptions on which valuation reserves are established andnegatively affect future period earnings and balance sheets.
Asian competition could adversely affect our operating results.
We operate in markets that are highly competitive. We believe that most companies inour lines of business compete primarily on price, but, depending upon the particularproduct, we experience competition based on quality, performance and availability as well.We face increasing pressure from foreign competitors as some of our customers source aportion of their components and finished products from Asia. If we are unable to purchasekey raw materials, such as steel, at prices competitive with those of foreign suppliers, ourability to maintain market share and profit margins could be harmed.
Our long-lived assets are subject to potential asset impairment.
A significant portion of our assets consist of goodwill and other intangible assets, thecarrying value of which may be reduced if we determine that those assets are impaired. AtDecember 31, 2008, goodwill and other intangible assets not held for sale representedapproximately $1.07 billion, or approximately 34% of our total assets. In addition, netproperty, plant and equipment, sundry assets and non-current assets held for sale totaledapproximately $782 million, or approximately 25% of total assets.
23
PART I
We review for potential goodwill impairment on an annual basis as part of our goodwillimpairment testing in the second quarter of each year, and more often, if an event orcircumstance occurs making it likely that impairment exists. In addition, we test for therecoverability of long-lived assets at year end, and more often if an event or circumstanceindicates the carrying value may not be recoverable. We conduct impairment testing basedon our current business strategy in light of present industry and economic conditions, aswell as future expectations. In the fourth quarter of 2007, we conducted interimimpairment testing as a result of the changes announced with the 2007 Strategic Plan anddetermined that some long-lived assets were impaired. For the year ended December 31,2007, we incurred goodwill impairment of $243 million, and long-lived asset impairment of$44 million.
The annual goodwill impairment review performed in June 2008 indicated no goodwillimpairments. As a result of the deterioration in the economic and financial climate in thefourth quarter of 2008, interim goodwill and other long-lived asset impairment analyses wereperformed in the fourth quarter. The goodwill analysis confirmed that fair values exceededcarrying value for all reporting units. Future cash flow assumptions were reduced to reflectlower sales and production levels for 2009 and 2010, returning to historical levels thereafter.Other long-lived asset impairment charges of $12 million were recorded in the fourth quarter2008.
Throughout 2008, we recorded $26 million of goodwill and $6 million of other long-lived asset impairments related to businesses held for sale as updated estimates of fairvalue less costs to sell became more certain.
If actual results differ from estimates used in these calculations, the Company couldincur future (unanticipated) impairment charges.
We are exposed to foreign currency risk.
We expect that international sales will continue to represent a significant percentageof our total sales, which exposes us to currency exchange rate fluctuations. In 2008, 26%of our sales from continuing operations was generated by international operations. Therevenues and expenses of our foreign operations are generally denominated in localcurrencies; however, certain of our operations experience currency-related gains andlosses where sales or purchases are denominated in currencies other than their localcurrency. Further, our competitive position may be affected by the relative strength of thecurrencies in countries where our products are sold. Foreign currency exchange risksinherent in doing business in foreign countries may have a material adverse effect on ourfuture operations and financial results.
Item 1B. Unresolved Staff Comments.
None.
Item 2. Properties.
The Company’s corporate headquarters are located in Carthage, Missouri. AtDecember 31, 2008, we had 270 production, warehouse, sales and administrative facilitiesassociated with continuing operations, of which 196 were disbursed across the UnitedStates and 74 were located in foreign countries.
24
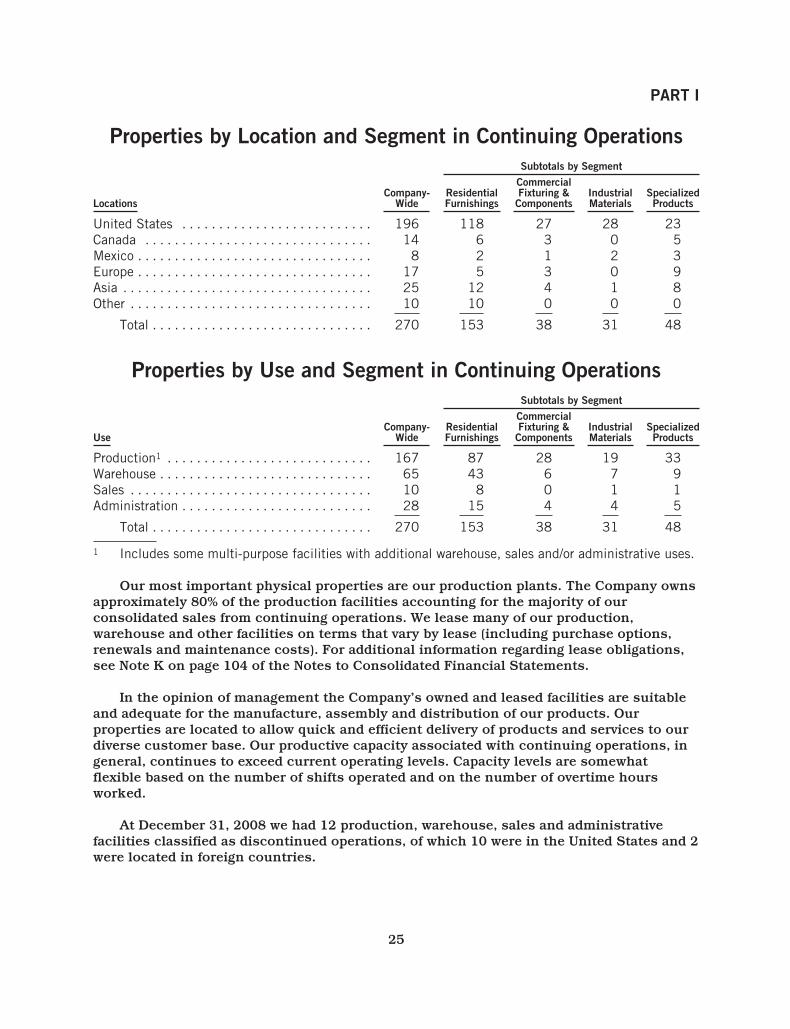
PART I
Properties by Location and Segment in Continuing OperationsSubtotals by Segment
LocationsCompany-
WideResidentialFurnishings
CommercialFixturing &Components
IndustrialMaterials
SpecializedProducts
United States . . . . . . . . . . . . . . . . . . . . . . . . . . 196 118 27 28 23Canada . . . . . . . . . . . . . . . . . . . . . . . . . . . . . . . 14 6 3 0 5Mexico . . . . . . . . . . . . . . . . . . . . . . . . . . . . . . . . 8 2 1 2 3Europe . . . . . . . . . . . . . . . . . . . . . . . . . . . . . . . . 17 5 3 0 9Asia . . . . . . . . . . . . . . . . . . . . . . . . . . . . . . . . . . 25 12 4 1 8Other . . . . . . . . . . . . . . . . . . . . . . . . . . . . . . . . . 10 10 0 0 0
Total . . . . . . . . . . . . . . . . . . . . . . . . . . . . . . 270 153 38 31 48
Properties by Use and Segment in Continuing OperationsSubtotals by Segment
UseCompany-
WideResidentialFurnishings
CommercialFixturing &Components
IndustrialMaterials
SpecializedProducts
Production1 . . . . . . . . . . . . . . . . . . . . . . . . . . . . 167 87 28 19 33Warehouse . . . . . . . . . . . . . . . . . . . . . . . . . . . . . 65 43 6 7 9Sales . . . . . . . . . . . . . . . . . . . . . . . . . . . . . . . . . 10 8 0 1 1Administration . . . . . . . . . . . . . . . . . . . . . . . . . . 28 15 4 4 5
Total . . . . . . . . . . . . . . . . . . . . . . . . . . . . . . 270 153 38 31 48
1 Includes some multi-purpose facilities with additional warehouse, sales and/or administrative uses.
Our most important physical properties are our production plants. The Company ownsapproximately 80% of the production facilities accounting for the majority of ourconsolidated sales from continuing operations. We lease many of our production,warehouse and other facilities on terms that vary by lease (including purchase options,renewals and maintenance costs). For additional information regarding lease obligations,see Note K on page 104 of the Notes to Consolidated Financial Statements.
In the opinion of management the Company’s owned and leased facilities are suitableand adequate for the manufacture, assembly and distribution of our products. Ourproperties are located to allow quick and efficient delivery of products and services to ourdiverse customer base. Our productive capacity associated with continuing operations, ingeneral, continues to exceed current operating levels. Capacity levels are somewhatflexible based on the number of shifts operated and on the number of overtime hoursworked.
At December 31, 2008 we had 12 production, warehouse, sales and administrativefacilities classified as discontinued operations, of which 10 were in the United States and 2were located in foreign countries.
25
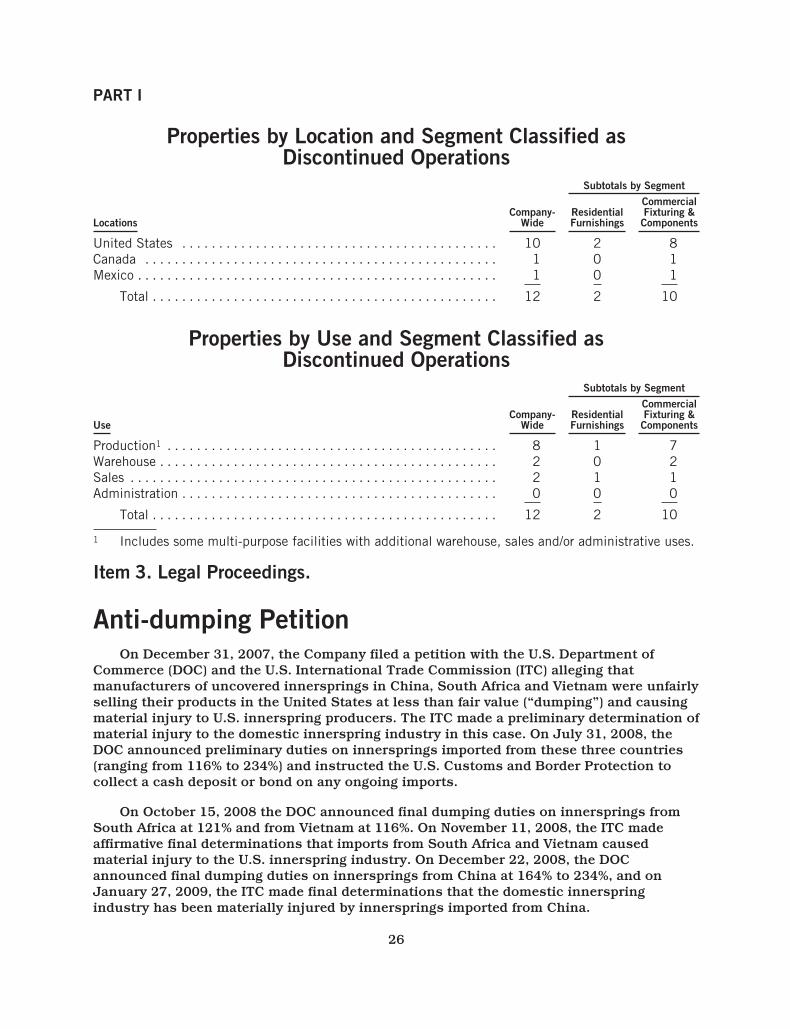
PART I
Properties by Location and Segment Classified asDiscontinued Operations
Subtotals by Segment
LocationsCompany-
WideResidentialFurnishings
CommercialFixturing &Components
United States . . . . . . . . . . . . . . . . . . . . . . . . . . . . . . . . . . . . . . . . . . . 10 2 8Canada . . . . . . . . . . . . . . . . . . . . . . . . . . . . . . . . . . . . . . . . . . . . . . . . 1 0 1Mexico . . . . . . . . . . . . . . . . . . . . . . . . . . . . . . . . . . . . . . . . . . . . . . . . . 1 0 1
Total . . . . . . . . . . . . . . . . . . . . . . . . . . . . . . . . . . . . . . . . . . . . . . . 12 2 10
Properties by Use and Segment Classified asDiscontinued Operations
Subtotals by Segment
UseCompany-
WideResidentialFurnishings
CommercialFixturing &Components
Production1 . . . . . . . . . . . . . . . . . . . . . . . . . . . . . . . . . . . . . . . . . . . . . 8 1 7Warehouse . . . . . . . . . . . . . . . . . . . . . . . . . . . . . . . . . . . . . . . . . . . . . . 2 0 2Sales . . . . . . . . . . . . . . . . . . . . . . . . . . . . . . . . . . . . . . . . . . . . . . . . . . 2 1 1Administration . . . . . . . . . . . . . . . . . . . . . . . . . . . . . . . . . . . . . . . . . . . 0 0 0
Total . . . . . . . . . . . . . . . . . . . . . . . . . . . . . . . . . . . . . . . . . . . . . . . 12 2 10
1 Includes some multi-purpose facilities with additional warehouse, sales and/or administrative uses.
Item 3. Legal Proceedings.
Anti-dumping PetitionOn December 31, 2007, the Company filed a petition with the U.S. Department of
Commerce (DOC) and the U.S. International Trade Commission (ITC) alleging thatmanufacturers of uncovered innersprings in China, South Africa and Vietnam were unfairlyselling their products in the United States at less than fair value (“dumping”) and causingmaterial injury to U.S. innerspring producers. The ITC made a preliminary determination ofmaterial injury to the domestic innerspring industry in this case. On July 31, 2008, theDOC announced preliminary duties on innersprings imported from these three countries(ranging from 116% to 234%) and instructed the U.S. Customs and Border Protection tocollect a cash deposit or bond on any ongoing imports.
On October 15, 2008 the DOC announced final dumping duties on innersprings fromSouth Africa at 121% and from Vietnam at 116%. On November 11, 2008, the ITC madeaffirmative final determinations that imports from South Africa and Vietnam causedmaterial injury to the U.S. innerspring industry. On December 22, 2008, the DOCannounced final dumping duties on innersprings from China at 164% to 234%, and onJanuary 27, 2009, the ITC made final determinations that the domestic innerspringindustry has been materially injured by innersprings imported from China.
26
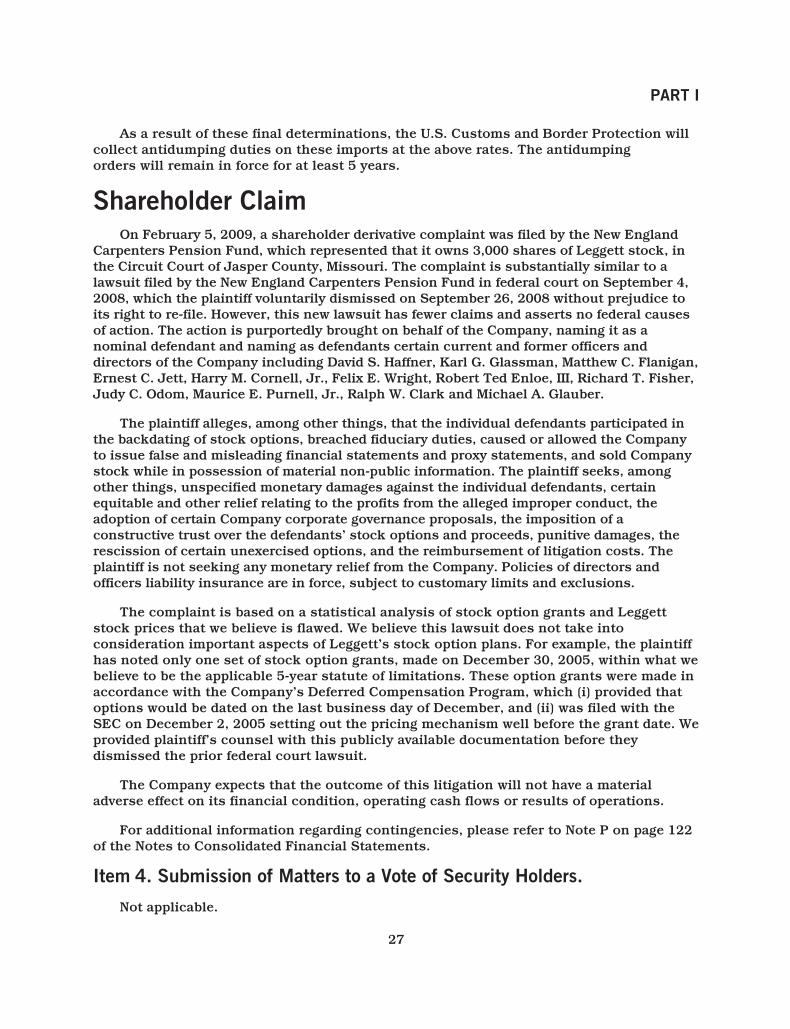
PART I
As a result of these final determinations, the U.S. Customs and Border Protection willcollect antidumping duties on these imports at the above rates. The antidumpingorders will remain in force for at least 5 years.
Shareholder ClaimOn February 5, 2009, a shareholder derivative complaint was filed by the New England
Carpenters Pension Fund, which represented that it owns 3,000 shares of Leggett stock, inthe Circuit Court of Jasper County, Missouri. The complaint is substantially similar to alawsuit filed by the New England Carpenters Pension Fund in federal court on September 4,2008, which the plaintiff voluntarily dismissed on September 26, 2008 without prejudice toits right to re-file. However, this new lawsuit has fewer claims and asserts no federal causesof action. The action is purportedly brought on behalf of the Company, naming it as anominal defendant and naming as defendants certain current and former officers anddirectors of the Company including David S. Haffner, Karl G. Glassman, Matthew C. Flanigan,Ernest C. Jett, Harry M. Cornell, Jr., Felix E. Wright, Robert Ted Enloe, III, Richard T. Fisher,Judy C. Odom, Maurice E. Purnell, Jr., Ralph W. Clark and Michael A. Glauber.
The plaintiff alleges, among other things, that the individual defendants participated inthe backdating of stock options, breached fiduciary duties, caused or allowed the Companyto issue false and misleading financial statements and proxy statements, and sold Companystock while in possession of material non-public information. The plaintiff seeks, amongother things, unspecified monetary damages against the individual defendants, certainequitable and other relief relating to the profits from the alleged improper conduct, theadoption of certain Company corporate governance proposals, the imposition of aconstructive trust over the defendants’ stock options and proceeds, punitive damages, therescission of certain unexercised options, and the reimbursement of litigation costs. Theplaintiff is not seeking any monetary relief from the Company. Policies of directors andofficers liability insurance are in force, subject to customary limits and exclusions.
The complaint is based on a statistical analysis of stock option grants and Leggettstock prices that we believe is flawed. We believe this lawsuit does not take intoconsideration important aspects of Leggett’s stock option plans. For example, the plaintiffhas noted only one set of stock option grants, made on December 30, 2005, within what webelieve to be the applicable 5-year statute of limitations. These option grants were made inaccordance with the Company’s Deferred Compensation Program, which (i) provided thatoptions would be dated on the last business day of December, and (ii) was filed with theSEC on December 2, 2005 setting out the pricing mechanism well before the grant date. Weprovided plaintiff’s counsel with this publicly available documentation before theydismissed the prior federal court lawsuit.
The Company expects that the outcome of this litigation will not have a materialadverse effect on its financial condition, operating cash flows or results of operations.
For additional information regarding contingencies, please refer to Note P on page 122of the Notes to Consolidated Financial Statements.
Item 4. Submission of Matters to a Vote of Security Holders.
Not applicable.
27
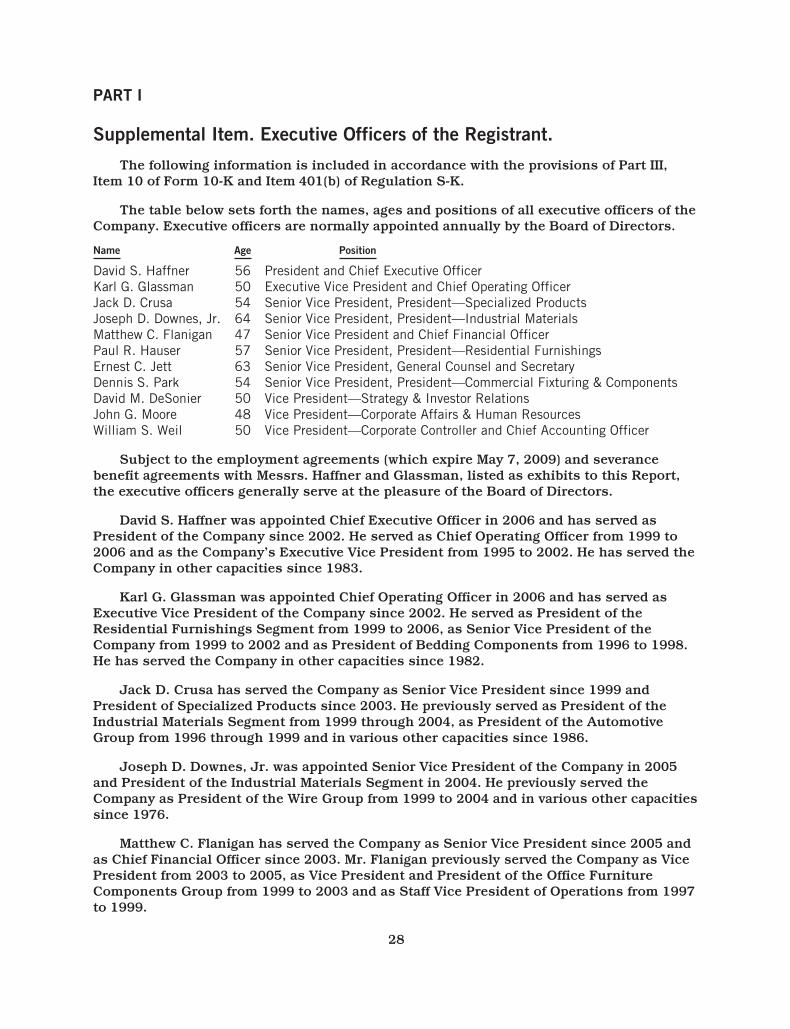
PART I
Supplemental Item. Executive Officers of the Registrant.
The following information is included in accordance with the provisions of Part III,Item 10 of Form 10-K and Item 401(b) of Regulation S-K.
The table below sets forth the names, ages and positions of all executive officers of theCompany. Executive officers are normally appointed annually by the Board of Directors.
Name Age Position
David S. Haffner 56 President and Chief Executive OfficerKarl G. Glassman 50 Executive Vice President and Chief Operating OfficerJack D. Crusa 54 Senior Vice President, President—Specialized ProductsJoseph D. Downes, Jr. 64 Senior Vice President, President—Industrial MaterialsMatthew C. Flanigan 47 Senior Vice President and Chief Financial OfficerPaul R. Hauser 57 Senior Vice President, President—Residential FurnishingsErnest C. Jett 63 Senior Vice President, General Counsel and SecretaryDennis S. Park 54 Senior Vice President, President—Commercial Fixturing & ComponentsDavid M. DeSonier 50 Vice President—Strategy & Investor RelationsJohn G. Moore 48 Vice President—Corporate Affairs & Human ResourcesWilliam S. Weil 50 Vice President—Corporate Controller and Chief Accounting Officer
Subject to the employment agreements (which expire May 7, 2009) and severancebenefit agreements with Messrs. Haffner and Glassman, listed as exhibits to this Report,the executive officers generally serve at the pleasure of the Board of Directors.
David S. Haffner was appointed Chief Executive Officer in 2006 and has served asPresident of the Company since 2002. He served as Chief Operating Officer from 1999 to2006 and as the Company’s Executive Vice President from 1995 to 2002. He has served theCompany in other capacities since 1983.
Karl G. Glassman was appointed Chief Operating Officer in 2006 and has served asExecutive Vice President of the Company since 2002. He served as President of theResidential Furnishings Segment from 1999 to 2006, as Senior Vice President of theCompany from 1999 to 2002 and as President of Bedding Components from 1996 to 1998.He has served the Company in other capacities since 1982.
Jack D. Crusa has served the Company as Senior Vice President since 1999 andPresident of Specialized Products since 2003. He previously served as President of theIndustrial Materials Segment from 1999 through 2004, as President of the AutomotiveGroup from 1996 through 1999 and in various other capacities since 1986.
Joseph D. Downes, Jr. was appointed Senior Vice President of the Company in 2005and President of the Industrial Materials Segment in 2004. He previously served theCompany as President of the Wire Group from 1999 to 2004 and in various other capacitiessince 1976.
Matthew C. Flanigan has served the Company as Senior Vice President since 2005 andas Chief Financial Officer since 2003. Mr. Flanigan previously served the Company as VicePresident from 2003 to 2005, as Vice President and President of the Office FurnitureComponents Group from 1999 to 2003 and as Staff Vice President of Operations from 1997to 1999.
28
PART I
Paul R. Hauser became Senior Vice President of the Company in 2005 and President ofthe Residential Furnishings Segment in 2006. He previously served as Vice President of theCompany and President of the Bedding Group from 1999 to 2006. He served in variouscapacities in the Company’s Bedding Group since 1980.
Ernest C. Jett became Senior Vice President, General Counsel and Secretary in 2005.He was appointed General Counsel in 1997 and Vice President and Secretary in 1995. Hepreviously served the Company as Assistant General Counsel from 1979 to 1995 and asManaging Director of the Legal Department from 1991 to 1997.
Dennis S. Park became Senior Vice President and President of the CommercialFixturing & Components Segment in 2006. In 2004, he was named President of the HomeFurniture and Consumer Products Group and became Vice President of the Company andPresident of Home Furniture Components in 1996. He served the Company in various othercapacities since 1977.
David M. DeSonier was appointed Vice President—Strategy & Investor Relations in2007. He served as Vice President—Investor Relations and Assistant Treasurer from 2002to 2007. He joined the Company as Vice President—Investor Relations in 2000. Prior to hisemployment with Leggett & Platt, he worked for Atlantic Richfield (a major integrated oilcompany) from 1980 to 2000 in strategic planning, investor relations, financialmanagement and analysis, and technical positions.
John G. Moore was appointed Vice President—Corporate Affairs & Human Resourcesin 2008. He served as Vice President—Corporate Governance and Deputy Secretary from2006 to 2008, as Vice President and Associate General Counsel from 2001 to 2006, and asManaging Counsel and Assistant General Counsel from 1998 to 2001. He has served theCompany in other capacities since 1994.
William S. Weil has served the Company as Chief Accounting Officer since February2004. He became Vice President in 2000 and has served the Company as CorporateController since 1991. He previously served the Company in various other accountingcapacities since 1983.
29
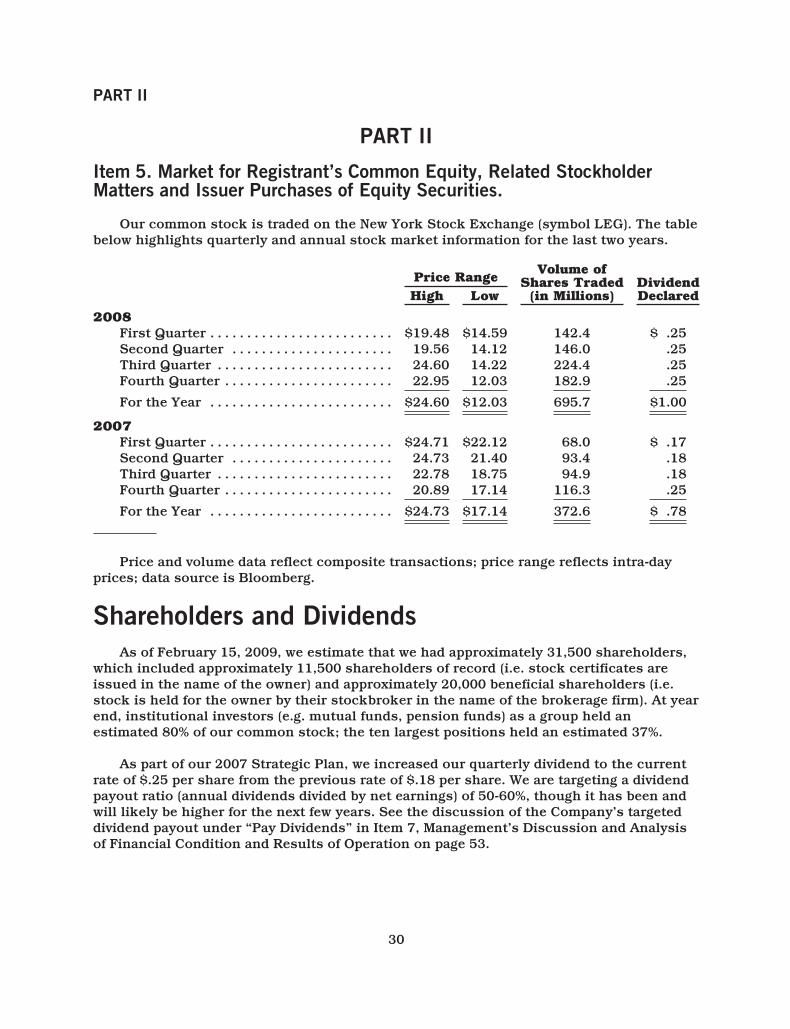
PART II
PART II
Item 5. Market for Registrant’s Common Equity, Related StockholderMatters and Issuer Purchases of Equity Securities.
Our common stock is traded on the New York Stock Exchange (symbol LEG). The tablebelow highlights quarterly and annual stock market information for the last two years.
Price Range Volume ofShares Traded
(in Millions)DividendDeclaredHigh Low
2008First Quarter . . . . . . . . . . . . . . . . . . . . . . . . . $19.48 $14.59 142.4 $ .25Second Quarter . . . . . . . . . . . . . . . . . . . . . . 19.56 14.12 146.0 .25Third Quarter . . . . . . . . . . . . . . . . . . . . . . . . 24.60 14.22 224.4 .25Fourth Quarter . . . . . . . . . . . . . . . . . . . . . . . 22.95 12.03 182.9 .25
For the Year . . . . . . . . . . . . . . . . . . . . . . . . . $24.60 $12.03 695.7 $1.00
2007First Quarter . . . . . . . . . . . . . . . . . . . . . . . . . $24.71 $22.12 68.0 $ .17Second Quarter . . . . . . . . . . . . . . . . . . . . . . 24.73 21.40 93.4 .18Third Quarter . . . . . . . . . . . . . . . . . . . . . . . . 22.78 18.75 94.9 .18Fourth Quarter . . . . . . . . . . . . . . . . . . . . . . . 20.89 17.14 116.3 .25
For the Year . . . . . . . . . . . . . . . . . . . . . . . . . $24.73 $17.14 372.6 $ .78
Price and volume data reflect composite transactions; price range reflects intra-dayprices; data source is Bloomberg.
Shareholders and DividendsAs of February 15, 2009, we estimate that we had approximately 31,500 shareholders,
which included approximately 11,500 shareholders of record (i.e. stock certificates areissued in the name of the owner) and approximately 20,000 beneficial shareholders (i.e.stock is held for the owner by their stockbroker in the name of the brokerage firm). At yearend, institutional investors (e.g. mutual funds, pension funds) as a group held anestimated 80% of our common stock; the ten largest positions held an estimated 37%.
As part of our 2007 Strategic Plan, we increased our quarterly dividend to the currentrate of $.25 per share from the previous rate of $.18 per share. We are targeting a dividendpayout ratio (annual dividends divided by net earnings) of 50-60%, though it has been andwill likely be higher for the next few years. See the discussion of the Company’s targeteddividend payout under “Pay Dividends” in Item 7, Management’s Discussion and Analysisof Financial Condition and Results of Operation on page 53.
30
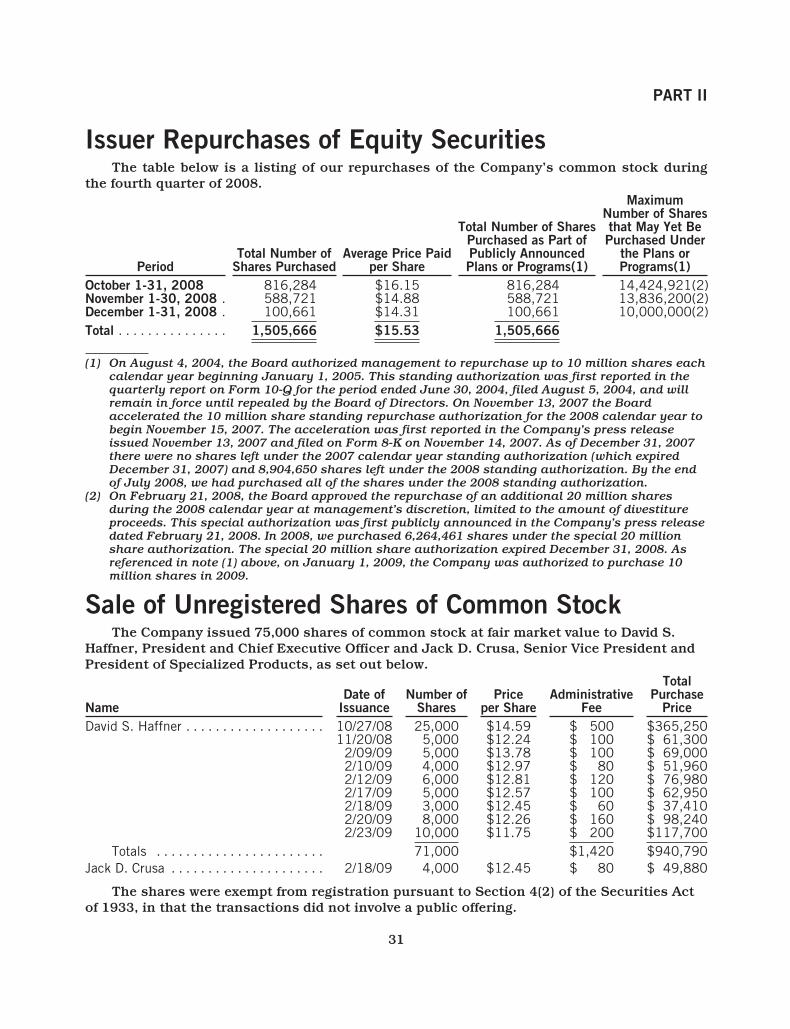
PART II
Issuer Repurchases of Equity SecuritiesThe table below is a listing of our repurchases of the Company’s common stock during
the fourth quarter of 2008.
PeriodTotal Number of
Shares PurchasedAverage Price Paid
per Share
Total Number of SharesPurchased as Part ofPublicly AnnouncedPlans or Programs(1)
MaximumNumber of Sharesthat May Yet BePurchased Under
the Plans orPrograms(1)
October 1-31, 2008 816,284 $16.15 816,284 14,424,921(2)November 1-30, 2008 . 588,721 $14.88 588,721 13,836,200(2)December 1-31, 2008 . 100,661 $14.31 100,661 10,000,000(2)Total . . . . . . . . . . . . . . . 1,505,666 $15.53 1,505,666
(1) On August 4, 2004, the Board authorized management to repurchase up to 10 million shares eachcalendar year beginning January 1, 2005. This standing authorization was first reported in thequarterly report on Form 10-Q for the period ended June 30, 2004, filed August 5, 2004, and willremain in force until repealed by the Board of Directors. On November 13, 2007 the Boardaccelerated the 10 million share standing repurchase authorization for the 2008 calendar year tobegin November 15, 2007. The acceleration was first reported in the Company’s press releaseissued November 13, 2007 and filed on Form 8-K on November 14, 2007. As of December 31, 2007there were no shares left under the 2007 calendar year standing authorization (which expiredDecember 31, 2007) and 8,904,650 shares left under the 2008 standing authorization. By the endof July 2008, we had purchased all of the shares under the 2008 standing authorization.
(2) On February 21, 2008, the Board approved the repurchase of an additional 20 million sharesduring the 2008 calendar year at management’s discretion, limited to the amount of divestitureproceeds. This special authorization was first publicly announced in the Company’s press releasedated February 21, 2008. In 2008, we purchased 6,264,461 shares under the special 20 millionshare authorization. The special 20 million share authorization expired December 31, 2008. Asreferenced in note (1) above, on January 1, 2009, the Company was authorized to purchase 10million shares in 2009.
Sale of Unregistered Shares of Common StockThe Company issued 75,000 shares of common stock at fair market value to David S.
Haffner, President and Chief Executive Officer and Jack D. Crusa, Senior Vice President andPresident of Specialized Products, as set out below.
NameDate of
IssuanceNumber of
SharesPrice
per ShareAdministrative
Fee
TotalPurchase
PriceDavid S. Haffner . . . . . . . . . . . . . . . . . . . 10/27/08 25,000 $14.59 $ 500 $365,250
11/20/08 5,000 $12.24 $ 100 $ 61,3002/09/09 5,000 $13.78 $ 100 $ 69,0002/10/09 4,000 $12.97 $ 80 $ 51,9602/12/09 6,000 $12.81 $ 120 $ 76,9802/17/09 5,000 $12.57 $ 100 $ 62,9502/18/09 3,000 $12.45 $ 60 $ 37,4102/20/09 8,000 $12.26 $ 160 $ 98,2402/23/09 10,000 $11.75 $ 200 $117,700
Totals . . . . . . . . . . . . . . . . . . . . . . . 71,000 $1,420 $940,790Jack D. Crusa . . . . . . . . . . . . . . . . . . . . . 2/18/09 4,000 $12.45 $ 80 $ 49,880
The shares were exempt from registration pursuant to Section 4(2) of the Securities Actof 1933, in that the transactions did not involve a public offering.
31
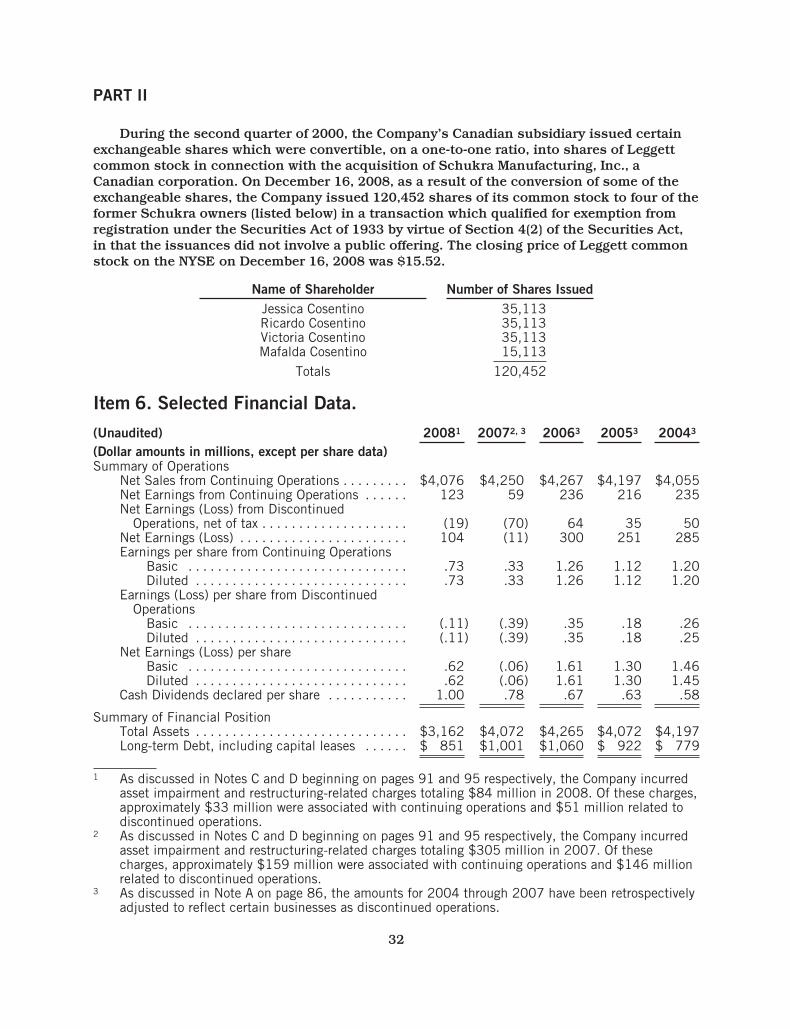
PART II
During the second quarter of 2000, the Company’s Canadian subsidiary issued certainexchangeable shares which were convertible, on a one-to-one ratio, into shares of Leggettcommon stock in connection with the acquisition of Schukra Manufacturing, Inc., aCanadian corporation. On December 16, 2008, as a result of the conversion of some of theexchangeable shares, the Company issued 120,452 shares of its common stock to four of theformer Schukra owners (listed below) in a transaction which qualified for exemption fromregistration under the Securities Act of 1933 by virtue of Section 4(2) of the Securities Act,in that the issuances did not involve a public offering. The closing price of Leggett commonstock on the NYSE on December 16, 2008 was $15.52.
Name of Shareholder Number of Shares IssuedJessica Cosentino 35,113Ricardo Cosentino 35,113Victoria Cosentino 35,113Mafalda Cosentino 15,113
Totals 120,452
Item 6. Selected Financial Data.
(Unaudited) 20081 20072, 3 20063 20053 20043
(Dollar amounts in millions, except per share data)Summary of Operations
Net Sales from Continuing Operations . . . . . . . . . $4,076 $4,250 $4,267 $4,197 $4,055Net Earnings from Continuing Operations . . . . . . 123 59 236 216 235Net Earnings (Loss) from Discontinued
Operations, net of tax . . . . . . . . . . . . . . . . . . . . (19) (70) 64 35 50Net Earnings (Loss) . . . . . . . . . . . . . . . . . . . . . . . 104 (11) 300 251 285Earnings per share from Continuing Operations
Basic . . . . . . . . . . . . . . . . . . . . . . . . . . . . . . .73 .33 1.26 1.12 1.20Diluted . . . . . . . . . . . . . . . . . . . . . . . . . . . . . .73 .33 1.26 1.12 1.20
Earnings (Loss) per share from DiscontinuedOperations
Basic . . . . . . . . . . . . . . . . . . . . . . . . . . . . . . (.11) (.39) .35 .18 .26Diluted . . . . . . . . . . . . . . . . . . . . . . . . . . . . . (.11) (.39) .35 .18 .25
Net Earnings (Loss) per shareBasic . . . . . . . . . . . . . . . . . . . . . . . . . . . . . . .62 (.06) 1.61 1.30 1.46Diluted . . . . . . . . . . . . . . . . . . . . . . . . . . . . . .62 (.06) 1.61 1.30 1.45
Cash Dividends declared per share . . . . . . . . . . . 1.00 .78 .67 .63 .58
Summary of Financial PositionTotal Assets . . . . . . . . . . . . . . . . . . . . . . . . . . . . . $3,162 $4,072 $4,265 $4,072 $4,197Long-term Debt, including capital leases . . . . . . $ 851 $1,001 $1,060 $ 922 $ 779
1 As discussed in Notes C and D beginning on pages 91 and 95 respectively, the Company incurredasset impairment and restructuring-related charges totaling $84 million in 2008. Of these charges,approximately $33 million were associated with continuing operations and $51 million related todiscontinued operations.
2 As discussed in Notes C and D beginning on pages 91 and 95 respectively, the Company incurredasset impairment and restructuring-related charges totaling $305 million in 2007. Of thesecharges, approximately $159 million were associated with continuing operations and $146 millionrelated to discontinued operations.
3 As discussed in Note A on page 86, the amounts for 2004 through 2007 have been retrospectivelyadjusted to reflect certain businesses as discontinued operations.
32
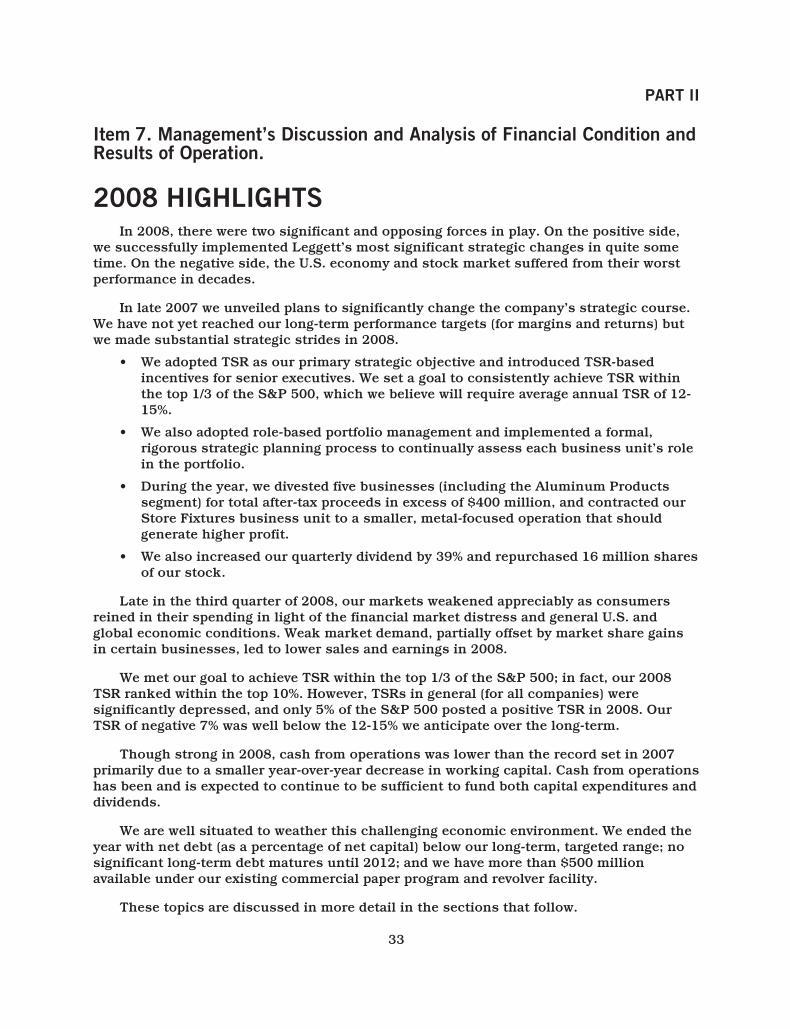
PART II
Item 7. Management’s Discussion and Analysis of Financial Condition andResults of Operation.
2008 HIGHLIGHTSIn 2008, there were two significant and opposing forces in play. On the positive side,
we successfully implemented Leggett’s most significant strategic changes in quite sometime. On the negative side, the U.S. economy and stock market suffered from their worstperformance in decades.
In late 2007 we unveiled plans to significantly change the company’s strategic course.We have not yet reached our long-term performance targets (for margins and returns) butwe made substantial strategic strides in 2008.
• We adopted TSR as our primary strategic objective and introduced TSR-basedincentives for senior executives. We set a goal to consistently achieve TSR withinthe top 1/3 of the S&P 500, which we believe will require average annual TSR of 12-15%.
• We also adopted role-based portfolio management and implemented a formal,rigorous strategic planning process to continually assess each business unit’s rolein the portfolio.
• During the year, we divested five businesses (including the Aluminum Productssegment) for total after-tax proceeds in excess of $400 million, and contracted ourStore Fixtures business unit to a smaller, metal-focused operation that shouldgenerate higher profit.
• We also increased our quarterly dividend by 39% and repurchased 16 million sharesof our stock.
Late in the third quarter of 2008, our markets weakened appreciably as consumersreined in their spending in light of the financial market distress and general U.S. andglobal economic conditions. Weak market demand, partially offset by market share gainsin certain businesses, led to lower sales and earnings in 2008.
We met our goal to achieve TSR within the top 1/3 of the S&P 500; in fact, our 2008TSR ranked within the top 10%. However, TSRs in general (for all companies) weresignificantly depressed, and only 5% of the S&P 500 posted a positive TSR in 2008. OurTSR of negative 7% was well below the 12-15% we anticipate over the long-term.
Though strong in 2008, cash from operations was lower than the record set in 2007primarily due to a smaller year-over-year decrease in working capital. Cash from operationshas been and is expected to continue to be sufficient to fund both capital expenditures anddividends.
We are well situated to weather this challenging economic environment. We ended theyear with net debt (as a percentage of net capital) below our long-term, targeted range; nosignificant long-term debt matures until 2012; and we have more than $500 millionavailable under our existing commercial paper program and revolver facility.
These topics are discussed in more detail in the sections that follow.
33
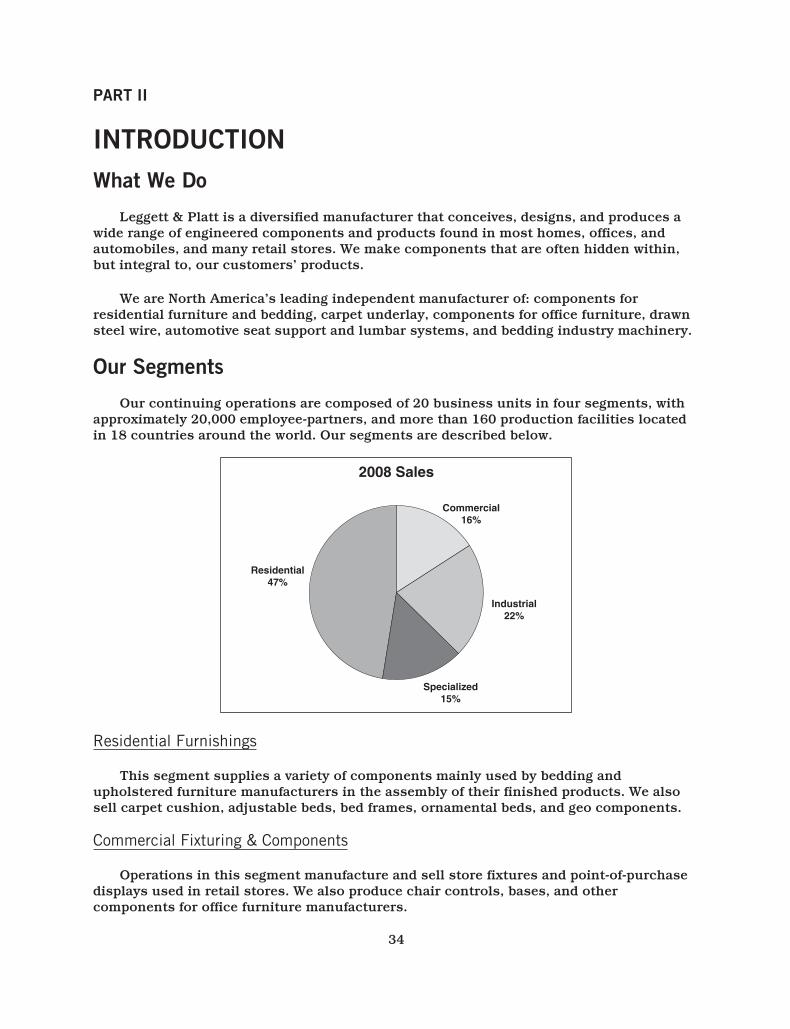
PART II
INTRODUCTIONWhat We Do
Leggett & Platt is a diversified manufacturer that conceives, designs, and produces awide range of engineered components and products found in most homes, offices, andautomobiles, and many retail stores. We make components that are often hidden within,but integral to, our customers’ products.
We are North America’s leading independent manufacturer of: components forresidential furniture and bedding, carpet underlay, components for office furniture, drawnsteel wire, automotive seat support and lumbar systems, and bedding industry machinery.
Our Segments
Our continuing operations are composed of 20 business units in four segments, withapproximately 20,000 employee-partners, and more than 160 production facilities locatedin 18 countries around the world. Our segments are described below.
2008 Sales
Residential47%
Specialized15%
Industrial22%
Commercial16%
Residential Furnishings
This segment supplies a variety of components mainly used by bedding andupholstered furniture manufacturers in the assembly of their finished products. We alsosell carpet cushion, adjustable beds, bed frames, ornamental beds, and geo components.
Commercial Fixturing & Components
Operations in this segment manufacture and sell store fixtures and point-of-purchasedisplays used in retail stores. We also produce chair controls, bases, and othercomponents for office furniture manufacturers.
34
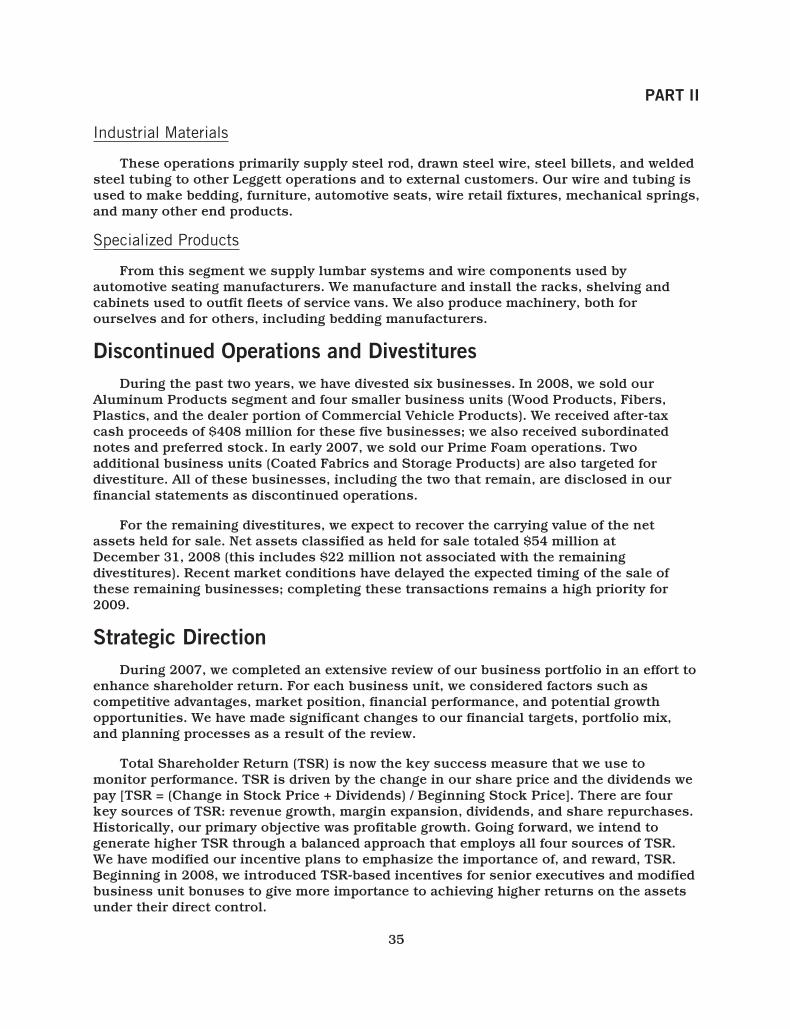
PART II
Industrial Materials
These operations primarily supply steel rod, drawn steel wire, steel billets, and weldedsteel tubing to other Leggett operations and to external customers. Our wire and tubing isused to make bedding, furniture, automotive seats, wire retail fixtures, mechanical springs,and many other end products.
Specialized Products
From this segment we supply lumbar systems and wire components used byautomotive seating manufacturers. We manufacture and install the racks, shelving andcabinets used to outfit fleets of service vans. We also produce machinery, both forourselves and for others, including bedding manufacturers.
Discontinued Operations and DivestituresDuring the past two years, we have divested six businesses. In 2008, we sold our
Aluminum Products segment and four smaller business units (Wood Products, Fibers,Plastics, and the dealer portion of Commercial Vehicle Products). We received after-taxcash proceeds of $408 million for these five businesses; we also received subordinatednotes and preferred stock. In early 2007, we sold our Prime Foam operations. Twoadditional business units (Coated Fabrics and Storage Products) are also targeted fordivestiture. All of these businesses, including the two that remain, are disclosed in ourfinancial statements as discontinued operations.
For the remaining divestitures, we expect to recover the carrying value of the netassets held for sale. Net assets classified as held for sale totaled $54 million atDecember 31, 2008 (this includes $22 million not associated with the remainingdivestitures). Recent market conditions have delayed the expected timing of the sale ofthese remaining businesses; completing these transactions remains a high priority for2009.
Strategic DirectionDuring 2007, we completed an extensive review of our business portfolio in an effort to
enhance shareholder return. For each business unit, we considered factors such ascompetitive advantages, market position, financial performance, and potential growthopportunities. We have made significant changes to our financial targets, portfolio mix,and planning processes as a result of the review.
Total Shareholder Return (TSR) is now the key success measure that we use tomonitor performance. TSR is driven by the change in our share price and the dividends wepay [TSR = (Change in Stock Price + Dividends) / Beginning Stock Price]. There are fourkey sources of TSR: revenue growth, margin expansion, dividends, and share repurchases.Historically, our primary objective was profitable growth. Going forward, we intend togenerate higher TSR through a balanced approach that employs all four sources of TSR.We have modified our incentive plans to emphasize the importance of, and reward, TSR.Beginning in 2008, we introduced TSR-based incentives for senior executives and modifiedbusiness unit bonuses to give more importance to achieving higher returns on the assetsunder their direct control.
35
PART II
We have adopted role-based portfolio management and will concentrate futureinvestments in businesses with strong competitive advantages and financial health.Certain of our businesses (categorized as Grow) are positioned to generate value throughfurther growth, while others (categorized as Core) are positioned to drive value byimproving EBITDA (earnings before interest, taxes, depreciation and amortization) andoptimizing operating cash flow while employing minimal amounts of capital. We allocatecapital to each business unit based upon its role in the portfolio. We plan to invest in Growbusinesses that hold strong competitive positions and consistently achieve compellingreturns on those investments. We plan to maintain or improve our competitive position inCore businesses that typically hold stable positions in solid markets, and focus onimproving returns but limit further investment in these operations. In total, we anticipatelower capital expenditures and fewer acquisitions in the near term.
We have implemented a more rigorous strategic planning process to continually assessour business units and help guide future decisions regarding the role of each businessunit, capital allocation priorities, and new areas in which to grow. We review the portfolioclassification of each unit at least on an annual basis to determine its appropriate role.This review includes several different criteria such as competitive position, marketconditions, business unit size, and fit within our overall objectives, as well as financialindicators such as EBITDA and operating cash flows relative to the amount of capitalemployed. To remain in the portfolio, business units are expected to consistently generateafter-tax returns in excess of our cost of capital. Business units may employ a variety ofmeans to achieve higher returns, including trimming expenses, introducing new products,improving productivity, adopting more disciplined pricing, reducing working capital, andconsolidating assets. Business units that fail to attain minimum return goals will bemoved to the Fix or Divest categories.
As a result of the 2007 strategic review, we narrowed our focus and eliminatedapproximately 15% of our portfolio through the divestiture of the Aluminum Productssegment and four additional business units (two other divestitures remain). We also placedour Store Fixtures business unit into the Fix category and gave it a one-year period inwhich to improve returns to at least cost of capital levels.
In the third quarter of 2008, we concluded that the Store Fixtures unit, in its previousform, was not capable of meeting our return requirements. As a result, we narrowed theunit’s scope to focus primarily on the metals part of the fixtures industry, in alignmentwith Leggett’s core competency of producing steel and steel-related products. Weconsolidated four wood store fixtures operations into two facilities and will continue toproduce a reduced amount of wood fixtures in order to meet the blended requirements (i.e.metal and wood) of certain of our customers. We also effected changes to seniormanagement, further reduced the unit’s overhead, and purged additional customeraccounts with unacceptable margins. These changes are expected to trim annual tradesales for the Store Fixtures business unit from a run-rate in late 2008 of approximately$325 million to approximately $250-$275 million in 2009, and we expect annual returns toat least match our cost of capital. The unit is now considered a Core business within ourportfolio; as such, its primary focus is to optimize operating cash flow and improve profitwhile minimizing its use of capital.
36
PART II
Activities related to the Fix and Divest businesses resulted in charges that impactedour operating results in 2007 and 2008. Those charges are discussed on page 40 under thesection titled “Asset Impairments and Restructuring-related Charges.”
The strategic changes have increased available cash, and we are returning much of thiscash to shareholders. In November 2007, the Board of Directors authorized a 39% dividendincrease, moving the quarterly rate to $.25 per share (from the previous $.18). For the year2008, we also repurchased nearly 16 million shares of our stock, fully exhausting ourannual repurchase authorization (of 10 million shares), and partially utilizing thesupplementary authorization to purchase additional shares with proceeds from thedivestitures. We expect to continue repurchasing our shares, but the timing of thoserepurchases will depend on several factors, including general economic and marketconditions, the price of Leggett stock, and our working capital needs.
CustomersWe serve a broad suite of customers, with no single one representing even 5% of our
sales. Many are companies whose names are widely recognized; they include mostmanufacturers of furniture and bedding, a variety of other manufacturers, and many majorretailers.
Major Factors That Impact Our BusinessMany factors impact our business, but those that generally have the greatest impact
are market demand, recent economic events, raw material cost trends, and competition.
Market Demand
Market demand (including product mix) is impacted by several economic factors, withconsumer confidence being most significant. Other important factors include disposableincome levels, employment levels, housing turnover, and interest rates. All these factorsinfluence consumer spending on durable goods, and therefore affect demand for ourcomponents and products. Some of these factors also influence business spending onfacilities and equipment, which impacts approximately one-quarter of our sales.
Recent Economic Events
In light of recent distress in the financial and credit markets (and the related impacton U.S. and global economies) we have been impacted, and may continue to be impacted, inseveral different areas as discussed below.
Lower Market-Wide Demand. Throughout 2007 and 2008, demand weakness in theU.S. home-related, retail, and other markets led to lower unit order activity, sales andearnings in our businesses. Several factors, including a weak U.S. economy, higher energycosts, a depressed housing market, and low consumer confidence contributed toconservative spending habits by U.S. consumers. Late in the third quarter of 2008, ourglobal markets weakened appreciably as consumers further reined in spending during thisperiod of credit concerns and stock market volatility. Short lead times in most of ourmarkets allow for very limited long-term visibility into demand trends; however, we
37
PART II
currently expect market demand to be soft in 2009. Despite the global economic decline,we have gained market share in our U.S. bedding components businesses primarily due to(i) bedding manufacturers shifting innerspring purchases from international to domesticsources as a result of antidumping duties imposed on imported innersprings from China,South Africa, and Vietnam; (ii) the deverticalization of a strong regional beddingmanufacturer (they now buy from us components they had previously produced forthemselves); and (iii) increased demand for innerspring mattresses, rather than premiumpriced, non-innerspring products. These market share gains offset some of the demandweakness.
Customers and Suppliers. Due to the recent tightening of credit markets and concernsregarding the availability of credit, our customers may be delayed in obtaining, or may notbe able to obtain, necessary cash for their purchases. Additionally, our suppliers could benegatively impacted by the current credit and financial market conditions causing delaysin product deliveries to us. These delays could negatively impact our customers’ andsuppliers’ ability to conduct business and could adversely affect our unit order activity andsales, and therefore negatively impact our cash flows and liquidity.
Management’s Response to Recent Economic Events. Activities completed over thepast few years (including the divestiture of businesses under our strategic plan, closure ofunderperforming and underutilized facilities, elimination of sales with unacceptablemargins, and other cost reduction initiatives) improved our cost position in advance of thelate 2008 economic contraction. In response to the recent economic events, we reducedproduction and were running well below our normal utilization levels during the fourthquarter 2008 in an effort to bring inventories in line with current demand. We have furtherreduced headcount, overhead costs, and capital spending, and are completing the closureof certain facilities. Given our balance sheet, operating cash flow and access to credit, weexpect to be able to endure an extended downturn in market demand with no materialimpact to our financial position or liquidity.
Raw Material Costs
In many of our businesses, we enjoy a cost advantage from buying large quantities ofraw materials. This purchasing leverage is a benefit that many of our competitors generallydo not have. Still, our costs can vary significantly as market prices for raw materials (manyof which are commodities) fluctuate.
Purchasing arrangements vary across the Company. We typically have short-termcommitments from our suppliers; accordingly our raw material costs generally move withthe market. In certain of our businesses, we have longer-term purchase contracts withpricing terms that provide stability under reasonable market conditions. However, whencommodities experience extreme inflation, vendors do not always honor those contracts.
Our ability to recover higher costs (through selling price increases) is crucial. When weexperience significant increases in raw material costs, we typically implement priceincreases to recover the higher costs. Conversely, when costs decrease significantly, wegenerally pass a portion of those lower costs through to our customers. The timing of ourprice increases or decreases is a critical factor; we typically experience a lag in recoveringhigher costs, so we also expect to realize a lag as costs decline.
38
PART II
Steel is our principal raw material and at various times in past years we haveexperienced extreme cost fluctuations in this commodity. In most cases, the majorchanges (both increases and decreases) were passed through to customers via selling priceadjustments. In late 2007 we began seeing higher steel costs, and significant increasesoccurred in 2008. We implemented price increases to recover these higher costs. Marketprices began to abate late in the year, but for certain types of steel, continued to be wellabove prior year levels. With the precipitous drop in market demand beginning late in thethird quarter, and the need to reduce inventories (that were purchased before steel costsdeclined), at year-end we had not yet made substantial purchases of the lower cost steel.
Our other raw materials include woven and non-woven fabrics, foam scrap, fibers, andchemicals. We have experienced changes in the cost of these materials in recent years, andtypically pass them through to our customers.
When we raise our prices to recover higher raw material costs, this sometimes causescustomers to modify their product designs and replace higher cost components with lowercost components. We experienced this de-contenting effect in our Residential Furnishingsand Industrial Materials segments in recent years, as our customers changed the quantityand mix of components in their finished goods to address steel and chemical inflation. Ourprofit margins were negatively impacted by this de-contenting. We are responding bydeveloping new products (including new types of innersprings and boxsprings) that enableour customers to reduce their total costs, and in certain instances, provide higher marginand profit contribution for our operations. Some of these new products were introducedduring 2007, with production of those products ramping up in 2008.
Competition
Many of our markets are highly competitive with the number of competitors varying byproduct line. In general, our competitors tend to be smaller, private companies.
We believe we gain competitive advantage in our global markets through low costoperations, significant internal production of key raw materials, superior manufacturingexpertise and product innovation, higher quality products, extensive customer servicecapabilities, and greater financial strength. Many of our competitors, both domestic andforeign, compete primarily on the basis of price. Our success has stemmed from the abilityto remain price competitive, while delivering product quality, innovation, and customerservice.
We continue to face pressure from foreign competitors as some of our customerssource a portion of their components and finished products from Asia. In instances whereour customers move production of their finished products overseas, our operations mustbe located nearby to supply them efficiently. We currently operate 11 facilities in China.
In recent years we experienced increased competition in the U.S. from foreign beddingcomponent manufacturers. We reacted to this competition by selectively adjusting prices,and by developing new proprietary products that help our customers reduce total costs.The increased price competition for bedding components was partially due to lower wirecosts in China. Asian manufacturers benefit from cost advantages for commodities such as
39
PART II
steel and chemicals. Foreign manufacturers also benefit from lenient regulatory climatesrelated to safety and environmental matters. In late 2007, we filed an antidumping suitrelated to innerspring imports from China, South Africa and Vietnam. We saw a distinctdecline in unfair imports during 2008 after the antidumping investigations began, and as aresult, we regained market share. The investigations were brought to a favorableconclusion in early 2009. We should see improved performance in our Bedding group asimported innersprings from these countries will now have to be sold at fair prices. Thecurrent antidumping duty rates on innersprings from these countries aresignificant, ranging from 116% to 234%, and will remain in effect for at least 5 years.
Asset Impairments and Restructuring-related Charges
Net impairment and restructuring-related charges (for both continuing anddiscontinued operations) totaled $84 million in 2008 and $305 million in 2007. Themajority of these charges occurred as a result of the strategic changes announced in late2007. Those details are discussed in the paragraphs below. Net impairment andrestructuring-related charges not associated with the 2007 Strategic Plan totaled $31million in 2008 and $17 million in 2007.
In the fourth quarter 2007, we recognized $287 million (primarily non-cash) ofimpairment and restructuring-related charges associated with the 2007 Strategic Plan.These charges (which included both continuing and discontinued operations) includegoodwill impairments for the Fixture & Display reporting unit of $143 million and theAluminum reporting unit of $83 million. Goodwill and asset impairment charges related toother held-for-sale businesses totaled $51 million. Restructuring-related charges totaled$10 million.
In 2008, we incurred additional costs totaling $53 million related to the 2007 StrategicPlan. This total includes $6 million of restructuring-related costs, $26 million of goodwillimpairment charges, $7 million of asset impairment charges, and $14 million of lossesfrom sale of assets.
To date, we have incurred total costs associated with the 2007 Strategic Plan of $340million ($153 million in continuing operations and $187 million in discontinuedoperations) and believe the activity to be substantially complete. For further informationabout asset impairments and restructuring, see Notes C and D to the ConsolidatedFinancial Statements on pages 91 and 95.
As discussed on pages 4 and 36, in late 2007 the Store Fixtures business unit wasplaced in the Fix category and given a one-year period in which to improve returns to atleast cost of capital levels. In the fall of 2008, we concluded that the business unit shouldbe contracted to a smaller, metal-focused business. This strategy change did not result inany goodwill impairment charges.
The Store Fixtures business unit is included in our Fixture & Display reporting unit forgoodwill impairment testing purposes. We conduct an annual review for potential goodwillimpairment (in June) and long-lived asset impairment (at year-end) for all of our reportingunits. We also review for potential impairment if an event or change in circumstanceoccurs that would more likely than not reduce the fair value of the reporting unit below its
40
PART II
carrying amount or impact the recoverability of the assets. At December 31, 2008, theFixture & Display reporting unit had $106 million of goodwill and $64 million of otherlong-lived assets ($62 million of the long-lived assets were associated with the StoreFixtures business unit).
For further information regarding the methodology we use for impairment testing, theassumptions we use for this testing and the potential for future impairment, refer toCritical Accounting Policies on page 60, and also Note C to the Consolidated FinancialStatements on page 91.
41

PART II
RESULTS OF OPERATIONS—2008 vs. 2007During 2008, sales from continuing operations decreased 4%. We reported full-year net
earnings from continuing operations of $123 million, which included $21 million ofrestructuring-related charges, impairments, and other items. Our 2008 earnings reflectedextremely soft market demand which led to lower unit volume in many of our businesses.In the majority of our markets, demand was soft throughout the year, but weakenedappreciably late in the third quarter as consumers further reduced their spending inresponse to the financial market distress and general U.S. and global economic conditions.Market share gains in certain businesses offset some of the impact from weak demand.
During the year, we also experienced significant inflation in steel costs, and wesuccessfully implemented price increases to recover the majority of these higher costs.Further details about our consolidated and segment results from continuing operationsare discussed below.
Consolidated Results (continuing operations)The following table shows the changes in sales and earnings from continuing
operations during 2008, and identifies the major factors contributing to the changes.Reported amounts for 2007 have been retrospectively adjusted to reflect thereclassification of our Coated Fabrics business unit from continuing to discontinuedoperations.
(Dollar amounts in millions, except per share data) Amount %
Net sales from continuing operations:Year ended December 31, 2007 . . . . . . . . . . . . . . . . . . . . . . . . . . . . . $4,250
Acquisition sales growth . . . . . . . . . . . . . . . . . . . . . . . . . . . . . . . . 35 0.8%Small divestitures . . . . . . . . . . . . . . . . . . . . . . . . . . . . . . . . . . . . . (41) (0.9)%Internal sales decline:
Approximate inflation . . . . . . . . . . . . . . . . . . . . . . . . . . . . . . . 285 6.7%Approximate unit volume decline . . . . . . . . . . . . . . . . . . . . . . (453) (10.7)%
Internal sales decline . . . . . . . . . . . . . . . . . . . . . . . . . . . . . . . (168) (4.0)%
Year ended December 31, 2008 . . . . . . . . . . . . . . . . . . . . . . . . . . . . . $4,076 (4.1)%
Earnings from continuing operations:(Dollar amounts, net of tax)
Year ended December 31, 2007 . . . . . . . . . . . . . . . . . . . . . . . . . . . . . $ 59Goodwill impairment in Fixture & Display . . . . . . . . . . . . . . . . . . . 120Restructuring-related charges . . . . . . . . . . . . . . . . . . . . . . . . . . . . (4)Asset impairment . . . . . . . . . . . . . . . . . . . . . . . . . . . . . . . . . . . . . . (4)Interest expense (net) . . . . . . . . . . . . . . . . . . . . . . . . . . . . . . . . . . 6Tax items . . . . . . . . . . . . . . . . . . . . . . . . . . . . . . . . . . . . . . . . . . . . 12Other factors including lower unit volume and production . . . . . . (66)
Year ended December 31, 2008 . . . . . . . . . . . . . . . . . . . . . . . . . . . . . $ 123
Earnings Per Share (continuing operations)—2007 . . . . . . . . . . . . . . . $ 0.33
Earnings Per Share (continuing operations)—2008 . . . . . . . . . . . . . . . $ 0.73
42
PART II
Sales from continuing operations decreased 4% versus 2007, primarily reflectingextremely weak market demand and our decision to exit specific sales volume withunacceptable profit margins (primarily in our Store Fixtures business). These declineswere partially offset by inflation-related price increases and market share gains.
Our U.S. bedding components business gained market share in 2008 as a result of: i)bedding manufacturers shifting innerspring purchases from international to domesticsources; ii) the deverticalization of a strong regional bedding manufacturer; and, iii)increased demand for innerspring mattresses, rather than premium-priced,non-innerspring products.
We experienced significant inflation in steel costs during 2008, and in response, weimplemented price increases to recover the higher costs. The magnitude of our sellingprice increases varied by product line depending on steel content, but in our majorResidential and Industrial businesses, prices increased substantially. In recent months,steel costs have abated. As costs were increasing, we experienced a lag in recovering them;likewise, as costs decline we also expect to realize a lag in any price reductions we giveback to our customers.
Full-year earnings from continuing operations were higher than in 2007, primarily dueto:
• Non-recurrence of 2007 goodwill impairment charges related to our Fixture &Display group ($120 million)
• Non-recurrence of 2007 tax items ($12 million)—adjustments to valuationallowances related to potential foreign tax benefits
• Lower interest expense
Several factors negatively impacted earnings. The most significant were:• Unit volume declines (down roughly 10% for the year)• Higher restructuring-related charges and asset impairments ($19 million)• Reduced production levels—with the significant pull-back in demand late in the
year, we cut production (even below depressed demand levels) and reducedinventories
LIFO Impact
All of our segments use the first-in, first-out (FIFO) method for valuing inventory. Inour consolidated financials, an adjustment is made at the corporate level (i.e. outside thesegments) to convert about 60% of our inventories to the last-in, first-out (LIFO) method.These are primarily our domestic, steel-related inventories. Significant steel cost increasesduring the year, along with moderately higher levels of these steel-related inventories,resulted in LIFO expense from continuing operations of $62 million in 2008 (versus a $1million benefit in 2007). Segment-level earnings in 2008 generally benefited under the FIFOmethod from the effect of rising commodity costs. For further discussion of inventories,see Note A to the Consolidated Financial Statements on page 82.
Interest and Income Taxes
Net interest expense decreased $9 million versus 2007, primarily the result of debtmaturities paid in 2007 and 2008, as well as lower commercial paper borrowings.
43
PART II
The consolidated worldwide effective income tax rate for 2008 was also lower, at 34.6%versus 58.1% in 2007. The 2007 rate was negatively impacted by goodwill impairmentcharges totaling $143 million, of which $95 million were non-deductible. This caused the2007 rate as a percent of pre-tax income to be much higher than normal. In 2008, a taxbenefit associated with the write-off of an acquired company’s stock was offset byincreased reserves for uncertain tax positions and valuation allowances against deferredtax assets for certain foreign entities.
In the third quarter of 2008, we recorded a $4 million valuation allowance againstcertain foreign tax assets. The valuation allowance related to our Canadian automotiveoperations that produce lumbar supports. The automotive industry is currently in adramatic state of decline, which has reduced the demand for our components. In additionto demand factors, these operations have also been negatively impacted by the strength inrecent years of the Canadian dollar versus the U.S. dollar (our Canadian automotiveoperations sell in U.S. dollars while incurring labor and overhead costs in Canadiandollars, thereby reducing margins). As a result, we believe it is more likely than not wewon’t realize the benefit of deferred tax assets associated with these operations.
As a result of recording this tax valuation allowance, we specifically reviewed expectedfuture cash flows for this component of the Automotive Reporting Unit as part of theannual long-lived asset impairment review. Based upon current facts and circumstances,we believe that the carrying value of these operations is recoverable through futureoperating cash flows. Performance in 2007 and the first half of 2008 was negativelyimpacted by the strength of the Canadian versus the U.S. Dollar. While it is difficult topredict the future movement in exchange rates, the Canadian dollar has recently weakenedversus the U.S. Dollar. If that trend were to continue, this would contribute to theimprovement of margins going forward. The carrying value of these operations was $51million at December 31, 2008, and we expect the future cash flows to recover those assets.Currently, the operations generate positive cash flows that we expect to improve in 2009through the combination of overhead reductions and reduced material costs caused byexpected lower steel prices. We continue to be awarded new product placements so webelieve market share loss is not a factor impacting recent performance.
Segment Results (continuing operations)In the following section we discuss 2008 sales and earnings before interest and taxes
(EBIT) from continuing operations for each of our segments. The Residential Furnishingsreported amounts for 2007 have been retrospectively adjusted to reflect the reclassificationof our Coated Fabrics business unit from continuing to discontinued operations. Weprovide additional detail about segment results and a reconciliation of segment EBIT toconsolidated EBIT in Note O to the Consolidated Financial Statements on page 117.
44
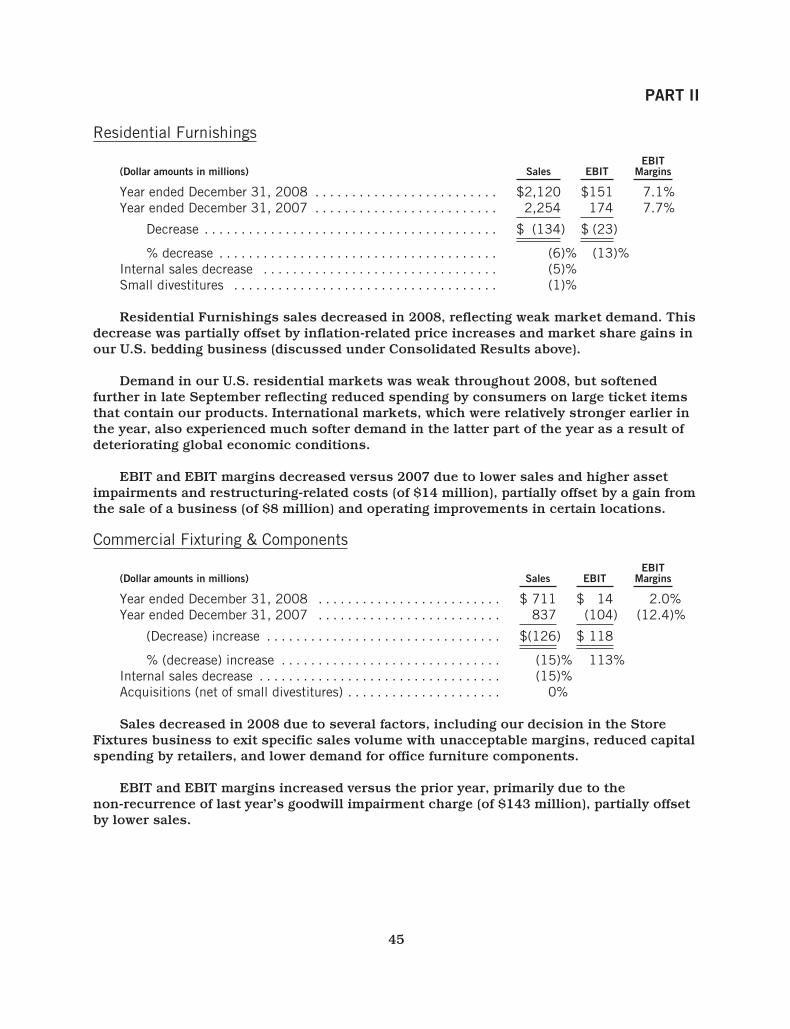
PART II
Residential Furnishings
(Dollar amounts in millions) Sales EBITEBIT
Margins
Year ended December 31, 2008 . . . . . . . . . . . . . . . . . . . . . . . . . $2,120 $151 7.1%Year ended December 31, 2007 . . . . . . . . . . . . . . . . . . . . . . . . . 2,254 174 7.7%
Decrease . . . . . . . . . . . . . . . . . . . . . . . . . . . . . . . . . . . . . . . . $ (134) $ (23)
% decrease . . . . . . . . . . . . . . . . . . . . . . . . . . . . . . . . . . . . . . (6)% (13)%Internal sales decrease . . . . . . . . . . . . . . . . . . . . . . . . . . . . . . . . (5)%Small divestitures . . . . . . . . . . . . . . . . . . . . . . . . . . . . . . . . . . . . (1)%
Residential Furnishings sales decreased in 2008, reflecting weak market demand. Thisdecrease was partially offset by inflation-related price increases and market share gains inour U.S. bedding business (discussed under Consolidated Results above).
Demand in our U.S. residential markets was weak throughout 2008, but softenedfurther in late September reflecting reduced spending by consumers on large ticket itemsthat contain our products. International markets, which were relatively stronger earlier inthe year, also experienced much softer demand in the latter part of the year as a result ofdeteriorating global economic conditions.
EBIT and EBIT margins decreased versus 2007 due to lower sales and higher assetimpairments and restructuring-related costs (of $14 million), partially offset by a gain fromthe sale of a business (of $8 million) and operating improvements in certain locations.
Commercial Fixturing & Components
(Dollar amounts in millions) Sales EBITEBIT
Margins
Year ended December 31, 2008 . . . . . . . . . . . . . . . . . . . . . . . . . $ 711 $ 14 2.0%Year ended December 31, 2007 . . . . . . . . . . . . . . . . . . . . . . . . . 837 (104) (12.4)%
(Decrease) increase . . . . . . . . . . . . . . . . . . . . . . . . . . . . . . . . $(126) $ 118
% (decrease) increase . . . . . . . . . . . . . . . . . . . . . . . . . . . . . . (15)% 113%Internal sales decrease . . . . . . . . . . . . . . . . . . . . . . . . . . . . . . . . . (15)%Acquisitions (net of small divestitures) . . . . . . . . . . . . . . . . . . . . . 0%
Sales decreased in 2008 due to several factors, including our decision in the StoreFixtures business to exit specific sales volume with unacceptable margins, reduced capitalspending by retailers, and lower demand for office furniture components.
EBIT and EBIT margins increased versus the prior year, primarily due to thenon-recurrence of last year’s goodwill impairment charge (of $143 million), partially offsetby lower sales.
45
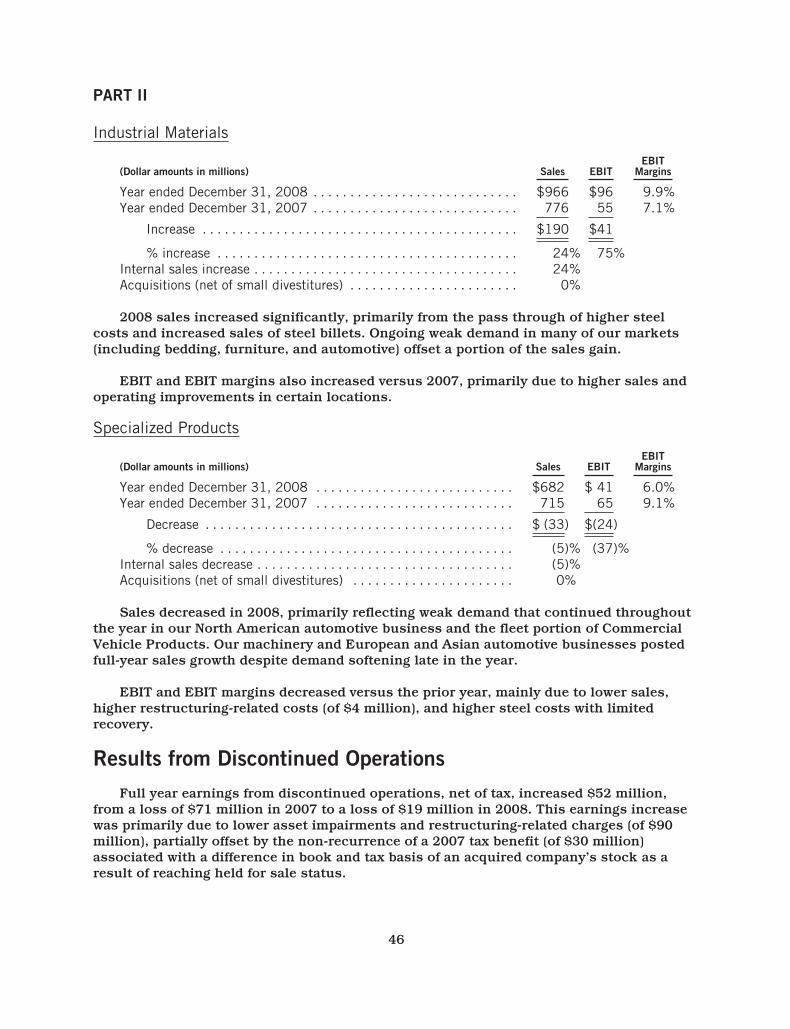
PART II
Industrial Materials
(Dollar amounts in millions) Sales EBITEBIT
Margins
Year ended December 31, 2008 . . . . . . . . . . . . . . . . . . . . . . . . . . . . $966 $96 9.9%Year ended December 31, 2007 . . . . . . . . . . . . . . . . . . . . . . . . . . . . 776 55 7.1%
Increase . . . . . . . . . . . . . . . . . . . . . . . . . . . . . . . . . . . . . . . . . . . $190 $41
% increase . . . . . . . . . . . . . . . . . . . . . . . . . . . . . . . . . . . . . . . . . 24% 75%Internal sales increase . . . . . . . . . . . . . . . . . . . . . . . . . . . . . . . . . . . . 24%Acquisitions (net of small divestitures) . . . . . . . . . . . . . . . . . . . . . . . 0%
2008 sales increased significantly, primarily from the pass through of higher steelcosts and increased sales of steel billets. Ongoing weak demand in many of our markets(including bedding, furniture, and automotive) offset a portion of the sales gain.
EBIT and EBIT margins also increased versus 2007, primarily due to higher sales andoperating improvements in certain locations.
Specialized Products
(Dollar amounts in millions) Sales EBITEBIT
Margins
Year ended December 31, 2008 . . . . . . . . . . . . . . . . . . . . . . . . . . . $682 $ 41 6.0%Year ended December 31, 2007 . . . . . . . . . . . . . . . . . . . . . . . . . . . 715 65 9.1%
Decrease . . . . . . . . . . . . . . . . . . . . . . . . . . . . . . . . . . . . . . . . . . $ (33) $(24)
% decrease . . . . . . . . . . . . . . . . . . . . . . . . . . . . . . . . . . . . . . . . (5)% (37)%Internal sales decrease . . . . . . . . . . . . . . . . . . . . . . . . . . . . . . . . . . . (5)%Acquisitions (net of small divestitures) . . . . . . . . . . . . . . . . . . . . . . 0%
Sales decreased in 2008, primarily reflecting weak demand that continued throughoutthe year in our North American automotive business and the fleet portion of CommercialVehicle Products. Our machinery and European and Asian automotive businesses postedfull-year sales growth despite demand softening late in the year.
EBIT and EBIT margins decreased versus the prior year, mainly due to lower sales,higher restructuring-related costs (of $4 million), and higher steel costs with limitedrecovery.
Results from Discontinued OperationsFull year earnings from discontinued operations, net of tax, increased $52 million,
from a loss of $71 million in 2007 to a loss of $19 million in 2008. This earnings increasewas primarily due to lower asset impairments and restructuring-related charges (of $90million), partially offset by the non-recurrence of a 2007 tax benefit (of $30 million)associated with a difference in book and tax basis of an acquired company’s stock as aresult of reaching held for sale status.
46
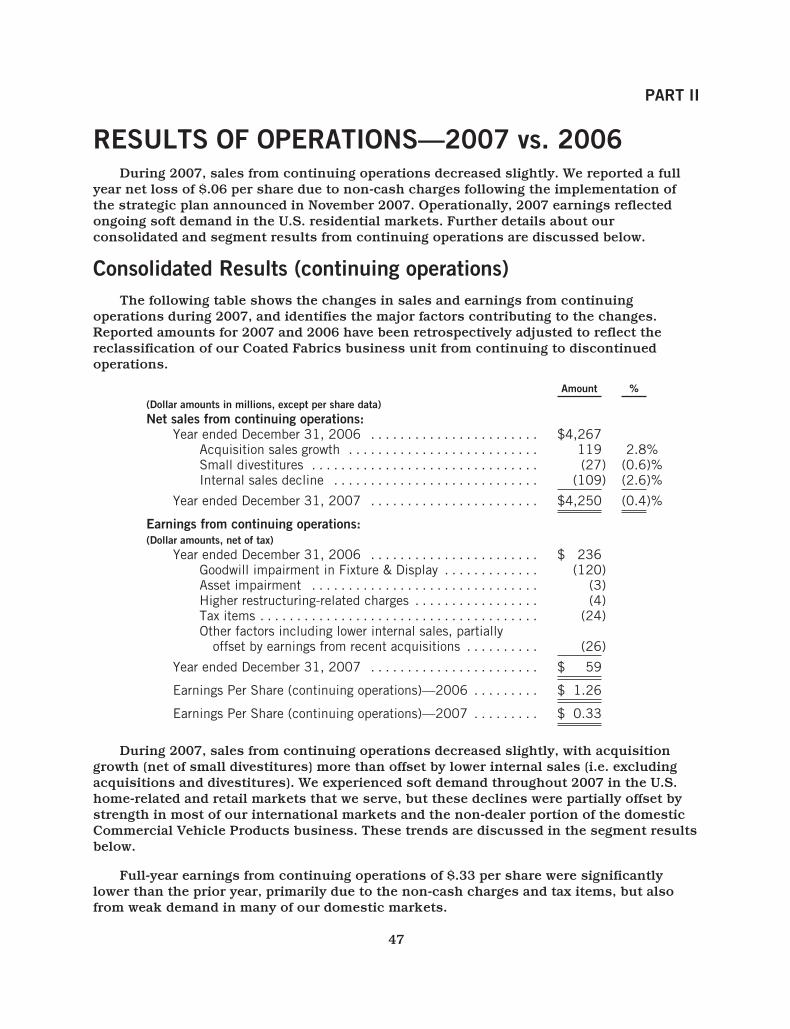
PART II
RESULTS OF OPERATIONS—2007 vs. 2006During 2007, sales from continuing operations decreased slightly. We reported a full
year net loss of $.06 per share due to non-cash charges following the implementation ofthe strategic plan announced in November 2007. Operationally, 2007 earnings reflectedongoing soft demand in the U.S. residential markets. Further details about ourconsolidated and segment results from continuing operations are discussed below.
Consolidated Results (continuing operations)The following table shows the changes in sales and earnings from continuing
operations during 2007, and identifies the major factors contributing to the changes.Reported amounts for 2007 and 2006 have been retrospectively adjusted to reflect thereclassification of our Coated Fabrics business unit from continuing to discontinuedoperations.
Amount %(Dollar amounts in millions, except per share data)Net sales from continuing operations:
Year ended December 31, 2006 . . . . . . . . . . . . . . . . . . . . . . . $4,267Acquisition sales growth . . . . . . . . . . . . . . . . . . . . . . . . . . 119 2.8%Small divestitures . . . . . . . . . . . . . . . . . . . . . . . . . . . . . . . (27) (0.6)%Internal sales decline . . . . . . . . . . . . . . . . . . . . . . . . . . . . (109) (2.6)%
Year ended December 31, 2007 . . . . . . . . . . . . . . . . . . . . . . . $4,250 (0.4)%
Earnings from continuing operations:(Dollar amounts, net of tax)
Year ended December 31, 2006 . . . . . . . . . . . . . . . . . . . . . . . $ 236Goodwill impairment in Fixture & Display . . . . . . . . . . . . . (120)Asset impairment . . . . . . . . . . . . . . . . . . . . . . . . . . . . . . . (3)Higher restructuring-related charges . . . . . . . . . . . . . . . . . (4)Tax items . . . . . . . . . . . . . . . . . . . . . . . . . . . . . . . . . . . . . . (24)Other factors including lower internal sales, partially
offset by earnings from recent acquisitions . . . . . . . . . . (26)
Year ended December 31, 2007 . . . . . . . . . . . . . . . . . . . . . . . $ 59
Earnings Per Share (continuing operations)—2006 . . . . . . . . . $ 1.26
Earnings Per Share (continuing operations)—2007 . . . . . . . . . $ 0.33
During 2007, sales from continuing operations decreased slightly, with acquisitiongrowth (net of small divestitures) more than offset by lower internal sales (i.e. excludingacquisitions and divestitures). We experienced soft demand throughout 2007 in the U.S.home-related and retail markets that we serve, but these declines were partially offset bystrength in most of our international markets and the non-dealer portion of the domesticCommercial Vehicle Products business. These trends are discussed in the segment resultsbelow.
Full-year earnings from continuing operations of $.33 per share were significantlylower than the prior year, primarily due to the non-cash charges and tax items, but alsofrom weak demand in many of our domestic markets.
47
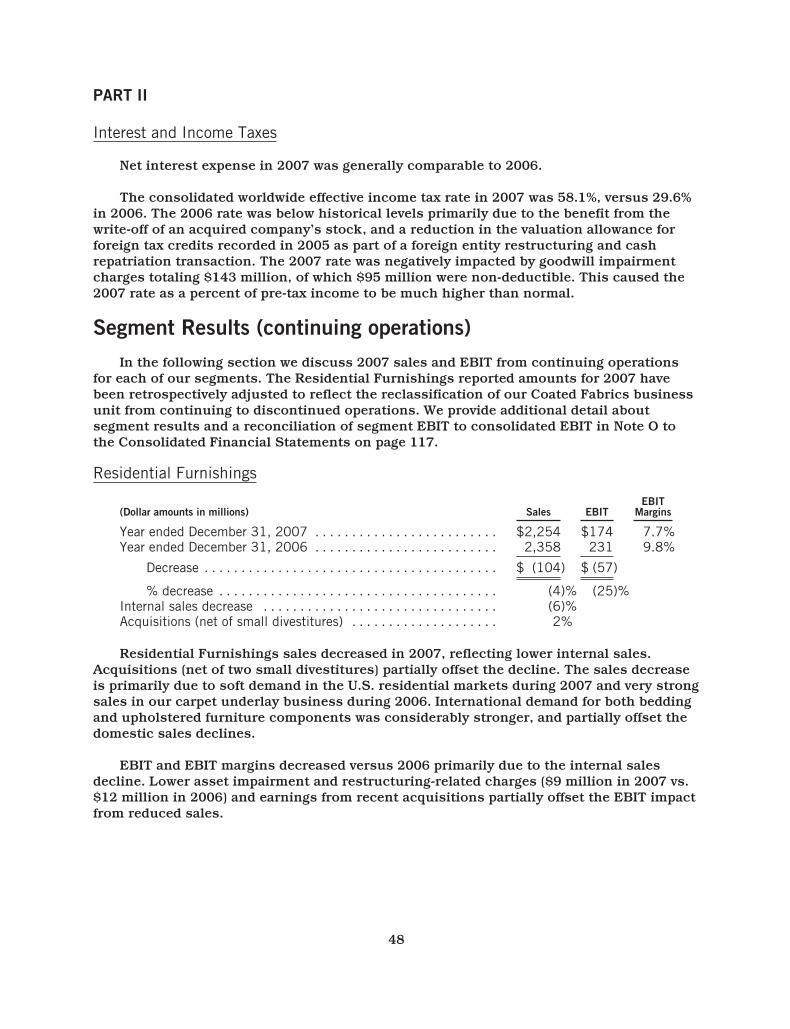
PART II
Interest and Income Taxes
Net interest expense in 2007 was generally comparable to 2006.
The consolidated worldwide effective income tax rate in 2007 was 58.1%, versus 29.6%in 2006. The 2006 rate was below historical levels primarily due to the benefit from thewrite-off of an acquired company’s stock, and a reduction in the valuation allowance forforeign tax credits recorded in 2005 as part of a foreign entity restructuring and cashrepatriation transaction. The 2007 rate was negatively impacted by goodwill impairmentcharges totaling $143 million, of which $95 million were non-deductible. This caused the2007 rate as a percent of pre-tax income to be much higher than normal.
Segment Results (continuing operations)In the following section we discuss 2007 sales and EBIT from continuing operations
for each of our segments. The Residential Furnishings reported amounts for 2007 havebeen retrospectively adjusted to reflect the reclassification of our Coated Fabrics businessunit from continuing to discontinued operations. We provide additional detail aboutsegment results and a reconciliation of segment EBIT to consolidated EBIT in Note O tothe Consolidated Financial Statements on page 117.
Residential Furnishings
(Dollar amounts in millions) Sales EBITEBIT
Margins
Year ended December 31, 2007 . . . . . . . . . . . . . . . . . . . . . . . . . $2,254 $174 7.7%Year ended December 31, 2006 . . . . . . . . . . . . . . . . . . . . . . . . . 2,358 231 9.8%
Decrease . . . . . . . . . . . . . . . . . . . . . . . . . . . . . . . . . . . . . . . . $ (104) $ (57)
% decrease . . . . . . . . . . . . . . . . . . . . . . . . . . . . . . . . . . . . . . (4)% (25)%Internal sales decrease . . . . . . . . . . . . . . . . . . . . . . . . . . . . . . . . (6)%Acquisitions (net of small divestitures) . . . . . . . . . . . . . . . . . . . . 2%
Residential Furnishings sales decreased in 2007, reflecting lower internal sales.Acquisitions (net of two small divestitures) partially offset the decline. The sales decreaseis primarily due to soft demand in the U.S. residential markets during 2007 and very strongsales in our carpet underlay business during 2006. International demand for both beddingand upholstered furniture components was considerably stronger, and partially offset thedomestic sales declines.
EBIT and EBIT margins decreased versus 2006 primarily due to the internal salesdecline. Lower asset impairment and restructuring-related charges ($9 million in 2007 vs.$12 million in 2006) and earnings from recent acquisitions partially offset the EBIT impactfrom reduced sales.
48

PART II
Commercial Fixturing & Components
(Dollar amounts in millions) Sales EBITEBIT
Margins
Year ended December 31, 2007 . . . . . . . . . . . . . . . . . . . . . . . . . . $837 $(104) (12.4)%Year ended December 31, 2006 . . . . . . . . . . . . . . . . . . . . . . . . . . 861 60 7.0%
Decrease . . . . . . . . . . . . . . . . . . . . . . . . . . . . . . . . . . . . . . . . . $ (24) $(164)
% decrease . . . . . . . . . . . . . . . . . . . . . . . . . . . . . . . . . . . . . . . (3)% (273)%Internal sales decrease . . . . . . . . . . . . . . . . . . . . . . . . . . . . . . . . . . (3)%Acquisitions (net of small divestitures) . . . . . . . . . . . . . . . . . . . . . 0%
Sales decreased in 2007, primarily due to lower Store Fixtures volume and ourdecision to walk away from sales with unacceptable margins, but also from slightly lowerdemand for office furniture components.
EBIT and EBIT margins were significantly lower than 2006, primarily due to a large,non-cash goodwill impairment charge. The major factors impacting EBIT were:
• Goodwill impairment ($143 million)• Higher asset impairment and restructuring-related charges ($14 million in 2007 vs.
$3 million in 2006)• Lower internal sales
These items were partially offset by gains from the sales of assets ($8 million).
Industrial Materials
(Dollar amounts in millions) Sales EBITEBIT
Margins
Year ended December 31, 2007 . . . . . . . . . . . . . . . . . . . . . . . . . . . . $776 $55 7.1%Year ended December 31, 2006 . . . . . . . . . . . . . . . . . . . . . . . . . . . . 784 55 7.0%
Decrease . . . . . . . . . . . . . . . . . . . . . . . . . . . . . . . . . . . . . . . . . . . $ (8) $ —
% decrease . . . . . . . . . . . . . . . . . . . . . . . . . . . . . . . . . . . . . . . . . (1)% 0%Internal sales decrease . . . . . . . . . . . . . . . . . . . . . . . . . . . . . . . . . . . (3)%Acquisitions (net of small divestitures) . . . . . . . . . . . . . . . . . . . . . . . 2%
Internal sales declined during the year, but this decrease was mostly offset byacquisitions (net of small divestitures). Continued softness in the U.S. residential marketsled to lower unit volume in our wire operations, but this decline was partially offset byinflation-related sales growth (from price increases we implemented to recover higher rawmaterial costs).
EBIT and EBIT margins were flat with the prior year, as the impact of lower sales wasoffset by earnings from an acquired business.
49

PART II
Specialized Products
(Dollar amounts in millions) Sales EBITEBIT
Margins
Year ended December 31, 2007 . . . . . . . . . . . . . . . . . . . . . . . . . . . . $715 $65 9.1%Year ended December 31, 2006 . . . . . . . . . . . . . . . . . . . . . . . . . . . . 621 43 6.9%
Increase . . . . . . . . . . . . . . . . . . . . . . . . . . . . . . . . . . . . . . . . . . . $ 94 $22
% increase . . . . . . . . . . . . . . . . . . . . . . . . . . . . . . . . . . . . . . . . . 15% 51%Internal sales growth . . . . . . . . . . . . . . . . . . . . . . . . . . . . . . . . . . . . . 11%Acquisitions (net of small divestitures) . . . . . . . . . . . . . . . . . . . . . . . 4%
Strong sales increases in 2007 reflected world-wide growth in our automotivebusiness, and continued solid performance in the non-dealer portion of CommercialVehicle Products. Acquisitions (net of a small divestiture) also contributed to higher salesduring the year.
EBIT and EBIT margins improved significantly, reflecting higher sales in the segmentand earnings from a company acquired early in 2007. These gains were partially offset asthe strength of the Canadian dollar negatively impacted our automotive business (we incurcosts in Canadian dollars and sell in U.S. dollars).
Results from Discontinued OperationsFull year earnings from discontinued operations, net of tax, declined $135 million,
from $64 million in 2006 to a loss of $71 million in 2007. The earnings decline wasprimarily due to:
• Higher asset impairments and restructuring-related charges (of $121 million)• Non-recurrence of the 2006 reimbursement of a duty on Canadian lumber imports
(of $10 million)• Softer demand, lower capacity utilization, and manufacturing inefficiencies in
certain operations
These items were partially offset by a tax benefit (of $30 million) associated with adifference in book and tax basis of an acquired company’s stock as a result of reachingheld for sale status.
50
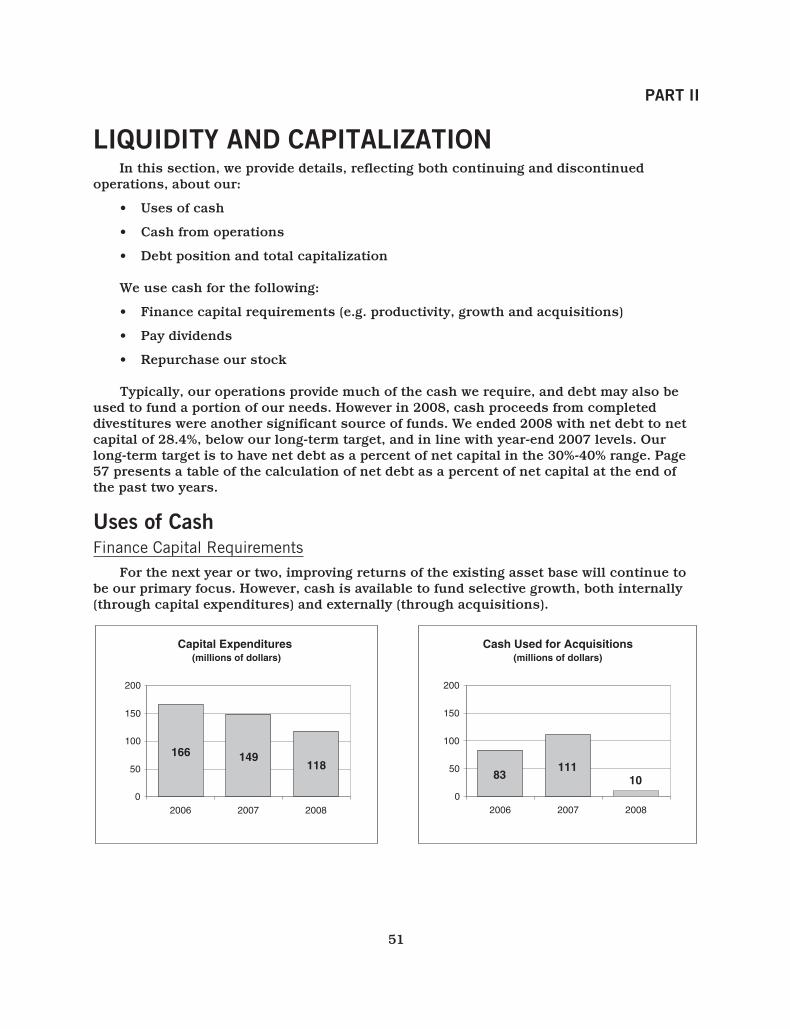
PART II
LIQUIDITY AND CAPITALIZATIONIn this section, we provide details, reflecting both continuing and discontinued
operations, about our:
• Uses of cash
• Cash from operations
• Debt position and total capitalization
We use cash for the following:
• Finance capital requirements (e.g. productivity, growth and acquisitions)
• Pay dividends
• Repurchase our stock
Typically, our operations provide much of the cash we require, and debt may also beused to fund a portion of our needs. However in 2008, cash proceeds from completeddivestitures were another significant source of funds. We ended 2008 with net debt to netcapital of 28.4%, below our long-term target, and in line with year-end 2007 levels. Ourlong-term target is to have net debt as a percent of net capital in the 30%-40% range. Page57 presents a table of the calculation of net debt as a percent of net capital at the end ofthe past two years.
Uses of CashFinance Capital Requirements
For the next year or two, improving returns of the existing asset base will continue tobe our primary focus. However, cash is available to fund selective growth, both internally(through capital expenditures) and externally (through acquisitions).
Capital Expenditures (millions of dollars)
2006 2007 2008
Cash Used for Acquisitions(millions of dollars)
2006 2007 2008
166 149118
0
50
100
150
200
83111
100
50
100
150
200
51
PART II
Capital expenditures include investments we make to modernize, maintain, andexpand manufacturing capacity. With our move to role-based portfolio management, we aremore restrictive in funding capital projects. Capital spending in 2009 is expected to bereduced to about $100 million. Growth capital, which had historically been available to allour businesses, is now predominantly earmarked for our Grow business units. Operationsdesignated as Core business units receive capital primarily for productivity enhancements,but expansion capital is limited.
We have also set a higher bar for acquisitions, and plan to pursue disciplined growththrough fewer, but more strategic, opportunities. We will seek acquisitions within ourgrowth businesses, and will also look for longer-term opportunities to enter new, highergrowth markets that meet strict criteria.
As a result of the new acquisition criteria, no significant acquisitions were completedin 2008. In 2007, we acquired three businesses that were expected to add about $100million to annual revenue ($20 million in Commercial Fixturing & Components, $50million in Industrial Materials, and $30 million in Specialized Products). Thesebusinesses:
▪ established a foothold in Asian production of office chair controls▪ manufactured coated wire products, including racks for dishwashers, and
presented Leggett with expanded technologies and cross-segment sellingopportunities
▪ broadened our suite of products for commercial vehicle interiors
We acquired five businesses in 2006 that were expected to add about $75 million toannual revenue. All these transactions occurred in the Residential Furnishings segment.These acquisitions:
▪ broadened our geographic presence and product offerings in geo components▪ expanded our rubber carpet underlay business▪ added to our international spring operations
In addition to the initial cash outlays for acquisitions (shown in the accompanyingchart), we also assumed debt of $5 million in 2006 and $24 million in 2007. We provideadditional details about acquisitions in Note G to the Consolidated Financial Statementson page 100.
52
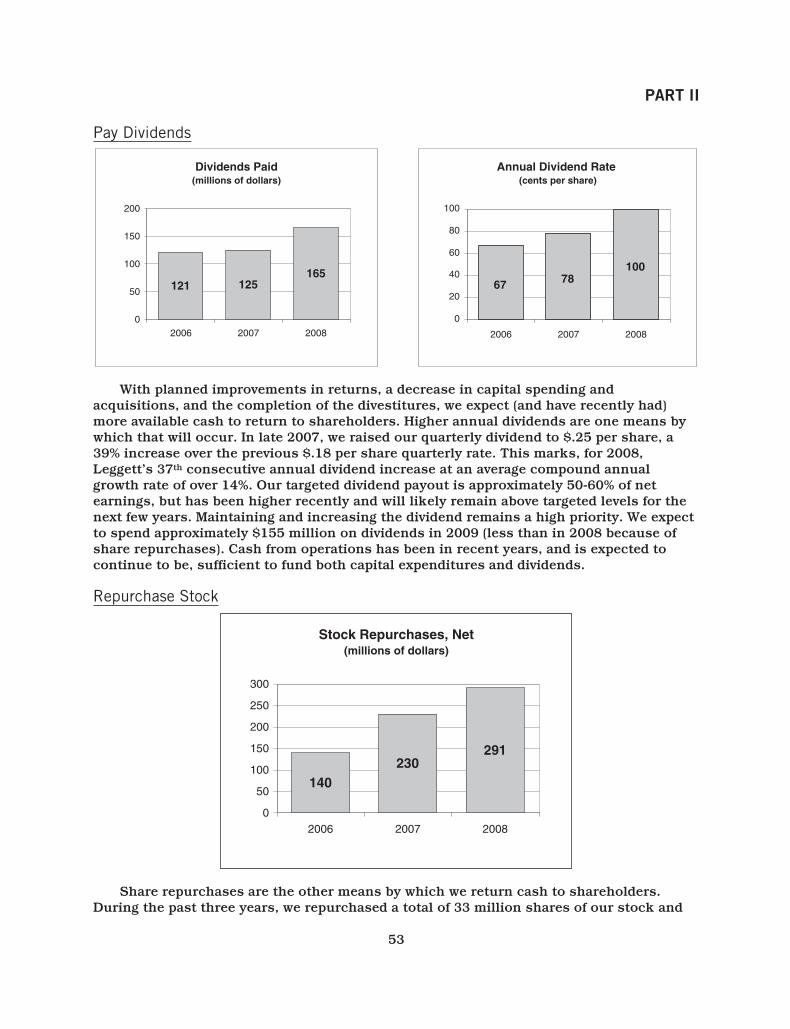
PART II
Pay Dividends
Dividends Paid (millions of dollars)
0
50
150
100
200
2006 2007 2008 2006 2007 2008
Annual Dividend Rate (cents per share)
121 125165
67 78100
0
20
40
60
80
100
With planned improvements in returns, a decrease in capital spending andacquisitions, and the completion of the divestitures, we expect (and have recently had)more available cash to return to shareholders. Higher annual dividends are one means bywhich that will occur. In late 2007, we raised our quarterly dividend to $.25 per share, a39% increase over the previous $.18 per share quarterly rate. This marks, for 2008,Leggett’s 37th consecutive annual dividend increase at an average compound annualgrowth rate of over 14%. Our targeted dividend payout is approximately 50-60% of netearnings, but has been higher recently and will likely remain above targeted levels for thenext few years. Maintaining and increasing the dividend remains a high priority. We expectto spend approximately $155 million on dividends in 2009 (less than in 2008 because ofshare repurchases). Cash from operations has been in recent years, and is expected tocontinue to be, sufficient to fund both capital expenditures and dividends.
Repurchase Stock
Stock Repurchases, Net(millions of dollars)
0
50
100
150
200
300
250
2006 2007 2008
140230
291
Share repurchases are the other means by which we return cash to shareholders.During the past three years, we repurchased a total of 33 million shares of our stock and
53
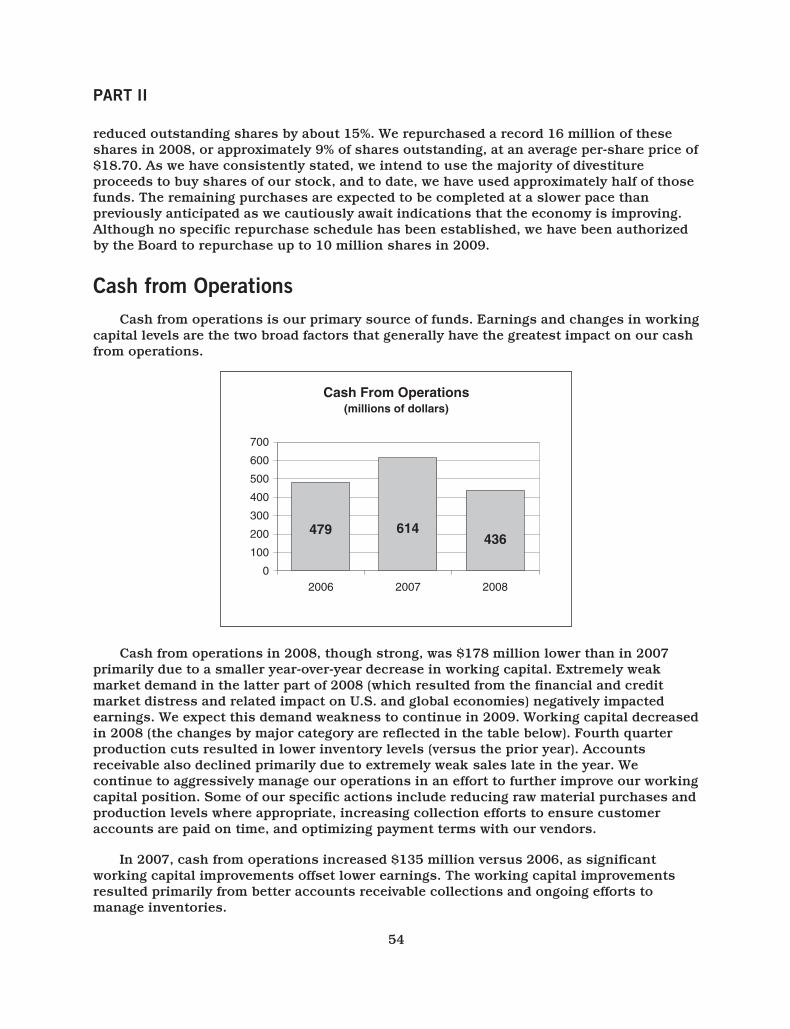
PART II
reduced outstanding shares by about 15%. We repurchased a record 16 million of theseshares in 2008, or approximately 9% of shares outstanding, at an average per-share price of$18.70. As we have consistently stated, we intend to use the majority of divestitureproceeds to buy shares of our stock, and to date, we have used approximately half of thosefunds. The remaining purchases are expected to be completed at a slower pace thanpreviously anticipated as we cautiously await indications that the economy is improving.Although no specific repurchase schedule has been established, we have been authorizedby the Board to repurchase up to 10 million shares in 2009.
Cash from OperationsCash from operations is our primary source of funds. Earnings and changes in working
capital levels are the two broad factors that generally have the greatest impact on our cashfrom operations.
Cash From Operations(millions of dollars)
0
100
200
300
400
500
600
700
2006 2007 2008
479 614436
Cash from operations in 2008, though strong, was $178 million lower than in 2007primarily due to a smaller year-over-year decrease in working capital. Extremely weakmarket demand in the latter part of 2008 (which resulted from the financial and creditmarket distress and related impact on U.S. and global economies) negatively impactedearnings. We expect this demand weakness to continue in 2009. Working capital decreasedin 2008 (the changes by major category are reflected in the table below). Fourth quarterproduction cuts resulted in lower inventory levels (versus the prior year). Accountsreceivable also declined primarily due to extremely weak sales late in the year. Wecontinue to aggressively manage our operations in an effort to further improve our workingcapital position. Some of our specific actions include reducing raw material purchases andproduction levels where appropriate, increasing collection efforts to ensure customeraccounts are paid on time, and optimizing payment terms with our vendors.
In 2007, cash from operations increased $135 million versus 2006, as significantworking capital improvements offset lower earnings. The working capital improvementsresulted primarily from better accounts receivable collections and ongoing efforts tomanage inventories.
54
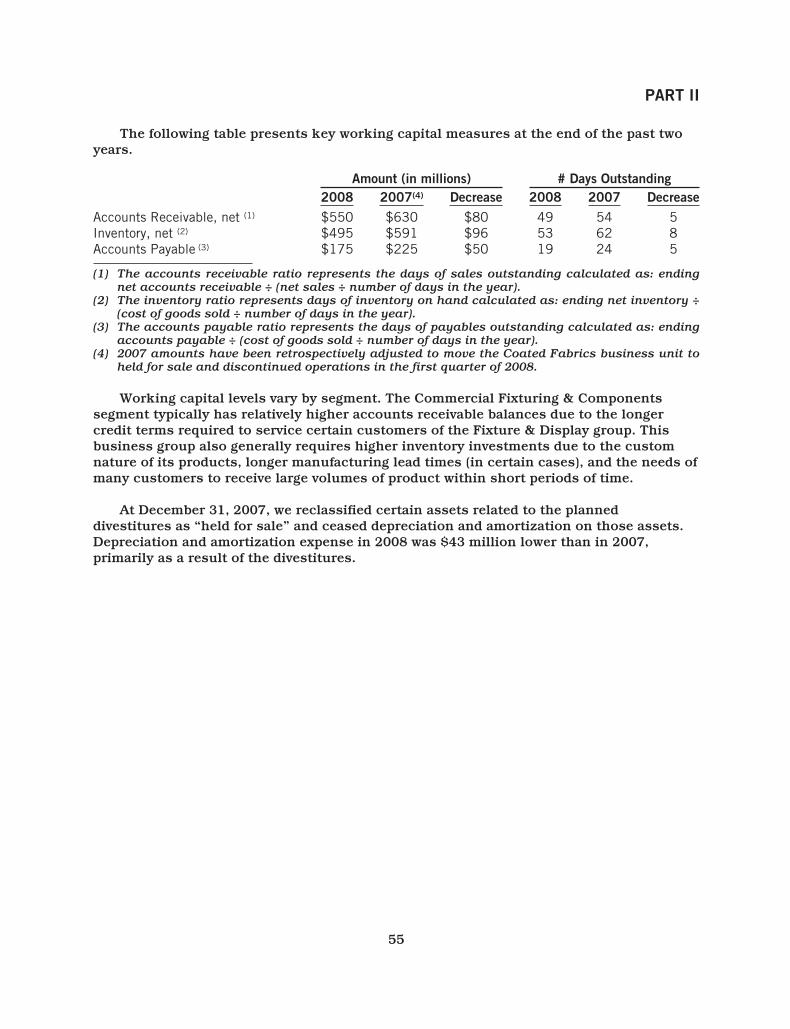
PART II
The following table presents key working capital measures at the end of the past twoyears.
Amount (in millions) # Days Outstanding2008 2007(4) Decrease 2008 2007 Decrease
Accounts Receivable, net (1) $550 $630 $80 49 54 5Inventory, net (2) $495 $591 $96 53 62 8Accounts Payable (3) $175 $225 $50 19 24 5
(1) The accounts receivable ratio represents the days of sales outstanding calculated as: endingnet accounts receivable ÷ (net sales ÷ number of days in the year).
(2) The inventory ratio represents days of inventory on hand calculated as: ending net inventory ÷(cost of goods sold ÷ number of days in the year).
(3) The accounts payable ratio represents the days of payables outstanding calculated as: endingaccounts payable ÷ (cost of goods sold ÷ number of days in the year).
(4) 2007 amounts have been retrospectively adjusted to move the Coated Fabrics business unit toheld for sale and discontinued operations in the first quarter of 2008.
Working capital levels vary by segment. The Commercial Fixturing & Componentssegment typically has relatively higher accounts receivable balances due to the longercredit terms required to service certain customers of the Fixture & Display group. Thisbusiness group also generally requires higher inventory investments due to the customnature of its products, longer manufacturing lead times (in certain cases), and the needs ofmany customers to receive large volumes of product within short periods of time.
At December 31, 2007, we reclassified certain assets related to the planneddivestitures as “held for sale” and ceased depreciation and amortization on those assets.Depreciation and amortization expense in 2008 was $43 million lower than in 2007,primarily as a result of the divestitures.
55
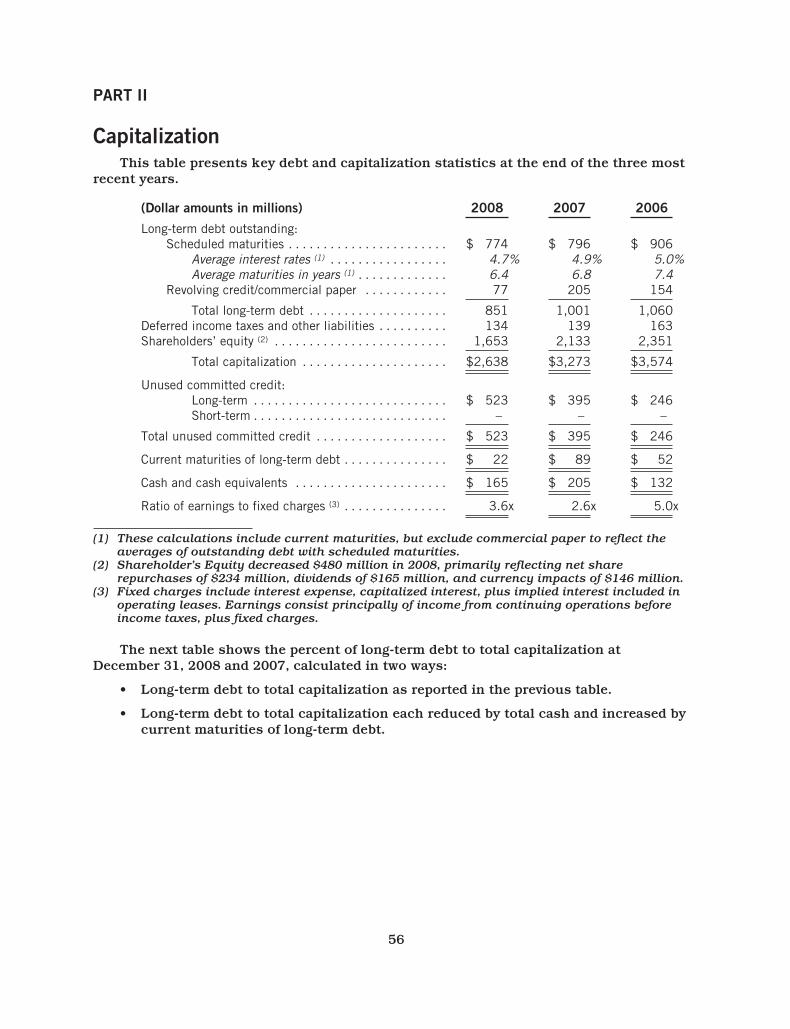
PART II
CapitalizationThis table presents key debt and capitalization statistics at the end of the three most
recent years.
(Dollar amounts in millions) 2008 2007 2006
Long-term debt outstanding:Scheduled maturities . . . . . . . . . . . . . . . . . . . . . . . $ 774 $ 796 $ 906
Average interest rates (1) . . . . . . . . . . . . . . . . . 4.7% 4.9% 5.0%Average maturities in years (1) . . . . . . . . . . . . . 6.4 6.8 7.4
Revolving credit/commercial paper . . . . . . . . . . . . 77 205 154
Total long-term debt . . . . . . . . . . . . . . . . . . . . 851 1,001 1,060Deferred income taxes and other liabilities . . . . . . . . . . 134 139 163Shareholders’ equity (2) . . . . . . . . . . . . . . . . . . . . . . . . . 1,653 2,133 2,351
Total capitalization . . . . . . . . . . . . . . . . . . . . . $2,638 $3,273 $3,574
Unused committed credit:Long-term . . . . . . . . . . . . . . . . . . . . . . . . . . . . $ 523 $ 395 $ 246Short-term . . . . . . . . . . . . . . . . . . . . . . . . . . . . – – –
Total unused committed credit . . . . . . . . . . . . . . . . . . . $ 523 $ 395 $ 246
Current maturities of long-term debt . . . . . . . . . . . . . . . $ 22 $ 89 $ 52
Cash and cash equivalents . . . . . . . . . . . . . . . . . . . . . . $ 165 $ 205 $ 132
Ratio of earnings to fixed charges (3) . . . . . . . . . . . . . . . 3.6x 2.6x 5.0x
(1) These calculations include current maturities, but exclude commercial paper to reflect theaverages of outstanding debt with scheduled maturities.
(2) Shareholder’s Equity decreased $480 million in 2008, primarily reflecting net sharerepurchases of $234 million, dividends of $165 million, and currency impacts of $146 million.
(3) Fixed charges include interest expense, capitalized interest, plus implied interest included inoperating leases. Earnings consist principally of income from continuing operations beforeincome taxes, plus fixed charges.
The next table shows the percent of long-term debt to total capitalization atDecember 31, 2008 and 2007, calculated in two ways:
• Long-term debt to total capitalization as reported in the previous table.
• Long-term debt to total capitalization each reduced by total cash and increased bycurrent maturities of long-term debt.
56
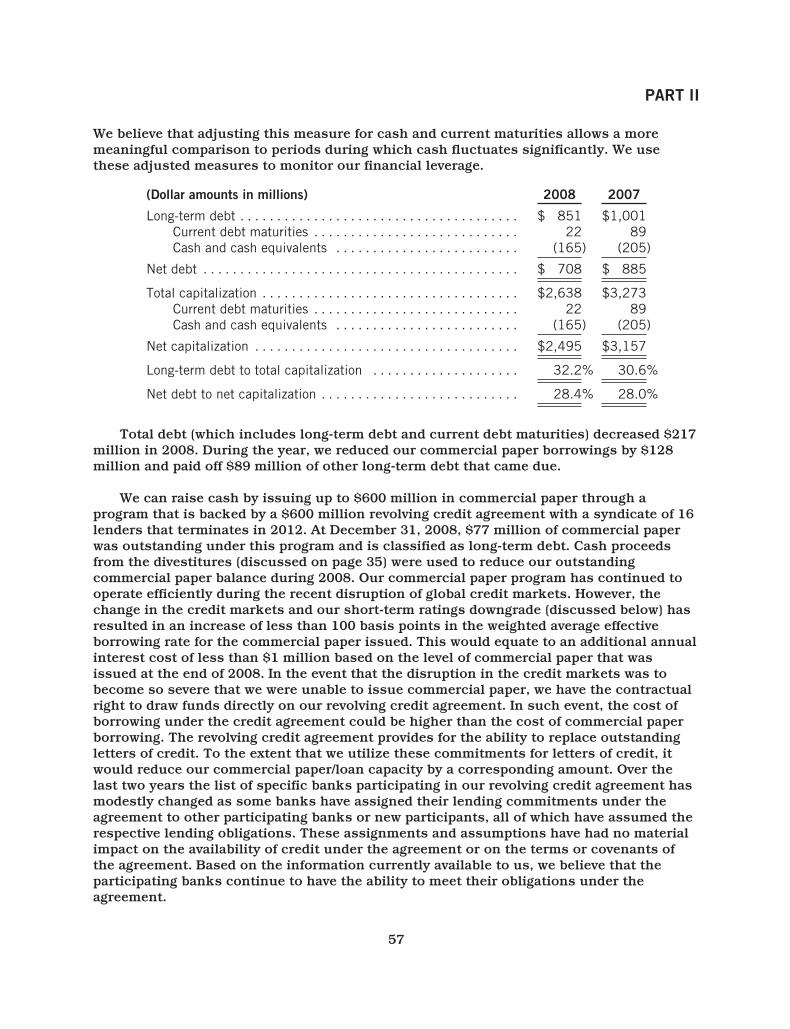
PART II
We believe that adjusting this measure for cash and current maturities allows a moremeaningful comparison to periods during which cash fluctuates significantly. We usethese adjusted measures to monitor our financial leverage.
(Dollar amounts in millions) 2008 2007
Long-term debt . . . . . . . . . . . . . . . . . . . . . . . . . . . . . . . . . . . . . . $ 851 $1,001Current debt maturities . . . . . . . . . . . . . . . . . . . . . . . . . . . . 22 89Cash and cash equivalents . . . . . . . . . . . . . . . . . . . . . . . . . (165) (205)
Net debt . . . . . . . . . . . . . . . . . . . . . . . . . . . . . . . . . . . . . . . . . . . $ 708 $ 885
Total capitalization . . . . . . . . . . . . . . . . . . . . . . . . . . . . . . . . . . . $2,638 $3,273Current debt maturities . . . . . . . . . . . . . . . . . . . . . . . . . . . . 22 89Cash and cash equivalents . . . . . . . . . . . . . . . . . . . . . . . . . (165) (205)
Net capitalization . . . . . . . . . . . . . . . . . . . . . . . . . . . . . . . . . . . . $2,495 $3,157
Long-term debt to total capitalization . . . . . . . . . . . . . . . . . . . . 32.2% 30.6%
Net debt to net capitalization . . . . . . . . . . . . . . . . . . . . . . . . . . . 28.4% 28.0%
Total debt (which includes long-term debt and current debt maturities) decreased $217million in 2008. During the year, we reduced our commercial paper borrowings by $128million and paid off $89 million of other long-term debt that came due.
We can raise cash by issuing up to $600 million in commercial paper through aprogram that is backed by a $600 million revolving credit agreement with a syndicate of 16lenders that terminates in 2012. At December 31, 2008, $77 million of commercial paperwas outstanding under this program and is classified as long-term debt. Cash proceedsfrom the divestitures (discussed on page 35) were used to reduce our outstandingcommercial paper balance during 2008. Our commercial paper program has continued tooperate efficiently during the recent disruption of global credit markets. However, thechange in the credit markets and our short-term ratings downgrade (discussed below) hasresulted in an increase of less than 100 basis points in the weighted average effectiveborrowing rate for the commercial paper issued. This would equate to an additional annualinterest cost of less than $1 million based on the level of commercial paper that wasissued at the end of 2008. In the event that the disruption in the credit markets was tobecome so severe that we were unable to issue commercial paper, we have the contractualright to draw funds directly on our revolving credit agreement. In such event, the cost ofborrowing under the credit agreement could be higher than the cost of commercial paperborrowing. The revolving credit agreement provides for the ability to replace outstandingletters of credit. To the extent that we utilize these commitments for letters of credit, itwould reduce our commercial paper/loan capacity by a corresponding amount. Over thelast two years the list of specific banks participating in our revolving credit agreement hasmodestly changed as some banks have assigned their lending commitments under theagreement to other participating banks or new participants, all of which have assumed therespective lending obligations. These assignments and assumptions have had no materialimpact on the availability of credit under the agreement or on the terms or covenants ofthe agreement. Based on the information currently available to us, we believe that theparticipating banks continue to have the ability to meet their obligations under theagreement.
57
PART II
With anticipated operating cash flows and the commercial paper program in place, webelieve we have sufficient funds available to support our ongoing operations, paydividends, repurchase stock, and fund future growth.
Most of our debt has fixed repayment dates. At the end of 2008, this debt consistedprimarily of term notes. We have maintained a debt rating in the “A” category (fromMoody’s and Standard and Poor’s) on our term notes and public debt for over a decade. OnNovember 12, 2008, Moody’s downgraded our long term debt rating from “A2” to “A3” andour commercial paper rating from “P1” to “P2” citing accelerating contraction inresidential and automotive related consumer spending. On November 25, 2008, S&Pdowngraded our long-term corporate credit and senior unsecured debt ratings from “A” to“A-” and our short-term and commercial paper ratings from “A-1” to “A-2” citing weakmarket conditions and financial policies that include a high dividend payout and sharerepurchases. In addition, both Moody’s and S&P assigned a negative outlook to each oftheir respective ratings. The ratings downgrades have not had an impact on our ability toissue commercial paper, but they have increased, and are expected to continue to increase,our cost of short-term borrowing. Also, if we choose to borrow under our $600 millionrevolving credit agreement, which expires in 2012, our interest cost under this agreementwould be increased approximately five basis points as a result of the new ratings. We donot expect the ratings downgrades to have a material impact on our liquidity or our abilityto access the long-term credit market.
These credit ratings reflect the views of the rating agency only. An explanation of thesignificance of these ratings may be obtained from the rating agency. These ratings are nota recommendation to buy, sell or hold securities. Any rating can be revised upward ordownward or withdrawn at any time by a rating agency if it decides that the circumstanceswarrant the change. Each rating agency may have different criteria for evaluating companyrisk and, therefore, each rating should be evaluated separately.
58
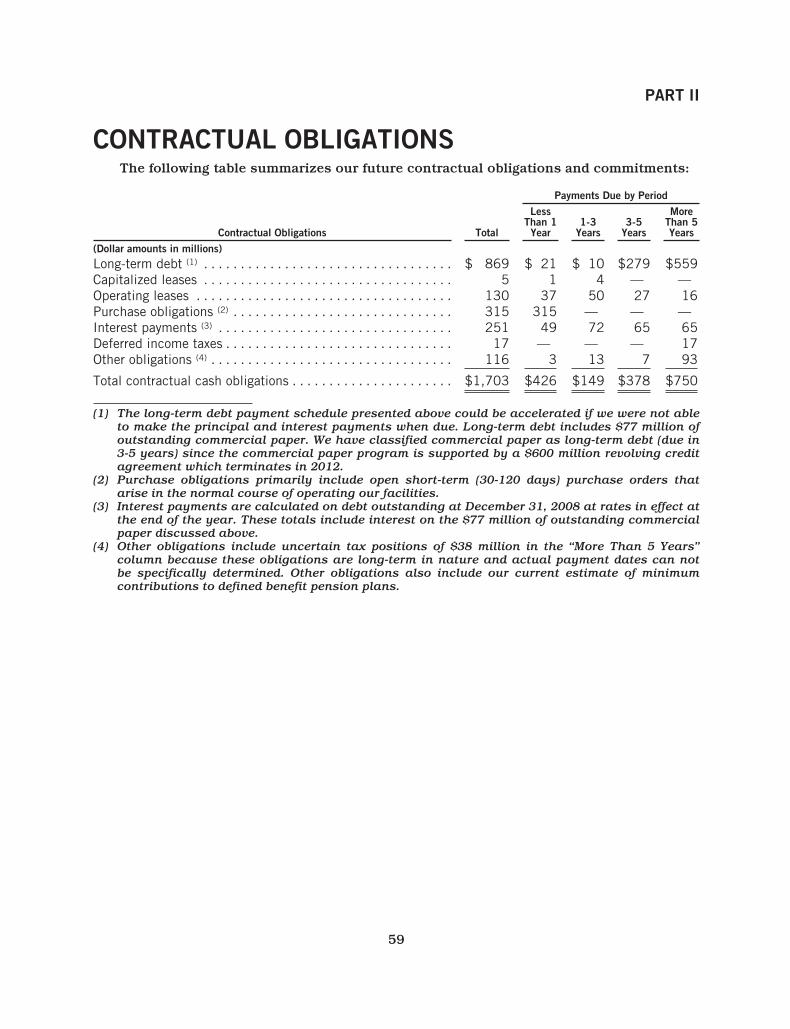
PART II
CONTRACTUAL OBLIGATIONSThe following table summarizes our future contractual obligations and commitments:
Payments Due by Period
Contractual Obligations Total
LessThan 1Year
1-3Years
3-5Years
MoreThan 5Years
(Dollar amounts in millions)Long-term debt (1) . . . . . . . . . . . . . . . . . . . . . . . . . . . . . . . . . . $ 869 $ 21 $ 10 $279 $559Capitalized leases . . . . . . . . . . . . . . . . . . . . . . . . . . . . . . . . . . 5 1 4 — —Operating leases . . . . . . . . . . . . . . . . . . . . . . . . . . . . . . . . . . . 130 37 50 27 16Purchase obligations (2) . . . . . . . . . . . . . . . . . . . . . . . . . . . . . . 315 315 — — —Interest payments (3) . . . . . . . . . . . . . . . . . . . . . . . . . . . . . . . . 251 49 72 65 65Deferred income taxes . . . . . . . . . . . . . . . . . . . . . . . . . . . . . . . 17 — — — 17Other obligations (4) . . . . . . . . . . . . . . . . . . . . . . . . . . . . . . . . . 116 3 13 7 93
Total contractual cash obligations . . . . . . . . . . . . . . . . . . . . . . $1,703 $426 $149 $378 $750
(1) The long-term debt payment schedule presented above could be accelerated if we were not ableto make the principal and interest payments when due. Long-term debt includes $77 million ofoutstanding commercial paper. We have classified commercial paper as long-term debt (due in3-5 years) since the commercial paper program is supported by a $600 million revolving creditagreement which terminates in 2012.
(2) Purchase obligations primarily include open short-term (30-120 days) purchase orders thatarise in the normal course of operating our facilities.
(3) Interest payments are calculated on debt outstanding at December 31, 2008 at rates in effect atthe end of the year. These totals include interest on the $77 million of outstanding commercialpaper discussed above.
(4) Other obligations include uncertain tax positions of $38 million in the “More Than 5 Years”column because these obligations are long-term in nature and actual payment dates can notbe specifically determined. Other obligations also include our current estimate of minimumcontributions to defined benefit pension plans.
59
PART II
CRITICAL ACCOUNTING POLICIES ANDESTIMATES
We prepare our consolidated financial statements in accordance with accountingprinciples generally accepted in the United States of America. To do so, we must makeestimates and judgments that affect the reported amounts of assets, liabilities, revenues,expenses, and disclosures. If we used different estimates or judgments our financialstatements would change, and some of those changes could be significant. Our estimatesare frequently based upon historical experience and are considered by management, at thetime they are made, to be reasonable and appropriate. Estimates are adjusted for actualevents, as they occur.
“Critical accounting estimates” are those that are: a) subject to uncertainty andchange, and b) of material impact to our financial statements. Listed here are the estimatesand judgments which we believe could have the most significant effect on our financialstatements:
• Asset and goodwill impairment• Inventory• Workers’ compensation, general liability, and employee benefit programs• Credit losses• Pension accounting• Income taxes• Contingencies
We provide additional details regarding our significant accounting policies in Note A tothe Consolidated Financial Statements on page 82.
Asset and Goodwill ImpairmentGoodwill is assessed for impairment annually, and as triggering events occur. Other
long-lived assets are tested for recoverability at year-end and whenever events orcircumstances indicate the carrying value may not be recoverable. The assessments areperformed to ensure that future cash flows (from use of the assets) exceed the assets’ bookvalue. In doing so, we make judgments and estimates about: a) the future cash flowsexpected from use (and eventual disposition) of the assets, and b) the assets’ fair marketvalues. If actual future cash flows are lower than our estimates, we could incur future(unanticipated) impairment charges.
Our ten reporting units for goodwill purposes (related to continuing operations) areone level below our operating segments, and are the same as the business groupsdisclosed in “Item 1. Business.” We assess our reporting units for possible goodwillimpairment on an annual basis and whenever events warrant. In doing so, we estimate thefair market values of our reporting units using a discounted cash flow model andcomparable market values for similar entities using price to earnings ratios. Keyassumptions and estimates used in the cash flow model include discount rate, internalsales growth, margins, capital expenditure requirements, and working capitalrequirements. Recent performance of the reporting unit is an important factor, but not theonly factor, in our assessment.
60
PART II
The annual goodwill impairment review performed in June 2008 indicated no goodwillimpairments. As a result of the deterioration in the economic and financial climate in thefourth quarter of 2008, interim goodwill and other long-lived asset impairment analyseswere performed in the fourth quarter. The goodwill analysis confirmed that estimated fairvalues exceeded carrying values for all reporting units. Future cash flow assumptions werereduced to reflect lower sales and production levels for 2009 and 2010, returning tohistorical levels thereafter. Other long-lived asset impairment charges of $12 million wererecorded in the fourth quarter 2008. If actual results differ from estimates used in thesecalculations, the Company could incur future (unanticipated) impairment charges.
Throughout 2008, we recorded $26 million of goodwill and $6 million of otherlong-lived asset impairments related to businesses held for sale as updated estimates offair value less costs to sell became more certain.
In June 2007, we performed the annual goodwill impairment review and determinedthat no impairments were indicated for any reporting units. In the fourth quarter 2007, weperformed an interim goodwill impairment review as a result of the November StrategicPlan which was considered a “triggering event” as defined in FAS 142. The fair value ofeach reporting unit was adjusted to reflect the significant decrease in the Company’soverall market value since June. In addition, individual reporting units impacted by the2007 Strategic Plan were revised to reflect updated margin and growth assumptions.
Since the carrying amounts of our Fixture & Display and Aluminum Products reportingunits were determined to exceed their fair values, we performed the second step of thegoodwill impairment test to determine the amount of impairment loss, if any. The secondstep of the goodwill impairment test compares the implied fair value of the reporting unit’sgoodwill with the carrying value of the goodwill. If the carrying value of the reporting unit’sgoodwill exceeds the implied fair value of that goodwill, an impairment loss is recognizedin an amount equal to that excess. The implied fair value of goodwill is determined in thesame manner as the amount of goodwill recognized in a business combination. That is, thefair value of the reporting unit is allocated to all of the assets and liabilities of that unit asif the reporting unit had been acquired in a business combination and the fair value of thereporting unit was the purchase price paid to acquire the reporting unit. The fair values ofthe reporting units identified above were determined using the discounted cash flowmethod and comparable market values for similar entities using price to earnings ratios.Application of the discounted cash flow method requires significant projections andassumptions. The significant assumptions used in this approach include estimates of ourfuture revenues, profits, capital expenditures, working capital requirements, operatingplans, industry data and other relevant factors. As a result of this process, we recordedgoodwill impairment charges in the fourth quarter of 2007 related to the Fixture & Displayand Aluminum Products reporting units of $143 and $83 million, respectively. In addition,we recorded goodwill and asset impairments of $51 million in the fourth quarter 2007relating to other held-for-sale locations.
Discounted cash flow projections for these two reporting units were based on 10-yearfinancial forecasts. These forecasts were based on annual financial forecasts developedinternally by management for use in managing the business. The significant assumptionsof these forecasts included a compound annual growth rate during the 10 years of 5% and
61
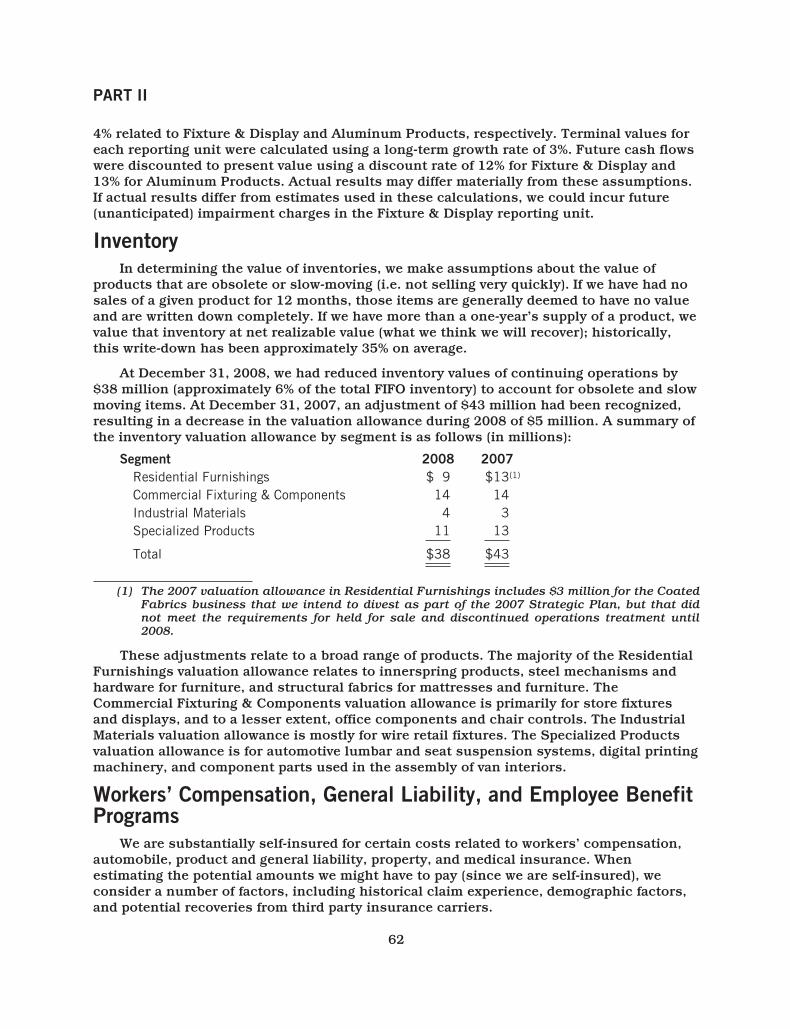
PART II
4% related to Fixture & Display and Aluminum Products, respectively. Terminal values foreach reporting unit were calculated using a long-term growth rate of 3%. Future cash flowswere discounted to present value using a discount rate of 12% for Fixture & Display and13% for Aluminum Products. Actual results may differ materially from these assumptions.If actual results differ from estimates used in these calculations, we could incur future(unanticipated) impairment charges in the Fixture & Display reporting unit.
InventoryIn determining the value of inventories, we make assumptions about the value of
products that are obsolete or slow-moving (i.e. not selling very quickly). If we have had nosales of a given product for 12 months, those items are generally deemed to have no valueand are written down completely. If we have more than a one-year’s supply of a product, wevalue that inventory at net realizable value (what we think we will recover); historically,this write-down has been approximately 35% on average.
At December 31, 2008, we had reduced inventory values of continuing operations by$38 million (approximately 6% of the total FIFO inventory) to account for obsolete and slowmoving items. At December 31, 2007, an adjustment of $43 million had been recognized,resulting in a decrease in the valuation allowance during 2008 of $5 million. A summary ofthe inventory valuation allowance by segment is as follows (in millions):
Segment 2008 2007Residential Furnishings $ 9 $13(1)
Commercial Fixturing & Components 14 14Industrial Materials 4 3Specialized Products 11 13
Total $38 $43
(1) The 2007 valuation allowance in Residential Furnishings includes $3 million for the CoatedFabrics business that we intend to divest as part of the 2007 Strategic Plan, but that didnot meet the requirements for held for sale and discontinued operations treatment until2008.
These adjustments relate to a broad range of products. The majority of the ResidentialFurnishings valuation allowance relates to innerspring products, steel mechanisms andhardware for furniture, and structural fabrics for mattresses and furniture. TheCommercial Fixturing & Components valuation allowance is primarily for store fixturesand displays, and to a lesser extent, office components and chair controls. The IndustrialMaterials valuation allowance is mostly for wire retail fixtures. The Specialized Productsvaluation allowance is for automotive lumbar and seat suspension systems, digital printingmachinery, and component parts used in the assembly of van interiors.
Workers’ Compensation, General Liability, and Employee BenefitPrograms
We are substantially self-insured for certain costs related to workers’ compensation,automobile, product and general liability, property, and medical insurance. Whenestimating the potential amounts we might have to pay (since we are self-insured), weconsider a number of factors, including historical claim experience, demographic factors,and potential recoveries from third party insurance carriers.
62
PART II
Over the past five years, we have incurred, on average, $26 million annually for costsassociated with these insurance programs. Average year-to-year variation over the past fiveyears has been approximately $3 million. At December 31, 2008, we had accrued $71million to cover future self-insurance liabilities.
Credit LossesOur customers are diverse. Many are small-to-medium sized companies, and some are
highly leveraged. Bankruptcy can occur with some of these customers relatively quicklyand with little warning. We regularly evaluate the ability of our customers to pay what theyowe us. When we become aware of a specific customer’s potential inability to pay, werecord a bad debt reserve for the amount we believe may not be collectible. We considerfactors such as the length of time that receivables are past due, the financial health of thecustomer, industry and macroeconomic considerations, and historical experience.
The total amount of credit losses over the last three years is $35 million. AtDecember 31, 2008, our reserves for doubtful accounts not held for sale totaled $38million (about 6% of our accounts and notes receivable of $634 million).
Pension AccountingFor our pension plans, we must estimate the cost of benefits to be provided (well into
the future) and the current value of those benefit obligations. The two most criticalassumptions affecting these estimates are the discount rate and the expected return onassets. Other assumptions include rates of compensation increases, withdrawal andmortality rates, and retirement ages. These estimates impact the pension expense orincome we recognize and our reported benefit obligations. We have recognized the impactof individual plans’ funded amounts on the balance sheet, and in 2008, changed to aDecember 31 measurement date (from September 30 in previous years).
To reflect market interest rates, in 2008 the discount rate for our major pension planswas unchanged at 6.0%. This follows an increase in 2007 from 5.75% to 6.0%. For 2008, weassumed long-term returns of 8.0% on the assets of these plans, which was identical to our2007 and 2006 assumptions.
Sensitivity to changes in the critical assumptions for our major plans is as follows:• Discount rate: a 25 basis point decrease in the discount rate would increase
pension expense by approximately $.5 million and decrease the plans’ fundedstatus by approximately $5 million.
• Expected return on assets: a 25 basis point reduction in the expected return onassets would increase pension expense by $.4 million, but have no effect on theplans’ funded status.
We expect that the combined contribution in 2009 to our defined benefit plans willtotal approximately $3 million. On December 31, 2006, our defined benefit Retirement Plancovering non-union employees was frozen, thereby eliminating the future accrual ofbenefits to participants and closing the plan to future enrollment. This plan changereduced the projected benefit obligation by $12 million, and reduced 2007 pension expenseby $4 million. Participants were moved to a defined contribution plan with a companycontribution based upon the age of the participant.
63
PART II
Income TaxesIn the ordinary course of business, we must make estimates of the tax treatment of
many transactions, even though the ultimate tax outcome may remain uncertain for sometime. These estimates become part of the annual income tax expense reported in ourfinancial statements. Subsequent to year end, we finalize our tax analysis and file incometax returns. Tax authorities periodically audit these income tax returns and examine ourtax filing positions, including (among other things) the timing and amounts of deductions,and the allocation of income among tax jurisdictions. We adjust income tax expense in ourfinancial statements in the periods in which the actual outcome becomes more certain.
At December 31, 2008, six open years were undergoing (or subject to) audit by theUnited States Internal Revenue Service (IRS) and Canada Revenue Agency. Amended federalreturns were filed with the IRS in 2008 for the 2004 tax year with a refund of $3 millionexpected. These filings are subject to review by the IRS, with the largest issue related to aresearch and development credit. In 2006, the IRS examination for the years 2002 and 2003was concluded. A final report was issued, and the net refund of approximately $11 million,plus interest, was received in 2007. The largest issue pertained to a refund claim we madefor a worthless stock deduction. The resolution of this item was reflected in 2006 as areduction in the Company’s overall tax rate. Canada Revenue Agency examinations areunderway for 2003 through 2006, which are at various stages of completion, but to date theCompany is not aware of any material adjustments.
At December 31, 2008 and 2007, we had $24 million and $25 million, respectively, ofnet deferred tax assets on our balance sheet related to operating loss and tax creditcarryforwards. The ultimate realization of these deferred tax assets is dependent upon theamount and source of future taxable income. Valuation reserves are established againstfuture potential tax benefits to reflect the amounts that we believe have no more than a50% probability of being realized. In addition, assumptions have been made regarding thenon-repatriation of earnings from certain subsidiaries. Those assumptions may change inthe future, thereby affecting future period results for the tax impact of such earnings.
ContingenciesOur disclosure and accrual of loss contingencies (i.e., losses that may or may not
occur) are based on our assessment of the likelihood that the expenses will actually occur,and our estimate of the likely cost. Our estimates and judgments are subjective and caninvolve matters in litigation, the results of which are generally very unpredictable.
The Company has been named as one of numerous defendants in several casesconsolidated as Gray v. Derderian, Case No. 1:04-CV-312-L, U.S.D.C. R.I. This litigationresulted from a nightclub fire in West Warwick, Rhode Island involving multiple deaths andinjuries. Along with other foam manufacturing defendants, the Company is alleged to havemanufactured and sold bulk polyurethane foam to a foam fabricator in Rhode Island, whoin turn, is alleged to have fabricated and sold foam sheets to the nightclub. The foam wasamong other materials alleged to have caught fire when pyrotechnics were ignited insidethe nightclub.
The Company believes it did not manufacture the foam subject to the lawsuit and thatit has valid defenses to the claims. Nevertheless, with the Company’s consent, the
64
PART II
Company’s primary insurance carrier reached a tentative settlement with counsel for allplaintiffs on April 29, 2008. If the settlement is approved by the court, the Company willpay a $2 million self-insured retention and the remainder of the $18.2 million settlement isthe responsibility of the insurance carrier. The settlement is subject to contingencies,including approval by the court. Management does not believe the settlement or theoutcome will have a material effect on the Company’s financial condition, operating cashflows or results of operations.
On February 5, 2009, a shareholder derivative complaint was filed by the New EnglandCarpenters Pension Fund, which represented that it owns 3,000 shares of Leggett stock, inthe Circuit Court of Jasper County, Missouri. The complaint is substantially similar to alawsuit filed by the New England Carpenters Pension Fund in federal court onSeptember 4, 2008, which the plaintiff voluntarily dismissed on September 26, 2008without prejudice to its right to re-file. However, this new lawsuit has fewer claims andasserts no federal causes of action. The action is purportedly brought on behalf of theCompany, naming it as a nominal defendant and naming as defendants certain current andformer officers and directors of the Company.
The plaintiff alleges, among other things, that the individual defendants participated inthe backdating of stock options, breached fiduciary duties, caused or allowed the Companyto issue false and misleading financial statements and proxy statements, and soldCompany stock while in possession of material non-public information. The plaintiffseeks, among other things, unspecified monetary damages against the individualdefendants, certain equitable and other relief relating to the profits from the allegedimproper conduct, the adoption of certain Company corporate governance proposals, theimposition of a constructive trust over the defendants’ stock options and proceeds,punitive damages, the rescission of certain unexercised options, and the reimbursement oflitigation costs. The plaintiff is not seeking any monetary relief from the Company. Policiesof directors and officers liability insurance are in force, subject to customary limits andexclusions.
The complaint is based on a statistical analysis of stock option grants and Leggettstock prices that we believe is flawed. We believe this lawsuit does not take intoconsideration important aspects of Leggett’s stock option plans. For example, the plaintiffhas noted only one set of stock option grants, made on December 30, 2005, within what webelieve to be the applicable 5-year statute of limitations. These option grants were made inaccordance with the Company’s Deferred Compensation Program, which (i) provided thatoptions would be dated on the last business day of December, and (ii) was filed with theSEC on December 2, 2005 setting out the pricing mechanism well before the grant date. Weprovided plaintiff’s counsel with this publicly available documentation before theydismissed the prior federal court lawsuit.
The Company expects that the outcome of this litigation will not have a materialadverse effect on its financial condition, operating cash flows or results of operations.
65
PART II
NEW ACCOUNTING STANDARDSOn January 1, 2008, the Company adopted the Financial Accounting Standards Board
(FASB) Statement of Financial Accounting Standards (SFAS) No. 158 (SFAS 158),“Employers’ Accounting for Defined Benefit Pension and Other Postretirement Plans”provision which requires it to measure the funded status of its plans as of year endbeginning with its December 31, 2008 balance sheet. The Company previously usedSeptember 30 as the measurement date for its most significant plans. The Company haschosen to perform a measurement that covers the 15-month period of October 1, 2007through December 31, 2008. Upon implementation, a proportionate allocation was made tocover the net benefit income for the transition period and the Company recorded a $.5million (net of tax) increase to beginning retained earnings on January 1, 2008. TheCompany previously adopted the provisions of this statement which were effectiveDecember 31, 2006 to recognize the funded status of its defined benefit plans in thebalance sheet and to recognize as a component of other comprehensive income changes infunded status from year to year that are not otherwise reflected in income.
As discussed in Note T to the Consolidated Financial Statements on page 126, theprovisions of SFAS No. 157 (SFAS 157), “Fair Value Measurements” were adopted onJanuary 1, 2008 for financial assets and liabilities of the Company. SFAS 157 providesguidance for using fair value to measure assets and liabilities and requires additionaldisclosure. SFAS 157 also has an effective date of January 1, 2009 for nonfinancial assetsand liabilities that are recognized or disclosed at fair value in the financial statements on anonrecurring basis. The Company has evaluated the effect of this standard and does notbelieve that it will have a material impact on the Company’s financial statements.
In February 2007, the FASB issued SFAS No. 159 (SFAS 159), “The Fair Value Optionfor Financial Assets and Financial Liabilities—Including an Amendment of FASB StatementNo. 115”. SFAS 159 permits entities to choose to measure many financial instruments andcertain other instruments at fair value, with the objective of improving financial reportingby providing entities with the opportunity to mitigate volatility in reported earnings causedby measuring related assets and liabilities differently without having to apply complexhedge accounting provisions. As the Company did not elect to fair value any of its financialinstruments under the provisions of SFAS 159, the adoption of this statement, effectiveJanuary 1, 2008, did not have an impact on the financial statements.
In December 2007, the FASB issued SFAS No. 141(R) (SFAS 141R), “BusinessCombinations,” which replaces SFAS 141. The new standard requires the acquiring entityin a business combination to recognize all the assets acquired and liabilities assumed inthe transaction and establishes the acquisition-date fair value as the measurementobjective for all assets acquired and liabilities assumed. SFAS 141R is effective on aprospective basis for all business combinations for which the acquisition date is on orafter January 1, 2009, with the exception of the accounting for valuation allowances ondeferred taxes and acquired tax contingencies. SFAS 141R amends SFAS 109 such thatadjustments made to valuation allowances on deferred taxes and acquired taxcontingencies associated with acquisitions that closed prior to the effective date of SFAS141R would also apply the provisions of SFAS 141R. Because the adoption of SFAS 141Rwill be applied prospectively, it is not expected to have a material impact on the Company’sfinancial statements.
66
PART II
In December 2007, the FASB also issued SFAS No. 160 (SFAS 160), “NoncontrollingInterests in Consolidated Financial Statements,” which seeks to improve the relevance,comparability, and transparency of financial information provided to investors by requiringall entities to report noncontrolling (minority) interests in subsidiaries in the same way asequity in their consolidated financial statements. SFAS 160 is also effective for theCompany beginning January 1, 2009, and its adoption is not expected to have a materialimpact on the Company’s financial statements.
In March 2008, the FASB issued SFAS No. 161 (SFAS 161), “Disclosures aboutDerivative Instruments and Hedging Activities.” The new standard requires enhanceddisclosures about derivative instruments and hedging activities and their effects on anentity’s financial position, financial performance, and cash flows. The statement requiresdisclosure of objectives and strategies for derivative instruments, disclosure of the fairvalues of derivative instruments and their gains and losses in a tabular format, disclosureof contingent derivative features that are credit-risk related, and requires cross-referencingwithin footnotes if the required disclosures are presented in more than one footnote. SFAS161 is effective for financial statements issued for fiscal years and interim periodsbeginning after November 15, 2008. Its adoption is not expected to have a material impacton the Company’s financial statements.
In April 2008, FASB Staff Position (FSP) SFAS No. 142-3, “Determination of the UsefulLife of Intangible Assets” was issued. This FSP amends the factors that must beconsidered in developing renewal or extension assumptions used to determine the usefullife over which to amortize the cost of a recognized intangible asset under SFAS No. 142(SFAS 142), “Goodwill and Other Intangible Assets.” The FSP requires an entity to considerits own assumptions about renewal or extension of the term of the arrangement,consistent with its expected use of the asset, and is an attempt to improve consistencybetween the useful life of a recognized intangible asset under SFAS 142 and the period ofexpected cash flows used to measure the fair value of the asset under SFAS No. 141,“Business Combinations.” The FSP is effective for the Company beginning January 1,2009, and the guidance for determining the useful life of a recognized intangible assetmust be applied prospectively to intangible assets acquired after the effective date. TheCompany does not expect the adoption of FSP SFAS No. 142-3 to have a material effect onits consolidated financial statements.
In May 2008, the FASB issued SFAS No. 162 (SFAS 162), “The Hierarchy of GenerallyAccepted Accounting Principles.” This statement identifies the sources of accountingprinciples and the framework for selecting the principles used in the preparation offinancial statements. It was effective 60 days following the Securities and ExchangeCommission’s approval on September 16, 2008, of the Public Company AccountingOversight Board amendments to AU Section 411, “The Meaning of Present Fairly inConformity With Generally Accepted Accounting Principles.” This statement will not resultin a change in the Company’s current practice.
In October 2008, FSP SFAS No. 157-3, “Determining the Fair Value of a Financial AssetWhen the Market for That Asset Is Not Active” was issued. This FSP clarifies theapplication of FASB Statement No. 157, “Fair Value Measurements,” and provides anexample to illustrate key considerations in determining the fair value of a financial assetwhen the market for that financial asset is not active. This FSP was effective uponissuance. Its adoption did not have a material effect on the Company’s consolidatedfinancial statements.
67
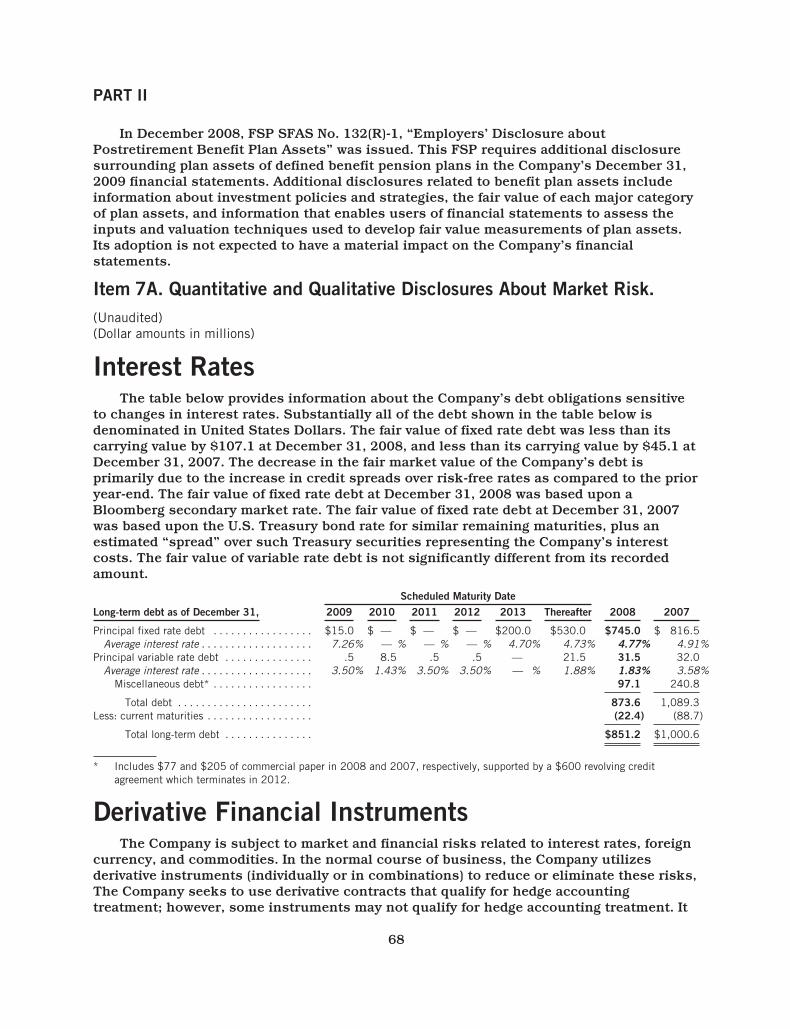
PART II
In December 2008, FSP SFAS No. 132(R)-1, “Employers’ Disclosure aboutPostretirement Benefit Plan Assets” was issued. This FSP requires additional disclosuresurrounding plan assets of defined benefit pension plans in the Company’s December 31,2009 financial statements. Additional disclosures related to benefit plan assets includeinformation about investment policies and strategies, the fair value of each major categoryof plan assets, and information that enables users of financial statements to assess theinputs and valuation techniques used to develop fair value measurements of plan assets.Its adoption is not expected to have a material impact on the Company’s financialstatements.
Item 7A. Quantitative and Qualitative Disclosures About Market Risk.(Unaudited)(Dollar amounts in millions)
Interest RatesThe table below provides information about the Company’s debt obligations sensitive
to changes in interest rates. Substantially all of the debt shown in the table below isdenominated in United States Dollars. The fair value of fixed rate debt was less than itscarrying value by $107.1 at December 31, 2008, and less than its carrying value by $45.1 atDecember 31, 2007. The decrease in the fair market value of the Company’s debt isprimarily due to the increase in credit spreads over risk-free rates as compared to the prioryear-end. The fair value of fixed rate debt at December 31, 2008 was based upon aBloomberg secondary market rate. The fair value of fixed rate debt at December 31, 2007was based upon the U.S. Treasury bond rate for similar remaining maturities, plus anestimated “spread” over such Treasury securities representing the Company’s interestcosts. The fair value of variable rate debt is not significantly different from its recordedamount.
Scheduled Maturity DateLong-term debt as of December 31, 2009 2010 2011 2012 2013 Thereafter 2008 2007
Principal fixed rate debt . . . . . . . . . . . . . . . . . $15.0 $ — $ — $ — $200.0 $530.0 $745.0 $ 816.5Average interest rate . . . . . . . . . . . . . . . . . . . 7.26% — % — % — % 4.70% 4.73% 4.77% 4.91%
Principal variable rate debt . . . . . . . . . . . . . . . .5 8.5 .5 .5 — 21.5 31.5 32.0Average interest rate . . . . . . . . . . . . . . . . . . . 3.50% 1.43% 3.50% 3.50% — % 1.88% 1.83% 3.58%
Miscellaneous debt* . . . . . . . . . . . . . . . . . 97.1 240.8
Total debt . . . . . . . . . . . . . . . . . . . . . . . 873.6 1,089.3Less: current maturities . . . . . . . . . . . . . . . . . . (22.4) (88.7)
Total long-term debt . . . . . . . . . . . . . . . $851.2 $1,000.6
* Includes $77 and $205 of commercial paper in 2008 and 2007, respectively, supported by a $600 revolving creditagreement which terminates in 2012.
Derivative Financial InstrumentsThe Company is subject to market and financial risks related to interest rates, foreign
currency, and commodities. In the normal course of business, the Company utilizesderivative instruments (individually or in combinations) to reduce or eliminate these risks,The Company seeks to use derivative contracts that qualify for hedge accountingtreatment; however, some instruments may not qualify for hedge accounting treatment. It
68
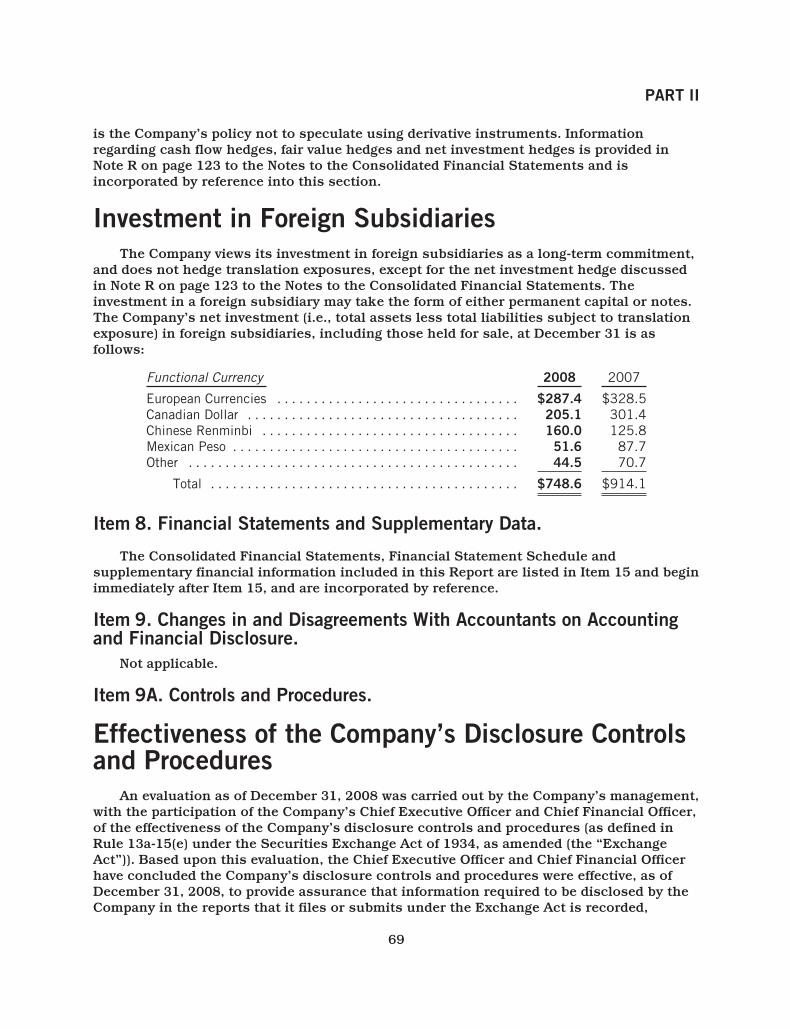
PART II
is the Company’s policy not to speculate using derivative instruments. Informationregarding cash flow hedges, fair value hedges and net investment hedges is provided inNote R on page 123 to the Notes to the Consolidated Financial Statements and isincorporated by reference into this section.
Investment in Foreign SubsidiariesThe Company views its investment in foreign subsidiaries as a long-term commitment,
and does not hedge translation exposures, except for the net investment hedge discussedin Note R on page 123 to the Notes to the Consolidated Financial Statements. Theinvestment in a foreign subsidiary may take the form of either permanent capital or notes.The Company’s net investment (i.e., total assets less total liabilities subject to translationexposure) in foreign subsidiaries, including those held for sale, at December 31 is asfollows:
Functional Currency 2008 2007
European Currencies . . . . . . . . . . . . . . . . . . . . . . . . . . . . . . . . . $287.4 $328.5Canadian Dollar . . . . . . . . . . . . . . . . . . . . . . . . . . . . . . . . . . . . . 205.1 301.4Chinese Renminbi . . . . . . . . . . . . . . . . . . . . . . . . . . . . . . . . . . . 160.0 125.8Mexican Peso . . . . . . . . . . . . . . . . . . . . . . . . . . . . . . . . . . . . . . . 51.6 87.7Other . . . . . . . . . . . . . . . . . . . . . . . . . . . . . . . . . . . . . . . . . . . . . 44.5 70.7
Total . . . . . . . . . . . . . . . . . . . . . . . . . . . . . . . . . . . . . . . . . . $748.6 $914.1
Item 8. Financial Statements and Supplementary Data.
The Consolidated Financial Statements, Financial Statement Schedule andsupplementary financial information included in this Report are listed in Item 15 and beginimmediately after Item 15, and are incorporated by reference.
Item 9. Changes in and Disagreements With Accountants on Accountingand Financial Disclosure.
Not applicable.
Item 9A. Controls and Procedures.
Effectiveness of the Company’s Disclosure Controlsand Procedures
An evaluation as of December 31, 2008 was carried out by the Company’s management,with the participation of the Company’s Chief Executive Officer and Chief Financial Officer,of the effectiveness of the Company’s disclosure controls and procedures (as defined inRule 13a-15(e) under the Securities Exchange Act of 1934, as amended (the “ExchangeAct”)). Based upon this evaluation, the Chief Executive Officer and Chief Financial Officerhave concluded the Company’s disclosure controls and procedures were effective, as ofDecember 31, 2008, to provide assurance that information required to be disclosed by theCompany in the reports that it files or submits under the Exchange Act is recorded,
69
PART II
processed, summarized, and reported, within the time periods specified by the Securitiesand Exchange Commission’s rules and forms. Disclosure controls and procedures, includewithout limitation, controls and procedures designed to ensure that information requiredto be disclosed by the Company in the reports that it files or submits under the ExchangeAct is accumulated and communicated to the Company’s management, including its ChiefExecutive Officer and Chief Financial Officer, as appropriate to allow timely decisionsregarding required disclosure.
Management’s Annual Report on Internal Controlover Financial Reporting and Auditor’s AttestationReport
Management’s Annual Report on Internal Control over Financial Reporting can befound on page 75, and the Report of Independent Registered Public Accounting Firmregarding the effectiveness of the Company’s internal control over financial reporting canbe found on page 76 of this Form 10-K. Each is incorporated by reference into this Item 9A.
Changes in the Company’s Internal Control OverFinancial Reporting
There were no changes in the Company’s internal control over financial reporting (assuch term is defined in Exchange Act Rule 13a-15(f)) that occurred during the quarterended December 31, 2008 that have materially affected, or are reasonably likely tomaterially affect, the Company’s internal control over financial reporting.
Item 9B. Other Information.
Change in Director NomineesOn February 19, 2009, the Board of Directors nominated all of the Company’s current
directors to stand for re-election, except Raymond F. Bentele. Section 2.3 of our Bylawsstates that no director upon reaching the age of 72 shall stand for election to the Boardunless a waiver is given. Mr. Bentele is 72 years old. The Board did not waive thisprovision. Mr. Bentele will continue to serve as a director until his current term expires onMay 7, 2009.
Because this Annual Report on Form 10-K is being filed within four business daysfrom February 19, 2009, the change in director nominees is being disclosed hereunderrather than under Item 5.02(b) of Form 8-K.
70
PART III
PART III
Item 10. Directors, Executive Officers and Corporate Governance.
The section entitled “Proposal 1—Election of Directors” and subsections entitled“Corporate Governance,” “Board and Committee Composition and Meetings,”“Consideration of Director Nominees” and “Section 16(a) Beneficial Ownership ReportingCompliance” in the Company’s definitive Proxy Statement for the Company’s AnnualMeeting of Shareholders to be held on May 7, 2009, are incorporated by reference.
Directors of the CompanyDirectors are elected annually at the Annual Meeting of Shareholders and hold office
until the next annual meeting of shareholders or until their successors are elected andqualified. All current directors, except Mr. Bentele, have been nominated for re-election atthe Company’s Annual Meeting of Shareholders to be held May 7, 2009. If a nominateddirector fails to receive an affirmative majority of the votes cast in the director election, thedirector has agreed to submit a resignation to the Board. The Board, in its discretion, mayaccept the resignation.
Brief biographies of the Company’s Board of Directors are provided below. Ouremployment agreements with Messrs. Haffner and Glassman (which expire May 7, 2009)provide that they may terminate the agreement if not elected as a director. See the ExhibitIndex on page 131 for reference to the agreements.
Raymond F. Bentele, age 72, served as President and Chief Executive Officer ofMallinckrodt, Inc., a manufacturer of medical and specialty chemical products, from 1981until his retirement in 1992. He serves as a director of The Mosaic Company, a producer ofcrop nutrient minerals, and AMCON Distributing Company, a distributor of food andbeverage products. He was first elected as a director of the Company in 1995.
Ralph W. Clark, age 68, was a Vice President of International Business MachinesCorporation (IBM) from 1988 until 1994. He also served as Chairman of Frontec AMT Inc., asoftware company, until his retirement in 1998. Mr. Clark was first elected as a director ofthe Company in 2000.
Robert Ted Enloe, III, age 70, has been Managing General Partner of BalquitaPartners, Ltd., a family securities and real estate investment partnership, since 1996. Healso served as President and Chief Executive Officer of Optisoft, Inc., a manufacturer ofintelligent traffic systems, from 2003 to 2005. Mr. Enloe serves as a director of SiliconLaboratories Inc., a designer of mixed-signal integrated circuits, and Live Nation, Inc., avenue operator, promoter and producer of live entertainment events. He was first electedas a director of the Company in 1969.
Richard T. Fisher, age 70, has been Senior Managing Director, Midwest Division ofOppenheimer & Co., an investment banking firm since 2002. He served as ManagingDirector of CIBC World Markets Corp., an investment banking firm, from 1990 to 2002.Mr. Fisher was first elected as a director of the Company in 1972 and has served asChairman of the Board since 2008.
71
PART III
Karl G. Glassman, age 50, was appointed Chief Operating Officer of the Company in2006 and Executive Vice President in 2002. He previously served the Company as Presidentof the Residential Furnishings Segment from 1999 to 2006, Senior Vice President from1999 to 2002, and President of Bedding Components from 1996 through 1998.Mr. Glassman has served the Company in various capacities since 1982. He was firstelected as a director of the Company in 2002.
David S. Haffner, age 56, was appointed Chief Executive Officer of the Company in2006 and has served as President of the Company since 2002. He previously served as theCompany’s Chief Operating Officer from 1999 to 2006, Executive Vice President from 1995to 2002 and in other capacities since 1983. Mr. Haffner serves as a director of BemisCompany, Inc., a manufacturer of flexible packaging and pressure sensitive materials.Mr. Haffner was first elected as a director of the Company in 1995.
Joseph W. McClanathan, age 56, has served as President and Chief Executive Officerof the Energizer Household Products Division of Energizer Holdings, Inc., a manufacturerof portable power solutions, since November 2007. Prior to his current position, he servedEnergizer as President and Chief Executive Officer of the Energizer Battery Division from2004 to 2007, President, North America, from 2002 to 2004, and as Vice President, NorthAmerica, from 2000 to 2002. He was first elected as a director of the Company in 2005.
Judy C. Odom, age 56, served as Chairman of the Board and Chief Executive Officer ofSoftware Spectrum, Inc., a computer software company, until 2002. She is a director ofHarte Hanks Inc., a direct marketing company. Ms. Odom was first elected as a director ofthe Company in 2002.
Maurice E. Purnell, Jr., age 69, has been Of Counsel to the law firm of Locke LordBissell & Liddell LLP, or its predecessor firm, since 2002, where he had been a partnersince 1972. Mr. Purnell was first elected as a director of the Company in 1988.
Phoebe A. Wood, age 55, served in various capacities at Brown-Forman Corporation, adiversified consumer products manufacturer until her retirement in 2008. She wasappointed Vice Chairman in 2007 and served as Chief Financial Officer since 2001. Shealso served as Executive Vice President from 2001 to 2007. Ms. Wood previously heldvarious positions at Atlantic Richfield Company, an oil and gas company, from 1976 to2000. Ms. Wood was first elected as a director of the Company in 2005.
Please see the “Supplemental Item” in Part I hereof, for a listing of and a description ofthe positions and offices held by the executive officers of the Company.
The Company has adopted a code of ethics that applies to its chief executive officer,chief financial officer, principal accounting officer and corporate controller called theLeggett & Platt, Incorporated Financial Code of Ethics. The Company has also adopted aCode of Business Conduct and Ethics for directors, officers and employees and CorporateGovernance Guidelines. The Financial Code of Ethics, the Code of Business Conduct andEthics and the Corporate Governance Guidelines are available on the Company’s Internetwebsite at http://www.leggett.com. Each of these documents is available in print to anyperson, without charge, upon request. Such requests may be made to the Company’sSecretary at Leggett & Platt, Incorporated, No. 1 Leggett Road, Carthage, Missouri 64836.
72
PART III
The Company intends to satisfy the disclosure requirement under Item 5.05 of Form 8-Kby posting any amendment or waiver to its Financial Code of Ethics, within four businessdays, on its website at the above address for at least a 12 month period. We routinely postall material information to our website. However, the Company’s website does notconstitute part of this Annual Report on Form 10-K.
Item 11. Executive Compensation.
The subsections entitled “Board and Committee Composition and Meetings” and“Director Compensation” together with the entire section entitled “ExecutiveCompensation and Related Matters” in the Company’s definitive Proxy Statement for theCompany’s Annual Meeting of Shareholders to be held on May 7, 2009, are incorporated byreference.
Item 12. Security Ownership of Certain Beneficial Owners andManagement and Related Stockholder Matters.
The entire sections entitled “Security Ownership” and “Equity Compensation PlanInformation” in the Company’s definitive Proxy Statement for the Company’s AnnualMeeting of Shareholders to be held on May 7, 2009, are incorporated by reference.
Item 13. Certain Relationships and Related Transactions, and DirectorIndependence.
The subsections entitled “Transactions with Related Persons,” “DirectorIndependence” and “Board and Committee Composition and Meetings” in the Company’sdefinitive Proxy Statement for the Company’s Annual Meeting of Shareholders to be heldon May 7, 2009, are incorporated by reference.
Item 14. Principal Accountant Fees and Services.
The subsections entitled “Audit and Non-Audit Fees” and “Pre-Approval Procedures forAudit and Non-Audit Services” in the Company’s definitive Proxy Statement for theCompany’s Annual Meeting of Shareholders to be held on May 7, 2009, are incorporated byreference.
73
PART IV
PART IV
Item 15. Exhibits, Financial Statement Schedules.
(a) Financial Statements and Financial Statement Schedules.
The Reports, Financial Statements and Financial Statement Schedules listed below areincluded in this Form 10-K:
Page No.
• Management’s Annual Report on Internal Control Over Financial Reporting 75• Report of Independent Registered Public Accounting Firm 76• Consolidated Statements of Operations for each of the years in the three-
year period ended December 31, 2008 78• Consolidated Balance Sheets at December 31, 2008 and 2007 79• Consolidated Statements of Cash Flows for each of the years in the three-
year period ended December 31, 2008 80• Consolidated Statements of Changes in Shareholders’ Equity for each of the
years in the three-year period ended December 31, 2008 81• Notes to Consolidated Financial Statements 82• Quarterly Summary of Earnings (Unaudited) 127• Schedule II—Valuation and Qualifying Accounts and Reserves 128
We have omitted other information schedules because the information is inapplicable,not required, or in the financial statements or notes.
(b) Exhibits—See Exhibit Index beginning on page 131.
We did not file other long-term debt instruments because the total amount ofsecurities authorized under any of these instruments does not exceed ten percent of thetotal assets of the Company and its subsidiaries on a consolidated basis. The Companyagrees to furnish a copy of such instruments to the SEC upon request.
74
PART IV
Management’s Annual Report on Internal ControlOver Financial Reporting
Management of Leggett & Platt, Incorporated is responsible for establishing andmaintaining adequate internal control over financial reporting as defined in Exchange ActRule 13a-15(f). Leggett & Platt’s internal control over financial reporting is a processdesigned to provide reasonable assurance regarding the reliability of financial reportingand the preparation of financial statements for external purposes in accordance withaccounting principles generally accepted in the United States of America. The Company’sinternal control over financial reporting includes those policies and procedures that:
• Pertain to the maintenance of records that, in reasonable detail, accurately andfairly reflect the transactions and dispositions of the assets of Leggett & Platt;
• Provide reasonable assurance that transactions are recorded as necessary to permitpreparation of financial statements in accordance with accounting principlesgenerally accepted in the United States of America, and that receipts andexpenditures of Leggett & Platt are being made only in accordance withauthorizations of management and directors of Leggett & Platt; and
• Provide reasonable assurance regarding prevention or timely detection ofunauthorized acquisition, use or disposition of Leggett & Platt assets that couldhave a material effect on the financial statements.
Because of its inherent limitations, internal control over financial reporting may notprevent or detect misstatements. Also, projections of any evaluation of effectiveness tofuture periods are subject to the risk that controls may become inadequate because ofchanges in conditions, or that the degree of compliance with the policies or proceduresmay deteriorate.
Under the supervision and with the participation of management (including ourselves),we conducted an evaluation of the effectiveness of Leggett & Platt’s internal control overfinancial reporting, as of December 31, 2008, based on the criteria in Internal Control—Integrated Framework issued by the Committee of Sponsoring Organizations of theTreadway Commission. Based on the evaluation under this framework, we concluded thatLeggett & Platt’s internal control over financial reporting was effective as of December 31,2008.
Leggett & Platt’s internal control over financial reporting, as of December 31, 2008,has been audited by PricewaterhouseCoopers LLP, an independent registered publicaccounting firm, as stated in their report appearing on page 76 of this Form 10-K.
/s/ DAVID S. HAFFNER /s/ MATTHEW C. FLANIGAN
David S. HaffnerPresident and Chief Executive Officer
Matthew C. FlaniganSenior Vice President andChief Financial Officer
February 23, 2009 February 23, 2009
75
PART IV
Report of Independent Registered PublicAccounting FirmTo the Board of Directors and Shareholders ofLeggett & Platt, Incorporated:
In our opinion, the consolidated financial statements listed in the index appearingunder Item 15(a) present fairly, in all material respects, the financial position of Leggett &Platt, Incorporated and its subsidiaries at December 31, 2008 and 2007, and the results oftheir operations and their cash flows for each of the three years in the period endedDecember 31, 2008 in conformity with accounting principles generally accepted in theUnited States of America. In addition, in our opinion, the financial statement schedulelisted in the index appearing under Item 15(a) presents fairly, in all material respects, theinformation set forth therein when read in conjunction with the related consolidatedfinancial statements. Also in our opinion, the Company maintained, in all materialrespects, effective internal control over financial reporting as of December 31, 2008, basedon criteria established in Internal Control—Integrated Framework issued by theCommittee of Sponsoring Organizations of the Treadway Commission (COSO). TheCompany’s management is responsible for these financial statements and financialstatement schedule, for maintaining effective internal control over financial reporting andfor its assessment of the effectiveness of internal control over financial reporting, includedin the accompanying Management’s Annual Report on Internal Control over FinancialReporting. Our responsibility is to express opinions on these financial statements, on thefinancial statement schedule, and on the Company’s internal control over financialreporting based on our integrated audits. We conducted our audits in accordance with thestandards of the Public Company Accounting Oversight Board (United States). Thosestandards require that we plan and perform the audits to obtain reasonable assuranceabout whether the financial statements are free of material misstatement and whethereffective internal control over financial reporting was maintained in all material respects.Our audits of the financial statements included examining, on a test basis, evidencesupporting the amounts and disclosures in the financial statements, assessing theaccounting principles used and significant estimates made by management, and evaluatingthe overall financial statement presentation. Our audit of internal control over financialreporting included obtaining an understanding of internal control over financial reporting,assessing the risk that a material weakness exists, and testing and evaluating the designand operating effectiveness of internal control based on the assessed risk. Our audits alsoincluded performing such other procedures as we considered necessary in thecircumstances. We believe that our audits provide a reasonable basis for our opinions.
A company’s internal control over financial reporting is a process designed to providereasonable assurance regarding the reliability of financial reporting and the preparation offinancial statements for external purposes in accordance with generally acceptedaccounting principles. A company’s internal control over financial reporting includesthose policies and procedures that (i) pertain to the maintenance of records that, inreasonable detail, accurately and fairly reflect the transactions and dispositions of theassets of the company; (ii) provide reasonable assurance that transactions are recorded asnecessary to permit preparation of financial statements in accordance with generally
76
PART IV
accepted accounting principles, and that receipts and expenditures of the company arebeing made only in accordance with authorizations of management and directors of thecompany; and (iii) provide reasonable assurance regarding prevention or timely detectionof unauthorized acquisition, use, or disposition of the company’s assets that could have amaterial effect on the financial statements.
Because of its inherent limitations, internal control over financial reporting may notprevent or detect misstatements. Also, projections of any evaluation of effectiveness tofuture periods are subject to the risk that controls may become inadequate because ofchanges in conditions, or that the degree of compliance with the policies or proceduresmay deteriorate.
/S/ PRICEWATERHOUSECOOPERS LLP
St. Louis, MOFebruary 23, 2009
77
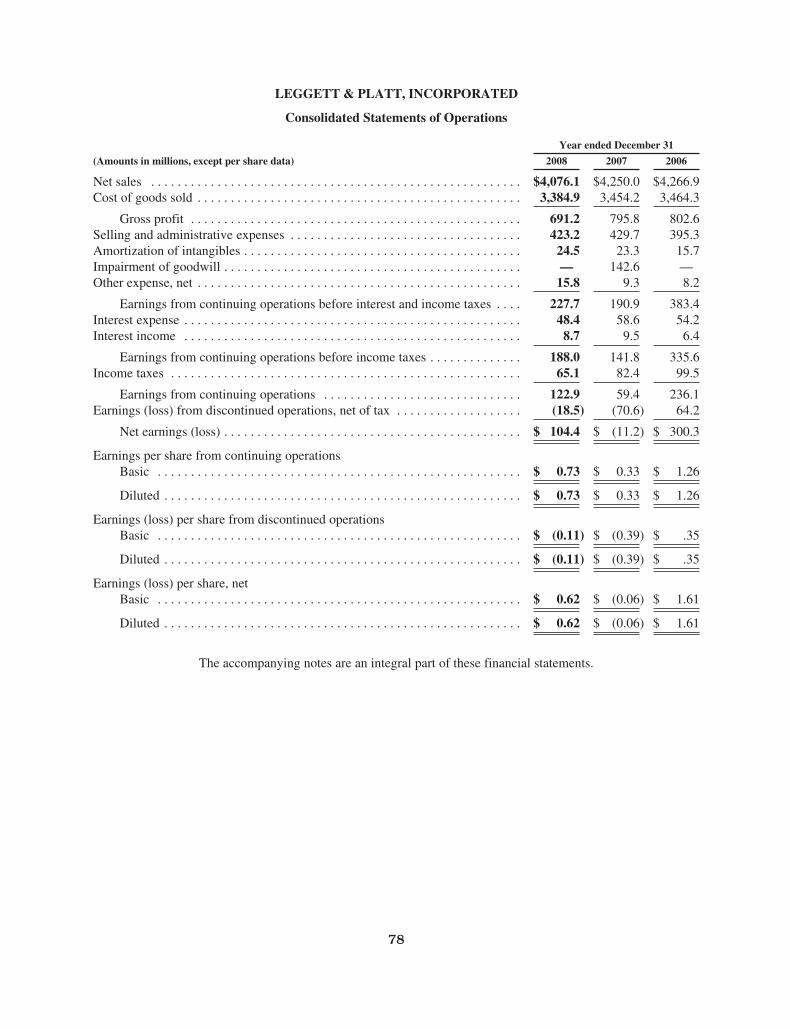
LEGGETT & PLATT, INCORPORATED
Consolidated Statements of Operations
Year ended December 31
(Amounts in millions, except per share data) 2008 2007 2006
Net sales . . . . . . . . . . . . . . . . . . . . . . . . . . . . . . . . . . . . . . . . . . . . . . . . . . . . . . . . $4,076.1 $4,250.0 $4,266.9Cost of goods sold . . . . . . . . . . . . . . . . . . . . . . . . . . . . . . . . . . . . . . . . . . . . . . . . . 3,384.9 3,454.2 3,464.3
Gross profit . . . . . . . . . . . . . . . . . . . . . . . . . . . . . . . . . . . . . . . . . . . . . . . . . . 691.2 795.8 802.6Selling and administrative expenses . . . . . . . . . . . . . . . . . . . . . . . . . . . . . . . . . . . 423.2 429.7 395.3Amortization of intangibles . . . . . . . . . . . . . . . . . . . . . . . . . . . . . . . . . . . . . . . . . . 24.5 23.3 15.7Impairment of goodwill . . . . . . . . . . . . . . . . . . . . . . . . . . . . . . . . . . . . . . . . . . . . . — 142.6 —Other expense, net . . . . . . . . . . . . . . . . . . . . . . . . . . . . . . . . . . . . . . . . . . . . . . . . . 15.8 9.3 8.2
Earnings from continuing operations before interest and income taxes . . . . 227.7 190.9 383.4Interest expense . . . . . . . . . . . . . . . . . . . . . . . . . . . . . . . . . . . . . . . . . . . . . . . . . . . 48.4 58.6 54.2Interest income . . . . . . . . . . . . . . . . . . . . . . . . . . . . . . . . . . . . . . . . . . . . . . . . . . . 8.7 9.5 6.4
Earnings from continuing operations before income taxes . . . . . . . . . . . . . . 188.0 141.8 335.6Income taxes . . . . . . . . . . . . . . . . . . . . . . . . . . . . . . . . . . . . . . . . . . . . . . . . . . . . . 65.1 82.4 99.5
Earnings from continuing operations . . . . . . . . . . . . . . . . . . . . . . . . . . . . . . 122.9 59.4 236.1Earnings (loss) from discontinued operations, net of tax . . . . . . . . . . . . . . . . . . . (18.5) (70.6) 64.2
Net earnings (loss) . . . . . . . . . . . . . . . . . . . . . . . . . . . . . . . . . . . . . . . . . . . . . $ 104.4 $ (11.2) $ 300.3
Earnings per share from continuing operationsBasic . . . . . . . . . . . . . . . . . . . . . . . . . . . . . . . . . . . . . . . . . . . . . . . . . . . . . . . $ 0.73 $ 0.33 $ 1.26
Diluted . . . . . . . . . . . . . . . . . . . . . . . . . . . . . . . . . . . . . . . . . . . . . . . . . . . . . . $ 0.73 $ 0.33 $ 1.26
Earnings (loss) per share from discontinued operationsBasic . . . . . . . . . . . . . . . . . . . . . . . . . . . . . . . . . . . . . . . . . . . . . . . . . . . . . . . $ (0.11) $ (0.39) $ .35
Diluted . . . . . . . . . . . . . . . . . . . . . . . . . . . . . . . . . . . . . . . . . . . . . . . . . . . . . . $ (0.11) $ (0.39) $ .35
Earnings (loss) per share, netBasic . . . . . . . . . . . . . . . . . . . . . . . . . . . . . . . . . . . . . . . . . . . . . . . . . . . . . . . $ 0.62 $ (0.06) $ 1.61
Diluted . . . . . . . . . . . . . . . . . . . . . . . . . . . . . . . . . . . . . . . . . . . . . . . . . . . . . . $ 0.62 $ (0.06) $ 1.61
The accompanying notes are an integral part of these financial statements.
78
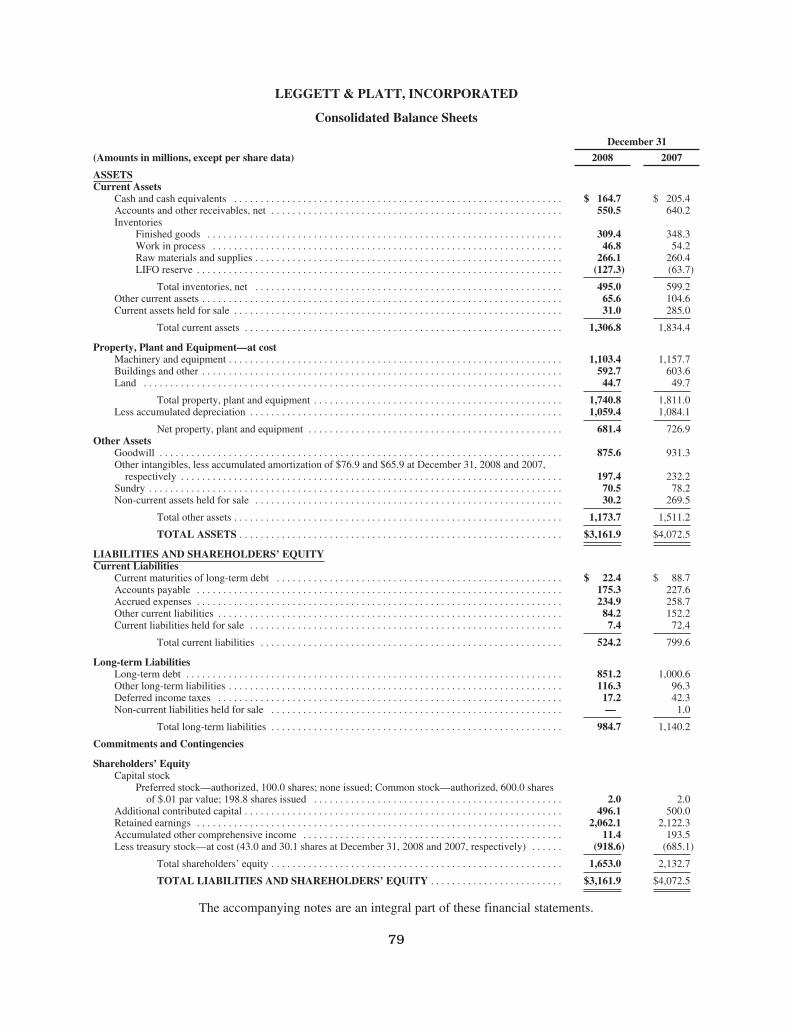
LEGGETT & PLATT, INCORPORATED
Consolidated Balance Sheets
December 31
(Amounts in millions, except per share data) 2008 2007
ASSETSCurrent Assets
Cash and cash equivalents . . . . . . . . . . . . . . . . . . . . . . . . . . . . . . . . . . . . . . . . . . . . . . . . . . . . . . . . . . . . . . $ 164.7 $ 205.4Accounts and other receivables, net . . . . . . . . . . . . . . . . . . . . . . . . . . . . . . . . . . . . . . . . . . . . . . . . . . . . . . . 550.5 640.2Inventories
Finished goods . . . . . . . . . . . . . . . . . . . . . . . . . . . . . . . . . . . . . . . . . . . . . . . . . . . . . . . . . . . . . . . . . . . 309.4 348.3Work in process . . . . . . . . . . . . . . . . . . . . . . . . . . . . . . . . . . . . . . . . . . . . . . . . . . . . . . . . . . . . . . . . . . 46.8 54.2Raw materials and supplies . . . . . . . . . . . . . . . . . . . . . . . . . . . . . . . . . . . . . . . . . . . . . . . . . . . . . . . . . . 266.1 260.4LIFO reserve . . . . . . . . . . . . . . . . . . . . . . . . . . . . . . . . . . . . . . . . . . . . . . . . . . . . . . . . . . . . . . . . . . . . . (127.3) (63.7)
Total inventories, net . . . . . . . . . . . . . . . . . . . . . . . . . . . . . . . . . . . . . . . . . . . . . . . . . . . . . . . . . . 495.0 599.2Other current assets . . . . . . . . . . . . . . . . . . . . . . . . . . . . . . . . . . . . . . . . . . . . . . . . . . . . . . . . . . . . . . . . . . . . 65.6 104.6Current assets held for sale . . . . . . . . . . . . . . . . . . . . . . . . . . . . . . . . . . . . . . . . . . . . . . . . . . . . . . . . . . . . . . 31.0 285.0
Total current assets . . . . . . . . . . . . . . . . . . . . . . . . . . . . . . . . . . . . . . . . . . . . . . . . . . . . . . . . . . . . 1,306.8 1,834.4
Property, Plant and Equipment—at costMachinery and equipment . . . . . . . . . . . . . . . . . . . . . . . . . . . . . . . . . . . . . . . . . . . . . . . . . . . . . . . . . . . . . . . 1,103.4 1,157.7Buildings and other . . . . . . . . . . . . . . . . . . . . . . . . . . . . . . . . . . . . . . . . . . . . . . . . . . . . . . . . . . . . . . . . . . . . 592.7 603.6Land . . . . . . . . . . . . . . . . . . . . . . . . . . . . . . . . . . . . . . . . . . . . . . . . . . . . . . . . . . . . . . . . . . . . . . . . . . . . . . . 44.7 49.7
Total property, plant and equipment . . . . . . . . . . . . . . . . . . . . . . . . . . . . . . . . . . . . . . . . . . . . . . . 1,740.8 1,811.0Less accumulated depreciation . . . . . . . . . . . . . . . . . . . . . . . . . . . . . . . . . . . . . . . . . . . . . . . . . . . . . . . . . . . 1,059.4 1,084.1
Net property, plant and equipment . . . . . . . . . . . . . . . . . . . . . . . . . . . . . . . . . . . . . . . . . . . . . . . . 681.4 726.9Other Assets
Goodwill . . . . . . . . . . . . . . . . . . . . . . . . . . . . . . . . . . . . . . . . . . . . . . . . . . . . . . . . . . . . . . . . . . . . . . . . . . . . 875.6 931.3Other intangibles, less accumulated amortization of $76.9 and $65.9 at December 31, 2008 and 2007,
respectively . . . . . . . . . . . . . . . . . . . . . . . . . . . . . . . . . . . . . . . . . . . . . . . . . . . . . . . . . . . . . . . . . . . . . . . . 197.4 232.2Sundry . . . . . . . . . . . . . . . . . . . . . . . . . . . . . . . . . . . . . . . . . . . . . . . . . . . . . . . . . . . . . . . . . . . . . . . . . . . . . . 70.5 78.2Non-current assets held for sale . . . . . . . . . . . . . . . . . . . . . . . . . . . . . . . . . . . . . . . . . . . . . . . . . . . . . . . . . . 30.2 269.5
Total other assets . . . . . . . . . . . . . . . . . . . . . . . . . . . . . . . . . . . . . . . . . . . . . . . . . . . . . . . . . . . . . . 1,173.7 1,511.2
TOTAL ASSETS . . . . . . . . . . . . . . . . . . . . . . . . . . . . . . . . . . . . . . . . . . . . . . . . . . . . . . . . . . . . . $3,161.9 $4,072.5
LIABILITIES AND SHAREHOLDERS’ EQUITYCurrent Liabilities
Current maturities of long-term debt . . . . . . . . . . . . . . . . . . . . . . . . . . . . . . . . . . . . . . . . . . . . . . . . . . . . . . $ 22.4 $ 88.7Accounts payable . . . . . . . . . . . . . . . . . . . . . . . . . . . . . . . . . . . . . . . . . . . . . . . . . . . . . . . . . . . . . . . . . . . . . 175.3 227.6Accrued expenses . . . . . . . . . . . . . . . . . . . . . . . . . . . . . . . . . . . . . . . . . . . . . . . . . . . . . . . . . . . . . . . . . . . . . 234.9 258.7Other current liabilities . . . . . . . . . . . . . . . . . . . . . . . . . . . . . . . . . . . . . . . . . . . . . . . . . . . . . . . . . . . . . . . . . 84.2 152.2Current liabilities held for sale . . . . . . . . . . . . . . . . . . . . . . . . . . . . . . . . . . . . . . . . . . . . . . . . . . . . . . . . . . . 7.4 72.4
Total current liabilities . . . . . . . . . . . . . . . . . . . . . . . . . . . . . . . . . . . . . . . . . . . . . . . . . . . . . . . . . 524.2 799.6
Long-term LiabilitiesLong-term debt . . . . . . . . . . . . . . . . . . . . . . . . . . . . . . . . . . . . . . . . . . . . . . . . . . . . . . . . . . . . . . . . . . . . . . . 851.2 1,000.6Other long-term liabilities . . . . . . . . . . . . . . . . . . . . . . . . . . . . . . . . . . . . . . . . . . . . . . . . . . . . . . . . . . . . . . . 116.3 96.3Deferred income taxes . . . . . . . . . . . . . . . . . . . . . . . . . . . . . . . . . . . . . . . . . . . . . . . . . . . . . . . . . . . . . . . . . 17.2 42.3Non-current liabilities held for sale . . . . . . . . . . . . . . . . . . . . . . . . . . . . . . . . . . . . . . . . . . . . . . . . . . . . . . . — 1.0
Total long-term liabilities . . . . . . . . . . . . . . . . . . . . . . . . . . . . . . . . . . . . . . . . . . . . . . . . . . . . . . . 984.7 1,140.2
Commitments and Contingencies
Shareholders’ EquityCapital stock
Preferred stock—authorized, 100.0 shares; none issued; Common stock—authorized, 600.0 sharesof $.01 par value; 198.8 shares issued . . . . . . . . . . . . . . . . . . . . . . . . . . . . . . . . . . . . . . . . . . . . . . . 2.0 2.0
Additional contributed capital . . . . . . . . . . . . . . . . . . . . . . . . . . . . . . . . . . . . . . . . . . . . . . . . . . . . . . . . . . . . 496.1 500.0Retained earnings . . . . . . . . . . . . . . . . . . . . . . . . . . . . . . . . . . . . . . . . . . . . . . . . . . . . . . . . . . . . . . . . . . . . . 2,062.1 2,122.3Accumulated other comprehensive income . . . . . . . . . . . . . . . . . . . . . . . . . . . . . . . . . . . . . . . . . . . . . . . . . 11.4 193.5Less treasury stock—at cost (43.0 and 30.1 shares at December 31, 2008 and 2007, respectively) . . . . . . (918.6) (685.1)
Total shareholders’ equity . . . . . . . . . . . . . . . . . . . . . . . . . . . . . . . . . . . . . . . . . . . . . . . . . . . . . . . 1,653.0 2,132.7
TOTAL LIABILITIES AND SHAREHOLDERS’ EQUITY . . . . . . . . . . . . . . . . . . . . . . . . . $3,161.9 $4,072.5
The accompanying notes are an integral part of these financial statements.
79
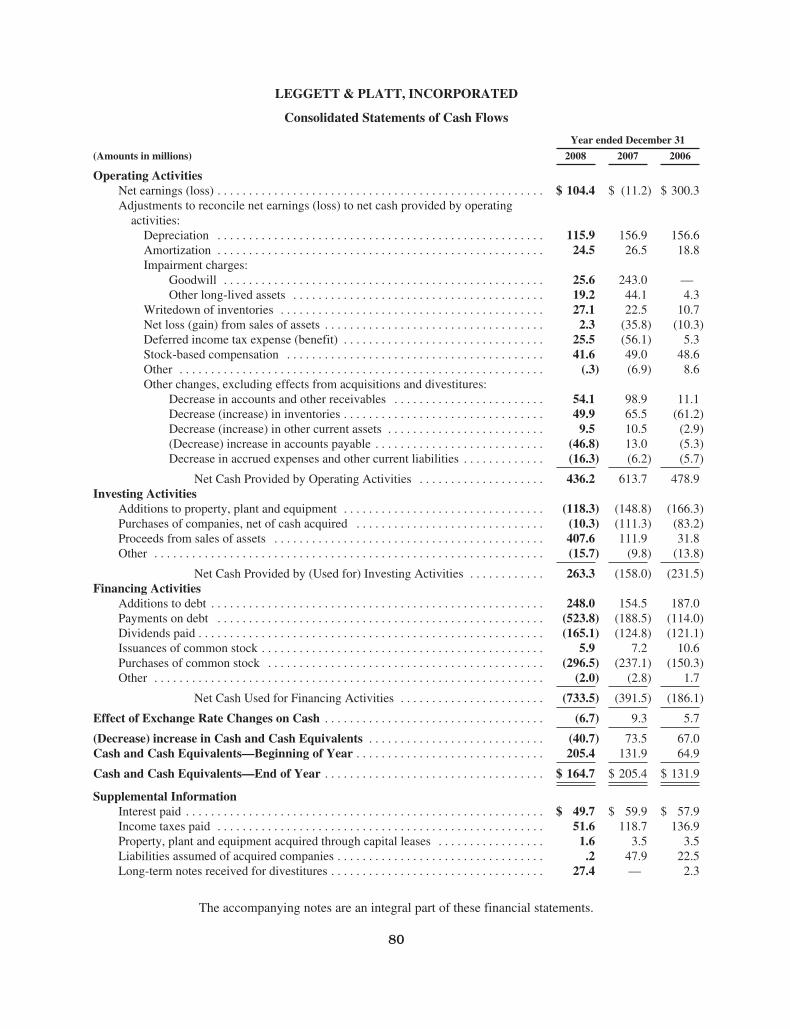
LEGGETT & PLATT, INCORPORATED
Consolidated Statements of Cash Flows
Year ended December 31
(Amounts in millions) 2008 2007 2006
Operating ActivitiesNet earnings (loss) . . . . . . . . . . . . . . . . . . . . . . . . . . . . . . . . . . . . . . . . . . . . . . . . . . . . $ 104.4 $ (11.2) $ 300.3Adjustments to reconcile net earnings (loss) to net cash provided by operating
activities:Depreciation . . . . . . . . . . . . . . . . . . . . . . . . . . . . . . . . . . . . . . . . . . . . . . . . . . . . 115.9 156.9 156.6Amortization . . . . . . . . . . . . . . . . . . . . . . . . . . . . . . . . . . . . . . . . . . . . . . . . . . . . 24.5 26.5 18.8Impairment charges:
Goodwill . . . . . . . . . . . . . . . . . . . . . . . . . . . . . . . . . . . . . . . . . . . . . . . . . . . 25.6 243.0 —Other long-lived assets . . . . . . . . . . . . . . . . . . . . . . . . . . . . . . . . . . . . . . . . 19.2 44.1 4.3
Writedown of inventories . . . . . . . . . . . . . . . . . . . . . . . . . . . . . . . . . . . . . . . . . . 27.1 22.5 10.7Net loss (gain) from sales of assets . . . . . . . . . . . . . . . . . . . . . . . . . . . . . . . . . . . 2.3 (35.8) (10.3)Deferred income tax expense (benefit) . . . . . . . . . . . . . . . . . . . . . . . . . . . . . . . . 25.5 (56.1) 5.3Stock-based compensation . . . . . . . . . . . . . . . . . . . . . . . . . . . . . . . . . . . . . . . . . 41.6 49.0 48.6Other . . . . . . . . . . . . . . . . . . . . . . . . . . . . . . . . . . . . . . . . . . . . . . . . . . . . . . . . . . (.3) (6.9) 8.6Other changes, excluding effects from acquisitions and divestitures:
Decrease in accounts and other receivables . . . . . . . . . . . . . . . . . . . . . . . . 54.1 98.9 11.1Decrease (increase) in inventories . . . . . . . . . . . . . . . . . . . . . . . . . . . . . . . . 49.9 65.5 (61.2)Decrease (increase) in other current assets . . . . . . . . . . . . . . . . . . . . . . . . . 9.5 10.5 (2.9)(Decrease) increase in accounts payable . . . . . . . . . . . . . . . . . . . . . . . . . . . (46.8) 13.0 (5.3)Decrease in accrued expenses and other current liabilities . . . . . . . . . . . . . (16.3) (6.2) (5.7)
Net Cash Provided by Operating Activities . . . . . . . . . . . . . . . . . . . . 436.2 613.7 478.9Investing Activities
Additions to property, plant and equipment . . . . . . . . . . . . . . . . . . . . . . . . . . . . . . . . (118.3) (148.8) (166.3)Purchases of companies, net of cash acquired . . . . . . . . . . . . . . . . . . . . . . . . . . . . . . (10.3) (111.3) (83.2)Proceeds from sales of assets . . . . . . . . . . . . . . . . . . . . . . . . . . . . . . . . . . . . . . . . . . . 407.6 111.9 31.8Other . . . . . . . . . . . . . . . . . . . . . . . . . . . . . . . . . . . . . . . . . . . . . . . . . . . . . . . . . . . . . . (15.7) (9.8) (13.8)
Net Cash Provided by (Used for) Investing Activities . . . . . . . . . . . . 263.3 (158.0) (231.5)Financing Activities
Additions to debt . . . . . . . . . . . . . . . . . . . . . . . . . . . . . . . . . . . . . . . . . . . . . . . . . . . . . 248.0 154.5 187.0Payments on debt . . . . . . . . . . . . . . . . . . . . . . . . . . . . . . . . . . . . . . . . . . . . . . . . . . . . (523.8) (188.5) (114.0)Dividends paid . . . . . . . . . . . . . . . . . . . . . . . . . . . . . . . . . . . . . . . . . . . . . . . . . . . . . . . (165.1) (124.8) (121.1)Issuances of common stock . . . . . . . . . . . . . . . . . . . . . . . . . . . . . . . . . . . . . . . . . . . . . 5.9 7.2 10.6Purchases of common stock . . . . . . . . . . . . . . . . . . . . . . . . . . . . . . . . . . . . . . . . . . . . (296.5) (237.1) (150.3)Other . . . . . . . . . . . . . . . . . . . . . . . . . . . . . . . . . . . . . . . . . . . . . . . . . . . . . . . . . . . . . . (2.0) (2.8) 1.7
Net Cash Used for Financing Activities . . . . . . . . . . . . . . . . . . . . . . . (733.5) (391.5) (186.1)
Effect of Exchange Rate Changes on Cash . . . . . . . . . . . . . . . . . . . . . . . . . . . . . . . . . . . (6.7) 9.3 5.7
(Decrease) increase in Cash and Cash Equivalents . . . . . . . . . . . . . . . . . . . . . . . . . . . . (40.7) 73.5 67.0Cash and Cash Equivalents—Beginning of Year . . . . . . . . . . . . . . . . . . . . . . . . . . . . . . 205.4 131.9 64.9
Cash and Cash Equivalents—End of Year . . . . . . . . . . . . . . . . . . . . . . . . . . . . . . . . . . . $ 164.7 $ 205.4 $ 131.9
Supplemental InformationInterest paid . . . . . . . . . . . . . . . . . . . . . . . . . . . . . . . . . . . . . . . . . . . . . . . . . . . . . . . . . $ 49.7 $ 59.9 $ 57.9Income taxes paid . . . . . . . . . . . . . . . . . . . . . . . . . . . . . . . . . . . . . . . . . . . . . . . . . . . . 51.6 118.7 136.9Property, plant and equipment acquired through capital leases . . . . . . . . . . . . . . . . . 1.6 3.5 3.5Liabilities assumed of acquired companies . . . . . . . . . . . . . . . . . . . . . . . . . . . . . . . . . .2 47.9 22.5Long-term notes received for divestitures . . . . . . . . . . . . . . . . . . . . . . . . . . . . . . . . . . 27.4 — 2.3
The accompanying notes are an integral part of these financial statements.
80
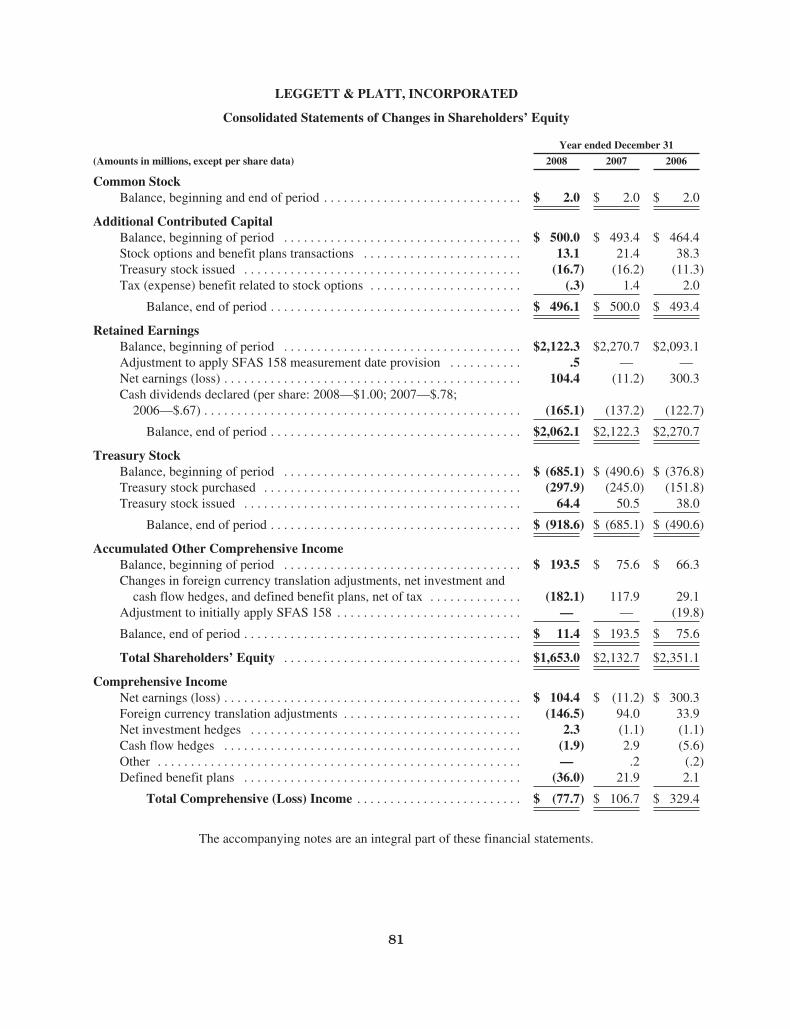
LEGGETT & PLATT, INCORPORATED
Consolidated Statements of Changes in Shareholders’ Equity
Year ended December 31
(Amounts in millions, except per share data) 2008 2007 2006
Common StockBalance, beginning and end of period . . . . . . . . . . . . . . . . . . . . . . . . . . . . . . $ 2.0 $ 2.0 $ 2.0
Additional Contributed CapitalBalance, beginning of period . . . . . . . . . . . . . . . . . . . . . . . . . . . . . . . . . . . . $ 500.0 $ 493.4 $ 464.4Stock options and benefit plans transactions . . . . . . . . . . . . . . . . . . . . . . . . 13.1 21.4 38.3Treasury stock issued . . . . . . . . . . . . . . . . . . . . . . . . . . . . . . . . . . . . . . . . . . (16.7) (16.2) (11.3)Tax (expense) benefit related to stock options . . . . . . . . . . . . . . . . . . . . . . . (.3) 1.4 2.0
Balance, end of period . . . . . . . . . . . . . . . . . . . . . . . . . . . . . . . . . . . . . . $ 496.1 $ 500.0 $ 493.4
Retained EarningsBalance, beginning of period . . . . . . . . . . . . . . . . . . . . . . . . . . . . . . . . . . . . $2,122.3 $2,270.7 $2,093.1Adjustment to apply SFAS 158 measurement date provision . . . . . . . . . . . .5 — —Net earnings (loss) . . . . . . . . . . . . . . . . . . . . . . . . . . . . . . . . . . . . . . . . . . . . . 104.4 (11.2) 300.3Cash dividends declared (per share: 2008—$1.00; 2007—$.78;
2006—$.67) . . . . . . . . . . . . . . . . . . . . . . . . . . . . . . . . . . . . . . . . . . . . . . . . (165.1) (137.2) (122.7)
Balance, end of period . . . . . . . . . . . . . . . . . . . . . . . . . . . . . . . . . . . . . . $2,062.1 $2,122.3 $2,270.7
Treasury StockBalance, beginning of period . . . . . . . . . . . . . . . . . . . . . . . . . . . . . . . . . . . . $ (685.1) $ (490.6) $ (376.8)Treasury stock purchased . . . . . . . . . . . . . . . . . . . . . . . . . . . . . . . . . . . . . . . (297.9) (245.0) (151.8)Treasury stock issued . . . . . . . . . . . . . . . . . . . . . . . . . . . . . . . . . . . . . . . . . . 64.4 50.5 38.0
Balance, end of period . . . . . . . . . . . . . . . . . . . . . . . . . . . . . . . . . . . . . . $ (918.6) $ (685.1) $ (490.6)
Accumulated Other Comprehensive IncomeBalance, beginning of period . . . . . . . . . . . . . . . . . . . . . . . . . . . . . . . . . . . . $ 193.5 $ 75.6 $ 66.3Changes in foreign currency translation adjustments, net investment and
cash flow hedges, and defined benefit plans, net of tax . . . . . . . . . . . . . . (182.1) 117.9 29.1Adjustment to initially apply SFAS 158 . . . . . . . . . . . . . . . . . . . . . . . . . . . . — — (19.8)
Balance, end of period . . . . . . . . . . . . . . . . . . . . . . . . . . . . . . . . . . . . . . . . . . $ 11.4 $ 193.5 $ 75.6
Total Shareholders’ Equity . . . . . . . . . . . . . . . . . . . . . . . . . . . . . . . . . . . . $1,653.0 $2,132.7 $2,351.1
Comprehensive IncomeNet earnings (loss) . . . . . . . . . . . . . . . . . . . . . . . . . . . . . . . . . . . . . . . . . . . . . $ 104.4 $ (11.2) $ 300.3Foreign currency translation adjustments . . . . . . . . . . . . . . . . . . . . . . . . . . . (146.5) 94.0 33.9Net investment hedges . . . . . . . . . . . . . . . . . . . . . . . . . . . . . . . . . . . . . . . . . 2.3 (1.1) (1.1)Cash flow hedges . . . . . . . . . . . . . . . . . . . . . . . . . . . . . . . . . . . . . . . . . . . . . (1.9) 2.9 (5.6)Other . . . . . . . . . . . . . . . . . . . . . . . . . . . . . . . . . . . . . . . . . . . . . . . . . . . . . . . — .2 (.2)Defined benefit plans . . . . . . . . . . . . . . . . . . . . . . . . . . . . . . . . . . . . . . . . . . (36.0) 21.9 2.1
Total Comprehensive (Loss) Income . . . . . . . . . . . . . . . . . . . . . . . . . $ (77.7) $ 106.7 $ 329.4
The accompanying notes are an integral part of these financial statements.
81
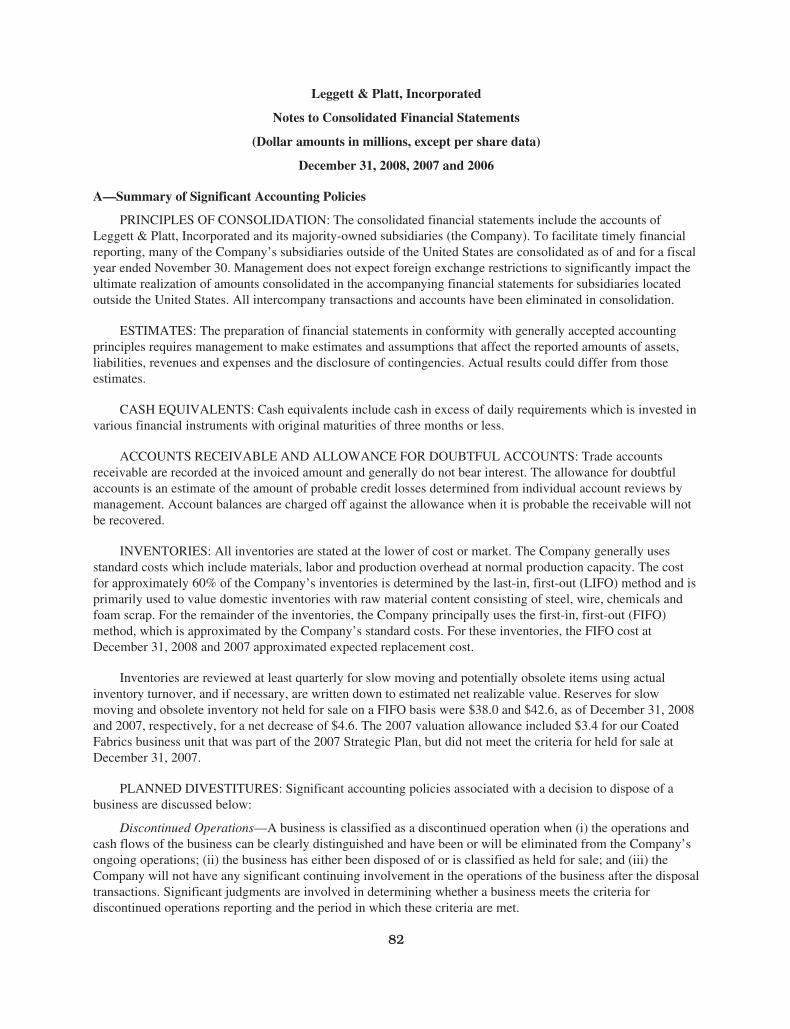
Leggett & Platt, Incorporated
Notes to Consolidated Financial Statements
(Dollar amounts in millions, except per share data)
December 31, 2008, 2007 and 2006
A—Summary of Significant Accounting Policies
PRINCIPLES OF CONSOLIDATION: The consolidated financial statements include the accounts ofLeggett & Platt, Incorporated and its majority-owned subsidiaries (the Company). To facilitate timely financialreporting, many of the Company’s subsidiaries outside of the United States are consolidated as of and for a fiscalyear ended November 30. Management does not expect foreign exchange restrictions to significantly impact theultimate realization of amounts consolidated in the accompanying financial statements for subsidiaries locatedoutside the United States. All intercompany transactions and accounts have been eliminated in consolidation.
ESTIMATES: The preparation of financial statements in conformity with generally accepted accountingprinciples requires management to make estimates and assumptions that affect the reported amounts of assets,liabilities, revenues and expenses and the disclosure of contingencies. Actual results could differ from thoseestimates.
CASH EQUIVALENTS: Cash equivalents include cash in excess of daily requirements which is invested invarious financial instruments with original maturities of three months or less.
ACCOUNTS RECEIVABLE AND ALLOWANCE FOR DOUBTFUL ACCOUNTS: Trade accountsreceivable are recorded at the invoiced amount and generally do not bear interest. The allowance for doubtfulaccounts is an estimate of the amount of probable credit losses determined from individual account reviews bymanagement. Account balances are charged off against the allowance when it is probable the receivable will notbe recovered.
INVENTORIES: All inventories are stated at the lower of cost or market. The Company generally usesstandard costs which include materials, labor and production overhead at normal production capacity. The costfor approximately 60% of the Company’s inventories is determined by the last-in, first-out (LIFO) method and isprimarily used to value domestic inventories with raw material content consisting of steel, wire, chemicals andfoam scrap. For the remainder of the inventories, the Company principally uses the first-in, first-out (FIFO)method, which is approximated by the Company’s standard costs. For these inventories, the FIFO cost atDecember 31, 2008 and 2007 approximated expected replacement cost.
Inventories are reviewed at least quarterly for slow moving and potentially obsolete items using actualinventory turnover, and if necessary, are written down to estimated net realizable value. Reserves for slowmoving and obsolete inventory not held for sale on a FIFO basis were $38.0 and $42.6, as of December 31, 2008and 2007, respectively, for a net decrease of $4.6. The 2007 valuation allowance included $3.4 for our CoatedFabrics business unit that was part of the 2007 Strategic Plan, but did not meet the criteria for held for sale atDecember 31, 2007.
PLANNED DIVESTITURES: Significant accounting policies associated with a decision to dispose of abusiness are discussed below:
Discontinued Operations—A business is classified as a discontinued operation when (i) the operations andcash flows of the business can be clearly distinguished and have been or will be eliminated from the Company’songoing operations; (ii) the business has either been disposed of or is classified as held for sale; and (iii) theCompany will not have any significant continuing involvement in the operations of the business after the disposaltransactions. Significant judgments are involved in determining whether a business meets the criteria fordiscontinued operations reporting and the period in which these criteria are met.
82
If a business is reported as a discontinued operation, the results of operations through the date of sale,including any gain or loss recognized on the disposition, are presented on a separate line of the income statement.Interest on debt directly attributable to the discontinued operation is allocated to discontinued operations. Gainsand losses related to the sale of businesses that do not meet the discontinued operation criteria are reported incontinuing operations and separately disclosed if significant.
Assets Held for Sale—An asset or business is classified as held for sale when (i) management commits to aplan to sell and it is actively marketed; (ii) it is available for immediate sale and the sale is expected to becompleted within one year; and (iii) it is unlikely significant changes to the plan will be made or that the planwill be withdrawn. In isolated instances, assets held for sale may exceed one year due to events or circumstancesbeyond the Company’s control. Upon being classified as held for sale, the recoverability of the carrying valuemust be assessed. Evaluating the recoverability of the assets of a business classified as held for sale follows adefined order in which property and intangible assets subject to amortization are considered only after therecoverability of goodwill and other assets are assessed. After the valuation process is completed, the assets heldfor sale are reported at the lower of the carrying value or fair value less cost to sell and the assets are no longerdepreciated or amortized. The assets and related liabilities are aggregated and reported on separate lines of thebalance sheet.
Assets Held for Use—If a decision to dispose of an asset or a business is made and the held for sale criteriaare not met, it is considered held for use. Assets of the business are evaluated for recoverability in the followingorder: (i) assets other than goodwill, property and intangibles; (ii) property and intangibles subject toamortization; and (iii) goodwill. In evaluating the recoverability of property and intangible assets subject toamortization, in a held for use business, the carrying value is first compared to the sum of the undiscounted cashflows expected to result from the use and eventual disposition. If the carrying value exceeds the undiscountedexpected cash flows, then a fair value analysis is performed. An impairment charge is recognized if the carryingvalue exceeds the fair value. There are inherent judgments and estimates used in determining future cash flowsand it is possible that additional impairment charges may occur in future periods. In addition, the sale of assetscan result in the recognition of a gain or loss that differs from that anticipated prior to the closing date.
PROPERTY, PLANT AND EQUIPMENT: Property, plant and equipment is stated at cost, less accumulateddepreciation. Assets are depreciated by the straight-line method and salvage value, if any, is assumed to beminimal. Depreciable lives primarily range from 3 to 20 years for machinery and equipment with a weightedaverage life of 9 years; 10 to 40 years for buildings with a weighted average life of 27 years; and 3 to 15 years forother items with a weighted average life of 7 years. Accelerated methods are used for tax purposes.
Property is tested for recoverability at year end and whenever events or changes in circumstances indicatethat its carrying value may not be recoverable as discussed above.
GOODWILL: Goodwill results from the acquisition of existing businesses and is not amortized; it isassessed for impairment annually and as triggering events may occur. The Company performs its annual reviewin the second quarter of each year. Recoverability of goodwill is evaluated using a two-step process. The firststep involves a comparison of the fair value of a reporting unit with its carrying value. Reporting units arebusiness groups one level below the operating segment level for which discrete financial information is availableand reviewed by segment management.
If the carrying value of the group exceeds its fair value, the second step of the process is necessary andinvolves a comparison of the implied fair value and the carrying value of the goodwill of that group. If thecarrying value of the goodwill of a group exceeds the implied fair value of that goodwill, an impairment loss isrecognized in an amount equal to the excess.
In evaluating the recoverability of goodwill, it is necessary to estimate the fair values of the business groups.In making this assessment, we estimate the fair market values of our reporting units using a discounted cash flow
83
model and comparable market values for similar entities using price to earnings ratios. Key assumptions andestimates used in the cash flow model include discount rate, internal sales growth, margins, capital expenditurerequirements, and working capital requirements. Recent performance of the group is an important factor, but notthe only factor, in our assessment. There are inherent assumptions and judgments required in the analysis ofgoodwill impairment. It is possible that assumptions underlying the impairment analysis will change in such amanner that impairment in value may occur in the future.
OTHER INTANGIBLE ASSETS: Substantially all of the Company’s other intangible assets are amortizedusing the straight-line method over their estimated useful lives ranging from 1 to 40 years with a weightedaverage of 16 years and are evaluated for impairment using a process similar to that used in evaluating therecoverability of property, plant and equipment.
STOCK-BASED COMPENSATION: Effective January 1, 2006, the Company adopted the provisions ofSFAS No. 123(R), “Share-Based Payment,” a revision of SFAS 123. As part of its adoption of SFAS 123(R), theCompany calculates any tax benefit windfalls or shortfalls for stock-based compensation under the provisions ofSFAS 123(R). Compensation expense for stock options granted is recognized using the straight line method overthe vesting period of the options, fair value is calculated on the grant date using the Black-Scholes option-pricingmodel.
SALES RECOGNITION: The Company recognizes sales when title and risk of loss pass to the customer.The terms of the Company’s sales are split approximately evenly between FOB shipping point and FOBdestination. The timing of the Company’s recognition of FOB destination sales is determined based on shippingdate and distance to the destination. The Company has no significant or unusual price protection, right of returnor acceptance provisions with its customers nor is it the Company’s practice to replace goods damaged or lost intransit. Sales allowances and discounts can be reasonably estimated throughout the period and are deducted fromsales in arriving at net sales.
SHIPPING AND HANDLING FEES AND COSTS: The Company reports Shipping and Handling Fees andCosts in accordance with Emerging Issues Task Force (“EITF”) issue No. 00-10, “Accounting for Shipping andHandling Fees and Costs.” As such, in the Consolidated Statements of Operations all amounts billed to customersby the Company related to shipping and handling are included in “Net sales” and the Company’s shipping andhandling costs are included in “Cost of goods sold.”
RESTRUCTURING COSTS: Restructuring costs are items such as employee termination, contracttermination, plant closure and asset relocation costs related to exit activities. Restructuring-related items areinventory writedowns and gains or losses from sales of assets recorded as the result of exit activities. TheCompany recognizes a liability for costs associated with an exit or disposal activity when the liability is incurred.Certain termination benefits for which employees are required to render service are recognized ratably over therespective future service periods.
INCOME TAXES: The provision for income taxes is determined using the asset and liability approach ofaccounting for income taxes. Under this approach, deferred taxes represent the future tax consequences expectedto occur when the reported amounts of assets and liabilities are recovered or paid. The provision for income taxesrepresents income taxes paid or payable for the current year plus the change in deferred taxes during the year.Deferred taxes result from differences between the financial and tax basis of the Company’s assets and liabilitiesand are adjusted for changes in tax rates and laws, as appropriate. A valuation allowance is provided to reducedeferred tax assets when management cannot conclude that it is more likely than not that a tax benefit will berealized. A provision is also made for taxes on undistributed earnings of foreign subsidiaries and relatedcompanies to the extent that such earnings are not deemed to be permanently invested. This provision would besubstantially offset by available foreign tax credits.
The calculation of the Company’s U.S., state, and foreign tax liabilities involves dealing with uncertaintiesin the application of complex global tax laws. The Company recognizes potential liabilities for anticipated tax
84
issues which might arise in the U.S. and other tax jurisdictions based on management’s estimate of whether, andthe extent to which, additional taxes will be due. If payment of these amounts ultimately proves to beunnecessary, the reversal of the liabilities would result in tax benefits being recognized in the period when wedetermine the liabilities are no longer necessary. Conversely, if the estimate of tax liabilities proves to be lessthan the ultimate tax assessment, a further charge to tax expense would result.
CONCENTRATION OF CREDIT RISKS, EXPOSURES AND FINANCIAL INSTRUMENTS: TheCompany manufactures, markets, and distributes engineered products for the various end markets described inNote O. Operations are principally located in the United States, although the Company also has operations inCanada, Europe, Latin America, Asia, Australia and South Africa.
The Company performs ongoing credit evaluations of its customers’ financial conditions and generallyrequires no collateral from its customers, some of which are highly leveraged. The Company maintainsallowances for potential credit losses and such losses have generally been within management’s expectations.
The Company has no material guarantees or liabilities for product warranties which would requiredisclosure under Financial Accounting Standards Board Interpretation (FIN) No. 45, “Guarantor’s Accountingand Disclosure Requirements for Guarantees, Including Indirect Guarantees of Indebtedness of Others.”
From time to time, the Company will enter into contracts to hedge foreign currency denominatedtransactions, natural gas purchases, and interest rates related to the Company’s debt. To minimize the risk ofcounter party default, only highly-rated financial institutions that meet certain requirements are used. TheCompany does not anticipate that any of the financial institution counter parties will default on their obligations.
The carrying value of cash and short-term financial instruments approximates fair value due to the shortmaturity of those instruments.
OTHER RISKS: Although the Company obtains insurance for workers’ compensation, automobile, productand general liability, property loss and medical claims, it has elected to retain a significant portion of expectedlosses through the use of deductibles. Accrued liabilities include estimates for both unpaid, reported claims andfor claims incurred but not yet reported. Provisions for losses are recorded based upon estimates of the aggregateliability for claims incurred utilizing the Company’s prior experience and information provided by its third-partyadministrators and insurance carriers.
DERIVATIVE FINANCIAL INSTRUMENTS: The Company utilizes derivative financial instruments tomanage market and financial risks related to interest rates, foreign currency and commodities. The Companyseeks to use derivative contracts that qualify for hedge accounting treatment; however some instruments thateconomically manage currency risk may not qualify for hedge accounting treatment. It is the Company’s policynot to speculate using derivative instruments.
Under hedge accounting, the Company formally documents its hedge relationships, including identificationof the hedging instruments and the hedged items, as well as its risk management objectives and strategies forentering into the hedge transaction. The process includes the linking of the derivative instruments that aredesignated as hedges of specific assets, liabilities, firm commitments or forecasted transactions. The Companyalso formally assesses both at inception and on a quarterly basis thereafter, whether the derivatives used inhedging transactions are highly effective in offsetting changes in either the fair value or cash flows of the hedgeditem. If it is determined that a derivative ceases to be highly effective, deferred gains or losses are recorded in theConsolidated Statements of Operations.
Derivatives are recorded in the Consolidated Balance Sheets at fair value in “Other current” or “Sundry”assets or “Other current” or “Other long-term” liabilities.
85
On the date the contract is entered into, the Company designates the derivative as one of the following typesof hedging instruments and accounts for it as follows:
Cash Flow Hedge—The hedge of a forecasted transaction or of the variability of cash flows to be receivedor paid related to a recognized asset or liability is designated as a cash flow hedge. The effective portion of thechange in fair value of a cash flow hedge is recorded in accumulated other comprehensive income. When thehedged item impacts the income statement, the gain or loss included in other comprehensive income is reportedon the same line of the Consolidated Statements of Operations as the hedged item to match the gain or loss on thederivative to the gain or loss on the hedged item. Any ineffective portion of the changes in the fair value of thecash flow hedge is reported in the Consolidated Statements of Operations on the same line as the hedged item.
Fair Value Hedge—The hedge of a recognized asset or liability or an unrecognized firm commitment isdesignated a fair value hedge. For fair value hedges, both the effective and ineffective portions of the changes infair value of the derivative, along with the gain or loss on the hedged item that is attributable to the hedged risk,are recorded in earnings and reported in the Consolidated Statements of Operations on the same line as thehedged item.
Net Investment Hedge—The hedge of a net investment in a foreign operation is designated a net investmenthedge. The effective portion of the change in the fair value of derivatives, based upon spot rates, used as a netinvestment hedge of a foreign operation is recorded in other comprehensive income on the ConsolidatedStatements of Changes in Shareholders’ Equity. Any ineffective portion of the change in the fair value of aninstrument designated as a net investment hedge is recorded in the Consolidated Statements of Operations.
FOREIGN CURRENCY TRANSLATION: The functional currency for most foreign operations is the localcurrency. The translation of foreign currencies into U.S. dollars is performed for balance sheet accounts usingcurrent exchange rates in effect at the balance sheet date and for income and expense accounts using monthlyaverage exchange rates. The cumulative effects of translating the functional currencies into the U.S. dollar areincluded in comprehensive income.
RECLASSIFICATIONS: Certain reclassifications have been made to the prior years’ consolidated financialstatements to conform to the 2008 presentation:
• In the Consolidated Balance Sheets—certain current liabilities associated with held for sale items havebeen reclassified between “Accrued expenses” and “Other current liabilities.”
• In the Consolidated Statements of Operations and all related notes—Prior periods have beenretrospectively adjusted to reflect the movement of the Coated Fabrics unit, previously in theResidential Furnishing segment, to discontinued operations. (See Note B.)
NEW ACCOUNTING STANDARDS: On January 1, 2008, the Company adopted the Financial AccountingStandards Board (FASB) Statement of Financial Accounting Standards (SFAS) No. 158 (SFAS 158),“Employers’ Accounting for Defined Benefit Pension and Other Postretirement Plans” provision which requiresit to measure the funded status of its plans as of year end beginning with its December 31, 2008 balance sheet.The Company previously used September 30 as the measurement date for its most significant plans. TheCompany has chosen to perform a measurement that covers the 15-month period of October 1, 2007 throughDecember 31, 2008. Upon implementation, a proportionate allocation was made to cover the net benefit incomefor the transition period and the Company recorded a $.5 (net of tax) increase to beginning retained earnings onJanuary 1, 2008. The Company previously adopted the provisions of this statement which were effectiveDecember 31, 2006 to recognize the funded status of its defined benefit plans in the balance sheet and torecognize as a component of other comprehensive income changes in funded status from year to year that are nototherwise reflected in income.
As discussed in Note T, the provisions of SFAS No. 157 (SFAS 157), “Fair Value Measurements” wereadopted on January 1, 2008 for financial assets and liabilities of the Company. SFAS 157 provides guidance forusing fair value to measure assets and liabilities and requires additional disclosure. SFAS 157 also has an
86
effective date of January 1, 2009 for nonfinancial assets and liabilities that are recognized or disclosed at fairvalue in the financial statements on a nonrecurring basis. The Company has evaluated the effect of this standardand does not believe that it will have a material impact on the Company’s financial statements.
In February 2007, the FASB issued SFAS No. 159 (SFAS 159), “The Fair Value Option for FinancialAssets and Financial Liabilities—Including an Amendment of FASB Statement No. 115”. SFAS 159 permitsentities to choose to measure many financial instruments and certain other instruments at fair value, with theobjective of improving financial reporting by providing entities with the opportunity to mitigate volatility inreported earnings caused by measuring related assets and liabilities differently without having to apply complexhedge accounting provisions. As the Company did not elect to fair value any of its financial instruments underthe provisions of SFAS 159, the adoption of this statement, effective January 1, 2008, did not have an impact onthe financial statements.
In December 2007, the FASB issued SFAS No. 141(R) (SFAS 141R), “Business Combinations,” whichreplaces SFAS 141. The new standard requires the acquiring entity in a business combination to recognize all theassets acquired and liabilities assumed in the transaction and establishes the acquisition-date fair value as themeasurement objective for all assets acquired and liabilities assumed. SFAS 141R is effective on a prospectivebasis for all business combinations for which the acquisition date is on or after January 1, 2009, with theexception of the accounting for valuation allowances on deferred taxes and acquired tax contingencies. SFAS141R amends SFAS 109 such that adjustments made to valuation allowances on deferred taxes and acquired taxcontingencies associated with acquisitions that closed prior to the effective date of SFAS 141R would also applythe provisions of SFAS 141R. Because the adoption of SFAS 141R will be applied prospectively, it is notexpected to have a material impact on the Company’s financial statements.
In December 2007, the FASB also issued SFAS No. 160 (SFAS 160), “Noncontrolling Interests inConsolidated Financial Statements,” which seeks to improve the relevance, comparability, and transparency offinancial information provided to investors by requiring all entities to report noncontrolling (minority) interestsin subsidiaries in the same way as equity in their consolidated financial statements. SFAS 160 is also effectivefor the Company beginning January 1, 2009, and its adoption is not expected to have a material impact on theCompany’s financial statements.
In March 2008, the FASB issued SFAS No. 161 (SFAS 161), “Disclosures about Derivative Instruments andHedging Activities.” The new standard requires enhanced disclosures about derivative instruments and hedgingactivities and their effects on an entity’s financial position, financial performance, and cash flows. The statementrequires disclosure of objectives and strategies for derivative instruments, disclosure of the fair values ofderivative instruments and their gains and losses in a tabular format, disclosure of contingent derivative featuresthat are credit-risk related, and requires cross-referencing within footnotes if the required disclosures arepresented in more than one footnote. SFAS 161 is effective for financial statements issued for fiscal years andinterim periods beginning after November 15, 2008. Its adoption is not expected to have a material impact on theCompany’s financial statements.
In April 2008, FASB Staff Position (FSP) SFAS No. 142-3, “Determination of the Useful Life of IntangibleAssets” was issued. This FSP amends the factors that must be considered in developing renewal or extensionassumptions used to determine the useful life over which to amortize the cost of a recognized intangible assetunder SFAS No. 142 (SFAS 142), “Goodwill and Other Intangible Assets.” The FSP requires an entity toconsider its own assumptions about renewal or extension of the term of the arrangement, consistent with itsexpected use of the asset, and is an attempt to improve consistency between the useful life of a recognizedintangible asset under SFAS 142 and the period of expected cash flows used to measure the fair value of the assetunder SFAS No. 141, “Business Combinations.” The FSP is effective for the Company beginning January 1,2009, and the guidance for determining the useful life of a recognized intangible asset must be appliedprospectively to intangible assets acquired after the effective date. The Company does not expect the adoption ofFSP SFAS No. 142-3 to have a material effect on its consolidated financial statements.
87
In May 2008, the FASB issued SFAS No. 162 (SFAS 162), “The Hierarchy of Generally AcceptedAccounting Principles.” This statement identifies the sources of accounting principles and the framework forselecting the principles used in the preparation of financial statements. It was effective 60 days following theSecurities and Exchange Commission’s approval on September 16, 2008, of the Public Company AccountingOversight Board amendments to AU Section 411, “The Meaning of Present Fairly in Conformity With GenerallyAccepted Accounting Principles.” This statement will not result in a change in the Company’s current practice.
In October 2008, FSP SFAS No. 157-3, “Determining the Fair Value of a Financial Asset When the Marketfor That Asset Is Not Active” was issued. This FSP clarifies the application of FASB Statement No. 157, “FairValue Measurements,” and provides an example to illustrate key considerations in determining the fair value of afinancial asset when the market for that financial asset is not active. This FSP was effective upon issuance. Itsadoption did not have a material effect on the Company’s consolidated financial statements.
In December 2008, FSP SFAS No. 132(R)-1, “Employers’ Disclosure about Postretirement Benefit PlanAssets” was issued. This FSP requires additional disclosure surrounding plan assets of defined benefit pensionplans in the Company’s December 31, 2009 financial statements. Additional disclosures related to benefit planassets include information about investment policies and strategies, the fair value of each major category of planassets, and information that enables users of financial statements to assess the inputs and valuation techniquesused to develop fair value measurements of plan assets. Its adoption is not expected to have a material impact onthe Company’s financial statements.
B—Discontinued Operations and Assets Held for Sale
During 2007 the Company completed an extensive review of its business portfolio and determined that itwill exit certain of its business activities. This includes the divestiture of some operations, the pruning of somebusiness and the closure of certain underperforming plants, referred to as the 2007 Strategic Plan. Details relatedto completed divestitures are discussed below.
Fourth quarter 2008• Fibers unit—The sale of this unit resulted in a pretax loss of $8.6 ($7.8 loss net of tax) that is reported
within earnings from discontinued operations. This unit was previously reported in the ResidentialFurnishings segment.
Third quarter 2008• Aluminum Products segment—This segment was sold for $300 in cash, a $25 subordinated note (book
value of $14), and shares of preferred stock (no book value, with face value not to exceed $25,dependent upon future performance of the divested business). The sale of this business resulted in apre-tax gain of $7.6 ($16.0 gain after taxes) that is reported within earnings from discontinuedoperations.
• Wood Products unit—The sale of this unit resulted in a pretax loss of $4.1 ($4.4 loss net of tax) that isreported within earnings from discontinued operations. This unit was previously part of the ResidentialFurnishings segment.
• Plastics unit—The sale of this unit resulted in a pretax loss of $9.4 ($6.7 loss net of tax) that is reportedwithin earnings from discontinued operations. This unit was previously reported in the CommercialFixturing & Components segment.
• The dealer portion of the Commercial Vehicle Products unit—The sale of this business resulted in apretax gain of $.4 ($.3 gain after taxes) that is reported within earnings from discontinued operations.This business was previously reported in the Specialized Products segment.
88
First quarter 2008• One automotive seating components operation—The sale of this business resulted in a pre-tax loss of
$2.5 ($1.7 loss net of tax) that is reported within earnings from discontinued operations. This businesswas previously part of the Specialized Products segment.
• One metal store fixture operation—This operation was classified as held for sale at December 31, 2007,but did not meet the requirements for discontinued operations. The results for this operation (including apre-tax gain on sale of $1.5) are included in the Commercial Fixturing & Components segment. Thepre-tax gain is reported in “Other expense, net” on the Consolidated Statements of Operations.
First quarter 2007• Prime Foam Products unit—The sale of this unit resulted in a pre-tax gain of $23.7 ($12.1 gain after
taxes) that is reported within earnings from discontinued operations. This business was previously partof the Residential Furnishings segment.
The Company has two remaining businesses held for sale (Coated Fabrics and Storage Products) and pre-taxproceeds are expected to recover the carrying value of the assets held for sale as presented in the followingtables. Completion of these dispositions is expected in the near term, although market conditions may delay thetiming of these dispositions. The net assets held for sale may fluctuate due to changes in working capital untilthese businesses are divested.
89
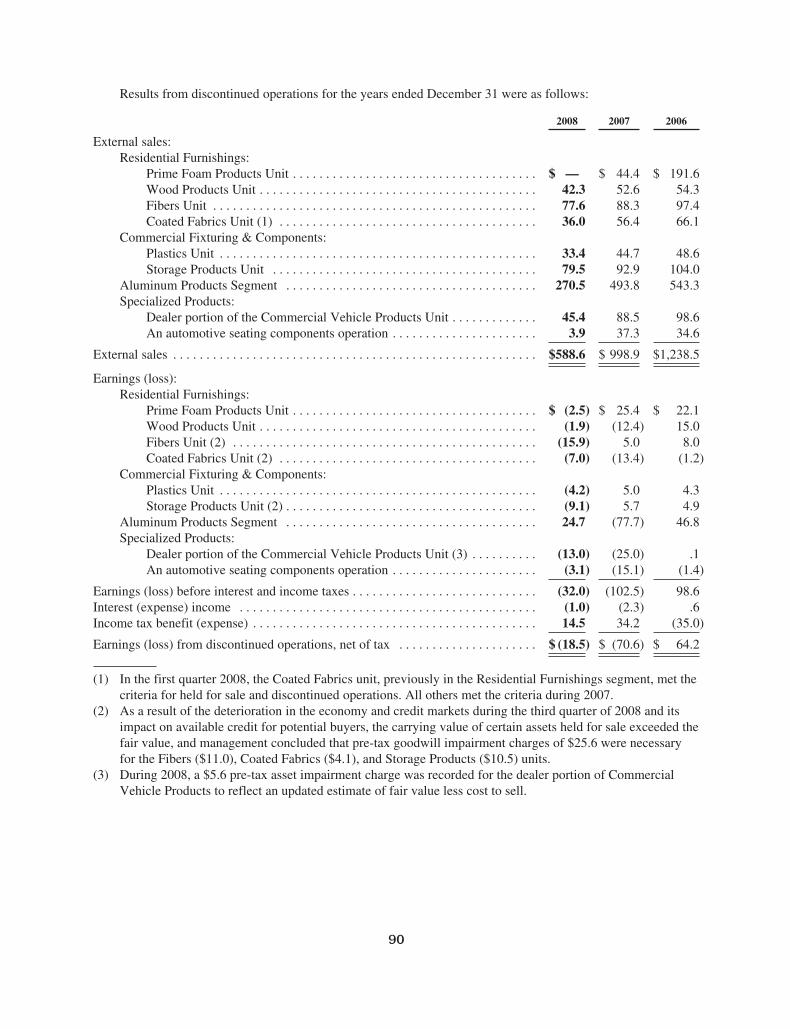
Results from discontinued operations for the years ended December 31 were as follows:
2008 2007 2006
External sales:Residential Furnishings:
Prime Foam Products Unit . . . . . . . . . . . . . . . . . . . . . . . . . . . . . . . . . . . . . $ — $ 44.4 $ 191.6Wood Products Unit . . . . . . . . . . . . . . . . . . . . . . . . . . . . . . . . . . . . . . . . . . 42.3 52.6 54.3Fibers Unit . . . . . . . . . . . . . . . . . . . . . . . . . . . . . . . . . . . . . . . . . . . . . . . . . 77.6 88.3 97.4Coated Fabrics Unit (1) . . . . . . . . . . . . . . . . . . . . . . . . . . . . . . . . . . . . . . . 36.0 56.4 66.1
Commercial Fixturing & Components:Plastics Unit . . . . . . . . . . . . . . . . . . . . . . . . . . . . . . . . . . . . . . . . . . . . . . . . 33.4 44.7 48.6Storage Products Unit . . . . . . . . . . . . . . . . . . . . . . . . . . . . . . . . . . . . . . . . 79.5 92.9 104.0
Aluminum Products Segment . . . . . . . . . . . . . . . . . . . . . . . . . . . . . . . . . . . . . . 270.5 493.8 543.3Specialized Products:
Dealer portion of the Commercial Vehicle Products Unit . . . . . . . . . . . . . 45.4 88.5 98.6An automotive seating components operation . . . . . . . . . . . . . . . . . . . . . . 3.9 37.3 34.6
External sales . . . . . . . . . . . . . . . . . . . . . . . . . . . . . . . . . . . . . . . . . . . . . . . . . . . . . . . $588.6 $ 998.9 $1,238.5
Earnings (loss):Residential Furnishings:
Prime Foam Products Unit . . . . . . . . . . . . . . . . . . . . . . . . . . . . . . . . . . . . . $ (2.5) $ 25.4 $ 22.1Wood Products Unit . . . . . . . . . . . . . . . . . . . . . . . . . . . . . . . . . . . . . . . . . . (1.9) (12.4) 15.0Fibers Unit (2) . . . . . . . . . . . . . . . . . . . . . . . . . . . . . . . . . . . . . . . . . . . . . . (15.9) 5.0 8.0Coated Fabrics Unit (2) . . . . . . . . . . . . . . . . . . . . . . . . . . . . . . . . . . . . . . . (7.0) (13.4) (1.2)
Commercial Fixturing & Components:Plastics Unit . . . . . . . . . . . . . . . . . . . . . . . . . . . . . . . . . . . . . . . . . . . . . . . . (4.2) 5.0 4.3Storage Products Unit (2) . . . . . . . . . . . . . . . . . . . . . . . . . . . . . . . . . . . . . . (9.1) 5.7 4.9
Aluminum Products Segment . . . . . . . . . . . . . . . . . . . . . . . . . . . . . . . . . . . . . . 24.7 (77.7) 46.8Specialized Products:
Dealer portion of the Commercial Vehicle Products Unit (3) . . . . . . . . . . (13.0) (25.0) .1An automotive seating components operation . . . . . . . . . . . . . . . . . . . . . . (3.1) (15.1) (1.4)
Earnings (loss) before interest and income taxes . . . . . . . . . . . . . . . . . . . . . . . . . . . . (32.0) (102.5) 98.6Interest (expense) income . . . . . . . . . . . . . . . . . . . . . . . . . . . . . . . . . . . . . . . . . . . . . (1.0) (2.3) .6Income tax benefit (expense) . . . . . . . . . . . . . . . . . . . . . . . . . . . . . . . . . . . . . . . . . . . 14.5 34.2 (35.0)
Earnings (loss) from discontinued operations, net of tax . . . . . . . . . . . . . . . . . . . . . $ (18.5) $ (70.6) $ 64.2
(1) In the first quarter 2008, the Coated Fabrics unit, previously in the Residential Furnishings segment, met thecriteria for held for sale and discontinued operations. All others met the criteria during 2007.
(2) As a result of the deterioration in the economy and credit markets during the third quarter of 2008 and itsimpact on available credit for potential buyers, the carrying value of certain assets held for sale exceeded thefair value, and management concluded that pre-tax goodwill impairment charges of $25.6 were necessaryfor the Fibers ($11.0), Coated Fabrics ($4.1), and Storage Products ($10.5) units.
(3) During 2008, a $5.6 pre-tax asset impairment charge was recorded for the dealer portion of CommercialVehicle Products to reflect an updated estimate of fair value less cost to sell.
90
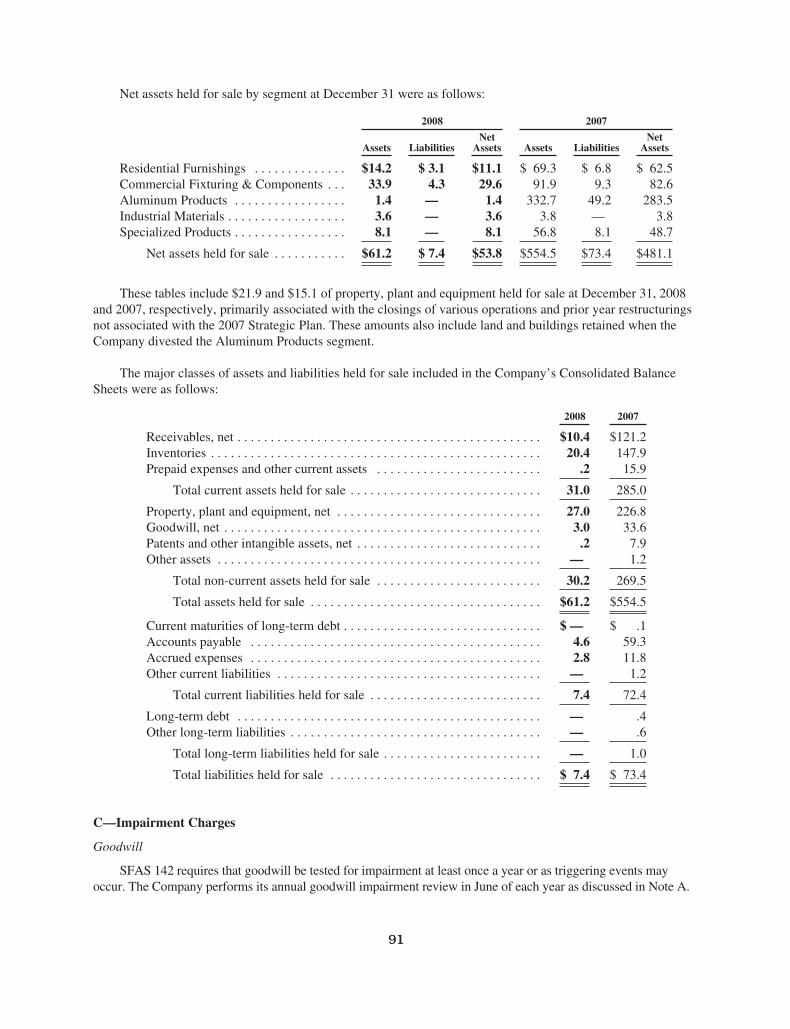
Net assets held for sale by segment at December 31 were as follows:
2008 2007
Assets LiabilitiesNet
Assets Assets LiabilitiesNet
Assets
Residential Furnishings . . . . . . . . . . . . . . $14.2 $ 3.1 $11.1 $ 69.3 $ 6.8 $ 62.5Commercial Fixturing & Components . . . 33.9 4.3 29.6 91.9 9.3 82.6Aluminum Products . . . . . . . . . . . . . . . . . 1.4 — 1.4 332.7 49.2 283.5Industrial Materials . . . . . . . . . . . . . . . . . . 3.6 — 3.6 3.8 — 3.8Specialized Products . . . . . . . . . . . . . . . . . 8.1 — 8.1 56.8 8.1 48.7
Net assets held for sale . . . . . . . . . . . $61.2 $ 7.4 $53.8 $554.5 $73.4 $481.1
These tables include $21.9 and $15.1 of property, plant and equipment held for sale at December 31, 2008and 2007, respectively, primarily associated with the closings of various operations and prior year restructuringsnot associated with the 2007 Strategic Plan. These amounts also include land and buildings retained when theCompany divested the Aluminum Products segment.
The major classes of assets and liabilities held for sale included in the Company’s Consolidated BalanceSheets were as follows:
2008 2007
Receivables, net . . . . . . . . . . . . . . . . . . . . . . . . . . . . . . . . . . . . . . . . . . . . . . $10.4 $121.2Inventories . . . . . . . . . . . . . . . . . . . . . . . . . . . . . . . . . . . . . . . . . . . . . . . . . . 20.4 147.9Prepaid expenses and other current assets . . . . . . . . . . . . . . . . . . . . . . . . . .2 15.9
Total current assets held for sale . . . . . . . . . . . . . . . . . . . . . . . . . . . . . 31.0 285.0
Property, plant and equipment, net . . . . . . . . . . . . . . . . . . . . . . . . . . . . . . . 27.0 226.8Goodwill, net . . . . . . . . . . . . . . . . . . . . . . . . . . . . . . . . . . . . . . . . . . . . . . . . 3.0 33.6Patents and other intangible assets, net . . . . . . . . . . . . . . . . . . . . . . . . . . . . .2 7.9Other assets . . . . . . . . . . . . . . . . . . . . . . . . . . . . . . . . . . . . . . . . . . . . . . . . . — 1.2
Total non-current assets held for sale . . . . . . . . . . . . . . . . . . . . . . . . . 30.2 269.5
Total assets held for sale . . . . . . . . . . . . . . . . . . . . . . . . . . . . . . . . . . . $61.2 $554.5
Current maturities of long-term debt . . . . . . . . . . . . . . . . . . . . . . . . . . . . . . $ — $ .1Accounts payable . . . . . . . . . . . . . . . . . . . . . . . . . . . . . . . . . . . . . . . . . . . . 4.6 59.3Accrued expenses . . . . . . . . . . . . . . . . . . . . . . . . . . . . . . . . . . . . . . . . . . . . 2.8 11.8Other current liabilities . . . . . . . . . . . . . . . . . . . . . . . . . . . . . . . . . . . . . . . . — 1.2
Total current liabilities held for sale . . . . . . . . . . . . . . . . . . . . . . . . . . 7.4 72.4
Long-term debt . . . . . . . . . . . . . . . . . . . . . . . . . . . . . . . . . . . . . . . . . . . . . . — .4Other long-term liabilities . . . . . . . . . . . . . . . . . . . . . . . . . . . . . . . . . . . . . . — .6
Total long-term liabilities held for sale . . . . . . . . . . . . . . . . . . . . . . . . — 1.0
Total liabilities held for sale . . . . . . . . . . . . . . . . . . . . . . . . . . . . . . . . $ 7.4 $ 73.4
C—Impairment Charges
Goodwill
SFAS 142 requires that goodwill be tested for impairment at least once a year or as triggering events mayoccur. The Company performs its annual goodwill impairment review in June of each year as discussed in Note A.
91
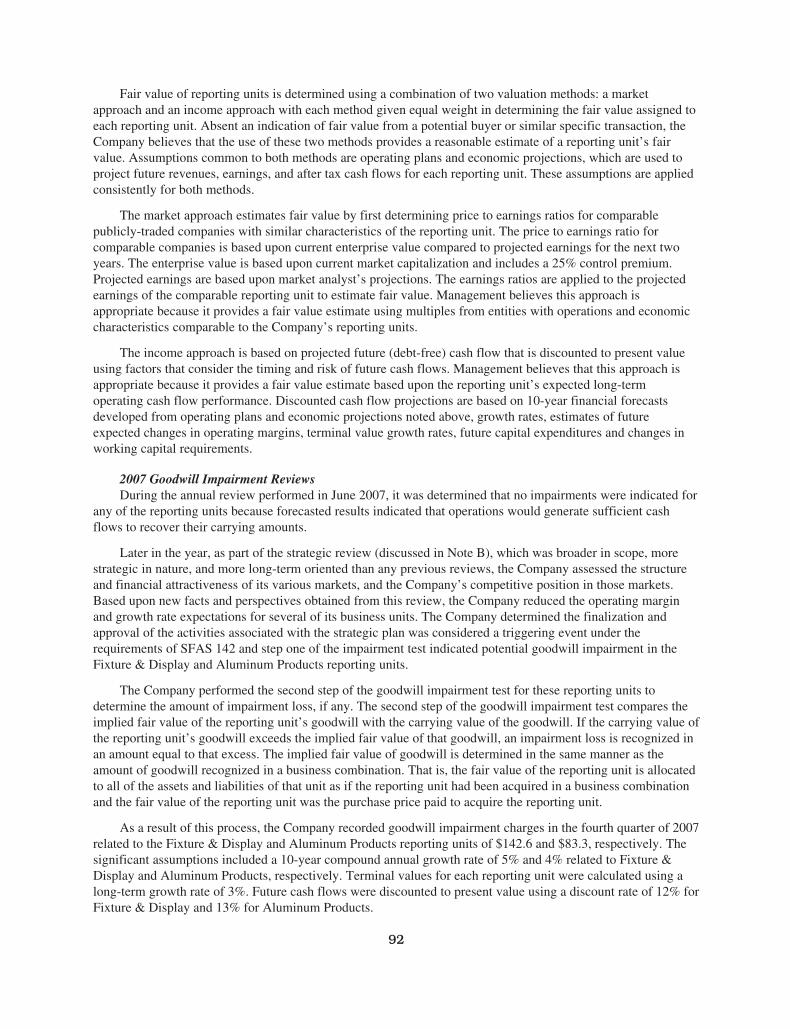
Fair value of reporting units is determined using a combination of two valuation methods: a marketapproach and an income approach with each method given equal weight in determining the fair value assigned toeach reporting unit. Absent an indication of fair value from a potential buyer or similar specific transaction, theCompany believes that the use of these two methods provides a reasonable estimate of a reporting unit’s fairvalue. Assumptions common to both methods are operating plans and economic projections, which are used toproject future revenues, earnings, and after tax cash flows for each reporting unit. These assumptions are appliedconsistently for both methods.
The market approach estimates fair value by first determining price to earnings ratios for comparablepublicly-traded companies with similar characteristics of the reporting unit. The price to earnings ratio forcomparable companies is based upon current enterprise value compared to projected earnings for the next twoyears. The enterprise value is based upon current market capitalization and includes a 25% control premium.Projected earnings are based upon market analyst’s projections. The earnings ratios are applied to the projectedearnings of the comparable reporting unit to estimate fair value. Management believes this approach isappropriate because it provides a fair value estimate using multiples from entities with operations and economiccharacteristics comparable to the Company’s reporting units.
The income approach is based on projected future (debt-free) cash flow that is discounted to present valueusing factors that consider the timing and risk of future cash flows. Management believes that this approach isappropriate because it provides a fair value estimate based upon the reporting unit’s expected long-termoperating cash flow performance. Discounted cash flow projections are based on 10-year financial forecastsdeveloped from operating plans and economic projections noted above, growth rates, estimates of futureexpected changes in operating margins, terminal value growth rates, future capital expenditures and changes inworking capital requirements.
2007 Goodwill Impairment ReviewsDuring the annual review performed in June 2007, it was determined that no impairments were indicated for
any of the reporting units because forecasted results indicated that operations would generate sufficient cashflows to recover their carrying amounts.
Later in the year, as part of the strategic review (discussed in Note B), which was broader in scope, morestrategic in nature, and more long-term oriented than any previous reviews, the Company assessed the structureand financial attractiveness of its various markets, and the Company’s competitive position in those markets.Based upon new facts and perspectives obtained from this review, the Company reduced the operating marginand growth rate expectations for several of its business units. The Company determined the finalization andapproval of the activities associated with the strategic plan was considered a triggering event under therequirements of SFAS 142 and step one of the impairment test indicated potential goodwill impairment in theFixture & Display and Aluminum Products reporting units.
The Company performed the second step of the goodwill impairment test for these reporting units todetermine the amount of impairment loss, if any. The second step of the goodwill impairment test compares theimplied fair value of the reporting unit’s goodwill with the carrying value of the goodwill. If the carrying value ofthe reporting unit’s goodwill exceeds the implied fair value of that goodwill, an impairment loss is recognized inan amount equal to that excess. The implied fair value of goodwill is determined in the same manner as theamount of goodwill recognized in a business combination. That is, the fair value of the reporting unit is allocatedto all of the assets and liabilities of that unit as if the reporting unit had been acquired in a business combinationand the fair value of the reporting unit was the purchase price paid to acquire the reporting unit.
As a result of this process, the Company recorded goodwill impairment charges in the fourth quarter of 2007related to the Fixture & Display and Aluminum Products reporting units of $142.6 and $83.3, respectively. Thesignificant assumptions included a 10-year compound annual growth rate of 5% and 4% related to Fixture &Display and Aluminum Products, respectively. Terminal values for each reporting unit were calculated using along-term growth rate of 3%. Future cash flows were discounted to present value using a discount rate of 12% forFixture & Display and 13% for Aluminum Products.
92
2008 Goodwill Impairment ReviewsThe annual goodwill impairment review performed in June 2008, indicated no goodwill impairments.
The deterioration in the economic and financial climate in the fourth quarter of 2008 and the associatedrevision to earnings as a result of lower demand was considered a triggering event under SFAS 142. An interimgoodwill impairment analysis was performed in the fourth quarter 2008 that confirmed fair values exceededcarrying value for all reporting units. Future cash flow assumptions were reduced to reflect lowered sales andproduction levels for 2009 and 2010, returning to historical levels thereafter. Other significant assumptionsincluded (i) 10-year compound annual growth rates ranging from 2%-6%; (ii) terminal values for each reportingunit using a long-term growth rate of 3%; and (iii) discount rates ranging from 11-12%. Goodwill associated withreporting units whose fair values exceeded the carrying value by 10-20% was $254.7; $205.5 of goodwill wasassociated with reporting units that had 20-30% excess fair value; and $415.4 of goodwill was associated withreporting units that had fair values in excess of the carrying values by greater than 30%. If actual results differfrom estimates used in these calculations, the Company could incur future impairment charges.
The Store Fixtures business unit experienced operational performance shortfalls in recent years andsignificant restructuring activities in the fourth quarter 2008 following the decision to focus on metal fixtures.The Store Fixtures business unit is included in the Fixture & Display reporting unit for goodwill impairmenttesting purposes. As a result of the interim goodwill impairment review performed in the fourth quarter 2008, noimpairment charges were indicated for the Fixture & Display reporting unit. The significant assumptionsincluded a 10-year compound annual growth rate of 6%, terminal values using a long-term growth rate of 3%,and a discount rate of 12%. Future cash flows are expected to increase as a result of narrowing the scope of theunit primarily to the metals part of the fixture industry. The recoverability of long-lived assets was also reviewedfor potential impairment, with no impairments indicated. The Fixture & Display reporting unit had $106 and$118 of goodwill at December 31, 2008 and 2007, respectively. Of the $64 and $76 of other long-lived assets inthe Fixture & Display reporting unit, $62 and $73 were associated with the Store Fixtures business unit atDecember 31, 2008 and 2007, respectively.
Businesses Held for Sale
In November 2007, the Company determined that it would exit certain of its business activities, and adopteda new strategic plan which required the Company to perform certain impairment reviews in the fourth quarter2007 under the requirements of SFAS 144 “Accounting for Impairment or Disposal of Long-Lived Assets.” As aresult of this review, goodwill and asset impairments were recorded in 2007 relating to held-for-sale locations assummarized in the table below.
In 2008, asset impairment charges were recorded as updated estimates of fair value less costs to sell becamemore certain. Pre-tax goodwill impairment charges of $25.6 were necessary and recorded for the Fibers ($11.0),Coated Fabrics ($4.1), and Storage Products ($10.5) units during the third quarter 2008 as a result of thedeterioration in the economy and credit markets and the impact on available credit for potential buyers.
Other Long-Lived Assets
As discussed in Note A, other long-lived assets are tested for recoverability at year end and whenever eventsor changes in circumstances indicate that the carrying value may not be recoverable. As a result of thedeterioration in the economic and financial climate in the fourth quarter of 2008, the Company performed animpairment review and determined that intangible assets associated with supply agreements in Latin Americawere impaired due to a significant reduction in the expected future cash flows associated with these agreements,resulting in an impairment of $9.5 in the Residential Furnishings segment. The Company also recorded othervarious impairments as presented in the table below which did not individually result in a material charge toearnings for the periods presented.
93
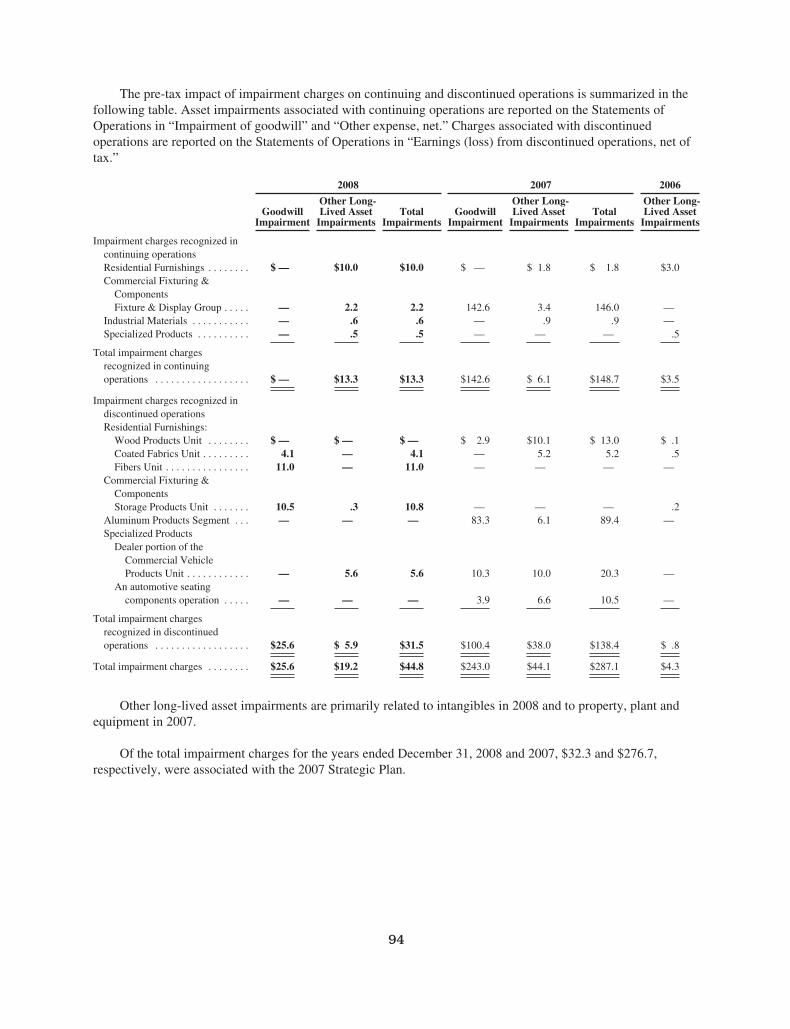
The pre-tax impact of impairment charges on continuing and discontinued operations is summarized in thefollowing table. Asset impairments associated with continuing operations are reported on the Statements ofOperations in “Impairment of goodwill” and “Other expense, net.” Charges associated with discontinuedoperations are reported on the Statements of Operations in “Earnings (loss) from discontinued operations, net oftax.”
2008 2007 2006
GoodwillImpairment
Other Long-Lived Asset
ImpairmentsTotal
ImpairmentsGoodwill
Impairment
Other Long-Lived Asset
ImpairmentsTotal
Impairments
Other Long-Lived Asset
Impairments
Impairment charges recognized incontinuing operationsResidential Furnishings . . . . . . . . $ — $10.0 $10.0 $ — $ 1.8 $ 1.8 $3.0Commercial Fixturing &
ComponentsFixture & Display Group . . . . . — 2.2 2.2 142.6 3.4 146.0 —
Industrial Materials . . . . . . . . . . . — .6 .6 — .9 .9 —Specialized Products . . . . . . . . . . — .5 .5 — — — .5
Total impairment chargesrecognized in continuingoperations . . . . . . . . . . . . . . . . . . $ — $13.3 $13.3 $142.6 $ 6.1 $148.7 $3.5
Impairment charges recognized indiscontinued operationsResidential Furnishings:
Wood Products Unit . . . . . . . . $ — $ — $ — $ 2.9 $10.1 $ 13.0 $ .1Coated Fabrics Unit . . . . . . . . . 4.1 — 4.1 — 5.2 5.2 .5Fibers Unit . . . . . . . . . . . . . . . . 11.0 — 11.0 — — — —
Commercial Fixturing &ComponentsStorage Products Unit . . . . . . . 10.5 .3 10.8 — — — .2
Aluminum Products Segment . . . — — — 83.3 6.1 89.4 —Specialized Products
Dealer portion of theCommercial VehicleProducts Unit . . . . . . . . . . . . — 5.6 5.6 10.3 10.0 20.3 —
An automotive seatingcomponents operation . . . . . — — — 3.9 6.6 10.5 —
Total impairment chargesrecognized in discontinuedoperations . . . . . . . . . . . . . . . . . . $25.6 $ 5.9 $31.5 $100.4 $38.0 $138.4 $ .8
Total impairment charges . . . . . . . . $25.6 $19.2 $44.8 $243.0 $44.1 $287.1 $4.3
Other long-lived asset impairments are primarily related to intangibles in 2008 and to property, plant andequipment in 2007.
Of the total impairment charges for the years ended December 31, 2008 and 2007, $32.3 and $276.7,respectively, were associated with the 2007 Strategic Plan.
94
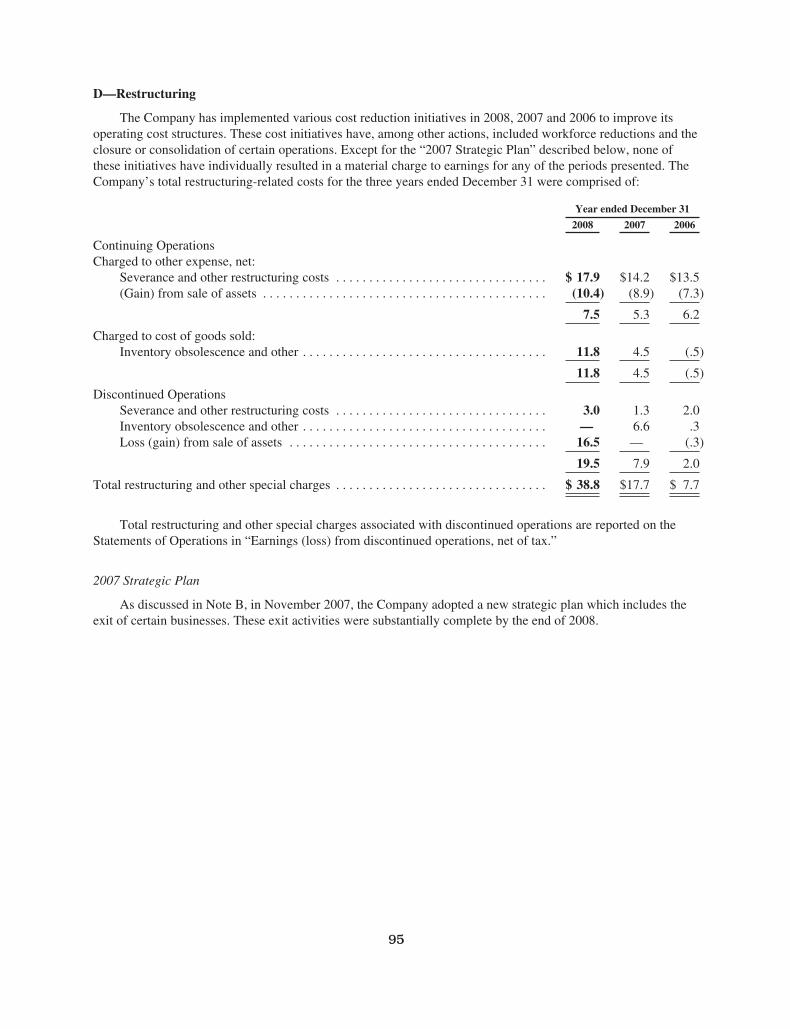
D—Restructuring
The Company has implemented various cost reduction initiatives in 2008, 2007 and 2006 to improve itsoperating cost structures. These cost initiatives have, among other actions, included workforce reductions and theclosure or consolidation of certain operations. Except for the “2007 Strategic Plan” described below, none ofthese initiatives have individually resulted in a material charge to earnings for any of the periods presented. TheCompany’s total restructuring-related costs for the three years ended December 31 were comprised of:
Year ended December 31
2008 2007 2006
Continuing OperationsCharged to other expense, net:
Severance and other restructuring costs . . . . . . . . . . . . . . . . . . . . . . . . . . . . . . . . $ 17.9 $14.2 $13.5(Gain) from sale of assets . . . . . . . . . . . . . . . . . . . . . . . . . . . . . . . . . . . . . . . . . . . (10.4) (8.9) (7.3)
7.5 5.3 6.2
Charged to cost of goods sold:Inventory obsolescence and other . . . . . . . . . . . . . . . . . . . . . . . . . . . . . . . . . . . . . 11.8 4.5 (.5)
11.8 4.5 (.5)
Discontinued OperationsSeverance and other restructuring costs . . . . . . . . . . . . . . . . . . . . . . . . . . . . . . . . 3.0 1.3 2.0Inventory obsolescence and other . . . . . . . . . . . . . . . . . . . . . . . . . . . . . . . . . . . . . — 6.6 .3Loss (gain) from sale of assets . . . . . . . . . . . . . . . . . . . . . . . . . . . . . . . . . . . . . . . 16.5 — (.3)
19.5 7.9 2.0
Total restructuring and other special charges . . . . . . . . . . . . . . . . . . . . . . . . . . . . . . . . $ 38.8 $17.7 $ 7.7
Total restructuring and other special charges associated with discontinued operations are reported on theStatements of Operations in “Earnings (loss) from discontinued operations, net of tax.”
2007 Strategic Plan
As discussed in Note B, in November 2007, the Company adopted a new strategic plan which includes theexit of certain businesses. These exit activities were substantially complete by the end of 2008.
95
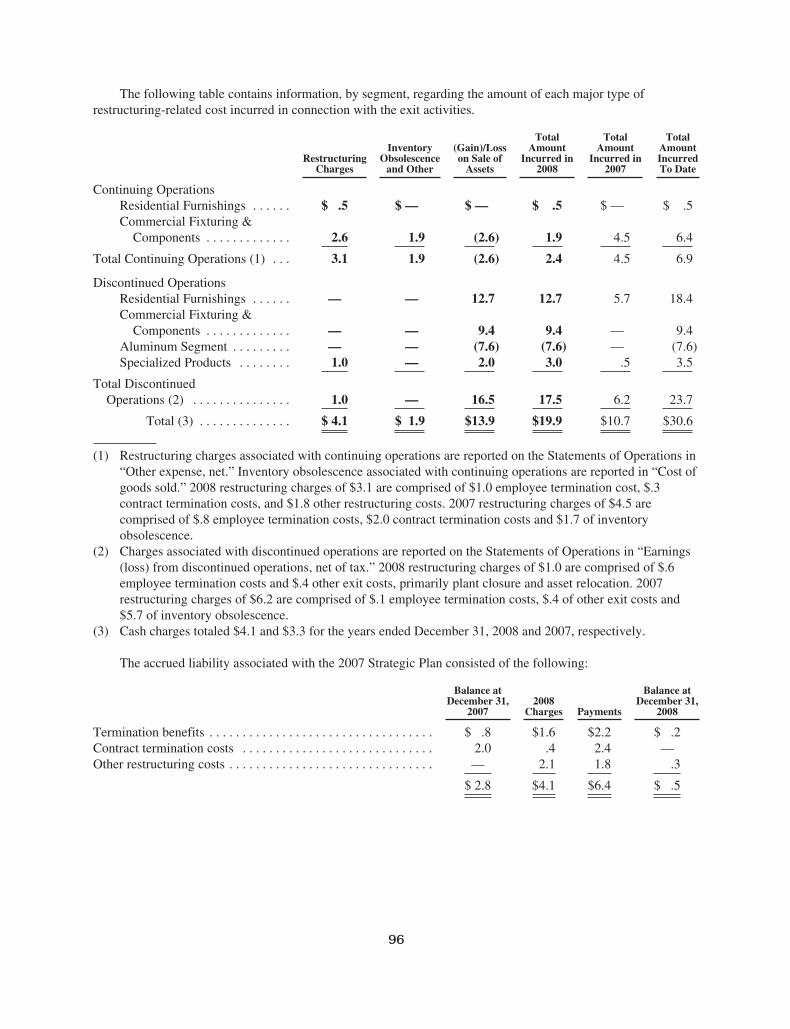
The following table contains information, by segment, regarding the amount of each major type ofrestructuring-related cost incurred in connection with the exit activities.
RestructuringCharges
InventoryObsolescence
and Other
(Gain)/Losson Sale of
Assets
TotalAmount
Incurred in2008
TotalAmount
Incurred in2007
TotalAmountIncurredTo Date
Continuing OperationsResidential Furnishings . . . . . . $ .5 $ — $ — $ .5 $ — $ .5Commercial Fixturing &
Components . . . . . . . . . . . . . 2.6 1.9 (2.6) 1.9 4.5 6.4
Total Continuing Operations (1) . . . 3.1 1.9 (2.6) 2.4 4.5 6.9
Discontinued OperationsResidential Furnishings . . . . . . — — 12.7 12.7 5.7 18.4Commercial Fixturing &
Components . . . . . . . . . . . . . — — 9.4 9.4 — 9.4Aluminum Segment . . . . . . . . . — — (7.6) (7.6) — (7.6)Specialized Products . . . . . . . . 1.0 — 2.0 3.0 .5 3.5
Total DiscontinuedOperations (2) . . . . . . . . . . . . . . . 1.0 — 16.5 17.5 6.2 23.7
Total (3) . . . . . . . . . . . . . . $ 4.1 $ 1.9 $13.9 $19.9 $10.7 $30.6
(1) Restructuring charges associated with continuing operations are reported on the Statements of Operations in“Other expense, net.” Inventory obsolescence associated with continuing operations are reported in “Cost ofgoods sold.” 2008 restructuring charges of $3.1 are comprised of $1.0 employee termination cost, $.3contract termination costs, and $1.8 other restructuring costs. 2007 restructuring charges of $4.5 arecomprised of $.8 employee termination costs, $2.0 contract termination costs and $1.7 of inventoryobsolescence.
(2) Charges associated with discontinued operations are reported on the Statements of Operations in “Earnings(loss) from discontinued operations, net of tax.” 2008 restructuring charges of $1.0 are comprised of $.6employee termination costs and $.4 other exit costs, primarily plant closure and asset relocation. 2007restructuring charges of $6.2 are comprised of $.1 employee termination costs, $.4 of other exit costs and$5.7 of inventory obsolescence.
(3) Cash charges totaled $4.1 and $3.3 for the years ended December 31, 2008 and 2007, respectively.
The accrued liability associated with the 2007 Strategic Plan consisted of the following:
Balance atDecember 31,
20072008
Charges Payments
Balance atDecember 31,
2008
Termination benefits . . . . . . . . . . . . . . . . . . . . . . . . . . . . . . . . . . $ .8 $1.6 $2.2 $ .2Contract termination costs . . . . . . . . . . . . . . . . . . . . . . . . . . . . . 2.0 .4 2.4 —Other restructuring costs . . . . . . . . . . . . . . . . . . . . . . . . . . . . . . . — 2.1 1.8 .3
$ 2.8 $4.1 $6.4 $ .5
96
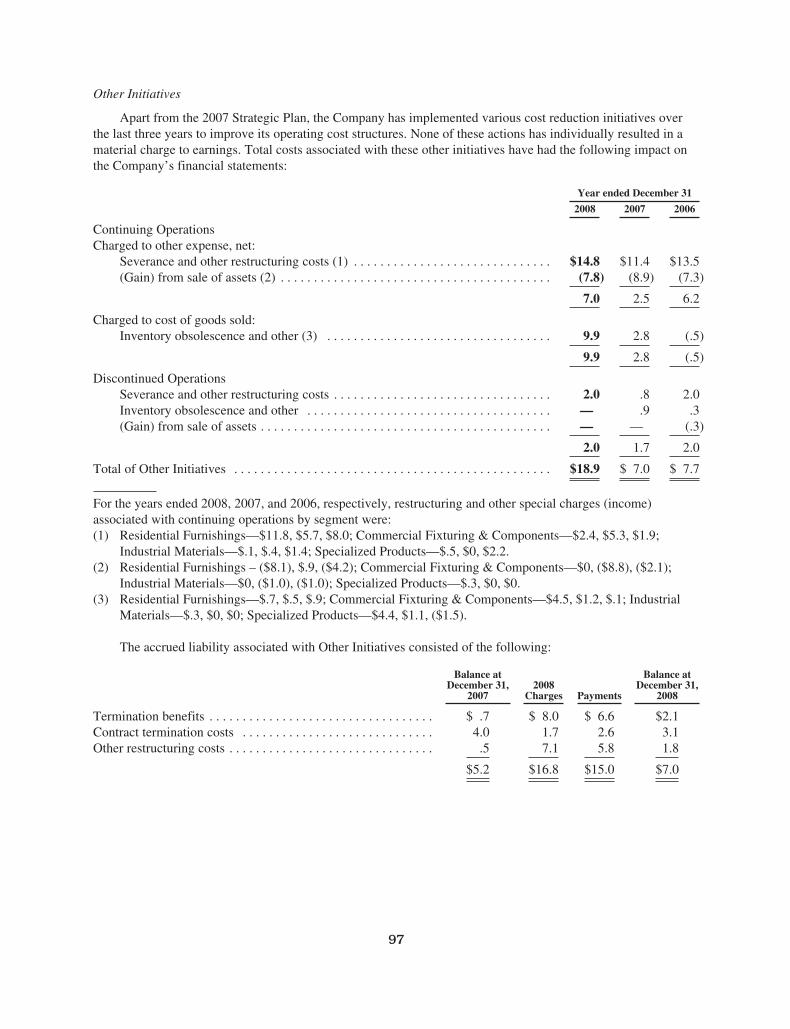
Other Initiatives
Apart from the 2007 Strategic Plan, the Company has implemented various cost reduction initiatives overthe last three years to improve its operating cost structures. None of these actions has individually resulted in amaterial charge to earnings. Total costs associated with these other initiatives have had the following impact onthe Company’s financial statements:
Year ended December 31
2008 2007 2006
Continuing OperationsCharged to other expense, net:
Severance and other restructuring costs (1) . . . . . . . . . . . . . . . . . . . . . . . . . . . . . . $14.8 $11.4 $13.5(Gain) from sale of assets (2) . . . . . . . . . . . . . . . . . . . . . . . . . . . . . . . . . . . . . . . . . (7.8) (8.9) (7.3)
7.0 2.5 6.2
Charged to cost of goods sold:Inventory obsolescence and other (3) . . . . . . . . . . . . . . . . . . . . . . . . . . . . . . . . . . 9.9 2.8 (.5)
9.9 2.8 (.5)
Discontinued OperationsSeverance and other restructuring costs . . . . . . . . . . . . . . . . . . . . . . . . . . . . . . . . . 2.0 .8 2.0Inventory obsolescence and other . . . . . . . . . . . . . . . . . . . . . . . . . . . . . . . . . . . . . — .9 .3(Gain) from sale of assets . . . . . . . . . . . . . . . . . . . . . . . . . . . . . . . . . . . . . . . . . . . . — — (.3)
2.0 1.7 2.0
Total of Other Initiatives . . . . . . . . . . . . . . . . . . . . . . . . . . . . . . . . . . . . . . . . . . . . . . . . $18.9 $ 7.0 $ 7.7
For the years ended 2008, 2007, and 2006, respectively, restructuring and other special charges (income)associated with continuing operations by segment were:(1) Residential Furnishings—$11.8, $5.7, $8.0; Commercial Fixturing & Components—$2.4, $5.3, $1.9;
Industrial Materials—$.1, $.4, $1.4; Specialized Products—$.5, $0, $2.2.(2) Residential Furnishings – ($8.1), $.9, ($4.2); Commercial Fixturing & Components—$0, ($8.8), ($2.1);
Industrial Materials—$0, ($1.0), ($1.0); Specialized Products—$.3, $0, $0.(3) Residential Furnishings—$.7, $.5, $.9; Commercial Fixturing & Components—$4.5, $1.2, $.1; Industrial
Materials—$.3, $0, $0; Specialized Products—$4.4, $1.1, ($1.5).
The accrued liability associated with Other Initiatives consisted of the following:
Balance atDecember 31,
20072008
Charges Payments
Balance atDecember 31,
2008
Termination benefits . . . . . . . . . . . . . . . . . . . . . . . . . . . . . . . . . . $ .7 $ 8.0 $ 6.6 $2.1Contract termination costs . . . . . . . . . . . . . . . . . . . . . . . . . . . . . 4.0 1.7 2.6 3.1Other restructuring costs . . . . . . . . . . . . . . . . . . . . . . . . . . . . . . . .5 7.1 5.8 1.8
$5.2 $16.8 $15.0 $7.0
97
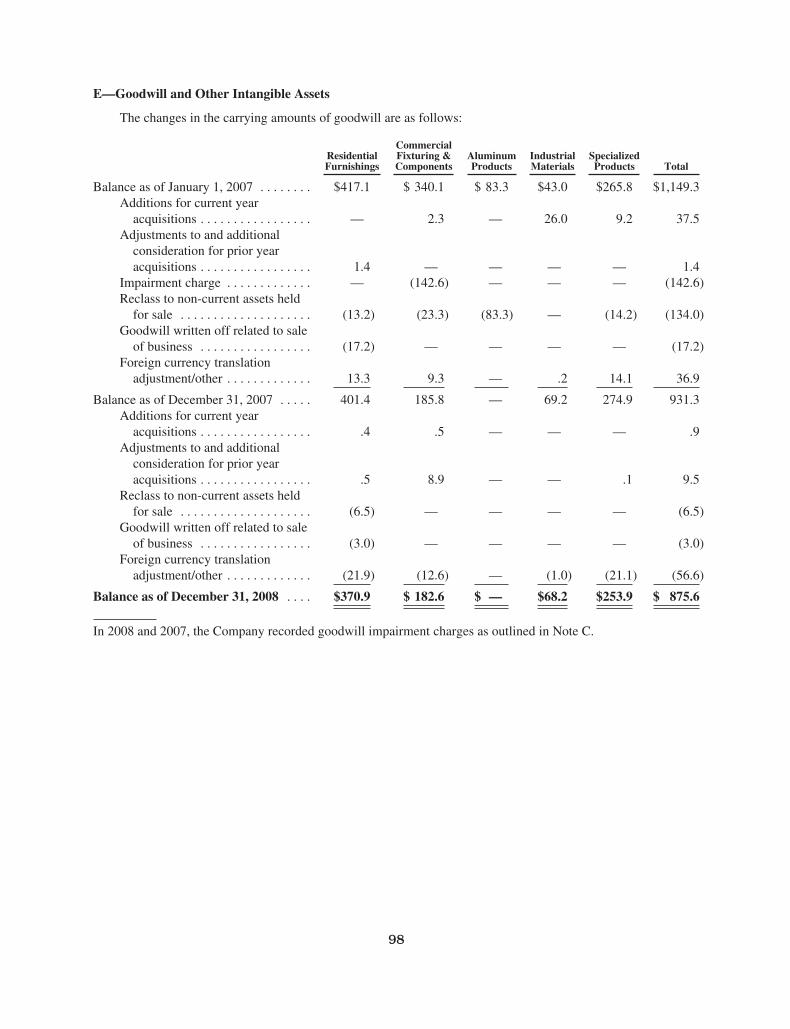
E—Goodwill and Other Intangible Assets
The changes in the carrying amounts of goodwill are as follows:
ResidentialFurnishings
CommercialFixturing &Components
AluminumProducts
IndustrialMaterials
SpecializedProducts Total
Balance as of January 1, 2007 . . . . . . . . $417.1 $ 340.1 $ 83.3 $43.0 $265.8 $1,149.3Additions for current year
acquisitions . . . . . . . . . . . . . . . . . — 2.3 — 26.0 9.2 37.5Adjustments to and additional
consideration for prior yearacquisitions . . . . . . . . . . . . . . . . . 1.4 — — — — 1.4
Impairment charge . . . . . . . . . . . . . — (142.6) — — — (142.6)Reclass to non-current assets held
for sale . . . . . . . . . . . . . . . . . . . . (13.2) (23.3) (83.3) — (14.2) (134.0)Goodwill written off related to sale
of business . . . . . . . . . . . . . . . . . (17.2) — — — — (17.2)Foreign currency translation
adjustment/other . . . . . . . . . . . . . 13.3 9.3 — .2 14.1 36.9
Balance as of December 31, 2007 . . . . . 401.4 185.8 — 69.2 274.9 931.3Additions for current year
acquisitions . . . . . . . . . . . . . . . . . .4 .5 — — — .9Adjustments to and additional
consideration for prior yearacquisitions . . . . . . . . . . . . . . . . . .5 8.9 — — .1 9.5
Reclass to non-current assets heldfor sale . . . . . . . . . . . . . . . . . . . . (6.5) — — — — (6.5)
Goodwill written off related to saleof business . . . . . . . . . . . . . . . . . (3.0) — — — — (3.0)
Foreign currency translationadjustment/other . . . . . . . . . . . . . (21.9) (12.6) — (1.0) (21.1) (56.6)
Balance as of December 31, 2008 . . . . $370.9 $ 182.6 $ — $68.2 $253.9 $ 875.6
In 2008 and 2007, the Company recorded goodwill impairment charges as outlined in Note C.
98
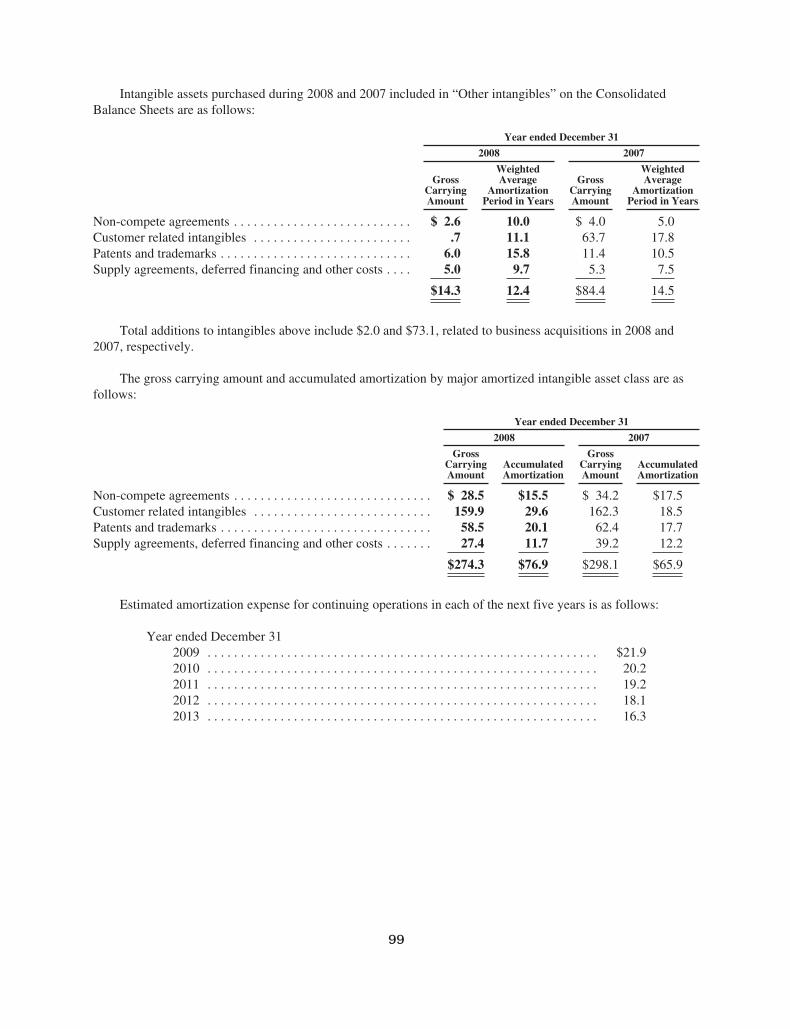
Intangible assets purchased during 2008 and 2007 included in “Other intangibles” on the ConsolidatedBalance Sheets are as follows:
Year ended December 31
2008 2007
GrossCarryingAmount
WeightedAverage
AmortizationPeriod in Years
GrossCarryingAmount
WeightedAverage
AmortizationPeriod in Years
Non-compete agreements . . . . . . . . . . . . . . . . . . . . . . . . . . . $ 2.6 10.0 $ 4.0 5.0Customer related intangibles . . . . . . . . . . . . . . . . . . . . . . . . .7 11.1 63.7 17.8Patents and trademarks . . . . . . . . . . . . . . . . . . . . . . . . . . . . . 6.0 15.8 11.4 10.5Supply agreements, deferred financing and other costs . . . . 5.0 9.7 5.3 7.5
$14.3 12.4 $84.4 14.5
Total additions to intangibles above include $2.0 and $73.1, related to business acquisitions in 2008 and2007, respectively.
The gross carrying amount and accumulated amortization by major amortized intangible asset class are asfollows:
Year ended December 31
2008 2007
GrossCarryingAmount
AccumulatedAmortization
GrossCarryingAmount
AccumulatedAmortization
Non-compete agreements . . . . . . . . . . . . . . . . . . . . . . . . . . . . . . $ 28.5 $15.5 $ 34.2 $17.5Customer related intangibles . . . . . . . . . . . . . . . . . . . . . . . . . . . 159.9 29.6 162.3 18.5Patents and trademarks . . . . . . . . . . . . . . . . . . . . . . . . . . . . . . . . 58.5 20.1 62.4 17.7Supply agreements, deferred financing and other costs . . . . . . . 27.4 11.7 39.2 12.2
$274.3 $76.9 $298.1 $65.9
Estimated amortization expense for continuing operations in each of the next five years is as follows:
Year ended December 312009 . . . . . . . . . . . . . . . . . . . . . . . . . . . . . . . . . . . . . . . . . . . . . . . . . . . . . . . . . . . $21.92010 . . . . . . . . . . . . . . . . . . . . . . . . . . . . . . . . . . . . . . . . . . . . . . . . . . . . . . . . . . . 20.22011 . . . . . . . . . . . . . . . . . . . . . . . . . . . . . . . . . . . . . . . . . . . . . . . . . . . . . . . . . . . 19.22012 . . . . . . . . . . . . . . . . . . . . . . . . . . . . . . . . . . . . . . . . . . . . . . . . . . . . . . . . . . . 18.12013 . . . . . . . . . . . . . . . . . . . . . . . . . . . . . . . . . . . . . . . . . . . . . . . . . . . . . . . . . . . 16.3
99
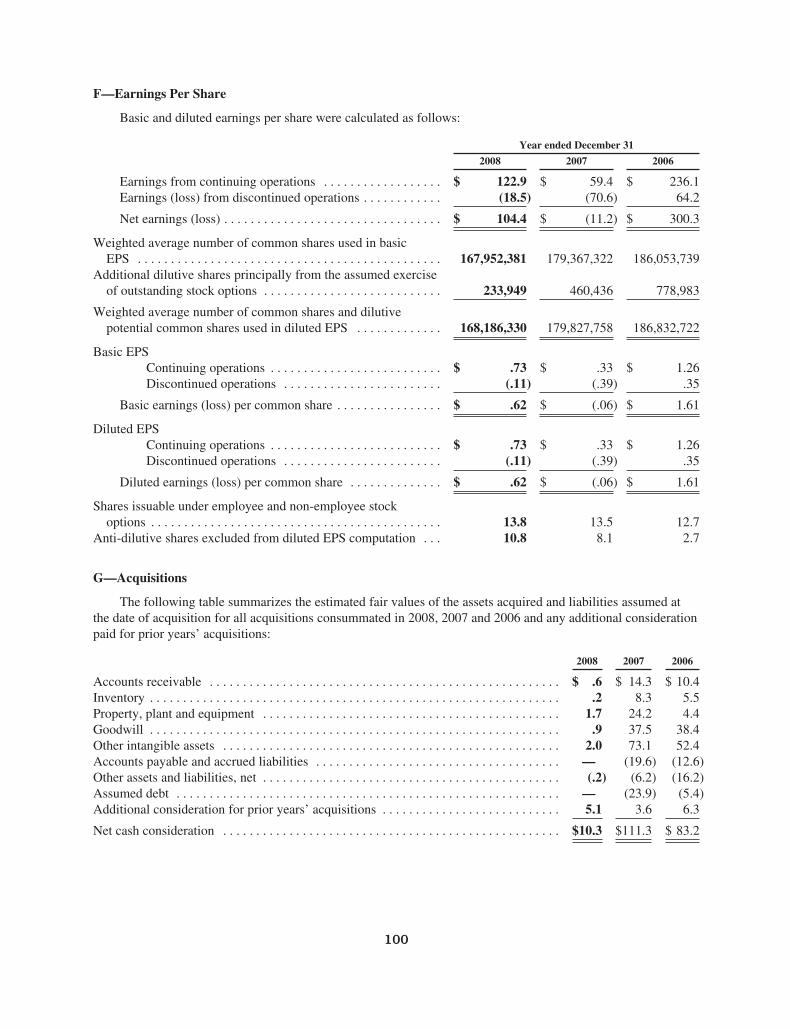
F—Earnings Per Share
Basic and diluted earnings per share were calculated as follows:
Year ended December 31
2008 2007 2006
Earnings from continuing operations . . . . . . . . . . . . . . . . . . $ 122.9 $ 59.4 $ 236.1Earnings (loss) from discontinued operations . . . . . . . . . . . . (18.5) (70.6) 64.2
Net earnings (loss) . . . . . . . . . . . . . . . . . . . . . . . . . . . . . . . . . $ 104.4 $ (11.2) $ 300.3
Weighted average number of common shares used in basicEPS . . . . . . . . . . . . . . . . . . . . . . . . . . . . . . . . . . . . . . . . . . . . . . 167,952,381 179,367,322 186,053,739
Additional dilutive shares principally from the assumed exerciseof outstanding stock options . . . . . . . . . . . . . . . . . . . . . . . . . . . 233,949 460,436 778,983
Weighted average number of common shares and dilutivepotential common shares used in diluted EPS . . . . . . . . . . . . . 168,186,330 179,827,758 186,832,722
Basic EPSContinuing operations . . . . . . . . . . . . . . . . . . . . . . . . . . $ .73 $ .33 $ 1.26Discontinued operations . . . . . . . . . . . . . . . . . . . . . . . . (.11) (.39) .35
Basic earnings (loss) per common share . . . . . . . . . . . . . . . . $ .62 $ (.06) $ 1.61
Diluted EPSContinuing operations . . . . . . . . . . . . . . . . . . . . . . . . . . $ .73 $ .33 $ 1.26Discontinued operations . . . . . . . . . . . . . . . . . . . . . . . . (.11) (.39) .35
Diluted earnings (loss) per common share . . . . . . . . . . . . . . $ .62 $ (.06) $ 1.61
Shares issuable under employee and non-employee stockoptions . . . . . . . . . . . . . . . . . . . . . . . . . . . . . . . . . . . . . . . . . . . . 13.8 13.5 12.7
Anti-dilutive shares excluded from diluted EPS computation . . . 10.8 8.1 2.7
G—Acquisitions
The following table summarizes the estimated fair values of the assets acquired and liabilities assumed atthe date of acquisition for all acquisitions consummated in 2008, 2007 and 2006 and any additional considerationpaid for prior years’ acquisitions:
2008 2007 2006
Accounts receivable . . . . . . . . . . . . . . . . . . . . . . . . . . . . . . . . . . . . . . . . . . . . . . . . . . . . . $ .6 $ 14.3 $ 10.4Inventory . . . . . . . . . . . . . . . . . . . . . . . . . . . . . . . . . . . . . . . . . . . . . . . . . . . . . . . . . . . . . . .2 8.3 5.5Property, plant and equipment . . . . . . . . . . . . . . . . . . . . . . . . . . . . . . . . . . . . . . . . . . . . . 1.7 24.2 4.4Goodwill . . . . . . . . . . . . . . . . . . . . . . . . . . . . . . . . . . . . . . . . . . . . . . . . . . . . . . . . . . . . . . .9 37.5 38.4Other intangible assets . . . . . . . . . . . . . . . . . . . . . . . . . . . . . . . . . . . . . . . . . . . . . . . . . . . 2.0 73.1 52.4Accounts payable and accrued liabilities . . . . . . . . . . . . . . . . . . . . . . . . . . . . . . . . . . . . . — (19.6) (12.6)Other assets and liabilities, net . . . . . . . . . . . . . . . . . . . . . . . . . . . . . . . . . . . . . . . . . . . . . (.2) (6.2) (16.2)Assumed debt . . . . . . . . . . . . . . . . . . . . . . . . . . . . . . . . . . . . . . . . . . . . . . . . . . . . . . . . . . — (23.9) (5.4)Additional consideration for prior years’ acquisitions . . . . . . . . . . . . . . . . . . . . . . . . . . . 5.1 3.6 6.3
Net cash consideration . . . . . . . . . . . . . . . . . . . . . . . . . . . . . . . . . . . . . . . . . . . . . . . . . . . $10.3 $111.3 $ 83.2
100
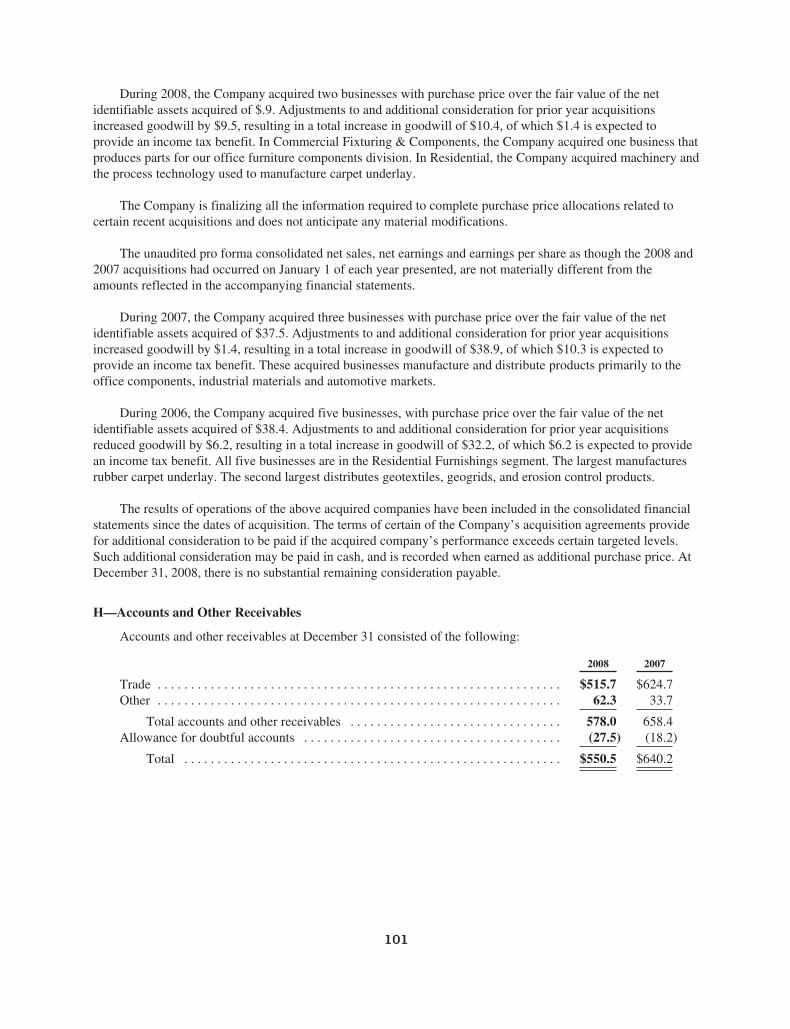
During 2008, the Company acquired two businesses with purchase price over the fair value of the netidentifiable assets acquired of $.9. Adjustments to and additional consideration for prior year acquisitionsincreased goodwill by $9.5, resulting in a total increase in goodwill of $10.4, of which $1.4 is expected toprovide an income tax benefit. In Commercial Fixturing & Components, the Company acquired one business thatproduces parts for our office furniture components division. In Residential, the Company acquired machinery andthe process technology used to manufacture carpet underlay.
The Company is finalizing all the information required to complete purchase price allocations related tocertain recent acquisitions and does not anticipate any material modifications.
The unaudited pro forma consolidated net sales, net earnings and earnings per share as though the 2008 and2007 acquisitions had occurred on January 1 of each year presented, are not materially different from theamounts reflected in the accompanying financial statements.
During 2007, the Company acquired three businesses with purchase price over the fair value of the netidentifiable assets acquired of $37.5. Adjustments to and additional consideration for prior year acquisitionsincreased goodwill by $1.4, resulting in a total increase in goodwill of $38.9, of which $10.3 is expected toprovide an income tax benefit. These acquired businesses manufacture and distribute products primarily to theoffice components, industrial materials and automotive markets.
During 2006, the Company acquired five businesses, with purchase price over the fair value of the netidentifiable assets acquired of $38.4. Adjustments to and additional consideration for prior year acquisitionsreduced goodwill by $6.2, resulting in a total increase in goodwill of $32.2, of which $6.2 is expected to providean income tax benefit. All five businesses are in the Residential Furnishings segment. The largest manufacturesrubber carpet underlay. The second largest distributes geotextiles, geogrids, and erosion control products.
The results of operations of the above acquired companies have been included in the consolidated financialstatements since the dates of acquisition. The terms of certain of the Company’s acquisition agreements providefor additional consideration to be paid if the acquired company’s performance exceeds certain targeted levels.Such additional consideration may be paid in cash, and is recorded when earned as additional purchase price. AtDecember 31, 2008, there is no substantial remaining consideration payable.
H—Accounts and Other Receivables
Accounts and other receivables at December 31 consisted of the following:
2008 2007
Trade . . . . . . . . . . . . . . . . . . . . . . . . . . . . . . . . . . . . . . . . . . . . . . . . . . . . . . . . . . . . . $515.7 $624.7Other . . . . . . . . . . . . . . . . . . . . . . . . . . . . . . . . . . . . . . . . . . . . . . . . . . . . . . . . . . . . . 62.3 33.7
Total accounts and other receivables . . . . . . . . . . . . . . . . . . . . . . . . . . . . . . . . 578.0 658.4Allowance for doubtful accounts . . . . . . . . . . . . . . . . . . . . . . . . . . . . . . . . . . . . . . . (27.5) (18.2)
Total . . . . . . . . . . . . . . . . . . . . . . . . . . . . . . . . . . . . . . . . . . . . . . . . . . . . . . . . . $550.5 $640.2
101
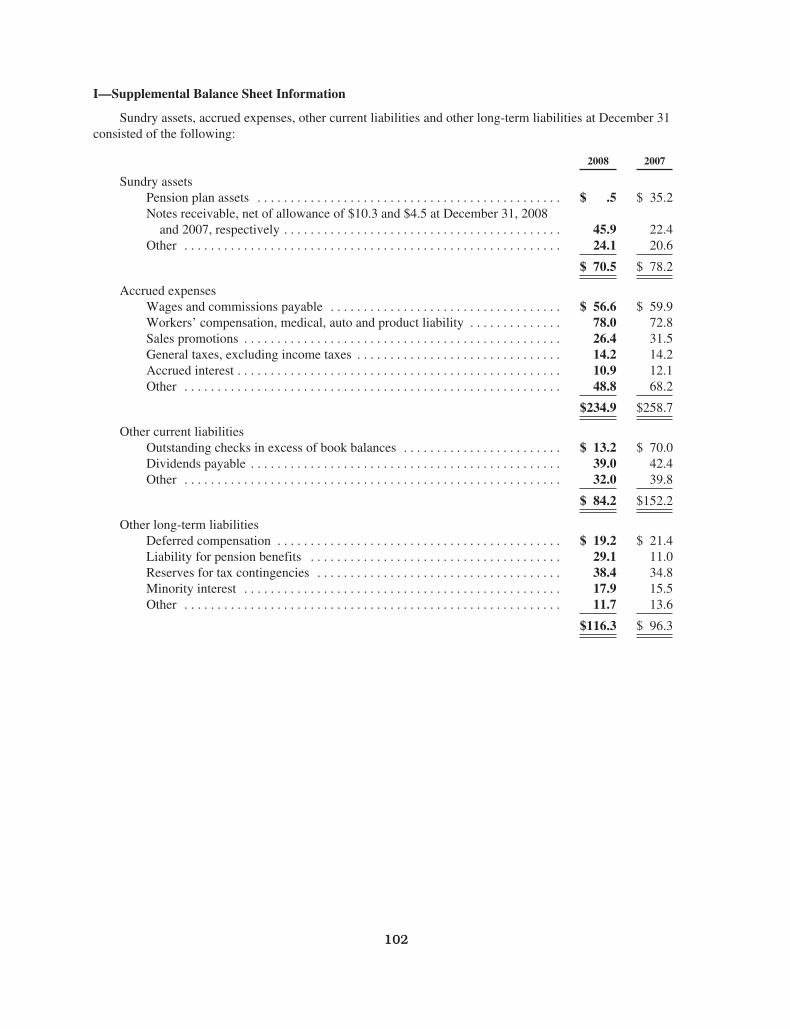
I—Supplemental Balance Sheet Information
Sundry assets, accrued expenses, other current liabilities and other long-term liabilities at December 31consisted of the following:
2008 2007
Sundry assetsPension plan assets . . . . . . . . . . . . . . . . . . . . . . . . . . . . . . . . . . . . . . . . . . . . . . $ .5 $ 35.2Notes receivable, net of allowance of $10.3 and $4.5 at December 31, 2008
and 2007, respectively . . . . . . . . . . . . . . . . . . . . . . . . . . . . . . . . . . . . . . . . . . 45.9 22.4Other . . . . . . . . . . . . . . . . . . . . . . . . . . . . . . . . . . . . . . . . . . . . . . . . . . . . . . . . . 24.1 20.6
$ 70.5 $ 78.2
Accrued expensesWages and commissions payable . . . . . . . . . . . . . . . . . . . . . . . . . . . . . . . . . . . $ 56.6 $ 59.9Workers’ compensation, medical, auto and product liability . . . . . . . . . . . . . . 78.0 72.8Sales promotions . . . . . . . . . . . . . . . . . . . . . . . . . . . . . . . . . . . . . . . . . . . . . . . . 26.4 31.5General taxes, excluding income taxes . . . . . . . . . . . . . . . . . . . . . . . . . . . . . . . 14.2 14.2Accrued interest . . . . . . . . . . . . . . . . . . . . . . . . . . . . . . . . . . . . . . . . . . . . . . . . . 10.9 12.1Other . . . . . . . . . . . . . . . . . . . . . . . . . . . . . . . . . . . . . . . . . . . . . . . . . . . . . . . . . 48.8 68.2
$234.9 $258.7
Other current liabilitiesOutstanding checks in excess of book balances . . . . . . . . . . . . . . . . . . . . . . . . $ 13.2 $ 70.0Dividends payable . . . . . . . . . . . . . . . . . . . . . . . . . . . . . . . . . . . . . . . . . . . . . . . 39.0 42.4Other . . . . . . . . . . . . . . . . . . . . . . . . . . . . . . . . . . . . . . . . . . . . . . . . . . . . . . . . . 32.0 39.8
$ 84.2 $152.2
Other long-term liabilitiesDeferred compensation . . . . . . . . . . . . . . . . . . . . . . . . . . . . . . . . . . . . . . . . . . . $ 19.2 $ 21.4Liability for pension benefits . . . . . . . . . . . . . . . . . . . . . . . . . . . . . . . . . . . . . . 29.1 11.0Reserves for tax contingencies . . . . . . . . . . . . . . . . . . . . . . . . . . . . . . . . . . . . . 38.4 34.8Minority interest . . . . . . . . . . . . . . . . . . . . . . . . . . . . . . . . . . . . . . . . . . . . . . . . 17.9 15.5Other . . . . . . . . . . . . . . . . . . . . . . . . . . . . . . . . . . . . . . . . . . . . . . . . . . . . . . . . . 11.7 13.6
$116.3 $ 96.3
102
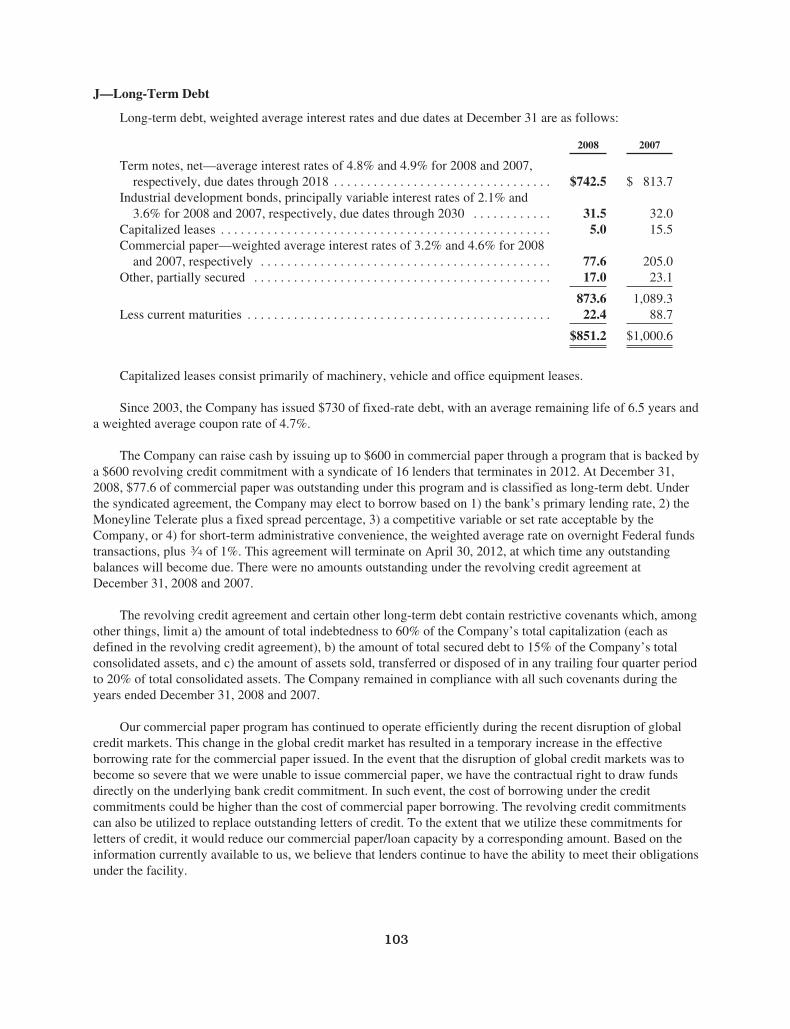
J—Long-Term Debt
Long-term debt, weighted average interest rates and due dates at December 31 are as follows:
2008 2007
Term notes, net—average interest rates of 4.8% and 4.9% for 2008 and 2007,respectively, due dates through 2018 . . . . . . . . . . . . . . . . . . . . . . . . . . . . . . . . . $742.5 $ 813.7
Industrial development bonds, principally variable interest rates of 2.1% and3.6% for 2008 and 2007, respectively, due dates through 2030 . . . . . . . . . . . . 31.5 32.0
Capitalized leases . . . . . . . . . . . . . . . . . . . . . . . . . . . . . . . . . . . . . . . . . . . . . . . . . . 5.0 15.5Commercial paper—weighted average interest rates of 3.2% and 4.6% for 2008
and 2007, respectively . . . . . . . . . . . . . . . . . . . . . . . . . . . . . . . . . . . . . . . . . . . . 77.6 205.0Other, partially secured . . . . . . . . . . . . . . . . . . . . . . . . . . . . . . . . . . . . . . . . . . . . . 17.0 23.1
873.6 1,089.3Less current maturities . . . . . . . . . . . . . . . . . . . . . . . . . . . . . . . . . . . . . . . . . . . . . . 22.4 88.7
$851.2 $1,000.6
Capitalized leases consist primarily of machinery, vehicle and office equipment leases.
Since 2003, the Company has issued $730 of fixed-rate debt, with an average remaining life of 6.5 years anda weighted average coupon rate of 4.7%.
The Company can raise cash by issuing up to $600 in commercial paper through a program that is backed bya $600 revolving credit commitment with a syndicate of 16 lenders that terminates in 2012. At December 31,2008, $77.6 of commercial paper was outstanding under this program and is classified as long-term debt. Underthe syndicated agreement, the Company may elect to borrow based on 1) the bank’s primary lending rate, 2) theMoneyline Telerate plus a fixed spread percentage, 3) a competitive variable or set rate acceptable by theCompany, or 4) for short-term administrative convenience, the weighted average rate on overnight Federal fundstransactions, plus 3⁄4 of 1%. This agreement will terminate on April 30, 2012, at which time any outstandingbalances will become due. There were no amounts outstanding under the revolving credit agreement atDecember 31, 2008 and 2007.
The revolving credit agreement and certain other long-term debt contain restrictive covenants which, amongother things, limit a) the amount of total indebtedness to 60% of the Company’s total capitalization (each asdefined in the revolving credit agreement), b) the amount of total secured debt to 15% of the Company’s totalconsolidated assets, and c) the amount of assets sold, transferred or disposed of in any trailing four quarter periodto 20% of total consolidated assets. The Company remained in compliance with all such covenants during theyears ended December 31, 2008 and 2007.
Our commercial paper program has continued to operate efficiently during the recent disruption of globalcredit markets. This change in the global credit market has resulted in a temporary increase in the effectiveborrowing rate for the commercial paper issued. In the event that the disruption of global credit markets was tobecome so severe that we were unable to issue commercial paper, we have the contractual right to draw fundsdirectly on the underlying bank credit commitment. In such event, the cost of borrowing under the creditcommitments could be higher than the cost of commercial paper borrowing. The revolving credit commitmentscan also be utilized to replace outstanding letters of credit. To the extent that we utilize these commitments forletters of credit, it would reduce our commercial paper/loan capacity by a corresponding amount. Based on theinformation currently available to us, we believe that lenders continue to have the ability to meet their obligationsunder the facility.
103
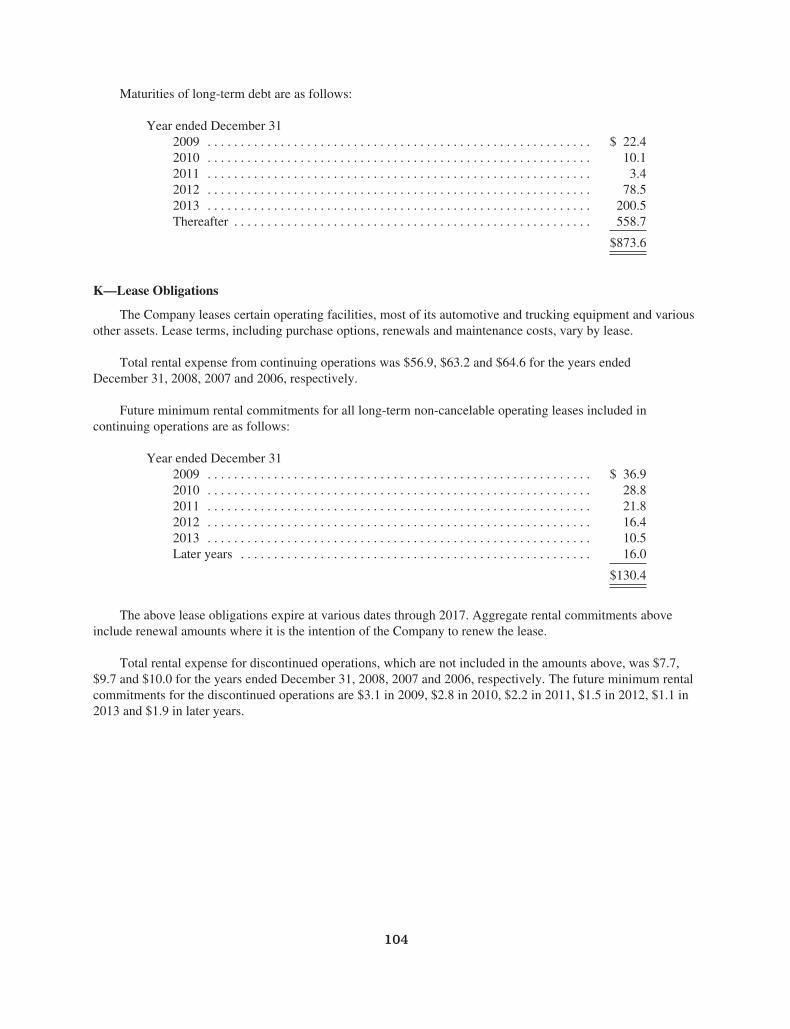
Maturities of long-term debt are as follows:
Year ended December 312009 . . . . . . . . . . . . . . . . . . . . . . . . . . . . . . . . . . . . . . . . . . . . . . . . . . . . . . . . . . $ 22.42010 . . . . . . . . . . . . . . . . . . . . . . . . . . . . . . . . . . . . . . . . . . . . . . . . . . . . . . . . . . 10.12011 . . . . . . . . . . . . . . . . . . . . . . . . . . . . . . . . . . . . . . . . . . . . . . . . . . . . . . . . . . 3.42012 . . . . . . . . . . . . . . . . . . . . . . . . . . . . . . . . . . . . . . . . . . . . . . . . . . . . . . . . . . 78.52013 . . . . . . . . . . . . . . . . . . . . . . . . . . . . . . . . . . . . . . . . . . . . . . . . . . . . . . . . . . 200.5Thereafter . . . . . . . . . . . . . . . . . . . . . . . . . . . . . . . . . . . . . . . . . . . . . . . . . . . . . . 558.7
$873.6
K—Lease Obligations
The Company leases certain operating facilities, most of its automotive and trucking equipment and variousother assets. Lease terms, including purchase options, renewals and maintenance costs, vary by lease.
Total rental expense from continuing operations was $56.9, $63.2 and $64.6 for the years endedDecember 31, 2008, 2007 and 2006, respectively.
Future minimum rental commitments for all long-term non-cancelable operating leases included incontinuing operations are as follows:
Year ended December 312009 . . . . . . . . . . . . . . . . . . . . . . . . . . . . . . . . . . . . . . . . . . . . . . . . . . . . . . . . . . $ 36.92010 . . . . . . . . . . . . . . . . . . . . . . . . . . . . . . . . . . . . . . . . . . . . . . . . . . . . . . . . . . 28.82011 . . . . . . . . . . . . . . . . . . . . . . . . . . . . . . . . . . . . . . . . . . . . . . . . . . . . . . . . . . 21.82012 . . . . . . . . . . . . . . . . . . . . . . . . . . . . . . . . . . . . . . . . . . . . . . . . . . . . . . . . . . 16.42013 . . . . . . . . . . . . . . . . . . . . . . . . . . . . . . . . . . . . . . . . . . . . . . . . . . . . . . . . . . 10.5Later years . . . . . . . . . . . . . . . . . . . . . . . . . . . . . . . . . . . . . . . . . . . . . . . . . . . . . 16.0
$130.4
The above lease obligations expire at various dates through 2017. Aggregate rental commitments aboveinclude renewal amounts where it is the intention of the Company to renew the lease.
Total rental expense for discontinued operations, which are not included in the amounts above, was $7.7,$9.7 and $10.0 for the years ended December 31, 2008, 2007 and 2006, respectively. The future minimum rentalcommitments for the discontinued operations are $3.1 in 2009, $2.8 in 2010, $2.2 in 2011, $1.5 in 2012, $1.1 in2013 and $1.9 in later years.
104
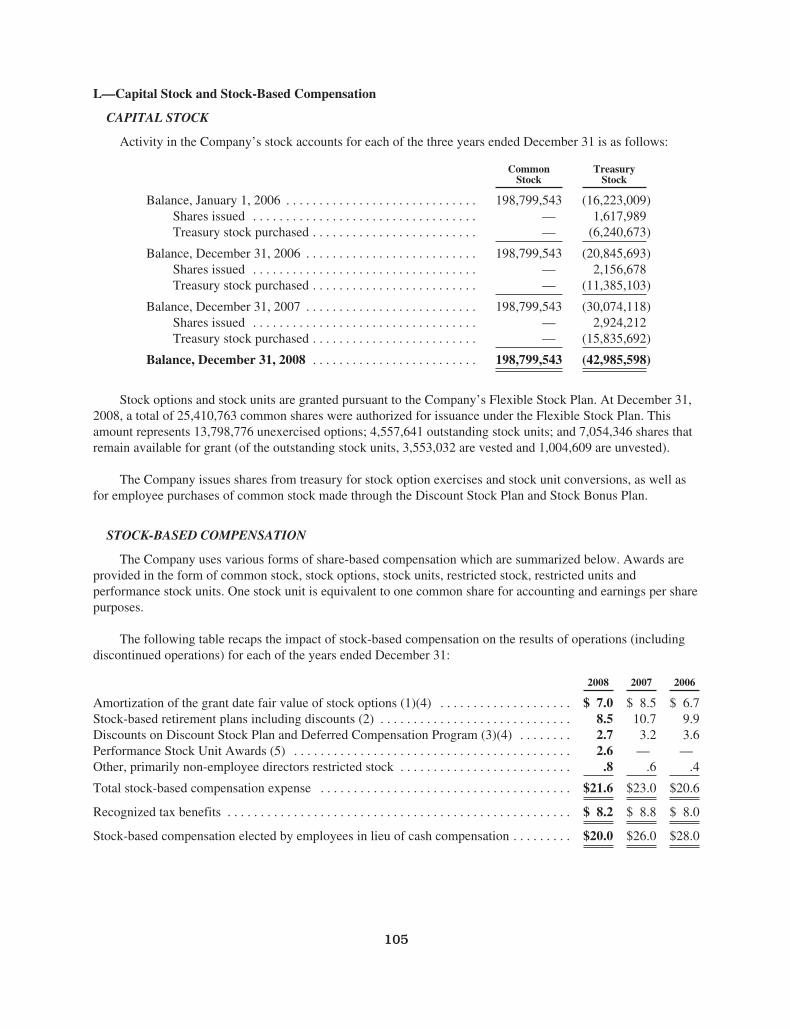
L—Capital Stock and Stock-Based Compensation
CAPITAL STOCK
Activity in the Company’s stock accounts for each of the three years ended December 31 is as follows:
CommonStock
TreasuryStock
Balance, January 1, 2006 . . . . . . . . . . . . . . . . . . . . . . . . . . . . . 198,799,543 (16,223,009)Shares issued . . . . . . . . . . . . . . . . . . . . . . . . . . . . . . . . . . — 1,617,989Treasury stock purchased . . . . . . . . . . . . . . . . . . . . . . . . . — (6,240,673)
Balance, December 31, 2006 . . . . . . . . . . . . . . . . . . . . . . . . . . 198,799,543 (20,845,693)Shares issued . . . . . . . . . . . . . . . . . . . . . . . . . . . . . . . . . . — 2,156,678Treasury stock purchased . . . . . . . . . . . . . . . . . . . . . . . . . — (11,385,103)
Balance, December 31, 2007 . . . . . . . . . . . . . . . . . . . . . . . . . . 198,799,543 (30,074,118)Shares issued . . . . . . . . . . . . . . . . . . . . . . . . . . . . . . . . . . — 2,924,212Treasury stock purchased . . . . . . . . . . . . . . . . . . . . . . . . . — (15,835,692)
Balance, December 31, 2008 . . . . . . . . . . . . . . . . . . . . . . . . . 198,799,543 (42,985,598)
Stock options and stock units are granted pursuant to the Company’s Flexible Stock Plan. At December 31,2008, a total of 25,410,763 common shares were authorized for issuance under the Flexible Stock Plan. Thisamount represents 13,798,776 unexercised options; 4,557,641 outstanding stock units; and 7,054,346 shares thatremain available for grant (of the outstanding stock units, 3,553,032 are vested and 1,004,609 are unvested).
The Company issues shares from treasury for stock option exercises and stock unit conversions, as well asfor employee purchases of common stock made through the Discount Stock Plan and Stock Bonus Plan.
STOCK-BASED COMPENSATION
The Company uses various forms of share-based compensation which are summarized below. Awards areprovided in the form of common stock, stock options, stock units, restricted stock, restricted units andperformance stock units. One stock unit is equivalent to one common share for accounting and earnings per sharepurposes.
The following table recaps the impact of stock-based compensation on the results of operations (includingdiscontinued operations) for each of the years ended December 31:
2008 2007 2006
Amortization of the grant date fair value of stock options (1)(4) . . . . . . . . . . . . . . . . . . . . $ 7.0 $ 8.5 $ 6.7Stock-based retirement plans including discounts (2) . . . . . . . . . . . . . . . . . . . . . . . . . . . . . 8.5 10.7 9.9Discounts on Discount Stock Plan and Deferred Compensation Program (3)(4) . . . . . . . . 2.7 3.2 3.6Performance Stock Unit Awards (5) . . . . . . . . . . . . . . . . . . . . . . . . . . . . . . . . . . . . . . . . . . 2.6 — —Other, primarily non-employee directors restricted stock . . . . . . . . . . . . . . . . . . . . . . . . . . .8 .6 .4
Total stock-based compensation expense . . . . . . . . . . . . . . . . . . . . . . . . . . . . . . . . . . . . . . $21.6 $23.0 $20.6
Recognized tax benefits . . . . . . . . . . . . . . . . . . . . . . . . . . . . . . . . . . . . . . . . . . . . . . . . . . . . $ 8.2 $ 8.8 $ 8.0
Stock-based compensation elected by employees in lieu of cash compensation . . . . . . . . . $20.0 $26.0 $28.0
105
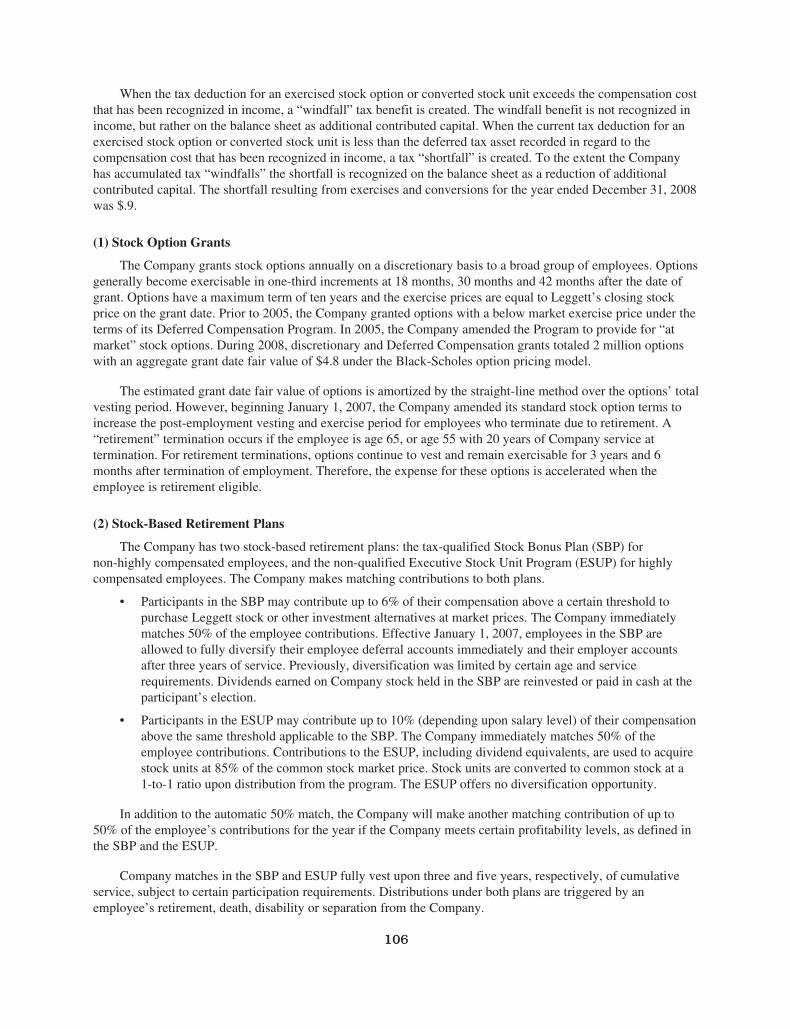
When the tax deduction for an exercised stock option or converted stock unit exceeds the compensation costthat has been recognized in income, a “windfall” tax benefit is created. The windfall benefit is not recognized inincome, but rather on the balance sheet as additional contributed capital. When the current tax deduction for anexercised stock option or converted stock unit is less than the deferred tax asset recorded in regard to thecompensation cost that has been recognized in income, a tax “shortfall” is created. To the extent the Companyhas accumulated tax “windfalls” the shortfall is recognized on the balance sheet as a reduction of additionalcontributed capital. The shortfall resulting from exercises and conversions for the year ended December 31, 2008was $.9.
(1) Stock Option Grants
The Company grants stock options annually on a discretionary basis to a broad group of employees. Optionsgenerally become exercisable in one-third increments at 18 months, 30 months and 42 months after the date ofgrant. Options have a maximum term of ten years and the exercise prices are equal to Leggett’s closing stockprice on the grant date. Prior to 2005, the Company granted options with a below market exercise price under theterms of its Deferred Compensation Program. In 2005, the Company amended the Program to provide for “atmarket” stock options. During 2008, discretionary and Deferred Compensation grants totaled 2 million optionswith an aggregate grant date fair value of $4.8 under the Black-Scholes option pricing model.
The estimated grant date fair value of options is amortized by the straight-line method over the options’ totalvesting period. However, beginning January 1, 2007, the Company amended its standard stock option terms toincrease the post-employment vesting and exercise period for employees who terminate due to retirement. A“retirement” termination occurs if the employee is age 65, or age 55 with 20 years of Company service attermination. For retirement terminations, options continue to vest and remain exercisable for 3 years and 6months after termination of employment. Therefore, the expense for these options is accelerated when theemployee is retirement eligible.
(2) Stock-Based Retirement Plans
The Company has two stock-based retirement plans: the tax-qualified Stock Bonus Plan (SBP) fornon-highly compensated employees, and the non-qualified Executive Stock Unit Program (ESUP) for highlycompensated employees. The Company makes matching contributions to both plans.
• Participants in the SBP may contribute up to 6% of their compensation above a certain threshold topurchase Leggett stock or other investment alternatives at market prices. The Company immediatelymatches 50% of the employee contributions. Effective January 1, 2007, employees in the SBP areallowed to fully diversify their employee deferral accounts immediately and their employer accountsafter three years of service. Previously, diversification was limited by certain age and servicerequirements. Dividends earned on Company stock held in the SBP are reinvested or paid in cash at theparticipant’s election.
• Participants in the ESUP may contribute up to 10% (depending upon salary level) of their compensationabove the same threshold applicable to the SBP. The Company immediately matches 50% of theemployee contributions. Contributions to the ESUP, including dividend equivalents, are used to acquirestock units at 85% of the common stock market price. Stock units are converted to common stock at a1-to-1 ratio upon distribution from the program. The ESUP offers no diversification opportunity.
In addition to the automatic 50% match, the Company will make another matching contribution of up to50% of the employee’s contributions for the year if the Company meets certain profitability levels, as defined inthe SBP and the ESUP.
Company matches in the SBP and ESUP fully vest upon three and five years, respectively, of cumulativeservice, subject to certain participation requirements. Distributions under both plans are triggered by anemployee’s retirement, death, disability or separation from the Company.
106
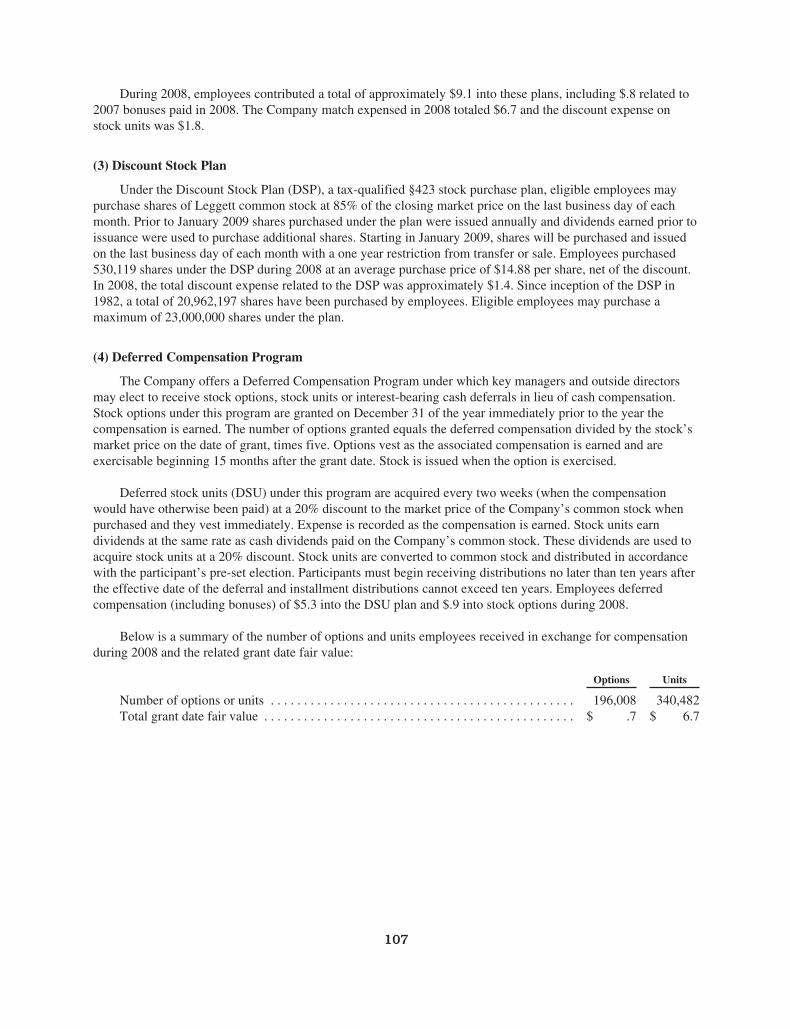
During 2008, employees contributed a total of approximately $9.1 into these plans, including $.8 related to2007 bonuses paid in 2008. The Company match expensed in 2008 totaled $6.7 and the discount expense onstock units was $1.8.
(3) Discount Stock Plan
Under the Discount Stock Plan (DSP), a tax-qualified §423 stock purchase plan, eligible employees maypurchase shares of Leggett common stock at 85% of the closing market price on the last business day of eachmonth. Prior to January 2009 shares purchased under the plan were issued annually and dividends earned prior toissuance were used to purchase additional shares. Starting in January 2009, shares will be purchased and issuedon the last business day of each month with a one year restriction from transfer or sale. Employees purchased530,119 shares under the DSP during 2008 at an average purchase price of $14.88 per share, net of the discount.In 2008, the total discount expense related to the DSP was approximately $1.4. Since inception of the DSP in1982, a total of 20,962,197 shares have been purchased by employees. Eligible employees may purchase amaximum of 23,000,000 shares under the plan.
(4) Deferred Compensation Program
The Company offers a Deferred Compensation Program under which key managers and outside directorsmay elect to receive stock options, stock units or interest-bearing cash deferrals in lieu of cash compensation.Stock options under this program are granted on December 31 of the year immediately prior to the year thecompensation is earned. The number of options granted equals the deferred compensation divided by the stock’smarket price on the date of grant, times five. Options vest as the associated compensation is earned and areexercisable beginning 15 months after the grant date. Stock is issued when the option is exercised.
Deferred stock units (DSU) under this program are acquired every two weeks (when the compensationwould have otherwise been paid) at a 20% discount to the market price of the Company’s common stock whenpurchased and they vest immediately. Expense is recorded as the compensation is earned. Stock units earndividends at the same rate as cash dividends paid on the Company’s common stock. These dividends are used toacquire stock units at a 20% discount. Stock units are converted to common stock and distributed in accordancewith the participant’s pre-set election. Participants must begin receiving distributions no later than ten years afterthe effective date of the deferral and installment distributions cannot exceed ten years. Employees deferredcompensation (including bonuses) of $5.3 into the DSU plan and $.9 into stock options during 2008.
Below is a summary of the number of options and units employees received in exchange for compensationduring 2008 and the related grant date fair value:
Options Units
Number of options or units . . . . . . . . . . . . . . . . . . . . . . . . . . . . . . . . . . . . . . . . . . . . . . 196,008 340,482Total grant date fair value . . . . . . . . . . . . . . . . . . . . . . . . . . . . . . . . . . . . . . . . . . . . . . . $ .7 $ 6.7
107
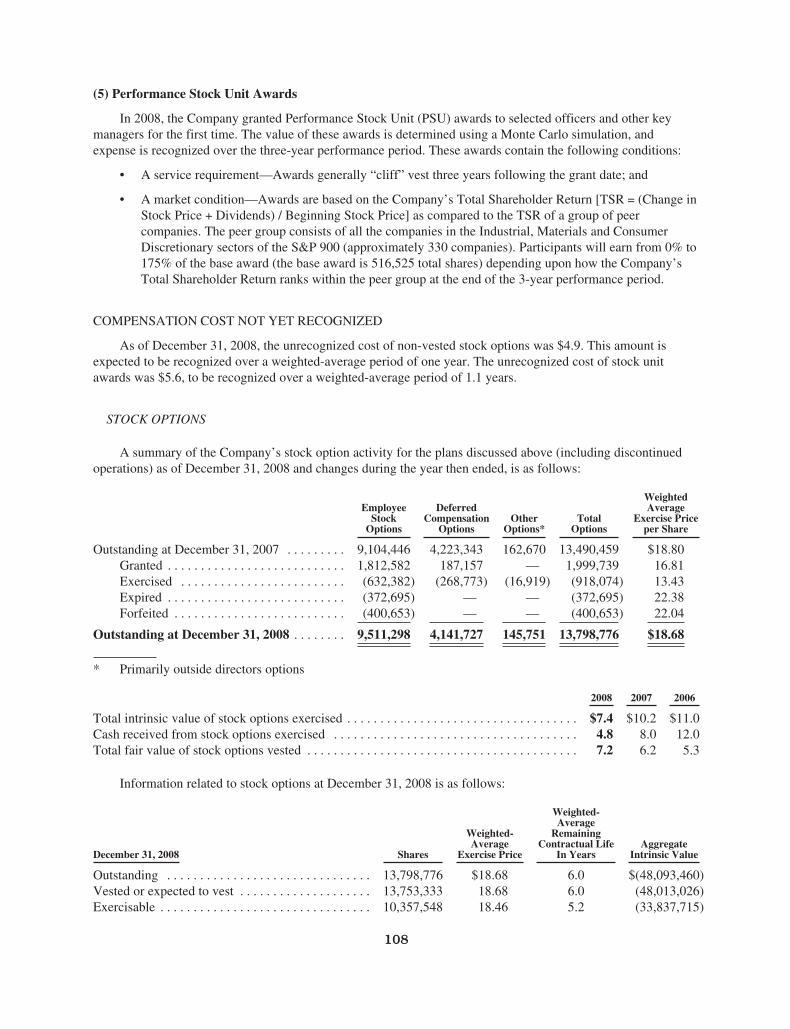
(5) Performance Stock Unit Awards
In 2008, the Company granted Performance Stock Unit (PSU) awards to selected officers and other keymanagers for the first time. The value of these awards is determined using a Monte Carlo simulation, andexpense is recognized over the three-year performance period. These awards contain the following conditions:
• A service requirement—Awards generally “cliff” vest three years following the grant date; and
• A market condition—Awards are based on the Company’s Total Shareholder Return [TSR = (Change inStock Price + Dividends) / Beginning Stock Price] as compared to the TSR of a group of peercompanies. The peer group consists of all the companies in the Industrial, Materials and ConsumerDiscretionary sectors of the S&P 900 (approximately 330 companies). Participants will earn from 0% to175% of the base award (the base award is 516,525 total shares) depending upon how the Company’sTotal Shareholder Return ranks within the peer group at the end of the 3-year performance period.
COMPENSATION COST NOT YET RECOGNIZED
As of December 31, 2008, the unrecognized cost of non-vested stock options was $4.9. This amount isexpected to be recognized over a weighted-average period of one year. The unrecognized cost of stock unitawards was $5.6, to be recognized over a weighted-average period of 1.1 years.
STOCK OPTIONS
A summary of the Company’s stock option activity for the plans discussed above (including discontinuedoperations) as of December 31, 2008 and changes during the year then ended, is as follows:
EmployeeStock
Options
DeferredCompensation
OptionsOther
Options*Total
Options
WeightedAverage
Exercise Priceper Share
Outstanding at December 31, 2007 . . . . . . . . . 9,104,446 4,223,343 162,670 13,490,459 $18.80Granted . . . . . . . . . . . . . . . . . . . . . . . . . . . 1,812,582 187,157 — 1,999,739 16.81Exercised . . . . . . . . . . . . . . . . . . . . . . . . . (632,382) (268,773) (16,919) (918,074) 13.43Expired . . . . . . . . . . . . . . . . . . . . . . . . . . . (372,695) — — (372,695) 22.38Forfeited . . . . . . . . . . . . . . . . . . . . . . . . . . (400,653) — — (400,653) 22.04
Outstanding at December 31, 2008 . . . . . . . . 9,511,298 4,141,727 145,751 13,798,776 $18.68
* Primarily outside directors options
2008 2007 2006
Total intrinsic value of stock options exercised . . . . . . . . . . . . . . . . . . . . . . . . . . . . . . . . . . . $7.4 $10.2 $11.0Cash received from stock options exercised . . . . . . . . . . . . . . . . . . . . . . . . . . . . . . . . . . . . . 4.8 8.0 12.0Total fair value of stock options vested . . . . . . . . . . . . . . . . . . . . . . . . . . . . . . . . . . . . . . . . . 7.2 6.2 5.3
Information related to stock options at December 31, 2008 is as follows:
December 31, 2008 Shares
Weighted-Average
Exercise Price
Weighted-Average
RemainingContractual Life
In YearsAggregate
Intrinsic Value
Outstanding . . . . . . . . . . . . . . . . . . . . . . . . . . . . . . . 13,798,776 $18.68 6.0 $(48,093,460)Vested or expected to vest . . . . . . . . . . . . . . . . . . . . 13,753,333 18.68 6.0 (48,013,026)Exercisable . . . . . . . . . . . . . . . . . . . . . . . . . . . . . . . . 10,357,548 18.46 5.2 (33,837,715)
108
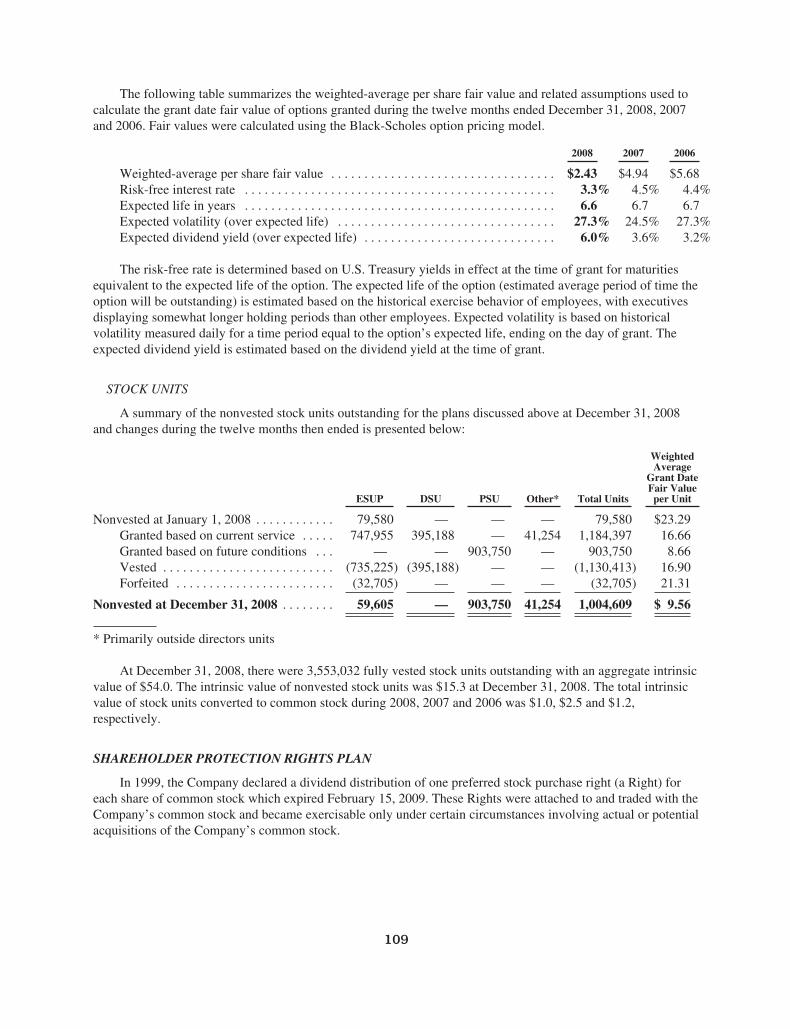
The following table summarizes the weighted-average per share fair value and related assumptions used tocalculate the grant date fair value of options granted during the twelve months ended December 31, 2008, 2007and 2006. Fair values were calculated using the Black-Scholes option pricing model.
2008 2007 2006
Weighted-average per share fair value . . . . . . . . . . . . . . . . . . . . . . . . . . . . . . . . . . $2.43 $4.94 $5.68Risk-free interest rate . . . . . . . . . . . . . . . . . . . . . . . . . . . . . . . . . . . . . . . . . . . . . . . 3.3% 4.5% 4.4%Expected life in years . . . . . . . . . . . . . . . . . . . . . . . . . . . . . . . . . . . . . . . . . . . . . . . 6.6 6.7 6.7Expected volatility (over expected life) . . . . . . . . . . . . . . . . . . . . . . . . . . . . . . . . . 27.3% 24.5% 27.3%Expected dividend yield (over expected life) . . . . . . . . . . . . . . . . . . . . . . . . . . . . . 6.0% 3.6% 3.2%
The risk-free rate is determined based on U.S. Treasury yields in effect at the time of grant for maturitiesequivalent to the expected life of the option. The expected life of the option (estimated average period of time theoption will be outstanding) is estimated based on the historical exercise behavior of employees, with executivesdisplaying somewhat longer holding periods than other employees. Expected volatility is based on historicalvolatility measured daily for a time period equal to the option’s expected life, ending on the day of grant. Theexpected dividend yield is estimated based on the dividend yield at the time of grant.
STOCK UNITS
A summary of the nonvested stock units outstanding for the plans discussed above at December 31, 2008and changes during the twelve months then ended is presented below:
ESUP DSU PSU Other* Total Units
WeightedAverage
Grant DateFair Valueper Unit
Nonvested at January 1, 2008 . . . . . . . . . . . . 79,580 — — — 79,580 $23.29Granted based on current service . . . . . 747,955 395,188 — 41,254 1,184,397 16.66Granted based on future conditions . . . — — 903,750 — 903,750 8.66Vested . . . . . . . . . . . . . . . . . . . . . . . . . . (735,225) (395,188) — — (1,130,413) 16.90Forfeited . . . . . . . . . . . . . . . . . . . . . . . . (32,705) — — — (32,705) 21.31
Nonvested at December 31, 2008 . . . . . . . . 59,605 — 903,750 41,254 1,004,609 $ 9.56
* Primarily outside directors units
At December 31, 2008, there were 3,553,032 fully vested stock units outstanding with an aggregate intrinsicvalue of $54.0. The intrinsic value of nonvested stock units was $15.3 at December 31, 2008. The total intrinsicvalue of stock units converted to common stock during 2008, 2007 and 2006 was $1.0, $2.5 and $1.2,respectively.
SHAREHOLDER PROTECTION RIGHTS PLAN
In 1999, the Company declared a dividend distribution of one preferred stock purchase right (a Right) foreach share of common stock which expired February 15, 2009. These Rights were attached to and traded with theCompany’s common stock and became exercisable only under certain circumstances involving actual or potentialacquisitions of the Company’s common stock.
109
M—Employee Benefit Plans
On January 1, 2008, the Company adopted SFAS No. 158, “Employers’ Accounting for Defined BenefitPension and Other Postretirement Plans” which requires it to measure the funded status of its plans as of year endbeginning with its December 31, 2008 balance sheet. The Company previously used September 30 as themeasurement date for its most significant plans. The Company chose to perform a measurement that covered the15-month period of October 1, 2007 through December 31, 2008. Upon implementation, a proportionateallocation was made to cover the net benefit income for the transition period and the Company recorded a $.5(net of tax) increase to beginning retained earnings on January 1, 2008.
The accompanying balance sheets as of December 31, 2008 and 2007 reflect as an asset or liability thefunded status of the Company’s domestic and foreign defined benefit pension plans as of their respectivemeasurement dates.
110
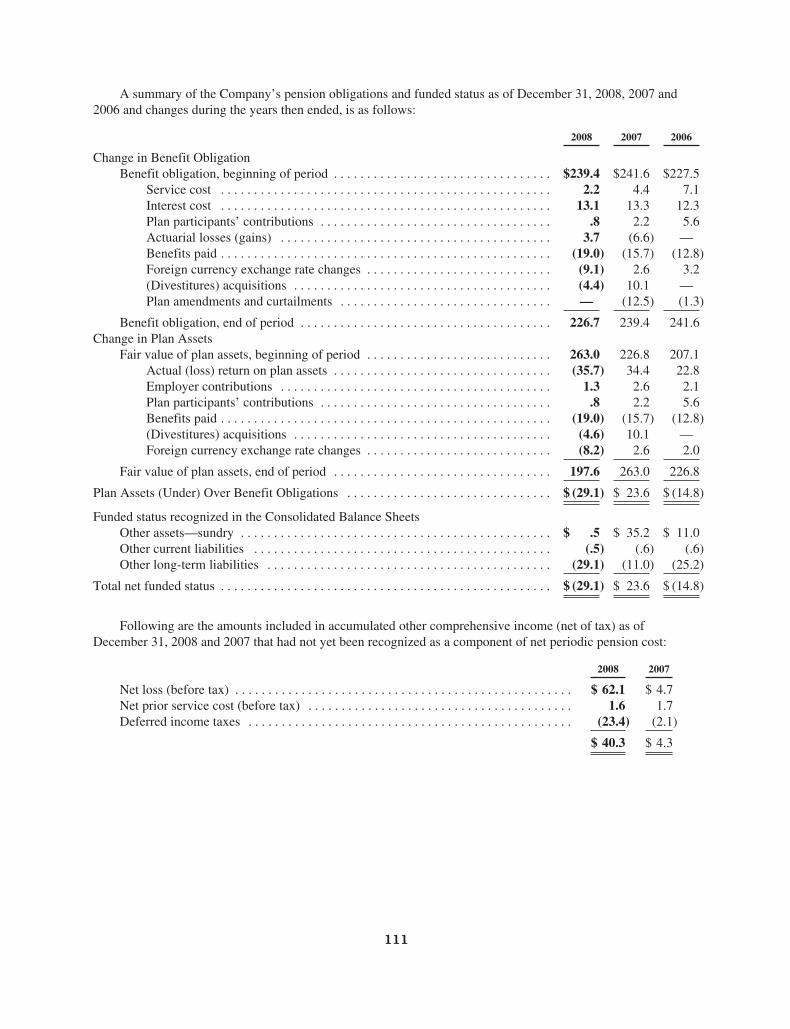
A summary of the Company’s pension obligations and funded status as of December 31, 2008, 2007 and2006 and changes during the years then ended, is as follows:
2008 2007 2006
Change in Benefit ObligationBenefit obligation, beginning of period . . . . . . . . . . . . . . . . . . . . . . . . . . . . . . . . . $239.4 $241.6 $227.5
Service cost . . . . . . . . . . . . . . . . . . . . . . . . . . . . . . . . . . . . . . . . . . . . . . . . . . 2.2 4.4 7.1Interest cost . . . . . . . . . . . . . . . . . . . . . . . . . . . . . . . . . . . . . . . . . . . . . . . . . . 13.1 13.3 12.3Plan participants’ contributions . . . . . . . . . . . . . . . . . . . . . . . . . . . . . . . . . . . .8 2.2 5.6Actuarial losses (gains) . . . . . . . . . . . . . . . . . . . . . . . . . . . . . . . . . . . . . . . . . 3.7 (6.6) —Benefits paid . . . . . . . . . . . . . . . . . . . . . . . . . . . . . . . . . . . . . . . . . . . . . . . . . . (19.0) (15.7) (12.8)Foreign currency exchange rate changes . . . . . . . . . . . . . . . . . . . . . . . . . . . . (9.1) 2.6 3.2(Divestitures) acquisitions . . . . . . . . . . . . . . . . . . . . . . . . . . . . . . . . . . . . . . . (4.4) 10.1 —Plan amendments and curtailments . . . . . . . . . . . . . . . . . . . . . . . . . . . . . . . . — (12.5) (1.3)
Benefit obligation, end of period . . . . . . . . . . . . . . . . . . . . . . . . . . . . . . . . . . . . . . 226.7 239.4 241.6Change in Plan Assets
Fair value of plan assets, beginning of period . . . . . . . . . . . . . . . . . . . . . . . . . . . . 263.0 226.8 207.1Actual (loss) return on plan assets . . . . . . . . . . . . . . . . . . . . . . . . . . . . . . . . . (35.7) 34.4 22.8Employer contributions . . . . . . . . . . . . . . . . . . . . . . . . . . . . . . . . . . . . . . . . . 1.3 2.6 2.1Plan participants’ contributions . . . . . . . . . . . . . . . . . . . . . . . . . . . . . . . . . . . .8 2.2 5.6Benefits paid . . . . . . . . . . . . . . . . . . . . . . . . . . . . . . . . . . . . . . . . . . . . . . . . . . (19.0) (15.7) (12.8)(Divestitures) acquisitions . . . . . . . . . . . . . . . . . . . . . . . . . . . . . . . . . . . . . . . (4.6) 10.1 —Foreign currency exchange rate changes . . . . . . . . . . . . . . . . . . . . . . . . . . . . (8.2) 2.6 2.0
Fair value of plan assets, end of period . . . . . . . . . . . . . . . . . . . . . . . . . . . . . . . . . 197.6 263.0 226.8
Plan Assets (Under) Over Benefit Obligations . . . . . . . . . . . . . . . . . . . . . . . . . . . . . . . $ (29.1) $ 23.6 $ (14.8)
Funded status recognized in the Consolidated Balance SheetsOther assets—sundry . . . . . . . . . . . . . . . . . . . . . . . . . . . . . . . . . . . . . . . . . . . . . . . $ .5 $ 35.2 $ 11.0Other current liabilities . . . . . . . . . . . . . . . . . . . . . . . . . . . . . . . . . . . . . . . . . . . . . (.5) (.6) (.6)Other long-term liabilities . . . . . . . . . . . . . . . . . . . . . . . . . . . . . . . . . . . . . . . . . . . (29.1) (11.0) (25.2)
Total net funded status . . . . . . . . . . . . . . . . . . . . . . . . . . . . . . . . . . . . . . . . . . . . . . . . . . $ (29.1) $ 23.6 $ (14.8)
Following are the amounts included in accumulated other comprehensive income (net of tax) as ofDecember 31, 2008 and 2007 that had not yet been recognized as a component of net periodic pension cost:
2008 2007
Net loss (before tax) . . . . . . . . . . . . . . . . . . . . . . . . . . . . . . . . . . . . . . . . . . . . . . . . . . . $ 62.1 $ 4.7Net prior service cost (before tax) . . . . . . . . . . . . . . . . . . . . . . . . . . . . . . . . . . . . . . . . 1.6 1.7Deferred income taxes . . . . . . . . . . . . . . . . . . . . . . . . . . . . . . . . . . . . . . . . . . . . . . . . . (23.4) (2.1)
$ 40.3 $ 4.3
111

Other changes in plan assets and benefit obligations recognized in other comprehensive income during theyear ended December 31, 2008:
Net actuarial loss . . . . . . . . . . . . . . . . . . . . . . . . . . . . . . . . . . . . . . . . . . . . . . . . . . . . . $ 57.4Amortization of net actuarial loss . . . . . . . . . . . . . . . . . . . . . . . . . . . . . . . . . . . . . . . . (.1)Amortization of prior service cost . . . . . . . . . . . . . . . . . . . . . . . . . . . . . . . . . . . . . . . (.2)Deferred income taxes . . . . . . . . . . . . . . . . . . . . . . . . . . . . . . . . . . . . . . . . . . . . . . . . (21.3)
$ 35.8
Of the amounts in accumulated other comprehensive income as of December 31, 2008, the portionsexpected to be recognized as components of net periodic pension cost in 2009 are as follows:
Net loss . . . . . . . . . . . . . . . . . . . . . . . . . . . . . . . . . . . . . . . . . . . . . . . . . . . . . . . . . . . . . . $4.8Net prior service cost . . . . . . . . . . . . . . . . . . . . . . . . . . . . . . . . . . . . . . . . . . . . . . . . . . . .2
Components of net pension income (expense) for the years ended December 31 were as follows:
2008 2007 2006
Service cost . . . . . . . . . . . . . . . . . . . . . . . . . . . . . . . . . . . . . . . . . . . . . . . . . . . . $ (2.2) $ (4.4) $ (7.1)Interest cost . . . . . . . . . . . . . . . . . . . . . . . . . . . . . . . . . . . . . . . . . . . . . . . . . . . . (13.1) (13.3) (12.3)Expected return on plan assets . . . . . . . . . . . . . . . . . . . . . . . . . . . . . . . . . . . . . 19.1 18.1 16.2Settlement loss . . . . . . . . . . . . . . . . . . . . . . . . . . . . . . . . . . . . . . . . . . . . . . . . . (1.3) — —Amortization of prior service cost . . . . . . . . . . . . . . . . . . . . . . . . . . . . . . . . . . (.2) (.1) —Recognized net actuarial loss . . . . . . . . . . . . . . . . . . . . . . . . . . . . . . . . . . . . . . (.1) (1.1) (2.6)
Net pension income (expense) . . . . . . . . . . . . . . . . . . . . . . . . . . . . . . . . . . . . . . . . . $ 2.2 $ (.8) $ (5.8)
Weighted Average Assumptions:Discount rate used in net pension costs . . . . . . . . . . . . . . . . . . . . . . . . . . . . . . 6.0% 5.6% 5.5%Discount rate used in benefit obligation . . . . . . . . . . . . . . . . . . . . . . . . . . . . . . 6.0% 6.0% 5.6%Expected return on plan assets . . . . . . . . . . . . . . . . . . . . . . . . . . . . . . . . . . . . . 7.9% 7.8% 7.9%Rate of compensation increase . . . . . . . . . . . . . . . . . . . . . . . . . . . . . . . . . . . . . 4.1% 4.1% 4.1%
The Company uses the average of the Citigroup Pension Discount Curve rate and Merrill Lynch AA-AAA10 year Bond Index rate to determine the discount rate used for its significant pension plans (rounded to thenearest 25 basis points). The Citigroup Pension Discount Curve rate is a calculated rate using yearly spot ratesmatched against expected future benefit payments. The Merrill Lynch Index rate is based on the weightedaverage yield of a portfolio of high grade Corporate Bonds with an average duration approximating the plans’projected benefit payments, adjusted for any callable bonds included in the portfolio. The discount rate used forour significant pension plans was 6.0% for 2008, 6.0% for 2007 and 5.75% for 2006. The discount rates used forthe Company’s other, primarily foreign, plans are based on rates appropriate for the respective country and theplan obligations.
The overall, expected long-term rate of return is based on each plan’s historical experience and theCompany’s expectations of future returns based upon each plan’s investment holdings.
On December 31, 2006, the Company made changes to the retirement plan covering non-union employeesthat meet the criteria of a curtailment as defined in SFAS No. 88, “Employer’s Accounting for Settlements andCurtailments of Defined Benefit Pension Plans and for Termination Benefits.” As such, the expected costsassociated with the future service of participants in the plan were reduced, lowering the Projected BenefitObligation in the plan by $11.7. This curtailment gain was offset against the plan’s previously existingunrecognized net actuarial loss in accordance with SFAS No. 88. Participants were moved to a definedcontribution plan that incorporates a company match based upon the age of the participant at December 31, 2006.
112
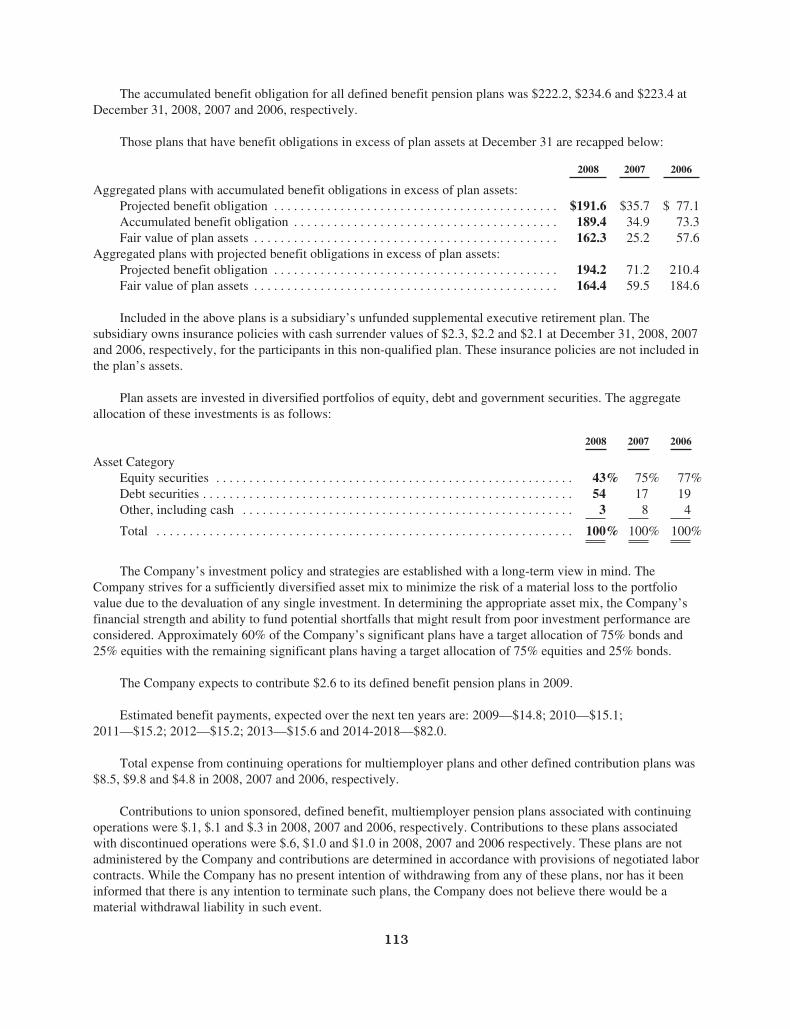
The accumulated benefit obligation for all defined benefit pension plans was $222.2, $234.6 and $223.4 atDecember 31, 2008, 2007 and 2006, respectively.
Those plans that have benefit obligations in excess of plan assets at December 31 are recapped below:
2008 2007 2006
Aggregated plans with accumulated benefit obligations in excess of plan assets:Projected benefit obligation . . . . . . . . . . . . . . . . . . . . . . . . . . . . . . . . . . . . . . . . . . . $191.6 $35.7 $ 77.1Accumulated benefit obligation . . . . . . . . . . . . . . . . . . . . . . . . . . . . . . . . . . . . . . . . 189.4 34.9 73.3Fair value of plan assets . . . . . . . . . . . . . . . . . . . . . . . . . . . . . . . . . . . . . . . . . . . . . . 162.3 25.2 57.6
Aggregated plans with projected benefit obligations in excess of plan assets:Projected benefit obligation . . . . . . . . . . . . . . . . . . . . . . . . . . . . . . . . . . . . . . . . . . . 194.2 71.2 210.4Fair value of plan assets . . . . . . . . . . . . . . . . . . . . . . . . . . . . . . . . . . . . . . . . . . . . . . 164.4 59.5 184.6
Included in the above plans is a subsidiary’s unfunded supplemental executive retirement plan. Thesubsidiary owns insurance policies with cash surrender values of $2.3, $2.2 and $2.1 at December 31, 2008, 2007and 2006, respectively, for the participants in this non-qualified plan. These insurance policies are not included inthe plan’s assets.
Plan assets are invested in diversified portfolios of equity, debt and government securities. The aggregateallocation of these investments is as follows:
2008 2007 2006
Asset CategoryEquity securities . . . . . . . . . . . . . . . . . . . . . . . . . . . . . . . . . . . . . . . . . . . . . . . . . . . . . . 43% 75% 77%Debt securities . . . . . . . . . . . . . . . . . . . . . . . . . . . . . . . . . . . . . . . . . . . . . . . . . . . . . . . . 54 17 19Other, including cash . . . . . . . . . . . . . . . . . . . . . . . . . . . . . . . . . . . . . . . . . . . . . . . . . . 3 8 4
Total . . . . . . . . . . . . . . . . . . . . . . . . . . . . . . . . . . . . . . . . . . . . . . . . . . . . . . . . . . . . . . . 100% 100% 100%
The Company’s investment policy and strategies are established with a long-term view in mind. TheCompany strives for a sufficiently diversified asset mix to minimize the risk of a material loss to the portfoliovalue due to the devaluation of any single investment. In determining the appropriate asset mix, the Company’sfinancial strength and ability to fund potential shortfalls that might result from poor investment performance areconsidered. Approximately 60% of the Company’s significant plans have a target allocation of 75% bonds and25% equities with the remaining significant plans having a target allocation of 75% equities and 25% bonds.
The Company expects to contribute $2.6 to its defined benefit pension plans in 2009.
Estimated benefit payments, expected over the next ten years are: 2009—$14.8; 2010—$15.1;2011—$15.2; 2012—$15.2; 2013—$15.6 and 2014-2018—$82.0.
Total expense from continuing operations for multiemployer plans and other defined contribution plans was$8.5, $9.8 and $4.8 in 2008, 2007 and 2006, respectively.
Contributions to union sponsored, defined benefit, multiemployer pension plans associated with continuingoperations were $.1, $.1 and $.3 in 2008, 2007 and 2006, respectively. Contributions to these plans associatedwith discontinued operations were $.6, $1.0 and $1.0 in 2008, 2007 and 2006 respectively. These plans are notadministered by the Company and contributions are determined in accordance with provisions of negotiated laborcontracts. While the Company has no present intention of withdrawing from any of these plans, nor has it beeninformed that there is any intention to terminate such plans, the Company does not believe there would be amaterial withdrawal liability in such event.
113
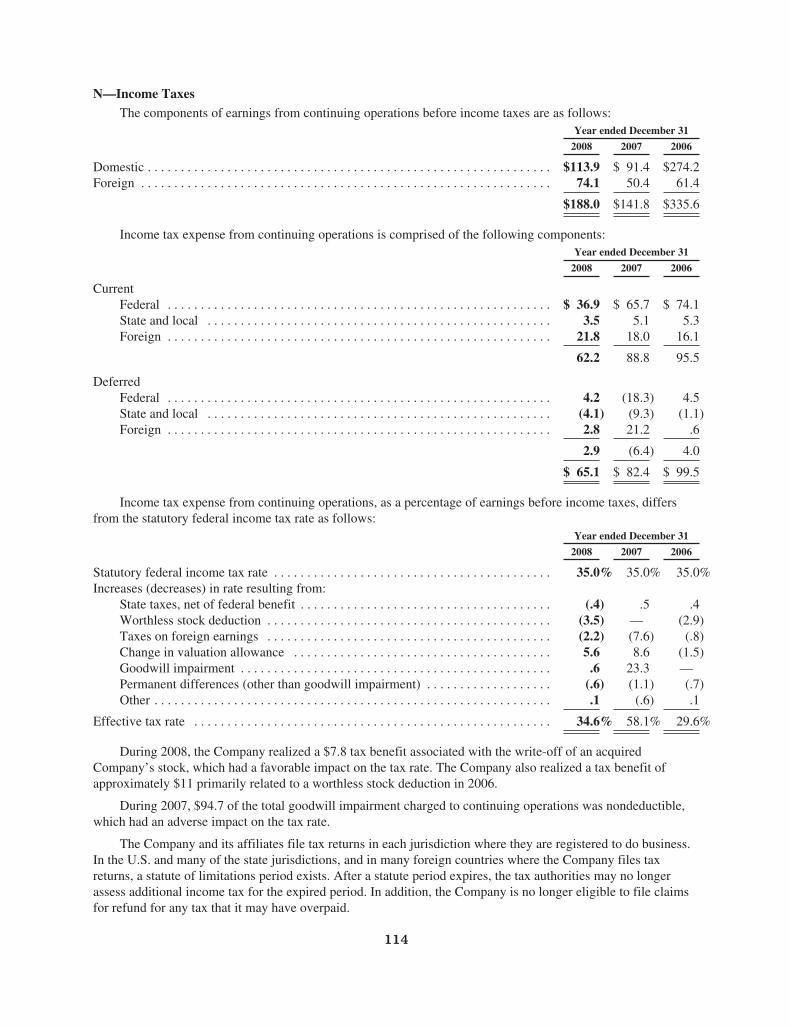
N—Income TaxesThe components of earnings from continuing operations before income taxes are as follows:
Year ended December 31
2008 2007 2006
Domestic . . . . . . . . . . . . . . . . . . . . . . . . . . . . . . . . . . . . . . . . . . . . . . . . . . . . . . . . . . . . . $113.9 $ 91.4 $274.2Foreign . . . . . . . . . . . . . . . . . . . . . . . . . . . . . . . . . . . . . . . . . . . . . . . . . . . . . . . . . . . . . . 74.1 50.4 61.4
$188.0 $141.8 $335.6
Income tax expense from continuing operations is comprised of the following components:Year ended December 31
2008 2007 2006
CurrentFederal . . . . . . . . . . . . . . . . . . . . . . . . . . . . . . . . . . . . . . . . . . . . . . . . . . . . . . . . . . $ 36.9 $ 65.7 $ 74.1State and local . . . . . . . . . . . . . . . . . . . . . . . . . . . . . . . . . . . . . . . . . . . . . . . . . . . . 3.5 5.1 5.3Foreign . . . . . . . . . . . . . . . . . . . . . . . . . . . . . . . . . . . . . . . . . . . . . . . . . . . . . . . . . . 21.8 18.0 16.1
62.2 88.8 95.5
DeferredFederal . . . . . . . . . . . . . . . . . . . . . . . . . . . . . . . . . . . . . . . . . . . . . . . . . . . . . . . . . . 4.2 (18.3) 4.5State and local . . . . . . . . . . . . . . . . . . . . . . . . . . . . . . . . . . . . . . . . . . . . . . . . . . . . (4.1) (9.3) (1.1)Foreign . . . . . . . . . . . . . . . . . . . . . . . . . . . . . . . . . . . . . . . . . . . . . . . . . . . . . . . . . . 2.8 21.2 .6
2.9 (6.4) 4.0
$ 65.1 $ 82.4 $ 99.5
Income tax expense from continuing operations, as a percentage of earnings before income taxes, differsfrom the statutory federal income tax rate as follows:
Year ended December 31
2008 2007 2006
Statutory federal income tax rate . . . . . . . . . . . . . . . . . . . . . . . . . . . . . . . . . . . . . . . . . . 35.0% 35.0% 35.0%Increases (decreases) in rate resulting from:
State taxes, net of federal benefit . . . . . . . . . . . . . . . . . . . . . . . . . . . . . . . . . . . . . . (.4) .5 .4Worthless stock deduction . . . . . . . . . . . . . . . . . . . . . . . . . . . . . . . . . . . . . . . . . . . (3.5) — (2.9)Taxes on foreign earnings . . . . . . . . . . . . . . . . . . . . . . . . . . . . . . . . . . . . . . . . . . . (2.2) (7.6) (.8)Change in valuation allowance . . . . . . . . . . . . . . . . . . . . . . . . . . . . . . . . . . . . . . . 5.6 8.6 (1.5)Goodwill impairment . . . . . . . . . . . . . . . . . . . . . . . . . . . . . . . . . . . . . . . . . . . . . . . .6 23.3 —Permanent differences (other than goodwill impairment) . . . . . . . . . . . . . . . . . . . (.6) (1.1) (.7)Other . . . . . . . . . . . . . . . . . . . . . . . . . . . . . . . . . . . . . . . . . . . . . . . . . . . . . . . . . . . . .1 (.6) .1
Effective tax rate . . . . . . . . . . . . . . . . . . . . . . . . . . . . . . . . . . . . . . . . . . . . . . . . . . . . . . 34.6% 58.1% 29.6%
During 2008, the Company realized a $7.8 tax benefit associated with the write-off of an acquiredCompany’s stock, which had a favorable impact on the tax rate. The Company also realized a tax benefit ofapproximately $11 primarily related to a worthless stock deduction in 2006.
During 2007, $94.7 of the total goodwill impairment charged to continuing operations was nondeductible,which had an adverse impact on the tax rate.
The Company and its affiliates file tax returns in each jurisdiction where they are registered to do business.In the U.S. and many of the state jurisdictions, and in many foreign countries where the Company files taxreturns, a statute of limitations period exists. After a statute period expires, the tax authorities may no longerassess additional income tax for the expired period. In addition, the Company is no longer eligible to file claimsfor refund for any tax that it may have overpaid.
114
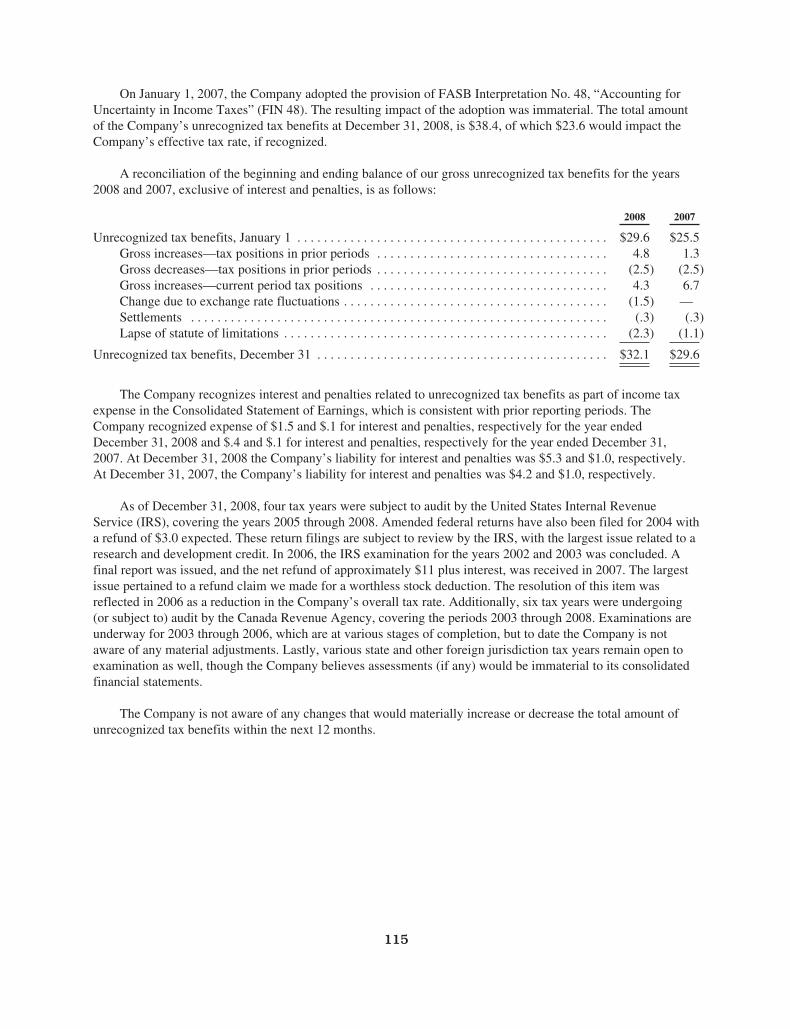
On January 1, 2007, the Company adopted the provision of FASB Interpretation No. 48, “Accounting forUncertainty in Income Taxes” (FIN 48). The resulting impact of the adoption was immaterial. The total amountof the Company’s unrecognized tax benefits at December 31, 2008, is $38.4, of which $23.6 would impact theCompany’s effective tax rate, if recognized.
A reconciliation of the beginning and ending balance of our gross unrecognized tax benefits for the years2008 and 2007, exclusive of interest and penalties, is as follows:
2008 2007
Unrecognized tax benefits, January 1 . . . . . . . . . . . . . . . . . . . . . . . . . . . . . . . . . . . . . . . . . . . . . . . $29.6 $25.5Gross increases—tax positions in prior periods . . . . . . . . . . . . . . . . . . . . . . . . . . . . . . . . . . . 4.8 1.3Gross decreases—tax positions in prior periods . . . . . . . . . . . . . . . . . . . . . . . . . . . . . . . . . . . (2.5) (2.5)Gross increases—current period tax positions . . . . . . . . . . . . . . . . . . . . . . . . . . . . . . . . . . . . 4.3 6.7Change due to exchange rate fluctuations . . . . . . . . . . . . . . . . . . . . . . . . . . . . . . . . . . . . . . . . (1.5) —Settlements . . . . . . . . . . . . . . . . . . . . . . . . . . . . . . . . . . . . . . . . . . . . . . . . . . . . . . . . . . . . . . . (.3) (.3)Lapse of statute of limitations . . . . . . . . . . . . . . . . . . . . . . . . . . . . . . . . . . . . . . . . . . . . . . . . . (2.3) (1.1)
Unrecognized tax benefits, December 31 . . . . . . . . . . . . . . . . . . . . . . . . . . . . . . . . . . . . . . . . . . . . $32.1 $29.6
The Company recognizes interest and penalties related to unrecognized tax benefits as part of income taxexpense in the Consolidated Statement of Earnings, which is consistent with prior reporting periods. TheCompany recognized expense of $1.5 and $.1 for interest and penalties, respectively for the year endedDecember 31, 2008 and $.4 and $.1 for interest and penalties, respectively for the year ended December 31,2007. At December 31, 2008 the Company’s liability for interest and penalties was $5.3 and $1.0, respectively.At December 31, 2007, the Company’s liability for interest and penalties was $4.2 and $1.0, respectively.
As of December 31, 2008, four tax years were subject to audit by the United States Internal RevenueService (IRS), covering the years 2005 through 2008. Amended federal returns have also been filed for 2004 witha refund of $3.0 expected. These return filings are subject to review by the IRS, with the largest issue related to aresearch and development credit. In 2006, the IRS examination for the years 2002 and 2003 was concluded. Afinal report was issued, and the net refund of approximately $11 plus interest, was received in 2007. The largestissue pertained to a refund claim we made for a worthless stock deduction. The resolution of this item wasreflected in 2006 as a reduction in the Company’s overall tax rate. Additionally, six tax years were undergoing(or subject to) audit by the Canada Revenue Agency, covering the periods 2003 through 2008. Examinations areunderway for 2003 through 2006, which are at various stages of completion, but to date the Company is notaware of any material adjustments. Lastly, various state and other foreign jurisdiction tax years remain open toexamination as well, though the Company believes assessments (if any) would be immaterial to its consolidatedfinancial statements.
The Company is not aware of any changes that would materially increase or decrease the total amount ofunrecognized tax benefits within the next 12 months.
115
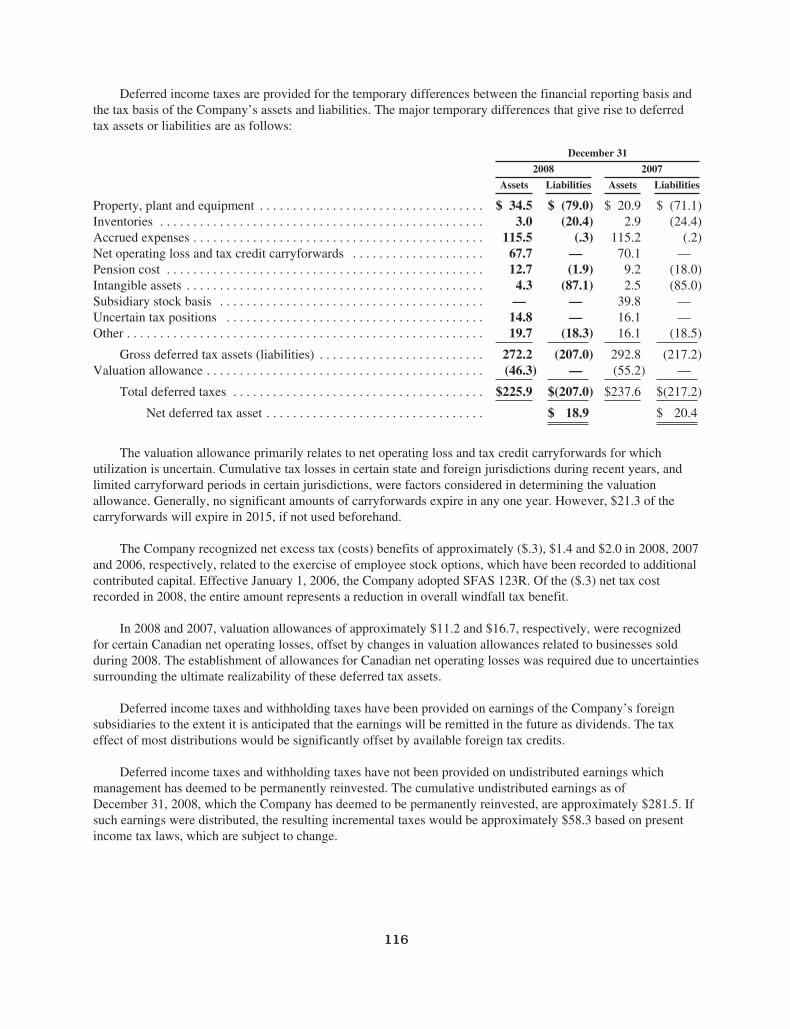
Deferred income taxes are provided for the temporary differences between the financial reporting basis andthe tax basis of the Company’s assets and liabilities. The major temporary differences that give rise to deferredtax assets or liabilities are as follows:
December 31
2008 2007
Assets Liabilities Assets Liabilities
Property, plant and equipment . . . . . . . . . . . . . . . . . . . . . . . . . . . . . . . . . . $ 34.5 $ (79.0) $ 20.9 $ (71.1)Inventories . . . . . . . . . . . . . . . . . . . . . . . . . . . . . . . . . . . . . . . . . . . . . . . . . 3.0 (20.4) 2.9 (24.4)Accrued expenses . . . . . . . . . . . . . . . . . . . . . . . . . . . . . . . . . . . . . . . . . . . . 115.5 (.3) 115.2 (.2)Net operating loss and tax credit carryforwards . . . . . . . . . . . . . . . . . . . . 67.7 — 70.1 —Pension cost . . . . . . . . . . . . . . . . . . . . . . . . . . . . . . . . . . . . . . . . . . . . . . . . 12.7 (1.9) 9.2 (18.0)Intangible assets . . . . . . . . . . . . . . . . . . . . . . . . . . . . . . . . . . . . . . . . . . . . . 4.3 (87.1) 2.5 (85.0)Subsidiary stock basis . . . . . . . . . . . . . . . . . . . . . . . . . . . . . . . . . . . . . . . . — — 39.8 —Uncertain tax positions . . . . . . . . . . . . . . . . . . . . . . . . . . . . . . . . . . . . . . . 14.8 — 16.1 —Other . . . . . . . . . . . . . . . . . . . . . . . . . . . . . . . . . . . . . . . . . . . . . . . . . . . . . . 19.7 (18.3) 16.1 (18.5)
Gross deferred tax assets (liabilities) . . . . . . . . . . . . . . . . . . . . . . . . . 272.2 (207.0) 292.8 (217.2)Valuation allowance . . . . . . . . . . . . . . . . . . . . . . . . . . . . . . . . . . . . . . . . . . (46.3) — (55.2) —
Total deferred taxes . . . . . . . . . . . . . . . . . . . . . . . . . . . . . . . . . . . . . . $225.9 $(207.0) $237.6 $(217.2)
Net deferred tax asset . . . . . . . . . . . . . . . . . . . . . . . . . . . . . . . . . $ 18.9 $ 20.4
The valuation allowance primarily relates to net operating loss and tax credit carryforwards for whichutilization is uncertain. Cumulative tax losses in certain state and foreign jurisdictions during recent years, andlimited carryforward periods in certain jurisdictions, were factors considered in determining the valuationallowance. Generally, no significant amounts of carryforwards expire in any one year. However, $21.3 of thecarryforwards will expire in 2015, if not used beforehand.
The Company recognized net excess tax (costs) benefits of approximately ($.3), $1.4 and $2.0 in 2008, 2007and 2006, respectively, related to the exercise of employee stock options, which have been recorded to additionalcontributed capital. Effective January 1, 2006, the Company adopted SFAS 123R. Of the ($.3) net tax costrecorded in 2008, the entire amount represents a reduction in overall windfall tax benefit.
In 2008 and 2007, valuation allowances of approximately $11.2 and $16.7, respectively, were recognizedfor certain Canadian net operating losses, offset by changes in valuation allowances related to businesses soldduring 2008. The establishment of allowances for Canadian net operating losses was required due to uncertaintiessurrounding the ultimate realizability of these deferred tax assets.
Deferred income taxes and withholding taxes have been provided on earnings of the Company’s foreignsubsidiaries to the extent it is anticipated that the earnings will be remitted in the future as dividends. The taxeffect of most distributions would be significantly offset by available foreign tax credits.
Deferred income taxes and withholding taxes have not been provided on undistributed earnings whichmanagement has deemed to be permanently reinvested. The cumulative undistributed earnings as ofDecember 31, 2008, which the Company has deemed to be permanently reinvested, are approximately $281.5. Ifsuch earnings were distributed, the resulting incremental taxes would be approximately $58.3 based on presentincome tax laws, which are subject to change.
116
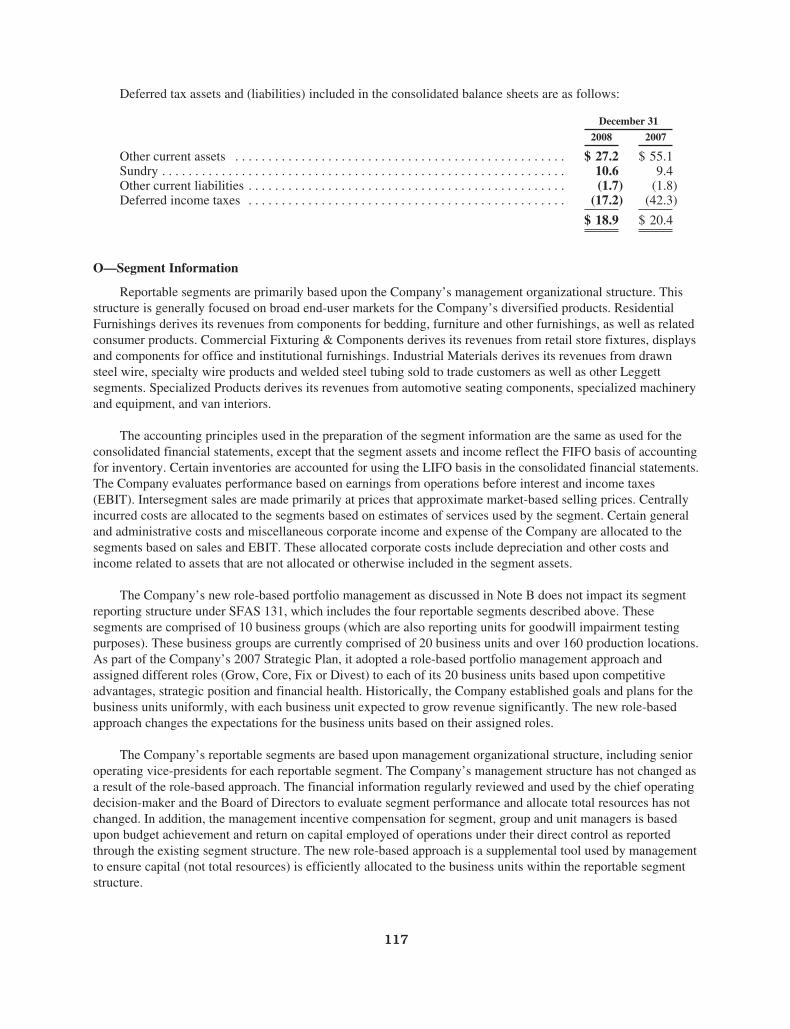
Deferred tax assets and (liabilities) included in the consolidated balance sheets are as follows:
December 31
2008 2007
Other current assets . . . . . . . . . . . . . . . . . . . . . . . . . . . . . . . . . . . . . . . . . . . . . . . . . . $ 27.2 $ 55.1Sundry . . . . . . . . . . . . . . . . . . . . . . . . . . . . . . . . . . . . . . . . . . . . . . . . . . . . . . . . . . . . . 10.6 9.4Other current liabilities . . . . . . . . . . . . . . . . . . . . . . . . . . . . . . . . . . . . . . . . . . . . . . . . (1.7) (1.8)Deferred income taxes . . . . . . . . . . . . . . . . . . . . . . . . . . . . . . . . . . . . . . . . . . . . . . . . (17.2) (42.3)
$ 18.9 $ 20.4
O—Segment Information
Reportable segments are primarily based upon the Company’s management organizational structure. Thisstructure is generally focused on broad end-user markets for the Company’s diversified products. ResidentialFurnishings derives its revenues from components for bedding, furniture and other furnishings, as well as relatedconsumer products. Commercial Fixturing & Components derives its revenues from retail store fixtures, displaysand components for office and institutional furnishings. Industrial Materials derives its revenues from drawnsteel wire, specialty wire products and welded steel tubing sold to trade customers as well as other Leggettsegments. Specialized Products derives its revenues from automotive seating components, specialized machineryand equipment, and van interiors.
The accounting principles used in the preparation of the segment information are the same as used for theconsolidated financial statements, except that the segment assets and income reflect the FIFO basis of accountingfor inventory. Certain inventories are accounted for using the LIFO basis in the consolidated financial statements.The Company evaluates performance based on earnings from operations before interest and income taxes(EBIT). Intersegment sales are made primarily at prices that approximate market-based selling prices. Centrallyincurred costs are allocated to the segments based on estimates of services used by the segment. Certain generaland administrative costs and miscellaneous corporate income and expense of the Company are allocated to thesegments based on sales and EBIT. These allocated corporate costs include depreciation and other costs andincome related to assets that are not allocated or otherwise included in the segment assets.
The Company’s new role-based portfolio management as discussed in Note B does not impact its segmentreporting structure under SFAS 131, which includes the four reportable segments described above. Thesesegments are comprised of 10 business groups (which are also reporting units for goodwill impairment testingpurposes). These business groups are currently comprised of 20 business units and over 160 production locations.As part of the Company’s 2007 Strategic Plan, it adopted a role-based portfolio management approach andassigned different roles (Grow, Core, Fix or Divest) to each of its 20 business units based upon competitiveadvantages, strategic position and financial health. Historically, the Company established goals and plans for thebusiness units uniformly, with each business unit expected to grow revenue significantly. The new role-basedapproach changes the expectations for the business units based on their assigned roles.
The Company’s reportable segments are based upon management organizational structure, including senioroperating vice-presidents for each reportable segment. The Company’s management structure has not changed asa result of the role-based approach. The financial information regularly reviewed and used by the chief operatingdecision-maker and the Board of Directors to evaluate segment performance and allocate total resources has notchanged. In addition, the management incentive compensation for segment, group and unit managers is basedupon budget achievement and return on capital employed of operations under their direct control as reportedthrough the existing segment structure. The new role-based approach is a supplemental tool used by managementto ensure capital (not total resources) is efficiently allocated to the business units within the reportable segmentstructure.
117
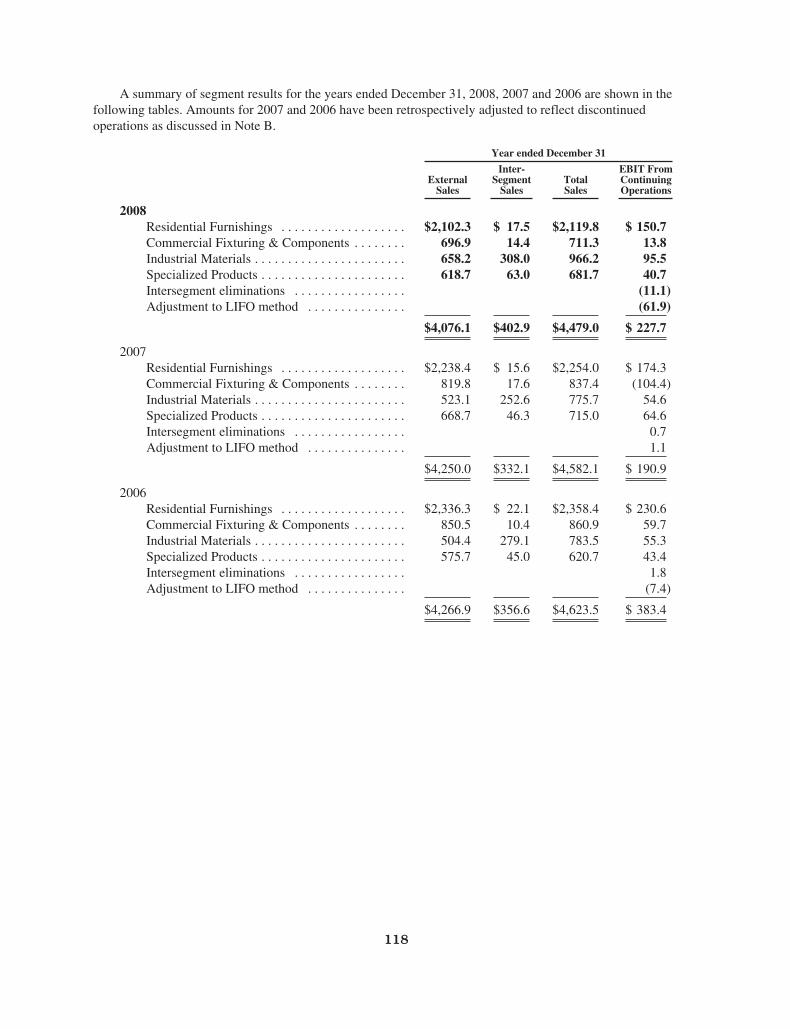
A summary of segment results for the years ended December 31, 2008, 2007 and 2006 are shown in thefollowing tables. Amounts for 2007 and 2006 have been retrospectively adjusted to reflect discontinuedoperations as discussed in Note B.
Year ended December 31
ExternalSales
Inter-Segment
SalesTotalSales
EBIT FromContinuingOperations
2008Residential Furnishings . . . . . . . . . . . . . . . . . . . $2,102.3 $ 17.5 $2,119.8 $ 150.7Commercial Fixturing & Components . . . . . . . . 696.9 14.4 711.3 13.8Industrial Materials . . . . . . . . . . . . . . . . . . . . . . . 658.2 308.0 966.2 95.5Specialized Products . . . . . . . . . . . . . . . . . . . . . . 618.7 63.0 681.7 40.7Intersegment eliminations . . . . . . . . . . . . . . . . . (11.1)Adjustment to LIFO method . . . . . . . . . . . . . . . (61.9)
$4,076.1 $402.9 $4,479.0 $ 227.7
2007Residential Furnishings . . . . . . . . . . . . . . . . . . . $2,238.4 $ 15.6 $2,254.0 $ 174.3Commercial Fixturing & Components . . . . . . . . 819.8 17.6 837.4 (104.4)Industrial Materials . . . . . . . . . . . . . . . . . . . . . . . 523.1 252.6 775.7 54.6Specialized Products . . . . . . . . . . . . . . . . . . . . . . 668.7 46.3 715.0 64.6Intersegment eliminations . . . . . . . . . . . . . . . . . 0.7Adjustment to LIFO method . . . . . . . . . . . . . . . 1.1
$4,250.0 $332.1 $4,582.1 $ 190.9
2006Residential Furnishings . . . . . . . . . . . . . . . . . . . $2,336.3 $ 22.1 $2,358.4 $ 230.6Commercial Fixturing & Components . . . . . . . . 850.5 10.4 860.9 59.7Industrial Materials . . . . . . . . . . . . . . . . . . . . . . . 504.4 279.1 783.5 55.3Specialized Products . . . . . . . . . . . . . . . . . . . . . . 575.7 45.0 620.7 43.4Intersegment eliminations . . . . . . . . . . . . . . . . . 1.8Adjustment to LIFO method . . . . . . . . . . . . . . . (7.4)
$4,266.9 $356.6 $4,623.5 $ 383.4
118
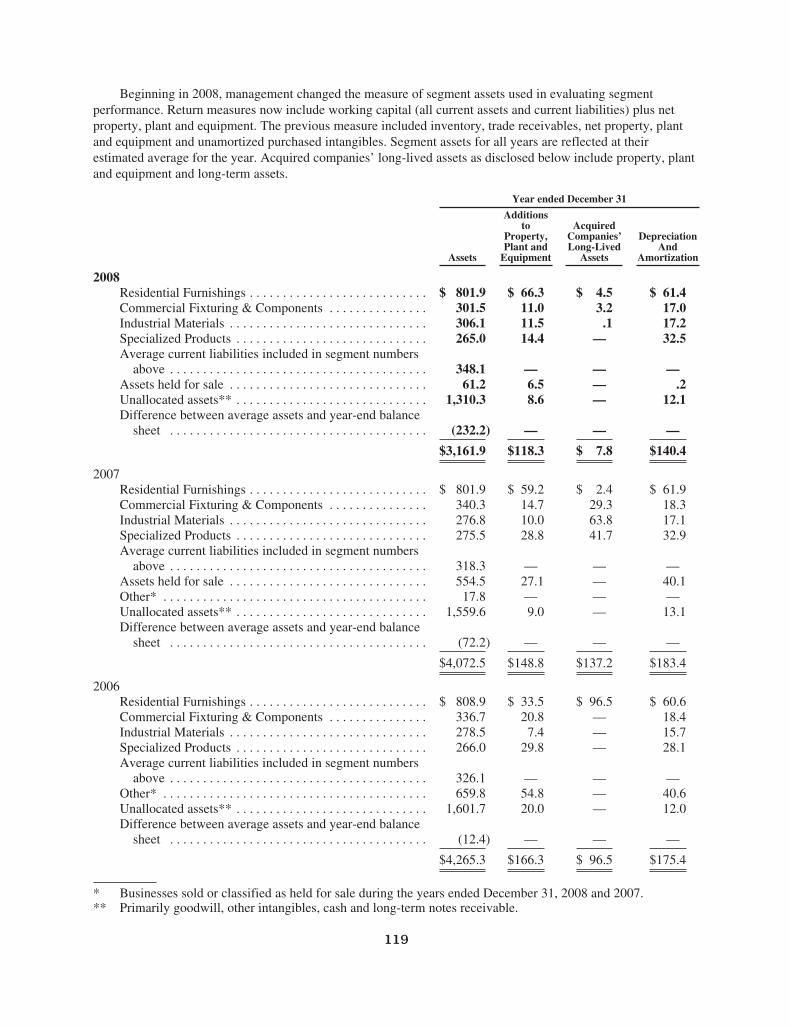
Beginning in 2008, management changed the measure of segment assets used in evaluating segmentperformance. Return measures now include working capital (all current assets and current liabilities) plus netproperty, plant and equipment. The previous measure included inventory, trade receivables, net property, plantand equipment and unamortized purchased intangibles. Segment assets for all years are reflected at theirestimated average for the year. Acquired companies’ long-lived assets as disclosed below include property, plantand equipment and long-term assets.
Year ended December 31
Assets
Additionsto
Property,Plant and
Equipment
AcquiredCompanies’Long-Lived
Assets
DepreciationAnd
Amortization
2008Residential Furnishings . . . . . . . . . . . . . . . . . . . . . . . . . . . $ 801.9 $ 66.3 $ 4.5 $ 61.4Commercial Fixturing & Components . . . . . . . . . . . . . . . 301.5 11.0 3.2 17.0Industrial Materials . . . . . . . . . . . . . . . . . . . . . . . . . . . . . . 306.1 11.5 .1 17.2Specialized Products . . . . . . . . . . . . . . . . . . . . . . . . . . . . . 265.0 14.4 — 32.5Average current liabilities included in segment numbers
above . . . . . . . . . . . . . . . . . . . . . . . . . . . . . . . . . . . . . . . 348.1 — — —Assets held for sale . . . . . . . . . . . . . . . . . . . . . . . . . . . . . . 61.2 6.5 — .2Unallocated assets** . . . . . . . . . . . . . . . . . . . . . . . . . . . . . 1,310.3 8.6 — 12.1Difference between average assets and year-end balance
sheet . . . . . . . . . . . . . . . . . . . . . . . . . . . . . . . . . . . . . . . (232.2) — — —
$3,161.9 $118.3 $ 7.8 $140.4
2007Residential Furnishings . . . . . . . . . . . . . . . . . . . . . . . . . . . $ 801.9 $ 59.2 $ 2.4 $ 61.9Commercial Fixturing & Components . . . . . . . . . . . . . . . 340.3 14.7 29.3 18.3Industrial Materials . . . . . . . . . . . . . . . . . . . . . . . . . . . . . . 276.8 10.0 63.8 17.1Specialized Products . . . . . . . . . . . . . . . . . . . . . . . . . . . . . 275.5 28.8 41.7 32.9Average current liabilities included in segment numbers
above . . . . . . . . . . . . . . . . . . . . . . . . . . . . . . . . . . . . . . . 318.3 — — —Assets held for sale . . . . . . . . . . . . . . . . . . . . . . . . . . . . . . 554.5 27.1 — 40.1Other* . . . . . . . . . . . . . . . . . . . . . . . . . . . . . . . . . . . . . . . . 17.8 — — —Unallocated assets** . . . . . . . . . . . . . . . . . . . . . . . . . . . . . 1,559.6 9.0 — 13.1Difference between average assets and year-end balance
sheet . . . . . . . . . . . . . . . . . . . . . . . . . . . . . . . . . . . . . . . (72.2) — — —
$4,072.5 $148.8 $137.2 $183.4
2006Residential Furnishings . . . . . . . . . . . . . . . . . . . . . . . . . . . $ 808.9 $ 33.5 $ 96.5 $ 60.6Commercial Fixturing & Components . . . . . . . . . . . . . . . 336.7 20.8 — 18.4Industrial Materials . . . . . . . . . . . . . . . . . . . . . . . . . . . . . . 278.5 7.4 — 15.7Specialized Products . . . . . . . . . . . . . . . . . . . . . . . . . . . . . 266.0 29.8 — 28.1Average current liabilities included in segment numbers
above . . . . . . . . . . . . . . . . . . . . . . . . . . . . . . . . . . . . . . . 326.1 — — —Other* . . . . . . . . . . . . . . . . . . . . . . . . . . . . . . . . . . . . . . . . 659.8 54.8 — 40.6Unallocated assets** . . . . . . . . . . . . . . . . . . . . . . . . . . . . . 1,601.7 20.0 — 12.0Difference between average assets and year-end balance
sheet . . . . . . . . . . . . . . . . . . . . . . . . . . . . . . . . . . . . . . . (12.4) — — —
$4,265.3 $166.3 $ 96.5 $175.4
* Businesses sold or classified as held for sale during the years ended December 31, 2008 and 2007.** Primarily goodwill, other intangibles, cash and long-term notes receivable.
119
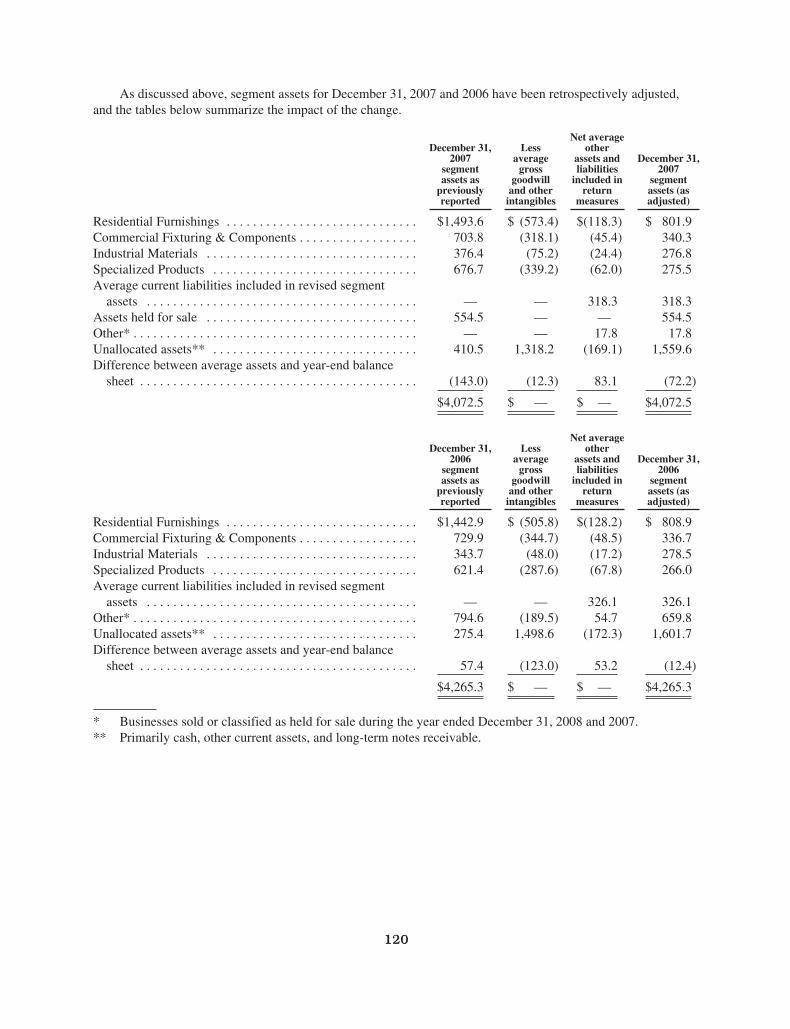
As discussed above, segment assets for December 31, 2007 and 2006 have been retrospectively adjusted,and the tables below summarize the impact of the change.
December 31,2007
segmentassets as
previouslyreported
Lessaverage
grossgoodwill
and otherintangibles
Net averageother
assets andliabilities
included inreturn
measures
December 31,2007
segmentassets (asadjusted)
Residential Furnishings . . . . . . . . . . . . . . . . . . . . . . . . . . . . . $1,493.6 $ (573.4) $(118.3) $ 801.9Commercial Fixturing & Components . . . . . . . . . . . . . . . . . . 703.8 (318.1) (45.4) 340.3Industrial Materials . . . . . . . . . . . . . . . . . . . . . . . . . . . . . . . . 376.4 (75.2) (24.4) 276.8Specialized Products . . . . . . . . . . . . . . . . . . . . . . . . . . . . . . . 676.7 (339.2) (62.0) 275.5Average current liabilities included in revised segment
assets . . . . . . . . . . . . . . . . . . . . . . . . . . . . . . . . . . . . . . . . . — — 318.3 318.3Assets held for sale . . . . . . . . . . . . . . . . . . . . . . . . . . . . . . . . 554.5 — — 554.5Other* . . . . . . . . . . . . . . . . . . . . . . . . . . . . . . . . . . . . . . . . . . . — — 17.8 17.8Unallocated assets** . . . . . . . . . . . . . . . . . . . . . . . . . . . . . . . 410.5 1,318.2 (169.1) 1,559.6Difference between average assets and year-end balance
sheet . . . . . . . . . . . . . . . . . . . . . . . . . . . . . . . . . . . . . . . . . . (143.0) (12.3) 83.1 (72.2)
$4,072.5 $ — $ — $4,072.5
December 31,2006
segmentassets as
previouslyreported
Lessaverage
grossgoodwill
and otherintangibles
Net averageother
assets andliabilities
included inreturn
measures
December 31,2006
segmentassets (asadjusted)
Residential Furnishings . . . . . . . . . . . . . . . . . . . . . . . . . . . . . $1,442.9 $ (505.8) $(128.2) $ 808.9Commercial Fixturing & Components . . . . . . . . . . . . . . . . . . 729.9 (344.7) (48.5) 336.7Industrial Materials . . . . . . . . . . . . . . . . . . . . . . . . . . . . . . . . 343.7 (48.0) (17.2) 278.5Specialized Products . . . . . . . . . . . . . . . . . . . . . . . . . . . . . . . 621.4 (287.6) (67.8) 266.0Average current liabilities included in revised segment
assets . . . . . . . . . . . . . . . . . . . . . . . . . . . . . . . . . . . . . . . . . — — 326.1 326.1Other* . . . . . . . . . . . . . . . . . . . . . . . . . . . . . . . . . . . . . . . . . . . 794.6 (189.5) 54.7 659.8Unallocated assets** . . . . . . . . . . . . . . . . . . . . . . . . . . . . . . . 275.4 1,498.6 (172.3) 1,601.7Difference between average assets and year-end balance
sheet . . . . . . . . . . . . . . . . . . . . . . . . . . . . . . . . . . . . . . . . . . 57.4 (123.0) 53.2 (12.4)
$4,265.3 $ — $ — $4,265.3
* Businesses sold or classified as held for sale during the year ended December 31, 2008 and 2007.** Primarily cash, other current assets, and long-term notes receivable.
120
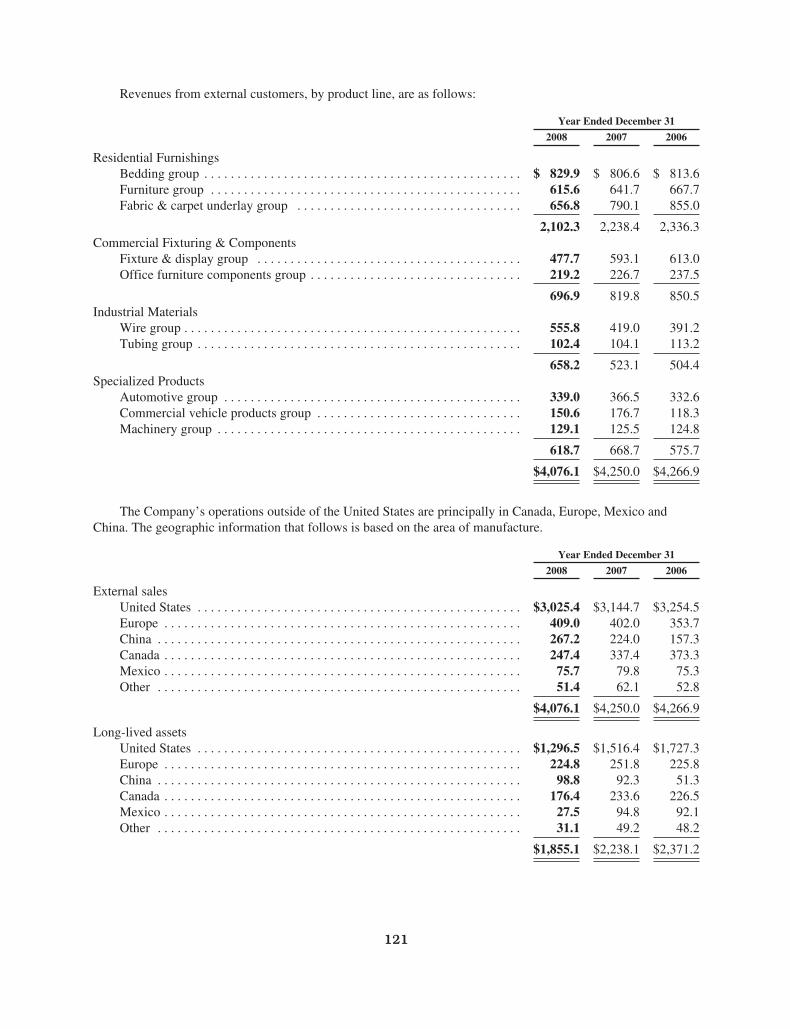
Revenues from external customers, by product line, are as follows:
Year Ended December 31
2008 2007 2006
Residential FurnishingsBedding group . . . . . . . . . . . . . . . . . . . . . . . . . . . . . . . . . . . . . . . . . . . . . . . . $ 829.9 $ 806.6 $ 813.6Furniture group . . . . . . . . . . . . . . . . . . . . . . . . . . . . . . . . . . . . . . . . . . . . . . . 615.6 641.7 667.7Fabric & carpet underlay group . . . . . . . . . . . . . . . . . . . . . . . . . . . . . . . . . . 656.8 790.1 855.0
2,102.3 2,238.4 2,336.3Commercial Fixturing & Components
Fixture & display group . . . . . . . . . . . . . . . . . . . . . . . . . . . . . . . . . . . . . . . . 477.7 593.1 613.0Office furniture components group . . . . . . . . . . . . . . . . . . . . . . . . . . . . . . . . 219.2 226.7 237.5
696.9 819.8 850.5Industrial Materials
Wire group . . . . . . . . . . . . . . . . . . . . . . . . . . . . . . . . . . . . . . . . . . . . . . . . . . . 555.8 419.0 391.2Tubing group . . . . . . . . . . . . . . . . . . . . . . . . . . . . . . . . . . . . . . . . . . . . . . . . . 102.4 104.1 113.2
658.2 523.1 504.4Specialized Products
Automotive group . . . . . . . . . . . . . . . . . . . . . . . . . . . . . . . . . . . . . . . . . . . . . 339.0 366.5 332.6Commercial vehicle products group . . . . . . . . . . . . . . . . . . . . . . . . . . . . . . . 150.6 176.7 118.3Machinery group . . . . . . . . . . . . . . . . . . . . . . . . . . . . . . . . . . . . . . . . . . . . . . 129.1 125.5 124.8
618.7 668.7 575.7
$4,076.1 $4,250.0 $4,266.9
The Company’s operations outside of the United States are principally in Canada, Europe, Mexico andChina. The geographic information that follows is based on the area of manufacture.
Year Ended December 31
2008 2007 2006
External salesUnited States . . . . . . . . . . . . . . . . . . . . . . . . . . . . . . . . . . . . . . . . . . . . . . . . . $3,025.4 $3,144.7 $3,254.5Europe . . . . . . . . . . . . . . . . . . . . . . . . . . . . . . . . . . . . . . . . . . . . . . . . . . . . . . 409.0 402.0 353.7China . . . . . . . . . . . . . . . . . . . . . . . . . . . . . . . . . . . . . . . . . . . . . . . . . . . . . . . 267.2 224.0 157.3Canada . . . . . . . . . . . . . . . . . . . . . . . . . . . . . . . . . . . . . . . . . . . . . . . . . . . . . . 247.4 337.4 373.3Mexico . . . . . . . . . . . . . . . . . . . . . . . . . . . . . . . . . . . . . . . . . . . . . . . . . . . . . . 75.7 79.8 75.3Other . . . . . . . . . . . . . . . . . . . . . . . . . . . . . . . . . . . . . . . . . . . . . . . . . . . . . . . 51.4 62.1 52.8
$4,076.1 $4,250.0 $4,266.9
Long-lived assetsUnited States . . . . . . . . . . . . . . . . . . . . . . . . . . . . . . . . . . . . . . . . . . . . . . . . . $1,296.5 $1,516.4 $1,727.3Europe . . . . . . . . . . . . . . . . . . . . . . . . . . . . . . . . . . . . . . . . . . . . . . . . . . . . . . 224.8 251.8 225.8China . . . . . . . . . . . . . . . . . . . . . . . . . . . . . . . . . . . . . . . . . . . . . . . . . . . . . . . 98.8 92.3 51.3Canada . . . . . . . . . . . . . . . . . . . . . . . . . . . . . . . . . . . . . . . . . . . . . . . . . . . . . . 176.4 233.6 226.5Mexico . . . . . . . . . . . . . . . . . . . . . . . . . . . . . . . . . . . . . . . . . . . . . . . . . . . . . . 27.5 94.8 92.1Other . . . . . . . . . . . . . . . . . . . . . . . . . . . . . . . . . . . . . . . . . . . . . . . . . . . . . . . 31.1 49.2 48.2
$1,855.1 $2,238.1 $2,371.2
121
P—Contingencies
The Company is involved in various legal proceedings including matters which involve claims against theCompany under employment, intellectual property, product liability, environmental and other laws. When it appearsprobable in management’s judgment that the Company will incur monetary damages or other costs in connectionwith claims and proceedings, and the costs can be reasonably estimated, appropriate liabilities are recorded in thefinancial statements and charges are made against earnings. No claim or proceeding has resulted in a materialcharge against earnings, nor are the total liabilities recorded material to the Company’s financial position. Except asdiscussed below, management believes the possibility of a material adverse effect on the Company’s consolidatedfinancial position, results of operations and cash flows from claims and proceedings is remote.
The Company has been named as one of numerous defendants in several cases consolidated as Gray v.Derderian, Case No. 1:04-CV-312-L, U.S.D.C. R.I. This litigation resulted from a nightclub fire in WestWarwick, Rhode Island involving multiple deaths and injuries. Along with other foam manufacturing defendants,the Company is alleged to have manufactured and sold bulk polyurethane foam to a foam fabricator in RhodeIsland, who in turn, is alleged to have fabricated and sold foam sheets to the nightclub. The foam was amongother materials alleged to have caught fire when pyrotechnics were ignited inside the nightclub.
The Company believes it did not manufacture the foam subject to the lawsuit and that it has valid defensesto the claims. Nevertheless, with the Company’s consent, the Company’s primary insurance carrier reached atentative settlement with counsel for all plaintiffs on April 29, 2008. If the settlement is approved by the court,the Company will pay a $2 self-insured retention and the remainder of the $18.2 settlement is the responsibilityof the insurance carrier. The settlement is subject to contingencies, including approval by the court. Managementdoes not believe the settlement or the outcome will have a material effect on the Company’s financial condition,operating cash flows or results of operations.
On February 5, 2009, a shareholder derivative complaint was filed by the New England Carpenters PensionFund, which represented that it owns 3,000 shares of Leggett stock, in the Circuit Court of Jasper County, Missouri.The complaint is substantially similar to a lawsuit filed by the New England Carpenters Pension Fund in federalcourt on September 4, 2008, which the plaintiff voluntarily dismissed on September 26, 2008 without prejudice toits right to re-file. However, this new lawsuit has fewer claims and asserts no federal causes of action. The action ispurportedly brought on behalf of the Company, naming it as a nominal defendant and naming as defendants certaincurrent and former officers and directors of the Company.
The plaintiff alleges, among other things, that the individual defendants participated in the backdating ofstock options, breached fiduciary duties, caused or allowed the Company to issue false and misleading financialstatements and proxy statements, and sold Company stock while in possession of material non-publicinformation. The plaintiff seeks, among other things, unspecified monetary damages against the individualdefendants, certain equitable and other relief relating to the profits from the alleged improper conduct, theadoption of certain Company corporate governance proposals, the imposition of a constructive trust over thedefendants’ stock options and proceeds, punitive damages, the rescission of certain unexercised options, and thereimbursement of litigation costs. The plaintiff is not seeking any monetary relief from the Company. Policies ofdirectors and officers liability insurance are in force, subject to customary limits and exclusions.
The complaint is based on a statistical analysis of stock option grants and Leggett stock prices that theCompany believes is flawed. The Company believes this lawsuit does not take into consideration important aspectsof Leggett’s stock option plans. For example, the plaintiff has noted only one set of stock option grants, made onDecember 30, 2005, within what we believe to be the applicable 5-year statute of limitations. These option grantswere made in accordance with the Company’s Deferred Compensation Program, which (i) provided that optionswould be dated on the last business day of December, and (ii) was filed with the SEC on December 2, 2005 settingout the pricing mechanism well before the grant date. The Company provided plaintiff’s counsel with this publiclyavailable documentation before they dismissed the prior federal court lawsuit.
The Company expects that the outcome of this litigation will not have a material adverse effect on itsfinancial condition, operating cash flows or results of operations.
122
Q—Other Expense
The components of other expense from continuing operations were as follows:
Year ended December 31
2008 2007 2006
Gain on asset sale . . . . . . . . . . . . . . . . . . . . . . . . . . . . . . . . . . . . . . . . . . . . $(14.6) $(11.4) $ (8.4)Restructuring charges . . . . . . . . . . . . . . . . . . . . . . . . . . . . . . . . . . . . . . . . . 17.9 14.1 13.3Asset impairments . . . . . . . . . . . . . . . . . . . . . . . . . . . . . . . . . . . . . . . . . . . . 13.3 6.2 3.4Currency loss . . . . . . . . . . . . . . . . . . . . . . . . . . . . . . . . . . . . . . . . . . . . . . . . — 2.2 .9Other income . . . . . . . . . . . . . . . . . . . . . . . . . . . . . . . . . . . . . . . . . . . . . . . . (.8) (1.8) (1.0)
$ 15.8 $ 9.3 $ 8.2
R—Derivative Financial Instruments
Risk Management Strategy & Objectives
The Company is subject to market and financial risks related to interest rates, foreign currency, andcommodities. In the normal course of business, the Company utilizes derivative instruments (individually or incombinations) to manage these risks. The Company seeks to use derivative contracts that qualify for hedgeaccounting treatment; however, some instruments that economically manage currency risk may not qualify forhedge accounting treatment. It is the Company’s policy not to speculate using derivative instruments.
Cash Flow Hedges
At December 31, 2008 and 2007, the Company had outstanding derivative financial instruments that hedgeforecasted transactions and anticipated cash flows. The changes in fair value of unexpired contracts are recordedin other comprehensive income and reclassified to income or expense in the period in which earnings areimpacted.
Commodity Cash Flow Hedges
The commodity cash flow hedges primarily manage natural gas commodity price risk. There were $9.2 inoutstanding commodity hedges at both December 31, 2008 and 2007, all of which had maturities less than 3years. The Company routinely hedges commodity price risk up to 36 months. The Company recognized income(expense) on these commodity hedges of $1.1, $(2.4), $(4.4) for years ended December 31, 2008, 2007 and 2006,respectively.
Foreign Currency Cash Flow Hedges
The foreign currency hedges manage risk associated with exchange rate volatility of various currencies. Ofthe $30.9 in foreign currency cash flow hedges at December 31, 2008, 99% hedged Canadian dollar exposuresand 1% hedged British pound exposures. Of the $47.6 in foreign currency cash flow hedges at December 31,2007, 44% hedged Canadian dollar exposures, 35% Mexican peso exposures, and 21% hedged other currenciesincluding the British pound, Euro, and Australian dollar. In general, foreign currency cash flow hedges havematurities within 1 year. The Company recognized income on these hedges of $2.4, $3.9 and $1.5 for the yearsended December 31, 2008, 2007 and 2006, respectively.
Fair Value Hedges
The Company’s fair value hedges are not material and are outstanding to manage foreign currency riskassociated with subsidiaries’ receivables and payables. Hedges designated as fair value hedges recognize gain orloss currently in earnings.
123
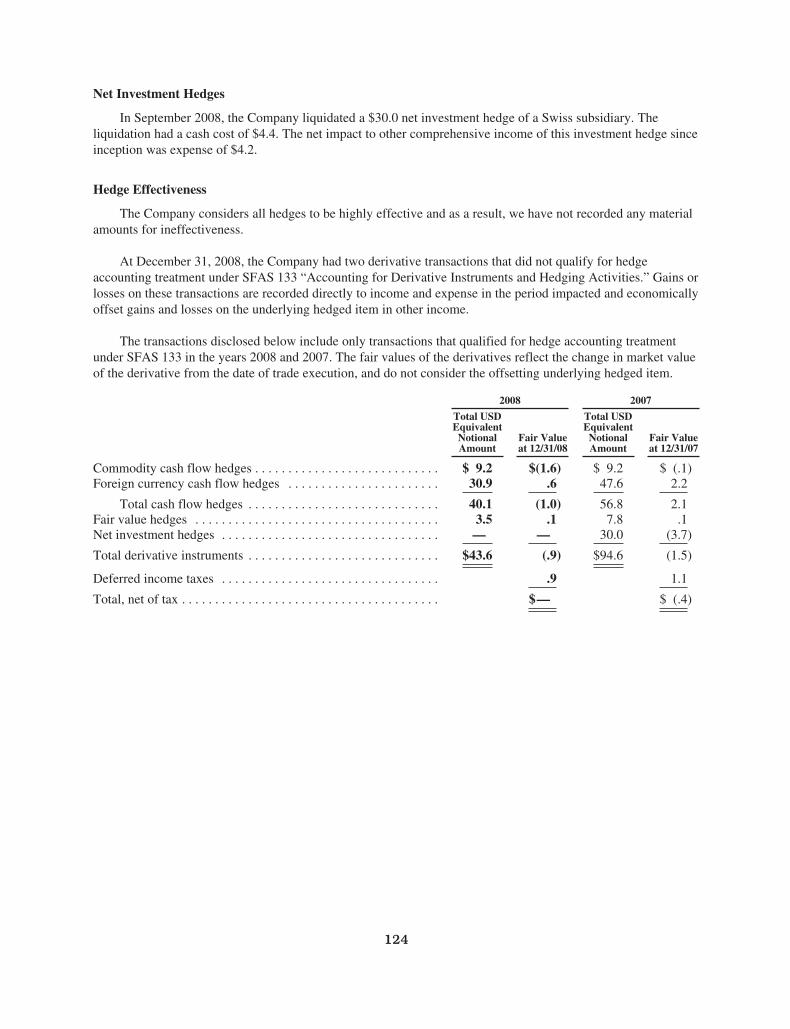
Net Investment Hedges
In September 2008, the Company liquidated a $30.0 net investment hedge of a Swiss subsidiary. Theliquidation had a cash cost of $4.4. The net impact to other comprehensive income of this investment hedge sinceinception was expense of $4.2.
Hedge Effectiveness
The Company considers all hedges to be highly effective and as a result, we have not recorded any materialamounts for ineffectiveness.
At December 31, 2008, the Company had two derivative transactions that did not qualify for hedgeaccounting treatment under SFAS 133 “Accounting for Derivative Instruments and Hedging Activities.” Gains orlosses on these transactions are recorded directly to income and expense in the period impacted and economicallyoffset gains and losses on the underlying hedged item in other income.
The transactions disclosed below include only transactions that qualified for hedge accounting treatmentunder SFAS 133 in the years 2008 and 2007. The fair values of the derivatives reflect the change in market valueof the derivative from the date of trade execution, and do not consider the offsetting underlying hedged item.
2008 2007
Total USDEquivalentNotionalAmount
Fair Valueat 12/31/08
Total USDEquivalentNotionalAmount
Fair Valueat 12/31/07
Commodity cash flow hedges . . . . . . . . . . . . . . . . . . . . . . . . . . . . $ 9.2 $(1.6) $ 9.2 $ (.1)Foreign currency cash flow hedges . . . . . . . . . . . . . . . . . . . . . . . 30.9 .6 47.6 2.2
Total cash flow hedges . . . . . . . . . . . . . . . . . . . . . . . . . . . . . 40.1 (1.0) 56.8 2.1Fair value hedges . . . . . . . . . . . . . . . . . . . . . . . . . . . . . . . . . . . . . 3.5 .1 7.8 .1Net investment hedges . . . . . . . . . . . . . . . . . . . . . . . . . . . . . . . . . — — 30.0 (3.7)
Total derivative instruments . . . . . . . . . . . . . . . . . . . . . . . . . . . . . $43.6 (.9) $94.6 (1.5)
Deferred income taxes . . . . . . . . . . . . . . . . . . . . . . . . . . . . . . . . . .9 1.1
Total, net of tax . . . . . . . . . . . . . . . . . . . . . . . . . . . . . . . . . . . . . . . $— $ (.4)
124
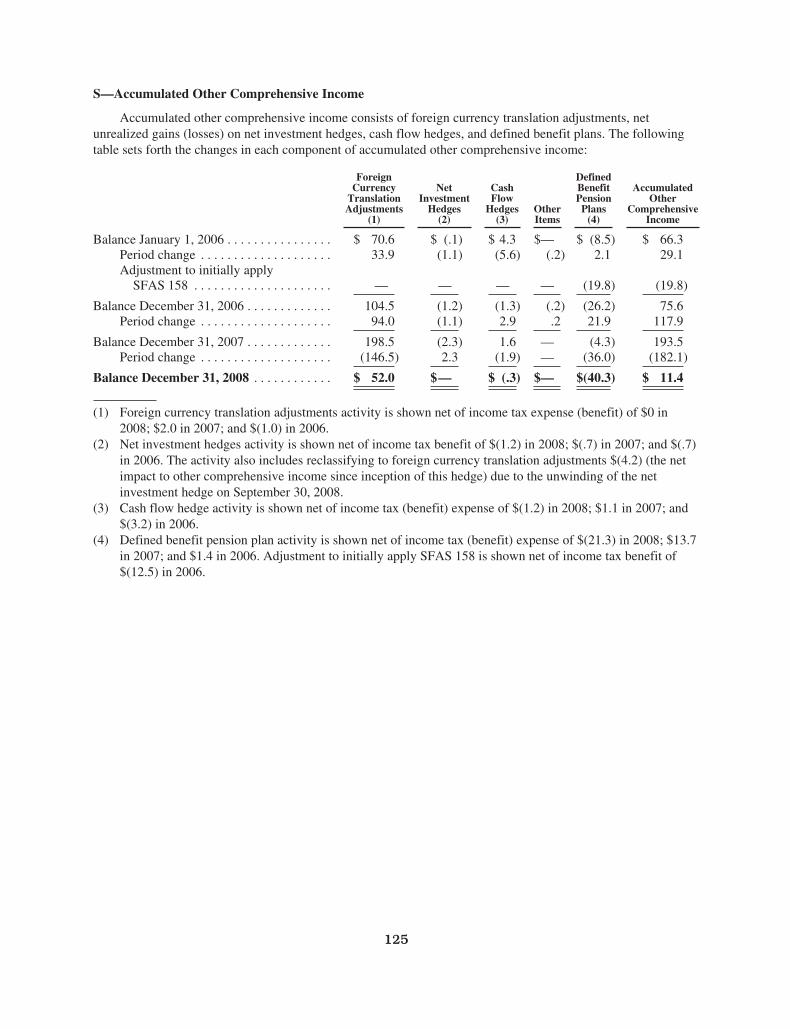
S—Accumulated Other Comprehensive Income
Accumulated other comprehensive income consists of foreign currency translation adjustments, netunrealized gains (losses) on net investment hedges, cash flow hedges, and defined benefit plans. The followingtable sets forth the changes in each component of accumulated other comprehensive income:
ForeignCurrency
TranslationAdjustments
(1)
NetInvestment
Hedges(2)
CashFlow
Hedges(3)
OtherItems
DefinedBenefitPensionPlans
(4)
AccumulatedOther
ComprehensiveIncome
Balance January 1, 2006 . . . . . . . . . . . . . . . . $ 70.6 $ (.1) $ 4.3 $— $ (8.5) $ 66.3Period change . . . . . . . . . . . . . . . . . . . . 33.9 (1.1) (5.6) (.2) 2.1 29.1Adjustment to initially apply
SFAS 158 . . . . . . . . . . . . . . . . . . . . . — — — — (19.8) (19.8)
Balance December 31, 2006 . . . . . . . . . . . . . 104.5 (1.2) (1.3) (.2) (26.2) 75.6Period change . . . . . . . . . . . . . . . . . . . . 94.0 (1.1) 2.9 .2 21.9 117.9
Balance December 31, 2007 . . . . . . . . . . . . . 198.5 (2.3) 1.6 — (4.3) 193.5Period change . . . . . . . . . . . . . . . . . . . . (146.5) 2.3 (1.9) — (36.0) (182.1)
Balance December 31, 2008 . . . . . . . . . . . . $ 52.0 $— $ (.3) $— $(40.3) $ 11.4
(1) Foreign currency translation adjustments activity is shown net of income tax expense (benefit) of $0 in2008; $2.0 in 2007; and $(1.0) in 2006.
(2) Net investment hedges activity is shown net of income tax benefit of $(1.2) in 2008; $(.7) in 2007; and $(.7)in 2006. The activity also includes reclassifying to foreign currency translation adjustments $(4.2) (the netimpact to other comprehensive income since inception of this hedge) due to the unwinding of the netinvestment hedge on September 30, 2008.
(3) Cash flow hedge activity is shown net of income tax (benefit) expense of $(1.2) in 2008; $1.1 in 2007; and$(3.2) in 2006.
(4) Defined benefit pension plan activity is shown net of income tax (benefit) expense of $(21.3) in 2008; $13.7in 2007; and $1.4 in 2006. Adjustment to initially apply SFAS 158 is shown net of income tax benefit of$(12.5) in 2006.
125
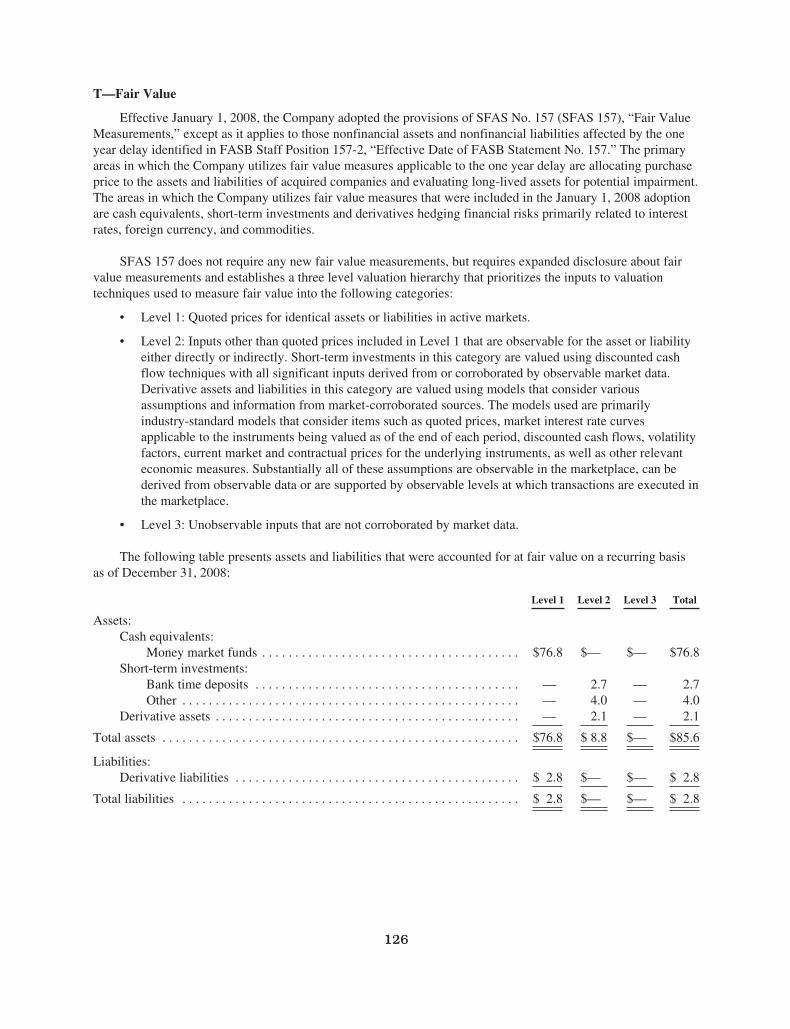
T—Fair Value
Effective January 1, 2008, the Company adopted the provisions of SFAS No. 157 (SFAS 157), “Fair ValueMeasurements,” except as it applies to those nonfinancial assets and nonfinancial liabilities affected by the oneyear delay identified in FASB Staff Position 157-2, “Effective Date of FASB Statement No. 157.” The primaryareas in which the Company utilizes fair value measures applicable to the one year delay are allocating purchaseprice to the assets and liabilities of acquired companies and evaluating long-lived assets for potential impairment.The areas in which the Company utilizes fair value measures that were included in the January 1, 2008 adoptionare cash equivalents, short-term investments and derivatives hedging financial risks primarily related to interestrates, foreign currency, and commodities.
SFAS 157 does not require any new fair value measurements, but requires expanded disclosure about fairvalue measurements and establishes a three level valuation hierarchy that prioritizes the inputs to valuationtechniques used to measure fair value into the following categories:
• Level 1: Quoted prices for identical assets or liabilities in active markets.
• Level 2: Inputs other than quoted prices included in Level 1 that are observable for the asset or liabilityeither directly or indirectly. Short-term investments in this category are valued using discounted cashflow techniques with all significant inputs derived from or corroborated by observable market data.Derivative assets and liabilities in this category are valued using models that consider variousassumptions and information from market-corroborated sources. The models used are primarilyindustry-standard models that consider items such as quoted prices, market interest rate curvesapplicable to the instruments being valued as of the end of each period, discounted cash flows, volatilityfactors, current market and contractual prices for the underlying instruments, as well as other relevanteconomic measures. Substantially all of these assumptions are observable in the marketplace, can bederived from observable data or are supported by observable levels at which transactions are executed inthe marketplace.
• Level 3: Unobservable inputs that are not corroborated by market data.
The following table presents assets and liabilities that were accounted for at fair value on a recurring basisas of December 31, 2008:
Level 1 Level 2 Level 3 Total
Assets:Cash equivalents:
Money market funds . . . . . . . . . . . . . . . . . . . . . . . . . . . . . . . . . . . . . . . $76.8 $— $— $76.8Short-term investments:
Bank time deposits . . . . . . . . . . . . . . . . . . . . . . . . . . . . . . . . . . . . . . . . — 2.7 — 2.7Other . . . . . . . . . . . . . . . . . . . . . . . . . . . . . . . . . . . . . . . . . . . . . . . . . . . — 4.0 — 4.0
Derivative assets . . . . . . . . . . . . . . . . . . . . . . . . . . . . . . . . . . . . . . . . . . . . . . — 2.1 — 2.1
Total assets . . . . . . . . . . . . . . . . . . . . . . . . . . . . . . . . . . . . . . . . . . . . . . . . . . . . . . $76.8 $ 8.8 $— $85.6
Liabilities:Derivative liabilities . . . . . . . . . . . . . . . . . . . . . . . . . . . . . . . . . . . . . . . . . . . $ 2.8 $— $— $ 2.8
Total liabilities . . . . . . . . . . . . . . . . . . . . . . . . . . . . . . . . . . . . . . . . . . . . . . . . . . . $ 2.8 $— $— $ 2.8
126
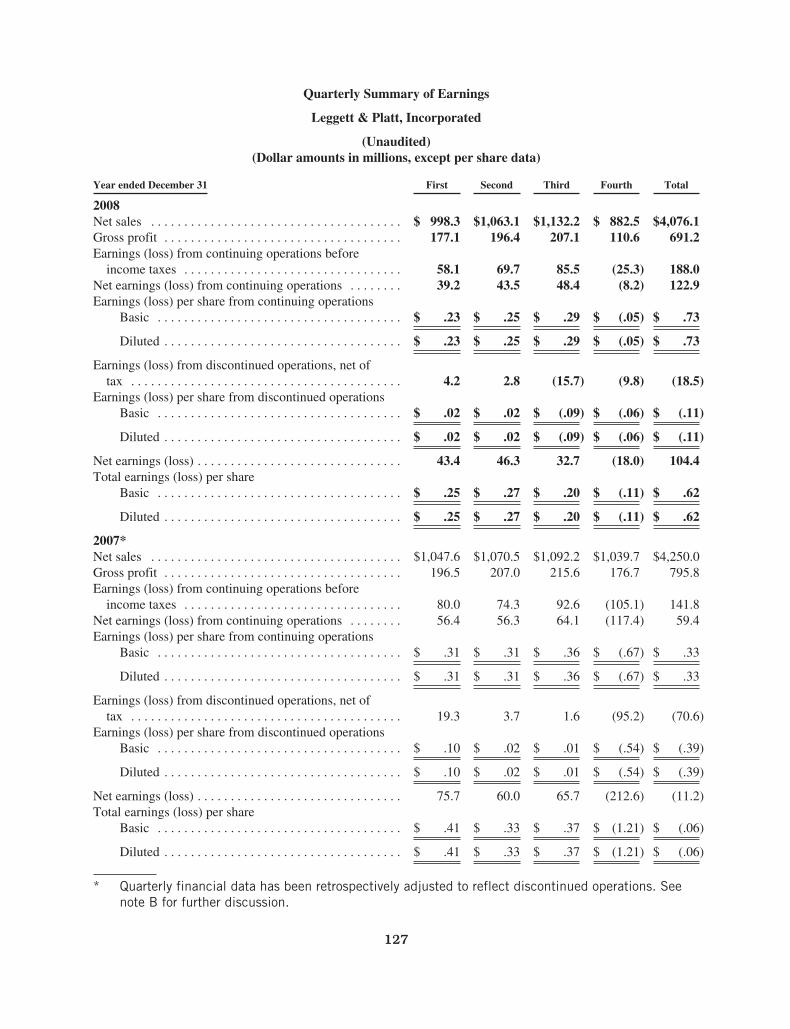
Quarterly Summary of Earnings
Leggett & Platt, Incorporated
(Unaudited)(Dollar amounts in millions, except per share data)
Year ended December 31 First Second Third Fourth Total
2008Net sales . . . . . . . . . . . . . . . . . . . . . . . . . . . . . . . . . . . . . . $ 998.3 $1,063.1 $1,132.2 $ 882.5 $4,076.1Gross profit . . . . . . . . . . . . . . . . . . . . . . . . . . . . . . . . . . . . 177.1 196.4 207.1 110.6 691.2Earnings (loss) from continuing operations before
income taxes . . . . . . . . . . . . . . . . . . . . . . . . . . . . . . . . . 58.1 69.7 85.5 (25.3) 188.0Net earnings (loss) from continuing operations . . . . . . . . 39.2 43.5 48.4 (8.2) 122.9Earnings (loss) per share from continuing operations
Basic . . . . . . . . . . . . . . . . . . . . . . . . . . . . . . . . . . . . . $ .23 $ .25 $ .29 $ (.05) $ .73
Diluted . . . . . . . . . . . . . . . . . . . . . . . . . . . . . . . . . . . . $ .23 $ .25 $ .29 $ (.05) $ .73
Earnings (loss) from discontinued operations, net oftax . . . . . . . . . . . . . . . . . . . . . . . . . . . . . . . . . . . . . . . . . 4.2 2.8 (15.7) (9.8) (18.5)
Earnings (loss) per share from discontinued operationsBasic . . . . . . . . . . . . . . . . . . . . . . . . . . . . . . . . . . . . . $ .02 $ .02 $ (.09) $ (.06) $ (.11)
Diluted . . . . . . . . . . . . . . . . . . . . . . . . . . . . . . . . . . . . $ .02 $ .02 $ (.09) $ (.06) $ (.11)
Net earnings (loss) . . . . . . . . . . . . . . . . . . . . . . . . . . . . . . . 43.4 46.3 32.7 (18.0) 104.4Total earnings (loss) per share
Basic . . . . . . . . . . . . . . . . . . . . . . . . . . . . . . . . . . . . . $ .25 $ .27 $ .20 $ (.11) $ .62
Diluted . . . . . . . . . . . . . . . . . . . . . . . . . . . . . . . . . . . . $ .25 $ .27 $ .20 $ (.11) $ .62
2007*Net sales . . . . . . . . . . . . . . . . . . . . . . . . . . . . . . . . . . . . . . $1,047.6 $1,070.5 $1,092.2 $1,039.7 $4,250.0Gross profit . . . . . . . . . . . . . . . . . . . . . . . . . . . . . . . . . . . . 196.5 207.0 215.6 176.7 795.8Earnings (loss) from continuing operations before
income taxes . . . . . . . . . . . . . . . . . . . . . . . . . . . . . . . . . 80.0 74.3 92.6 (105.1) 141.8Net earnings (loss) from continuing operations . . . . . . . . 56.4 56.3 64.1 (117.4) 59.4Earnings (loss) per share from continuing operations
Basic . . . . . . . . . . . . . . . . . . . . . . . . . . . . . . . . . . . . . $ .31 $ .31 $ .36 $ (.67) $ .33
Diluted . . . . . . . . . . . . . . . . . . . . . . . . . . . . . . . . . . . . $ .31 $ .31 $ .36 $ (.67) $ .33
Earnings (loss) from discontinued operations, net oftax . . . . . . . . . . . . . . . . . . . . . . . . . . . . . . . . . . . . . . . . . 19.3 3.7 1.6 (95.2) (70.6)
Earnings (loss) per share from discontinued operationsBasic . . . . . . . . . . . . . . . . . . . . . . . . . . . . . . . . . . . . . $ .10 $ .02 $ .01 $ (.54) $ (.39)
Diluted . . . . . . . . . . . . . . . . . . . . . . . . . . . . . . . . . . . . $ .10 $ .02 $ .01 $ (.54) $ (.39)
Net earnings (loss) . . . . . . . . . . . . . . . . . . . . . . . . . . . . . . . 75.7 60.0 65.7 (212.6) (11.2)Total earnings (loss) per share
Basic . . . . . . . . . . . . . . . . . . . . . . . . . . . . . . . . . . . . . $ .41 $ .33 $ .37 $ (1.21) $ (.06)
Diluted . . . . . . . . . . . . . . . . . . . . . . . . . . . . . . . . . . . . $ .41 $ .33 $ .37 $ (1.21) $ (.06)
* Quarterly financial data has been retrospectively adjusted to reflect discontinued operations. Seenote B for further discussion.
127

LEGGETT & PLATT, INCORPORATED
SCHEDULE II—VALUATION AND QUALIFYING ACCOUNTS AND RESERVES(Amounts in millions)
Column A Column B Column C Column D Column E
Description
Balanceat
Beginningof Period
AdditionsChargedto Cost
andExpenses Deductions
Balanceat End of
Period
Year ended December 31, 2008 (1)Allowance for doubtful receivables . . . . . . . . . . . . . . . . . . . . . . $23.9 $22.8 $ 8.5(2) $38.2
Excess and obsolete inventory reserve, LIFO basis . . . . . . . . . $35.3 $27.1 $36.2 $26.2
Tax valuation allowance . . . . . . . . . . . . . . . . . . . . . . . . . . . . . . . $55.2 $ 1.7 $10.6(3) $46.3
Year ended December 31, 2007Allowance for doubtful receivables . . . . . . . . . . . . . . . . . . . . . . . $21.9 $ 8.5 $ 6.5(2) $23.9
Excess and obsolete inventory reserve, LIFO basis . . . . . . . . . . . $25.6 $22.5 $12.8 $35.3
Tax valuation allowance . . . . . . . . . . . . . . . . . . . . . . . . . . . . . . . . $37.3 $16.1 $ (1.8)(3) $55.2
Year ended December 31, 2006Allowance for doubtful receivables . . . . . . . . . . . . . . . . . . . . . . . $20.8 $ 4.9 $ 3.8(2) $21.9
Excess and obsolete inventory reserve, LIFO basis . . . . . . . . . . . $34.2 $10.7 $19.3 $25.6
Tax valuation allowance . . . . . . . . . . . . . . . . . . . . . . . . . . . . . . . . $38.0 $ 1.8 $ 2.5(3) $37.3
(1) The balances at December 31, 2008 include assets held for sale of $.5 of allowance for doubtfulreceivables, and $2.9 of excess and obsolete inventory reserve.
(2) Uncollectible accounts charged off, net of recoveries.(3) Federal tax effect of state and foreign net operating loss carryforwards and credits and changes in
currency exchange rates.
128
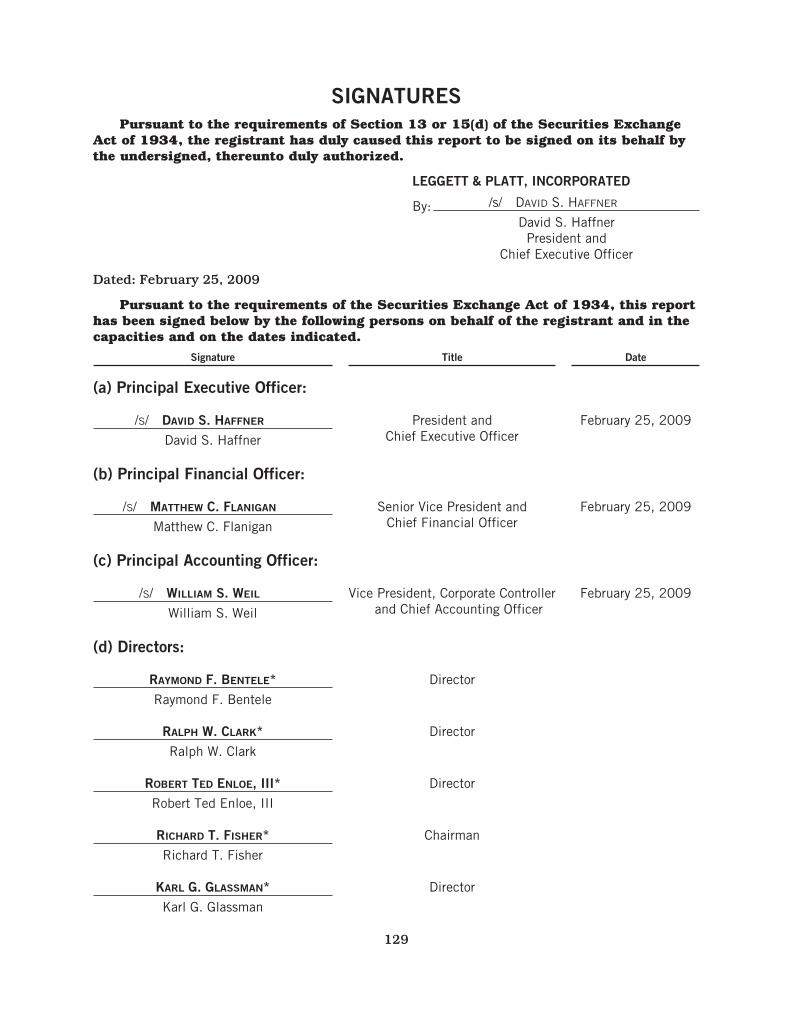
SIGNATURESPursuant to the requirements of Section 13 or 15(d) of the Securities Exchange
Act of 1934, the registrant has duly caused this report to be signed on its behalf bythe undersigned, thereunto duly authorized.
LEGGETT & PLATT, INCORPORATED
By: /s/ DAVID S. HAFFNER
David S. HaffnerPresident and
Chief Executive Officer
Dated: February 25, 2009
Pursuant to the requirements of the Securities Exchange Act of 1934, this reporthas been signed below by the following persons on behalf of the registrant and in thecapacities and on the dates indicated.
Signature Title Date
(a) Principal Executive Officer:
/S/ DAVID S. HAFFNER
David S. Haffner
President andChief Executive Officer
February 25, 2009
(b) Principal Financial Officer:
/S/ MATTHEW C. FLANIGAN
Matthew C. Flanigan
Senior Vice President andChief Financial Officer
February 25, 2009
(c) Principal Accounting Officer:
/S/ WILLIAM S. WEIL
William S. Weil
Vice President, Corporate Controllerand Chief Accounting Officer
February 25, 2009
(d) Directors:
RAYMOND F. BENTELE*Raymond F. Bentele
Director
RALPH W. CLARK*Ralph W. Clark
Director
ROBERT TED ENLOE, III*Robert Ted Enloe, III
Director
RICHARD T. FISHER*Richard T. Fisher
Chairman
KARL G. GLASSMAN*Karl G. Glassman
Director
129
Signature Title Date
DAVID S. HAFFNER*David S. Haffner
Director
JOSEPH W. MCCLANATHAN*Joseph W. McClanathan
Director
JUDY C. ODOM*Judy C. Odom
Director
MAURICE E. PURNELL, JR.*Maurice E. Purnell, Jr.
Director
PHOEBE A. WOOD*Phoebe A. Wood
Director
*By: /s/ ERNEST C. JETT February 25, 2009
Ernest C. JettAttorney-in-Fact
Under Power-of-Attorneydated February 19, 2009
130
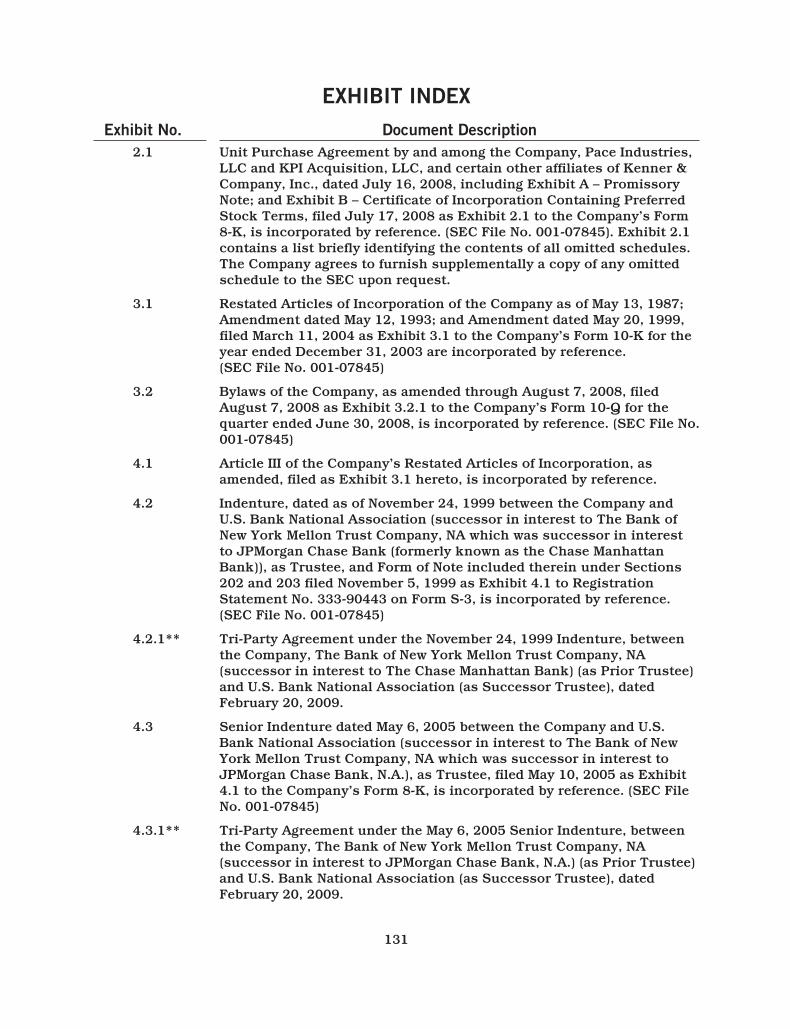
EXHIBIT INDEXExhibit No. Document Description
2.1 Unit Purchase Agreement by and among the Company, Pace Industries,LLC and KPI Acquisition, LLC, and certain other affiliates of Kenner &Company, Inc., dated July 16, 2008, including Exhibit A – PromissoryNote; and Exhibit B – Certificate of Incorporation Containing PreferredStock Terms, filed July 17, 2008 as Exhibit 2.1 to the Company’s Form8-K, is incorporated by reference. (SEC File No. 001-07845). Exhibit 2.1contains a list briefly identifying the contents of all omitted schedules.The Company agrees to furnish supplementally a copy of any omittedschedule to the SEC upon request.
3.1 Restated Articles of Incorporation of the Company as of May 13, 1987;Amendment dated May 12, 1993; and Amendment dated May 20, 1999,filed March 11, 2004 as Exhibit 3.1 to the Company’s Form 10-K for theyear ended December 31, 2003 are incorporated by reference.(SEC File No. 001-07845)
3.2 Bylaws of the Company, as amended through August 7, 2008, filedAugust 7, 2008 as Exhibit 3.2.1 to the Company’s Form 10-Q for thequarter ended June 30, 2008, is incorporated by reference. (SEC File No.001-07845)
4.1 Article III of the Company’s Restated Articles of Incorporation, asamended, filed as Exhibit 3.1 hereto, is incorporated by reference.
4.2 Indenture, dated as of November 24, 1999 between the Company andU.S. Bank National Association (successor in interest to The Bank ofNew York Mellon Trust Company, NA which was successor in interestto JPMorgan Chase Bank (formerly known as the Chase ManhattanBank)), as Trustee, and Form of Note included therein under Sections202 and 203 filed November 5, 1999 as Exhibit 4.1 to RegistrationStatement No. 333-90443 on Form S-3, is incorporated by reference.(SEC File No. 001-07845)
4.2.1** Tri-Party Agreement under the November 24, 1999 Indenture, betweenthe Company, The Bank of New York Mellon Trust Company, NA(successor in interest to The Chase Manhattan Bank) (as Prior Trustee)and U.S. Bank National Association (as Successor Trustee), datedFebruary 20, 2009.
4.3 Senior Indenture dated May 6, 2005 between the Company and U.S.Bank National Association (successor in interest to The Bank of NewYork Mellon Trust Company, NA which was successor in interest toJPMorgan Chase Bank, N.A.), as Trustee, filed May 10, 2005 as Exhibit4.1 to the Company’s Form 8-K, is incorporated by reference. (SEC FileNo. 001-07845)
4.3.1** Tri-Party Agreement under the May 6, 2005 Senior Indenture, betweenthe Company, The Bank of New York Mellon Trust Company, NA(successor in interest to JPMorgan Chase Bank, N.A.) (as Prior Trustee)and U.S. Bank National Association (as Successor Trustee), datedFebruary 20, 2009.
131
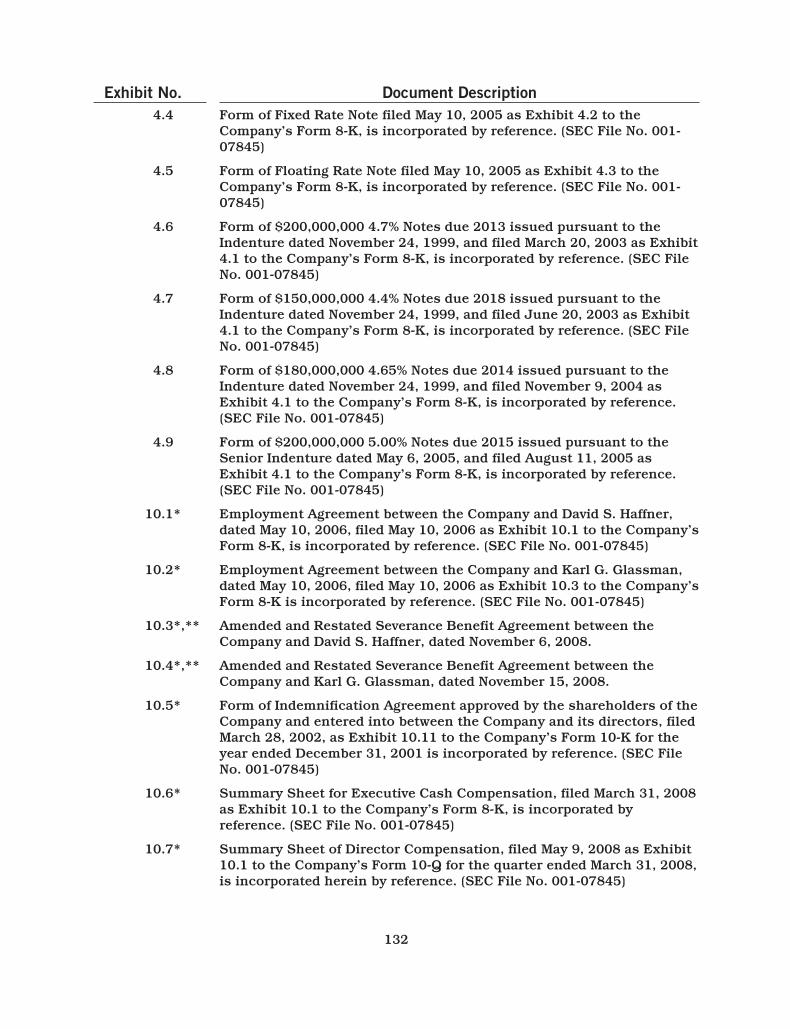
Exhibit No. Document Description4.4 Form of Fixed Rate Note filed May 10, 2005 as Exhibit 4.2 to the
Company’s Form 8-K, is incorporated by reference. (SEC File No. 001-07845)
4.5 Form of Floating Rate Note filed May 10, 2005 as Exhibit 4.3 to theCompany’s Form 8-K, is incorporated by reference. (SEC File No. 001-07845)
4.6 Form of $200,000,000 4.7% Notes due 2013 issued pursuant to theIndenture dated November 24, 1999, and filed March 20, 2003 as Exhibit4.1 to the Company’s Form 8-K, is incorporated by reference. (SEC FileNo. 001-07845)
4.7 Form of $150,000,000 4.4% Notes due 2018 issued pursuant to theIndenture dated November 24, 1999, and filed June 20, 2003 as Exhibit4.1 to the Company’s Form 8-K, is incorporated by reference. (SEC FileNo. 001-07845)
4.8 Form of $180,000,000 4.65% Notes due 2014 issued pursuant to theIndenture dated November 24, 1999, and filed November 9, 2004 asExhibit 4.1 to the Company’s Form 8-K, is incorporated by reference.(SEC File No. 001-07845)
4.9 Form of $200,000,000 5.00% Notes due 2015 issued pursuant to theSenior Indenture dated May 6, 2005, and filed August 11, 2005 asExhibit 4.1 to the Company’s Form 8-K, is incorporated by reference.(SEC File No. 001-07845)
10.1* Employment Agreement between the Company and David S. Haffner,dated May 10, 2006, filed May 10, 2006 as Exhibit 10.1 to the Company’sForm 8-K, is incorporated by reference. (SEC File No. 001-07845)
10.2* Employment Agreement between the Company and Karl G. Glassman,dated May 10, 2006, filed May 10, 2006 as Exhibit 10.3 to the Company’sForm 8-K is incorporated by reference. (SEC File No. 001-07845)
10.3*,** Amended and Restated Severance Benefit Agreement between theCompany and David S. Haffner, dated November 6, 2008.
10.4*,** Amended and Restated Severance Benefit Agreement between theCompany and Karl G. Glassman, dated November 15, 2008.
10.5* Form of Indemnification Agreement approved by the shareholders of theCompany and entered into between the Company and its directors, filedMarch 28, 2002, as Exhibit 10.11 to the Company’s Form 10-K for theyear ended December 31, 2001 is incorporated by reference. (SEC FileNo. 001-07845)
10.6* Summary Sheet for Executive Cash Compensation, filed March 31, 2008as Exhibit 10.1 to the Company’s Form 8-K, is incorporated byreference. (SEC File No. 001-07845)
10.7* Summary Sheet of Director Compensation, filed May 9, 2008 as Exhibit10.1 to the Company’s Form 10-Q for the quarter ended March 31, 2008,is incorporated herein by reference. (SEC File No. 001-07845)
132
Exhibit No. Document Description10.8.1* The Company’s Flexible Stock Plan, amended and restated, effective as
of May 8, 2008, filed March 27, 2008 as Appendix C to the Company’sDefinitive Proxy Statement for the Annual Meeting of Shareholders, isincorporated by reference. (SEC File No. 001-07845)
10.8.2* Form of Non-Qualified Stock Option Award pursuant to the Company’sFlexible Stock Plan, filed November 2, 2006 as Exhibit 10.1 to theCompany’s Form 10-Q for the quarter ended September 30, 2006, isincorporated by reference. (SEC File No. 001-07845)
10.8.3* Form of Restricted Stock Agreement pursuant to the Company’sFlexible Stock Plan, filed November 3, 2004 as Exhibit 10.2 to theCompany’s Form 10-Q for the quarter ended September 30, 2004, isincorporated by reference. (SEC File No. 001-07845)
10.8.4* Form of Performance Stock Unit Award Agreement pursuant to theCompany’s Flexible Stock Plan, filed February 26, 2008 as Exhibit10.11.1 to the Company’s Form 10-K for the year ended December 31,2007, is incorporated by reference. (SEC File No. 001-07845)
10.8.5* Form of Director Restricted Stock Agreement pursuant to theCompany’s Flexible Stock Plan, filed August 7, 2008 as Exhibit 10.1 tothe Company’s Form 10-Q for the quarter ended June 30, 2008, isincorporated by reference. (SEC File No. 001-07845)
10.8.6* Form of Director Restricted Stock Unit Award Agreement pursuant tothe Company’s Flexible Stock Plan, filed August 7, 2008 as Exhibit 10.2to the Company’s Form 10-Q for the quarter ended June 30, 2008, isincorporated by reference. (SEC File No. 001-07845)
10.9* The Company’s 2004 Key Officers Incentive Plan, amended and restatedeffective January 1, 2006 filed March 1, 2006 as Exhibit 10.13 to theCompany’s Form 10-K for the year ended December 31, 2005, isincorporated by reference. (SEC File No. 001-07845)
10.10* Award Formula under the Company’s 2004 Key Officers Incentive Plan,filed March 31, 2008 as Exhibit 10.2 to the Company’s Form 8-K, isincorporated by reference. (SEC File No. 001-07845)
10.11* The Company’s Director Stock Option Plan, as amended and restatedNovember 13, 2002, filed March 18, 2003 as Exhibit 10.13 to theCompany’s Form 10-K for the year ended December 31, 2002, isincorporated by reference. (SEC File No. 001-07845)
10.12* The Company’s Deferred Compensation Program, Amended andRestated, Effective as of December 1, 2007, filed February 26, 2008 asExhibit 10.14 to the Company’s Form 10-K for the year endedDecember 31, 2007 is incorporated by reference. (SEC File No. 001-07845)
10.13* The Company’s Executive Deferred Stock Program, filed March 31, 1999as Exhibit 10.16 to the Company’s Form 10-K for the year endedDecember 31, 1998, is incorporated by reference. (SEC File No.001-07845)
133
Exhibit No. Document Description10.14* The Company’s Pre-2005 Executive Stock Unit Program, as amended
and restated, effective as of December 31, 2004, filed December 10,2004 as Exhibit 10.2 to the Company’s Form 8-K, is incorporated byreference. (SEC File No. 001-07845)
10.15* The Company’s 2005 Executive Stock Unit Program, as amended,effective as of December 31, 2007, filed February 26, 2008 as Exhibit10.17 to the Company’s Form 10-K for the year ended December 31,2007, is incorporated by reference. (SEC File No. 001-07845)
10.15.1* Amendment No. 1 to the Company’s 2005 Executive Stock UnitProgram, filed May 8, 2008 as Exhibit 10.1 to the Company’s Form 8-K;is incorporated by reference. (SEC File No. 001-07845)
10.16*,** Description of long-term disability arrangements between the Companyand certain executives.
10.17* The Company’s Retirement K Excess Program, amended and restatedon November 26, 2007, effective as of January 1, 2007, filed February26, 2008 as Exhibit 10.19 to the Company’s Form 10-K for the yearended December 31, 2007 is incorporated by reference. (SEC File No.001-07845)
10.18* Restated and Amended Employment Agreement between the Companyand Felix E. Wright dated March 1, 1999, filed March 31, 1999 as Exhibit10.2 to the Company’s Form 10-K for the year ended December 31, 1998is incorporated by reference. (SEC File No. 001-07845)
10.18.1* Amendment No. 1 to the Restated and Amended EmploymentAgreement of Felix E. Wright, dated October 1, 2002, filed November 13,2002 as Exhibit 10 to the Company’s Form 10-Q for the quarter endedSeptember 30, 2002 is incorporated by reference. (SEC File No. 001-07845)
10.18.2* Letter Agreement between the Company and Felix E. Wright, datedAugust 6, 2003, filed August 6, 2003 as Exhibit 10.1 to the Company’sForm 10-Q for the quarter ended June 30, 2003 is incorporated byreference. (SEC File No. 001-07845)
10.18.3* Amendment No. 2 to the Restated and Amended EmploymentAgreement of Felix E. Wright, dated August 4, 2004, filed August 5, 2004as Exhibit 10.1 to the Company’s Form 10-Q for the quarter endedJune 30, 2004 is incorporated by reference. (SEC File No. 001-07845)
10.19* Restated and Amended Employment Agreement between the Companyand Harry M. Cornell, Jr. dated as of August 14, 1996, and AmendmentNo. 1 to Employment Agreement dated January 1, 1999, and LetterAgreement dated April 24, 2000 extending term of EmploymentAgreement and Letter Agreement dated March 1, 2001 extending term ofEmployment Agreement, all of which were filed on March 28, 2002 asExhibit 10.1 to the Company’s Form 10-K for the year endedDecember 31, 2001 are incorporated by reference. (SEC FileNo. 001-07845)
134
Exhibit No. Document Description10.19.1* Letter Agreement between the Company and Harry M. Cornell, Jr. dated
November 15, 2002, filed March 18, 2003 as Exhibit 10.2 to theCompany’s Form 10-K for the year ended December 31, 2002 isincorporated by reference. (SEC File No. 001-07845)
10.20 Credit Agreement, dated August 5, 2005 among the Company, WachoviaBank, N.A. as syndication agent, JPMorgan Chase Bank, N.A. asadministrative agent, and the participating banking institutions namedtherein, filed August 9, 2005 as Exhibit 10.1 to the Company’s Form 8-Kis incorporated by reference. (SEC File No. 001-07845)
10.20.1 First Amendment to Credit Agreement, dated July 31, 2006, among theCompany, JPMorgan Chase Bank, N.A. as administrative agent, and theparticipating banking institutions named therein, filed August 3, 2006as Exhibit 10.1 to the Company’s Form 10-Q for the quarter endedJune 30, 2006 is incorporated by reference. (SEC File No. 001-07845)
10.20.2 Second Amendment to Credit Agreement, dated May 1, 2007, among theCompany, JPMorgan Chase Bank, N.A. as administrative agent, and theparticipating banking institutions named therein, filed May 4, 2007 asExhibit 10.3 to the Company’s Form 8-K is incorporated by reference.(SEC File No. 001-07845)
10.20.3 Third Amendment to Credit Agreement, dated September 30, 2008,among the Company, JPMorgan Chase Bank, N.A. as administrativeagent, and the participating banking institutions named therein, filedOctober 2, 2008 as Exhibit 10.4 to the Company’s Form 8-K isincorporated by reference. (SEC File No. 001-07845)
10.21 Assignment and Assumption between Bank of America, N.A. and Bankof Tokyo-Mitsubishi UFJ, Ltd., dated February 22, 2008 (regarding thelending commitment under the Company’s Credit Agreement), filedFebruary 26, 2008 as Exhibit 10.20.1 to the Company’s Form 10-K forthe year ended December 31, 2007 is incorporated by reference. (SECFile No. 001-07845)
10.22 Assignment and Assumption between The Bank of New York andComerica Bank, dated February 22, 2008 (regarding the lendingcommitment under the Company’s Credit Agreement), filed February 26,2008 as Exhibit 10.20.2 to the Company’s Form 10-K for the year endedDecember 31, 2007 is incorporated by reference. (SEC File No. 001-07845)
10.23 Assignment and Assumption between HSBC Bank USA NationalAssociation and ABN AMRO Bank, N.V., dated April 10, 2008 (regardingthe lending commitment under the Company’s Credit Agreement), filedApril 11, 2008 as Exhibit 10.1 to the Company’s Form 8-K, isincorporated by reference. (SEC File No. 001-07845)
10.24 Assignment and Assumption between BNP Paribas and ABN AMROBank, N.V., dated April 10, 2008 (regarding the lending commitmentunder the Company’s Credit Agreement), filed April 11, 2008 as Exhibit10.2 to the Company’s Form 8-K, is incorporated by reference. (SEC FileNo. 001-07845)
135
Exhibit No. Document Description10.25 Assignment and Assumption between BNP Paribas and Arvest Bank,
dated April 10, 2008 (regarding the lending commitment under theCompany’s Credit Agreement), filed April 11, 2008 as Exhibit 10.3 to theCompany’s Form 8-K, is incorporated by reference. (SEC File No. 001-07845)
10.26 Commercial Paper Agency Agreement between JPMorgan Chase Bank,N.A. (formerly The Chase Manhattan Bank, N.A.) and the Company,including the forms of Master Note, dated December 21, 1994, filedMarch 15, 2007 as Exhibit 10.1 to the Company’s Form 8-K isincorporated by reference. (SEC File No. 001-07845)
10.27 Commercial Paper Dealer Agreement between the Company andGoldman, Sachs & Co. (formerly Goldman Sachs Money Markets, L.P.)dated December 21, 1994, filed May 9, 2007 as Exhibit 10.3 to theCompany’s Form 10-Q for the quarter ended March 31, 2007, isincorporated by reference. (SEC File No. 001-07845)
10.28 Commercial Paper Dealer Agreement between the Company and J.P.Morgan Securities, Inc. (formerly Chase Securities, Inc.) datedDecember 21, 1994, filed May 9, 2007 as Exhibit 10.4 to the Company’sForm 10-Q for the quarter ended March 31, 2007, is incorporated byreference. (SEC File No. 001-07845)
10.29 Commercial Paper Dealer Agreement between the Company andSunTrust Capital Markets, Inc. dated February 7, 2005, filed May 9,2007 as Exhibit 10.5 to the Company’s Form 10-Q for the quarter endedMarch 31, 2007, is incorporated by reference. (SEC File No. 001-07845)
10.30 Commercial Paper Dealer Agreement between the Company andWachovia Capital Markets, LLC dated October 10, 2005, filed May 9,2007 as Exhibit 10.6 to the Company’s Form 10-Q for the quarter endedMarch 31, 2007, is incorporated by reference. (SEC File No. 001-07845)
12** Computation of Ratio of Earnings to Fixed Charges.
21** Schedule of Subsidiaries of the Company.
23** Consent of Independent Registered Public Accounting Firm.
24** Power of Attorney executed by members of the Company’s Board ofDirectors regarding this Form 10-K.
31.1** Certification of David S. Haffner, pursuant to Rule 13a-14(a), as adoptedpursuant to Section 302 of the Sarbanes-Oxley Act of 2002, datedFebruary 25, 2009.
31.2** Certification of Matthew C. Flanigan, pursuant to Rule 13a-14(a), asadopted pursuant to Section 302 of the Sarbanes-Oxley Act of 2002,dated February 25, 2009.
32.1** Certification of David S. Haffner, pursuant to 18 U.S.C. Section 1350, asadopted pursuant to Section 906 of the Sarbanes-Oxley Act of 2002,dated February 25, 2009.
32.2** Certification of Matthew C. Flanigan, pursuant to 18 U.S.C. Section1350, as adopted pursuant to Section 906 of the Sarbanes-Oxley Act of2002, dated February 25, 2009.
* Denotes management contract or compensatory plan or arrangement.** Denotes filed or furnished herewith.
136
THIS PAGE LEFT INTENTIONALLY BLANK
Glossary
Annualize: To take a measurement covering a period ofless than one year, and extrapolate it to cover a full year.
Adjusted EPS: earnings per fully diluted share fromcontinuing operations, adjusted to exclude unusual ornon-recurring items such as restructuring-relatedcosts, impairments, customer-related reserves, gainsor losses on sale, one-time tax items, etc. We makethese adjustments to aid the investor in seeing theunderlying trend of earnings without all the ‘noise’.
Basis Point: A unit of measure equal to 1/100th of 1%.
Book Value Per Share: Another term for per shareshareholder equity, or net worth. A company’s totalassets minus total liabilities, divided by the number of shares of stock outstanding.
Business Group or Unit: An organizational subset ofLeggett’s operations; there are currently 10 businessgroups and 20 business units (BUs) in continuingoperations.
Capital Expenditure (Capex): Funds used to purchasephysical assets including property, plant and equipment.
Cash Equivalents: Highly liquid assets; assets that canbe readily converted into cash.
Credit Rating: An evaluation of a company’s ability torepay debt. Ratings are issued by Moody’s, S&P, andFitch. Investors and analysts use these ratings toassess the risk of an investment.
Commercial Paper: Unsecured (i.e. no collateralrequired), unregistered short-term debt that comesdue within 270 days.
De-Contenting: Modifying product design to replacehigher cost components with lower cost components.
Debt to Cap: An indicator of financial leverage; theratio of long-term debt to total capitalization.
Deverticalization: Leggett’s term for encouraging customers to cease making their own components.Leggett becomes their component supplier, freeing themto concentrate on retailing, marketing and assembly.
Dividend: The portion of a company’s profit paid toshareholders, usually in cash.
Dividend Yield: The fraction of the stock price returnedto shareholders annually as dividends (equal to dividends paid divided by stock price). For example, a stock selling for $12.50 that pays shareholders$1.00 in annual dividends has a dividend yield of8.0% (= 1.00 / 12.50).
EBIT: Earnings before interest and taxes.
EBIT Margin: EBIT divided by sales; equal to theamount of EBIT earned per dollar of sales.
EBITA: EBIT + amortization.
EBITDA: EBIT + depreciation + amortization.
EPS: Earnings per share. A company’s after-tax profitdivided by the weighted average number of shares ofstock. For instance, if a company earning $6 millionhad 3 million shares of stock, its EPS would be $2 per share.
Form 10-K: An annual report filed with the SEC bypublic corporations.
Fortune 500: Fortune magazine’s listing of the top 500 U.S. corporations, ranked by annual sales.
Forward Looking Statements: Comments a companymakes regarding beliefs or expectations about the future.
Free Cash Flow: Amount of cash the BU returns to corporate; equal to: EBITDA - Taxes - Capex - Changein Working Capital - Acquisitions + Sales Proceeds.
Geo Components: Product group that includes geotextiles, ground stabilization, geogrids and silt fencing.
Geotextiles: Synthetic fabrics used in drainage protection, erosion control and weed control.
Gondola Shelving: Standard form of upright steel shelving used by large retailers. Typically has a peg-board backing and allows for varied shelf height; can be used to create end caps, wall units, and center aisles.
Goodwill: The premium paid for an acquisition; theamount paid in excess of the fair market value of theassets acquired.
Gross Margin: Gross profit (which is net sales less costof goods sold) divided by net sales.
Hedge: An investment made specifically to reduce oreliminate risks related to items such as interest rates,foreign currency exchange rates, and commodity costs.
Innerspring: The set of steel coil springs, boundtogether, that form the core of about 90% of mattressesin North America.
Intangible Asset: A non-financial asset lacking physicalsubstance; examples include goodwill, patents, trademarks and licenses.
Inter-Segment Sales: Sales of product from one segmentof the company to another (e.g. sales of wire fromLeggett’s Industrial Materials segment to theResidential Furnishings segment).
LIFO: “Last In, First Out;” an inventory accountingmethod that assumes the products acquired last arethe first ones sold.
Long-Term Debt: Liability, such as a bond or a note,that comes due (i.e. must be repaid) more than oneyear into the future.
Maker/User: Leggett’s term for a customer that makesits own components for use in the assembly of a product it manufactures.
Motion Mechanism: The highly-engineered componentthat enables furniture to recline, tilt, swivel, elevate,etc; usually made from steel.
Net Debt: The amount of debt remaining if all cash andcash equivalents are used to pay off debt.
Net Debt to Net Capital: A measure of financial leveragethat allows meaningful comparison to historical peri-ods of higher cash balances; equal to: (Long TermDebt + Current Debt Maturities – Cash & Equivalents)/(Total Capitalization + Current Debt Maturities – Cash& Equivalents).
Net Margin: Net earnings divided by net sales; a measure of after-tax profitability per dollar of sales.Also called net earnings margin.
Net Sales: Overall sales to third parties adjusted fordiscounts and/or return of product. Excludes inter-segment sales.
Organic Sales Growth: Also called “same location salesgrowth” or “internal sales growth.” The amount ofsales increase not attributable to acquisitions; salesgrowth that comes from the same plants and facilitiesthat the company owned one year earlier.
Payout Ratio: The percentage of earnings that is paidto shareholders in the form of dividends.
Point-of-Purchase Display: Temporary or semi-permanent, brand-specific, promotional exhibitlocated in a retail store.
Portfolio Roles: Grow = Profitably grow competitivelyadvantaged positions; Core = Maximize cash in stable, competitive positions; Fix = Rapidly improve (< 12 months), or exit.
Revolving Credit: Contractual agreement to loan up to a specified amount of money, for a specified period oftime; any amounts repaid can be borrowed again.
Return on Shareholders’ Equity: Net earnings divided byshareholders’ equity; a measure of the amount earnedon the investment of the stockholders.
ROGI: After-tax return on gross investment; equal to:(EBITA – Taxes) / (Working Capital + Gross PP&E)
S&P 500: An index of 500 widely-held large-companystocks that reflects the general performance of theU.S. stock market.
Same Location Sales Growth: See Organic Sales Growth.
Segment: A major subset of the company’s operationsthat contains business groups and units. Leggettreports results in four segments.
Shareholders’ Equity: Another term for net worth. Acompany’s total assets minus total liabilities.
Store Fixture: Shelving, display case, rack, cart, kiosk,partition, or cabinet used to hold or present a productin a retail environment.
Steel Rod: Commodity product produced at steel mills.Rod looks like a coil of thick wire and is rolled (orformed) from a billet (which is a long bar of steel).Rod is commonly used to make wire, bolts and nails.
Total Business Unit Return (TBR): Analogous to TSR, butat the BU Level; equal to: (Change in BU MarketValue + Free Cash Flow) / Initial BU Market Value.
Total Capitalization: The sum of four balance sheetitems: long-term debt, other liabilities, deferredincome taxes and shareholder’s equity. In essence, itis a measure of the total amount invested in the firmby both shareholders and lenders.
Total Sales: Net sales plus inter-segment sales.
Total Shareholder Return (TSR): Total benefit investorrealizes from owning our stock; equal to: (Change inStock Price + Dividends) / Initial Stock Price.
Working Capital: The strict accounting definition is: current assets less current liabilities. Many companies,including Leggett, exclude cash and equivalents, as wellas current maturities of long term debt, when analyzinghow efficiently working capital is being utilized.
23201rrdD5R1.fin.qxp:Layout 1 3/4/09 4:11 PM Page 138
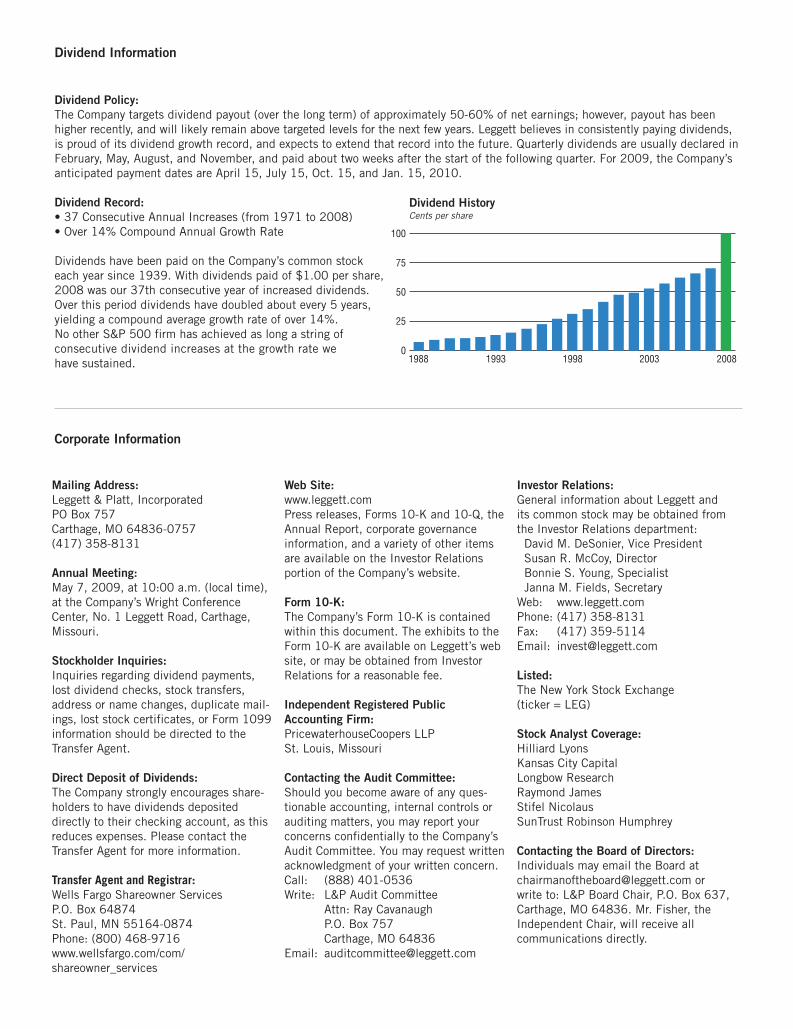
1. Make TSR our key objective:
TSRTSR
CONTENTS
10 Financial Highlights
11 Letter to Shareholders
14 Six Year Financials
15 Stock Performance Graph
15 Corporate Officers
16 Navigating the 10K
Form 10K
Glossary (last page of 10K)
Dividend and Corporate Information (inside back cover)
Leggett at a Glance (back cover)
In late 2007 we unveiled our new strategic direction,
and committed ourselves to 5 key activities. In the
next few pages we remind you of those commitments,
and report on the progress we’ve made.
Dividend Information
Dividend Policy:
The Company targets dividend payout (over the long term) of approximately 50-60% of net earnings; however, payout has beenhigher recently, and will likely remain above targeted levels for the next few years. Leggett believes in consistently paying dividends,is proud of its dividend growth record, and expects to extend that record into the future. Quarterly dividends are usually declared inFebruary, May, August, and November, and paid about two weeks after the start of the following quarter. For 2009, the Company’santicipated payment dates are April 15, July 15, Oct. 15, and Jan. 15, 2010.
Dividend Record:
• 37 Consecutive Annual Increases (from 1971 to 2008)• Over 14% Compound Annual Growth Rate
Dividends have been paid on the Company’s common stockeach year since 1939. With dividends paid of $1.00 per share,2008 was our 37th consecutive year of increased dividends.Over this period dividends have doubled about every 5 years,yielding a compound average growth rate of over 14%. No other S&P 500 firm has achieved as long a string of consecutive dividend increases at the growth rate we have sustained.
Corporate Information
Mailing Address:
Leggett & Platt, IncorporatedPO Box 757Carthage, MO 64836-0757(417) 358-8131
Annual Meeting:
May 7, 2009, at 10:00 a.m. (local time),at the Company’s Wright ConferenceCenter, No. 1 Leggett Road, Carthage,Missouri.
Stockholder Inquiries:
Inquiries regarding dividend payments,lost dividend checks, stock transfers,address or name changes, duplicate mail-ings, lost stock certificates, or Form 1099information should be directed to theTransfer Agent.
Direct Deposit of Dividends:
The Company strongly encourages share-holders to have dividends depositeddirectly to their checking account, as thisreduces expenses. Please contact theTransfer Agent for more information.
Transfer Agent and Registrar:Wells Fargo Shareowner ServicesP.O. Box 64874St. Paul, MN 55164-0874Phone: (800) 468-9716www.wellsfargo.com/com/shareowner_services
Web Site:
www.leggett.com Press releases, Forms 10-K and 10-Q, theAnnual Report, corporate governanceinformation, and a variety of other itemsare available on the Investor Relationsportion of the Company’s website.
Form 10-K:
The Company’s Form 10-K is containedwithin this document. The exhibits to theForm 10-K are available on Leggett’s website, or may be obtained from InvestorRelations for a reasonable fee.
Independent Registered Public
Accounting Firm:
PricewaterhouseCoopers LLPSt. Louis, Missouri
Contacting the Audit Committee:
Should you become aware of any ques-tionable accounting, internal controls orauditing matters, you may report yourconcerns confidentially to the Company’sAudit Committee. You may request writtenacknowledgment of your written concern.Call: (888) 401-0536Write: L&P Audit Committee
Attn: Ray CavanaughP.O. Box 757Carthage, MO 64836
Email: [email protected]
Investor Relations:
General information about Leggett and its common stock may be obtained fromthe Investor Relations department:David M. DeSonier, Vice PresidentSusan R. McCoy, DirectorBonnie S. Young, SpecialistJanna M. Fields, Secretary
Web: www.leggett.comPhone: (417) 358-8131Fax: (417) 359-5114Email: [email protected]
Listed:
The New York Stock Exchange (ticker = LEG)
Stock Analyst Coverage:
Hilliard LyonsKansas City CapitalLongbow ResearchRaymond JamesStifel NicolausSunTrust Robinson Humphrey
Contacting the Board of Directors:
Individuals may email the Board at [email protected] or write to: L&P Board Chair, P.O. Box 637,Carthage, MO 64836. Mr. Fisher, theIndependent Chair, will receive all communications directly.
Dividend HistoryCents per share
01988 1993 1998 2003 2008
100
50
75
25
Dividend HistoryCents per share
23201rrdD1R1.qxp:23201rrdD1R1 3/9/09 7:42 AM Page IC
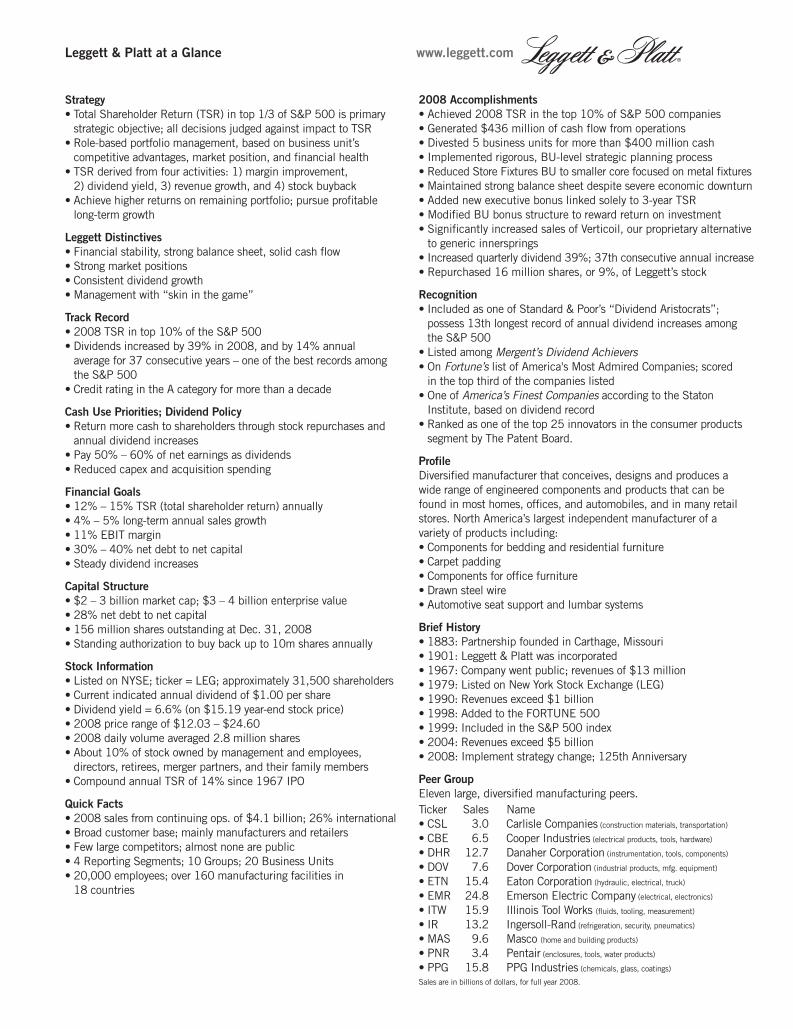
Coming into Focus
2008 Annual Report
Strategy
• Total Shareholder Return (TSR) in top 1/3 of S&P 500 is primarystrategic objective; all decisions judged against impact to TSR
• Role-based portfolio management, based on business unit’s competitive advantages, market position, and financial health
• TSR derived from four activities: 1) margin improvement, 2) dividend yield, 3) revenue growth, and 4) stock buyback
• Achieve higher returns on remaining portfolio; pursue profitablelong-term growth
Leggett Distinctives
• Financial stability, strong balance sheet, solid cash flow• Strong market positions• Consistent dividend growth• Management with “skin in the game”
Track Record
• 2008 TSR in top 10% of the S&P 500• Dividends increased by 39% in 2008, and by 14% annual
average for 37 consecutive years – one of the best records among the S&P 500
• Credit rating in the A category for more than a decade
Cash Use Priorities; Dividend Policy
• Return more cash to shareholders through stock repurchases andannual dividend increases
• Pay 50% – 60% of net earnings as dividends• Reduced capex and acquisition spending
Financial Goals
• 12% – 15% TSR (total shareholder return) annually• 4% – 5% long-term annual sales growth • 11% EBIT margin• 30% – 40% net debt to net capital• Steady dividend increases
Capital Structure
• $2 – 3 billion market cap; $3 – 4 billion enterprise value• 28% net debt to net capital• 156 million shares outstanding at Dec. 31, 2008 • Standing authorization to buy back up to 10m shares annually
Stock Information
• Listed on NYSE; ticker = LEG; approximately 31,500 shareholders• Current indicated annual dividend of $1.00 per share• Dividend yield = 6.6% (on $15.19 year-end stock price)• 2008 price range of $12.03 – $24.60• 2008 daily volume averaged 2.8 million shares• About 10% of stock owned by management and employees,
directors, retirees, merger partners, and their family members • Compound annual TSR of 14% since 1967 IPO
Quick Facts
• 2008 sales from continuing ops. of $4.1 billion; 26% international• Broad customer base; mainly manufacturers and retailers • Few large competitors; almost none are public• 4 Reporting Segments; 10 Groups; 20 Business Units• 20,000 employees; over 160 manufacturing facilities in
18 countries
2008 Accomplishments
• Achieved 2008 TSR in the top 10% of S&P 500 companies• Generated $436 million of cash flow from operations• Divested 5 business units for more than $400 million cash• Implemented rigorous, BU-level strategic planning process• Reduced Store Fixtures BU to smaller core focused on metal fixtures• Maintained strong balance sheet despite severe economic downturn• Added new executive bonus linked solely to 3-year TSR• Modified BU bonus structure to reward return on investment• Significantly increased sales of Verticoil, our proprietary alternative
to generic innersprings• Increased quarterly dividend 39%; 37th consecutive annual increase• Repurchased 16 million shares, or 9%, of Leggett’s stock
Recognition
• Included as one of Standard & Poor’s “Dividend Aristocrats”; possess 13th longest record of annual dividend increases among the S&P 500
• Listed among Mergent’s Dividend Achievers• On Fortune’s list of America's Most Admired Companies; scored
in the top third of the companies listed• One of America’s Finest Companies according to the Staton
Institute, based on dividend record• Ranked as one of the top 25 innovators in the consumer products
segment by The Patent Board.
Profile
Diversified manufacturer that conceives, designs and produces a wide range of engineered components and products that can be found in most homes, offices, and automobiles, and in many retailstores. North America’s largest independent manufacturer of a variety of products including:• Components for bedding and residential furniture• Carpet padding• Components for office furniture• Drawn steel wire• Automotive seat support and lumbar systems
Brief History
• 1883: Partnership founded in Carthage, Missouri• 1901: Leggett & Platt was incorporated • 1967: Company went public; revenues of $13 million• 1979: Listed on New York Stock Exchange (LEG)• 1990: Revenues exceed $1 billion• 1998: Added to the FORTUNE 500• 1999: Included in the S&P 500 index• 2004: Revenues exceed $5 billion• 2008: Implement strategy change; 125th Anniversary
Peer Group
Eleven large, diversified manufacturing peers.Ticker Sales Name • CSL 3.0 Carlisle Companies (construction materials, transportation)
• CBE 6.5 Cooper Industries (electrical products, tools, hardware)
• DHR 12.7 Danaher Corporation (instrumentation, tools, components)
• DOV 7.6 Dover Corporation (industrial products, mfg. equipment)
• ETN 15.4 Eaton Corporation (hydraulic, electrical, truck)
• EMR 24.8 Emerson Electric Company (electrical, electronics)
• ITW 15.9 Illinois Tool Works (fluids, tooling, measurement)
• IR 13.2 Ingersoll-Rand (refrigeration, security, pneumatics)
• MAS 9.6 Masco (home and building products)
• PNR 3.4 Pentair (enclosures, tools, water products)
• PPG 15.8 PPG Industries (chemicals, glass, coatings)
Sales are in billions of dollars, for full year 2008.
Leggett & Platt at a Glance www.leggett.com
23201rrdD1R1.qxp:23201rrdD1R1 3/6/09 6:33 PM Page OC