Company spending on design: Exploratory ... - idi-design.ie · This survey captures design spend...
48
Company spending on design: Exploratory survey of UK firms 2008 F Livesey J Moultrie
Transcript of Company spending on design: Exploratory ... - idi-design.ie · This survey captures design spend...

Company spending on design: Exploratory survey of UK firms 2008
F LiveseyJ Moultrie

AuthorsFinbarr Livesey, Centre for Industry and Government, Institute for Manufacturing,
University of Cambridge
Dr James Moultrie, Design Management Group, Institute for Manufacturing,
University of Cambridge
Project PartnersThis report is an output from the Design Scoreboard project, funded by the AHRC and
EPSRC through the Design for the 21st Century Initiative. Project partners include:
— Cecilia Malvido de Rodriguez from the Institute for Manufacturing,
University of Cambridge
— Professor Kul Pawar, Johann Riedel, Ahmad Beltagui from
Nottingham University Business School
— Professor Steve Evans, Dr Veronica Martinez from Cranfield University
— Dr Jillian MacBryde from University of Strathclyde Business School
— Professor Bill Nixon from University of Dundee
— Dr Peter Demian from Loughborough University
AcknowledgementsThe support and input of Ruth Flood, Head of Research and Knowledge
at the UK Design Council, is greatly appreciated.
We would also like to acknowledge the input from an expert panel and their comments
on an early draft of this report. Panel members included: David Godber (Design Council),
Professor Tom Inns (Dundee University), Rubbina Karruna (Department of Culture
Media and Sport), Ray Lambert (Department of Innovation Universities and Skills),
Gisele Raulik (Design Wales), Bruce Tether (Imperial University) and Jennifer Whyte
(Reading University). The views expressed in this report are the authors, and not
necessarily those of this expert panel.
Survey SponsorsThis survey is jointly financed through the UK Design Council, and the Design Scoreboard
project, funded by the AHRC and EPSRC through the Design for the 21st Century Initiative.
Authors
Foreword
When the bottom fell out of the stock market at the end of last year, I received an
interesting e-mail from a stockbroker friend. While licking his wounds he remembered
a FTSE design index that we published showing that plc’s that used design integrally
outperformed their competitors by 200% through bull and bear markets.
Our own survey of 1,500 firms would indicate that business leaders in the so-called
“real economy” recognize what many city analysts have ignored. Prosperity comes from
turning real ideas into commercial realities. Most recently we observed that business
leaders are increasing their spend on design as they seek to out-compete and out-
innovate in the toughest of market conditions.
There are lessons to be drawn from our national repository of economic evidence on
design. In 2005, our Chairman Sir George Cox, drew from this well of data to provide the
then Chancellor of the Exchequer with recommendations on R&D tax credits, design-led
support for UK firms, and changes to business education.
In 2009, the imperative to harness our design capabilities is even more compelling.
The recent national strategies on Innovation, Manufacturing and Enterprise from
the UK government indicate that government is aware of the role that design can play.
For instance, Secretary of State, John Denham recently announced new measures to
use design to drive innovation in the public sector as well as funding to support design’s
use in commercialising university science research.
This is why we are delighted to support Cambridge University in their new work. It will
add to the national evidence base on design and its role in the economy. It provides us
all with some new methodologies to test and over time could add significantly to our
common understanding of design in industry.
David Kester Chief Executive Design Council

c o m pa n y s pe n d i n g o n d e s i g n | c o n t e n ts �
Contents
Executive summary 6
Part one: Approach 8 Introduction 10 Measuring design spending 12
Part two: Company spending on design 18 Company spending on design 20 Spending on technical design 22 Spending on user design 25 Spending on promotional design 28 Spending on identity design 31 Sector comparisons 34 Design spend by size of company 35
Part three: National spending on design 38 National spending on design 40 Discussion 44
Appendix: data for key graphs 47

This report presents the results of an exploratory survey of company spending on design
in the UK, based on 358 survey responses from companies across the economy collected
in 2008. The total design spend for the companies surveyed was £92 million, representing
2.1% of turnover.
The relatively small sample size means developing a national estimate for private-sector
spending on design is difficult. Estimates range from £50 billion (based on size analysis)
to £60 billion (based on sectoral analysis). For this analysis we use the £50 billion
estimate, to acknowledge the possibility that those companies more likely to respond are
also more likely to have a higher design spend and to reduce the risk of over-estimation
as much as possible. It should be noted that a 95% confidence interval for the sample
ranges from £30 billion to £120 billion.
This survey captures design spend using an inclusive model of design that categorises
spending by purpose rather than by a strict definition of design. This includes design in
developing products and services, and design in promoting products or the company.
This leads to four categories of design spending:
— Technical: design is used to solve technical issues, for example
in mechanical engineering or software design
— User: considers the user experience, user interaction and aesthetics
of products and services
— Promotional design: design of advertising and promotional activities
for specific products and services
— Identity design: design focused on company identity, including branding
Few previous estimates of national private-sector design spending exist due to the
difficulties in collecting such data. The estimate resulting from this work is similar in
order of magnitude to previous work, but there are significant differences based on how
design is defined and how the data was collected.
Including technical design is important, as it allows companies to report a wide variety
of design-related activities that so far have not been well captured. It also provides a link
to R&D and innovation that has not been well represented in past work. There is
a distinct spend above and beyond R&D spending which is captured in the technical
design category, as just over 8% of companies indicate that they claim R&D tax credits
while over 33% have a technical design spend.
Technical design spending represents 81% of the total design spend reported by the
companies surveyed and thus dominates the value of design spending. However, in
terms of the proportion of companies reporting each type of spend, promotional design
is the highest, with over 66% of companies having such a spend.
Executive summary
c o m pa n y s pe n d i n g o n d e s i g n | e x e c u t i v e s u m m a ry �

Sectoral differences in design spending are strong, with other business activities
(Standard Industrial Code division K) reporting the highest average percentage of
turnover spent on design, both overall (6.4%) and in each category. Manufacturing
(SIC division D) has a strong average spend on technical design (£698K per company)
but does not lead in terms of percentage of turnover (3.6%). Wholesale (SIC division G)
has a surprisingly high percentage of turnover spent on technical design (2.1%) and
promotional design (1.4%), while construction (SIC division F) has a low percentage of
turnover spent in all four categories (1.2% overall). These results indicate that significant
work remains to be done to better understand the importance of each type of design in
various sectors.
A high level of skew occurs in the data reported, as over 15% of companies claim no
design spend and 37% have a design spend of between zero and £10K. This high skew
means these results need to be interpreted carefully and further data collection is
necessary to verify and expand them.
This report is seen as a proof of principle that reliable and comparable data on design
spending can be collected across the economy. It is hoped that it will act as a catalyst to
further work and the development of a standard for the reporting of design spending,
akin to the standards for R&D spending.
The following recommendations are made for further work:
1. Developing a standard for design spending that is applicable across sectors and size of
company, developed in consultation with company managers and policymakers.
2. Investing in further surveys of private-sector spending in the UK to establish a baseline
and to improve the accuracy of national estimates of design spend.
3. Instigating surveys in key competitor countries to enable comparison between nations.
Figure 1 – Estimate of national design spending by category
c o m pa n y s pe n d i n g o n d e s i g n | e x e c u t i v e s u m m a ry �
Non
tech
nica
l (£b
n)Te
chni
cal (
£bn)
In house (£bn) Outsourced (£bn)

Part one:Approach


The role of design, both at the company and country level, is increasingly being
recognised as important. As the Department of Trade and Industry (DTI) commented in
2005: “Design, as a structured creative process, is an important competitive tool for firms
in many sectors…”1 Some consider it to be an important driver of innovation, acting as a
bridge between technical and customer-oriented functions. In the broadest sense, design
has been described as linking creativity and innovation.2
Measuring what companies spend on design, however, has been problematic due to a
lack of an agreed framework for such measurements or a bounded definition of design.
Without the ability to measure design spend, it is impossible to understand its impact on
company and national performance.
This report directly addresses this issue, presenting the results of an exploratory UK-based
survey of company spending on design. The primary aim of the survey is to demonstrate
that reliable and consistent data can be collected on what companies of differing sizes
in different sectors spend on design. The secondary aim is to provide a national estimate
of private-sector spending on design in the UK.
Design spending data for 358 UK companies across the economy is presented and an
estimate of national design spending is developed. This data, based on a four-part model
of design spending, is the first comparable data for design spending in UK companies
and is an important first step in understanding how such spending affects company and
national competitiveness.
Existing data on design spendingA small number of attempts to quantify company spending on design have been made
already. These have either defined design in a very narrow sense or left the decision
on what to include as design up to the survey respondent. Neither approach allows a
comprehensive and repeatable picture of design spending to be developed.
At the company level, the most comprehensive data is from a 1997 study by Sentance
and Clark.3 They surveyed around 800 manufacturing firms in the UK, a sample they
felt represented approximately a fifth of the UK’s manufacturing industries. They
captured spend as a percentage of turnover, by giving respondents a range of banded
options. As a result, they estimated that UK manufacturers invested around £10 billion
on product development and design. Interestingly, this compares with the official figure
of £7 billion spent on R&D during the same year. However, the survey was restricted to
the manufacturing sector and so did not capture any spend elsewhere in the economy.
Furthermore, it used a narrow view of design focused on product development.
Introduction
1 DTI (2005) Creativity, Design and Company Performance: DTI Economics Paper 15, November 2005.
2 Cox, G. (2005) The Cox Review of Creativity in Business, HM Treasury available online at http://www.hm-treasury.gov.uk/coxreview_index.htm.
3 Sentance, A & Clark, J (1997) The contribution of design to the UK economy. Design Council Research Workshop 1997. The Design Council, London.
4 Design Council (2005) The Business of Design, Design Council, London.
c o m pa n y s pe n d i n g o n d e s i g n | a p p roac h 1 0

In 2005, the Design Council estimated the size of the design industry based on
2,433 telephone interviews with designers from design consultancies, freelancers and
in-house teams.4 They estimated the turnover of the design sector to be £11.6 billion,
with £5.1 billion in turnover from design consultancies, £2.0 billion for freelancers and
£5.5 billion for in-house teams.5 While this is a reliable national estimate for the design
industry, it is a supply-side rather than demand-side estimate and does not allow us to
discuss what individual companies are spending on design.
Unfortunately, while the Community Innovation Survey (CIS) asks whether companies
spent on “design functions for the development or implementation of new or improved
goods, services and processes,”6 the analysis papers available do not provide a national
estimate for design based on these estimates.
Finally, as part of the CoInvest project,7 Jonathan Haskell estimates the total expenditure
and investment in architecture and engineering design activities. For 2004,
private-sector spending on purchased architecture and engineering design services
is estimated to be around £17 billion while spending on own-account (i.e. in-house)
architecture and engineering design services was £27 billion. However, this is again
a narrow interpretation of design, bounded by the existing Standard Industrial Code
(SIC) structure.
The relatively small number of studies that attempt to estimate design spending, either
at the company or country level, highlights the difficulty of this task. Also, the results that
are available show high variation depending on what is included and what is excluded
from the definition of design (for example, architecture). The following section outlines
the model developed for the survey of design spend, and it is hoped that this acts as a first
step towards a common framework for estimating design spending at a company level.
5 These values do not sum to £11.6 billion due to outsourcing of some work, which was taken into account by the Design Council in arriving at the national estimate.
6 Further details on the UK responses to the CIS can be found at http://www.berr.gov.uk/dius/innovation/innovation-statistics/cis/page10957.html.
7 See http://www.coinvest.org.uk/bin/view/CoInvest for further details.
c o m pa n y s pe n d i n g o n d e s i g n | a p p roac h 1 1
The varied definition and interpretation of ‘design’ makes collecting data on design
spend very difficult. This lack of an agreed, concise and usable definition for design is
problematic both in industry, where it creates misconceptions which lead to mistrust
and misuse of design skills, and in research, where the lack of precision makes
interpreting potentially useful data difficult.
It is clearly possible to determine any number of classification schemes for design,
each of which is valid, given the context and the purpose of that classification.
The challenge for measuring company design spend is to have a model that can
flexibly apply across sectors and contexts.
As part of the Design Scoreboard project,8 a review of relevant literature and several
detailed case studies were carried out to better understand how companies think about
and use design. From this, a model for capturing design spend was developed based on
the purpose of the activities – whether they were in support of creating products and
services or to promote the company and its products. At this early stage of developing
an estimate of design spending, we have not tried to distinguish between investment
and expenditure, and have just focused attention on how much firms spend. This is
because it is unclear what could or should be categorised as investment as opposed to
expenditure. Once a framework for capturing design spending is established, further
refinement may be possible. The following sections discuss these concepts and provide
an overview of the model used.
Design in the creation of products and servicesDesign plays a key role as products and services are being developed. Bruce & Bessant
suggested that design is the “purposive application of creativity to all the activities
necessary to bring ideas into use either as product (service) or process innovations.”9
This is the key reason for confusion in separating what is design and what is R&D.
As products and services are being created, there are two distinct focuses for the use of
design. The first is when design is used to resolve technical issues. This might include
engineering skills such as mechanical engineering, electrical engineering and software
design. It might also include the design of production processes and technologies
necessary to deliver services.
The second is user-focused design, which has its basis in the arts or in the consideration
of the user experience. This might include product aesthetics, ergonomics, interfaces
with software and the experience of the overall service.
This distinction can be seen in software development, where software engineers design
the functional aspects of a software package (technical) as well as designing the interface
between the user and the software (user).
Measuring design spending
8 Funded through the Designing for the 21st Century initiative www.design21.dundee.ac.uk
9 Bruce, M & Bessant, J (2002) Design in Business: Strategic Innovation Through Design, New York: Financial Times/Prentice Hall.
c o m pa n y s pe n d i n g o n d e s i g n | a p p roac h 1 2

Design in promoting products, services and the businessDesign also plays a role in other aspects of the business, specifically in communications
and branding activities. These aspects of design are relevant in all firms, including those
that do not frequently engage in developing new products and services.
In the British Standard guide to managing design,10 distinction is made between two
aspects of design not specifically related to product or service development:
— Identity design: physical, operational and human features and values
that give the organisation its unique personality
— Promotional design: advertising, promotional literature, packaging, instructions,
manuals, presentations, showroom environments, displays in stores, the
appearance, courtesy and knowledge of staff, professionalism of delivery,
helplines, web-help, service workshops etc
This distinction is interesting, in that the former category applies at a corporate level,
while the latter can be considered for individual product/service lines.
Model of design spendThe model of design spend developed for this survey (outlined in figure 2) does not try
to provide an exhaustive list of types of design or design activities (e.g. industrial, graphic,
fashion, multimedia etc.). Instead, by focusing on the key activities of developing new
products and services and communicating brand and identity, we are able to discuss
design in a manner which is flexible and applies across sectors.
Figure 2 – A conceptual model of design spend
10 BS 7000-10:1995, design management systems — part 2, London: British Standards Institute
c o m pa n y s pe n d i n g o n d e s i g n | a p p roac h 1 3
Design in the creation of products and services
Design in the communication, promotion and delivery of products and services or the overall business
Design relating to the technical/engineering aspects of creating products and services
Design of the user experience in the creation of products and services
Design as part of promotion, communication, branding, and distribution of products and services
Design as part of developing promoting, and communicating the corporate identity
Non-technical design
Technical design

In House
Outsourced
Within £1K
Within £10K
Within £50K
Within £100K
Can’t estimate
Precision of estimate (please tick as appropriate, to indicate the relative precision of your estimate)
Estimate of design spend
£K
£K
Design is perhaps most commonly perceived as relating to the visual and experiential
outputs from firms, including product aesthetics, ergonomics, promotion and branding.
However, in many firms, there is also significant design work relating to the technical
aspects of new products and services. The model used to capture design spend
brings together both of these sides of design, and provides a way for the breadth of
design activities to be recognised, in order to provide a realistic estimate of design
spending in a company.
The model clearly highlights the overlap of design with R&D, due to the inclusion of
technical design. Pure research, as included within R&D, may never reach the market
place, and encompasses more speculative and long term work. Technical design work
is much closer to market, and will result in the products and services produced by
the company. It is recognised that it is difficult to draw a clear line between design,
R&D and innovation, although this categorisation is intended to clarify the distinction.
MethodologyThe purpose of this survey is to demonstrate that data on design spend in companies
can be collected and to use that data to develop an estimate of national private-sector
design spending. Collecting such data on design spending in companies across the UK
economy is a very difficult task. To date, there have been no requirements for companies
to report design spending and so there is a lack of understanding and interest in
providing the data. In addition, design permeates an organisation and therefore is not the
responsibility of any one budget-holder. Furthermore, companies are naturally reluctant
to provide financial data in surveys.
The initial development of the survey instrument was based on an in-depth literature
review and eight company case studies investigating how they perceived design
spending. The initial survey instrument was piloted in 10 companies, and after
further revisions an attempt to trial the final instrument was made using a two-step
approach, where companies were asked for a relevant contact and then emailed the
survey instrument. Due to difficulties in generating responses, the instrument was
revised and simplified for use in direct telephone interviews.
The improvements to the survey instrument were key to achieving acceptable response
rates for the final survey. We realise that direct telephone interviews reduce data quality,
as respondents do not have time to consult records or colleagues. However, as our aim
was a proof of principle this was thought to be acceptable.
Companies were asked the same question on design spend in each of the four categories
(technical, user, promotional, identity) and at the same time were asked to provide an
estimate of the precision of their answer (see figure 3). This allows us to understand the
confidence level of the respondent and to develop a self-reported error for the national
estimates of design spend.
Figure 3 – Structure of design spend question
c o m pa n y s pe n d i n g o n d e s i g n | a p p roac h 1 4

c o m pa n y s pe n d i n g o n d e s i g n | a p p roac h 1 �
Data collection was carried out by Stratagia Limited in association with Synchronicity
Consultants and QA Research, under contract to the research team. Overall 3,334 contacts
were used, leading to 834 successful contacts and 428 responses, a base rate of 12.8%.
This set was reduced to 358 responses for analysis because:
— 61 companies did not report turnover and their turnover could not be obtained
via Companies House due to their size
— Six companies had a reported design spend as a percentage of turnover
greater than 1
— A further three companies were removed because their reported design spend as
a percentage of turnover was greater than 0.5 and these companies could not be
contacted to confirm their responses
The final data set of 358 companies is broadly representative of the UK economy, with an
over-representation of manufacturing firms (see table 1).
The overall size of the sample means national estimates will potentially have a significant
error and therefore the estimates should be used with care. Also, the dominant group
in division K is Other Business Services, and so this is the title that will be used for this
section of the sample in further analysis.
Table 1 – Survey population by Standard Industrial Code (SIC)
Division
A, B
C, E
D
F
G
H
I
J
K
M
N
O
Industry description
Agriculture, Hunting and Forestry; Fishing
Mining & Quarrying; Electricity, Gas & Water Supply
Manufacturing
Construction
Wholesale and Retail Trade; Repairs
Hotels and Restaurants
Transport, Storage and Communication
Financial Intermediation
Real Estate, Renting and Business Activities
Education
Health and Social work
Other Community, Social & Personal Service Activities
Total numbers of companies
Whole economy
4.0%
0.2%
7.3%
20.6%
13.0%
3.1%
6.1%
1.5%
24.8%
2.9%
5.5%
10.9%
4,466,700
Survey
0.0%
0.3%
22.6%
15.6%
19.0%
9.5%
0.6%
1.1%
21.2%
0.8%
2.8%
5.9%
358

Part two:Company spending on design
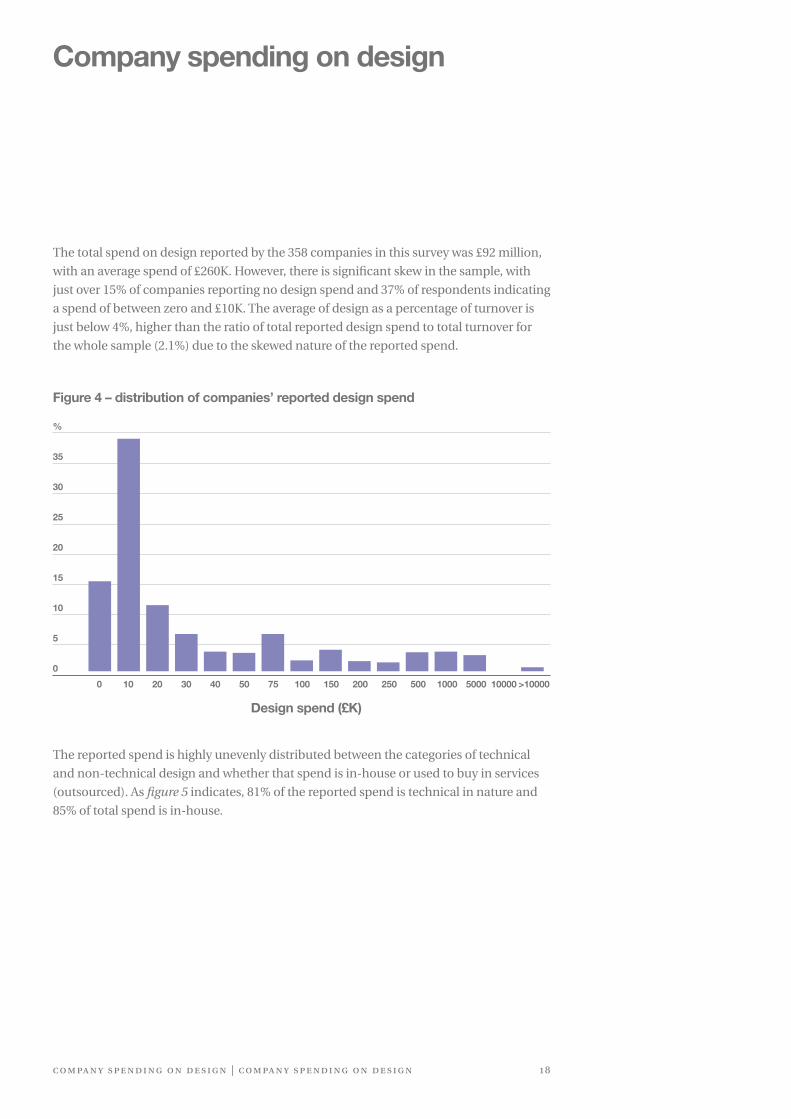
The total spend on design reported by the 358 companies in this survey was £92 million,
with an average spend of £260K. However, there is significant skew in the sample, with
just over 15% of companies reporting no design spend and 37% of respondents indicating
a spend of between zero and £10K. The average of design as a percentage of turnover is
just below 4%, higher than the ratio of total reported design spend to total turnover for
the whole sample (2.1%) due to the skewed nature of the reported spend.
Figure 4 – distribution of companies’ reported design spend
Company spending on design
The reported spend is highly unevenly distributed between the categories of technical
and non-technical design and whether that spend is in-house or used to buy in services
(outsourced). As figure 5 indicates, 81% of the reported spend is technical in nature and
85% of total spend is in-house.
%
35
30
25
20
15
10
5
0
0 150 200 250 500 1000 5000 10000 >1000010 20 30 40 50 75 100
Design spend (£K)
c o m pa n y s pe n d i n g o n d e s i g n | c o m pa n y s pe n d i n g o n d e s i g n 1 8

c o m pa n y s pe n d i n g o n d e s i g n | c o m pa n y s pe n d i n g o n d e s i g n 1 9
Figure 5 – Design spending (£M) for survey sample of 358 companies
Non
tech
nica
l (£m
)Te
chni
cal (
£m)
In house (£m) Outsourced (£m)

The definition of technical design used in this survey includes the production of drawings
and prototypes or the design of IT systems to enable services. This type of spend is the
closest to R&D and most commentators believe there is an overlap. As noted above,
spending on technical design dominates the total spend on design for the companies
surveyed, with 81% of the total design spend categorised by respondents as technical.
However, it appears that the companies surveyed do not consider there to be a significant
overlap between R&D and technical design, as only 8.6% of companies in the sample
indicated that they claim R&D tax credits whereas 33.4% report internal technical design
spend on developing products and services. This may indicate that companies who could
claim R&D tax credits do not do so, or that technical design is reliably distinct from R&D
spending. Given that four times as many companies indicate a technical design spend
than claim R&D tax credits, this remains an important open question.
Overall, these results show a complicated picture for technical design spending. The
average spend on technical design tells the expected story, with manufacturing having
the highest average spend. However, in comparing design spend as a percentage of
turnover, there is a similar amount of technical work in wholesale and other business
activities, which was not expected. The varied nature of companies responding is
highlighted by the fact that 205 companies out of 358 reported no technical design spend.
Average technical design spendAverage technical spend for all companies was £211K, with just over 10% of that spend
being outsourced. The highest average spending by some margin was in manufacturing,
at £698K compared to the next highest average of £171K in wholesale and retail.
Looking at how average spending on technical design varied by size of company, it is
immediately apparent that average technical design spend increased significantly for
larger companies (see figure 7). As the number of companies over 250 employees is low
(18 for this sample) this average could be overstated. However, the rise is marked and it
can be expected that this pattern should hold for a larger sample.
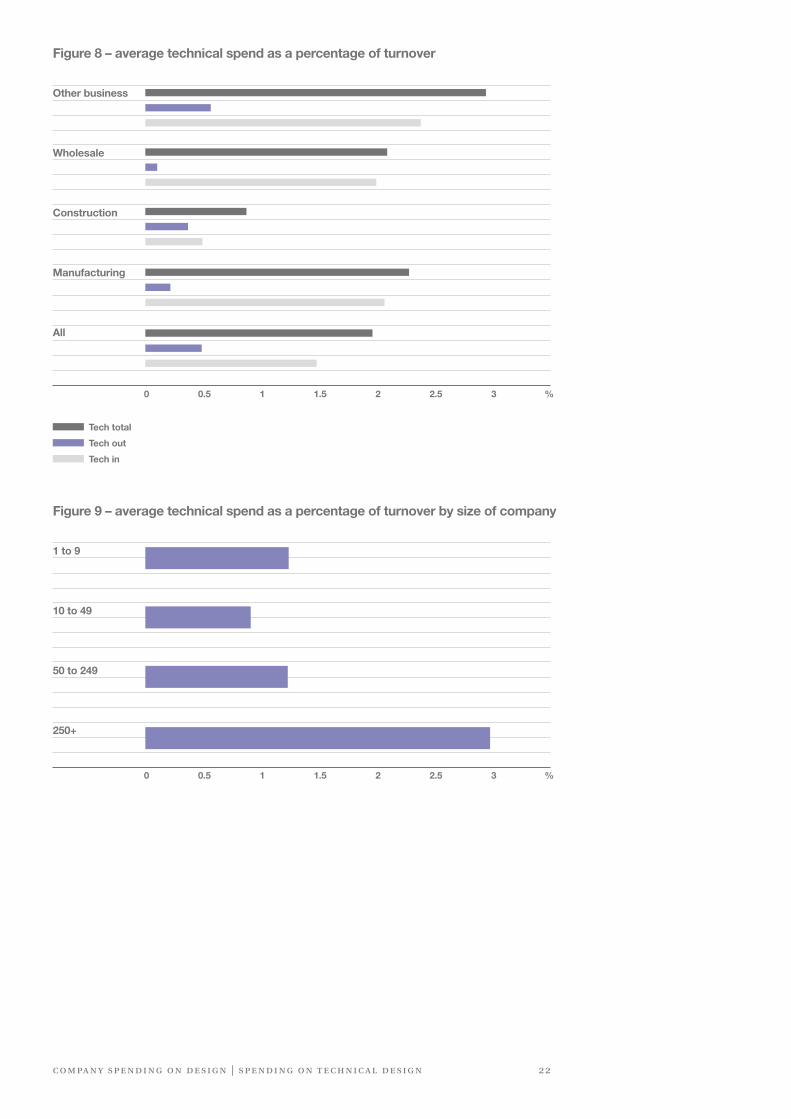
Technical design spend as a percentage of turnoverIn terms of design spend as a percentage of turnover, manufacturing is second to
other business activities (2.3% compared to 3.0% of turnover) in this sample. There is
surprisingly little technical design spend as a percentage of turnover in construction and
a significant element of technical design spending in wholesale.
By size of company, there is an interesting U-shaped pattern, with small (0 – 9 employees)
companies’ relative spend at 1.6% of turnover and large companies (more than 250
Spending on technical design
c o m pa n y s pe n d i n g o n d e s i g n | s pe n d i n g o n t e c h n i c a l d e s i g n 2 0

Tech in
Tech out
Tech total
employees) double that at just over 3% of turnover (see figure 9). In between, companies
with 10 to 49 employees had a relative spend of just under 1% and those with 50 to 249
employees had an intensity of 1.3%. This may reflect the need for new young companies
to move from a prototype to a working product and for large companies to carry out
significant technical design to produce large volumes or complex systems.
Figure 6 – average absolute technical spending (£K)
All Manufacturing Construction Wholesale Other business
c o m pa n y s pe n d i n g o n d e s i g n | s pe n d i n g o n t e c h n i c a l d e s i g n 2 1
800
700
600
500
400
300
200
100
0
3000
2500
2000
1500
1000
500
0
Figure 7 – average technical spend (£K) by size of company
1 to 9 10 to 49 50 to 249 250+
c o m pa n y s pe n d i n g o n d e s i g n | s pe n d i n g o n t e c h n i c a l d e s i g n 2 2
Figure 8 – average technical spend as a percentage of turnover
Tech total
Tech out
Tech in
Other business
Wholesale
Construction
Manufacturing
All
0 0.5 1 1.5 2 2.5 3
Figure 9 – average technical spend as a percentage of turnover by size of company
1 to 9
10 to 49
50 to 249
250+
0 0.5 1 1.5 2 2.5 3
%
%
Developing new products and services can involve significant effort in designing the
aesthetics, ergonomics and interfaces of products as well as manuals and multi-media
to support service delivery. This category of user design is the first of the non-technical
categories and is the bridge between the unseen interior of products and services and the
user. Again the skew of the data is significant, with 243 companies reporting no spend in
this category.
Average user design spend Average spending on user design for the companies surveyed was £11.6K, with a
maximum reported of £520K. The scale difference between this kind of spend and
technical design spend is striking, which may reflect the specialised equipment often
required to support technical design work.
In terms of average spend, only construction has more outsourced than in-house spend,
although it is the lowest average spend. Other business activities have the highest average
spend, with a significant proportion outsourced.
The highest average spend by size of company was for those with 50 – 249 employees
(see figure 11) at just under £34K. There is an inverted-U pattern with small companies
spending least on average on user design (£1.3K), and large companies also having a low
average spend in this category (£8.3K).
User design spend as a percentage of turnoverThe intensity of spending on user design varies significantly between sectors, with other
business services at 0.64% of turnover compared to manufacturing at 0.37% of turnover.
The companies reporting in the construction sector again stand out as having a very low
relative intensity of user design spend. This may be the nature of the sector but it appears
to be a significant difference. Expectations that manufacturing would have the highest
user spending are not fulfilled and wholesale again has a high intensity relative to the
other sectors.
Company size appears to have the same pattern for intensity of user design to the
average absolute spend. However, the highest spend as a percentage of turnover is
for companies with 10 – 49 employees (see figure 13) at 0.3% of turnover. The lowest
intensity for user design spend is in the largest companies, with just 0.01% of turnover
spent in this category.
Spending on user design
c o m pa n y s pe n d i n g o n d e s i g n | s pe n d i n g o n u s e r d e s i g n 2 3

Figure 10 – average absolute spending on user design (£K)
User in
User out
User total
25
20
15
10
5
0All Manufacturing Construction Wholesale Other business
c o m pa n y s pe n d i n g o n d e s i g n | s pe n d i n g o n u s e r d e s i g n 2 4
Figure 11 – average absolute spend on user design (£K) by company size
40
35
30
25
20
15
10
5
0
1 to 9 10 to 49 50 to 249 250+

Figure 12 – average user design spending as a percentage of turnover
User total
User out
User in
Other business
Wholesale
Construction
Manufacturing
All
0 0.1 0.2 0.3 0.4 0.5 0.6 %
c o m pa n y s pe n d i n g o n d e s i g n | s pe n d i n g o n u s e r d e s i g n 2 �
Figure 13 – average user design spending as a percentage of turnover by company size
1 to 9
10 to 49
50 to 249
250+
0 0.05 0.1 0.15 0.2 0.25 0.3 %

This category includes the design of advertisements, brochures, showrooms, exhibition
stands, and point of sale materials for specific products. This is distinct from the overall
management of a company’s brand, which is the last category of spending.
In contrast to technical and user design, a much smaller number (120) of companies
reported no spend in this category. As a more traditionally understood design
function this may not be surprising, but it does indicate where design is traditionally
thought to operate and to add value. Whether this is where it does add most value is an
open question.
Average promotional design spendThe average promotional design spend for this sample is £28K, with 36% of that spend
being outsourced, to the greatest extent in construction. The sector with the highest
average spend was wholesale, with an average spend of £44K, possibly reflecting the
nature of competition in the sector.
Companies with over 250 employees have the highest average spend at just over £170K
and the average spend appears to increase with company size (see figure 15). This
would support a model for promotional spend where the design effort in promotional is
proportional to the size of the company, i.e. there is a scale affect that does not plateau.
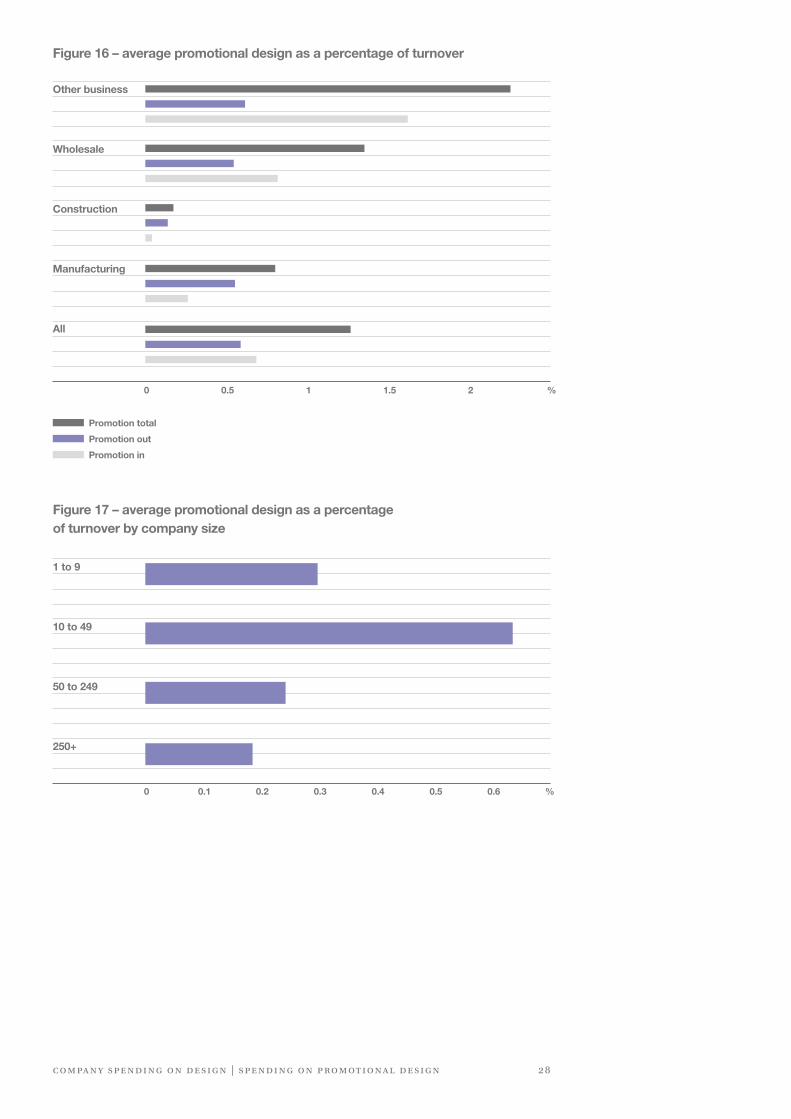
Promotional design as a percentage of turnoverThe intensity of promotional design spending as a percentage of turnover is highest
for other business activities, with 2.2% of turnover spent in this category, followed by
wholesale at 1.3% and manufacturing third at 0.8%.
These results indicate that the relative need for promotion is highest in other business
activities, whereas it might be expected that as a competitive differentiator it would
be most required in wholesale. There appears to be little relative spend in construction,
again identifying it as a very different sector in terms of design input.
In contrast to the absolute spends by size of company, the relative promotional
spend peaks for companies with between 10 and 49 employees at 0.6% (see figure 17).
The other three size categories all have approximately the same intensity at around
0.3% of turnover. This may, if company size is strongly linked to age of the company,
indicate that as companies grow they go through a period where there is a need for
relatively greater design focus on promotion.
Spending on promotional design
c o m pa n y s pe n d i n g o n d e s i g n | s pe n d i n g o n p ro m ot i o n a l d e s i g n 2 �

Figure 14 – average absolute spend on promotional design (£K)
Promotion in
Promotion out
Promotion total
45
40
35
30
25
20
15
10
5
0All Manufacturing Construction Wholesale Other business
c o m pa n y s pe n d i n g o n d e s i g n | s pe n d i n g o n p ro m ot i o n a l d e s i g n 2 �
Figure 15 – average absolute spend on promotional design (£K) by company size
180
160
140
120
100
80
60
40
20
01 to 9 10 to 49 50 to 249 250+
c o m pa n y s pe n d i n g o n d e s i g n | s pe n d i n g o n p ro m ot i o n a l d e s i g n 2 8
Figure 16 – average promotional design as a percentage of turnover
Promotion total
Promotion out
Promotion in
Other business
Wholesale
Construction
Manufacturing
All
0 0.5 1 1.5 2 %
Figure 17 – average promotional design as a percentage of turnover by company size
1 to 9
10 to 49
50 to 249
250+
0 0.1 0.2 0.3 0.4 0.5 0.6 %
The final category of spending is identity design, which includes the design of logos,
corporate identity, business websites, uniforms, and business colour schemes. It is
intended to capture the design of the whole company identity as distinct from design
of individual products and services or their promotion. For many commentators not
directly involved in design this is the first and last category of design. However, this is only
one element of design spending and in average terms is the lowest over this sample.
The categories of promotional and identity design will overlap in reporting (as some
companies find it difficult to separate the two if there are few product lines) but it is
interesting to see how promoting products demands higher levels of spending (in terms
of percentage of turnover, roughly double both by sector and by size of company). This
could be a reflection of how often a company will consider its image and branding at the
strategic level compared to having to promote products as they are brought to market.
Even though it has the lowest average spend over the sample, identity design was the
second most reported category, with 197 companies reporting spending.
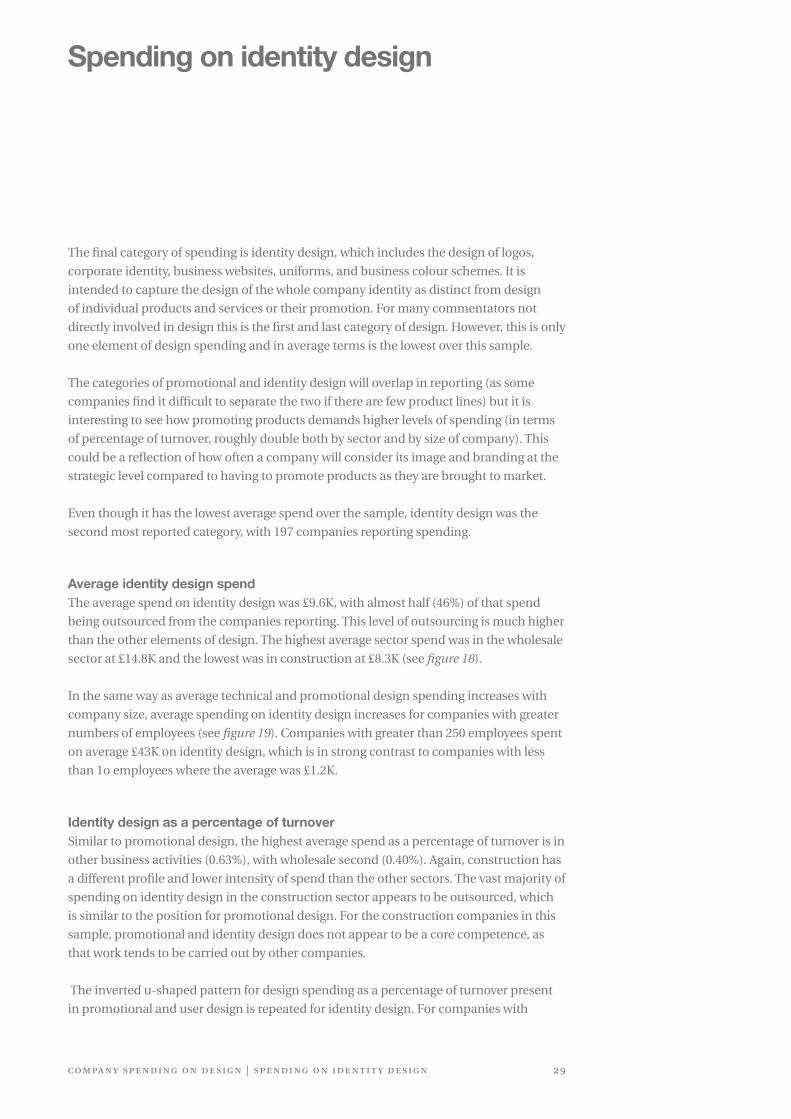
Average identity design spendThe average spend on identity design was £9.6K, with almost half (46%) of that spend
being outsourced from the companies reporting. This level of outsourcing is much higher
than the other elements of design. The highest average sector spend was in the wholesale
sector at £14.8K and the lowest was in construction at £8.3K (see figure 18).
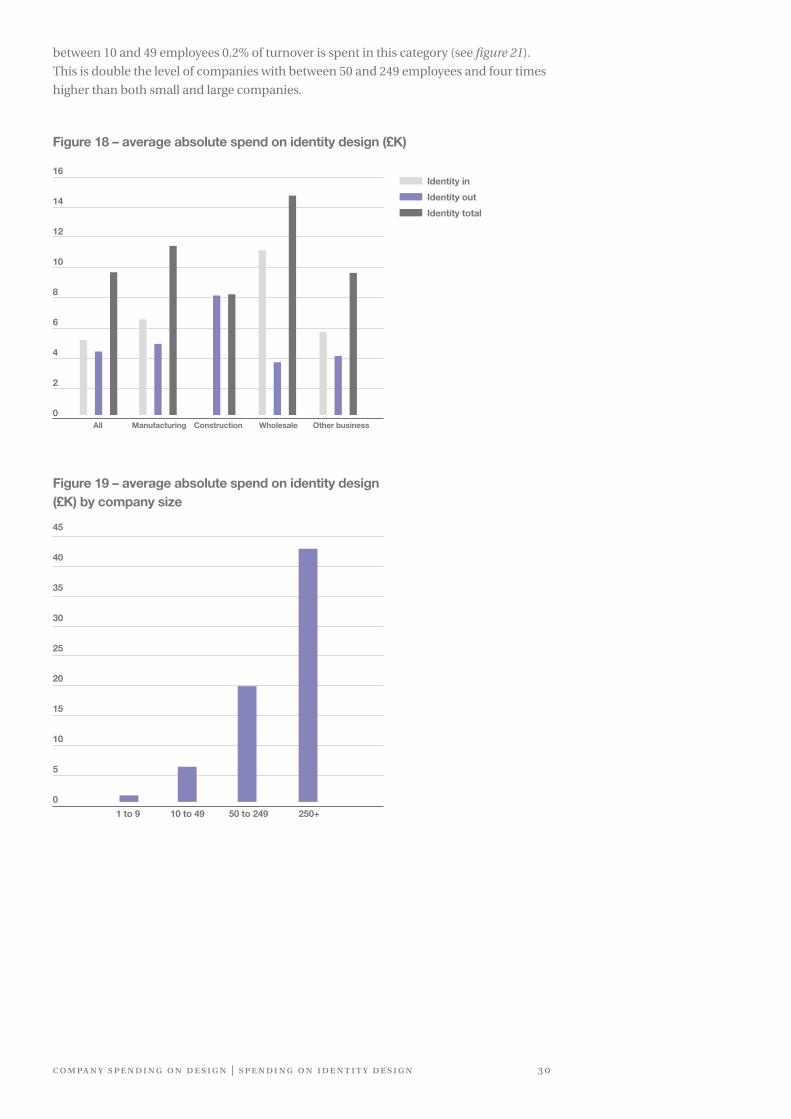
In the same way as average technical and promotional design spending increases with
company size, average spending on identity design increases for companies with greater
numbers of employees (see figure 19). Companies with greater than 250 employees spent
on average £43K on identity design, which is in strong contrast to companies with less
than 1o employees where the average was £1.2K.
Identity design as a percentage of turnoverSimilar to promotional design, the highest average spend as a percentage of turnover is in
other business activities (0.63%), with wholesale second (0.40%). Again, construction has
a different profile and lower intensity of spend than the other sectors. The vast majority of
spending on identity design in the construction sector appears to be outsourced, which
is similar to the position for promotional design. For the construction companies in this
sample, promotional and identity design does not appear to be a core competence, as
that work tends to be carried out by other companies.
The inverted u-shaped pattern for design spending as a percentage of turnover present
in promotional and user design is repeated for identity design. For companies with
Spending on identity design
c o m pa n y s pe n d i n g o n d e s i g n | s pe n d i n g o n i d e n t i t y d e s i g n 2 9
Identity in
Identity out
Identity total
between 10 and 49 employees 0.2% of turnover is spent in this category (see figure 21).
This is double the level of companies with between 50 and 249 employees and four times
higher than both small and large companies.
Figure 18 – average absolute spend on identity design (£K)
Figure 19 – average absolute spend on identity design (£K) by company size
16
14
12
10
8
6
4
2
0All Manufacturing Construction Wholesale Other business
45
40
35
30
25
20
15
10
5
0
1 to 9 10 to 49 50 to 249 250+
c o m pa n y s pe n d i n g o n d e s i g n | s pe n d i n g o n i d e n t i t y d e s i g n 3 0

Figure 20 – average spending on identity design as a percentage of turnover
Identity total
Identity out
Identity in
Other business
Wholesale
Construction
Manufacturing
All
0 0.1 0.2 0.3 0.4 0.5 0.6 %
c o m pa n y s pe n d i n g o n d e s i g n | s pe n d i n g o n i d e n t i t y d e s i g n 3 1
Figure 21 – average spending on identity design as a percentage of turnover by company size
1 to 9
10 to 49
50 to 249
250+
0 0.05 0.1 0.15 0.2 0.25 0.3 %

The differences in spending between sectors provide an insight into the complex nature
of design spending across the economy. There is significant variation in total spend,
spend as a percentage of turnover and which type of design is preferenced in each sector.
Table 2 – Average absolute design spend by type and sector
Sector comparisons
The scale of spending between the categories indicates that the inclusion of technical
design spending is key in order to gain a realistic estimate of total design spend.
For the whole sample, technical design has the highest average spend by a factor of
seven compared to promotional design, followed by user-focused design and finally
identity design.
Table 3 – reported design spending as a percentage of turnover
By contrast, the sector that reports the highest design spending as a percentage of
turnover is other business activities. This may not be surprising as this category includes
product development consultancies and marketing service providers and so there is a
significant focus on technical and promotional design. However, in this relative sense it is
interesting to note how manufacturing, which led in absolute terms, is not the leader in
any of the categories of design spend as a percentage of turnover.
(£K)
All
Manufacturing
Construction
Wholesale
Other Business
Technical
211.2
697.9
46.9
171.1
54.5
User
11.6
17.3
3.0
12.9
20.1
Promotional
28.4
34.2
10.5
44.0
31.5
Identity
9.6
11.5
8.3
14.8
9.7
Total
260.7
761.0
68.6
242.7
115.7
% of turnover
All companies
Manufacturing
Construction
Wholesale
Other Business
Technical
1.98
2.28
0.87
2.10
2.96
User
0.35
0.37
0.04
0.31
0.64
Promotional
1.27
0.80
0.18
1.35
2.23
Identity
0.36
0.19
0.08
0.40
0.63
Total
3.95
3.64
1.17
4.15
6.45
c o m pa n y s pe n d i n g o n d e s i g n | s e c to r c o m pa r i s o n s 3 2
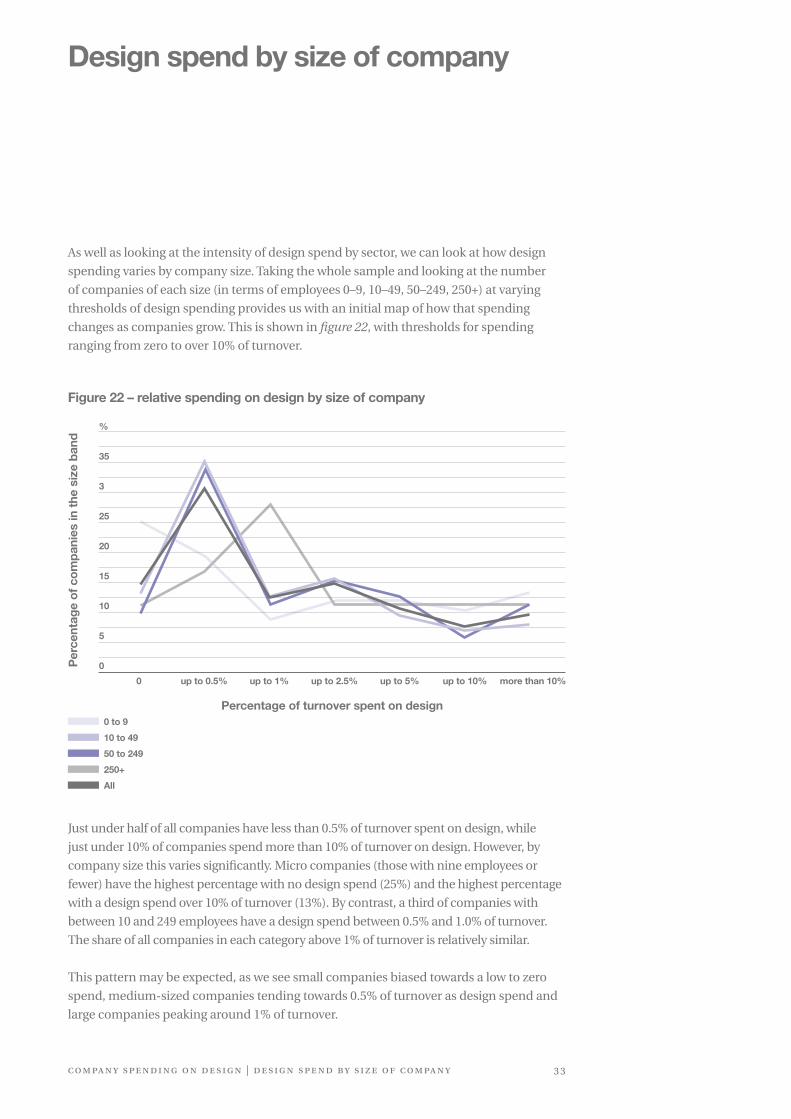
As well as looking at the intensity of design spend by sector, we can look at how design
spending varies by company size. Taking the whole sample and looking at the number
of companies of each size (in terms of employees 0–9, 10–49, 50–249, 250+) at varying
thresholds of design spending provides us with an initial map of how that spending
changes as companies grow. This is shown in figure 22, with thresholds for spending
ranging from zero to over 10% of turnover.
Figure 22 – relative spending on design by size of company
Design spend by size of company
%
35
3
25
20
15
10
5
0
0 more than 10%up to 0.5% up to 1% up to 2.5% up to 5% up to 10%
Percentage of turnover spent on design
Just under half of all companies have less than 0.5% of turnover spent on design, while
just under 10% of companies spend more than 10% of turnover on design. However, by
company size this varies significantly. Micro companies (those with nine employees or
fewer) have the highest percentage with no design spend (25%) and the highest percentage
with a design spend over 10% of turnover (13%). By contrast, a third of companies with
between 10 and 249 employees have a design spend between 0.5% and 1.0% of turnover.
The share of all companies in each category above 1% of turnover is relatively similar.
This pattern may be expected, as we see small companies biased towards a low to zero
spend, medium-sized companies tending towards 0.5% of turnover as design spend and
large companies peaking around 1% of turnover.
0 to 9
10 to 49
50 to 249
250+
All
c o m pa n y s pe n d i n g o n d e s i g n | d e s i g n s pe n d by s i z e o f c o m pa n y 3 3
Per
cent
age
of c
om
pan
ies
in t
he s
ize
ban
d
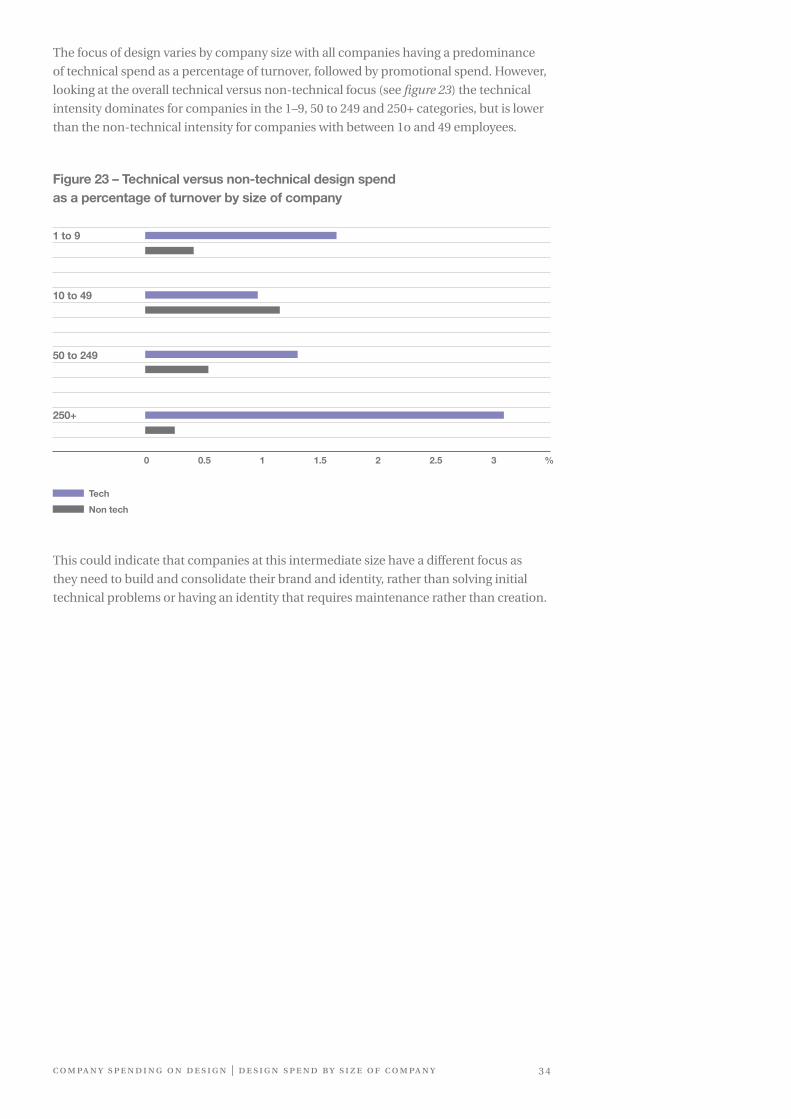
The focus of design varies by company size with all companies having a predominance
of technical spend as a percentage of turnover, followed by promotional spend. However,
looking at the overall technical versus non-technical focus (see figure 23) the technical
intensity dominates for companies in the 1–9, 50 to 249 and 250+ categories, but is lower
than the non-technical intensity for companies with between 1o and 49 employees.
Figure 23 – Technical versus non-technical design spend as a percentage of turnover by size of company
This could indicate that companies at this intermediate size have a different focus as
they need to build and consolidate their brand and identity, rather than solving initial
technical problems or having an identity that requires maintenance rather than creation.
c o m pa n y s pe n d i n g o n d e s i g n | d e s i g n s pe n d by s i z e o f c o m pa n y 3 4
1 to 9
10 to 49
50 to 249
250+
Tech
Non tech
0 0.5 1 1.5 2 2.5 3 %

c o m pa n y s pe n d i n g o n d e s i g n | d e s i g n s pe n d by s i z e o f c o m pa n y 3 �


Part three:National spending on design

Developing a national estimate of private-sector design spend from a sample of this size
is challenging due to the relatively small number of companies involved. The estimates
developed in this section indicate potential national level design spend but should be
used with caution due to the small sample size.
The total turnover for this sample of 358 companies was £4.4 billion, with a reported
total design spend of £92 million. This implies an intensity of design spending of 2.1% of
turnover. If this accurately reflects the intensity of design spending across UK SMEs and
as such companies are 99.9% of enterprises nationally, we can estimate national private-
sector spending on design as approximately £58.75 billion. This estimate is based on
total turnover for SMEs in the UK for 2007, which was £2,794 billion.11 This number could
overestimate national design spending due to the large skew in the data collected (i.e. a
significant proportion of companies reported zero design spend). SMEs encompass 99.9%
of all enterprises, but represent only 51.1% of total turnover nationally. In this sample, only
95% of firms are SMEs, and thus, it is possible that the national estimate of design spend
is underestimated as a result.
An alternative method to estimate national private-sector spending on design is
to develop an estimate based on sector-level spending. Grouping similar sectors together
(so there are 100+ companies in each band from the sample) and then using the average
design spend as a percentage of turnover against the figures for the whole economy leads
to an estimate of £59.98 billion (see table 4).
Table 4 – developing an estimate of national design spend based on industry groupings
National spending on design
11 See Small and Medium Sized Enterprises Statistics for the UK and the Regions, Department of Business, Enterprise and Regulatory Reform, available online at http://stats.berr.gov.uk/ed/sme/.
Sample turnover (£K)
Sample design spend (£K)
Design as percentage of turnover
Population turnover (£M)
Estimated design spend (£M)
2,421,679 65,516 2.71% 868,369 23,493
743,506 17,172 2.31% 1,284,178 29,659
894,481 9,956 1.11% 613,693 6,831
Industry group
Mining and quarrying, manufacturing, electricity, gas and water supply, construction
Wholesale and retail, hotels and restaurants, transport, storage and communication
Real estate, renting, business activities, education, health and social work, other community, social and personal services
c o m pa n y s pe n d i n g o n d e s i g n | n at i o n a l s pe n d i n g o n d e s i g n 3 8

In a similar fashion we can develop estimates of design spending based on the size of
companies, ranging from those with fewer than 10 employees to those with more than
250 employees. This leads to an estimate of £50.06 billion for national private sector
design spending (see table 5).
Table 5 – developing an estimate of national design spend based on company size
A final method, similar to that used in developing national estimates from studies such
as the Community Innovation Survey, is to scale the spending for companies by size and
sector across the sample based on the inverse of the achieved sample size (i.e. total
number of companies/number of companies in sample). Due to the relatively small
sample size, this method is not possible with this data as too many individual categories
of size and sector have fewer than 10 companies and so the error in scaling is significant.
As noted in the methodology section above, the companies were asked to report their
level of confidence in their estimates as being to within £1K, £10K, £50K or £100K.
Using these self-reported errors we can provide upper and lower bounds for the
estimates developed, based on SME turnover, sector and size. These are presented in
figure 24 below, showing that there is a range for our national design spend estimate
of between £39.8 billion and £66.2 billion.
Figure 24 – estimates of national private-sector spending on design
Company size
Sample turnover (£K)
Sample design spend (£K)
Design as percentage of turnover
Population turnover (£M)
Estimated design spend (£M)
0 to 9
10 to 49
50 to 249
250+
156,896
520,916
1,332,960
1,657,900
3,204
10,992
24,212
54,403
2.04%
2.11%
1.82%
3.28%
423,451
421,259
412,706
1,530,358
Total
8,647
8,889
7,496
25,003
50,066
c o m pa n y s pe n d i n g o n d e s i g n | n at i o n a l s pe n d i n g o n d e s i g n 3 9
*Based on reported accuracy
39 40 41 42 43 44 45 46 47 48 49 50 51 52 53 54 55 56 57 58 59 60 61 62 63 64 65 66 67
Sector based estimate
£59.9£53.7min* £66.2 max*
Size based estimate
£50.1£39.8min* £60.3 max*
SME based estimate
£58.7£53.4 min* £64.1max*

c o m pa n y s pe n d i n g o n d e s i g n | s e c t i o n h e a d i n g 4 0
These values are estimates based on the 358 completed returns for this survey and
therefore may over- or under-represent total national spending. This is because of the
high level of skew in responses, i.e. this is not a normal distribution, and because of the
differences between the make-up of the sample (in terms of sector and size) compared to
actual distributions for the whole economy.
To ensure we are not immediately over-estimating the level of private-sector design
spending, we will use the lowest of these estimates (£50.1 billion) for further analysis.
The 95% confidence interval for the national estimate will be between £30 billion and
£120 billion, and so we are working in the bottom half of that interval.
Breaking up the national estimate, we can estimate the level of technical and non-
technical design spending in the UK, as well as how much design is carried out in-house
or is outsourced. Figure 25 shows a simple calculation scaling the intensities in each
category for the sample against the average of the estimates for national design spend.
Figure 25 – breaking down the national estimate for design spend
12 The translation of current prices into 1997 prices used GDP deflators from HM Treasury available at http://www.hm-treasury.gov.uk/data_gdp_fig.htm.
Estimate of total national design spending
% Percentage of reported spend in each category of design spending
Total £50.1bn
12% 7%
8%73%
Non
tech
nica
l (£b
n)Te
chni
cal (
£bn)
In house (£bn) Outsourced (£bn)

c o m pa n y s pe n d i n g o n d e s i g n | s e c t i o n h e a d i n g 4 1
A key question is how do these estimates, the overall one and the breakdown by type
of spend, compare to previous estimates of national design spending? As noted in the
introduction, relatively few attempts have been made to estimate design spending at
the national level.
The estimate from Sentence and Clark of £10 billion for product development and design
in UK manufacturing firms in 1997 is roughly comparable to the first line of table 4, which
estimates 2007 design spending in mining, manufacturing and utilities as just over £23.5
billion. This figure, corrected for inflation, is approximately £18.5 billion in 1997 terms.12
The differences between the two figures will be based on the differing context for 1997
and 2008, as well as the definitional differences governing each estimate.
Next, by looking at the Design Council estimates of the UK design industry we can
compare the total figure for the design sector and that for external consultancies.
The turnover of the UK design sector, which was estimated at £11.6 billion, can be
compared to the total for non-technical design from this survey, which was £9.5 billion.
The reported revenue of design consultancies (£5.1 billion) is broadly in line with non-
technical outsourced design spending, which is estimated at £3.5 billion from this survey.
Finally, as discussed earlier there is a significant relationship between technical design
spend and R&D spending. The estimate for technical design spend is approximately
£40.6 billion and this could be compared to national private-sector R&D spending, which
is reported at £21bn for 2007.13 The fact that technical design spending is estimated at
approximately twice R&D spending seems to indicate that the discussion on innovation
support (especially that based on R&D tax credits) may be missing a significant element
of spending which is future-oriented and directed at bringing new products and services
to market without depending on R&D.
The recent paper from Jonathan Haskell estimates expenditure (in-house and outsourced)
as well as investment on architecture and engineering design activities. This contrasts
to our survey, which did not make an explicit differentiation between expenditure and
investment, and so we should compare the expenditure figure as we asked for company
spending in a given year. The Haskell paper estimates in-house spending on architecture
and engineering design at £27 billion, with purchased architecture and engineering design
services costing £17 billion. The estimated outsourced design spend from our survey was
£7.5 billion, approximately half of that estimated by Haskell, while the in-house spend is
£42.6 billion, roughly twice the Haskell estimate. This highlights the difficulty in comparing
our survey to the Haskell estimates, as they have a narrow measurement of architecture
and engineering design, whereas we asked for all types of design spending.
It is encouraging that the comparisons are similar in order of magnitude, providing
confidence that the estimates are reasonable. However, the significant differences,
especially between this survey and the Haskell paper, highlight the differences in
definitions and boundaries used in each approach. The inclusion or not of architecture,
for example, will significantly change the results. The key difference, though, will be
on how design is interpreted, either in a survey question or from existing data sources.
In many ways design spend is in a similar situation to the measurement of research and
development spending in the 1980s. R&D was recognised as important, but no standard
(such as the Frascati definitions) existed at that stage and companies were not used to
reporting their R&D spend. Over time, it should be possible to achieve similar levels of
confidence in reporting design spend to that of reporting R&D spending.
13 DIUS (2008) R&D Scoreboard 2008, Department for Innovation, Universities and Skills, further details available at http://www.innovation.gov.uk/rd_scoreboard/.

Measuring design spending is very difficult as companies have not traditionally reported
such spending and there is no agreed definition of it. This survey provides the first
comparable data for UK companies spending on design, indicating 2.1% of turnover
spent on design for the sample of companies surveyed. These results imply that private-
sector spending on design in the UK was approximately £50 billion in 2007.
The estimate of national private-sector spending on design is reasonable when compared
to previous estimates of design activity, being similar in order of magnitude. However,
there are significant scale differences. These may be due to how design was described in
each approach and what was explicitly included or excluded. This highlights the need
for an agreed and stable approach to estimating design spending if design is to be better
understood and given the priority many believe it deserves in policy.
In developing the survey, a four-part model for capturing design spend was created
based on the purpose of the design activity. This approach provides significant flexibility
compared to a purely definitional approach. Attempts to define design categories are
problematic as the terms are not universally understood and it is unclear whether they
can ever be exhaustive. This flexibility is necessary to enable firms to estimate spend on
design in the business. The model developed here could be used as the first stage of a
new standard for estimating design spending in companies.
In terms of absolute and relative spend, technical design dominates this survey as it
represents 81% of the reported spending. Including technical design as a category of
spending is seen as critical to understanding the breadth of design impact and to help
clarify the interface between design, R&D and innovation.
However, in terms of numbers of companies reporting each type of spend (technical,
user, promotional, identity) technical spending is third, with 42.7% of companies
reporting such a spend, compared with promotional spending being reported by
66.5% of companies.
Discussion
c o m pa n y s pe n d i n g o n d e s i g n | n at i o n a l s pe n d i n g o n d e s i g n 4 2

As a comparison, the most recent Community Innovation Survey (CIS) in 2007 asked
whether companies had “Expenditure on design functions for the development or
implementation of new or improved goods, services and processes,”14 specifically
excluding design spending in support of R&D. The percentage of all companies indicating
this kind of spend in the period 2004–2006 was 17%. This is much lower than any of the
reporting percentages for design spend and raises a question as to what companies were
reporting in the CIS survey. Again, it also highlights the difficulty in the interface between
design, R&D and innovation.
It might have been expected that the majority of technical and user design would be in
manufacturing companies and that promotional and identity design would be relatively
similar across all firms. However, the patterns of design spending were surprising in
two sectors, wholesale and other business activities. In wholesale the high level of
technical spending was not expected and the high overall level of design spending in
other business activities was contrary to expectations. This again raises the question as to
whether the impact of different types of design activity is well understood across different
sectors and implies the need for further research.
As indicated earlier, this survey is a proof of principle that reliable data on design
spending can be collected. However, several issues could not be covered in this survey.
These include:
— Whether UK companies are sourcing their bought-in design from
the UK or from overseas
— Whether there is a relationship between intensity of design spending
and performance (as a single year is insufficient to address the question)
Several important limitations to the work should also be highlighted:
— The data collected are best estimates that telephone interviewees
were able to provide and so have a margin of error attached.
14 Further information on the Community Innovation Survey, including the questionnaire can be found at http://www.berr.gov.uk/dius/innovation/innovation-statistics/cis/page10957.html.
Figure 26 – percentage of sample reporting spend in each category
%
70
60
50
40
30
20
10
0Technical User Promotional Identity
c o m pa n y s pe n d i n g o n d e s i g n | n at i o n a l s pe n d i n g o n d e s i g n 4 3
— Some of the responses may be biased by the functional focus of the company
representative answering the survey.
— The terms and categories used are relatively novel and so it is expected that
if the model becomes accepted more precise data will be collected.
Given these limitations, the data collected as part of this survey and the model of design
spending are an important first step in improving our understanding of the impact of
design on company performance. If data can be collected over several years it should be
possible to analyse which types of design spend have an impact on company outcomes
in a variety of sectors and contexts.
RecommendationsThe completion of this survey has highlighted the lack of an agreed standard for
design spending and due to this an inability to link design to company and national
performance. The following recommendations are made for further work:
1. Developing a standard for design spending that is applicable across sectors
and size of company, developed in consultation with company managers
and policymakers.
2. Investing in further surveys of private-sector spending in the UK to establish
a baseline and to improve the accuracy of national estimates of design spend.
3. Instigating surveys in key competitor countries to enable comparison
between nations.
These steps should ensure that the UK is among the leaders in understanding
the impact of design spending on company and national performance.
c o m pa n y s pe n d i n g o n d e s i g n | n at i o n a l s pe n d i n g o n d e s i g n 4 4

Appendix: data for key graphs
c o m pa n y s pe n d i n g o n d e s i g n | a p pe n d i x 4 �
0 to 910 to 4950 to 249250+All
Figure 22 – Relative spending on design by size of company
0
25.0013.029.86
11.1114.61
up to 0.5%
19.1234.9033.8016.6730.66
up to 1%
8.8212.5011.2727.7812.32
up to 2.5%
11.7615.6315.4911.1114.61
up to 5%
11.769.38
12.6811.1110.60
up to 10%
10.296.775.63
11.117.45
More than 10%
13.247.81
11.2711.119.74
TechnicalUserPromotionalIdentity
Figure 26 – Percentage of sample reporting spend in each category
Zeros
205243120161
Reporting
153115238197
Percentage
42.7432.1266.4855.03
1 to 910 to 4950 to 249250+
Figure 23 – Technical versus non-technical design spend as a percentage of turnover by size of company
Technical %
1.630.971.293.04
Non-technical %
0.411.140.530.24
AllManufacturingConstructionWholesaleOther business
Figures 6, 10, 14, 18 – Average absolute spending
Tech in
189.96631.9824.01
165.4551.48
Tech out
21.1665.9322.875.633.00
Tech total
211.12697.9146.88
171.0754.48
User in
9.1114.921.02
12.1814.23
User out
2.452.401.940.675.85
User total
11.5617.322.96
12.8620.08
Promo in
18.0423.801.93
34.5724.05
ID in
5.196.570.20
11.095.68
Promo out
10.3710.438.589.427.40
Promo total
28.4134.2310.5143.9931.45
ID out
4.414.978.053.713.99
ID total
9.6011.548.25
14.809.67
Total inhouse
222.30677.2727.15
223.2995.45
AllManufacturingConstructionWholesaleOther business
Figures 8, 12, 16, 20 – Design spend as percentage of turnover
Tech in
1.482.070.501.992.38
Tech out
0.490.210.370.110.57
Tech total
1.982.280.872.102.95
User in
0.230.330.010.260.44
User out
0.120.040.030.050.19
User total
0.350.370.040.300.64
Promo in
0.680.250.040.811.62
ID in
0.190.110.010.270.44
Promo out
0.580.550.130.540.61
Promo total
1.270.800.181.352.23
ID out
0.160.090.080.140.19
ID total
0.360.190.080.400.63
Total inhouse
2.592.750.563.334.88
Percentage of companies
Figure 4 – Distribution of companies’ reported design spend
0
15.17
10
36.80
20
10.39
30
5.90
40
3.37
50
3.09
75
5.90
100
1.97
150
3.65
200
1.97
250
1.69
500
3.37
1000
3.37
5000
2.81
10000
00.00
>10000
0.56
The Institute for Manufacturing (IfM)The IfM provides a unique environment for the creation of new ideas and approaches
for modern industrial practice. Part of the University of Cambridge’s Department of
Engineering, it brings together expertise in management, economics and technology
to address the full spectrum of industrial issues.
Design Management Group
The Design Management Group, within the IfM, aims to understand the ways in which
design can be effectively managed, and how integration of design and technology can
improve success at a project, company and national level.
Centre for Industry and Government
The Centre for Industry and Government (CIG) within the IfM explores changing
industrial structures, business models and modern industrial policies around the
world to provide analysis and policy recommendations to governments and companies,
in support of sustainable economic growth. Building on the depth of industrial experience
and collaboration across the IfM, CIG seeks to improve understanding of the business-
government relationship, and to support policy development and implementation.
Printed by the Good News
Press on 150 gsm and
300 gsm Think4 Bright paper.
100% ECF (Elemental Chlorine
Free) pulp. FSC certified.
Totally recyclable.

Company spending on design: Exploratory survey of UK firms 2008
Finbarr Livesey and James Moultrie
Copyright © Institute for Manufacturing, April 2009. All rights reserved.
First published in Great Britain by the University of Cambridge Institute for Manufacturing Mill Lane, Cambridge CB2 1RX
From July 2009 the IfM’s address will be: The Alan Reece Building 17 Charles Babbage Road Cambridge CB3 0FS www.ifm.eng.cam.ac.uk
Design Council 34 Bow Street London WC2E 7DL United Kingdom
Tel +44(0)20 7420 5200 Fax +44(0)20 7420 5300 [email protected] www.designcouncil.org.uk
ISBN 987-1-902846-73-5