Company Presentation - Vonovia SEinvestors.vonovia.de/.../2017-10_VNA-CompanyPresentation.pdf ·...
74
Company Presentation Non-deal Roadshow to Asia October 2017
Transcript of Company Presentation - Vonovia SEinvestors.vonovia.de/.../2017-10_VNA-CompanyPresentation.pdf ·...

Company Presentation Non-deal Roadshow to Asia October 2017

Non-deal Roadshow to Asia – October 2017 page 2
1. Our Market
3. Our Numbers
2. Our Company

Non-deal Roadshow to Asia – October 2017
German Residential – Safe Harbor and Low Risk
page 3
Sources: Federal Statistics Office, GdW (German Association of Professional Homeowners), REIS, BofA Merrill Lynch Global Research; BIP USA: IMF, Statista Note: Due to lack of q-o-q US rent growth data, the annual rent growth for a year is assumed to also be the q-o-q rent growth of that year
Germany: regulated market ensures sustainable rent growth
%
USA: rent growth is highly volatile
%
-7
-5
-3
-1
1
3
5
7
2006
2007
2008
2009
2010
2011
2012
2013
2014
2015
2016
GDP USA quarterly development y-o-y
Rent Growth USA annually development y-o-y
-7
-5
-3
-1
1
3
5
7
2006
2007
2008
2009
2010
2011
2012
2013
2014
2015
2016
GDP Germany quarterly development y-o-y
Rent Growth Germany quarterly development y-o-y
Contrary to most other jurisdictions such as the USA, residential lease agreements are evergreen contracts (VNA’s
avg. lease length is 13.5 years); rental growth is regulated and not directly linked to CPI, GDP development etc.
Rents are regulated via “Mietspiegel“ (city-specific rent indices), which look at the asking rents of the previous four
years to determine a rent growth level for existing tenants for the next two years.
Evergreen contracts in a regulated market safeguard sustainable growth

Non-deal Roadshow to Asia – October 2017
German Residential – Landlords Benefit from Structural Imbalance between Supply and Demand
page 4
Sources: Federal Statistics Office, IW Köln, GdW (German Association of Professional Homeowners)
New supply falls short of demand
Consensus estimates see a current shortage of around 1 million apartments in urban areas. Three main constraints
stand in the way of material changes in the short and even medium term:
Building permits often take several years because city administrations lack qualified personnel.
Severe shortage of building capacity after years of downsizing.
Substantial gap between in-place values and market replacement cost render construction in affordable
segment economically unfeasible.
0
100
200
300
400
500
600
700
800
1991
1992
1993
1994
1995
1996
1997
1998
1999
2000
2001
2002
2003
2004
2005
2006
2007
2008
2009
2010
2011
2012
2013
2014
2015
2016
2017
2018
2019
2020
2021
Completions Permits Estimated required volume
Completions on average 18% below permits
Required volume exceeds average
annual completions of past 15 years by
~170k
Residential building permits and new construction volume (‘000 units)
Non-deal Roadshow to Asia – October 2017
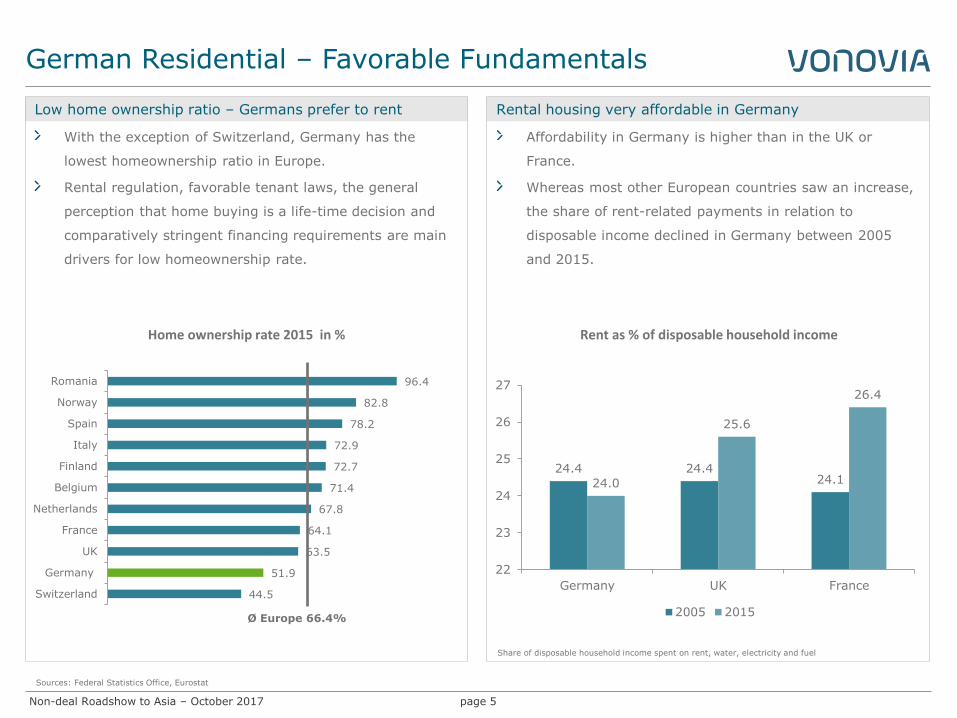
German Residential – Favorable Fundamentals
page 5
Sources: Federal Statistics Office, Eurostat
Home ownership rate 2015 in %
Low home ownership ratio – Germans prefer to rent Rental housing very affordable in Germany
24.4 24.4 24.1 24.0
25.6
26.4
22
23
24
25
26
27
Germany UK France
2005 2015
Rent as % of disposable household income
With the exception of Switzerland, Germany has the
lowest homeownership ratio in Europe.
Rental regulation, favorable tenant laws, the general
perception that home buying is a life-time decision and
comparatively stringent financing requirements are main
drivers for low homeownership rate.
Affordability in Germany is higher than in the UK or
France.
Whereas most other European countries saw an increase,
the share of rent-related payments in relation to
disposable income declined in Germany between 2005
and 2015.
Share of disposable household income spent on rent, water, electricity and fuel
96.4
82.8
78.2
72.9
72.7
71.4
67.8
64.1
63.5
51.9
44.5
Romania
Norway
Spain
Italy
Finland
Belgium
Netherlands
France
UK
Germany
Switzerland
Ø Europe 66.4%
Non-deal Roadshow to Asia – October 2017
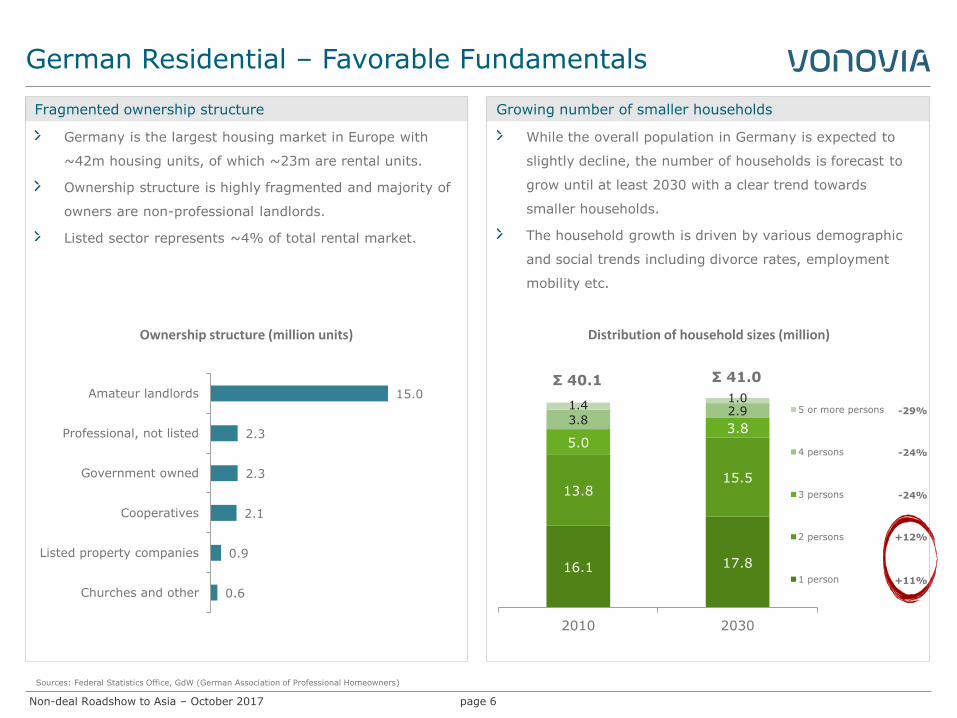
German Residential – Favorable Fundamentals
page 6
16.1 17.8
13.8 15.5
5.0 3.8
3.8 2.9
1.4 1.0
2010 2030
5 or more persons
4 persons
3 persons
2 persons
1 person
Sources: Federal Statistics Office, GdW (German Association of Professional Homeowners)
-29%
-24%
-24%
+12%
+11%
Fragmented ownership structure Growing number of smaller households
While the overall population in Germany is expected to
slightly decline, the number of households is forecast to
grow until at least 2030 with a clear trend towards
smaller households.
The household growth is driven by various demographic
and social trends including divorce rates, employment
mobility etc.
Distribution of household sizes (million)
15.0
2.3
2.3
2.1
0.9
0.6
Amateur landlords
Professional, not listed
Government owned
Cooperatives
Listed property companies
Churches and other
Germany is the largest housing market in Europe with
~42m housing units, of which ~23m are rental units.
Ownership structure is highly fragmented and majority of
owners are non-professional landlords.
Listed sector represents ~4% of total rental market.
Ownership structure (million units)
Σ 40.1 Σ 41.0

Non-deal Roadshow to Asia – October 2017 page 7
1. Our Market
3. Our Numbers
2. Our Company

Non-deal Roadshow to Asia – October 2017
Vonovia at a Glance
page 8
1 Free float according to Deutsche Börse is 92.5%, as Norges stake is not counted towards the free float
Size
Germany‘s largest owner and operator of residential real estate.
Pan-German portfolio with >350k apartments and >€30bn gross asset
value across 15 urban regional markets.
IPO in 2013; DAX 30 constituent since 2015 with a market cap of ~€17bn,
100% free float1 and ~€45m average daily turnover.
Philosophy
Full-scale service provider with insourcing strategy and value-add business
to leverage economies of scale in a highly homogeneous asset class.
Strong internal growth profile via sustainable market rent growth,
additional rent growth from portfolio investments and dynamic value-add
business.
Investor Benefit
Predictable top and bottom line offer downside protection; scalable
business provides upside potential.
Robust business model delivers highly stable and growing cash flows.

Non-deal Roadshow to Asia – October 2017
If You Want to Know Where Germans Live - Follow the Light
page 9
Illustration of Germany at Night
Source: www.bundeswahlleiter.de

Non-deal Roadshow to Asia – October 2017
Strong Overlap with Vonovia Portfolio
page 10
Source: www.bundeswahlleiter.de
Illustration of Germany at Night
Note: Vonovia Strategic Portfolio
High-influx cities (“Schwarmstädte”). For more information: http://investoren.vonovia.de/websites/vonovia/English/4050/financial-reports-_-presentations.html

Non-deal Roadshow to Asia – October 2017
Proven and Unchanged Strategy since IPO
page 11
Financing 2
Ensure well-balanced financing mix and maturity profile with low financing costs, investment grade credit rating and adequate liquidity at all times
Fast and unfettered access to equity and debt capital markets at all times
Portfolio Management 3
Portfolio optimization by way of tactical acquisitions and non-core/non-strategic disposals to ensure exposure to strong local markets
Pro-active development of the portfolio through investments to offer the right products in the right markets and on a long-term basis
Value-add Business 4
Expansion of core business to extend the value chain by offering additional services and products that are directly linked to our customers and/or the properties
Insourcing of services to ensure maximum process management and cost control
Innovative
Tra
ditio
nal
Property Management 1
Systematic optimization of operating performance and core business productivity through leveraging scaling effects
High degree of standardization and industrialization throughout the entire organization
Continuous review of on- and off-market opportunities to lever economies of scale and apply strategic pillars 1-4 to a growing portfolio
All acquisitions must meet the stringent acquisition criteria
Reputation & Customer Satisfaction
Mergers & Acquisitions
5

Non-deal Roadshow to Asia – October 2017 page 12
1. Our Market
3. Our Numbers
2. Our Company

Non-deal Roadshow to Asia – October 2017 page 13
5.40
5.58
5.75
6.02
3.5% 3.4%
2.7% 2.4%
2013 2014 2015 2016
In-place rent (€/sqm) Vacancy rate (%)
175 203
357 333
830 754
645 570
2013 2014 2015 2016
Number of apartments ('000; eop) Cost per unit (€)
Operating KPIs fully under control
Solid financial basis Proof of business scalability
Steady efficiency gains
60.8% 63.8% 67.7% 70.9%
79.6% 82.2% 84.8% 87.0%
2013 2014 2015 2016
EBITDA margin EBITDA margin (excl. maintenance)
49% 50% 47% 42%
2.2
2.7 3.0
3.7
2013 2014 2015 2016
LTV (%) Global ICR
Track Record

Non-deal Roadshow to Asia – October 2017
Valuation Going Up but still Moderate
page 14
Fair value (€/sqm)
792 812 839 901 964 1,054 1,264 1,341
1,800
2,500
2010 2011 2012 2013 2014 2015 2016 H1 2017 VNA modularconstruction
costs
Market costsfor new
constructions
Adj. NAV (€/share) Fair values have been consistently moving up but are still well below replacement costs and market prices
NAV has also been steadily improving
Three points to bear in mind with regards to NAV
NAV is based on the discounted rental values of the assets
DCF assumptions are based on market terms for operating costs etc.
Reflects brick and mortar value and disregards Vonovia‘s operating platform and value-add business
21.74 22.67 24.19
30.75 33.10
2013 2014 2015 2016 H1 2017

Non-deal Roadshow to Asia – October 2017
Sustainable Growth in FFO 1 and Dividends
page 15
0.95 1.00
1.30
1.63
~1.882
0.67
0.74
0.94
1.12
2013 2014 2015 2016 2017(E)
FFO 1 per share (€) Dividend per share (€)
70 % of FFO 1
Sustainable and growing cash flow with attractive pay-out ratio
1 Rental income + EBITDA Value-add Business and Other; excluding sales effects. 2 Midpoint 2017 guidance
Number of months until costs are earned by recurring income1
Maintenance Expenses
Operating Expenses
0
2
4
6
8
10
12
nu
mb
er o
f m
on
ths
Maintenance Expenses
Taxes
Interest Expenses
Operating Expenses
FFO 1
Dividend (ca. 70%)
Other (ca. 30%)
Non-deal Roadshow to Asia – October 2017
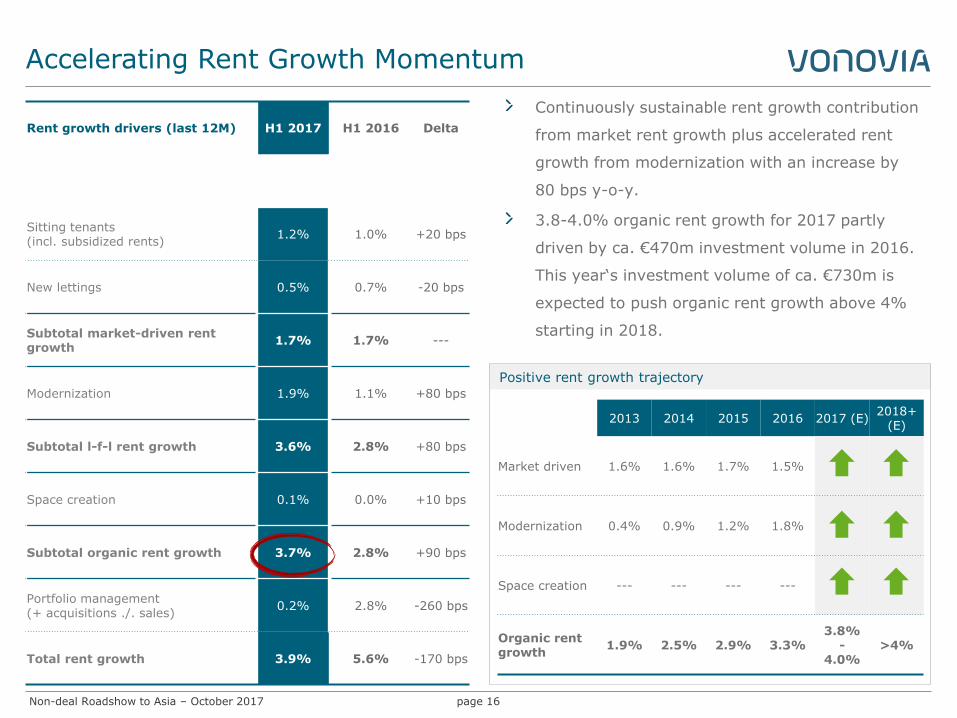
Accelerating Rent Growth Momentum
page 16
Continuously sustainable rent growth contribution
from market rent growth plus accelerated rent
growth from modernization with an increase by
80 bps y-o-y.
3.8-4.0% organic rent growth for 2017 partly
driven by ca. €470m investment volume in 2016.
This year‘s investment volume of ca. €730m is
expected to push organic rent growth above 4%
starting in 2018.
Rent growth drivers (last 12M) H1 2017 H1 2016 Delta
Sitting tenants (incl. subsidized rents)
1.2% 1.0% +20 bps
New lettings 0.5% 0.7% -20 bps
Subtotal market-driven rent growth
1.7% 1.7% ---
Modernization 1.9% 1.1% +80 bps
Subtotal l-f-l rent growth 3.6% 2.8% +80 bps
Space creation 0.1% 0.0% +10 bps
Subtotal organic rent growth 3.7% 2.8% +90 bps
Portfolio management (+ acquisitions ./. sales)
0.2% 2.8% -260 bps
Total rent growth 3.9% 5.6% -170 bps
2013 2014 2015 2016 2017 (E) 2018+
(E)
Market driven 1.6% 1.6% 1.7% 1.5%
Modernization 0.4% 0.9% 1.2% 1.8%
Space creation --- --- --- ---
Organic rent growth
1.9% 2.5% 2.9% 3.3% 3.8%
- 4.0%
>4%
Positive rent growth trajectory

Non-deal Roadshow to Asia – October 2017
0.0%
1.0%
2.0%
3.0%
4.0%
0
500
1,000
1,500
2,000
2,500
3,000
2017 2018 2019 2020 2021 2022 2023 2024 2025 2026 2027 from 2028
Mortgages Structured Loans Bond Debt Hybrid Equity Hybrid conwert bank loans avg. financing cost
Smooth Maturity Profile with Diverse Funding Mix
page 17
Weighted avg. financing cost p.a.1
1.7% 1.9% 3.7% 1.9% 3.3%2 1.4% 2.6% 1.3% 1.6% 1.5% 1.8% 1.9%
% of debt maturing
10.0% 8.4% 9.6% 15.2% 12.4% 11.2% 9.2% 7.5% 4.9% 4.4% 3.7% 3.6%
Debt maturity profile (€m) and cost of finance (%)
1 Average financing cost of debt maturing in the relevant year. 2 Weighted avg. financing cost excl. Equity Hybrid. Including Equity Hybrid the avg. interest rate of debt maturing in 2021 is 3.7%. 3 Net Debt as of June 30 over H1 EBITDA Operations annualized.
Current unsecured reoffer yield (7-8 years)
KPIs June 30, 2017 Target
LTV 43.2% Mid-to low forties
Unencumbered assets in % 61.7% ≥50%
Debt/EBITDA3 11.2x
Total debt / total assets 40%
Fixed/hedged debt ratio 97%
Global ICR (YTD) 4.7x
Financing cost 2.1%
Weighted avg. maturity 6.7 years
Ongoing optimization with most economic funding
Debt structure
Bonds (years indicate maturity)
1-2 years 12%
3-4 years 16%
5-6 years 13%
7-8 years 14%
9-10 years 7%
11-12 years 3%
Equity Hybrid 7%
Debt Hybrid 5%
Structured Loans 9%
Mortgages 12%
Subsidized Modernization
Debt 2%

Non-deal Roadshow to Asia – October 2017
Pro-active Portfolio Management Clustering
page 18
Strategic units of conwert portfolio have initially all been included
in Operate and will be reclassified to UB and OA in the context of
the regular annual portfolio clustering in the fall.
96% of total fair value in Strategic and Privatization clusters.
June 30, 2017 Residential Units In-place rent Vacancy rate Fair value Fair value
(€/sqm) (%) (€bn) (%)
Operate 105,972 6.29 2.8 9.7 31%
Upgrade Buildings (UB) 125,064 6.03 2.7 10.1 33%
Optimize Apartments (OA) 89,275 6.25 2.1 8.2 27%
Subtotal Strategic Clusters 320,311 6.18 2.6 27.9 91%
Privatize 16,180 6.01 4.3 1.5 5%
Non-strategic 8,862 4.85 8.9 0.3 1%
Non-core 5,259 4.99 8.2 0.3 1%
Total Germany 350,612 6.12 2.9 30.1 98%
Austria 2,203 6.24 3.1 0.6 2%
Total Residential Portfolio 352,815 6.12 2.9 30.7 100%
Operate 31%
UB 33%
OA 27%
Privatize 5%
Non-core, non-
strategic, Austria
2%
Vienna 2%
Fair value of the developed land excluding €156.0 million for undeveloped land, inheritable building rights granted and other.

Non-deal Roadshow to Asia – October 2017
Growing Investment Volume
page 19
Investment volume track record (€m)
Investments into the portfolio are increasingly meaningful organic growth drivers and provide independence
from acquisition opportunities.
Average 7% hurdle rate (unlevered) for each program year with investments in year one generally lead to
rent growth in year two.
Increasing scope of work from single apartment over whole building to entire neighborhoods including
modular space creation.
65
172
356
472
~730
1,000
2013 2014 2015 2016 2017E Annual
run rate
2018+
Distribution of investment funds for 2017 program year
Upgrade Buildings 51%
Optimize Apartments
19%
New Products 10%
Neighborhood Development
3%
Space Creation 18%

Non-deal Roadshow to Asia – October 2017
Growing Contribution from Value-add Business
page 20
Economics
23.6
37.6
57.0
~100
2014 2015 2016 2017E
+59%
+52%
+~75%
NAV does not account for Vonovia’s Value-add Business.
Applying the impairment test WACC1 to the 2017E Adj. EBITDA Value-add Business translates into an additional value of ~€5.1 per share (~16% on top of Adj. NAV).
1 Pre-tax WACC of 4.1% as per Dec. 31, 2016.
Expansion of core business to extend the value chain by offering additional services and products that are directly linked to our customers and/or the properties and offer the same cash flow stability as the rental business.
Insourcing of services to ensure maximum process management and cost control.
Two types of Value-add Business
1. External income (e.g. multimedia, smart metering)
2. Internal savings (e.g. craftsmen, resi environment)
New initiatives always follow same low risk pattern of
Prototype development
Proof of concept in pilot phase
Roll-out across portfolio
Rental contract
Multimedia
Smart Metering
Residential Environment
Craftsmen VTS
…
Concept
€m
Penetration
Multimedia ca. 75%
Smart metering ca. 15%
Residential environment ca. 20%
Craftsmen VTS ca. 70% (maintenance) ca. 20% (modernization) target is around 70% to allow for enough flexibility in the volumes and to enable continuous benchmarking to market prices

Non-deal Roadshow to Asia – October 2017 page 21
Guidance (JPY currency)
EUR USD JPY
2015 2016 2017 2015 2016 2017 2015 2016 2017
Actuals Actuals Guidance Actuals Actuals Guidance Actuals Actuals Guidance
Organic rent growth (eop) 2.9% 3.3% 3.8% - 4.0% 2.9% 3.3% 3.8% - 4.0% 2.9% 3.3% 3.8% - 4.0%
Occupancy (eop) 97.3% 97.6% >97.5% 97.3% 97.6% >97.5% 97.3% 97.6% >97.5%
Rental Income (m) 1,415 1,538 1,660 - 1,680 1,671 1,817 1,961 - 1,984 187,063 203,337 219,452 - 222,096
FFO1 (m) 608 761 900 - 920 718 899 1,063 - 1,087 80,378 100,578 118,980 - 121,624
FFO 1 per share 1.30 1.63 1.86 - 1.90 1.54 1.93 2.20 - 2.24 171.86 215.49 245.89 - 251.18
Maintenance (m) 331 320 ~340 391 378 ~402 43,758 42,317 ~44,948
Modernization & Investments (m)
356 472 ~730 420 558 ~862 47,063 62,438 ~96,506
Privatization (#) 2,979 2,701 ~2,300 2,979 2,701 ~2,300 2,979 2,701 ~2,300
FV step-up (Privatization) 30.5% 36.2% ~35% 30.5% 36.2% ~35% 30.5% 36.2% ~35%
Non-core (#) 12,195 23,930 opportunistic 12,195 23,930 opportunistic 12,195 23,930 opportunistic
FV step-up (Non-Core) 9.2% 5.4% >0% 9.2% 5.4% >0% 9.2% 5.4% >0%
Dividend/share 0.94 1.12 70% of FFO 1 1.11 1.32 70% of FFO 1 124.27 148.06 70% of FFO 1
Exchange rates as of Sep 27, 2017 (EUR 1.00 : USD 1.18115 : JPY 132.20).

Non-deal Roadshow to Asia – October 2017 page 22
Guidance (HKD currency)
EUR USD HKD
2015 2016 2017 2015 2016 2017 2015 2016 2017
Actuals Actuals Guidance Actuals Actuals Guidance Actuals Actuals Guidance
Organic rent growth (eop) 2.9% 3.3% 3.8% - 4.0% 2.9% 3.3% 3.8% - 4.0% 2.9% 3.3% 3.8% - 4.0%
Occupancy (eop) 97.3% 97.6% >97.5% 97.3% 97.6% >97.5% 97.3% 97.6% >97.5%
Rental Income (m) 1,415 1,538 1,660 - 1,680 1,671 1,817 1,961 - 1,984 13,057 14,193 15,317 - 15,502
FFO1 (m) 608 761 900 - 920 718 899 1,063 - 1,087 5,610 7,020 8,305 - 8,489
FFO 1 per share 1.30 1.63 1.86 - 1.90 1.54 1.93 2.20 - 2.24 12.00 15.04 17.16 - 17.53
Maintenance (m) 331 320 ~340 391 378 ~402 3,054 2,954 ~3,137
Modernization & Investments (m)
356 472 ~730 420 558 ~862 3,285 4,358 ~6736
Privatization (#) 2,979 2,701 ~2,300 2,979 2,701 ~2,300 2,979 2,701 ~2,300
FV step-up (Privatization) 30.5% 36.2% ~35% 30.5% 36.2% ~35% 30.5% 36.2% ~35%
Non-core (#) 12,195 23,930 opportunistic 12,195 23,930 opportunistic 12,195 23,930 opportunistic
FV step-up (Non-Core) 9.2% 5.4% >0% 9.2% 5.4% >0% 9.2% 5.4% >0%
Dividend/share 0.94 1.12 70% of FFO 1 1.11 1.32 70% of FFO 1 8.67 10.33 70% of FFO 1
Exchange rates as of Sep 27, 2017 (EUR 1.00 : USD 1.18115 : HKD 9.22733).
Non-deal Roadshow to Asia – October 2017 page 23
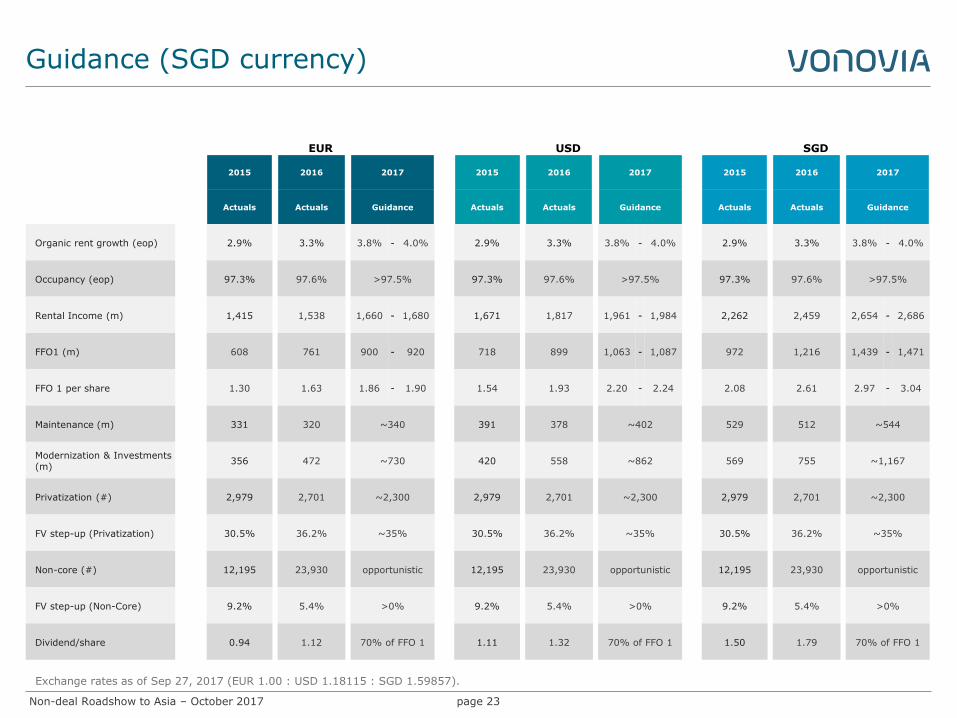
Guidance (SGD currency)
EUR USD SGD
2015 2016 2017 2015 2016 2017 2015 2016 2017
Actuals Actuals Guidance Actuals Actuals Guidance Actuals Actuals Guidance
Organic rent growth (eop) 2.9% 3.3% 3.8% - 4.0% 2.9% 3.3% 3.8% - 4.0% 2.9% 3.3% 3.8% - 4.0%
Occupancy (eop) 97.3% 97.6% >97.5% 97.3% 97.6% >97.5% 97.3% 97.6% >97.5%
Rental Income (m) 1,415 1,538 1,660 - 1,680 1,671 1,817 1,961 - 1,984 2,262 2,459 2,654 - 2,686
FFO1 (m) 608 761 900 - 920 718 899 1,063 - 1,087 972 1,216 1,439 - 1,471
FFO 1 per share 1.30 1.63 1.86 - 1.90 1.54 1.93 2.20 - 2.24 2.08 2.61 2.97 - 3.04
Maintenance (m) 331 320 ~340 391 378 ~402 529 512 ~544
Modernization & Investments (m)
356 472 ~730 420 558 ~862 569 755 ~1,167
Privatization (#) 2,979 2,701 ~2,300 2,979 2,701 ~2,300 2,979 2,701 ~2,300
FV step-up (Privatization) 30.5% 36.2% ~35% 30.5% 36.2% ~35% 30.5% 36.2% ~35%
Non-core (#) 12,195 23,930 opportunistic 12,195 23,930 opportunistic 12,195 23,930 opportunistic
FV step-up (Non-Core) 9.2% 5.4% >0% 9.2% 5.4% >0% 9.2% 5.4% >0%
Dividend/share 0.94 1.12 70% of FFO 1 1.11 1.32 70% of FFO 1 1.50 1.79 70% of FFO 1
Exchange rates as of Sep 27, 2017 (EUR 1.00 : USD 1.18115 : SGD 1.59857).

Non-deal Roadshow to Asia – October 2017 page 24
Guidance (MYR currency)
EUR USD MYR
2015 2016 2017 2015 2016 2017 2015 2016 2017
Actuals Actuals Guidance Actuals Actuals Guidance Actuals Actuals Guidance
Organic rent growth (eop)
2.9% 3.3% 3.8% - 4.0% 2.9% 3.3% 3.8% - 4.0% 2.9% 3.3% 3.8% - 4.0%
Occupancy (eop) 97.3% 97.6% >97.5% 97.3% 97.6% >97.5% 97.3% 97.6% >97.5%
Rental Income (m) 1,415 1,538 1,660 - 1,680 1,671 1,817 1,961 - 1,984 7,031 7,642 8,248 - 8,347
FFO1 (m) 608 761 900 - 920 718 899 1,063 - 1,087 3,021 3,780 4,472 - 4,571
FFO 1 per share 1.30 1.63 1.86 - 1.90 1.54 1.93 2.20 - 2.24 6.46 8.10 9.24 - 9.44
Maintenance (m) 331 320 ~340 391 378 ~402 1,645 1,590 ~1,689
Modernization & Investments (m)
356 472 ~730 420 558 ~862 1,769 2,347 ~3,627
Privatization (#) 2,979 2,701 ~2,300 2,979 2,701 ~2,300 2,979 2,701 ~2,300
FV step-up (Privatization)
30.5% 36.2% ~35% 30.5% 36.2% ~35% 30.5% 36.2% ~35%
Non-core (#) 12,195 23,930 opportunistic 12,195 23,930 opportunistic 12,195 23,930 opportunistic
FV step-up (Non-Core) 9.2% 5.4% >0% 9.2% 5.4% >0% 9.2% 5.4% >0%
Dividend/share 0.94 1.12 70% of FFO 1 1.11 1.32 70% of FFO 1 4.67 5.56 70% of FFO 1
Exchange rates as of Sep 27, 2017 (EUR 1.00 : USD 1.18115 : MYR 4.96870).

Non-deal Roadshow to Asia – October 2017
IR Contact & Financial Calendar
page 25
Rene Hoffmann Head of Investor Relations Vonovia SE Philippstraße 3 44803 Bochum Germany +49 234 314 1629 [email protected] www.vonovia.de
Financial Calendar 2017 Contact
2017
Nov 8 Interim results 9M 2017
Nov 13-16 Management Roadshow (Europe)
Nov 17 Roadshow (Brussels)*
Nov 28 UBS Global Real Estate CEO/CFO Conference (London)
Nov 28 Roadshow (Geneva)*
Dec 1 Societe Generale The Premium Review Conference (Paris)
Dec 5 Berenberg European Corporate Conference (Pennyhill)*
Dec 11 HSBC Global Real Estate Conference (Cape Town)
Dec 14 Roadshow (Milano)*
2018
Mar 6 FY 2017 results
May 3 Interim retults 3M 2018
May 9 Annual General Meeting
Aug 2 Interim Results 6M 2018
Nov 6 Interim Resuts 9M 2018
*IR only

Non-deal Roadshow to Asia – October 2017 page 26
Appendix
Non-deal Roadshow to Asia – October 2017
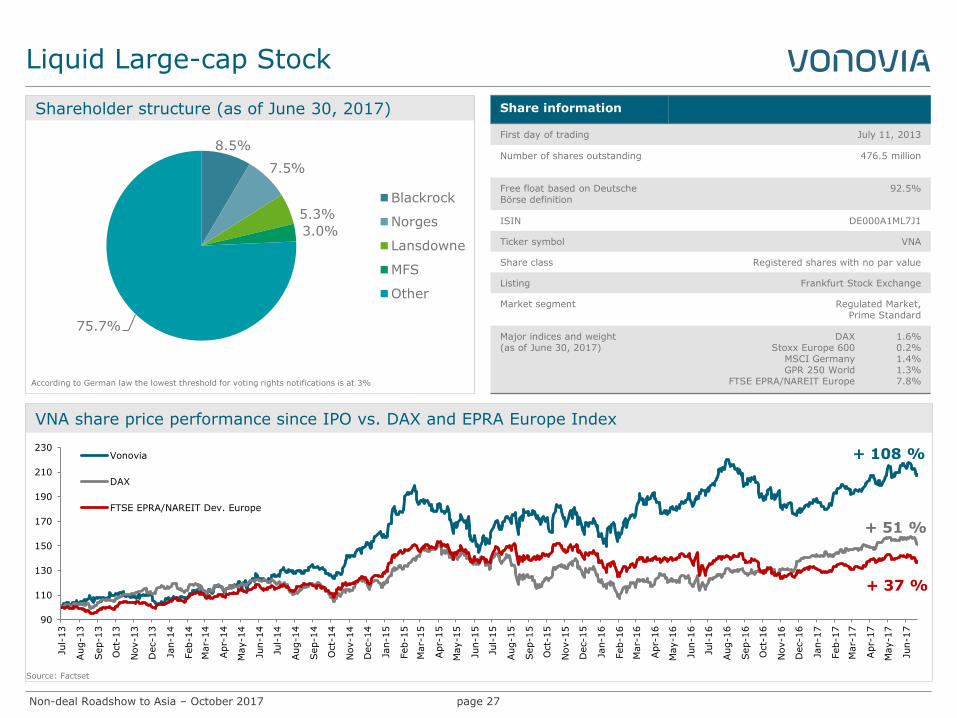
Liquid Large-cap Stock
page 27
VNA share price performance since IPO vs. DAX and EPRA Europe Index
Source: Factset
Share information
First day of trading July 11, 2013
Number of shares outstanding 476.5 million
Free float based on Deutsche Börse definition
92.5%
ISIN DE000A1ML7J1
Ticker symbol VNA
Share class Registered shares with no par value
Listing Frankfurt Stock Exchange
Market segment Regulated Market, Prime Standard
Major indices and weight (as of June 30, 2017)
DAX Stoxx Europe 600
MSCI Germany GPR 250 World
FTSE EPRA/NAREIT Europe
1.6% 0.2% 1.4% 1.3% 7.8%
Shareholder structure (as of June 30, 2017)
8.5%
7.5%
5.3%
3.0%
75.7%
Blackrock
Norges
Lansdowne
MFS
Other
According to German law the lowest threshold for voting rights notifications is at 3%
90
110
130
150
170
190
210
230
Jul-
13
Aug-1
3
Sep-1
3
Oct-
13
Nov-1
3
Dec-1
3
Jan-1
4
Feb-1
4
Mar-
14
Apr-
14
May-1
4
Jun-1
4
Jul-
14
Aug-1
4
Sep-1
4
Oct-
14
Nov-1
4
Dec-1
4
Jan-1
5
Feb-1
5
Mar-
15
Apr-
15
May-1
5
Jun-1
5
Jul-
15
Aug-1
5
Sep-1
5
Oct-
15
Nov-1
5
Dec-1
5
Jan-1
6
Feb-1
6
Mar-
16
Apr-
16
May-1
6
Jun-1
6
Jul-
16
Aug-1
6
Sep-1
6
Oct-
16
Nov-1
6
Dec-1
6
Jan-1
7
Feb-1
7
Mar-
17
Apr-
17
May-1
7
Jun-1
7
Vonovia
DAX
FTSE EPRA/NAREIT Dev. Europe
+ 51 %
+ 108 %
+ 37 %

Non-deal Roadshow to Asia – October 2017
Scalable Organization
page 28
Lo
cal
Cen
tral
Asset Management Property Management
~355,000 apartments
38 Business Units
6 Business Units
North
Customer Service
Sh
ared
- S
ervic
es
Acquisition & Sales
Finance/ Tax
Controlling / Valuation
Legal/ HR
IT Other
Functions*
5 Business Units
East
4 Business Units
South-East
8 Business Units
South
7 Business Units
Middle
8 Business Units
West
6 Regions
Residential Environment
Service
Local property management, letting, care-taking
*Other shared services: Internal Audit, Communications, Central Procurement, Insurances, Investor Relations, Accounting
New Construction & Modernization
Product Management
Technical Service
Non-deal Roadshow to Asia – October 2017
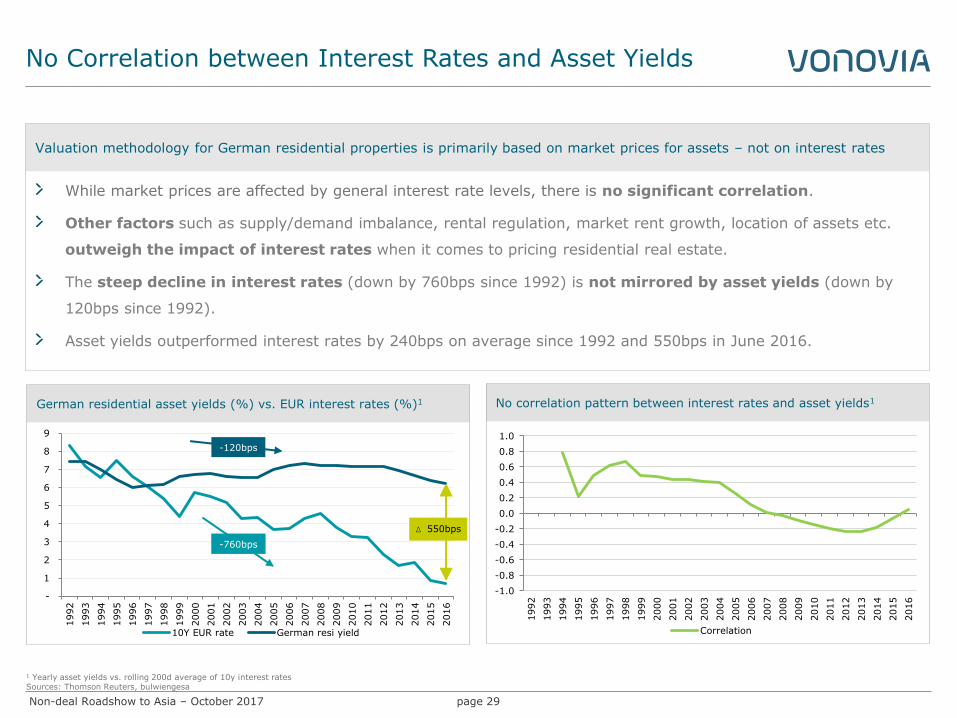
-
1
2
3
4
5
6
7
8
9
1992
1993
1994
1995
1996
1997
1998
1999
2000
2001
2002
2003
2004
2005
2006
2007
2008
2009
2010
2011
2012
2013
2014
2015
2016
10Y EUR rate German resi yield
page 29
German residential asset yields (%) vs. EUR interest rates (%)1
1 Yearly asset yields vs. rolling 200d average of 10y interest rates Sources: Thomson Reuters, bulwiengesa
-120bps
Δ 550bps
While market prices are affected by general interest rate levels, there is no significant correlation.
Other factors such as supply/demand imbalance, rental regulation, market rent growth, location of assets etc.
outweigh the impact of interest rates when it comes to pricing residential real estate.
The steep decline in interest rates (down by 760bps since 1992) is not mirrored by asset yields (down by
120bps since 1992).
Asset yields outperformed interest rates by 240bps on average since 1992 and 550bps in June 2016.
Valuation methodology for German residential properties is primarily based on market prices for assets – not on interest rates
No Correlation between Interest Rates and Asset Yields
No correlation pattern between interest rates and asset yields1
-1.0
-0.8
-0.6
-0.4
-0.2
0.0
0.2
0.4
0.6
0.8
1.0
1992
1993
1994
1995
1996
1997
1998
1999
2000
2001
2002
2003
2004
2005
2006
2007
2008
2009
2010
2011
2012
2013
2014
2015
2016
Correlation
-760bps

Non-deal Roadshow to Asia – October 2017 page 30
1
Cash Flow (FFO 1 & Dividend
€ per share)
2
Portfolio Valuation (Adj. NAV
€ per share)
3
Stock Market Valuation (Stock price € per share)
• Regulated market • No cluster risk due to high
degree of granularity • Robust business model
• Market prices for assets
are much more relevant than interest rate levels
• Additional material factors are supply/ demand imbalance and sustainable market rent growth
• Only partly driven by performance and portfolio valuation
• Negatively correlated to bund yields and interest rates
• Subject to additional macro considerations
21.7 22.7 24.2
30.8 33.1
2013 2014 2015 2016 6M 2017
0.95 1.00
1.30
1.63 ~1.881
0.67 0.74 0.94
1.12 ~70%
2013 2014 2015 2016 2017(E)FFO 1 DPS
Three Valuation Layers with Different Volatilities
Layer Development Main drivers
IPO 2014 2015 2016
High degree of stability and predictability of underlying business (layer 1) and portfolio valuation (layer 2)
is not reflected in share price development (layer 3), as equity markets appear to apply valuation
parameters that are substantially less material for Vonovia’s operating performance.
In
creasin
g level
of
percep
tio
n a
nd
ju
dg
men
t
2017
1 Mid point guidance.

Non-deal Roadshow to Asia – October 2017
H1 2017 Highlights
page 31
Built-in organic growth dynamics continue
Accelerated organic rent growth of 3.7% y-o-y (prior year: 2.8%)
Adj. EBITDA Operations up 8.9% y-o-y.
FFO 1 per share up 15.7% y-o-y (18.1% on average NOSH).
Execution of 2017 investment program running at full speed
98% of projects for €730m target investment volume completed or committed.
Growing pipeline for space creation projects to achieve annual run rate of ~2,000 new units p.a.
Half-year valuation supports positive momentum
Valuation exercise comprised ca. 2/3 of portfolio (20 largest cities plus five additional locations).
€1.5bn l-f-l value increase (+5.2% overall and +7.1% for the sub-portfolio that was revalued).
Guidance for 2017 confirmed
Operational integration of conwert completed.
Performance of first six months fully confirms our expectations for the full year.
Final guidance for 2017 and initial guidance for 2018 with 9M results in November.
Non-deal Roadshow to Asia – October 2017
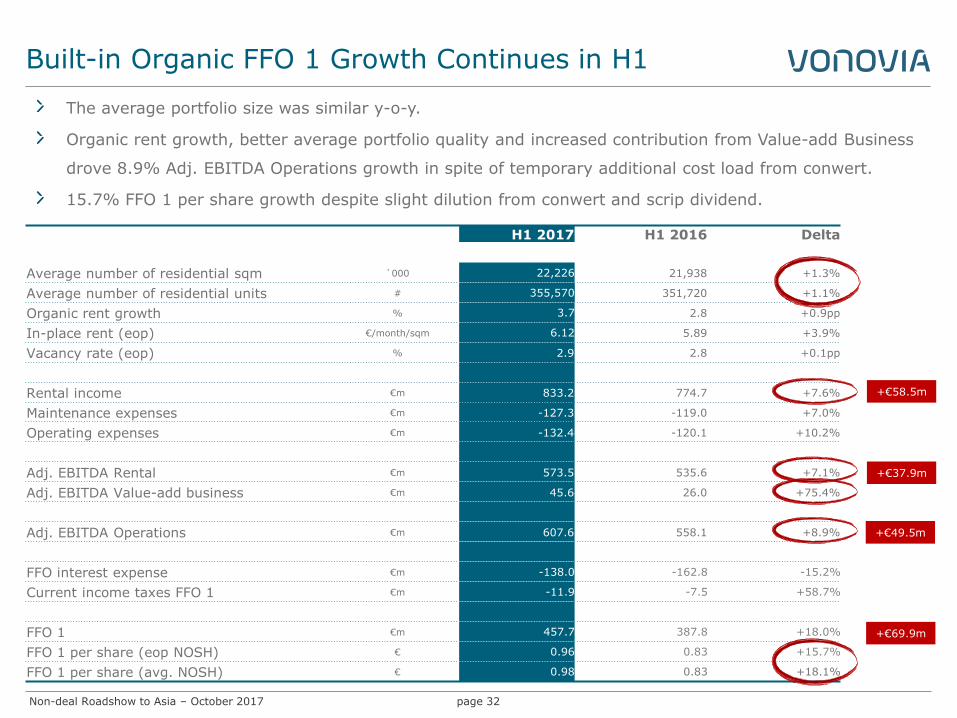
Built-in Organic FFO 1 Growth Continues in H1
page 32
The average portfolio size was similar y-o-y.
Organic rent growth, better average portfolio quality and increased contribution from Value-add Business
drove 8.9% Adj. EBITDA Operations growth in spite of temporary additional cost load from conwert.
15.7% FFO 1 per share growth despite slight dilution from conwert and scrip dividend.
+€37.9m
+€49.5m
+€69.9m
+€58.5m
H1 2017 H1 2016 Delta
Average number of residential sqm `000 22,226 21,938 +1.3%
Average number of residential units # 355,570 351,720 +1.1%
Organic rent growth % 3.7 2.8 +0.9pp
In-place rent (eop) €/month/sqm 6.12 5.89 +3.9%
Vacancy rate (eop) % 2.9 2.8 +0.1pp
Rental income €m 833.2 774.7 +7.6%
Maintenance expenses €m -127.3 -119.0 +7.0%
Operating expenses €m -132.4 -120.1 +10.2%
Adj. EBITDA Rental €m 573.5 535.6 +7.1%
Adj. EBITDA Value-add business €m 45.6 26.0 +75.4%
Adj. EBITDA Operations €m 607.6 558.1 +8.9%
FFO interest expense €m -138.0 -162.8 -15.2%
Current income taxes FFO 1 €m -11.9 -7.5 +58.7%
FFO 1 €m 457.7 387.8 +18.0%
FFO 1 per share (eop NOSH) € 0.96 0.83 +15.7%
FFO 1 per share (avg. NOSH) € 0.98 0.83 +18.1%

Non-deal Roadshow to Asia – October 2017 page 33
LTV down to 43.2% and well within target range of 40%-45%.
LTV Well within Target Range Debt/EBITDA Multiple of 11.2x
Debt/EBITDA multiple is net debt as of June 30 over H1 EBITDA Operations annualized.
€m (unless indicated otherwise)
Jun. 30, 2017 Mar. 31, 2017 Dec. 31, 2016
Non-derivative financial liabilities 14,257.6 14,435.3 13,371.0
Foreign exchange rate effects -137.2 -194.8 -209.9
Cash and cash equivalents -378.1 -1,007.9 -1,540.8
Net debt 13,742.3 13,232.6 11,620.3
Sales receivables -180.0 -144.4 -135.4
Additional loan amount for outstanding acquisitions --- 275.0 ---
Adj. net debt 13,562.3 13,363.2 11,484.9
Fair value of real estate portfolio 30,830.2 29,607.6 27,115.6
Shares in other real estate companies 564.6 520.4 503.1
Adj. fair value of real estate portfolio 31,394.8 30,128.0 27,618.7
LTV 43.2% 44.4% 41.6%

Non-deal Roadshow to Asia – October 2017
FFO 1 per Share +15.7%
page 34
Driven by better operational performance and lower interest expenses, FFO 1 per share was up 15.7% y-o-y
for eop NOSH and up 18.1% for avg. NOSH.
Number of shares outstanding increased from 466.0m to 476.5m (+2.2%) as a result of the scrip dividend
and the conwert acquisition.1
€m (unless indicated otherwise)
H1 2017 H1 2016 Delta
Adj. EBITDA Operations 607.6 558.1 8.9%
FFO interest expense -138.0 -162.8 -15.2%
Current income taxes FFO 1 -11.9 -7.5 58.7%
FFO 1 457.7 387.8 18.0%
of which attributable to Vonovia’s shareholders 431.1 362.3 19.0%
of which attributable to Vonovia’s hybrid capital investors 20.0 20.0 -
of which attributable to non-controlling interests 6.6 5.5 20.0%
Capitalized maintenance -30.5 -29.1 4.8%
AFFO 427.2 358.7 19.1%
Current income taxes FFO 2 -20.1 -25.0 -19.6%
Adjusted EBITDA Sales 44.3 46.5 -4.7%
FFO 2 481.9 409.3 17.7%
FFO 1 € / share (eop NOSH) 0.96 0.83 15.7%
FFO 1 € / share (avg. NOSH) 0.98 0.83 18.1%
1 8.6m additional new shares were created in July in the context of the GAGFAH merger.
Non-deal Roadshow to Asia – October 2017
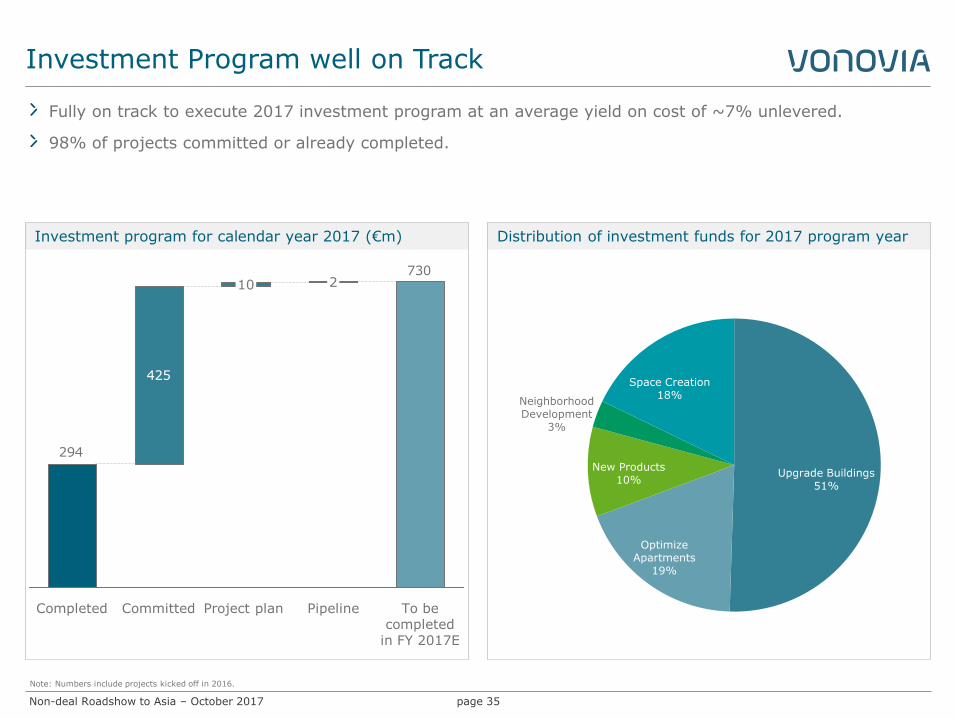
Investment Program well on Track
page 35
Fully on track to execute 2017 investment program at an average yield on cost of ~7% unlevered.
98% of projects committed or already completed.
Note: Numbers include projects kicked off in 2016.
Investment program for calendar year 2017 (€m) Distribution of investment funds for 2017 program year
Upgrade Buildings 51%
Optimize Apartments
19%
New Products 10%
Neighborhood Development
3%
Space Creation 18%
730
294
425
To be completed
in FY 2017E
Pipeline
2
Project plan
10
Committed Completed

Non-deal Roadshow to Asia – October 2017
Space creation pipeline (number of apartments from infill projects and roof extensions)
Ramping Up Space Creation
page 36
>300
>800
2,000
2017E
Completion Start of construction Committed
The bottleneck is not availability of projects,
building capacity or financing but construction
permits including all preliminary approvals
necessary.
By way of planning, applying for building
permits and doing construction work for
different projects in parallel, Vonovia is
developing a pipeline to ensure a steady flow of
project completions going forward to achieve a
target run rate of 2,000 new apartments p.a.
Case Study Kaulbachstr. in Bochum
Start planning
Start coordinating
with the authority Submit
construction application
Receive Building permit
Planning Building permit process Construc-
tion
3 months
8 months
3 months
Often 1 year or longer
Preliminary planning
permission
Planning
Coordination with the authorities
Submission of
construction application
4-6 months 6-8 months 3 months
Construction permit approval process
For larger projects: Development master plan
For small and mid-sized projects: Preconstruction inquiry
1-5 years
6-8 months
Vonovia‘s strategy: planning, applying for construction permits and building a multitude of projects in parallel
Vonovia modular
construction
Note: indicated durations are averages based on Vonovia’s experience and can vary between different projects.
18-24 months
Conventional construction

Non-deal Roadshow to Asia – October 2017
Portfolio Valuation Update
page 37
FV uplift (l-f-l) > 1.5% > 5% > 7.5% > 10%
Valuation as of June 30 comprised the 20 largest cities of our
portfolio, plus five additional locations, representing ca. 2/3
of the entire portfolio fair value. All other locations and
values were left unchanged and adjusted only for
capitalization.
Total value uplift of €1.5bn (5.2%).
Average portfolio FV of €1,341/sqm with an in-place multiple
of 18.5x.
Especially the valuation movement in Leipzig confirms our
view on the conwert properties.
FV growth driver Value uplift
(%) (€m)
Yield compression 2.8% 830
Investments 0.5% 150
Performance 1.3% 393
Fair value uplift of properties reviewed 4.7% 1,373
Investments into properties outside review 0.5% 140
Total fair value uplift 5.2% 1,513
1 l-f-l valuation uplift compared to Dec. 31, 2016, excluding conwert, excluding Vienna.
Value uplift across the 25 locations reviewed1

Non-deal Roadshow to Asia – October 2017
Adj. NAV per Share Up 7.6% in H1 2017
page 38
1 Adjusted for effects from cross currency swaps.
Driven by the operating performance, the inclusion of conwert and the H1 valuation, the Adj. NAV per share
is up 7.6% in the first six months in spite of the 2.2% increase in the number of shares outstanding.
€m (unless indicated otherwise)
Jun. 30, 2017 Mar. 31, 2017 Dec. 31, 2016
Equity attributable to Vonovia's shareholders 13,368.0 12,706.5 12,467.8
Deferred taxes on investment properties and assets held for sale
5,307.9 4,827.4 4,550.3
Fair value of derivative financial instruments1 39.0 29.0 44.4
Deferred taxes on derivative financial instruments -12.1 -14.3 -15.4
EPRA NAV 18,702.8 17,548.6 17,047.1
Goodwill -2,931.8 -2,931.8 -2,718.9
Adj. NAV 15,771.0 14,616.8 14,328.2
EPRA NAV €/share 39.25 37.43 36.58
Adj. NAV €/share 33.10 31.18 30.75

Non-deal Roadshow to Asia – October 2017
Sales – Steady Cash Flow at Attractive Margins
page 39
Overall sales volume lower than in prior-year period mostly as a result of portfolio transaction with LEG
including privatizations in H1 2016.
Non-core / Non-strategic sales include a relatively large share of commercial properties from conwert
portfolio.
PRIVATIZATION
NON-CORE / NON-STRATEGIC
TOTAL
€m (unless indicated otherwise)
H1 2017 H1 2016 H1 2017 H1 2016 H1 2017 H1 2016
No. of units sold 1,160 1,441 3,324 17,694 4,484 19,135
Income from disposal 142.7 133.3 559.2 717.2 701.9 850.5
Fair value of disposal -108.7 -99.1 -536.1 -693.1 -644.8 -792.2
Adj. profit from disposal 34.0 34.2 23.1 24.1 57.1 58.3
Fair value step-up (%) 31.3% 34.5% 4.3% 3.5%
Selling costs -12.8 -11.8
Adj. EBITDA Sales 44.3 46.5

Non-deal Roadshow to Asia – October 2017
Improvements Across All KPIs
page 40
H1 2017 H1 2016 Delta
Average number of residential sqm `000 22,226 21,938 +1.3%
In-place rent (eop) €/month/sqm 6.12 5.89 +3.9%
Organic rent growth % 3.7 2.8 0.9pp
Vacancy rate (eop) % 2.9 2.8 +0.1pp
Rental income €m 833.2 774.7 +7.6%
Cost per average unit € 276 277 -0.4%
Adj. EBITDA Operations €m 607.6 558.1 +8.9%
Rental €m 573.5 535.6 +7.1%
Value-add Business €m 45.6 26.0 +75.4%
Other (i.e. consolidation) €m -11.5 -3.5 +>100%
FFO 1 €m 457.7 387.8 +18.0%
FFO 1 per share (eop NOSH) € 0.96 0.83 +15.7%
FFO 1 per share (avg. NOSH) € 0.98 0.83 +18.1%
AFFO €m 427.2 358.7 +19.1%
Adj. EBITDA Sales €m 44.3 46.5 -4.7%
Adj. EBITDA (Total) €m 651.9 604.6 +7.8%
FFO 2 €m 481.9 409.3 +17.7%
Jun. 30, 2017 Dec. 31, 2016 Delta
Fair value of real estate portfolio €m 30,830.2 27,115.6 +13.7%
EPRA NAV €/share 39.25 36.58 +7.3%
Adj. NAV €/share 33.10 30.75 +7.6%
LTV % 43.2 41.6 -4.2pp

Non-deal Roadshow to Asia – October 2017
All Strategic Markets Show Upward Potential
page 41
Note: Difference between number of resi units in strategic locations and number of resi units in strategic clusters is due to privatization units that are included in the strategic locations but not in the strategic clusters.
Regional Market
Fair Value In-place rent
(€m) (€/sqm) Residential
units Living area ('000 sqm)
Vacancy (%)
Total (p.a., €m)
Residential (p.a., €m)
(€/sqm) Organic rent
growth (%)
Multiple (in-place rent)
Average rent growth forecast CBRE (5 yrs)
(%)
Average rent growth (%) from Optimize
Apartments
Berlin 4,625 1,820 38,582 2,444 1.7 189 179 6.21 3.2 24.4 3.3 45.5
Rhine Main Area (Frankfurt, Darmstadt, Wiesbaden)
3,196 1,757 28,052 1,789 1.8 164 159 7.54 3.9 19.5 3.2 40.3
Rhineland (Cologne, Düsseldorf, Bonn)
3,105 1,464 30,756 2,063 3.1 167 159 6.65 4.3 18.5 2.8 29.4
Dresden 2,697 1,153 38,603 2,196 2.5 156 146 5.67 5.5 17.3 3.6 35.2
Southern Ruhr Area (Dortmund, Essen, Bochum)
2,678 963 44,528 2,721 3.3 181 174 5.52 4.1 14.8 2.1 29.1
Hamburg 1,787 1,648 16,584 1,051 2.2 87 83 6.67 3.7 20.5 3.0 38.6
Munich 1,692 2,564 9,752 642 0.8 62 58 7.60 3.4 27.3 4.5 46.5
Stuttgart 1,592 1,717 14,235 896 1.8 82 78 7.42 1.9 19.3 2.8 38.4
Northern Ruhr Area (Duisburg, Gelsenkirchen)
1,326 774 27,281 1,693 4.1 105 102 5.24 3.4 12.6 1.7 22.9
Hanover 1,100 1,236 13,826 875 3.0 63 61 6.01 3.2 17.3 2.7 34.1
Kiel 928 1,103 13,983 811 1.8 56 54 5.60 3.0 16.5 2.2 35.9
Bremen 854 1,147 11,921 723 3.7 47 44 5.34 1.8 18.2 2.9 33.6
Leipzig 680 1,096 9,171 587 4.2 41 38 5.69 1.6 16.5 2.4 21.7
Westphalia (Münster, Osnabrück)
613 968 9,651 625 2.2 41 40 5.46 2.8 14.9 2.5 30.9
Freiburg 508 1,816 4,055 277 1.8 23 22 6.83 3.4 22.1 3.7 45.6
Other Strategic Locations 1,967 1,261 24,012 1,524 2.9 115 111 6.22 4.4 17.1 3.1 34.6
Total Strategic Locations 29,349 1,361 334,992 20,916 2.6 1,582 1,508 6.17 3.7 18.6 2.9 34.4

Non-deal Roadshow to Asia – October 2017
Substantial Reduction of Portfolio Locations
page 42
High-influx cities (“Schwarmstädte”). For more information: http://investoren.vonovia.de/websites/vonovia/English/4050/financial-reports-_-presentations.html
Vonovia location
03/2015 (incl. Südewo)
818 locations
12/2016
665 locations
Strategic Portfolio
<400 locations

Non-deal Roadshow to Asia – October 2017
Maintenance
page 43
5.7 5.4
1.4 1.3
H1 2017 H1 2016
Expenses for maintenance Capitalized maintenance
€7.2/sqm €6.7/sqm
€m (unless indicated otherwise)
H1 2017 H1 2016 Delta
Expenses for maintenance -127.3 -119.0 7.0%
Capitalized maintenance -31.5 -29.3 7.5%
Total -158.8 -148.3 7.1%
Maintenance capitalization ratio
20% 20%

Non-deal Roadshow to Asia – October 2017
Reconciliation IFRS Profit to FFO
page 44
€m (unless indicated otherwise) H1 2017 H1 2016 Delta
IFRS PROFIT FOR THE PERIOD 1,064.6 147.9 +>100%
Financial result 148.6 276.1 -46.2%
Income taxes 588.0 109.9 +>100%
Depreciation and amortization 14.9 10.0 +49.0%
Income from fair value adjustments of investment properties -1,164.7 --- ---
= EBITDA IFRS 651.4 543.9 +19.8%
Non-recurring items 46.3 49.1 -5.7%
Total period adjustments from assets held for sale -32.9 21.1 ->100%
Income from investments in other real estate companies -12.9 -9.5 ->100%
= ADJUSTED EBITDA 651.9 604.6 +7.8%
Adjusted EBITDA Sales -44.3 -46.5 -4.7%
= ADJUSTED EBITDA OPERATIONS 607.6 558.1 +8.9%
Interest expense FFO -138.0 -162.8 -15.2%
Current income taxes FFO 1 -11.9 -7.5 +58.7%
= FFO 1 457.7 387.8 +18.0%
Capitalized maintenance -30.5 -29.1 +4.8%
= AFFO 427.2 358.7 +19.1%
Current income taxes FFO2 -20.1 -25.0 -19.6%
FFO 2 (FFO 1 incl. Adjusted EBITDA Sales/current income taxes Sales)
481.9 409.3 +17.7%
FFO 1 per share in € (eop NOSH) 0.96 0.83 +15.7%
AFFO per share in € (eop NOSH) 0.90 0.77 +16.5%
Number of shares (million) eop 476.5 466.0 +2.2%
Non-deal Roadshow to Asia – October 2017
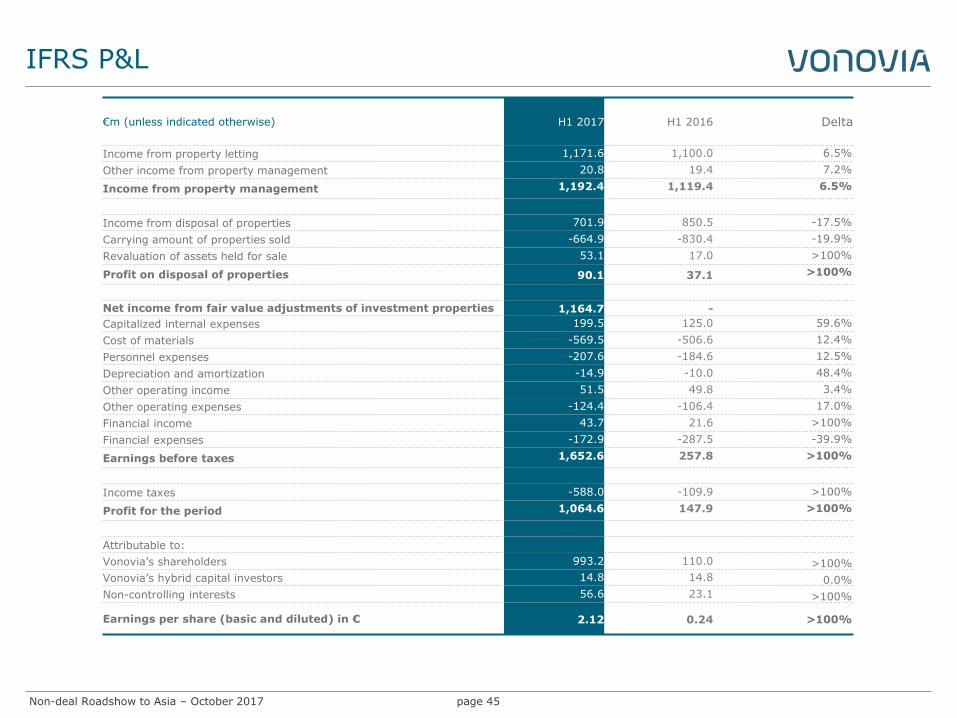
IFRS P&L
page 45
€m (unless indicated otherwise) H1 2017 H1 2016 Delta
Income from property letting 1,171.6 1,100.0 6.5%
Other income from property management 20.8 19.4 7.2%
Income from property management 1,192.4 1,119.4 6.5%
Income from disposal of properties 701.9 850.5 -17.5%
Carrying amount of properties sold -664.9 -830.4 -19.9%
Revaluation of assets held for sale 53.1 17.0 >100%
Profit on disposal of properties 90.1 37.1 >100%
Net income from fair value adjustments of investment properties 1,164.7 -
Capitalized internal expenses 199.5 125.0 59.6%
Cost of materials -569.5 -506.6 12.4%
Personnel expenses -207.6 -184.6 12.5%
Depreciation and amortization -14.9 -10.0 48.4%
Other operating income 51.5 49.8 3.4%
Other operating expenses -124.4 -106.4 17.0%
Financial income 43.7 21.6 >100%
Financial expenses -172.9 -287.5 -39.9%
Earnings before taxes 1,652.6 257.8 >100%
Income taxes -588.0 -109.9 >100%
Profit for the period 1,064.6 147.9 >100%
Attributable to:
Vonovia’s shareholders 993.2 110.0 >100%
Vonovia’s hybrid capital investors 14.8 14.8 0.0%
Non-controlling interests 56.6 23.1 >100%
Earnings per share (basic and diluted) in € 2.12 0.24 >100%
Non-deal Roadshow to Asia – October 2017
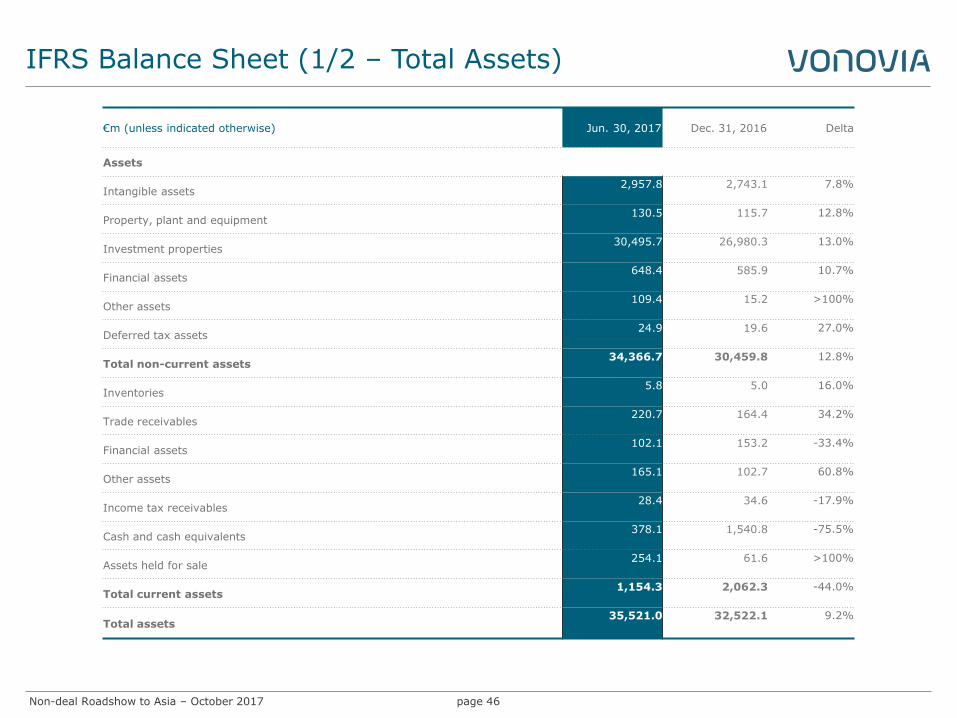
IFRS Balance Sheet (1/2 – Total Assets)
page 46
€m (unless indicated otherwise) Jun. 30, 2017 Dec. 31, 2016 Delta
Assets
Intangible assets 2,957.8 2,743.1 7.8%
Property, plant and equipment 130.5 115.7 12.8%
Investment properties 30,495.7 26,980.3 13.0%
Financial assets 648.4 585.9 10.7%
Other assets 109.4 15.2 >100%
Deferred tax assets 24.9 19.6 27.0%
Total non-current assets 34,366.7 30,459.8 12.8%
Inventories 5.8 5.0 16.0%
Trade receivables 220.7 164.4 34.2%
Financial assets 102.1 153.2 -33.4%
Other assets 165.1 102.7 60.8%
Income tax receivables 28.4 34.6 -17.9%
Cash and cash equivalents 378.1 1,540.8 -75.5%
Assets held for sale 254.1 61.6 >100%
Total current assets 1,154.3 2,062.3 -44.0%
Total assets 35,521.0 32,522.1 9.2%

Non-deal Roadshow to Asia – October 2017
IFRS Balance Sheet (2/2 – Total Equity and Liabilities)
page 47
€m (unless indicated otherwise) Jun. 30, 2017 Dec. 31, 2016 Delta
Equity and liabilities
Subscribed capital 476.5 466.0 2.3%
Capital reserves 5,673.4 5,334.9 6.3%
Retained earnings 7,136.3 6,665.4 7.1%
Other reserves 81.8 1.5 >100%
Total equity attributable to Vonovia's shareholders 13,368.0 12,467.8 7.2%
Equity attributable to hybrid capital investors 1,021.4 1,001.6 2.0%
Total equity attributable to Vonovia's shareholders and hybrid capital investors 14,389.4 13,469.4 6.8%
Non-controlling interests 885.7 419.0 >100%
Total equity 15,275.1 13,888.4 10.0%
Provisions 595.4 607.9 -2.1%
Trade payables 0.6 1.3 -53.8%
Non derivative financial liabilities 11,771.1 11,643.4 1.1%
Derivatives 18.0 19.1 -5.8%
Liabilities from finance leases 94.5 94.7 -0.2%
Liabilities to non-controlling interests 4.9 9.9 -50.5%
Other liabilities 80.8 83.3 -3.0%
Deferred tax liabilities 4,492.6 3,769.5 19.2%
Total non-current liabilities 17,057.9 16,229.1 5.1%
Provisions 360.8 370.8 -2.7%
Trade payables 123.5 138.8 -11.0%
Non derivative financial liabilities 2,486.5 1,727.6 43.9%
Derivatives 29.9 57.5 -48.0%
Liabilities from finance leases 11.2 4.5 >100%
Liabilities to non-controlling interests 0.4 2.7 -85.2%
Other liabilities 175.7 102.7 71.1%
Total current liabilities 3,188.0 2,404.6 32.6%
Total liabilities 20,245.9 18,633.7 8.7%
Total equity and liabilities 35,521.0 32,522.1 9.2%

Non-deal Roadshow to Asia – October 2017
Bonds / Rating
page 48
Corporate Investment grade rating
Rating agency Rating Outlook Last Update
Standard & Poor’s BBB+ Stable 06. Sep 16
Bond ratings
Name Tenor & Coupon ISIN Amount Issue price Coupon Final Maturity Date Rating
Bond 002 (EUR-Bond) 6 years 3.125% DE000A1HNW52 € 600m 99.935% 3.125% 25 July 2019 BBB+
Bond 003 (USD-Bond) 4 years 3.200% US25155FAA49 USD 750m 100.000% 2.970%1 02 Oct 2017 BBB+
Bond 004 (USD-Bond) 10 years 5.000% US25155FAB22 USD 250m 98.993% 4.580%1 02 Oct 2023 BBB+
Bond 005 (EMTN) 8 years 3.625% DE000A1HRVD5 € 500m 99.843% 3.625% 08 Oct 2021 BBB+
Bond 006 (Hybrid) 60 years 4.625% XS1028959671 € 700m 99.782% 4.625% 08. Apr 2074 BBB-
Bond 007 (EMTN) 8 years 2.125% DE000A1ZLUN1 € 500m 99.412% 2.125% 09 July 2022 BBB+
Bond 008 (Hybrid) perpetual 4% XS1117300837 € 1,000m 100.000% 4.000% perpetual BBB-
Bond 009A (EMTN) 5 years 0.875% DE000A1ZY971 € 500m 99.263% 0.875% 30 Mar 2020 BBB+
Bond 009B (EMTN) 10 years 1.500% DE000A1ZY989 € 500m 98.455% 1.500% 31 Mar 2025 BBB+
Bond 010A (EMTN) 2 years 0.950%+3M EURIBOR DE000A18V120 € 750m 100.000% 0.835% hedged 15 Dec 2017 BBB+
Bond 010B (EMTN) 5 years 1.625% DE000A18V138 € 1,250m 99.852% 1.625% 15 Dec 2020 BBB+
Bond 010C (EMTN) 8 years 2.250% DE000A18V146 € 1,000m 99.085% 2.250% 15 Dec 2023 BBB+
Bond 011A (EMTN) 6 years 0.875% DE000A182VS4 € 500m 99.530% 0.875% 10 June 2022 BBB+
Bond 011B (EMTN) 10 years 1.500% DE000A182VT2 € 500m 99.165% 1.500% 10 June 2026 BBB+
Bond 012 (EMTN) 2 years 0.380%+3M EURIBOR DE000A185WC9 € 500m 100.000% 0.140% hedged 13 Sep 2018 BBB+
Bond 013 (EMTN) 8 years 1.250% DE000A189ZX0 € 1,000m 99.037% 1.250% 06 Dec 2024 BBB+
Bond 14A (EMTN) 5 years 0.750% DE000A19B8D4 € 500m 99.863% 0.750% 25 Jan 2022 BBB+
Bond 14B (EMTN) 10 years 1.750% DE000A19B8E2 € 500m 99.266% 1.750% 25 Jan 2027 BBB+
1 EUR-equivalent Coupon

Non-deal Roadshow to Asia – October 2017
Covenants and KPIs (June 30, 2017)
page 49
Covenant Level Jun. 30, 2017
LTV
Total Debt / Total Assets <60% 40%
Secured LTV
Secured Debt / Total Assets <45% 10%
ICR
Last 12M EBITDA / Last 12M Interest Expense >1.80x 4,1x
Unencumbered Assets
Unencumbered Assets / Unsecured Debt >125% 224%
Covenant Level (BBB+)
Debt to Capital
Total Debt / Total Equity + Total Debt <60%
ICR
Last 12M EBITDA / Last 12M Interest Expense >1.80x
Bond KPIs
Rating KPIs

Non-deal Roadshow to Asia – October 2017
Acquisitions – Opportunistic but Disciplined
Acquisition pipeline (‘000 units) – excl. Gagfah
page 50
127
74
58
45
20
83
39 38
7
0
91
32
20
9
1 0
20
40
60
80
100
120
140
Examined Analyzed inmore detail
Due Diligence,partly ongoing
Bids Signed
H1 2015 H1 2016 H1 2017
Acquisition criteria
No quantitative acquisition target.
Any potential acquisition must meet all four stringent
acquisition criteria assuming a 50/50 equity/debt
financing.
Strategic fit
NAV/share
non-dilutive
FFO/share
accretive
BBB+ Rating
(stable)

Non-deal Roadshow to Asia – October 2017
Historical Key Figures (1/2)
page 51
The key figures of prior years have been adjusted to match the definitions of the 2016 fiscal year. The key figures per share are based on the shares carrying dividend rights on the corresponding reporting date. Values for 2013 and 2014 are TERP-adjusted.
Financial Key Figures (€m, unless stated otherwise) H1 2017 2016 2015 2014 2013
Rental income 833.2 1,538.1 1,414.6 789.3 728.0
Adjusted EBITDA Operations 607.6 1,094.0 957.6 503.4 442.4
Adjusted EBITDA Rental 573.5 1,046.2 924.4 482.6 433.0
Adjusted EBITDA Value-add Business 45.6 57.0 37.6 23.6 10.5
Adjusted EBITDA Other -11.5 -9.2 -4.4 -2.8 -1.1
Income from disposal of properties 701.9 1,227.9 726.0 287.3 353.5
Adjusted EBITDA Sales 44.3 92,5 71.1 50.1 27.7
Adjusted EBITDA 651.9 1,186.5 1,028.7 553.5 470.1
EBITDA IFRS 651.4 1,083.7 838.4 500.3 431.0
FFO 1 457.7 760.8 608.0 286.6 223.5
thereof attributable to Vonovia shareholders 431.1 713.4 555.5 275.1 218.4
thereof attributable to Vonovia hybrid capital investors 20.0 40.0 33.0 - -
thereof attributable to Non-controlling interests 6.6 7.4 19.5 11.5 5.1
FFO 2 481.9 823.8 662.1 336.7 251.2
AFFO 427.2 689.2 520.5 258.3 203.5
FFO 1 per share in € 0.96 1.63 1.30 1.00 0.95
Income from fair value adjustments of investment properties 1,164.7 3,236.1 1,323.5 371.1 553.7
EBT 1,652.6 3,859.8 1,734.5 589.1 689.6
Profit for the period 1,064.6 2,512.9 994.7 409.7 484.2
Cash flow from operating activities 475.4 828.9 689.8 453.2 259.6
Cash flow from investing activities - 1,179.0 416.4 -3,239.8 -1,177.9 171.3
Cash flow from financing activities -459.1 -2,812.4 4,093.1 1,741.7 -353.2
Maintenance and modernization 456.4 792.4 686.3
345.5
228.4
thereof for maintenance expenses and capitalized maintenance 158.8 320.1 330.7 173.8 157.6
thereof for modernization 297.6 472.3 355.6 171.7 70.8

Non-deal Roadshow to Asia – October 2017
Historical Key Figures (2/2)
page 52
The key figures of prior years have been adjusted to match the definitions of the 2016 fiscal year. The key figures per share are based on the shares carrying dividend rights on the corresponding reporting date. Values for 2013 and 2014 are TERP-adjusted.
Key Balance Sheet Figures (€m, unless stated otherwise)
Jun. 30, 2017
Dec. 31, 2016
Dec. 31, 2015
Dec 31, 2014
Dec 31, 2013
Fair value of real estate portfolio 30,830.2 27,115.6 24,157.7 12,759.1 10,326.7
Adjusted NAV 15,771.0 14,328.2 11,273.5 6,472.0 5,123.4
Adjusted NAV per share in € 33.10 30.75 24.19 22.67 21.74
LTV (%) 43.2 41.6 47.3 49.7 49.0
Non-Financial Key Figures
H1 2017 2016
2015
2014
2013
Number of units managed 416,282 392,350 397,799 232,246 201,737
thereof own apartments 352,815 333,381 357,117 203,028 175,258
thereof apartments owned by others 63,467 58,969 40,682 29,218 26,479
Number of units bought 23,745 2,815 168,632 31,858 0
Number of units sold 4,484 26,631 15,174 4,081 6,720
thereof Privatize 1,160 2,701 2,979 2,238 2,576
thereof Non-Core 3,324 23,930 12,195 1,843 4,144
Vacancy rate (in %; eop) 2.9 2.4 2.7 3.4 3.5
Monthly in-place rent in €/sqm 6.12 6.02 5.75 5.58 5.40
Monthly in-place rent organic growth (%) 3.7 3.3 - - -
Number of employees 8,257 7,437 6,368 3,850 2,935
EPRA Key Figures
H1 2017 2016
2015
2014
2013
EPRA NAV 18,702.8 17,047.1 13,988.2 6,578.0 5,123.4
EPRA NAV per share in €** 39.25 36.58 30.02 23.04 21.74
EPRA NNNAV - 12,034.4 9,739.8 - -
EPRA Earnings - 448.5 329.2 - -
EPRA Net Initial Yield in % - 4.1 4.5 - -
EPRA "topped-up" Net Initial Yield in % - 4.1 4.5 - -
EPRA Vacancy rate in % - 2.2 2.5 3.0 3.1 EPRA Cost Ratio (incl. direct vacancy costs) in % - 28.4 31.9 - -
EPRA Cost Ratio (excl. direct vacancy costs) in % - 27.0 30.2 - -

Non-deal Roadshow to Asia – October 2017
Vacancy Rates – Annual Comparison
Q-by-Q development 2012 – 2016
page 53
4.4%
4.5%
4.4%
3.9%
4.0% 3.9% 3.9%
3.5%
3.7% 3.8%
3.6%
3.4% 3.4%
3.5%
3.4%
2.7%
2.8% 2.8% 2.8%
2.4%
2%
3%
4%
5%
Q1 Q2 Q3 Q4
2012
2013
2014
2015
2016

Non-deal Roadshow to Asia – October 2017
Vonovia History
page 54
Source: Factset, company data
Share price and market capitalization
Seed portfolios of today‘s Vonovia have origin in public housing provided by government, large employers
and similar landlords with a view towards offering affordable housing.
At beginning of last decade, private equity invested in German residential on a large scale including into
what is Vonovia today (mainly Deutsche Annington and Gagfah then).
IPO in 2013.
Final exit of private equity in 2014.
0
2
4
6
8
10
12
14
16
18
20
15
20
25
30
35
40
Q3 '13 Q4 '13 Q1 '14 Q2 '14 Q3 '14 Q4 '14 Q1 '15 Q2 '15 Q3 '15 Q4 '15 Q1 '16 Q2 '16 Q3 '16 Q4 '16 Q1 '17 Q2 '17
Averag
e m
arket
cap
(E
uro
bn
)
VW
AP
(E
uro
/sh
are)
Average market cap (Euro bn) VWAP (Euro/share)
DAX inclusion
MSCI inclusion
Stoxx 600 inclusion
Südewo acq. (20k units)
MDAX inclusion
S-DAX inclusion
DeWAG & Vitus acq. (41k units)
Gagfah acq. (140k units)
conwert acq. (24k units)

Non-deal Roadshow to Asia – October 2017
Impressions
page 55
Frankfurt
Frankfurt
Frankfurt
Essen

Non-deal Roadshow to Asia – October 2017
Impressions
page 56
Dresden
Dresden Dortmund
Dresden

Non-deal Roadshow to Asia – October 2017
Impressions
page 57
Essen Dortmund
Dortmund Essen

Non-deal Roadshow to Asia – October 2017 page 58
Optimize Apartment
Before After

Non-deal Roadshow to Asia – October 2017 page 59
Optimize Apartment
Before After

Non-deal Roadshow to Asia – October 2017 page 60
Upgrade Building
Before After

Non-deal Roadshow to Asia – October 2017 page 61
Upgrade Building
Before After

Non-deal Roadshow to Asia – October 2017 page 62
Before After
Upgrade Building

Non-deal Roadshow to Asia – October 2017
Modernization - Impressions
page 63
Upgrade Building Upgrade Building
Addition of new floor plus modernization investment Addition of new floor plus modernization investment
Before After

Non-deal Roadshow to Asia – October 2017
Floor Addition
page 64

Non-deal Roadshow to Asia – October 2017
Floor Addition
page 65
Before After
Non-deal Roadshow to Asia – October 2017
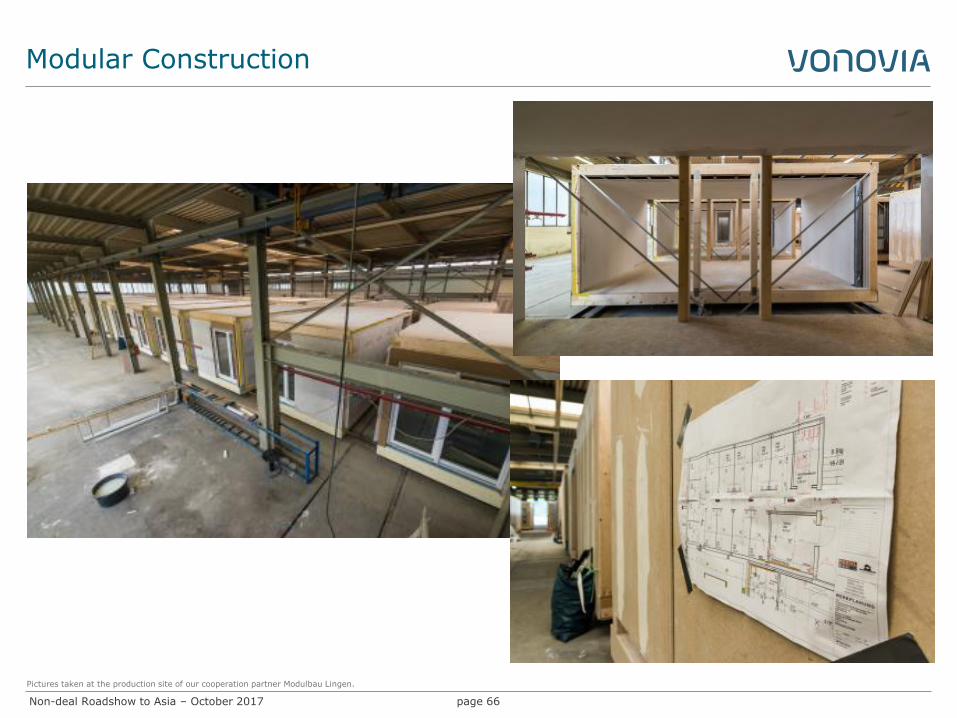
Modular Construction
page 66
Pictures taken at the production site of our cooperation partner Modulbau Lingen.

Non-deal Roadshow to Asia – October 2017
Modular Construction
page 67

Non-deal Roadshow to Asia – October 2017
Modular Construction
page 68

Non-deal Roadshow to Asia – October 2017
Modular Construction
page 69

Non-deal Roadshow to Asia – October 2017
Modular Construction
page 70

Non-deal Roadshow to Asia – October 2017
Neighbourhood Development “Eltingviertel”
page 71

Non-deal Roadshow to Asia – October 2017
VTS Van
page 72

Non-deal Roadshow to Asia – October 2017
Disclaimer
page 73
This presentation has been specifically prepared by Vonovia SE and/or its affiliates (together, “Vonovia”) for internal use. Consequently, it may not be sufficient or appropriate for the purpose for which a third party might use it.
This presentation has been provided for information purposes only and is being circulated on a confidential basis. This presentation shall be used only in accordance with applicable law, e.g. regarding national and international insider dealing rules, and must not be distributed, published or reproduced, in whole or in part, nor may its contents be disclosed by the recipient to any other person. Receipt of this presentation constitutes an express agreement to be bound by such confidentiality and the other terms set out herein.
This presentation includes statements, estimates, opinions and projections with respect to anticipated future performance of Vonovia ("forward-looking statements") which reflect various assumptions concerning anticipated results taken from Vonovia’s current business plan or from public sources which have not been independently verified or assessed by Vonovia and which may or may not prove to be correct. Any forward-looking statements reflect current expectations based on the current business plan and various other assumptions and involve significant risks and uncertainties and should not be read as guarantees of future performance or results and will not necessarily be accurate indications of whether or not such results will be achieved. Any forward-looking statements only speak as at the date the presentation is provided to the recipient. It is up to the recipient of this presentation to make its own assessment of the validity of any forward-looking statements and assumptions and no liability is accepted by Vonovia in respect of the achievement of such forward-looking statements and assumptions.
Vonovia accepts no liability whatsoever to the extent permitted by applicable law for any direct, indirect or consequential loss or penalty arising from any use of this presentation, its contents or preparation or otherwise in connection with it.
No representation or warranty (whether express or implied) is given in respect of any information in this presentation or that this presentation is suitable for the recipient’s purposes. The delivery of this presentation does not imply that the information herein is correct as at any time subsequent to the date hereof.
Vonovia has no obligation whatsoever to update or revise any of the information, forward-looking statements or the conclusions contained herein or to reflect new events or circumstances or to correct any inaccuracies which may become apparent subsequent to the date hereof.
This presentation does not, and is not intended to, constitute or form part of, and should not be construed as, an offer to sell, or a solicitation of an offer to purchase, subscribe for or otherwise acquire, any securities of the Company nor shall it or any part of it form the basis of or be relied upon in connection with or act as any inducement to enter into any contract or commitment or investment decision whatsoever.
This presentation is neither an advertisement nor a prospectus and is made available on the express understanding that it does not contain all information that may be required to evaluate, and will not be used by the attendees/recipients in connection with, the purchase of or investment in any securities of the Company. This presentation is selective in nature and does not purport to contain all information that may be required to evaluate the Company and/or its securities. No reliance may or should be placed for any purpose whatsoever on the information contained in this presentation, or on its completeness, accuracy or fairness.
This presentation is not directed to or intended for distribution to or use by, any person or entity that is a citizen or resident or located in any locality, state, country or other jurisdiction where such distribution, publication, availability or use would be contrary to law or regulation or which would require any registration or licensing within such jurisdiction.
Neither this presentation nor the information contained in it may be taken, transmitted or distributed directly or indirectly into or within the United States, its territories or possessions. This presentation is not an offer of securities for sale in the United States. The securities of the Company have not been and will not be registered under the US Securities Act of 1933, as amended (the “Securities Act”) or with any securities regulatory authority of any state or other jurisdiction of the United States. Consequently, the securities of the Company may not be offered, sold, resold, transferred, delivered or distributed, directly or indirectly, into or within in the United States except pursuant to an exemption from, or in a transaction not subject to, the registration requirements of the Securities Act and in compliance with any applicable securities laws of any state or other jurisdiction of the United States unless registered under the Securities Act.
Tables and diagrams may include rounding effects.

Non-deal Roadshow to Asia – October 2017
For Your Notes
page 74