
Community Affairs References Committee - … Affairs References Committee Out-of-pocket costs in...
97
The Senate Community Affairs References Committee Out-of-pocket costs in Australian healthcare August 2014
Transcript of Community Affairs References Committee - … Affairs References Committee Out-of-pocket costs in...
The Senate
Community Affairs References Committee
Out-of-pocket costs in Australian healthcare August 2014
Commonwealth of Australia 2014
ISBN 978-1-76010-066-7
Secretariat
Ms Jeanette Radcliffe (Committee Secretary) Mr Matthew Crawshaw (Committee Secretary) Dr Richard Grant (Principal Research Officer) Ms Monika Sheppard (Senior Research Officer) Ms Margie Morrison (Senior Research Officer) Ms Elise Williamson (Research Officer) Mr Tasman Larnach (Research Officer) Ms Carol Stewart (Administrative Officer) Ms Najiyah Khan (Graduate)
PO Box 6100 Parliament House Canberra ACT 2600 Phone: 02 6277 3515 Fax: 02 6277 5829 E-mail: [email protected] Internet: www.aph.gov.au/senate_ca
This document was produced by the Senate Community Affairs Committee Secretariat and printed by the Senate Printing Unit, Parliament House, Canberra. This work is licensed under the Creative Commons Attribution-NonCommercial-NoDerivs 3.0 Australia License.
The details of this licence are available on the Creative Commons website: http://creativecommons.org/licenses/by-nc-nd/3.0/au/
ii
MEMBERSHIP OF THE COMMITTEE
44th Parliament
Members
Senator Rachel Siewert, Chair Western Australia, AG Senator Sue Boyce, Deputy Chair (to 30 June) Queensland, LP Senator Zed Seselja, Deputy Chair (from 8 July) Queensland, LP Senator Catryna Bilyk (from 1 July) Tasmania, ALP Senator Carol Brown Tasmania, ALP Senator Nova Peris OAM Northern Territory, ALP Senator Linda Reynolds (from 1 July) Western Australia, LP Senator Dean Smith (to 30 June) Western Australia, LP Senator the Hon Lin Thorp (to 30 June) Tasmania, ALP
Participating members for this inquiry
Senator Richard Di Natale Victoria, AG Senator the Hon Jan McLucas Queensland, ALP Senator Claire Moore Queensland, ALP
iii

iv
TABLE OF CONTENTS
Membership of the Committee ........................................................................ iii
Abbreviations ..................................................................................................... ix
List of Recommendations .................................................................................. xi
Chapter 1
Introduction .............................................................................................................. 1
Terms of Reference ................................................................................................ 1
Conduct of the inquiry ............................................................................................ 1
Acknowledgements ................................................................................................ 2
Notes on references ................................................................................................ 2
Structure of the report ............................................................................................. 2
Chapter 2
Out-of-pocket expenditure in Australian healthcare ............................................ 3
Introduction ............................................................................................................ 3
Current out-of-pocket healthcare expenditure ........................................................ 4
Key areas of expenditure ...................................................................................... 11
Committee view .................................................................................................... 23
Chapter 3
Co-payments............................................................................................................ 25
Introduction .......................................................................................................... 25
Impact of co-payments on consumers ability to access health care ..................... 29
Impact on health outcomes and costs ................................................................... 35
Effect of co-payments on other parts of the health system .................................. 37
Safety nets and other offsets .................................................................................. 41
Introduction .......................................................................................................... 41
Appropriateness of current safety nets and other offsets ..................................... 43
Recommended changes to the safety nets ............................................................ 47
Committee view .................................................................................................... 48
Chapter 4
Current market drivers and the sustainability of the health system ................ 49
Market drivers ...................................................................................................... 49
Access to comprehensive health data ................................................................... 51
Sustainability of the health system ....................................................................... 52
Committee view .................................................................................................... 55
Chapter 5
Private health insurance ........................................................................................ 57
Introduction .......................................................................................................... 57
Private health insurance in primary healthcare .................................................... 57
Role of private health insurers to reduce out-of-pocket costs .............................. 60
Out of pocket costs associated with the private health system ............................ 60
Ensuring a high level of information disclosure .................................................. 62
Committee view .................................................................................................... 64
Chapter 6
Conclusion and recommendations ........................................................................ 65
Coalition Senators' Dissenting Report
Health Expenditure ............................................................................................... 71
Out of Pocket Health Expenses ............................................................................ 71
International Comparisons.................................................................................... 72
Government Measures addressing out-of-pocket expenses ................................. 73
Recommendations ................................................................................................ 74
APPENDIX 1
Submissions and additional information received by the Committee ............... 77
vi
APPENDIX 2
Public hearings ........................................................................................................ 83
vii

viii
ABBREVIATIONS
ABS Australian Bureau of Statistics
ACOSS Australian Council of Social Service
ACT Australian Capital Territory
ADA Australian Dental Association
AIHW Australian Institute of Health and Welfare
AMA Australian Medical Association
ASA Australian Society of Anaesthetists
ATSI Aboriginal and Torres Strait Islander
CHF Consumers Health Forum of Australia
COAG Council of Australian Governments
COTA Council of the Ageing Australia
ED Emergency Department
EMSN Extended Medicare Safety Net
GDP Gross Domestic Product
GP General Practitioner
MBS Medicare Benefits Schedule
MTAA Medical Technology Association of Australia
NACCHO National Aboriginal Community Controlled Health Organisation
NHPA National Health Performance Authority
NMETO Net Medical Expenses Tax Offset
NRHA National Rural Health Alliance
NSW New South Wales
OECD Organisation for Economic Co-operation and Development
PBS Pharmaceutical Benefits Scheme
PHIAC Private health Insurance Administration Council
QAIHC Queensland Aboriginal and Islander Health Council
RACGP Royal Australian College of General Practitioners
SEIFA Socio-Economic Indexes for Areas
SHPA Society of Hospital Pharmacists of Australia
SMSN Single Medicare Safety Net
VACCHO Victorian Aboriginal Community Controlled Health Organisation
x
LIST OF RECOMMENDATIONS
Recommendation 1
6.20 The committee recommends that the Government should not proceed with further co-payments. Recommendation 2
6.21 The committee recommends that the Government undertake a comprehensive review of the impact of existing co-payments on individuals' access to health services and health outcomes. The review should pay particular attention to the impact on the most vulnerable groups in the community. Recommendation 3
6.22 The committee recommends that the Government review the impact and effectiveness of existing safety nets to ensure that current safeguards provide adequate protection to the most vulnerable in the community. Recommendation 4
6.26 The committee recommends that the Government review the Pharmaceutical Benefits Scheme to identify areas where efficiencies can be gained, with particular reference to the following areas:
• current procurement and pricing structures, with particular reference to examining benchmarking as a mechanism to explore the extent to which savings could be achieved;
• effective monitoring and review of GP prescribing practices to ensure dispensed medications are cost effective and evidence based; and
• evaluation of the prevalence of patient non-adherence to prescribed medication, with particular reference to identifying reasons for non-adherence. Recommendation 5
6.32 The committee recommends that the Government review existing models for funding and delivery of primary healthcare with a view to identifying opportunities for improved service delivery and health outcomes.

xii
Chapter 1 Introduction
Terms of Reference 1.1 On 26 March 2014, the Senate referred the following matter to the Senate Community Affairs References Committee (committee) for inquiry and report by 16 July 2014:
The out-of-pocket costs in Australian healthcare, with particular reference to:
(a) the current and future trends in out-of-pocket expenditure by Australian health consumers;
(b) the impact of co-payments on:
(i) consumers' ability to access health care, and
(ii) health outcomes and costs;
(c) the effects of co-payments on other parts of the health system;
(d) the implications for the ongoing sustainability of the health system;
(e) key areas of expenditure, including pharmaceuticals, primary care visits, medical devices or supplies, and dental care;
(f) the role of private health insurance;
(g) the appropriateness and effectiveness of safety nets and other offsets;
(h) market drivers for costs in the Australian healthcare system; and
(i) any other related matter.1
1.2 On 17 June 2014, the Senate agreed to extend the reporting date to 8 August 2014.2 The reporting date was subsequently extended until 22 August 2014.
Conduct of the inquiry 1.3 The committee advertised the inquiry in The Australian and details of the inquiry were placed on the committee's website. The committee also wrote to approximately 85 individuals and organisations, inviting submissions by 12 May 2014. The formal submissions period was reopened following the 2014–15 Budget, to allow for the further lodgement of submissions by 26 June 2014. Submissions continued to be accepted up to the date of tabling. 1.4 The committee received 106 submissions from a diverse range of individuals and organisations. A list of the individuals and organisations that made public submissions to the inquiry, together with other information authorised for publication by the committee, is provided at Appendix 1.
1 Journals of the Senate, No. 25—26 March 2014, p. 725.
2 Journals of the Senate, No. 31—17 June 2014, p. 889.
2
1.5 Public hearings were held in Melbourne on 3 July 2014 and in Canberra on 29 July 2014. Transcripts of the hearing are available on the committee's website.3 A list of witnesses who gave evidence at the public hearings is provided at Appendix 2.
Acknowledgements 1.6 The committee thanks those organisations and individuals who made submissions and gave evidence at the public hearing.
Notes on references 1.7 References in this report are to individual submissions as received by the committee, not to a bound volume. References to the committee Hansard are to the proof Hansard. Page numbers may vary between the proof and the official Hansard transcript.
Structure of the report 1.8 The committee's report is structured as follows: • chapter 2 provides an overview of out-of-pocket expenditure in Australian
healthcare, including expenditure in different areas of health care; • chapter 3 discusses the impact of co-payments on individuals ability to access
healthcare and the impact of co-payments on health outcomes and costs. It also examines the impact of co-payments on other parts of the health system with particular reference to hospitals, pharmacies and bulk-billing. This chapter also discusses the appropriateness and effectiveness of safety nets and other offsets;
• chapter 4 covers the sustainability and costs drivers of the health system; • chapter 5 examines the role of private health insurance in primary health care.
This chapter also discusses the out-of-pocket costs incurred in the private health system and the issue of information disclosure; and
• chapter 6 presents the committee's conclusions and recommendations.
3 See http://www.aph.gov.au/Parliamentary_Business/Committees/Senate/Community_Affairs
Chapter 2 Out-of-pocket expenditure in Australian healthcare
Introduction 2.1 Health expenditure occurs when money is spent on health goods and services. It occurs at different levels of government, as well as by non-government entities such as private health insurers and individuals.1 2.2 This chapter discusses the following terms of reference:
(a) the current and future trends in out-of-pocket expenditure by Australian health consumers; and (e) key areas of expenditure, including pharmaceuticals, primary care visits, medical devices or supplies, and dental care.
2.3 Evidence provided to the committee discussed total out-of-pocket expenditure in healthcare as well as expenditure in particular areas of health care. This chapter will first discuss the evidence received related to overall expenditure in healthcare and then the evidence related to expenditure in different areas of healthcare.
What is out-of-pocket expenditure? 2.4 Individuals incur out-of-pocket expenditure when they meet the full cost of a health good or service as well as when they share the cost of goods and services with third-party payers such as governments or private health insurance funds.2 2.5 The following list of examples of out-of-pocket healthcare costs was provided by the National Rural Health Alliance in their submission: • the 'gap' between the fee for a doctor’s consultation and the amount rebated by
Medicare; • the 'gap' between the fee for a dental or allied health consultation and the
amount rebated by a private health insurance fund (for someone with private health insurance);
• the total cost of a dental or allied health consultation (for someone without private health insurance);
• the cost of prescription medicines to the consumer (after the subsidy for PBS-listed medicines has been applied);
• the total cost of 'over the counter' medicines, such as aspirin and cough syrup;
1 Australian Institute of Health and Welfare 2013. Health expenditure Australia 2011–12. Health and welfare expenditure series no. 50. Cat. no. HWE 59. Canberra: AIHW, p. 1.
2 Australian Institute of Health and Welfare 2013. Health expenditure Australia 2011–12. Health and welfare expenditure series no. 50. Cat. no. HWE 59. Canberra: AIHW, p. 117.
4
• the total cost of natural and complementary medicines, such as vitamins and nutritional supplements; and
• the net cost of medical devices (after any subsidies and rebates are applied), such as prostheses, dental devices, syringes and contraceptives.3
2.6 The Department of Health noted private health insurance premiums as another out-of-pocket cost incurred by individuals.4
Current out-of-pocket healthcare expenditure 2.7 The Australian Institute of Health and Welfare (AIHW) collects and analyses data about individual out-of-pocket expenditure in healthcare. When providing evidence to the committee, a large number of submitters and witnesses referenced AIHW data. 2.8 Total health expenditure in Australia in 2011–2012 was estimated to be $140.2 billion. Governments funded 69.7 per cent of total health expenditure which included 42.4 per cent from the Commonwealth Government and 27.3 per cent from state and territory governments. Non-government sources funded 30.3 per cent of the estimated $140.2 billion spent in 2011–12. 2.9 Funding by individuals accounted for 57.2 per cent of the estimated non-government funding of health goods and services in 2011–12. The contribution by individuals accounted for 17.3 per cent of the total health expenditure funding (government and non-government). This includes: • where individuals meet the full cost of goods and services—for example,
medications that are not subsidised by the PBS, health services not subject to a Medicare rebate;
• where individuals share the cost of health goods and services with third party payers—for example, Medicare, private health insurance funds.5
2.10 According to the Department of Health: Of the $140.2 billion spent on health care in Australia in 2011–12 ($6 230 per capita), a total of $24.3 billion was from out-of-pocket payments by individuals (adjusted for the Net Medical Expenses Tax Offset—NMETO). This is equivalent to $1 078 per capita ($1 102 before the NMETO). A further $11.2 billion ($496 per capita) was paid by private health insurers, and so indirectly by individuals.6
3 National Rural Health Alliance, Submission 54, p. 4 (citing: Out-of-pocket: Rethinking health copayments, Jennifer Doggett, Centre for Policy Development Occasional Paper Number 9, July 2009.).
4 Department of Health, Submission 101, p. 9.
5 Australian Institute of Health and Welfare 2013. Health expenditure Australia 2011–12. Health and welfare expenditure series no. 50. Cat. no. HWE 59. Canberra: AIHW, p. 41.
6 Department of Health, Submission 101, p. 6.

5
2.11 Data from the AIHW indicates that total individual out-of-pocket expenditure in 2011–12 ($24.3 billion) was more than double the $11 billion spent a decade earlier in 2001–02. With respect to the proportion of total health expenditure funded by individual out-of-pocket payments, in 2011–12 this was 17.3 per cent, relatively unchanged from 17.5 per cent in 2001–02 (see Table 2.1 below). 2.12 Further to this, the AIHW advised that the contribution of non-government funders of health to total expenditure reduced from 32.8 per cent in 2001–02 to 30.3 per cent in 2011–12. Government expenditure increased from 67.2 per cent in 2001–02 to 69.7 per cent in 2011–12.7 2.13 The committee notes that this data indicates that individual expenditure ($11 billion) accounted for 53 per cent of health expenditure from all non-government sources ($20.7 billion) in 2001–02. In 2011–12, individual expenditure ($24.3 billion) accounted for 57 per cent of health expenditure from all non-government sources ($42.4 billion). Table 2.1: Total individual health expenditure and proportion of health expenditure from all sources of funds
Year Amount ($m)
Proportion (%)
Year Amount ($m)
Proportion (%)
2001–02 11 050 17.5 2007–08 17 416 16.8
2002–03 11 514 16.7 2008–09 19 451 17.1
2003–04 12 828 17.5 2009–10 21 246 17.5
2004–05 14 131 17.4 2010–11 23 834 18.3
2005–06 15 108 17.4 2011–12 24 254 17.3
2006–07 16 553 17.4
Source: Australian Institute of Health and Welfare 2013. Health expenditure Australia 2011–12. Health and welfare expenditure series no. 50. Cat. no. HWE 59. Canberra: AIHW, p. 42.
2.14 The Department of Health also observed that the share of health expenses met by individual out-of-pocket payments remained relatively stable between 2001–02 and 2011–12.
… while the share of health expenses met by out-of-pocket payments clearly increased in the five years after 1986–87, from 13.6 per cent in 1986-87 to 16.5 per cent in 1991-92, and in the five years after 1995-96, it has remained relatively stable over the past decade.8
2.15 Further to this, the Department submitted:
7 Australian Institute of Health and Welfare, Submission 35, p. 3.
8 Department of Health, Submission 101, p. 7.
6
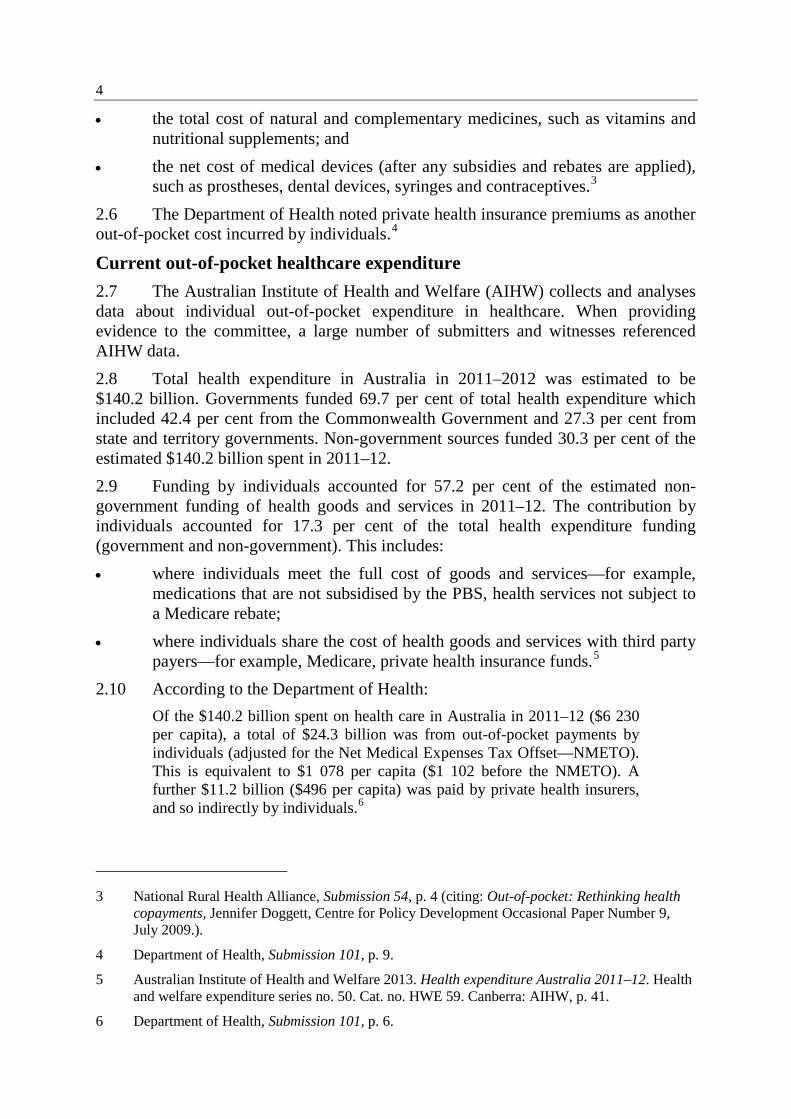
Overall health expenditure per capita and out-of-pocket expenditure on health per capita continue to grow at a faster rate than the broader economy, average incomes and overall household expenditure. Measured in current prices, overall health expenditure per capita and out-of-pocket expenditure on health per capita have grown by 91.4 per cent and 89.0 per cent respectively over the decade to 2011–12. That is, out-of-pocket expenditure on health per capita is currently growing at the same rate as total expenditure on health. Over the same period, GDP per capita grew by 69.7 per cent, average weekly earnings grew by 54.0 per cent and total household expenditure grew by an estimated 65.6 per cent in nominal terms.9
Figure 2.1: Share of health expenditure funded by out-of-pocket payments, 1986–87 to 2011–12.
Source: Department of Health, Submission 101, p. 7. (Departmental analysis of AIHW health expenditure data)
2.16 Several submitters and witnesses commented on the proportion of health expenditure contributed by individuals10, noting that there are a number of issues that need to be considered when analysing the proportion of individual health expenditure. 2.17 The committee heard evidence from the Consumers Health Forum of Australia (CHF) that 17.3 per cent out-of-pocket expenditure is contributed by individuals. It was explained that this percentage comprises areas of healthcare where
9 Department of Health, Submission 101, p. 7.
10 See for example, The Menzies Centre for Health Policy/The George Institute for Global Health, Submission 28, p. 2; National Rural Health Alliance, Submission 54, p. 4.
7
there are no (or limited) government subsidies including: some pharmaceutical spending, dental services, and aids and appliances. This suggests that there are some areas of health care where individual consumers are paying a large proportion—in some cases the entirety—of the cost.11
Growth in individual expenditure 2.18 Evidence to the committee stated that individual expenditure has risen in real terms whilst individual expenditure as a proportion of overall health expenditure has remained relatively stable. 2.19 According to the AIHW:
People are definitely paying more—that is, taking into account inflation and having adjusted for the medical expenses rebate—out of their pockets than they were in the past. It has been increasing as per person, so it is not just about population growth. Per person, we are also spending more. It has not been increasing as a proportion of total expenditure. So whilst growth has been strong, growth across the health sector has been strong.12
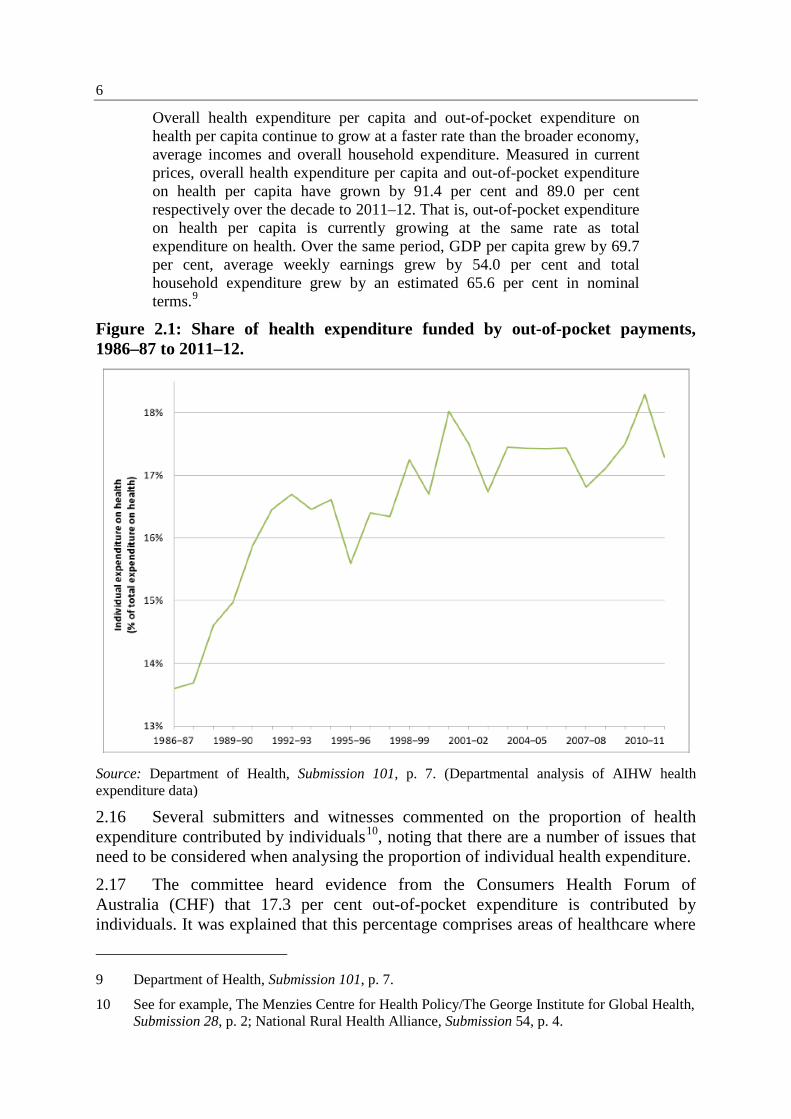
2.20 Dr Stephen Duckett, Director, Health Program, Grattan Institute observed that out-of-pocket costs are increasing because total health expenditure is increasing and there has been a real increase in out-of-pocket costs over the last five years.13 In particular, since 2007, the average out-of-pocket payments for Medicare services have risen by a quarter in real terms. Out-of-pocket costs have increased in all but three categories14 (see Figure 2.2).
Figure 2.2: Real increase in out-of-pocket costs, 2007-2013
Source: Grattan Institute, Submission 79, p. 4.
11 Ms Priyanka Rai, Committee Hansard, 29 July 2014, pp 5–6.
12 Dr Adrian Webster, Committee Hansard, 29 July 2014, p. 43.
13 Dr Stephen Duckett, Committee Hansard, 29 July 2014, p. 33.
14 Grattan Institute, Submission 79, p. 4
8
2.21 Submitters observed that individuals are carrying an increasing burden of out-of-pocket costs for health care in a variety of areas, including GP visits, medications, pathology and imaging, dental services, hospital services.15 2.22 Data from the AIHW indicates that per person health expenditure by individuals (that is averaged over the whole population) grew at an average of 5.2 per cent per year from 2001–02 to 2011–12. The areas of expenditure with the highest per person growth rates in 2011–12 included benefit-paid pharmaceuticals (4.2 per cent) and dental services (2.2 per cent). The areas with negative growth included community and public health services (–18.8 per cent), patient transport services (–7.4 per cent) and hospital services (–5.9 per cent).16 Household expenditure on out-of-pocket health costs 2.23 Another measure of health expenditure analysed by the AIHW is the household final consumption expenditure which measures household expenditure as opposed to income. There has been an increase from approximately 2.7 per cent to 3.2 per cent over the last 10 years in the proportion of household expenditure being spent on out-of-pocket healthcare costs. 2.24 The AIHW advised that this data is not currently compared against proportion of household income.17 2.25 The Department of Health submitted details from the 2009–10 ABS Household Expenditure Survey which showed that weekly expenditure on 'medical care and health expenses' (including the cost of private health insurance) was $65.60 for the average Australian household, making up 5.3 per cent of total household expenditure. The Department observed that components of household expenditure have grown at different rates over time, sometimes decreasing in real terms. The fastest growing direct health costs for households are for the category that includes non-prescription medicines, pharmaceutical products and therapeutic appliances.18 International comparisons 2.26 Several submitters and witnesses discussed Australia's out-of-pocket costs in comparison to a range of international jurisdictions. It was noted that out-of-pocket expenditure for Australian health consumers is high by international standards.19 2.27 Data from the AIHW indicates that in 2000, Australia's average out-of-pocket expenditure per person using OECD criteria ($583) was $35 above the weighted OECD average ($548). In 2010, Australia's average out-of-pocket expenditure per person ($1 075) was $94 above the weighted OECD average ($981).
15 See for example, The Australia Institute, Submission 1.
16 Australian Institute of Health and Welfare 2013. Health expenditure Australia 2011–12. Health and welfare expenditure series no. 50. Cat. no. HWE 59. Canberra: AIHW, p. 45.
17 Dr Adrian Webster, Committee Hansard, 29 July 2014, p. 45.
18 Department of Health, Submission 101, p. 12.
19 See for example, Australian Council of Social Service, Submission 61, p. 6.
9
2.28 The AIHW also noted that out-of-pocket expenditure fell as a proportion of total health expenditure, accounting for 19.8 per cent of total health expenditure in 2000 and 19.3 per cent in 201020. However, out-of-pocket expenditure increased as a percentage of total household final consumption expenditure in Australia, from 2.7 per cent in 2000 to 3.2 per cent in 2010. The OECD weighted averages against these measures were 16.3 per cent in 2000 and 13.9 per cent in 2010, and 2.7 in 2010 and 2.9 per cent in 2010 respectively.21 2.29 Several submitters and witnesses discussed Australia's out-of-pocket costs in the context of comparisons against OECD data. 2.30 Professor Stephen Jan, The George Institute for Global Health, told the committee that the level of out-of-pocket costs in Australia, when compared with the OECD average, is third only to the US and Switzerland. 2.31 The committee inquired into the underlying reasons for this ranking and were advised by Professor Jan:
In general terms, it is the level of co-payments that we pay for Medicare reimbursed services and also the fact that we have a significant number of medical expenses that are not covered by Medicare or through the hospital system that people have to incur out of pocket. One example might be home oxygen for people. The coverage for that varies for chronic obstructive pulmonary disease, and we found that to be a significant burden for a particular patient population. There are a number of allied healthcare services that often are not covered under Medicare or through the hospital system that people have to pay for out of pocket. Those are really the two areas. It is gap payments or co-payments and also the services that are not covered.22
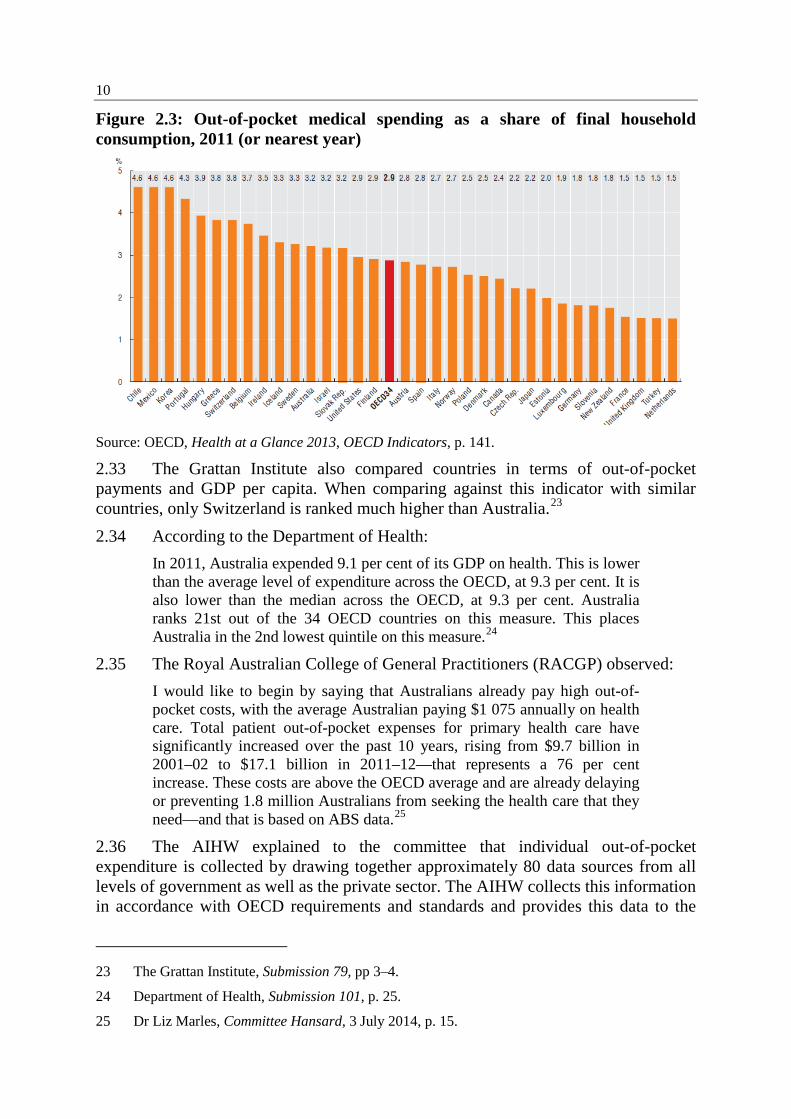
2.32 The Grattan Institute submitted that Australia is ranked in the middle of the OECD for the proportion of health costs paid for with out-of-pocket fees. It was also noted that the amount Australians pay as a proportion of their household expenditure is relatively high (see Figure 2.3).
20 The proportion of out-of-pocket expenditure noted here differs from other AIHW data provided in Table 2.1 due to different methodology being used to compile information for the OECD.
21 Australian Institute of Health and Welfare, Submission 35, p. 5.
22 Professor Stephen Jan, Committee Hansard, 3 July 2014, p. 4.
10
Figure 2.3: Out-of-pocket medical spending as a share of final household consumption, 2011 (or nearest year)
Source: OECD, Health at a Glance 2013, OECD Indicators, p. 141. 2.33 The Grattan Institute also compared countries in terms of out-of-pocket payments and GDP per capita. When comparing against this indicator with similar countries, only Switzerland is ranked much higher than Australia.23 2.34 According to the Department of Health:
In 2011, Australia expended 9.1 per cent of its GDP on health. This is lower than the average level of expenditure across the OECD, at 9.3 per cent. It is also lower than the median across the OECD, at 9.3 per cent. Australia ranks 21st out of the 34 OECD countries on this measure. This places Australia in the 2nd lowest quintile on this measure.24
2.35 The Royal Australian College of General Practitioners (RACGP) observed: I would like to begin by saying that Australians already pay high out-of-pocket costs, with the average Australian paying $1 075 annually on health care. Total patient out-of-pocket expenses for primary health care have significantly increased over the past 10 years, rising from $9.7 billion in 2001–02 to $17.1 billion in 2011–12—that represents a 76 per cent increase. These costs are above the OECD average and are already delaying or preventing 1.8 million Australians from seeking the health care that they need—and that is based on ABS data.25
2.36 The AIHW explained to the committee that individual out-of-pocket expenditure is collected by drawing together approximately 80 data sources from all levels of government as well as the private sector. The AIHW collects this information in accordance with OECD requirements and standards and provides this data to the
23 The Grattan Institute, Submission 79, pp 3–4.
24 Department of Health, Submission 101, p. 25.
25 Dr Liz Marles, Committee Hansard, 3 July 2014, p. 15.
11
OECD and the World Health Organisation annually. The AIHW noted that there are many OECD countries that are not able to estimate out-of-pocket expenditure.26 The AIHW added:
They [the OECD] try to pull together the expenditure information and, by and large, they look at that at a high level and they try to produce country rankings to give people a sense of where they sit in the overall expenditure. As to whether we are fifth or 10th or 15th, it is a bit hard to tell but we are probably not 30th and we are probably not first. They take that information and look at health outcomes information. Obviously, the OECD reports have a wide range of information—not just about expenditure but also about all the key indicators of health. As Dr Duckett and others have mentioned, we are known for a system that is relatively efficient. In terms of the dollars spent for the health outcomes achieved, we do well.
… That is an international comparison. That judgement about relative efficiency is comparing us to other nations that perhaps spend a similar quantum of dollars but do not achieve the same health outcomes.27
2.37 Officials from the Department of Health cautioned against drawing comparisons between Australia and other OECD countries:
A number of submissions have highlighted the absolute value of out-of-pockets as evidence of an issue across the system. The trend over the last couple of years for out-of-pockets as a percentage of total health expenditure is down. It peaked at 19 per cent some years ago; it was 18.3 per cent in 2010–11; and in 2011–12 it was 17.3 per cent. It is lower than the OECD average, and Australia ranks 15 out of 34 of OECD countries for out-of-pockets as a percentage of health expenditure. The absolute dollars in many ways are an indication of the wealth of a society, rather than the appropriateness or inappropriateness of the level of out-of-pockets being charged. The extent to which out-of-pockets are discretionary is highlighted when an analysis of the out-of-pocket data is undertaken. The largest and fastest-growing area is non-prescription medicines, including complementary medicines. They are nearly one third of the total out-of-pocket costs. Medical services are about 12 per cent, and prescription pharmaceuticals are less than seven per cent of the total.28
Key areas of expenditure 2.38 Australian consumers spend money on healthcare in a number of different areas. In 2011–12, the AIHW estimates that individuals spent $24.8 billion29 in recurrent funding for health goods and services. Over one-third (39.2 per cent) of this
26 Dr Adrian Webster, Committee Hansard, 29 July 2014, pp 42–43.
27 Dr Adrian Webster, Committee Hansard, 29 July 2014, p. 44.
28 Mr Richard Bartlett, Committee Hansard, 3 July 2014, p. 63.
29 This AIHW figure of $24.8 billion quoted here is higher than the figure of $24.3 billion provided in paragraph 2.11. The $24.8 billion reflects the gross expenditure by individual and the $24.3 billion accounts for rebates such as from private health insurers.
12
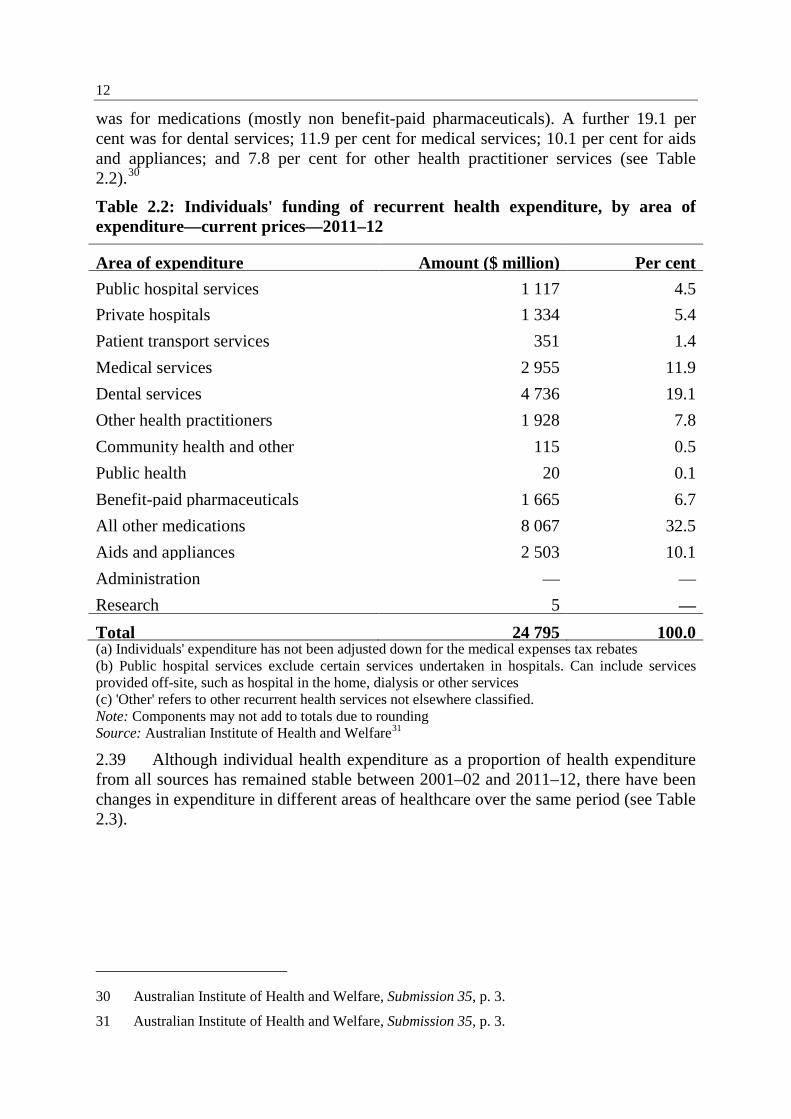
was for medications (mostly non benefit-paid pharmaceuticals). A further 19.1 per cent was for dental services; 11.9 per cent for medical services; 10.1 per cent for aids and appliances; and 7.8 per cent for other health practitioner services (see Table 2.2).30
Table 2.2: Individuals' funding of recurrent health expenditure, by area of expenditure—current prices—2011–12
Area of expenditure Amount ($ million) Per cent Public hospital services 1 117 4.5 Private hospitals 1 334 5.4 Patient transport services 351 1.4 Medical services 2 955 11.9 Dental services 4 736 19.1 Other health practitioners 1 928 7.8 Community health and other 115 0.5 Public health 20 0.1 Benefit-paid pharmaceuticals 1 665 6.7 All other medications 8 067 32.5 Aids and appliances 2 503 10.1 Administration — — Research 5 — Total 24 795 100.0 (a) Individuals' expenditure has not been adjusted down for the medical expenses tax rebates (b) Public hospital services exclude certain services undertaken in hospitals. Can include services provided off-site, such as hospital in the home, dialysis or other services (c) 'Other' refers to other recurrent health services not elsewhere classified. Note: Components may not add to totals due to rounding Source: Australian Institute of Health and Welfare31
2.39 Although individual health expenditure as a proportion of health expenditure from all sources has remained stable between 2001–02 and 2011–12, there have been changes in expenditure in different areas of healthcare over the same period (see Table 2.3).
30 Australian Institute of Health and Welfare, Submission 35, p. 3.
31 Australian Institute of Health and Welfare, Submission 35, p. 3.
13
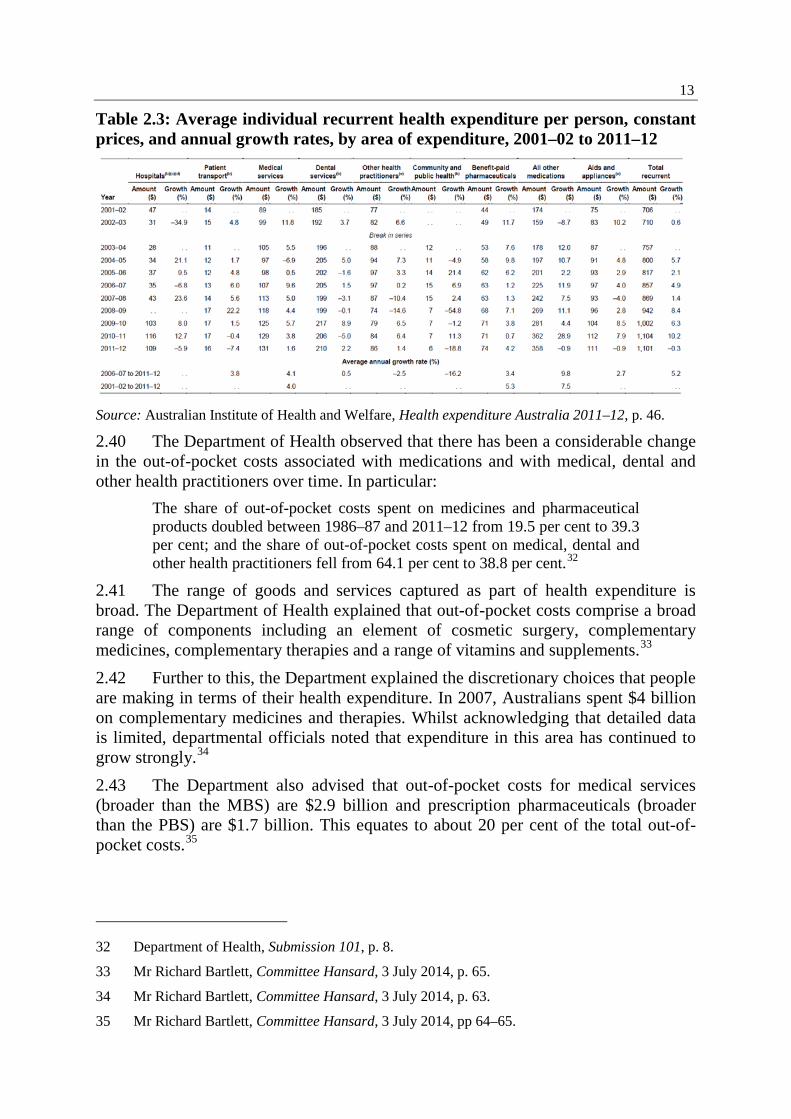
Table 2.3: Average individual recurrent health expenditure per person, constant prices, and annual growth rates, by area of expenditure, 2001–02 to 2011–12
Source: Australian Institute of Health and Welfare, Health expenditure Australia 2011–12, p. 46.
2.40 The Department of Health observed that there has been a considerable change in the out-of-pocket costs associated with medications and with medical, dental and other health practitioners over time. In particular:
The share of out-of-pocket costs spent on medicines and pharmaceutical products doubled between 1986–87 and 2011–12 from 19.5 per cent to 39.3 per cent; and the share of out-of-pocket costs spent on medical, dental and other health practitioners fell from 64.1 per cent to 38.8 per cent.32
2.41 The range of goods and services captured as part of health expenditure is broad. The Department of Health explained that out-of-pocket costs comprise a broad range of components including an element of cosmetic surgery, complementary medicines, complementary therapies and a range of vitamins and supplements.33 2.42 Further to this, the Department explained the discretionary choices that people are making in terms of their health expenditure. In 2007, Australians spent $4 billion on complementary medicines and therapies. Whilst acknowledging that detailed data is limited, departmental officials noted that expenditure in this area has continued to grow strongly.34 2.43 The Department also advised that out-of-pocket costs for medical services (broader than the MBS) are $2.9 billion and prescription pharmaceuticals (broader than the PBS) are $1.7 billion. This equates to about 20 per cent of the total out-of-pocket costs.35
32 Department of Health, Submission 101, p. 8.
33 Mr Richard Bartlett, Committee Hansard, 3 July 2014, p. 65.
34 Mr Richard Bartlett, Committee Hansard, 3 July 2014, p. 63.
35 Mr Richard Bartlett, Committee Hansard, 3 July 2014, pp 64–65.
14
2.44 Mr Gordon Gregory, Executive Director, National Rural Health Alliance described an alternate model for consideration of the different areas of health expenditure:
We ask you to conceive of three concentric circles: the centre one has the out-of-pocket costs for seeing a GP; next, what might be called the rest of the standard out-of-pocket health care costs; and, on the outside, the actual total out-of-pocket health care costs for rural and remote people, which includes the cost of transport to and from services. All three of these are relevant, but evidence about the middle circle is not available by remoteness and the importance of the outside circle—that is transport and accommodation—is obvious but not easily quantified.36
2.45 The next section summarises the evidence received by the committee in the following areas of health expenditure: • pharmaceuticals and other medications, such as over-the-counter medications
that do not require a prescription; • medical services; • specialist services; • medical devices and supplies; • dental care; • health related travel costs. Medical services 2.46 In 2011–12 Australians spent $2.955 billion on medical services, comprising 11.9 per cent of total healthcare expenditure.37 Medical services in this category include GP visits, pathology and imaging services. 2.47 The committee heard evidence that in 2012–13, 81.1 per cent of GP consultations were bulk billed and 88.7 per cent of private in-hospital medical services were charged at the private health insurance benefit (i.e. no out-of-pocket costs). 2.48 The committee notes that there is some variability across regions in terms of GP bulk billing rates. 2.49 The Australian Medical Association (AMA) submitted:
In the decade to 2012–13, the percentage of medical services attracting out of pocket costs has either stayed the same or declined. The medical profession has effectively absorbed the relative reductions in Government and PHI contributions to the cost of medical services. However, patients
36 Mr Gordon Gregory, Committee Hansard, 3 July 2014, p. 23.
37 Medical services includes services provided by, or on behalf of, registered medical practitioners that are funded by the MBS. Most medical services are provided on a fee-for service basis and attracts benefits from the Australian Government under Medicare. Full definition of medical services available: Australian Institute of Health and Welfare, Health expenditure Australia 2011–12, p. 118.
15
who do have out of pocket costs for medical services are paying more today than they were a decade ago. These services partly offset the services provided at no cost.38
2.50 Furthermore, the AMA observed that contrary to common perceptions, medical services do not make up the majority of out-of-pocket costs for individuals, accounting for 11.9 per cent of the total of individuals' out-of-pocket costs.39 2.51 The committee was reminded that the figure of 81 per cent of bulk-billed GP consultations relates to each individual item number that is bulk-billed. The provision of this information at item number level does not allow for analysis of the number of individuals that are bulk-billed, the frequency of bulk-billing and the location.40 2.52 Evidence received from Catholic Health Australia indicated that the average out-of-pocket cost for a GP visit is now $28, which represents a 50 per cent increase in five years.41 2.53 The AMA advised that the average out-of-pocket cost for a GP visit was $28.58 in 2012–13 compared to $12.46 in 2002–03, reflecting an 11.8 per cent growth per annum.42 2.54 COTA Australia provided evidence about the average out-of-pocket cost for a visit to non-bulk-billing doctors, noting that the average was $46.50 in 2012.43 2.55 During the 2014–15 Budget Estimates, the Department of Health advised that in 2012–13, total expenditure on out-of-hospital pathology was $2.14 billion, 98.5 per cent paid by government and 1.5 per cent paid by patients.44 2.56 The Australian Diagnostic Imaging Association submitted that out-of-pocket costs for non-bulk billed services are growing at rates significantly higher than inflation, and averaged $88 in 2012–13 ($158 for MRI), with patients contributing $475 million to their cost of their care. The growth in gaps was 9.8 per cent in 2010–11, 7.0 per cent in 2011–12 and 4.7 per cent in 2012–13.45
Pharmaceuticals and other medications 2.57 Data from the AIHW indicates that Australians spent approximately $9.7 billion on medications in 2011–12 which is approximately 39 per cent of total expenditure. The table below shows the breakdown between benefit-paid pharmaceuticals and all other medications.
38 Australian Medical Association, Submission 72, p. 2.
39 Australian Medical Association, Submission 72, p. 3.
40 Mr Andrew McAuliffe, Committee Hansard, 29 July 2014, p. 11.
41 Catholic Health Australia, Submission 63, p. 4.
42 Australian Medical Association, Submission 72, p. 2.
43 COTA Australia, Submission 62, p. 3.
44 Mr Richard Bartlett, Estimates Hansard, 2 June 2014, p. 61.
45 Australian Diagnostic Imaging Association, Submission 45, p. 7.
16
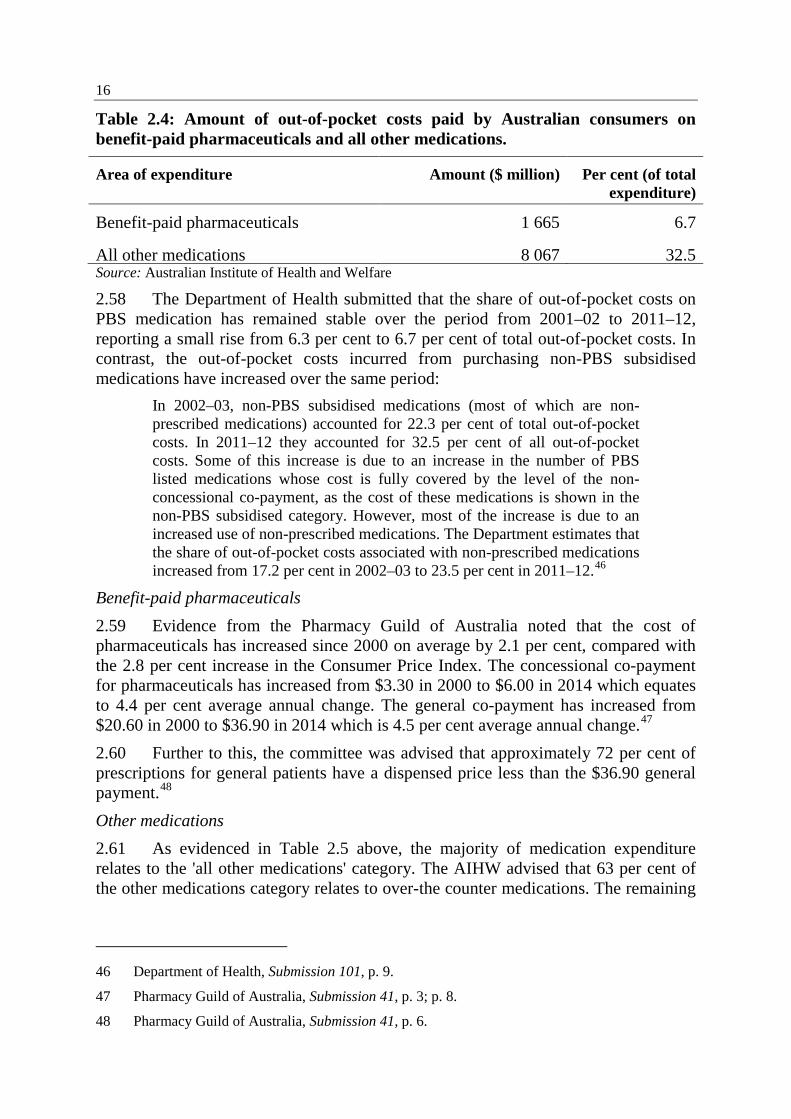
Table 2.4: Amount of out-of-pocket costs paid by Australian consumers on benefit-paid pharmaceuticals and all other medications.
Area of expenditure Amount ($ million) Per cent (of total expenditure)
Benefit-paid pharmaceuticals 1 665 6.7
All other medications 8 067 32.5 Source: Australian Institute of Health and Welfare
2.58 The Department of Health submitted that the share of out-of-pocket costs on PBS medication has remained stable over the period from 2001–02 to 2011–12, reporting a small rise from 6.3 per cent to 6.7 per cent of total out-of-pocket costs. In contrast, the out-of-pocket costs incurred from purchasing non-PBS subsidised medications have increased over the same period:
In 2002–03, non-PBS subsidised medications (most of which are non-prescribed medications) accounted for 22.3 per cent of total out-of-pocket costs. In 2011–12 they accounted for 32.5 per cent of all out-of-pocket costs. Some of this increase is due to an increase in the number of PBS listed medications whose cost is fully covered by the level of the non-concessional co-payment, as the cost of these medications is shown in the non-PBS subsidised category. However, most of the increase is due to an increased use of non-prescribed medications. The Department estimates that the share of out-of-pocket costs associated with non-prescribed medications increased from 17.2 per cent in 2002–03 to 23.5 per cent in 2011–12.46
Benefit-paid pharmaceuticals 2.59 Evidence from the Pharmacy Guild of Australia noted that the cost of pharmaceuticals has increased since 2000 on average by 2.1 per cent, compared with the 2.8 per cent increase in the Consumer Price Index. The concessional co-payment for pharmaceuticals has increased from $3.30 in 2000 to $6.00 in 2014 which equates to 4.4 per cent average annual change. The general co-payment has increased from $20.60 in 2000 to $36.90 in 2014 which is 4.5 per cent average annual change.47 2.60 Further to this, the committee was advised that approximately 72 per cent of prescriptions for general patients have a dispensed price less than the $36.90 general payment.48 Other medications 2.61 As evidenced in Table 2.5 above, the majority of medication expenditure relates to the 'all other medications' category. The AIHW advised that 63 per cent of the other medications category relates to over-the counter medications. The remaining
46 Department of Health, Submission 101, p. 9.
47 Pharmacy Guild of Australia, Submission 41, p. 3; p. 8.
48 Pharmacy Guild of Australia, Submission 41, p. 6.
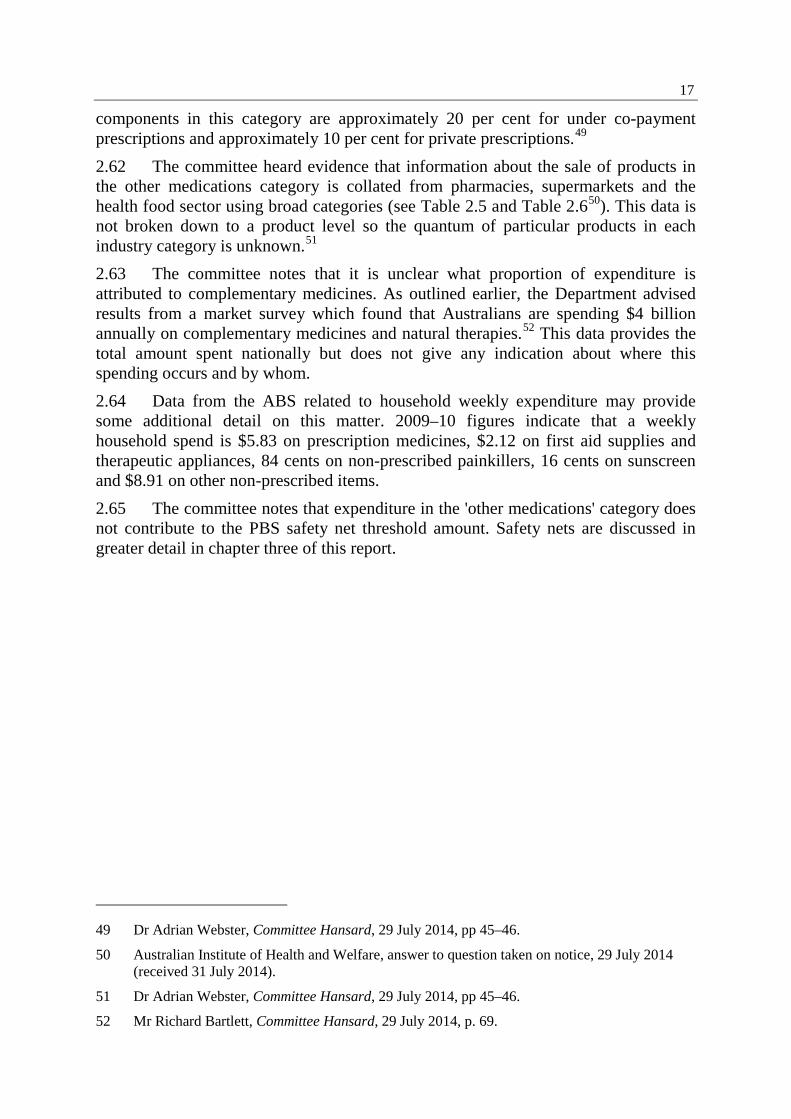
17
components in this category are approximately 20 per cent for under co-payment prescriptions and approximately 10 per cent for private prescriptions.49 2.62 The committee heard evidence that information about the sale of products in the other medications category is collated from pharmacies, supermarkets and the health food sector using broad categories (see Table 2.5 and Table 2.650). This data is not broken down to a product level so the quantum of particular products in each industry category is unknown.51 2.63 The committee notes that it is unclear what proportion of expenditure is attributed to complementary medicines. As outlined earlier, the Department advised results from a market survey which found that Australians are spending $4 billion annually on complementary medicines and natural therapies.52 This data provides the total amount spent nationally but does not give any indication about where this spending occurs and by whom. 2.64 Data from the ABS related to household weekly expenditure may provide some additional detail on this matter. 2009–10 figures indicate that a weekly household spend is $5.83 on prescription medicines, $2.12 on first aid supplies and therapeutic appliances, 84 cents on non-prescribed painkillers, 16 cents on sunscreen and $8.91 on other non-prescribed items. 2.65 The committee notes that expenditure in the 'other medications' category does not contribute to the PBS safety net threshold amount. Safety nets are discussed in greater detail in chapter three of this report.
49 Dr Adrian Webster, Committee Hansard, 29 July 2014, pp 45–46.
50 Australian Institute of Health and Welfare, answer to question taken on notice, 29 July 2014 (received 31 July 2014).
51 Dr Adrian Webster, Committee Hansard, 29 July 2014, pp 45–46.
52 Mr Richard Bartlett, Committee Hansard, 29 July 2014, p. 69.
18
Table 2.5: Categories that AIHW uses to compile expenditure on over-the-counter pharmaceuticals purchased from supermarkets Sunscreen and after sun care
Cotton e.g. cotton wool, cotton balls, cotton buds/tips
Throat care
Adult incontinence Dietary supplements Wound care Allergy care Laxatives Nappy rash treatment Analgesics Anti-diarrhoeal Footcare Antacids Fluid replacement Anti-dandruff hair care Antiseptics Rheumatic rubs Toothbrushes and toothpaste Cold relief Sinus remedy Medical non-durables (i.e. family
planning) Cold sore care Smoking control Facial treatment and cleansers Source: Retail World Annual Reports53
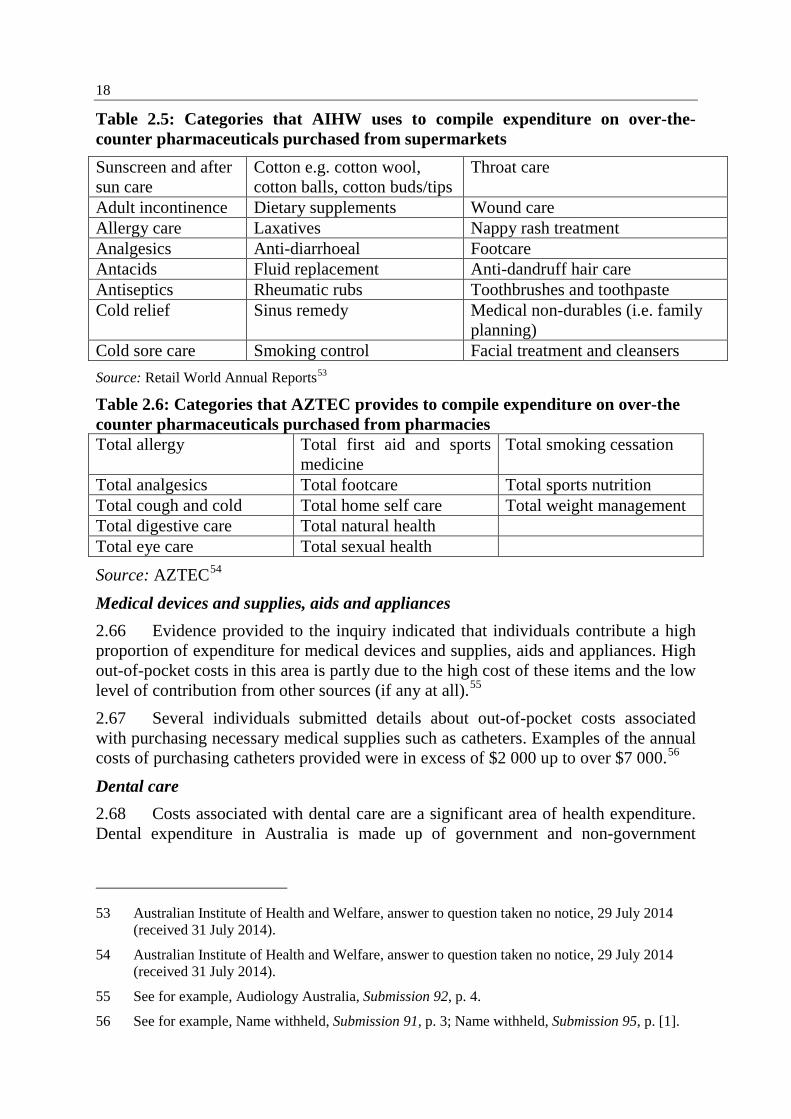
Table 2.6: Categories that AZTEC provides to compile expenditure on over-the counter pharmaceuticals purchased from pharmacies Total allergy Total first aid and sports
medicine Total smoking cessation
Total analgesics Total footcare Total sports nutrition Total cough and cold Total home self care Total weight management Total digestive care Total natural health Total eye care Total sexual health
Source: AZTEC54 Medical devices and supplies, aids and appliances 2.66 Evidence provided to the inquiry indicated that individuals contribute a high proportion of expenditure for medical devices and supplies, aids and appliances. High out-of-pocket costs in this area is partly due to the high cost of these items and the low level of contribution from other sources (if any at all).55 2.67 Several individuals submitted details about out-of-pocket costs associated with purchasing necessary medical supplies such as catheters. Examples of the annual costs of purchasing catheters provided were in excess of $2 000 up to over $7 000.56
Dental care 2.68 Costs associated with dental care are a significant area of health expenditure. Dental expenditure in Australia is made up of government and non-government
53 Australian Institute of Health and Welfare, answer to question taken no notice, 29 July 2014 (received 31 July 2014).
54 Australian Institute of Health and Welfare, answer to question taken no notice, 29 July 2014 (received 31 July 2014).
55 See for example, Audiology Australia, Submission 92, p. 4.
56 See for example, Name withheld, Submission 91, p. 3; Name withheld, Submission 95, p. [1].
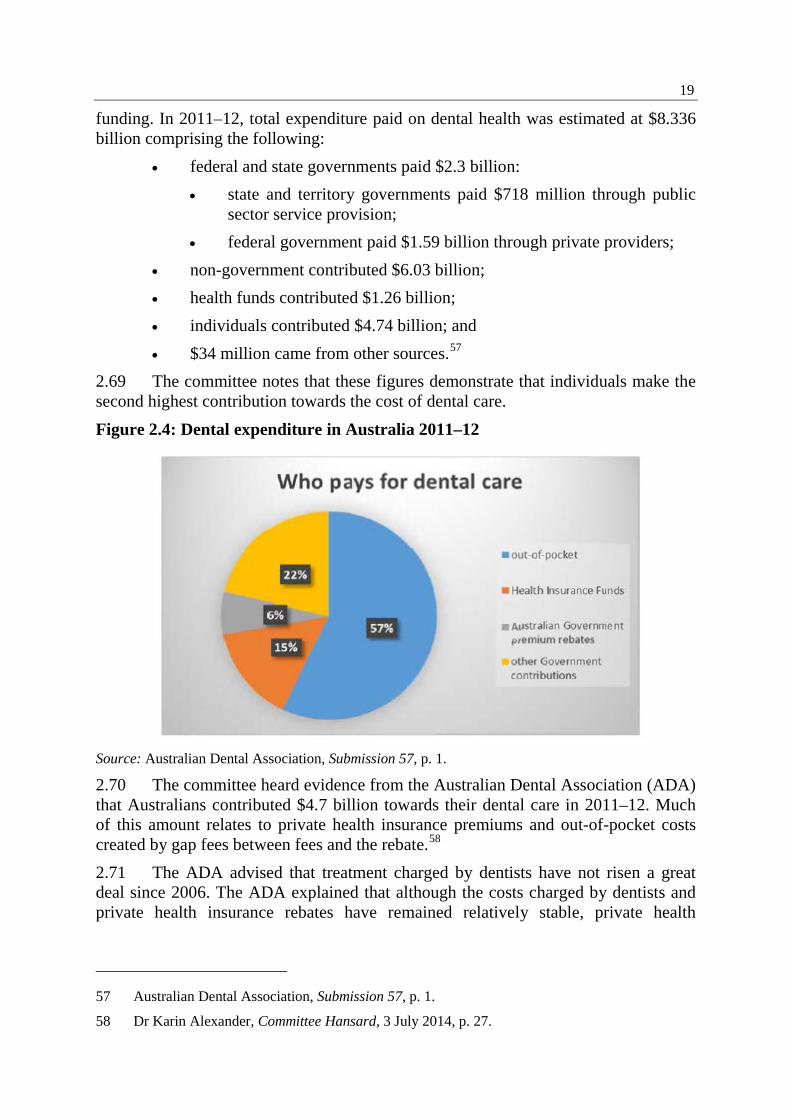
19
funding. In 2011–12, total expenditure paid on dental health was estimated at $8.336 billion comprising the following:
• federal and state governments paid $2.3 billion: • state and territory governments paid $718 million through public
sector service provision; • federal government paid $1.59 billion through private providers;
• non-government contributed $6.03 billion; • health funds contributed $1.26 billion; • individuals contributed $4.74 billion; and • $34 million came from other sources.57
2.69 The committee notes that these figures demonstrate that individuals make the second highest contribution towards the cost of dental care. Figure 2.4: Dental expenditure in Australia 2011–12
Source: Australian Dental Association, Submission 57, p. 1.
2.70 The committee heard evidence from the Australian Dental Association (ADA) that Australians contributed $4.7 billion towards their dental care in 2011–12. Much of this amount relates to private health insurance premiums and out-of-pocket costs created by gap fees between fees and the rebate.58 2.71 The ADA advised that treatment charged by dentists have not risen a great deal since 2006. The ADA explained that although the costs charged by dentists and private health insurance rebates have remained relatively stable, private health
57 Australian Dental Association, Submission 57, p. 1.
58 Dr Karin Alexander, Committee Hansard, 3 July 2014, p. 27.
20
insurance premiums have increased. Increased premiums contribute to the increased out-of-pocket costs for individuals. 2.72 The Australian Healthcare & Hospitals Association highlighted that out-of-pocket costs for dental services were the same as the costs for medical services, public hospital and private hospital care combined.59 Health related and other travel costs 2.73 Health related travel costs are not accounted for when health expenditure data is collected. The Department of Health confirmed:
As soon as they are subsidised they are captured but—you are right—a huge proportion will not be subsidised and will not be captured, just as those sorts of costs are not captured for a whole range of other things.60
2.74 Evidence provided to the committee indicated that health related travel costs contribute significantly to individuals' out-of-pocket costs. These costs include direct travel costs (flights, train or bus, fuel), accommodation as well as costs associated with loss of income due to inability to work and the cost of care arrangements for other family members.61 Submitters emphasised that travel costs may act as a barrier to accessing required health services.62 2.75 Parkinson's Victoria explained that transport assistance schemes are means tested and often limited to concession card holders. This places a significant cost burden for individuals without healthcare cards who need to travel to health services. Even when financial assistance is available, benefits are only payable if the journey exceeds 100 kilometres.63 2.76 The cost of travelling to access healthcare is particularly significant for regional and remote communities. Mr Gregory explained to the committee:
The standard measurement of out-of-pocket health care cost does not include the cost of transport to services, which due to the distances to be covered and the lack of public transport are much higher for rural people for every occasion of service. These transport costs—including accommodation, income forgone and logistical complexities—often dwarf standard out-of-pocket costs for families in more remote areas. The jurisdictional patient travel and accommodation schemes are poorly understood, poorly promoted and not sufficient to cover the real costs involved in travelling to and staying in major cities.64
59 Australian Healthcare & Hospitals Association, Submission 43, p. 1.
60 Mr Bartlett, Committee Hansard, 3 July 2014, p. 66.
61 See for example, Services for Australian Rural and Remote Allied Health, Submission 34, p. 3; Associate Professor Pam McGrath, Submission 104.
62 See for example, Audiology Australia, Submission 92, p. 5.
63 Parkinson's Victoria, Submission 30, p. 3.
64 Mr Gordon Gregory, Committee Hansard, 3 July 2014, p. 23.
21
2.77 Further to this, Mr Gregory advised that 'there is almost nothing that pops up on our radar here at the Rural Health Alliance more regularly, than patients' travel and accommodation—it is still a major issue'.65 2.78 Dr Christine Walker, Executive Officer, Chronic Illness Alliance provided evidence about the impact of the high cost of hospital parking:
We had a dreadful example—somebody whose child was a transplant patient who eventually died at one of Sydney's major hospitals. They did not think about the cost of parking. After the child had died, they worked it out and they reckoned they had spent something like $6 000 on parking their car at the hospital.66
Specialist services 2.79 Professor Jan advised that when looking at the level of out-of-pocket costs in the health system, the majority of the costs incurred relate to specialist services. In contrast to the approximately 80 per cent of bulk-billed GP services, only a very low percentage of specialist services are bulk billed.67 2.80 Evidence provided to the inquiry suggested that a large volume of expenses incurred by individuals using the health system relate to services provided by specialists.68 2.81 The Australian Healthcare & Hospitals Association provided evidence that in the 2012 December quarter, medical specialist fees for in-hospital services totalled $254 million, with Medicare covering $67 million and private health insurance contributing $47 million. Patients incurred out-of-pocket costs of $140 million.69 2.82 Evidence provided by the Australian Society of Anaesthetists (ASA) suggests out-of-pocket expenses for anaesthesia services is significantly less that than of other specialists.70 2.83 Further to this, the ASA noted:
…approximately 3.5 million to 3.7 million anaesthetics are given in Australia each year, and more than 90 per cent of all anaesthesia services are provided at no out-of-pocket cost to the patient. In the private sector, more than 85 per cent are provided at no out-of-pocket cost to the patient. The primary reason for any out-of-pocket expenses has essentially been the lack of adequate indexation over the last 30 years and also, in anaesthesia specifically, the level of rebates have been significantly lower when compared to other craft groups. For example, anaesthesia rebates represent
65 Mr Gordon Gregory, Committee Hansard, 3 July 2014, p. 25
66 Dr Christine Walker, Committee Hansard, 3 July 2014, p. 48.
67 Professor Stephen Jan, Committee Hansard, 3 July 2014, p. 4.
68 See for example, Professor Peter Brooks, Committee Hansard, 3 July 2014, p. 8.
69 Australian Healthcare and Hospitals Association, Submission 43, p. 1.
70 Dr Mark Sinclair, Committee Hansard, 3 July 2014, p. 18.
22
about 40 to 45 per cent of the AMA recommended fee, whereas for other surgical specialties that is up to 60 to 65 per cent and even up to 70 per cent, varying on different specialties.71
2.84 The ASA explained that out-of-pocket costs for anaesthesia relate to private services. There are approximately 2.1 million anaesthesia services provided in the private sector annually and approximately one in six of these patients will incur out-of-pocket costs. The ASA advised the committee that ‘over the past 30 years the issue of out-of-pocket expenses for anaesthesia and for health services in general have arisen because of the failure of indexation’.72 2.85 The committee notes that out-of-pocket costs incurred for private anaesthesia services are in addition to private health insurance premiums.
Private health insurance 2.86 Individual expenditure associated with private health insurance is a combination of insurance premiums and out-of-pocket costs to cover treatment costs not paid by Medicare or the private health insurer. The committee heard evidence that gap payments may vary significantly across private health insurers. 2.87 The Department of Health submitted that one third of household expenditure in 2009–10 on medical care and health expenses was associated with the cost of private health insurance.73 2.88 According to data provided by the Private Health Insurance Administration Council (PHIAC) in The Operations of Private Health Insurers Annual Report 2012-13, during 2012–13 the funding of privately insured services totalled $22.402 billion and comprised the following components: • benefits provided by private health insurance of $15.303 billion (68.3 per
cent); • benefits provided by Medicare of $2.376 billion (10.6 per cent); and • payments by patients of $4.722 billion (21.1 per cent).74 2.89 The Australian Healthcare Reform Alliance submitted:
PHIAC quarterly statistics for June 2013 show that the average co-payment for one episode of hospital treatment was $307 and for non-hospital services it was $47. Due to their higher average level of need, older people incur higher out-of-pocket payments than younger people using private health services.75
71 Dr Richard Grutzner, Committee Hansard, 3 July 2014, p. 16.
72 Dr Mark Sinclair, Committee Hansard, 3 July 2014, p. 17.
73 Department of Health, Submission 101, p. 9.
74 Private Health Insurance Administration Council, The Operations of Private Health Insurers Annual Report 2012-13, p. 8.
75 Australian Healthcare Reform Alliance, Submission 80, [pp 4–5].
23
2.90 Bupa Australia observed two recent issues that have affected the out-of-pocket costs for individuals with private health insurance: (1) changes to the government private health insurance rebate and (2) contract arrangements between private health insurers and hospitals.76 2.91 Issues relating to private health insurance are discussed in more detail in chapter five of this report.
Other areas of expenditure 2.92 The committee received evidence outlining other areas of out-of-pocket expenditure. The Australian Wound Management Association referred to a study undertaken in 2012 that reported a median of $142 a month for dressing products over an average duration of 22 weeks with a total expense as high as $10 400.77 2.93 Optometrists Association Australia submitted that prescription glasses and contact lenses do not qualify for a Medicare rebate, although a portion of the cost is covered under some private health insurance policies. This means that the out-of-pocket costs can be a barrier to accessing essential primary eye care, particularly those on low incomes and without private health insurance.78
Committee view 2.94 The Australian community incurs out-of-pocket costs in healthcare in a number of different areas. Individual expenditure as a proportion of overall expenditure on healthcare has remained relatively stable since 2001–02 although there have been changes in expenditure in different areas of the health system. 2.95 The committee notes evidence from several submitters and witnesses that individual expenditure has risen in real terms while individual expenditure as a proportion of overall health expenditure has remained relatively stable. 2.96 Evidence received about the impact of out-of-pocket expenditure in some areas of health is subject to debate. The committee notes that analysing Australia's healthcare system and out-of-pocket expenditure against international comparisons is useful but that these comparisons need to be made with caution and in context. 2.97 The committee notes the importance of developing and maintaining comprehensive and robust national data about different areas of the health system. This would ensure there is a solid evidence base to assist policy development and ongoing evaluation and analysis, and would reduce the likelihood of unintended consequences arising once policies are implemented.
76 Dr Dwayne Crombie, Committee Hansard, 3 July 2014, p. 37.
77 Australian Wound Management Association, Submission 31, p. 2.
78 Optometrists Association Australia, Submission 18, p. 1.

24
Chapter 3 Co-payments
Introduction 3.1 When accessing particular services in the healthcare system, individuals contribute to the financial cost of those services—in the form of a co-payment. However, a number of services are also provided to individuals 'free' at the point of service delivery—that is, no co-payment contribution is required. 3.2 This chapter discusses the following terms of reference:
(b) the impact of co-payments on consumers' ability to access health care, and health outcomes and costs; (c) the effects of co-payments on other parts of the health system; and (g) the appropriateness and effectiveness of safety nets and other offsets.
Medicare and Pharmaceutical Benefits Scheme co-payments 3.3 The introduction of a Medicare co-payment and an increase in the PBS co-payment were discussed by the National Commission of Audit (the Commission) in its report into Government expenditure released in February 2014.1 3.4 In the 2014–15 Budget, the Australian Government announced a range of health initiatives including: a new Medicare Safety Net and changes to the Pharmaceutical Benefits Scheme Safety Net, establishment of a Medical Research Future Fund, and pausing of the thresholds for the Private Health Insurance Rebate and most Medicare fees. 3.5 The Budget also announced the introduction of a $7 Medicare co-contribution or co-payment. From 1 July 2015, bulk-billed patients will be required to pay $7 per visit toward the cost of general practitioner consultations, and out-of-hospital pathology and imaging services.2 Under the proposed changes, $5 will be invested in the Medical Future Research Fund and $2 will be paid directly to the doctor or service provider. Medicare rebates for items attracting a patient contribution will be reduced by $5. 3.6 The Government has indicated that doctors will be paid a 'low gap incentive payment’ to encourage them to charge concession card holders and children under 16
1 National Commission of Audit, Towards responsible government. The report of the National Commission of Audit, Phase One, February 2014, pp 99–100; 111–112.
2 Commonwealth of Australia, Budget Overview, p. 13. Also see: The Hon. J.B. Hockey MP, Treasurer, Budget Speech 2014–15, 13 May 2014, p. 8.
26
no more than a $7 patient contribution for their first 10 visits, and to bulk bill these patients (after 10 initial visits) and not charge them for subsequent visits.3 3.7 Currently, the incentive payment for bulk-billing concession patients is $6 for metropolitan areas and $9.10 for regional areas and Tasmania. GPs do not receive an incentive payment when bulk-billing patients without a concession card.4 3.8 Evidence provided to the inquiry by the Royal Australian College of General Practitioners (RACGP) explained the proposal as follows:
The current reality is that, if I bulk-bill someone who is a concession card holder or a child under 16—they are seen as vulnerable groups who are likely to be most affected by fees—I am also paid a bulk-billing incentive payment. It is $6 in metropolitan areas, and in some rural areas and areas of workforce shortage it is $9. Effectively, in this new system, if I waive the co-payment and I bulk-bill, my rebate will be reduced by $5 because that is what they are paying and that bulk-bill incentive is lost. So that will be a decrease of between $11 and $14, and on a standard consultation that represents a 25 to 31 per cent reduction in the Medicare rebate, which has only increased from about $22 to $36 over a 20-year period anyway. So, as it is, it is a fairly low rebate.5
3.9 In the Budget, the Government also announced that from 1 July 2015, general patients will pay an extra $5.00 towards the cost of each PBS prescription. Patients with a concession card will pay an extra $0.80 towards the cost of each PBS prescription.6 3.10 Submissions made to the inquiry prior to the budget announcement commented on the potential introduction of the Medicare co-payment, whereas submissions made after 13 May 2014 referred to the announced measure. In either case, submitters overwhelmingly did not support the introduction of a Medicare co-payment. 3.11 Similarly, the committee received submissions which included comments on the potential increase to the PBS co-payment. Submitters overwhelmingly did not support an increase in the PBS co-payment. 3.12 The majority of the evidence provided to the committee discussed co-payments in the context of the proposals announced in the Budget. This chapter will present the evidence about the impact of co-payments on access to health care and then the evidence received about the impact on health outcomes and costs.
3 Department of Health, Strengthening Medicare, June 2014, http://www.health.gov.au/internet/budget/publishing.nsf/content/budget2014-factsheet-strengthening-medicare (accessed 7 August 2014).
4 Department of Health, Strengthening Medicare, June 2014, http://www.health.gov.au/internet/budget/publishing.nsf/content/budget2014-factsheet-strengthening-medicare (accessed 7 August 2014).
5 Dr Liz Marles, Committee Hansard, 3 July 2014, p. 16.
6 The Budget also included proposed changes to the Medicare and PBS safety nets which will be discussed in more detail in chapter 4 of this report.
27
3.13 In order to provide some context for the discussion about the impact of co-payments, this next section will discuss the rationale and effectiveness of the proposed co-payments as well as the issue of price signals in healthcare. Rationale for co-payments 3.14 Several submitters questioned whether a strong case had been made to justify the introduction of a co-payment, in particular the justification that a co-payment was necessary to reduce the number of visits individuals make to GPs unnecessarily. 3.15 The Tasmanian Council of Social Service observed:
The aim to “send messages” to people who access the GP unnecessarily is, at best, a risky healthcare strategy. It is the role of GPs to ascertain the severity of symptoms, injuries and illness. To place the burden of this onto unqualified members of the public is irresponsible and unrealistic. To send a message that says “stay home unless you are acutely unwell” will result in presentations to the GP that are beyond the preventative stage.7
3.16 The Australian Council of Social Service (ACOSS) submitted that they have not seen any compelling evidence to support the introduction of a co-payment for GP services and that the proposals presented provide no evidence of over-servicing. Furthermore, there has been no analysis presented of the administrative costs of the co-payment schemes.8 3.17 Witnesses noted that evidence to suggest that GP over-servicing occurs is limited.9 Furthermore, defining what may constitute an 'unnecessary visit' is very difficult as individuals are not in the best position to determine the nature and seriousness of their health concern. It is difficult for individuals to make an accurate assessment about the level of medical intervention that may be required and the urgency. Gaining an understanding or making a judgement about whether the 'right' patients are not accessing or delaying using services is also very difficult to do.10 3.18 Several witnesses commented that national data reporting the severity of illnesses or symptoms individuals may have when they delay or defer visiting a GP is not routinely collected and is unavailable.11 3.19 The Pharmacy Guild of Australia (Pharmacy Guild) submitted details from a 2008 study commissioned by the Australian Self Medication Industry which found that 15 per cent of all GP consultations involve the treatment of minor ailments and 7 per cent involve the treatment of minor ailments alone. The Pharmacy Guild projected
7 Tasmanian Council of Social Service, Submission 67, p. 4.
8 Australian Council of Social Service, Submission 61, p. 10.
9 See for example. Dr Liz Marles, Committee Hansard, 3 July 2014, p. 20; Ms Rebecca Vassarotti, Committee Hansard, 3 July 2014, p. 51.
10 See for example, Dr Stephen Duckett, Committee Hansard, 29 July 2014, pp 31–32.
11 See for example, Mr Adam Stankevicius, Committee Hansard, 29 July 2014, p. 6; Professor Brian Owler, Committee Hansard, 29 July 2014, p. 27; Dr Stephen Duckett, Committee Hansard, 29 July 2014, p. 30.
28
these figures nationally and suggested that this finding equated to 25 million GP consultations annually.12
Price signals in healthcare and the effectiveness of co-payments 3.20 The committee notes that the purpose of a co-payment is to create a price signal for consumers to encourage greater consideration of the need to access particular health services, with a view to reduce the number of health service visits. 3.21 Professor Stephen Jan, Professor of Health Economics, The George Institute for Global Health questioned whether such price signals are appropriate given that healthcare is very different from other consumption goods:
When we are talking about health care, we go to the doctor. The doctor is the provider of health care, but they are also acting as the agent for the consumer—so they help the consumer decide on what health care, further down the track, they will need. Consumers go into this whole—I suppose—'transaction' as an ill-informed individual. The problem with a co-payment is that you are preventing people from even engaging in that first step in getting information about what health care they need.13
3.22 The Department of Health submitted: Basic economics suggests that, other things being equal, increased prices lead to decreased demand, with the strength of this relationship being referred to as elasticity of demand. However in real world situations, particularly in health, other factors are not equal, and the relationship can be quite complex. In particular, demand is also influenced by income, and for superior goods like health, demand can be very elastic and grow faster than incomes. Moreover, not all health interventions have the same value and changes in aggregate demand may not impact on health outcomes if they reflect a ‘swapping out’ of less effective interventions for more effective interventions.
3.23 The Royal Australian College of General Practitioners provided the following evidence:
The federal government's proposed co-payment model is intended to reduce unnecessary general practice health service use. However, international studies demonstrate that, with the exception of the most vulnerable patients, there is limited evidence that co-payments actually reduce health service use. The economic rationale for implementing co-payments is further confounded by evidence suggesting that healthcare costs increase due to preventable conditions not being treated and poorer control of chronic disease and greater hospitalisations.14
12 Pharmacy Guild of Australia, Submission 41, p. 13.
13 Professor Stephen Jan, Committee Hansard, 3 July 2014, p. 2.
14 Dr Liz Marles, Committee Hansard, 3 July 2014, p. 15.
29
3.24 The Grattan Institute acknowledged that increasing out-of-pocket costs will succeed in its intended outcome to reduce service use. The fundamental issue with encouraging a reduction in medical service use is that:
…the more that so-called necessary services are reduced, alongside unnecessary ones, the worse the outcome will be. There could be health consequences and increased long-run costs.15
Impact of co-payments on consumers ability to access health care 3.25 The Department of Health advised that it is estimated that the introduction of a GP co-payment will result in a one per cent reduction in the rate of growth in GP consultations—the rate of growth will reduce from approximately 4.5 per cent to approximately 3.5 per cent. If the rate of growth is 3.5 per cent, it is estimated that there will be one million fewer GP consultations than there would have been under current conditions.16 3.26 However, evidence to the inquiry emphasised that rather than discourage 'over-servicing' and reducing the number of 'unnecessary visits', the introduction of co-payments would have a negative impact on consumers' ability to access necessary primary health care services. This section will first present the evidence received about the impact on access to particular services in the health system and then discuss the evidence received about the impact on access to health care overall, as well as the impact on particular communities. 3.27 The committee also notes evidence received which expressed concern that the introduction of a co-payment will impact on the nature of visits to the GP, by placing additional financial pressure on GPs to see more patients (resulting in shorter consultations) or shifting the focus of the consultation to discussions around capacity to pay rather than on important health discussions.
Access to medical services 3.28 Submitters and witnesses expressed concern that an increase in out-of pocket costs in the form of a co-payment for GP services would result in people delaying seeking medical treatment. It was noted that existing out-of-pocket costs already cause people to delay seeking treatment for financial reasons and that further increases to out-of-pockets costs would exacerbate this situation.17 3.29 The RACGP noted Australian Bureau of Statistics findings that in 2010–11 approximately 1.8 million Australians indicated that they delayed or avoided seeing their GP because of cost. The RACGP expect this number to increase if out of pocket costs continue to rise.18
15 Dr Stephen Duckett, Committee Hansard, 29 July 2014, p. 29.
16 Mr Richard Bartlett, Committee Hansard, 29 July 2014, pp 58–59.
17 See for example, Australian College of Nursing, Submission 15; Ms Rebecca Vassarotti, Committee Hansard, 3 July 2014, p. 55; Ms Jill Gallagher, Committee Hansard, 3 July 2014, pp 55–56.
18 Royal Australian College of General Practitioners, Submission 20, p. 3.
30
3.30 In its review of healthcare in Australia, the COAG Reform Council found that nationally, in 2012–13, 5.8 per cent of people delayed or did not see a GP due to cost. The rate was higher outside major cities (7.2 per cent compared to 5.3 per cent in major cities) and for women (7.0 per cent compared to 4.3 per cent for men). The rate at which people reported cost barriers to seeing a GP was similar regardless of how socioeconomically disadvantaged the area was in which they lived.19 3.31 The 2012–13 Patient Experience Survey conducted by the Australian Bureau of Statistics reported similar findings. In 2012–13, 5.4 per cent of people reported that they delayed or did not see a GP due to cost.20 3.32 The National Health Performance Authority (NHPA) drew the committee's attention to data from their report Healthy Communities: Australian's experiences with primary health care in 2011–12. In this report, the NHPA compared Medicare Local catchments on the basis of health status, cost barriers and expenditure of GPs. This report found that in 2011–12, the percentage of adults who reported they delayed or did not see a GP due to cost varied across Medicare Local catchments, ranging from one to three per cent. The range of adults who did not see a medical specialist due to cost across Medicare local catchments, ranged from three to 14 per cent. 21 3.33 The Consumers Health Forum of Australia (CHF) noted findings from their national survey which found that nearly two-thirds of respondents indicated they had at some point delayed seeing a medical practitioner. Nearly half of the respondents cited cost as a contributing factor.22 3.34 The AMA reported that 7.2 per cent of people living outside major cities defer or do not access a GP due to cost.23 3.35 The committee received evidence detailing the impact of the proposed $7 co-payment on accessing GP services. 3.36 The Victorian Aboriginal Community Controlled Health Organisation (VACCHO) advised the committee that they have committed to absorb the co-payment because the community they service will be unable to pay. In light of this, it is estimated that VACCHO will lose approximately $250,000 of the $900,000 in
19 COAG Reform Council, Healthcare in Australia 2012-13: Five years of performance, 30 April 2014, p. 51.
20 Australian Bureau of Statistics, 4839.0—Patient experiences in Australia: summary of findings, 2012–13, 21 November 2013, http://www.abs.gov.au/ausstats/[email protected]/mf/4839.0 (accessed 15 August 2014).
21 National Health Performance Authority, Healthy Communities: Australians' experiences with primary health care in 2011-12, June 2013, p. 5.
22 Mr Adam Stankevicius, Committee Hansard, 29 July 2014, p. 1.
23 Australian Medical Association, response to question on notice, 29 July 2014 (received 15 August 2014).
31
Medicare income they currently receive annually. This reduction will likely result in VACCHO reducing their Aboriginal health worker staff numbers by three.24 3.37 Mr Gordon Gregory, Executive Director, National Rural Health Alliance told the committee:
…based on available data, our estimates are that the introduction of a $7 co-payment would almost double the average annual out-of-pocket costs that Australians pay for GPs. In addition, we anticipate that a $7 co-payment will present a dilemma, especially for lone GPs in small rural and remote towns, and that the viability of these medical practices may be reduced, with consequences for access to health services in those towns. Further consideration of the impact of proposed new co-payments should therefore include their differential impact on people in rural and remote areas. There should be modelling of the effects of such additional payments across remoteness and SEIFA [Socio-Economic Indexes for Areas] gradients, particularly on such things as skipped or delayed visits to GPs and other clinicians and on potentially preventable hospitalisations’.25
Access to pharmaceuticals 3.38 Submitters and witnesses expressed concern about the impact of increased co-payments on individuals' access to pharmaceuticals with existing out-of-pocket costs already affecting individuals’ adherence to their medication regimes. 3.39 The committee heard a debate over the evidence regarding the extent to which an increased co-payment would impact individuals' decisions to fill prescriptions. While the majority of submitters expressed concern that an increased co-payment would impact on compliance with prescribed medication, the Department presented evidence against this proposition. 3.40 Data from the NHPA indicates that the number of adults who reported that they did not fill a medical prescription due to cost ranged across Medicare Local catchments from 5 per cent to 15 per cent.26 3.41 The AMA reported that 12.4 per cent of people living in the most disadvantaged areas delayed or did not fill a prescription due to cost, twice the rate for the least disadvantaged areas.27 3.42 Mrs Helen Dowling, Chief Executive Officer, Society of Hospital Pharmacists of Australia (SHPA) noted that she was aware of individual case studies and anecdotal
24 Mr Jason King, Committee Hansard, 3 July 2014, p. 59.
25 Mr Gordon Gregory, Committee Hansard, 3 July 2014, p. 24.
26 National Health Performance Authority, Healthy Communities: Australians' experiences with primary health care in 2011-12, June 2013, p. 5.
27 Australian Medical Association, response to question on notice, 29 July 2014 (received 5 August 2014).
32
evidence but that data on what scripts are written and subsequently filled is not collected in Australia.28 3.43 A representative from the Department of Health advised that the main source of information on this matter is the ABS patient experience survey which asked questions about whether individuals ‘delayed’ or ‘didn’t’ fill prescriptions. The Department was of the view that the data gleaned from these questions is limited.29 3.44 The last increase to the PBS co-payment occurred on 1 January 2005 when the co-payment increased by 21 per cent. The Consumers Health Forum of Australia provided evidence about the impact of the 2005 increase on individuals:
Studies have shown that, following the January 2005 increase in PBS copayments, there was a significant decrease in dispensing volumes observed across 12 of the 17 medicine categories, including anti-epileptic medication, anti-Parkinson's treatments, combination asthma medicines, insulin and osteoporosis treatments. Importantly, we also know that the copayment increase had a particular impact at that time on medicine utilisation by concessional patients.30
3.45 The Department of Health advised that, although the 2005 changes to PBS co-payments saw the reduction in script volumes in some medications, there was also a significant increase in script volumes in other disease classes. Due to a range of factors, the Department argued that it was inappropriate to draw parallels between the co-payment increase in 2005 and what is currently being proposed.31 3.46 During the 2014–15 Budget Estimates, officials from the Department of Health advised that they expect the increased PBS co-payment to result in concession card holders paying, on average, an additional $13.60 per year. This estimated impact has been calculated based on filling 17 prescriptions annually.32
Access to dental care 3.47 Evidence provided to the inquiry suggested that out of pocket costs are a key factor in individuals' decisions to visit the dentist. 3.48 Data from the NHPA reported that the percentage of adults who did not see a dental professional due to cost varied across Medicare Local catchments, ranging from 11 per cent to 34 per cent.33 3.49 The Australian Dental Association (ADA) provided results from a survey they had undertaken which indicated that 72 per cent of the population see a dentist 'when
28 Mrs Helen Dowling, Committee Hansard, 3 July 2014, p. 12.
29 Mr Richard Bartlett, Committee Hansard, 3 July 2014, p. 67.
30 Mr Adam Stankevicius, Committee Hansard, 29 July 2014, p. 2.
31 Ms Felicity McNeill, Committee Hansard, 29 July 2014, pp 71–72.
32 Ms Felicity McNeill, Estimates Hansard, 2 June 2014, p. 45.
33 National Health Performance Authority, Healthy Communities: Australians' experiences with primary health care in 2011-12, June 2013, p. 5.
33
they have a problem' with only 23 per cent reporting a regular visiting pattern. Of the 72 per cent who only attended when there is a problem, 80 per cent had an annual household income of less than $50 000. Further to this, the ADA submitted:
Cost of care is clearly a factor influencing attendance for care. What remains unclear is whether cost is used as the excuse or whether it demonstrates a failure on behalf of the community to properly prioritise their dental care. Whatever the reason, it is clear that cost is a factor and thus it can be predicted that the likelihood of incurring OOPs [out of pocket costs] will be a reason for non-attendance.34
3.50 COTA and National Seniors Australia provided evidence about the high financial burden faced by older people when accessing dental care. Many older people report suffering negative outcomes as a result of poor oral health. The exclusion of dental services from Medicare was a key concern raised by older people.35 Impact on different sectors of the community 3.51 Several submitters and witnesses noted that the impact of co-payments is disproportionality felt by vulnerable people across the community. In particular, the committee received evidence about the impact on the Aboriginal and Torres Strait Islander community, people on low and fixed incomes, older people, people with chronic illness and people living in regional, rural and remote communities.36 3.52 In their submission, ACOSS referred to the Productivity Commission Report on Government Services 2014 which noted that it is well documented that people who experience social and economic disadvantage are at risk of negative health outcomes. The Report also noted that higher income and wealth are associated with better health. People with higher incomes are better able to access health services in a timely manner and have greater access to a range of goods and services that have health benefits.37 3.53 Carers NSW submitted:
Carers report that the high costs of health care result in decisions to go without. For some families this may mean going without family leisure, sport and other social activities which promote physical and mental health and wellbeing. For some this may mean making drastic and stressful financial decisions, such as selling the family home.
For many families the cost of health care simply means going without health care.38
34 Australian Dental Association, Submission 57, pp 7–8.
35 Ms Josephine Root, Committee Hansard, 29 July 2014, p. 16; Ms Marie Skinner, Committee Hansard, 29 July 2014, p. 17.
36 See for example, Victorian Medicare Action Group, Submission 39, p. 1; National Aboriginal Community Controlled Health Organisation, Submission 42, p. 3.
37 Australian Council of Social Service, Submission 61, p. 7.
38 Carers NSW, Submission 56, p. [3].
34
3.54 The National Aboriginal Community Controlled Health Organisation (NACCHO) noted:
On average 12 per cent of Aboriginal Australians defer GP visits for more than a year because of costs, more than twice the rate of the general population. Aboriginal Australians also present disproportionately high 'potentially avoidable GP-type presentations' to hospital outpatients particular in major cities and inner regional centres.39
3.55 National Seniors Australia reported that older Australians spend $350 per quarter on out-of-pocket health costs. The financial burden is magnified for people with chronic health conditions; people with five or more chronic conditions report spending $882 per quarter on out-of-pocket health costs.40 3.56 According to COTA Australia:
I think it is important to remember that older people come into the three groups that have been identified by other speakers; in fact, they have the triple whammy of being vulnerable because they are older, they are on low incomes on the whole, and they have chronic diseases. So those are the three things that mean that copayments are going to have a negative effect on you, and older people are going to get all three.41
3.57 Evidence provided to the inquiry indicated that people living in rural and remote areas are less able to pay out-of-pocket costs, resulting in a greater proportion of people in rural and remote areas postponing or not making visits to a health professional due to the costs. 3.58 GP out-of-pocket health care costs for people in regional areas are 10 to 20 per cent higher in absolute terms than in the major cities, but lower in very remote areas due to the lesser rate at which people have access to a GP. More specifically, the National Rural Health Alliance provided the following evidence to the committee: • the average amount an Australian pays out-of-pocket for access to a GP is
$29.56 a year (averaged across Australia); • the average out-of-pocket costs for a person who is not bulk-billed is $29.37
per occasion of service. This national average is comprised of: $29.94 in major cities, $27.60 in inner regional, $28.90 in outer regional, $32.59 in remote and $33.82 in very remote.42
3.59 The AMA highlighted that the performance of the health system in Tasmania is poorer than in many other jurisdictions. In respect to access to general practice, the AMA stated:
39 National Aboriginal Community Controlled Health Organisation, Submission 42, p. 3.
40 Ms Marie Skinner, Committee Hansard, 29 July 2014, p. 17.
41 Ms Josephine Root, Committee Hansard, 29 July 2014, p. 16.
42 Mr Gordon Gregory, Committee Hansard, 3 July 2014, p. 26.

35
Tasmania has a higher burden of chronic disease and higher smoking rates, and we need to do more to encourage preventive health care and chronic disease management. That is why I think the co-payment is probably going to affect Tasmanians more than it affects people in other jurisdictions.43
3.60 The Menzies Centre for Health Policy/The George Institute for Global Health provided evidence about the household economic burden of chronic and long-term illnesses, with out-of-pocket costs being a major component. Their submission detailed a study of the experiences of people living with advanced chronic obstructive pulmonary disease. The study reported that 78 per cent of respondents experienced economic hardship from managing their illness and 27 per cent were unable to pay their medical and dental expenses. The economic burden of chronic disease is demonstrated by the evidence that each additional chronic disease adds 46 per cent to the likelihood of a person facing severe financial difficulties due to health costs.44 3.61 Several submitters noted that people with chronic illness incur significant out-of-pocket costs due to the complex nature of their conditions and the range of services and medications that may be necessary. 3.62 On this matter, National Seniors Australia advised:
National Seniors research reveals that overall out-of-pocket expenditure increases steadily as the number of chronic conditions increased. Eighty per cent of 4,500 respondents to a 2009 survey had at least one chronic condition and 56 per cent had more than one condition. The presence and number of chronic conditions increased with age with five or more chronic conditions reported by twice as many (12 per cent) of those aged 75 years and over compared with those aged between 50 and 64 years. Out-of-pocket health expenditure was greatest for medication and medical services with cancer expenditure significantly higher than that for arthritis and high blood pressure.45
Impact on health outcomes and costs 3.63 Submitters argued that when medical treatment (such as not visiting a GP when required or filling a prescription) is delayed due to out-of-pocket costs, this will often lead to negative health outcomes.46 3.64 As outlined above, several submitters expressed concern that an increase in out-of-pocket costs (for example, in the form of a mandatory co-payment) will impact disproportionally on individuals with the greatest healthcare need, including:
43 Associate Professor Brian Owler, Committee Hansard, 29 July 2014, pp 27–28.
44 The Menzies Centre for Health Policy / The George Institute for Global Health, Submission 28, p. 2.
45 National Seniors Australia, Submission 55, p. 11.
46 See for example, The Menzies Centre for Health Policy/The George Institute for Global Health, Submission 28, p. 3.
36
Aboriginal and Torres Strait Islanders, elderly people, women, people on low or fixed incomes and people with chronic illnesses.47 3.65 Evidence to the inquiry noted that people with chronic illnesses need to access health services on a regular basis. Their capacity to visit GPs and other service providers when required may be affected by the cost of accessing these services. Serious negative health outcomes may occur if regular contact with the necessary health professional is deferred. 3.66 For example, Diabetes Australia submitted information from the latest Report on Government Services that only 25 per cent of Australians met the annual diabetes cycle of care requirements in 2012–13. In particular, many people with diabetes are not having their recommended six monthly check up. Diabetes Australia is concerned that 'having people pay more for health care may worsen access to the recommended cycle of care and the recommended 6 monthly monitoring'.48 3.67 Hepatitis NSW expressed concern that an increase in out-of-pocket costs will have a serious and disproportionate impact on communities affected by both hepatitis B and hepatitis C, affecting their ability to pay for healthcare which will result in negative long-term health outcomes.49 3.68 National Seniors Australia submitted:
Respondents to a National Seniors 2009 survey stated that a lack of affordable access to doctors / specialists and health insurance, lack of government support for the health system, long waiting times and general ageing contributed to the deterioration of their health during recent years. People with five or more chronic conditions were significantly more likely to face a moderate (18.6 per cent) or severe (30.5 per cent) financial burden than those with fewer conditions.50
3.69 Evidence was also received that if individuals delay treatment, this may result in increased costs to the health system later on as conditions progress and worsen.51
Pharmaceuticals 3.70 Evidence provided to the committee noted the negative health outcomes that may arise when individuals do not adhere to their prescribed medication program. 3.71 Mrs Helen Dowling noted that an estimated 50 per cent of patients with chronic diseases are not taking their medications as prescribed. Approximately 10 per cent of patients visiting a GP report having experienced an adverse medication event
47 See, for example, Royal Australian College of General Practitioners, Submission 20, Australian Healthcare and Hospitals Association, Submission 43, pp 2–3.
48 Diabetes Australia, Submission 65, p. 2.
49 Hepatitis NSW, Submission 64, p. 3.
50 National Seniors Australia, Submission 55, p. 6.
51 See for example, Chronic Illness Alliance, Submission 38, p. 6; National Seniors Australia, Submission 55, p. 7.
37
in the past six months. In relation to emergency department presentations and hospital admissions, approximately two to three per cent of all hospital admissions, 12 per cent of all medical admissions and 20 to 30 per cent of admissions in consumer aged care for patients aged over 65 years are medication related.52
Effect of co-payments on other parts of the health system 3.72 The committee notes that the intention of the $7 co-payment on GP visits is to reduce the overall number of GP visits and thereby reduce the Government's contribution to these services. 3.73 Submitters and witnesses emphasised the importance of quality and accessible primary health care services (in particular, GPs). Delivery of quality primary health services is vital not only to respond to individuals' health needs, but to the functioning of the health system as a whole. 3.74 The AMA told the committee:
Now is not the time to strip money out of primary health care. It is the time to invest in primary care to ensure sustainability of the healthcare system. People need access to general practitioners to know what their healthcare needs are. General practitioners need access to pathology and imaging services in order to diagnose conditions early and put treatment plans in place.53
3.75 Evidence to the inquiry explained that primary health care is the most efficient part of the health system. Witnesses emphasised that countries with strong primary healthcare systems report the best health outcomes at the most efficient cost.54 3.76 The RACGP observed that there is no economic benefit in dissuading patients from seeing their GP:
In fact, there is good evidence to suggest that there is a negative economic impact with patients using more expensive health care through the hospital system that could be delivered by general practice at a fraction of the cost. General practice has been, and remains, the most efficient component of the healthcare system, with general practice costs per patient remaining steady over the past 20 years, while hospital costs have continued to rise.55
3.77 Evidence to the inquiry indicated that increasing the cost to access a particular section of the healthcare system would affect other services due to the integrated nature of the health system. Submitters and witnesses argued that co-payments may affect other parts of the health system in a number of ways, including by:
52 Mrs Helen Dowling, Committee Hansard, 3 July 2014, p. 10.
53 Associate Professor Brian Owler, Committee Hansard, 29 July 2014, p. 22.
54 See for example, Dr Liz Marles, Committee Hansard, 3 July 2014, p. 21; Mr Gordon Gregory, Committee Hansard, 3 July 2014, p. 24.
55 Dr Liz Marles, Committee Hansard, 3 July 2014, p. 15.
38
• placing increased stress on the public health system (in particular emergency departments) as patients seek hospital treatment to avoid paying a GP co-payment;
• shifting responsibility for primary care to community pharmacies; and • reducing the number of patients undertaking all required pathology and
diagnostic testing.56 3.78 In the following section, the effect of co-payments on the following sectors of the health system will be explored in more detail: • the hospital system; • pharmacies; and • bulk-billing rates.
Effect on the hospital system 3.79 Submitters noted that increasing GP co-payments would place increased stress on the public hospital system, especially emergency departments, as patients seek hospital treatment to avoid the co-payment costs associated with GP visits. 3.80 According to Catholic Health Australia:
High out-of-pocket charges imposed in an uncoordinated way are more than likely already resulting in people receiving care in settings that may not be the most effective or cost-effective. There is evidence that some, many of who have no choice, seek to minimise costs by avoiding or delaying seeking health services, or choosing a provider with lower costs by utilising a hospital emergency department rather than attending a GP who charges out-of-pocket costs.57
3.81 The Grattan Institute acknowledged that there is little evidence for whether people are more likely to go to a hospital emergency department if they face higher co-payments at the GP, but that it seems likely. It was suggested that any shift of patients from GPs to emergency departments will increase costs to government because the Medicare rebate for the most common type of GP consultation, which lasts up to 20 minutes, is $36.30. The average cost of a non-admitted level 5 triage visit to a hospital—a likely substitute for a GP visit—is $290.58 3.82 Evidence provided to the inquiry indicated that the cost of providing healthcare in a hospital is significantly higher than providing care in a primary health setting. For example, the Australian Healthcare & Hospitals Association referenced a
56 The impact on other areas of the health system was discussed in a number of submissions. See for example, Australian Women's Health Network, Submission 36, p. 5.
57 Catholic Health Australia, Submission 63, p. 5.
58 Grattan Institute, Submission 79, p. 13.
39
Northern Territory study which found that costs associated with in-patient care for renal conditions were significantly higher than community based care.59 3.83 Taking a similar view, the Doctors Reform Society submitted that although 'studies are lacking, common sense indicates that patients who struggle to afford visits to GPs will consider attending Emergency Departments'. Further to this, it was noted that emergency departments are not designed to deal with many of the problems dealt with by GPs.60 3.84 The National Rural Health Alliance (NRHA) noted that one of the impacts of missing out on primary care is a higher rate of avoidable hospitalisation. Further to this, using data from the NHPA, the NRHA submitted:
The age-standardised rate of potentially avoidable hospitalisations increases significantly with remoteness. For example, in 2011–12 the age-standardised rate of potentially avoidable acute and vaccine-preventable conditions ranged from 1,135 hospitalisations per 100,000 people in Inner West Sydney to 3,125 per 100,000 people in Central and North West Queensland.61
3.85 The importance of primary health care being delivered by GPs and not in emergency departments was also raised in submissions. The Australian College of Nurse Practitioners observed:
Specifically, patients who either cannot afford or who wish to avoid the co-payment will use the ED [emergency department], as their first point of contact, for their healthcare. The focus for EDs is to manage emergent and episodic care, and patients see a different clinician every time they present. If a patient uses ED for primary care services the continuity and ongoing management of their primary healthcare conditions will become fragmented.62
3.86 Dr Stephen Duckett, Director, Health Program, Grattan Institute outlined the difficulties to quantify the impact of possible redirection of GP visits to emergency departments. Dr Duckett suggested that if one in five of the estimated one million GP services that will not occur as a result of the new co-payment presents to an emergency department, there will be no savings to total government expenditure.63 Co-payment charges in hospitals 3.87 The committee notes recent speculation that hospital emergency departments will be encouraged to charge a co-payment to reduce the possibility that individuals will present to emergency departments to avoid paying the GP co-payment. A number of witnesses questioned the appropriateness and practicality of this proposal. The
59 Mr Andrew McAuliffe, Committee Hansard, 29 July 2014, p. 10.
60 Doctors Reform Society, Submission 26, p. 3.
61 National Rural Health Alliance, Submission 54, p. 13.
62 Australian College of Nurse Practitioners, Submission 70, p. 6.
63 Dr Stephen Duckett, Committee Hansard, 29 July 2014, p. 34.
40
Australian Healthcare & Hospitals Association suggested that idea is impractical because additional staff and infrastructure would be required to manage billing procedures.64 3.88 The Department of Health advised that the introduction of patient contributions for GP-type patients in public hospitals is a matter for states and territories. The Department also noted that:
…public hospitals already collect payments for non-Medicare eligible patients presenting for treatment in Emergency Departments. Therefore, states show existing capability to levy patient contributions for certain types of patients.65
Effect on pharmacies 3.89 Evidence provided to the inquiry suggested that the introduction of a GP co-payment may shift greater responsibility of primary care to community pharmacies. 3.90 The Pharmacy Guild of Australia submitted that pharmacies already provide a range of services and advice for minor health conditions and expressed caution about the increased pressure that may be placed on these services should a GP co-payment be introduced.66
Effect on bulk billing 3.91 The committee heard evidence that the introduction of the $7 co-payment will impact on the capacity of GPs to bulk-bill due to the increased financial burden it will place on their practice. 3.92 Under the proposal, all patients will be required to pay $7 towards the cost of GP consultations. For concession card holders, the $7 contribution will be capped at 10 visits per calendar year for GP, out-of-hospital pathology and diagnostic imaging services. If a GP decides not to charge the $7 co-payment on existing bulk-billed services, they will receive the revised Medicare rebate of $31.30. If the GP was to charge the $7 co-payment, they would receive between $38.30 and $47.40 depending on the patients' concessional status and the level of low gap incentive payment applied.67 3.93 The Australian Medical Association stated:
I think the fundamental question here is really whether it is feasible for a medical practitioner to bulk bill in those circumstances. The problem that we have is that there is a cut to the Medicare rebate. For non-concession patients the $5 cut to the rebate means that, if they do not charge the co-
64 Australian Healthcare & Hospitals Association, Submission 43a, p. 2.
65 Department of Health, answer to question on notice, 29 July 2014 (received 6 August 2014).
66 Pharmacy Guild of Australia, Submission 41, p.13.
67 Department of Health, Strengthening Medicare, June 2014, p. 1, http://www.health.gov.au/internet/budget/publishing.nsf/content/budget2014-factsheet-strengthening-medicare (accessed 7 August 2014).

41
payment, the doctor will be $5 worse off. That is out of a $36 co-payment to start with. For patients who are under a concession who would under this plan receive what is called the low-gap incentive, not only would they lose the $7 co-payments but they would also lose the low-gap incentive. For patients in metropolitan areas, I understand that then adds up to $13. For patients who are in regional areas, of course, there is a $9 low-gap incentive, so it is an extra $3, or $16.68
3.94 Dr Duckett noted that in proposing the GP co-payment, the Government has created a significant financial disincentive for doctors who wish to bulk-bill. The current bulk-billing incentive will be replaced with a low-fee incentive. Dr Duckett suggested that, under the proposed new arrangements, if a doctor bulk-bills, they will be approximately 30 per cent worse off than they would otherwise be.69 3.95 Dr Liz Marles, President, RACGP explained that GPs will receive financial incentives to charge the co-payment:
…so you will actually get a low gap incentive if you charge the co-payment. If I charge that $7, I will get a bonus $6 or $9, whereas if I bulk-bill them that money is not there. We are being positively incentivised to charge the co-payment to all patients whether they are concession card holders or not, and that will translate into increased costs.70
3.96 Officials from the Department of Health emphasised that it will be up to individual GPs to decide how best to apply the co-payment to suit the needs of their practice. It was acknowledged that, as is the case under the existing system, GPs will approach the situation differently and with the necessary business decisions to reflect their practice.71
Safety nets and other offsets Introduction 3.97 There are two safety nets in the Australian healthcare system—the Medicare Safety Net and the PBS Safety Net. The safety nets provide assistance to individuals and families by reducing out-of-pocket costs once their Medicare or pharmaceutical expenses have exceeded the applicable threshold amount. 3.98 This section will commence with discussing the evidence received about safety nets generally and then discuss particular issues arising in relation to either the Medicare safety net or the PBS safety net. 3.99 The 2014 Medicare Safety Net thresholds are shown in the following table:
68 Associate Professor Brian Owler, Committee Hansard, 29 July 2014, p. 22.
69 Dr Stephen Duckett, Committee Hansard, 29 July 2014, p. 31.
70 Dr Liz Marles, Committee Hansard, 3 July 2014, pp 20–21.
71 Mr Richard Bartlett, Committee Hansard, 29 July 2014, p. 65.

42
Table 3.1: 2014 Medicare Safety Net thresholds
Source: Department of Human Services, 2014 Medicare Safety Net thresholds, http://www.humanservices.gov.au/customer/enablers/medicare/medicare-safety-net/medicare-safety-net-thresholds (accessed 15 August 2014). 3.100 From 1 January 2015, the threshold for the Extended Medicare Safety Net will be increased to $2 000. 3.101 In the 2014–15 Budget, the Government announced that from 1 January 2016 a Single Medicare Safety Net (SMSN) for out-of-hospital services will replace the Extended Medicare Safety Net (EMSN), the Original Medicare Safety Net and the Greatest Permissible Gap. The SMSN will have three thresholds: • $400—for singles with a concession card or families with a concession card; • $700—for singles with no concession card or families receiving Family Tax
Benefits Part A with no concession card; and • $1000—for families with no concession card.72 3.102 From 1 January 2016 there will be a limit on the out-of-pocket costs that count towards reaching the threshold. There will also be a maximum Medicare Safety Net benefit paid per service, which is based on the Medicare Benefits Schedule Fee for the service.73 3.103 The 2014 threshold for the Pharmaceutical Benefits Scheme Safety Net is $1 421 for general patients and $360 for concession card holders. General patient contribution per prescription is up to $36.90 and $6 for concession card holders. Once the threshold is reached, the cost for prescriptions is $6 for general patients and no charge for concession card holders.
72 Department of Human Services, Budget 2014-15: Simplifying Medicare safety net arrangements, May 2014, http://www.humanservices.gov.au/corporate/publications-and-resources/budget/1415/measures/health-matters-and-health-professionals/29-000490 (accessed 28 June 2014).
73 Department of Health, answer to question on notice, 29 July 2014 (received 6 August 2014).
43
3.104 In the 2014–15 Budget, the Government announced changes to the PBS safety net to commence on 1 January 2015 estimating the following changes: • general patient contribution of $42.70 and $6.90 contribution once the revised
threshold of $1597.80 is reached. • concession card holder contribution of $6.90 and no charge once the revised
threshold of $427.80 is reached.7475 3.105 According to the Department of Health:
The extended Medicare safety net has undergone significant change to ensure that it is more focused on supporting patients and less supportive of medical inflation. This will culminate in the safety net announced in the budget which will support more people than the current arrangements, albeit with lower benefits.76
Appropriateness of current safety nets and other offsets 3.106 Submissions to the inquiry indicated that existing safety nets do not benefit or assist people who are most in need of support from a safety net. In particular, attention was drawn to the challenges faced by people on low incomes and with chronic illnesses who experience disadvantage in accessing healthcare due to out-of-pocket costs. 3.107 Issues impacting an individuals' ability to access and benefit from existing safety nets include:
(a) the high out-of-pocket costs incurred before reaching the threshold amounts;
(b) complexity of the safety net system; and (c) the health expenditure that does not contribute to the safety net threshold
amounts. 3.108 The committee heard evidence from Professor Stephen Jan, The George Institute for Global Health who noted that the current safety net limits the annual out-of-pocket expenses of Medicare-reimbursed services. Professor Jan explained that the limitation of the safety net is that there is still a significant financial burden as individuals must pay for services until they reach the safety net threshold. This financial burden acts as a deterrent to accessing healthcare. It should also be noted that
74 Department of Health, 2014 Budget information on the Pharmaceutical Benefits Scheme, 13 May 2014, http://www.pbs.gov.au/info/news/2014/05/2014-budget-information (accessed 28 June 2014).
75 On 19 June 2014, the Selection of Bills Committee referred the provisions of the National Health Amendment (Pharmaceutical Benefits) Bill 2014 to the Community Affairs Legislation Committee for inquiry and report by 26 August 2014. This bill would give effect to the changes announced in the Budget.
76 Mr Richard Bartlett, Committee Hansard, 3 July 2014, p. 64.
44
there are many out-of-pocket costs that are incurred outside of Medicare services and therefore do not contribute to the safety net.77
Medicare safety net 3.109 Out-of-pocket medical expenses that contribute to the Medicare Safety Net are automatically monitored by Medicare although the process for monitoring payments differs slightly depending on individuals’ method of paying for medical services. Once the relevant threshold is reached, a higher Medicare rebate may be provided for all eligible for the rest of the calendar year. 3.110 Evidence provided to the inquiry suggested that the eligibility criteria to qualify for the EMSN should be reviewed to better target people who have insufficient means to pay for health services. 3.111 The Tasmanian Council of Social Service submitted:
It is evident, however, that the Safety Net does not currently benefit people on low incomes, despite its intention to do so. The figures in the 2009 review of the EMSN disturbingly showed that 55% of EMSN benefits had been distributed to the top quintile of Australia’s most socioeconomically advantaged areas, and that the bottom quintile received less than 3.5%. This is an enormous disparity, and means that ultimately the EMSN might be simply “helping wealthier people to afford even more high-cost services”.78
3.112 Submitters did not support the EMSN threshold being increased to $2 000. For example, National Seniors Australia submitted that the increase 'is inequitable and hurts people who are living with chronic health conditions'.79 The committee notes that the EMSN will come into effect on 1 January 2015 for a period of 12 months when it will be replaced by the Simplified Medicare Safety Net. 3.113 National Seniors Australia and Consumers Health Forum observed that the Simplified Medicare Safety Net as proposed has various exclusions and caveats that are very difficult for individuals to understand.80 3.114 The Department of Health estimated that 770 000 individuals will receive Medicare Safety Net benefits in 2015 and, following the commencement of the Extended Medicare Safety Net in 2016, an estimated 830 000 individuals will receive benefits.81 Pharmaceutical Benefits Scheme safety net 3.115 In contrast to the process required to qualify for the Medicare safety net, to qualify for the PBS safety net, individuals (or pharmacists on the individual's behalf)
77 Professor Stephen Jan, Committee Hansard, 3 July 2014, p. 2.
78 Tasmanian Council of Social Service, Submission 67, p. 5.
79 National Seniors Australia, Submission 55, p. 13.
80 Mr Adam Stankevicius, Committee Hansard, 29 July 2014, p. 3; Ms Marie Skinner, Committee Hansard, 29 July 2014, pp 18–19.
81 Department of Health, answer to question on notice, 29 July 2014, (received 6 August 2014).
45
must keep a record of all PBS medicines on a Prescription Record Form. Once the safety net threshold is reached, a PBS Safety Net card is issued which ensures access to cheaper or free PBS medicines for the rest of the calendar year.82 3.116 Several submitters expressed concern at the additional record keeping requirements for individuals (or pharmacists on the individual's behalf) wishing to access the PBS safety net. It was noted that many people may be missing out on the intended benefits of this safety net.83 3.117 The committee is aware that in the 2013 calendar year, there were 119 463 PBS Safety Net cards issued for general patients, noting that these cards may apply to an individual, a couple or a family. The 119 463 cards covered 236 942 patients.84 3.118 The current PBS safety net for concession patients is set at the equivalent of 60 PBS prescriptions per year at the concessional rate. During the 2014–15 Budget Estimates, officials from the Department of Health provided evidence about the changes under the new safety net from 1 January 2015:
So, if I look to what the changes will be in January 2015, the general safety net will increase by approximately $145.30, from $1,452.50 to $1,597.80; and the concessional safety net will go from 60 scripts to 62. In 2016, we expect that the general safety net will then be increased to $1,798; in 2017, we expect it to be at $2,029.20; and, in 2018, we expect it to be at $2,287.90. For the concessional safety net, it will go up to 64 scripts in 2016, 66 scripts in 2017 and 68 scripts in 2018. I would like to just put one caveat on all of that, which is that the calculation of the safety net is reliant on the CPI figure for the September quarter on a 12-month average, and therefore these are very much approximates because they are completely dependent on what the final CPI figure would be in each year.85
3.119 Submitters also described challenges experienced by people on low incomes to pay for prescriptions before they have reached the safety net threshold. In addition, particular attention was drawn to the experience of individuals with chronic illnesses who may be purchasing multiples prescriptions and incurring high out-of-pocket costs. 3.120 The Healthcare Consumers Association ACT suggested that individuals with lifelong conditions should be able to pay the discounted safety net price immediately rather than incurring out-of-pocket costs to meet the respective threshold.86 3.121 Professor Jan noted that even though the safety net is in place, the PBS costs that people face, particularly individuals with conditions that require multiple
82 Department of Human Services, Pharmaceutical Benefits Scheme Safety Net, http://www.humanservices.gov.au/customer/services/medicare/pbs-safety-net (accessed 22 July 2014).
83 See for example, Queensland Aboriginal and Islander Health Council, Submission 58, p. 6.
84 Ms Felicity McNeill, Estimates Hansard, 2 June 2014, p. 46.
85 Ms Felicity McNeill, Estimates Hansard, 2 June 2014, p. 46.
86 Healthcare Consumers’ Association ACT, Submission 66, p. 18.
46
medications, still act as a significant barrier to people using their prescribed medications which can lead to non-adherence and then further costs at a later time.87 3.122 Mrs Helen Dowling, Chief Executive Officer, Society of Hospital Pharmacists of Australia advised the committee that, based on the Department of Health's PBS budget information, in four years:
Just to highlight the significance of this, in four years the co-payment today for each category will rise from the current general non-concessional rate threshold of $1,421.20 to $2,287.90 in 2018. That is a 61 per cent increase in the threshold. For the concessional rate today, this equates to $360 for 60 prescriptions at $6 each to $510 in 2018 for 68 scrips. That is a 24 per cent increase, as highlighted. We are concerned that this will make it almost impossible for an average family to reach the safety net threshold, especially if the number of prescriptions needed to reach this threshold also increases, as is stated, from 60 to 68 over the same four years.88
3.123 On the matter of the number of filled prescriptions required to reach the safety net threshold, Mrs Dowling advised that:
Today this represents 38 script items at a price of $36.90; in 2018 if the script fee is increased at the same rate as the threshold, then the number of scripts would be anticipated to be the same for general patients.89
Other offsets 3.124 In addition to the two safety nets, other measures such as health care cards and the medical expenses tax offset are available to provide some reduction in out-of-pocket health costs. Individuals with health care concession cards are eligible to no or low cost medical treatment and prescriptions. Safety net thresholds are significantly lower for health care card holders. 3.125 The net medical expenses tax offset allowed individuals to claim 20 per cent of the amount of net medical expenses (total medical expenses minus Medicare and private health insurance rebates) above $2 060 as a deductible expense. Commencing in July 2013, the net medical expenses tax offset will be phased out. To be eligible to claim in 2014–15, individuals must have received the offset in their 2013–14 income tax assessment. 2014–15 is the final year patients can claim the tax offset unless they have medical expenses relating to disability aids, attendant care or aged care, in which case the tax offset can be claimed for these items up to the 2018–19 income tax year.90 3.126 The Healthcare Consumers’ Association ACT noted consumers concerns about tax offsets and the use of healthcare cards for those whose partners and/or carers
87 Professor Stephen Jan, Committee Hansard, 3 July 2014, p. 3.
88 Mrs Helen Dowling, Committee Hansard, 3 July 2014, p. 11.
89 Society of Hospital Pharmacists of Australia, answer to question on notice, 3 July 2014 (received 3 July 2014).
90 Australian Taxation Office, Medical expenses, 22 July 2014, https://www.ato.gov.au/Individuals/Income-and-deductions/Offsets-you-can-claim/Medical-expenses/ (accessed 13 August 2014).
47
earn just above, or above the threshold. It was observed that many consumers stated that managing chronic conditions without a health care card meant high costs for pharmaceuticals and medical supplies.91 3.127 Evidence received from the Breast Cancer Network Australia expressed disappointment that, following the 2013–14 Budget, the net medical expenses tax offset is being phased out. It was noted that the offset provided some respite to Australians with high medical costs, including those living with cancer.92
Recommended changes to the safety nets 3.128 Several witnesses advocated for changes to the Medicare and PBS Safety Nets. While there was some discussion about the optimal level of the safety net threshold, the majority of evidence provided to the inquiry argued for more structural changes to the safety net and transition to a more simplified and integrated approach.93 3.129 Submitters and witnesses noted the importance of ensuring that the safety net is patient focused and facilitates improved health outcomes. 3.130 Mr Patrick Tobin, Director, Policy, Catholic Health Australia told the committee that the safety net needs to be designed around the consumer:
At the moment, the safety nets have been designed by different parts of our siloed system and so, as well as being difficult to understand, if people have to separately qualify for different aspects of a particular safety net then that just makes it much harder.94
3.131 The Consumers Health Forum argued that safety nets should be more integrated and encompass a range of health services:
One of the biggest issues we have is that, at the moment, safety nets are designed to address one-off, acute interactions with the healthcare system, so it is annual expenditure. But we are seeing the burden of disease shift to more chronic disease management, so it is ongoing expenditure. For consumers to have to deal with the Medicare safety net only after the expenditure has been incurred puts a heavy burden on people, especially those with conditions like asthma and diabetes, who need the assistance as and when it occurs.95
3.132 Carers Queensland recommended the implementation of a robust safety net which is clearly defined and crosses all forms of treatment.96 This approach was supported by several submitters and witnesses. Evidence suggested that the Medicare
91 Healthcare Consumers’ Association ACT, Submission 66, p. 18.
92 Breast Cancer Network Australia, Submission 51, p. 9.
93 See for example, Mr Andrew McAuliffe, Committee Hansard, 29 July 2014, p. 13; Ms Josephine Root, Committee Hansard, 29 July 2014, p. 18.
94 Mr Patrick Tobin, Committee Hansard, 29 July 2014, p. 13.
95 Ms Priyanka Rai, Committee Hansard, 29 July 2014, p. 3.
96 Ms Sarah Walbank, Committee Hansard, 3 July 2014, p. 53.
48
Safety Net should be looked at more holistically to include allied health services such as occupational therapy, physiotherapy and healthcare provided by nurse practitioners.97 This holistic approach to patient care will likely become more important as the population ages and the number of people with multiple conditions increases, placing increasing pressure on the healthcare system.
Committee view 3.133 The committee notes that the purpose of a co-payment is to create a price signal for consumers as a means of reducing unnecessary visits to general practitioners and the use of pathology and diagnostic services. 3.134 Evidence provided to the inquiry suggested that there was limited evidence to suggest there is over-servicing in primary healthcare. In fact, there is evidence to suggest that in some areas and communities there is significant under-servicing. 3.135 The current level of out-of-pocket costs in healthcare is already impacting on an individuals' access to healthcare. The available data indicates that many Australians are delaying visits to their GP and dental service or not filling all of their required prescriptions. The committee heard evidence that the impact of co-payments is disproportionality felt by vulnerable people across the community. 3.136 The committee is concerned that imposing an additional co-payment will make it even harder for individuals, particularly vulnerable groups, to access primary health care. 3.137 Deferring seeking medical treatment may impact not only on an individuals' health but may also affect other parts of the health system whereby primary health visits are redirected into the public hospital system. 3.138 The committee is concerned that existing safety nets do not benefit or assist people who are most in need of support from a safety net. Often individuals will incur significant out-of-pocket costs before they reach the respective threshold amount. As outlined throughout the inquiry, out-of-pocket costs can be barriers to access healthcare. 3.139 The committee notes that the safety nets are complex and many people report difficulty understanding the requirements and thresholds that must be met to qualify. This is particularly relevant for the PBS Safety Net as individuals are required to keep their own record of prescription medications. In this situation, there is a risk that people will not maintain the correct records and fail to qualify for the safety net. 3.140 The committee notes that the health costs that may contribute towards the safety net are limited. The committee believes a single, integrated safety net should be developed but notes that careful consideration would need to be given to what services and costs are eligible to contribute to the safety net.
97 See for example, Australian Physiotherapy Association, Submission 22, p. [4–5].
Chapter 4 Current market drivers and the sustainability of the
health system 4.1 This chapter discusses the following terms of reference:
(h) market drivers for costs in the Australian healthcare system; and (d) the implications for the ongoing sustainability of the health system.
Market drivers 4.2 The Minister for Health, the Hon Peter Dutton MP has characterised the ageing population, chronic disease and higher costs as the key drivers of costs in the healthcare system. The Minister noted that these drivers have placed increasing pressure on Medicare, the Pharmaceutical Benefits Scheme (PBS) and public hospitals.1 4.3 Several submitters and witnesses also identified the ageing population and increased incidence of chronic and long term illnesses as the key areas placing additional pressure on the healthcare system. 4.4 Evidence to the inquiry suggested that these drivers will continue to place additional pressure on health costs as the population ages and individuals are required to manage chronic and complex illnesses for longer periods. It was noted that the ability to respond to these changing health needs is not reflected in the current model of funding.2 4.5 The Australian Medical Association (AMA) explained that one of the primary drivers of cost is the volume of treatment during episodes of care:
I think what that is referring to is not just the medical costs associated with that care but also the other costs that come into play with an episode of care. An episode of care might be, for instance, a hospital admission, but there are a lot of other services that we now provide for patients, including things like physiotherapy, occupational therapy, the use of a pharmacist and a whole bunch of other allied health professionals. There is an increase in the volume of services that are provided per episode, so it is not just one fee but multiple fees across different providers.3
4.6 Other witnesses also identified that individuals' health needs are becoming more complex. Occupational Therapy Australia suggested that adopting a
1 The Hon Peter Dutton MP, Speech to the Australian Institute of Policy and Science, 15 May 2014, https://www.health.gov.au/internet/ministers/publishing.nsf/Content/D650B8CD02CBEC46CA257CDD000B593F/$File/PDSP140515.pdf, p. 1 (accessed 8 August 2014).
2 See for example, Consumer's Health Forum of Australia, Submission 17.
3 Associate Professor Brian Owler, Committee Hansard, 29 July 2014, p. 26.
50
multidisciplinary approach may assist health professionals to address these complexities more efficiently. A multidisciplinary approach will facilitated improved communication and improve efficiencies as there will be a reduction in duplicating delivery of health care services.4 4.7 Witnesses identified reforms to the PBS as a mechanism to reduce overall expenditure in health. The Grattan Institute proposed a number of budget saving initiatives that it considers should be pursued as alternatives to increasing the PBS co-payment, including establishing an independent expert pharmaceutical pricing authority. Dr Stephen Duckett, Director, Health Program suggested that $580 million could be saved annually if the cost of Australian pharmaceuticals was benchmarked internationally. Further to this, Dr Duckett suggested that the government should consider a one-off price cut on all generic drugs.5 4.8 The committee is aware that price disclosure is a routine part of maintaining PBS listings for medicines where more than one brand has been listed. The objective of the policy is to ensure that PBS prices for these brands more closely reflect the prices in the market. Where discounting is occurring as a result of competition, price disclosure progressively reduces the price of PBS medicines and ensures better value for money. The Government requires pharmaceutical companies to provide information relating to the sales of brands subject to price disclosure. This information is then used to determine the PBS price.6 4.9 The Consumers Health Forum (CHF) recommended the acceleration of price disclosure measures to reduce the cost of pharmaceuticals. CHF advised that pharmaceutical prices are currently checked every 12 months and there would be benefits if this timeframe was reduced and prices were checked more frequently.7 4.10 Officials from the Department of Health explained that 326 drugs are currently subject to price disclosure calculations. Since price disclosure began in 2007, approximately 50 per cent of drugs have reduced in price. Under simplified price disclosure (the new price disclosure process8) the calculation is undertaken after six months of data instead of 12 months. Following the most recent price review, 95 drugs will reduce in price.9 4.11 The Pharmacy Guild of Australia (the Pharmacy Guild) also expressed support for price disclosure as an 'appropriate mechanism to ensure that prices paid for
4 Mr Peter Bothams, Committee Hansard, 29 July 2014, p. 39.
5 Dr Stephen Duckett, Committee Hansard, 29 July 2014, p. 29.
6 Department of Health, Simplified Price Disclosure (SPD) Frequently Asked Questions, updated June 2014, accessible at: http://www.pbs.gov.au/industry/pricing/price-disclosure-spd/updated-faq-simplified-price-disclosure.pdf (accessed 7 August 2014).
7 Ms Priyani Rai, Committee Hansard, 29 July 2014, p. 7.
8 Simplified price disclosure streamlines price disclosure processes and allows PBS prices to be adjusted to market prices more quickly. The first price reduction under simplified price disclosure will occur on 1 October 2014.
9 Ms Felicity McNeill, Committee Hansard, 29 July 2014, p. 70.
51
PBS medicines reflect the competition in the market for those medicines' and that expenditure on the PBS is now well contained as a result of price disclosure.10 However, the Guild noted that price disclosure is lowering remuneration levels for community pharmacies which may limit the range of services that can be provided by these pharmacies.11
Access to comprehensive health data 4.12 The committee notes that an accurate understanding of the drivers of costs in the healthcare system is dependent on the availability of reliable health data. The committee notes advice received throughout the inquiry from a range of witnesses that various data sets are either not routinely collected, unavailable at the level of detail requested or unreliable due to the data collection methodology. 4.13 The committee recognises the value of drawing data from different sectors of the health system together in order to develop a comprehensive understanding of the interactions between health services as well as trends across different sectors of the community. 4.14 The committee asked the Australian Institute of Health and Welfare about the information that could be made available if MBS and PBS data was analysed together. Representatives from the AIHW told the committee that:
The legislation as currently written precludes the linkage by a Commonwealth agency of MBS and PBS data, so we are currently doing a range of work where we can link the two. You can link Medicare data to a group of people and separately you can link PBS data to that group of people but we as a Commonwealth agency cannot actually bring those two together.12
4.15 The committee discussed this further with the Department of Health and was advised that such analysis was not currently possible due to the legislative restrictions in place that prohibited sharing of each of these data sets.
There are specific prohibitions on Medicare data, MBS data, being linked with PBS data. That is within the health portfolio. There are rules set by the Privacy Commissioner about the terms under which it can be done, how long it can be kept, and how it has to be destroyed. Tax data is surrounded by a whole raft of its own secrecy provisions. It is collected under very strict conditions, and one of those very strict conditions is very tight restraints on how it can be used to inform other things. So there is no routine way we could seek to link those datasets.13
4.16 The committee notes that some broad level data is publicly available on the Department of Human Services website relating to particular areas of the health
10 Pharmacy Guild of Australia, Submission 41, p. 5.
11 Pharmacy Guild of Australia, Submission 41, p. 9.
12 Ms Justine Boland, Committee Hansard, 29 July 2014, p. 48.
13 Mr Richard Bartlett, Committee Hansard, 29 July 2014, p. 61.
52
system. While this data enables interested parties to gain a general understanding of health services activity, the information is not available at a sufficient level of detail to facilitate analysis and evaluation. 4.17 The committee notes the Australian Healthcare and Hospitals Association (AHHA) submission that publication of more detailed bulk billing data would support analysis of bulk billing practices at the patient level rather than the service item level. The AHHA noted:
Readily accessible bulk-billing data reflects services (MBS item numbers) and does not give an indication of the number of bulk-billed individuals—data on the proportion of people who are bulk-billed, sometimes bulk-billed and never bulk-billed should be publicly reported so that the impact on out-of-pocket costs can be assessed.
Further detail on the distribution of these groups of people by socio-economic status and by geographic region will also provide a more informative analysis that reliance on existing publicly available data sets which focus on the proportion of service items that are bulk-billed.14
4.18 The Department advised the committee that work is currently being undertaken to look at making more data available at a more detailed level.15
Sustainability of the health system 4.19 In its report, the Commission of Audit highlighted projections from the Productivity Commission that suggest Commonwealth Government spending on health will rise from around 4 per cent of GDP in 2011–12 to 7 per cent in 2059–60. The Commission observed that 'health care spending represents the Commonwealth's single largest long-run fiscal challenge, with expenditure on all major health programmes expected to grow strongly to 2023–24 and beyond'.16 4.20 When discussing the proposed co-payments and the healthcare system generally, Government Ministers have reflected on healthcare in Australia and described the system as unsustainable, with particular focus on growth in expenditure on the Medicare Benefits Schedule and the Pharmaceutical Benefits Scheme. The introduction of co-payments has been explained as necessary to increase the sustainability of the health system. 4.21 When discussing the PBS co-payment during Budget Estimates, Assistant Minister for Health, Senator the Hon Fiona Nash noted that over the last 10 years, the PBS has risen by 80 per cent and in order to ensure that the system is sustainable; decisions need to be made now to facilitate sustainability.17
14 Australian Healthcare and Hospitals Association, Submission 43, pp 2-3.
15 Mr Richard Bartlett, Committee Hansard, 29 July 2014, p. 62.
16 National Commission of Audit, Towards responsible government. The report of the National Commission of Audit, Phase One, February 2014, pp 99-100; 111–112.
17 The Hon Senator Fiona Nash, Estimates Hansard, 2 June 2014, p. 45.

53
4.22 The Assistant Minister provided the following evidence about the sustainability of the MBS:
We have gone from a cost of $8 billion for the MBS 10 years ago. In 2007–08, it was $13 billion and it has gone up to a bit over $18½ billion now. It is projected to go to $34 billion. We have got 263 million free services occurring at the moment. That is unsustainable. As has been very clearly pointed out, we have chosen with the co-payment to put in place a change to the system which we believe will make the system sustainable.18
4.23 In proposing the new GP co-payment and the increase to the PBS co-payment, it appears that these measures are intended to alleviate costs associated with these two areas of the health system, with the intended result being a more sustainable health system. 4.24 Several submitters and witnesses also expressed reservations regarding predictions that costs associated with the MBS and the PBS are increasing unsustainably.19 4.25 The AMA told the committee:
There is no evidence that our healthcare system is unsustainable. When we look at the proportion of the federal budget that has been spent on health care, in 2006 it was 18.1 per cent. In the last federal budget it was 16.1 per cent. In fact, it has actually gone down. So, while the overall amount might be going up, it is certainly not out of control. The federal government's proportion of money that they contribute to the overall health spending in Australia is still 41 per cent, and it has been between about 40 and 43 per cent for the past 10 years.20
4.26 Dr Duckett observed that Australia has a very efficient health system: Australia has one of the most efficient health systems in the world. We are below the OECD average in health expenditure and above the OECD average in life expectancy. Although we have increased our spending on health over the last decade or so, we have actually dramatically reduced the death rate from people who die from conditions that the health system might be able to address. When you are looking at sustainability, you look at both how much you spend and what you get for your spending. We have got a very good health system in international terms.21
4.27 The Pharmacy Guild argued that there is overwhelming evidence that current PBS expenditure is sustainable:
18 The Hon Senator Fiona Nash, Committee Hansard, 2 June 2014, p. 64.
19 See for example, Pharmacy Guild of Australia, Submission 41, p. 14.
20 Associate Professor Brian Owler, Committee Hansard, 29 July 2014, p. 23.
21 Dr Stephen Duckett, Committee Hansard, 29 July 2014, p. 33.

54
… and is in fact rising at a rate significantly lower than the rest of the health system due to a combination of price disclosure and strong competition in the community pharmacy sector.22
4.28 Submitters and witnesses emphasised that the Australian healthcare system is generally performing well overall and delivering good health outcomes across a range of areas. At the same time, it was acknowledged that there are areas where significant improvement is required to ensure that everyone is able to access and benefit from the health system. 4.29 Evidence indicated that there would be benefit in undertaking a review of all health services prior to implementing further reforms. Such a holistic review would facilitate a better understanding of the health system overall and the structural changes that may be required to service the community better. This is particularly relevant given the connections and inter-relationships between areas of the health system and the drivers of cost in different areas.
Effectiveness of co-payments to increase sustainability of the health system 4.30 Several submitters and witnesses did not support the view that the introduction of co-payments would ensure the sustainability of the health system. In particular, evidence provided to the committee questioned whether the introduction of a co-payment for GP visits and out-of-hospital pathology and diagnostic imaging was the appropriate mechanism to address any perceived sustainability issues in the healthcare system. 4.31 The committee received evidence that, instead of reducing health system costs, co-payments would create cost and access barriers for those seeking primary health care and therefore inhibit the management and treatment of ongoing chronic conditions. Such barriers would in turn impact on the sustainability of the healthcare system due to the high costs of receiving hospital treatment.23 4.32 Witnesses advocated for a broad review of the healthcare system that would identify areas of reform and develop new and innovative models of health financing and models of care. Such a broad review would analyse possible changes to the health system in the context of their impact on other health services. 4.33 The Australian College of Nurse Practitioners submitted:
Conversely, to identify “real savings” and build sustainability, the health system as a whole needs to be considered. This includes building on the work that has already been done to successfully introduce new models of care that are cost effective, safe and efficacious. Integral to this is a systematic review of healthcare funding to ensure the patient journey, through the system, is streamlined and efficient. Where appropriate, it is
22 Pharmacy Guild of Australia, Submission 41, p. 14.
23 Healthcare Consumers' Association ACT, Submission 66, p. 17.
55
suggested that funding needs to facilitate early intervention and management in the community to avoid unnecessary hospitalisation.24
4.34 Dr Stephen Duckett, Director, Health Program, Grattan Institute, argued that, instead of the focus being on co-payments, the focus of healthcare discussions should be about the problems in the system and how they can be addressed.
It is important that we are fiscally responsible in health care, as in every area of expenditure. But in ensuring our financial rectitude we need to look first to where we can save money without impacting adversely on patients. The budget proposals jump too quickly to a cost-shifting solution when there are cost-saving opportunities that have not been pursued.25
Committee view 4.35 The committee notes that the GP co-payment and the increase to the PBS co-payment have been proposed as a mechanism to address issues affecting the sustainability of the health system. Evidence provided to the inquiry questioned both the appropriateness of these measures as well as the effectiveness of the co-payments to increase the sustainability of the healthcare system. On the basis of this evidence the committee believes that the GP and PBS co-payments are likely to decrease patient access and make the health system less sustainable over the long term. 4.36 The committee recognises that Australia's healthcare system requires reform to both increase the effectiveness of the system and improve health outcomes. The committee notes the evidence recommending that any further changes should be informed by a much broader review of the healthcare system.
24 Australian College of Nurse Practitioners, Submission 70, p. 7.
25 Dr Stephen Duckett, Committee Hansard, 29 July 2014, p. 29.

56
Chapter 5 Private health insurance
Introduction 5.1 The private health insurance industry in Australia comprises 34 private health insurers. At the end of 2012–13, 47 per cent of the Australian population was covered for hospital treatment by a health insurance policy and 54.9 per cent was covered by a general treatment policy. 85.5 per cent of insured persons are insured for both hospital and general treatment policies.1 5.2 This chapter discusses the following term of reference:
(f) the role of private health insurance. 5.3 The majority of the evidence received by the committee with respect to the role of private health insurance related to individuals' out-of-pocket costs associated with private health insurance premiums as well as costs incurred when accessing private health services. The committee also received evidence related to the notion of private health insurers making a contribution to primary healthcare services. 5.4 This chapter will first present the evidence received on the role of private health insurers in primary healthcare and then the evidence received about out-of-pocket costs associated with the private health system.
Private health insurance in primary healthcare 5.5 Private health insurance in Australia covers treatment in private hospitals, treatment in public hospitals as a private patient and treatment by allied health professionals who do not receive a Medicare rebate. Under the Private Health Insurance Act 2007, it is prohibited for private insurers to cover services for which a Medicare benefit is payable. 5.6 Although the 2014–15 Budget did not include specific initiatives relating to the expansion of private health insurance services, the Budget papers did include the following information:
In line with its commitment to reducing red tape, the Australian Government will review the private health insurance regulatory framework to ensure it does not place an unnecessary regulatory burden on providers, while ensuring consumer and health system needs are protected.2
5.7 The committee notes that since the National Commission of Audit released its report, there has been speculation and media commentary about whether the current
1 Private Health Insurance Administration Council, The Operations of Private Health Insurers Annual Report 2012-13, September 2013, p. 20.
2 Department of Health, Budget related paper No. 1.10, 2014-15 Health Portfolio Budget Statements, Private Health, May 2014, p. 119.
58
situation will be amended in such a way to allow private health insurers to expand to cover primary healthcare. 5.8 Submitters were concerned that the entrance of private insurers into primary healthcare would serve to both increase out-of-pocket costs for individuals and facilitate the creation of a 'two-tiered' healthcare system that would significantly disadvantage those without private health insurance.3 5.9 The Australia Institute noted that allowing private health insurers to cover out-of-pocket expenses in primary care may assist those who can afford private health insurance to offset costs but that such a change ' would increase the cost of primary health services and inequality of access to these services as more and more Australians would be likely to delay seeing the doctor'.4 5.10 Professor Stephen Jan told the committee:
Our concern about that is that that potentially leads to cost escalation and in a sense undermines the whole idea of trying to contain costs. When you allow insurers to cover the full cost of the gap then potentially that gap gets bigger and bigger. We know from the US that, when private health insurers are allowed to enter into that area, inevitably there are cost escalations that potentially undermine the whole initiative we are talking about.5
5.11 Submitters cautioned that extending private health insurance into general practice may impact on a doctor's ability to provide services.6 5.12 The National Aboriginal Community Controlled Health Organisation submitted that studies have indicated that Aboriginal and Torres Strait Islander people have a much lower uptake of private health insurance. Any moves to expand the role of private health insurers into the delivery of primary health care services risks further alienation of Aboriginal and Torres Strait Islander people from health care services.7 5.13 The New South Wales Nurses and Midwives' Association submitted:
In terms of the role of private health insurance, local and global evidence shows that the more private health insurance is used to fund health care, the more expensive that health system becomes, without any improvement in the quality of care.8
5.14 The Australian Council of Social Service (ACOSS) also expressed concern about proposals to allow private health insurance into primary healthcare:
3 See for example, Doctors Reform Society of Australia, Submission 26, [p. 4]; Combined Pensioners & Superannuants Association of NSW Inc, Submission 32, p. 3.
4 The Australia Institute, Submission 1, p. 6.
5 Professor Stephen Jan, Committee Hansard, 3 July 2014, p. 3.
6 See for example, Australian Nursing & Midwifery Federation, Submission 50, p. 8.
7 National Aboriginal Community Controlled Health Organisation, Submission 42, p. 4.
8 New South Wales Nurses and Midwives' Association, Submission 68, p. 3.
59
While consumers should be able to access particular models of care, and have choice of provider and practitioner, there are concerns about a model that promotes private health insurance as a way ‘to jump the queue’ and to access timely health care. All Australians should be able to access the care they need, at the time they need it.
Further, ACOSS is particularly concerned about proposals to allow private health insurance into primary healthcare. We are concerned that this will further encourage the emergence of a two tier health system, where those with financial means are able to access the care they need, when they need it, while those without private health insurance will be less able to access appropriate care.9
5.15 The Queensland Aboriginal and Islander Health Council (QAIHC) noted that if private health insurers entered the primary healthcare setting, this would create competition between services and community controlled health organisations such as QAIHC will be unable to compete.
…QAIHC may potentially lose its core functions including our ability to collect, analyse, interpret and report of data and across AICCHS. The amalgamation of community controlled health organisations will result in poorer health outcomes for Aboriginal and Torres Strait Islander people, a loss of employment, a gap in primary health service delivery and more burden on the health care system.10
5.16 The committee received some limited evidence indicating that there may be merit in expanding the role of private health insurance. 5.17 The Royal Australian College of General Practitioners (RACGP) suggested that discussion about the role of private health insurance should be a much broader and separate discussion from out-of-pocket costs. However, the RACGP also noted:
The RACGP believes that, under strictly agreed conditions, there is a possible role for private health insurers to support the delivery of general practice services that are not currently funded by Medicare. The RACGP does not support amendment of the Private Health Insurer Act 2007.11
5.18 On 17 June 2014, the Senate referred the Private Health Insurance Amendment (GP services) Bill 2014 to the Community Affairs Legislation Committee for inquiry and report. This private Senator's Bill seeks to amend the Private Health Insurance Act 2007 to clarify that private health insurers may not enter into arrangements with primary care providers that provide preferential treatment to their members.12
9 Australian Council of Social Service, Submission 61, p. 12.
10 Queensland Aboriginal and Islander Health Council, Submission 58, p. 9.
11 The Royal Australian College of General Practitioners, Submission 20, p. 6.
12 Private Health Insurance Amendment (GP Services) Bill 2014, Explanatory Memorandum, p. 2.
60
Role of private health insurers to reduce out-of-pocket costs 5.19 Submissions received from Medibank Private and Bupa Australia highlighted the important role that private health insurance plays in the Australian healthcare system. Bupa advised that in the 12 month period to March 2014, private health insurers paid more than $16.5 billion in healthcare benefits. In addition:
Further indicative of the significant contribution that PHI makes to the system as a whole, in 2012/13, $7.4 billion in benefits paid were paid by health insurers for treatment in private hospitals and $899 million in benefits were paid for treatment in public hospitals. In 2012/13, private hospitals treated 4 out of every 10 hospital admitted patients, representing 41 per cent of all hospital separations.13
5.20 Other evidence provided to the committee questioned whether private health insurers do play a role in reducing out-of-pocket costs in healthcare for individuals. 5.21 Services for Australian Rural and Remote Allied Health submitted:
The limited availability of private health services in rural and remote Australia directly affects the capacity of private health insurance to assist consumers residing in those settings with their out-of-pocket health costs.14
5.22 The Australian Dental Association (ADA) argued that private health insurance holds a special place in health service delivery that, in the ADA's view, is not warranted.15 5.23 Evidence from ACOSS acknowledged the role of private health insurers in Australia's health system, but emphasised the need to acknowledge that 'private health insurance is increasingly a luxury that cannot be afforded by many households on low incomes'.16 ACOSS also questioned the efficacy of maintaining the private health insurance rebate. This was a view shared by other witnesses to the inquiry.17
Out of pocket costs associated with the private health system 5.24 Submitters and witnesses provided examples of the high out-of-pocket costs incurred when receiving treatment in the private health system and cited occasions when patients reported lack of disclosure about the total out-of-pocket costs that would be incurred. 5.25 Particular reference was made to costs associated with breast cancer treatment18 and circumstances when surgical medical technology is not included on
13 Bupa Australia, Submission 76, pp 5–6.
14 Services for Australian Rural and Remote Allied Health, Submission 34, p. 6.
15 Australian Dental Association, Submission 57, p. 10.
16 Australian Council of Social Service, Submission 61, p. 11.
17 See for example, Australian Council of Social Service, Submission 61, pp 11–12; Ms Annie Butler, Committee Hansard, 29 July 2014, p. 36.
18 Breast Cancer Network Australia, Submission 51, p. 9.
61
the federal government's mandatory reimbursement list known as the Prostheses List.19 5.26 The Breast Cancer Network Australia submitted that women with breast cancer who have treatment in the private health system often incur high out-of-pocket costs. Many women report that they were unaware that their private health insurance would not cover all of the costs associated with their treatment.20 5.27 Cancer Voices Australia submitted that privately insured individuals often report lack of up-front disclosure for the total out-of-pocket costs associated with cancer surgery, drugs and radiotherapy.21 5.28 The committee notes evidence from the Macular Disease Foundation Australia (the Foundation) that many elderly people struggle to maintain their private health insurance but feel compelled to do so to maintain choice and access to treatment. Maintaining access to treatment is becoming increasingly important due to the limited availability of public outpatient treatment for wet macular degeneration. The Foundation explained the frustration experienced when individuals incur out-of-pocket costs for wet macular degeneration treatment provided by an ophthalmologist in the doctor's rooms as they are unable to access their private health insurance to cover this gap. In contrast, if the same treatment was received in a private hospital or day clinic, individual cost is reduced as they are able to access assistance through private health insurance.22 5.29 The committee also received evidence indicating that individuals are experiencing difficulties to meet the out of pocket costs of private health insurance. National Seniors Australia submitted:
Older Australians are committed to maintaining their private health insurance for as long as possible. The main reasons given by the over 50s for purchasing private health insurance are security, protection or peace of mind followed by choice of doctor, private treatment and shorter waiting times for treatment. People on pensions and allowances and lower income earners are more likely to report that they are unable to afford private health insurance.
However, their ability to contribute to the cost of their own health care and decrease the burden on the public health system is under attack due to rising out-of-pocket health costs, capping of Medicare rebates, the phasing out of the Net Medical Expenses Tax Offset, higher proposed thresholds for the Extended Medicare Safety Net and the recently announced changes to the private health insurance rebate.23
19 Mr David Ross, Committee Hansard, 29 July 2014, p. 51.
20 Breast Cancer Network Australia, Submission 51, p. 9.
21 Cancer Voices Australia, Submission 14, p. 3.
22 Macular Disease Foundation Australia, Submission 96, p. 7.
23 National Seniors Australia, Submission 55, pp 11–12.
62
Dental services 5.30 With the exception of a small number of public dental programs and services, dental services are provided almost exclusively by private providers. Individuals accessing these services frequently incur high out-of-pocket costs and many Australians take out private health insurance as a mechanism to reduce out-of-pocket costs. 5.31 The Australian Dental Association (ADA) explained that individuals with private health insurance are often required to pay the difference between the service fee charged and the rebate paid by the private health insurer. According to the ADA, the discrepancy between the fees charged and the level of rebate has increased since 2001.24 5.32 The ADA noted that the increasing gap being paid by way of increasing out-of-pocket costs has an adverse impact on private health insurance members' attendance levels for care.25 Preferred providers 5.33 The committee was advised that approximately 50 per cent of general practice dentists participate in the preferred provider system. 5.34 The ADA submitted that the 'preferred provider' system entered into between private health insurers and providers has a negative impact on out-of-pocket expenses.
The ADA can advise that there are cases where the non-preferred provider's entire fee is less than the rebate offered to the preferred provider patient. Yet, because the out-of-pocket expense is less, staff of the fund promote the preferred provider as being cheaper.26
5.35 Further to this, the ADA argued that the preferred provider system is inequitable because often dentists are refused entry to the system because of the number of dentists in the area that are already preferred providers.27
Ensuring a high level of information disclosure 5.36 Evidence provided to the committee noted the importance of individuals being adequately informed of the costs associated with treatment before it has taken place. 5.37 The committee notes that it may be challenging to ensure that individuals are fully informed of costs associated with their treatment at every stage of the process. However, it is very important that comprehensive information is provided before treatment occurs and that patients are encouraged to seek clarification. 5.38 Professor Peter Brooks explained some of the challenges associated with informed consent because of the perceived power imbalance in the relationship
24 Australian Dental Association, Submission 57, p. 5.
25 Australian Dental Association, Submission 57, p. 6.
26 Australian Dental Association, Submission 57, p. 11.
27 Mrs Eithne Irving, Committee Hansard, 3 July 2014, p. 29.
63
between the patient and the doctor. Even when patients are informed about the out-of-pocket costs, they are often reluctant to ask questions or seek clarification as they fear it may jeopardise or delay their treatment. Professor Brooks emphasised the importance of improving health literacy so that individuals feel more empowered to initiate conversations about treatments and the associated costs.28 5.39 The Department of Health reiterated that it is important for patients to be informed about the costs associated with their treatment but acknowledged that there are challenges:
When you are talking about a single piece of surgery, that can and does happen. But if you are talking about somebody receiving treatment over a period of time for cancer, for example, then you get a whole range of treatments. That is the situation I am talking about where a decision made quite early on about which way to go has significant downstream impacts, many of which no-one can know at the time the decision is made. It is very hard to predict what they will be.29
5.40 The Australian Society of Anaesthetists (ASA) told that committee that health insurers have a responsibility to make patients aware of the details of their health insurance policy, particularly if they do not have a known gap policy. The ASA emphasised that this information should be provided by private health insurers at the outset. Although anaesthetists try to make sure that the information is available to patients, they 'should not be relied upon to be the only source'.30 5.41 Medibank Private and Bupa Australia reiterated the importance that individual policy holders are fully aware of the services covered under their insurance policies. 5.42 Drawing on research undertaken by IPSOS Australia (market research organisation who conduct the IPSOS health care and insurance indicator survey), Medibank private concluded that there are three conditions that contribute to consumers acceptance of out-of-pocket expenses: • communication: that the out-of-pocket cost is communicated; • certainty: limited variation in the out-of-pocket amount originally advised;
and • manageability: consumers need to feel that they can manage the cost
otherwise it will act as a deterrent to accessing healthcare.31 5.43 Catholic Health Australia submitted that more needs to be done to ensure that consumers are informed about the appropriateness of their private health insurance
28 Professor Peter Brooks, Committee Hansard, 3 July 2014, p. 6.
29 Mr Richard Bartlett, Committee Hansard, 3 July 2014, p. 68.
30 Dr Mark Sinclair, Committee Hansard, 3 July 2014, p. 22.
31 Mr James Connors, Committee Hansard, 3 July 2014, p. 36.
64
policy for their life circumstances. Information about the potential out-of-pocket costs should be readily available on an ongoing basis.32 5.44 Bupa Australia argued that increased transparency about hospital and specialist charges is fundamental to consumers having greater access to information:
From our point of view, getting a degree of transparency about how specialists and hospitals charge for things—and making that available to consumers—would be a significant step in the right direction. Given the amount of taxpayer and private health fund money that is tied up in this, we believe that is a completely reasonable ask. Many other organisations are required to divulge these things to the consumer. It would also allow us as an industry to do some of the things that we rightfully have responsibility to do. If transparency were available, we could develop software technology for our members, telling them in advance what the particular products, and the particular doctors they are wanting to see, might mean for them.33
Committee view 5.45 The committee notes the concerns raised by some witnesses about private health insurers making a contribution to primary healthcare services. The committee notes that the Private Health Insurance Amendment (GP services) Bill 2014 has been referred to the Community Affairs Legislation Committee for inquiry and report by 26 August 2014. 5.46 The committee notes the evidence received which cautioned against extending the scope of private health insurance into primary health care. 5.47 The committee accepts that private health insurers already play a significant role in the delivery of health services and contribute to improving health outcomes for the Australian community. 5.48 The committee was concerned to hear personal accounts throughout the inquiry in relation to individuals incurring very high out-of-pocket costs for treatment in the private health system. The committee notes that often payment was required with very little notice given of the costs involved or a limited understanding of the full terms and conditions of their private health insurance policies. 5.49 Given that individuals with private health insurance often face large out of pocket costs and informed financial consent is often inadequate, better mechanisms are required to ensure patients are fully informed about treatment costs, before initial treatment as well as throughout any follow up treatment.
32 Catholic Health Australia, Submission 63, p. 6.
33 Dr Dwayne Crombie, Committee Hansard, 3 July 2014, p. 37.
Chapter 6 Conclusion and recommendations
6.1 This inquiry was established in March 2014 to inquire into out-of-pocket costs in Australian healthcare. The purpose of the inquiry was to investigate growing concerns about the extent of out-of-pocket costs in health and the impact on individuals. Measures announced in the 2014–15 Commonwealth Budget, in particular those relating to patient co-payments and changes to safety nets, have highlighted these concerns further. 6.2 The Australian healthcare system is underpinned by the principle of universal access to healthcare. The Commonwealth Government supports universal access, through the Medicare Benefits Schedule (MBS) and the Pharmaceutical Benefits Scheme (PBS) and other mechanisms such as safety nets, concession cards and subsidised services. 6.3 The committee recognises the need for on-going reform to deliver efficiencies and ensure the sustainability of Australia's health system. As noted in Chapter 2, total health expenditure in Australia in 2011–2012 was estimated to be $140.2 billion. Government funding provided 69.7% of total health expenditure (42.4% Commonwealth government and 27.3% state and territory governments). Non-government sources funded 30.3% of the estimated $140.2 billion spent in 2011–12. 6.4 The committee notes the National Commission of Audit's finding that:
Health care spending represents the Commonwealth's single largest long-run fiscal challenge, with expenditure on all major health programmes expected to grow strongly to 2013–24 and beyond.1
6.5 Factors such as demographic trends, the increasing prevalence of chronic health conditions and the development of new pharmaceuticals and technologies means that it is more likely that this trend will continue. 6.6 The committee notes the Assistant Minister for Health's, Senator the Hon Fiona Nash, statement that over the last 10 years, the cost of the MBS and PBS has risen by 130 per cent and 80 per cent respectively, requiring decisions to be made now to facilitate sustainability.2 6.7 Evidence to this inquiry supports the view that on-going reform of the healthcare system will deliver efficiencies and ensure the system's sustainability. 6.8 As highlighted in Chapter 2, out-of-pocket expenditure by individuals accounted for 57.2 per cent of the estimated non-government funding of health goods and services in 2011–12. The contribution by individuals accounted for 17.3 per cent
1 National Commission of Audit, Towards Responsible Government: The Report of the National Commission of Audit, Phase One, February 2014,p. 95.
2 Senator the Hon Fiona Nash, Committee Hansard, 2 June 2014, p. 64.
66
of the total health expenditure (government and non-government). In 2011–12, individuals spent approximately $24.3 billion on out-of-pocket health expenses. 6.9 Evidence provided to the inquiry suggests that individual out-of-pocket expenditure has been increasing in real terms. Of particular note, individuals appear to be incurring significant out-of-pocket costs for areas of healthcare where there is limited or no relief by way of government or private health insurance rebates. 6.10 In addressing these issues, the challenge is to understand the most appropriate way to contain growth in health spending without undermining what is generally considered to be one of the more efficient health systems in the OECD. 6.11 The Government has said that in order to ensure the sustainability of the healthcare system, attention should focus on two areas of the health system that attract a significant portion of the Commonwealth's health expenditure—the MBS and the PBS. 6.12 The committee cautions against focusing on seeking to reduce expenditure on the MBS and the PBS in isolation. Evidence to the inquiry, though admittedly partial and anecdotal in places, clearly identifies a need to fully interrogate all available data to understand the full range of impacts of current out-of-pocket expenditure on consumer behaviour before introducing broad changes. 6.13 The committee received evidence that existing out-of-pocket health expenses create an environment where individuals already defer medical treatment or filling prescriptions because of financial reasons. Further, evidence suggests that out-of-pocket costs impact disproportionately on individuals with the greatest health needs including Aboriginal and Torres Strait Islander people, people with chronic illnesses and people living in rural and remote areas. 6.14 It is of concern to the committee that out-of-pocket expenses impact so significantly on the most disadvantaged in the community. Personal accounts about the impact of out-of-pocket costs on individuals highlighted the difficult decisions that many in the community are already facing on a regular basis. At the same time, existing safety nets appear not to be providing sufficient support or financial assistance to those that need it most. 6.15 The committee notes the significant financial burden that individuals must bear up front as they incur out-of-pocket costs before qualifying for the safety net. In addition, the committee received evidence that individuals may pay significant out-of-pocket health costs but fail to reach the threshold amount due to the number of health related costs that do not contribute towards the safety net threshold. Co-payments and safety nets 6.16 Evidence to the committee questioned the effectiveness of using price signals to contain expenditure on health care. The committee notes that while measures such as co-payments will deliver revenue and may result in decreased use of services, they are unlikely to deliver efficiencies. The committee notes evidence regarding the indiscriminate impact of co-payments on service delivery and the limited likelihood that the proposed co-payments will provide incentives for greater efficiency and innovation in the delivery of services.
67
6.17 The committee is concerned that broad brush changes such as the proposed introduction of a GP co-payment and adjustments to safety nets, risk significant negative consequences for sectors of the community who are already facing barriers to access healthcare services. These measures also risk increased costs for governments in the longer term as costs are shifted onto other parts of the health. 6.18 The committee acknowledges that this is a complex issue which requires a sophisticated and coordinated response. It is important that there is a comprehensive understanding of the impact of reforms, particularly on the most vulnerable, before implementation, to reduce the risk of unintended consequences and perverse outcomes. 6.19 While the committee notes that Australians may need to continue to accept a reasonable level of out-of-pocket costs, the committee considers it is essential that vulnerable and disadvantaged people are adequately protected from the harshest consequences of such costs. Recommendation 1 6.20 The committee recommends that the Government should not proceed with further co-payments. Recommendation 2 6.21 The committee recommends that the Government undertake a comprehensive review of the impact of existing co-payments on individuals' access to health services and health outcomes. The review should pay particular attention to the impact on the most vulnerable groups in the community. Recommendation 3 6.22 The committee recommends that the Government review the impact and effectiveness of existing safety nets to ensure that current safeguards provide adequate protection to the most vulnerable in the community. Pharmaceuticals price structures 6.23 The committee notes that the PBS co-payment applies to prescription medications that a GP has assessed as being required for their patient's treatment. The committee is concerned about the impact of co-payments on an individuals' adherence to their prescribed medication schedule and emphasises that price signals, such as co-payments, are not an appropriate mechanism to contain the costs of the PBS. 6.24 The committee notes evidence to the inquiry which suggests the potential for greater efficiencies and cost saving in the PBS through a comprehensive review of price structures. Undertaking reforms in this area could consider a review of the PBS to identify areas where efficiencies can be gained. 6.25 The committee notes the effectiveness of price disclosure in pharmaceuticals and suggests that this continue to be supported as an effective mechanism to reduce pharmaceutical costs. The committee also acknowledges the evidence that greater savings may be possible with more regular price reviews.
68
Recommendation 4 6.26 The committee recommends that the Government review the Pharmaceutical Benefits Scheme to identify areas where efficiencies can be gained, with particular reference to the following areas: • current procurement and pricing structures, with particular reference to
examining benchmarking as a mechanism to explore the extent to which savings could be achieved;
• effective monitoring and review of GP prescribing practices to ensure dispensed medications are cost effective and evidence based; and
• evaluation of the prevalence of patient non-adherence to prescribed medication, with particular reference to identifying reasons for non-adherence.
Review of primary health care delivery models 6.27 The committee recognises the valuable role of primary health care in Australia's healthcare system. Primary health care provides the first reference point to respond to health concerns and plays an important role in providing referrals to other areas of the health system. 6.28 Evidence to the inquiry suggests that alternative models of primary health care delivery offer the means to secure the efficiency and innovation necessary to achieve long term sustainability in the sector. The committee notes evidence regarding the potential of multidisciplinary teams to achieve cost saving and better health outcomes by focusing on prevention as well as ongoing management of chronic conditions. 6.29 In the area of primary health care, the committee recognises opportunities for reform in a number of areas:
(a) an examination of models for remuneration of GP services as an alternative to the current fee for service model, including capitation or performance based payments, which may have potential to encourage efficiencies and innovation in healthcare delivery and lead to improved health outcomes;
(b) examination of alternative models of primary healthcare service delivery to assess the benefit of incorporating a more prominent role for allied health professionals.
6.30 The committee notes that by encouraging an environment in which consumers are able to access treatment appropriate to their needs from practice teams comprised of general practitioners and a range of allied health professionals, this may deliver greater long term efficiencies in primary healthcare. In addition, the committee acknowledges the important role of community pharmacies to drive further efficiencies in the system. 6.31 Importantly, such a coordinated approach will assist GPs to have greater capacity to focus attention where it is most needed. An increased focus on
69
preventative health may also foster collaboration between patients and health care professionals and build relationships to improve health literacy.
Recommendation 5 6.32 The committee recommends that the Government review existing models for funding and delivery of primary healthcare with a view to identifying opportunities for improved service delivery and health outcomes. Preventive health measures, health literacy and access to information 6.33 Evidence to the inquiry underscored the key role for preventive health programs in delivering efficiencies in healthcare. The committee notes evidence to the Community Affairs Legislation Committee's inquiry into the Australian National Preventative Health Agency (Abolition) Bill 2014 that emphasised the benefit of preventative health strategies to the overall healthcare system. 6.34 Central to an increased focus on preventative health to improve efficiency is placing the individual at the centre of health care. Improving education and health literacy is fundamental to adopting a patient centred approach. 6.35 The committee notes evidence explaining the difficulties consumers face to make informed decisions about their access to health care due to the significant imbalance in knowledge and information on services and their attendant costs. The committee emphasises the importance of ensuring that consumers are well informed of the cost of treatment before it is provided and throughout the treatment process. The committee supports the position of several witnesses that greater emphasis should be given to increasing health literacy across the community. The committee considers the Government can play a role to facilitate this.
Senator Rachel Siewert Chair

70
Coalition Senators' Dissenting Report 1.1 The Coalition members of the Community Affairs (Legislation) Committee consider that the Chairperson’s inquiry report (“the Report”) does not accurately reflect the breadth and complexity of the issues affecting out of pocket health expenses.
Health Expenditure 1.2 The Report fails to recognise the pressures on the current fiscal environment and the unsustainable growth in health expenditure. The previous Government incurred $123 billion in future deficits. Without policy changes, this debt will reach $667 billion.1 1.3 The Commission of Audit has stated that health care spending is the Commonwealth’s single largest long term budget challenge.2 Ten years ago the Australian Government spent $8 billion on Medicare; in 2014–15 the Australian Government will spend $19 billion. In 10 years' time this expenditure is projected to be more than $34 billion.3 1.4 The Department of Health submitted that in 2011, Australia’s annual real rate of growth of total health expenditure was 4.2 per cent. They stated that this was higher than the average across the OECD, at 3.9 per cent. This placed Australia in the 2nd highest quintile on this measure.4 1.5 It is clear that without reform to health expenditure that the federal budget would not be able to withstand the increased health expenditure.
Out of Pocket Health Expenses 1.6 In regard to out-of-pocket expenses relating to healthcare, the Australian Medical Association submitted:
In the decade to 2012–13, the percentage of medical services attracting out-of-pocket costs has either stayed the same or declined.5
1.7 The Department of Health provided in their submission: [T]he proportion of total health expenditure funded by out-of-pocket payments in 2011–12 (17.3 per cent) was largely unchanged from than in 2001–02 (17.5 percent).6
1 Australian Government 'Budget Strategy Outlook', Budget Paper No. 1, p. 1.
2 National Commission of Audit, Towards responsible government. The report of the National Commission of Audit, Phase One, February 2014, pp 99–100; 111–112.
3 Senator the Hon Fiona Nash, Committee Hansard, 2 June 2014, p. 64.
4 Department of Health, Submission 101, p 25.
5 Australian Medical Association, Submission 72, p.2.
72
1.8 Whilst out-of-pocket expenses have remained relatively stable, there are some changes in the distribution of costs associated with healthcare. The Department of Health stated that:
The largest and fastest-growing area is non-prescription medicines, including complementary medicines. They are nearly one third of the total out-of-pocket costs…
It is also important to note that the discretionary choices that people are making in terms of their health expenditure. Australians in 2007 were spending $4 billion on complementary medicines and therapies.7
1.9 Evidence to the committee clearly highlights that while the total health expenditure funded by out of pocket payments has remained relatively stable over the last decade, there has been significant growth in discretionary spending on non-prescribed complementary medicines, including vitamins and supplements.
International Comparisons 1.10 The Report substantially details evidence of international comparisons made by various submitters to the inquiry. The volume and variance of the evidence presented illustrates the complexity of making international comparisons. The Department of Health cautioned in the hearing against making comparisons between Australia and other OECD countries:
A number of submissions have highlighted the absolute value of out-of-pockets as evidence of issues across the system. The trend over the last couple of years for out-of-pockets as a percentage of total health expenditure is down. It peaking at 19 per cent some years ago; it was 18.3 per cent in 2010–11; and in 2011–12 it was 17.3 per cent. It is lower than the OECD average, and Australia ranks 15 out of 34 of OECD countries for out-of-pockets as a percentage of health expenditure. The absolute dollars in many ways are an indication of the wealth of a society, rather than the appropriateness or inappropriateness of the level of out-of-pockets being charged. The extent to which out-of-pockets are discretionary is highlighted when an analysis of the out-of-pocket data is undertaken. The largest and fastest-growing area is in non-prescription medicines, including complementary medicines. They are nearly one third of the total out-of-pocket costs.8
1.11 In the hearing for the Committee’s inquiry in to National Health Amendment (Pharmaceutical Benefits) Bill 2014, Department of Health officials provided further evidence on the difficulties of international comparisons:
If you read through the OECD report, depending on the country, some things are and are not included in the total. So you can look at one country
6 Department of Health, Submission 101, p 7.
7 Mr Richard Bartlett, Committee Hansard, 3 July 2014, p.63.
8 Mr Richard Bartlett, Committee Hansard, 3 July 2014, p.63.
73
and it says, 'Yes, we include OTCs and other non-discretionary items,' and then you can look at another country and it says, 'These were included and these were not included.' Again, it is about being able to get through the back of all that data. We cannot be specific about whether you are comparing apples and oranges or apples and apples. It does vary between countries.9
1.12 The Department of Health acknowledged that data on expenditure by Australians on complementary medicines and therapies was limited.10
Government Measures addressing out-of-pocket expenses 1.13 The Report fails to acknowledge a number of measures in place designed to ensure that out-of-pocket medical costs are reduced. The MBS is designed to protect vulnerable persons with high out-of-pocket costs. 1.14 Under current rules doctors are paid an incentive fee to bulk-bill (or charge no more than the Medicare rebate) for a GP consultation to concession card holders, or children under 16. This fee is $6. Importantly, a higher bulk-billing incentive is paid to the doctor if the service is provided in a rural or remote location of $9.10 for each consultation. This is specifically designed to ensure that Concession card holders, and children under 16 have their out of pocket costs when visiting a GP minimised.11 1.15 Under the Government’s budget changes, these incentives will still apply if Doctors limit their co-payment charge to only $7, and will be renamed the low-gap incentive payment. 1.16 The Government provides a “safety net” to support more vulnerable patients, to limit the out of pocket costs of those at risk of excessive costs for medical services. Once a family or individual has reached the Extended Medicare Safety Net General threshold, the Government will pay the Medicare benefit and 80% of the out of pocket costs, or the benefit cap, whichever is the lower amount, for eligible out of hospital Medicare Benefit Schedule services for the rest of the calendar year. 1.17 Currently there are multiple Medicare Safety Nets for out of hospital services which help protect patients. From 1 January 2016 a new Medicare Safety Net will simplify existing safety nets for out of hospital services whilst continuing to protect vulnerable patients. The new Medicare Safety Net will have lower thresholds for most people. This may allow some people to qualify for safety net benefits earlier than under current arrangements.12
9 Ms Felicity McNeill, Committee Hansard, 19 August 2014, p.28
10 Mr Richard Bartlett, Committee Hansard, 3 July 2014, p.63
11 Department of Health, Strengthening Medicare, http://www.health.gov.au/internet/budget/publishing.nsf/content/budget2014-factsheet-strengthening-medicare (accessed 21 August 2014).
12 Department of Health, Budget 2014–15, http://budget.gov.au/2014-15/content/glossy/health/download/Health.pdf (accessed 21 August 2014).
74
1.18 Importantly, under the Government’s budget announcement, effectively a second safety net has been introduced for concession card holders, and children under 16. 1.19 In addition to the MBS safety net, concession card holders and children under 16 will only be required to pay the $7 co-payment, for the first 10 visits in any calendar year for either General Practice, out of hospital pathology, and out of hospital diagnostic imaging. After this cap has been reached an incentive will be paid to the practitioner to bulk-bill (or charge no more than the Medicare rebate) for future services.13 1.20 There are some patient groups in the community that are at greater risk than others. The Government provides a “safety net” to support more vulnerable patients, to limit the out of pocket costs of those at risk of excessive medicines costs. Once a patient hits the PBS Safety Net threshold, they have the cost of their PBS medicines reduced. 1.21 For a General patient—on reaching the PBS safety net, will have their PBS patient contribution reduced from $36.90, to $6.00. For Concessional patients—on reaching their PBS safety net will have their PBS patient contribution reduced from $6.00 to free.14 1.22 At present there are 7.6 million Concessional PBS patients in Australia.15 In 2012-13, one in five PBS-subsidised prescriptions dispensed through community pharmacies were supplied free of charge to concessional patients who had reached the safety net.16 1.23 Safety net arrangements will continue to protect very high users of medicines under the Government’s proposed budget changes. 1.24 In the 2014–15 Budget Estimates, the Department of Health stated that they expect the increased PBS co-payment to result in concession card holders paying, on average, an additional $13.60 per year.17
Recommendations 1.25 The Report focuses on changes to co-payments for health expenditure and fails to address the context and reasons for the changes. Additionally, there is little
13 Department of Health, Strengthening Medicare, http://www.health.gov.au/internet/budget/publishing.nsf/content/budget2014-factsheet-strengthening-medicare (accessed 21 August 2014).
14 Department of Human Services, Pharmaceutical Benefits Scheme Safety Net, http://www.humanservices.gov.au/customer/services/medicare/pbs-safety-net (accessed 21 August 2014).
15 Department of Health, Submission to the Inquiry into the National Health Amendment (Pharmaceutical Benefits) Bill 2014, p.5.
16 Department of Health, Submission to the Inquiry into the National Health Amendment (Pharmaceutical Benefits) Bill 2014, p.11.
17 Ms Felicity McNeill, Proof Estimates Hansard, 2 June 2014, p.45
75
analysis of other government support for out-of-pocket expenses beyond GP services and pharmaceuticals. The recommendations provided in the Report focus on a series of reviews that would further delay necessary reforms to health expenditure and further increase the unsustainable burden that growing health costs are having on the federal budget. Analysis, review of evidence and economic modelling were all conducted in preparation for the 2014–15 Budget.
Recommendation 1 1.26 That Coalition members of the Committee recommend that the Senate proceed with health expenditure reforms detailed in the 2014–15 Budget
Senator Zed Seselja Senator Linda Reynolds
Senator Dean Smith

76
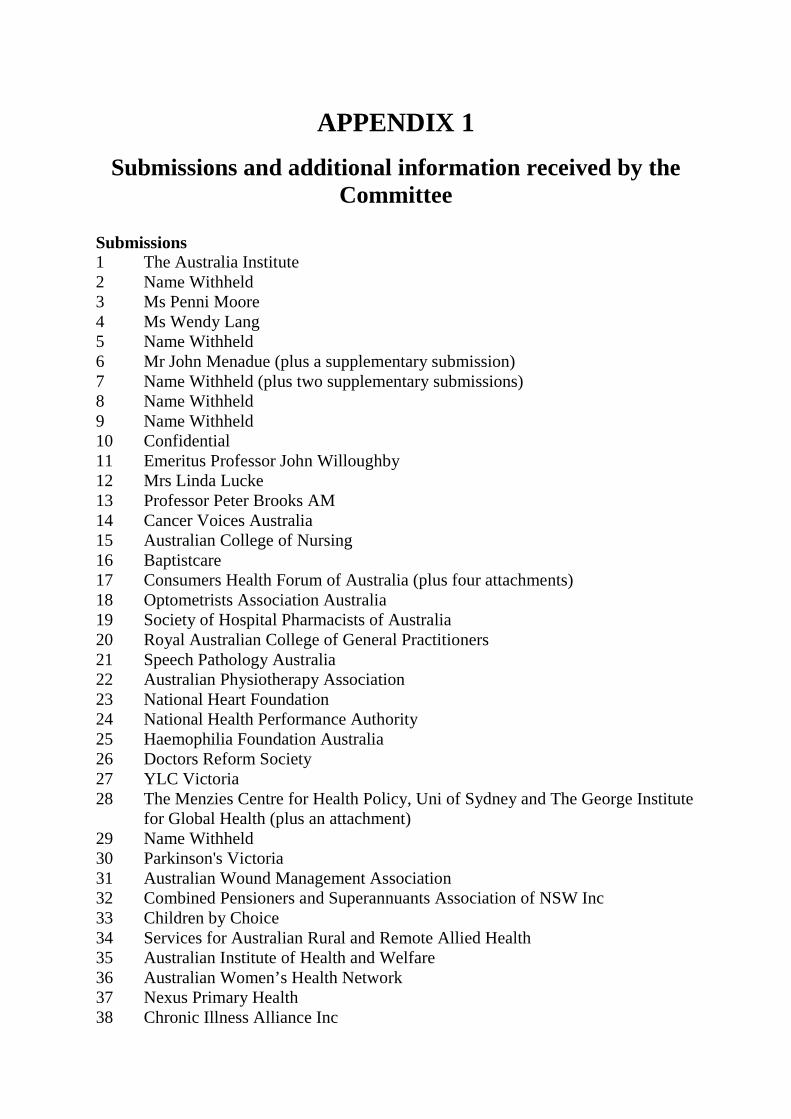
APPENDIX 1 Submissions and additional information received by the
Committee
Submissions 1 The Australia Institute 2 Name Withheld 3 Ms Penni Moore 4 Ms Wendy Lang 5 Name Withheld 6 Mr John Menadue (plus a supplementary submission) 7 Name Withheld (plus two supplementary submissions) 8 Name Withheld 9 Name Withheld 10 Confidential 11 Emeritus Professor John Willoughby 12 Mrs Linda Lucke 13 Professor Peter Brooks AM 14 Cancer Voices Australia 15 Australian College of Nursing 16 Baptistcare 17 Consumers Health Forum of Australia (plus four attachments) 18 Optometrists Association Australia 19 Society of Hospital Pharmacists of Australia 20 Royal Australian College of General Practitioners 21 Speech Pathology Australia 22 Australian Physiotherapy Association 23 National Heart Foundation 24 National Health Performance Authority 25 Haemophilia Foundation Australia 26 Doctors Reform Society 27 YLC Victoria 28 The Menzies Centre for Health Policy, Uni of Sydney and The George Institute
for Global Health (plus an attachment) 29 Name Withheld 30 Parkinson's Victoria 31 Australian Wound Management Association 32 Combined Pensioners and Superannuants Association of NSW Inc 33 Children by Choice 34 Services for Australian Rural and Remote Allied Health 35 Australian Institute of Health and Welfare 36 Australian Women’s Health Network 37 Nexus Primary Health 38 Chronic Illness Alliance Inc
78
39 Victorian Medicare Action Group 40 Multiple Sclerosis Australia 41 Pharmacy Guild of Australia 42 National Aboriginal Community Controlled Health Organisation (plus three
attachments) 43 Australian Healthcare and Hospitals Association (plus a supplementary
submission) 44 Australian Nursing and Midwifery Federation (SA Branch) 45 Australian Diagnostic Imaging Association (plus a supplementary submission) 46 Medical Technology Association of Australia (plus four attachments) 47 Queensland Nurses' Union 48 Australasian Podiatry Council 49 Kidney Health Australia 50 Australian Nursing and Midwifery Federation 51 Breast Cancer Network Australia 52 Cancer Drugs Alliance 53 Australian Psychological Society 54 National Rural Health Alliance 55 National Seniors Australia 56 Carers NSW 57 Australian Dental Association Inc (plus a supplementary submission) 58 Queensland Aboriginal and Islander Health Council 59 Occupational Therapy Australia 60 Australian Society of Anaesthetists 61 Australian Council of Social Service 62 COTA Australia 63 Catholic Health Australia 64 Hepatitis NSW 65 Diabetes Australia 66 Health Care Consumers’ Association ACT Inc (plus three attachments) 67 Tasmanian Council of Social Service and Tasmanian Medicare Action Group 68 New South Wales Nurses and Midwives' Association 69 Carers Queensland Inc 70 Australian College of Nurse Practitioners 71 Palliative Care Australia 72 Australian Medical Association (plus a supplementary submission) 73 Medibank 74 Arthritis Australia (plus a supplementary submission) 75 Department of Health and Human Services, Tasmania 76 Bupa Australia 77 ACT Government 78 Newcastle University Students Association 79 Grattan Institute 80 Australian Healthcare Reform Alliance 81 Spinal Cord Injuries Australia 82 Wellspect HealthCare
79
83 Independent Audiologists Australia Inc 84 Ms Julie Dicker 85 Foundation 97 Limited 86 Name Withheld 87 Royal Australian and New Zealand College of Radiologists 88 Spinal Injuries Australia 89 Royal Rehab 90 NSW Spina Bifida Collaborative 91 Name Withheld 92 Audiology Australia Ltd 93 Victorian Aboriginal Community Controlled Health Organisation 94 Australian College of Midwives 95 Name Withheld 96 Macular Disease Foundation Australia 97 Telethon Speech and Hearing Centre for Children Inc (WA) 98 Professor Emeritus Colin Chapman 99 Australasian College for Emergency Medicine 100 Royal Australasian College of Surgeons 101 Department of Health 102 Name Withheld 103 Ms Kristy Mahoney 104 Associate Professor Pam McGrath 105 Ms Cris Kerr (plus an attachment) 106 Cystic Fibrosis Victoria
80
Additional Information 1 Empty Pockets: Why Co-payments are not the solution, report by Jennifer
Doggett, from Consumers Health Forum of Australia, recieved 16 May 2014. 2 Prescription charges: are they worth it?, British Medical Journal article from
June 2014, tabled by Society of Hospital Pharmacists of Australia, at Melbourne public hearing 3 July 2014
3 Presentation, tabled by Medibank, at Melbourne public hearing 3 July 2014 4 The Cost of Chronis Illnesses for Rural and Regional Victorians, paper by
Christine Walker and Jo-Anne Tamlyn, tabled by Chronic Illness Alliance, at Melbourne public hearing 3 July 2014
5 Position paper: Closing The Gap Pharmaceutical Benefits Schedule Co-payment Measure, by The Pharmacy Guild of Australia, from Society of Hospital Pharmacists of Australia, received 3 July 2014
6 The affordability of prescription medicines in Australia: are copayments and safety net thresholds too high?, Australian Health Review article from 2013, from Society of Hospital Pharmacists of Australia, received 3 July 2014
7 Access to cancer medicines in Australia, by Medicines Australia Oncology Industry Taskforce, July 2013, from Society of Hospital Pharmacists of Australia, received 3 July 2014
8 Medical Adherence in America, A National Report Card, by National Community Pharmacists Association, from Society of Hospital Pharmacists of Australia, received 3 July 2014
9 Barriers to Medication Adherence in Chronic Heart Failure Patients during Home Visits, Journal of Pharmacy Practice and Research research paper from 2010, from Society of Hospital Pharmacists of Australia, received 3 July 2014
10 Interventions for enhancing medication adherence, by The Cochrane Collaboration, from Society of Hospital Pharmacists of Australia, received 3 July 2014
11 A systematic review of interventions to enhance medication adherence in children and adolescents with chronic illness, article from 2010, from Society of Hospital Pharmacists of Australia, received 3 July 2014
12 Concordance, adherence and compliance in medicine taking, report for the National Co-ordinating Centre for NHS Service Delivery and Organisation R and D, from Society of Hospital Pharmacists of Australia, received 3 July 2014
13 Multifaceted Intervention to Improve Medication Adherence and Secondary Prevention Measures After Acute Coronary Syndrome Hospital Discharge, JAMA Internal Medicine article from 2013, from Society of Hospital Pharmacists of Australia, received 3 July 2014
14 Ingredients of Successful Interventions to Improve Medication Adherence, JAMA article from 2013, from Society of Hospital Pharmacists of Australia, received 3 July 2014
15 Pharmaceuticals, pharmacists and profits: a health policy perspective, online editorial from 2014, from Society of Hospital Pharmacists of Australia, received 4 July 2014
81
16 Pharmaceuticals, pharmacists and profits: the Pharmacy Guild perspective, online editorial from 2014, from Society of Hospital Pharmacists of Australia, received 4 July 2014
17 Competition Policy, from Australian Dental Association Inc, received 8 July 2014
18 ACCC Submission on Private Health Insurance, September 2012, from Australian Dental Association Inc, received 8 July 2014
19 ACCC Submission on Private Health Insurance, August 2013, from Australian Dental Association Inc, received 8 July 2014
20 National Dental Update, January 2014, from Australian Dental Association Inc, received 8 July 2014
21 National Dental Update, April 2014, from Australian Dental Association Inc, received 8 July 2014
22 National Dental Update, June 2014, from Australian Dental Association Inc, received 8 July 2014
23 Health Voices publication, April 2014, from Consumers Health Forum of Australia, received 29 July 2014
24 GP co-payment would increase emergency department wait times, The Conversation July 2014, from Consumers Health Forum of Australia, received 29 July 2014
25 How does copayment for health care services affect demand, health and redistribution? A systematic review of the empirical evidence from 1990 to 2011, (Astrid Kiil and Kurt Houlberg) European Journal of Health Economics, September 2012, from Consumers Health Forum of Australia, received 29 July 2014
26 Prescription drug cost sharing. Associations with mediation and medical utilization and spending and health (Dana Goldman, Geoffrey Joyce and Yuhui Zheng) American Medical Association, July 2007, from Consumers Health Forum of Australia, received 29 July 2014
27 The relationship between number of primary health care visits and hospitalisations: evidence from linked clinic and hospital data for remote indigenous Australians (Yuejen Zhao, Jo Wright, Steven Guthridge and Paul Lawton) BMC Health Services Research, November 2013, from Australian Healthcare and Hospitals Association, received 29 July 2014
28 The cost-effectiveness of primary care for Indigenous Australians with diabetes living in remote Northern Territory communities (Susan Thomas, Yuejen Zhao, Steven Guthridge, John Wakerman) Medical Journal of Australia, June 2014, from Australian Healthcare and Hospitals Association, received 29 July 2014
29 Crossing the boundaries: embracing the potential (Debbie Deasey), from Australian Nursing and Midwifery Federation, received 30 July 2014
82
Answers to Questions on Notice 1 Answers to Questions taken on Notice during 3 July public hearing, received
from Society of Hospital Pharmacists of Australia, 3 July 2014 2 Answers to Questions taken on Notice during 3 July public hearing, received
from Australian Society of Anaesthetists, 21 July 2014 3 Answers to Questions taken on Notice during 3 July public hearing, received
from Australian Dental Association, 21 July 2014 4 Answers to Questions taken on Notice during 3 July public hearing, received
from National Aboriginal Community Controlled Health Organisation, 24 July 2014
5 Answers to Questions taken on Notice during 3 July public hearing, received from Department of Health, 6 August 2014
6 Answers to Questions taken on Notice during 3 July public hearing, received from Medibank Private, 18 August 2014
7 Answers to Questions taken on Notice during 29 July public hearing, received from Australian Institute of Health and Welfare, 31 July 2014
8 Answers to Questions taken on Notice during 29 July public hearing, received from Department of Health, 6 August 2014
9 Answers to Questions taken on Notice during 29 July public hearing, received from Grattan Institute, 8 August 2014
10 Answers to Questions taken on Notice during 29 July public hearing, received from Australian Medical Association, 14 August 2014
Correspondence 1 Correspondence from Private Healthcare Australia, received 5 August 2014
APPENDIX 2 Public hearings
Thursday, 3 July 2014
Monash Conference Centre, Melbourne
Witnesses The George Institute for Global Health JAN, Professor Stephen, Professor of Health Economics, University of Sydney BROOKS, Professor Peter Michael, Private capacity Society of Hospital Pharmacists of Australia DOWLING, Mrs Helen, Chief Executive Officer Australian Society of Anaesthetists GRUTZNER, Dr Richard William, President O'DONNELL, Mr Chesney John, Policy Manager SINCLAIR, Dr Mark Fairbridge, Chairman, Economics Advisory Committee Royal Australian College of General Practitioners MARLES, Dr Elizabeth (Liz), President National Rural Health Alliance GREGORY, Mr Gordon, Executive Director PHILLIPS, Mr Andrew, Policy Adviser Australian Dental Association Inc. ALEXANDER, Dr Karin, Federal President IRVING, Mrs Eithne, Policy and Regulation Manager SCALES, Ms Delia Eve, Private capacity Medibank CONNORS, Mr James, Government and Regulatory Affairs Manager O'BRIEN, Mr Dan, General Manager Corporate Affairs Bupa CROMBIE, Dr Dwayne Edward Nicol, Managing Director Health Insurance LONGSHAW, Mr Adam, Director, Health & Benefits Management
84
Cancer Drugs Alliance VINES, Mr Richard, Board Member ZALCBERG, Professor John, Co-chair Chronic Illness Alliance WALKER, Dr Christine, Executive Officer Australian Council of Social Service VASSAROTTI, Ms Rebecca, Deputy Chief Executive Officer Carers Queensland Inc. WALBANK, Ms Sarah, Policy and Research Officer National Aboriginal Community Controlled Health Organisation BRIGGS, Ms Lisa, Chief Executive Officer Victorian Aboriginal Community Controlled Health Organisation GALLAGHER, Ms Jill, Chief Executive Officer KING, Mr Jason B, Chair, and Chief Executive Officer, Victorian Aboriginal Health Service Department of Health BARTLETT, Mr Richard, First Assistant Secretary, Medical Benefits Division CREECH, Mr Paul, Acting First Assistant Secretary, Pharmaceutical Benefits Division
Tuesday, 29 July 2014
Parliament House, Canberra
Witnesses Department of Health BARTLETT, Mr Richard, Acting Deputy Secretary CAHILL, Ms Fifine, Acting First Assistant Secretary, Medical Services Division COTTERELL, Mr Simon, Acting First Assistant Secretary, Portfolio Strategies Division CREECH, Mr Paul, Acting Assistant Secretary, Pharmaceutical Benefits Division CULLEN, Professor David, Chief Economist and Head, Strategic Policy Unit, Portfolio Strategies Division McNEILL, Ms Felicity, First Assistant Secretary, Pharmaceutical Benefits Division
85
Australian Institute of Health and Welfare BOLAND, Ms Justine, Head, Statistics and Communication Group WEBSTER, Dr Adrian, Head, Expenditure and Workforce Unit Occupational Therapy Australia BOTHAMS, Mr Peter, Vice President BROOME, Dr Kieran, Chairperson, Queensland Divisional Council Grattan Institute BREADON, Mr Peter, Health Fellow DUCKETT, Dr Stephen, Director, Health Program Australian Nursing and Midwifery Federation BUTLER, Ms Annie, Assistant Federal Secretary THOMAS, Ms Lee, Federal Secretary JEPSON, Dr Nigel Stuart, Private capacity Australian Healthcare and Hospitals Association McAULIFFE, Mr Andrew, Executive Director Australian Medical Association OWLER, Associate Professor Brian, President TRIMMER, Ms Anne, Secretary-General Consumers Health Forum of Australia RAI, Ms Priyanka , Policy and Communications Officer STANKEVICIUS, Mr Adam, Chief Executive Officer Council on the Ageing (COTA) Australia ROOT, Ms Josephine Mary, National Policy Manager Medical Technology Association of Australia ROSS, Mr David, Director Healthcare Access National Seniors Australia SKINNER, Ms Marie Denise, Senior Policy Adviser Catholic Health Australia TOBIN, Mr Patrick, Director, Policy National Health Performance Authority WATSON, Dr Diane Elizabeth, Chief Executive Officer


