Communication, Con dence and Asset Pricing
166
Communication, Condence and Asset Pricing A DISSERTATION SUBMITTED TO THE FACULTY OF THE GRADUATE SCHOOL OF THE UNIVERSITY OF MINNESOTA BY Chun Xia IN PARTIAL FULFILLMENT OF THE REQUIREMENTS FOR THE DEGREE OF DOCTOR OF PHILOSOPHY JAN WERNER, ADVISOR August 2008
Transcript of Communication, Con dence and Asset Pricing
Communication, Con�dence and Asset Pricing
A DISSERTATION
SUBMITTED TO THE FACULTY OF THE GRADUATE SCHOOL
OF THE UNIVERSITY OF MINNESOTA
BY
Chun Xia
IN PARTIAL FULFILLMENT OF THE REQUIREMENTS
FOR THE DEGREE OF
DOCTOR OF PHILOSOPHY
JAN WERNER, ADVISOR
August 2008

c Chun Xia 2008
All Rights Reserved

i
Acknowledgements
In writing this dissertation I incurred many debts. I am very grateful to the economics
and business faculty at the University of Minnesota for leading me to the fantastic world of
economic, �nance and accounting theories. This work would not have been possible without
the guidance and support of my advisor, Jan Werner. I am enormously indebted to Jan
for his invaluable comments and un agging encouragement, and for his insistence on inde-
pendent thinking and clear writing. Jan's dedication to the scholarly development of his
students is admirable and inspiring. I am especially grateful to the members of my disserta-
tion committee: Beth Allen (chair), Raj Singh, David Rahman, for their intellectual support
and insightful comments. Special thanks are extended to Han Ozsoylev and Yijiang Wang,
for their long term inspiration and enlightenment. I also gratefully acknowledge the partial
�nancial support from National Science Foundation through grant DMI-0217974.
The second chapter of this dissertation has also bene�tted from suggestions by Justin
Barnette, Rui Cao, Murray Frank, Erzo Luttmer, Andy McLennan, Josh Miller, Fabrizio
Perry, Aldo Rustichini, Fernando Vega-Redondo, Itai Sher, Jia Yuan , an anonymous net-
friend and seminar participants at University of Minnesota, University of Hong Kong, and
the 2007 Midwest Finance Association Annual Meeting, and the Fall 2007 Midwest Economic
Theory Meeting for insightful comments.
The third chapter of this dissertation has also bene�tted from comments by Rui Cao, Erzo
Luttmer, Aldo Rustichini, Suhas Saha, Tracy Wang and seminar participants at University
of Minnesota, the Spring 2007 Midwest Economic Theory Meeting, and the 2007 North
American Summer Meeting of the Econometric Society for useful comments. Correspondence
with Simon Gervais and Terrace Odean is very helpful.
Many colleagues and friends provide help and support during various stages of my grad-
uate study. I thank Yan Bai, Camelia Beja, Hui He, Fanchang Huang, Huiyan Qiu, Shino
Takayama, Annie F. Yang, Yuzhe Zhang and many others. I also thank Yao Fan, Yuanyuan
Fan, David Peng, Jian Su, Jue Wang, Hong Wei, with whom I spent much wonderful time.
I am deeply indebted to the unconditional and complete love from my parents who invested
so much in me and inspired me to be a scholar. My sister has been a constant source of support
and encouragement. My mother passed away due to a surgical accident when I was preparing
for second-year preliminary exams. I was fortunate to meet my wife, Yan Cao, in that most
di�cult time, for whom I reserve the utmost gratitude and thanks. She shouldered all the
burden and anxiety for the family while I worked on the dissertation, which would never have
been completed without her love and devotion.
Finally, all remaining errors of any part in this dissertation are, of course, mine alone.

ii
Dedication
To my father, Mingshi Xia, from whom I learned to be a man of honesty and integrity.
To the memory of my mother, Zhihong Zhu, from whom I inherited my passion for science
and arts, and my embrace of love and goodness.
iii
Abstract
Standard rational expectations models assume away direct communication among specu-
lative traders and resort to psychological traits such as traders' overcon�dence in information
processing ability to explain the observed enormous trading activity in �nancial markets. Yet,
a growing literature documents that social communication a�ects individual trading behav-
ior and market trading patterns in �nancial markets, and over- and undercon�dent traders
may coexist. The dissertation thus has two general objectives: (1) to analyze the impact
of social communication on asset pricing, agents' trading behavior and welfare, and (2) to
examine how traders' changing con�dences resulted from communication a�ect asset pricing
and trading behavior.
In Chapter 2 we develop an asset pricing model �a la Kyle (1985) in which agents commu-
nicate information in social networks prior to trading. An agent who is more con�dent in her
private information puts greater weight on her private signal than on signal received through
communication when aggregating her information. The model generates several novel impli-
cations. (1), proximity between agents in networks a�ects correlation of agent demands. (2),
individual agent exploits information and in uences price distinctly in di�erent networks. (3),
under certain circumstances social communication is welfare improving for all agents. (4),
irrespective of di�erent network structures, market trading patterns such as market liquidity,
trading volume, price volatility and informational e�ciency of prices are all higher in the
presence of social communication relative to those in economy where agents exploit private
signals exclusively. (5), market trading patterns are strictly decreasing in (a range of) agents'
con�dence in private signals. Interestingly, social communication can alternatively explain
some intriguing empirical facts such as \gender trading di�erences" which were attributed to
overcon�dence.
In Chapter 3 we develop a multi-period market model to examine the evolution of risk
averse agents' con�dence degrees in learning their abilities to obtain precise information
and the properties of resulting market trading patterns in price volatility, trading volume,
and expected pro�ts. Agents initially do not know their abilities which are related to the
qualities of private signals. They assess abilities from communicating and comparing quality
of their own signals with that of others. Motivated by recent experimental �ndings that
over- and/or undercon�dence in ability are often observed, agents are assumed to credit
(blame) themselves strongly for favorable (unfavorable) outcomes. I demonstrate that under
reasonable circumstances excessive price volatility can be associated with undercon�dence.
This is opposite to the existing results that overcon�dence leads to higher price volatility.
The non-monotonic relation between expected volume and expected pro�ts is established,
and the link between con�dence level and risk aversion is emphasized. The asset supply
uncertainty is shown to be crucial for the new �ndings.

Contents
Contents iv
List of Tables vii
List of Figures viii
1 Speculativing Trading and Volume of Trade 1
1.1 Financial Market Models . . . . . . . . . . . . . . . . . . . . . . . . . . . . . . 5
1.1.1 Competitive Market with Overcon�dent Traders . . . . . . . . . . . . 6
1.1.2 Strategic Market with Overcon�dent Traders . . . . . . . . . . . . . . 11
1.2 Motivation of Dissertation . . . . . . . . . . . . . . . . . . . . . . . . . . . . . 15
1.3 Overview of Dissertation . . . . . . . . . . . . . . . . . . . . . . . . . . . . . . 18
1.A Appendix: Mathematical Preliminaries . . . . . . . . . . . . . . . . . . . . . . 20
1.B Appendix: Proof of Results in Main Text . . . . . . . . . . . . . . . . . . . . 21
2 Communication and Con�dence in Financial Networks 28
2.1 Introduction . . . . . . . . . . . . . . . . . . . . . . . . . . . . . . . . . . . . . 28
2.2 The Basic Framework . . . . . . . . . . . . . . . . . . . . . . . . . . . . . . . 36
2.2.1 The Economy . . . . . . . . . . . . . . . . . . . . . . . . . . . . . . . . 37
2.2.2 Information Communication and Con�dence Degree . . . . . . . . . . 39
2.3 Trading in Circle Network . . . . . . . . . . . . . . . . . . . . . . . . . . . . . 42
2.3.1 Correlation of Demands and Information Utilization . . . . . . . . . . 46
2.3.2 Market Patterns and Expected Pro�t . . . . . . . . . . . . . . . . . . 50
iv
CONTENTS v
2.3.3 Con�dence Change . . . . . . . . . . . . . . . . . . . . . . . . . . . . . 54
2.4 Trading in Star Network . . . . . . . . . . . . . . . . . . . . . . . . . . . . . . 55
2.4.1 Social In uence and Information Utilization . . . . . . . . . . . . . . . 58
2.4.2 Market Patterns and Expected Pro�ts . . . . . . . . . . . . . . . . . . 61
2.4.3 Con�dence Change . . . . . . . . . . . . . . . . . . . . . . . . . . . . . 62
2.5 Communication and Overcon�dence . . . . . . . . . . . . . . . . . . . . . . . 63
2.6 Conclusion . . . . . . . . . . . . . . . . . . . . . . . . . . . . . . . . . . . . . 66
2.A Appendix: Proofs of Main Text Results . . . . . . . . . . . . . . . . . . . . . 67
2.B Appendix: In the Absence of Information Communication . . . . . . . . . . . 92
3 Communicating to Be Over- and Undercon�dence 95
3.1 Introduction . . . . . . . . . . . . . . . . . . . . . . . . . . . . . . . . . . . . . 95
3.2 Literature Review . . . . . . . . . . . . . . . . . . . . . . . . . . . . . . . . . 99
3.2.1 New Experimental Evidence . . . . . . . . . . . . . . . . . . . . . . . . 99
3.2.2 Other Related Literature . . . . . . . . . . . . . . . . . . . . . . . . . 100
3.3 The Economy . . . . . . . . . . . . . . . . . . . . . . . . . . . . . . . . . . . . 102
3.3.1 Preferences and Information Structure . . . . . . . . . . . . . . . . . . 103
3.3.2 Communication and Self-Attribution Bias . . . . . . . . . . . . . . . . 106
3.3.3 Equilibrium . . . . . . . . . . . . . . . . . . . . . . . . . . . . . . . . . 112
3.4 Properties of the Model . . . . . . . . . . . . . . . . . . . . . . . . . . . . . . 116
3.4.1 Individual Con�dence Bias . . . . . . . . . . . . . . . . . . . . . . . . 116
3.4.2 Price Volatility . . . . . . . . . . . . . . . . . . . . . . . . . . . . . . . 118
3.4.3 Trading Volume . . . . . . . . . . . . . . . . . . . . . . . . . . . . . . 123
3.4.4 Expected Pro�ts . . . . . . . . . . . . . . . . . . . . . . . . . . . . . . 130
3.5 Discussion . . . . . . . . . . . . . . . . . . . . . . . . . . . . . . . . . . . . . . 134
3.5.1 The Role of Asset Random Net Supply . . . . . . . . . . . . . . . . . 134
3.5.2 The Role of Information Communication . . . . . . . . . . . . . . . . 135
3.6 Conclusion . . . . . . . . . . . . . . . . . . . . . . . . . . . . . . . . . . . . . 137
3.A Appendix: Proofs of Main Text Results . . . . . . . . . . . . . . . . . . . . . 138

CONTENTS vi
Bibliography 145

List of Tables
3.1 Four Economy Scenarios . . . . . . . . . . . . . . . . . . . . . . . . . . . . . . 115
vii
List of Figures
2.1 Timeline of Events . . . . . . . . . . . . . . . . . . . . . . . . . . . . . . . . . 37
2.2 One-Way Directed Information Transmission between Two Agents . . . . . . 40
2.3 Information Transmission in Circle Network . . . . . . . . . . . . . . . . . . . 43
2.4 Information Transmission in Star Network . . . . . . . . . . . . . . . . . . . . 56
3.1 Timeline of Events . . . . . . . . . . . . . . . . . . . . . . . . . . . . . . . . . 104
3.2 Price Volatilities in Four Economy Scenarios . . . . . . . . . . . . . . . . . . . 121
3.3 Expected Trading Volumes in Four Economy Scenarios . . . . . . . . . . . . . 126
3.4 Decomposed Expected Trading Volumes in Four Economy Scenarios . . . . . 127
3.5 Expected Trading Volumes in the Third Economy Scenario (Only High-Ability
Agents Being Overcon�dent) . . . . . . . . . . . . . . . . . . . . . . . . . . . 129
3.6 Decomposed Expected Trading Volumes with Varing Learning Bias in the
Third Economy Scenario . . . . . . . . . . . . . . . . . . . . . . . . . . . . . . 130
3.7 Expected Trading Pro�ts in Four Economy Scenarios . . . . . . . . . . . . . . 132
3.8 Expected Pro�ts of High-Ability but Overcon�dent Agents in the Third Econ-
omy Scenario . . . . . . . . . . . . . . . . . . . . . . . . . . . . . . . . . . . . 134
viii

Chapter 1
Speculativing Trading and Volume
of Trade
A casual observer of �nancial markets would be amazed by the enormity of volume of assets
traded each day, no matter what the assets are stocks, bonds, currencies or derivatives. The
daily number of shares traded on the NYSE was on average about 500 million in the year
1996, 1.4 billion in the year 2002 and 2.4 billion in the �rst half of 2008.1 Dow and Gorton
(1997) report that one quarter of the value of the annual worldwide trade and investment ow
is traded in the foreign exchange market (including forwards, swaps, and spot transactions)
each day.
What contributes to this enormous trading activity? Explanations for trading volume
include tax-driven trading, liquidity trading, portfolio rebalancing, and speculation. Existing
empirical studies suggest that the magnitude of trading volume can hardly be understood
by the �rst three explanations. Economists tend to focus on speculative trading as being
the major factor accounting for the enormous trading activity. Speculative trading often
stems from disagreement among traders over the relationship between the current available
information of the assets such as prices, earning announcement, and their future performance.
There are several sources of such disagreements. For instance, when traders have dif-
1The data is available at http://www.nyse.com/equities/nyseequities/1022221393023.html
1

CHAPTER 1. SPECULATIVING TRADING AND VOLUME OF TRADE 2
ferent private information regarding the uncertain asset payo�, disagreement can arise that
leads to speculative trading. In particular, rational traders determine their demands based
on expectations about asset payo�, which is conditional on their private information. They
also realize that the market clearing prices convey dispersed private information so they take
into account this fact when forming expectations. Grossman (1976) �rst formalizes this ra-
tional expectation consideration without introducing liquidity trading. However, very soon
the so-called \Grossman-Stiglitz paradox" is reported: In the absence of liquidity trading,
when rational traders have common prior of private information, equilibrium prices are infor-
mationally e�cient in the sense that they are su�cient statistic for all private information,
thus, no trader will condition her demand on her private information. But if traders' demand
is independent of their information, how can prices be informationally e�cient? Moreover,
traders have no incentive to gather costly private information if the su�cient statistic of all
information can be inferred from the prices for free. In other word, there is no trade when
prices can aggregate information e�ciently.2 Grossman and Stiglitz (1980), Hellwig (1980)
introduce liquidity trading (uncertain net supply) to circumvent the paradox.3 Liquidity
trader trade for exogenous reasons and their existence impedes prices to fully aggregate or
convey the private information. These frameworks are labeled competitive rational expectation
models. Kyle (1985) develops a di�erent framework in which traders submit market orders
before they observe the market-clearing prices which is set by a market maker. The presence
of noise trading prevents the market maker to fully infer the traders' information. Hence
trade is generated. This framework is labeled strategic rational expectation model since every
trader has to consider the impact of demands, not only her own but also those of others, on
the prices. Liquidity and noise trading are equivalent and interchangeable in the literature.
This kind of trading is not necessarily irrational. For example, endowment shocks, such as
bequests or emergencies, can be interpreted as noise/liquidity trading motives. Nonetheless,
2This result is closely related to \No-Trade Theorems". The earliest version, proved by Milgrom andStokey (1982), states that if it is common knowledge that all traders are rational and the current allocation isex-ante Pareto e�cient, then new asymmetric information will not lead to trade, provided traders are strictlyrisk averse and hold concordant beliefs. Brunnermeier (2001) gives an excellent account of various no-tradetheorems, pp. 30-37.
3Diamond and Verrecchia (1981) assume that each trader's endowment is random and therefore the averagesupply is also random as long as the number of traders does not go to in�nity.

CHAPTER 1. SPECULATIVING TRADING AND VOLUME OF TRADE 3
attributing the volume phenomenon to liquidity/noise trading as a primary source is unap-
pealing both theoretically and empirically. De Bondt and Thaler (1995) argue that the high
trading volume observed in �nancial markets \is perhaps the single most embarrassing fact
to the standard �nance paradigm". Thus, it is desirable to look for other important reasons
for trading.
Another plausible source of disagreement is that traders receive common information
but they either have di�erent prior beliefs or they di�er in the way in which they interpret
this information, and each trader believes in the validity of her own interpretation. It is
furthermore assumed that these di�erence in beliefs or models for interpreting information
are common knowledge. i.e. traders agree to disagree each other's beliefs or interpretation.
Traders are referred to have \di�erences of opinion". This line of research is motivated
by Varian (1985, 1989). Varian (1989) generalizes Grossman (1976) to allow for di�erent
prior probabilities. Each trader has a subjective prior distribution for a risky asset payo�.
These prior distribution are assumed to be normal but have di�erent means. It is found
that the larger the di�erences of opinion, the larger trading volume is. It is noteworthy that
liquidity/noise trading is not required to generate trade. Harris and Raviv (1993), Kandel
and Pearson (1995) extend this idea by modelling di�erences of opinion in di�erent way that
help explain high levels of trading volume.
Recently, a new motive of trade is highlighted: traders are generally overcon�dent in their
information processing ability in the sense that they tend to overestimate the precision of
their private information and underestimate that of others.4 Therefore overcon�dent traders
trade more intensively relative to rational traders, giving rise to the high level of trading
volume. Daniel, Hirshleifer and Subrahmanyam (1998), Odean (1998), Wang (1998), Gervais
4There are some slightly di�erent de�nitions of overcon�dence in the literature. Technically, overcon�dencerefers to the fact that people are poorly calibrated in that they tend to express con�dence in subjectivejudgement exceeding the objective accuracy. For instance, one study by Fischho�, Solvic and Lichtenstein(1977) shows that events people think are certain to occur actually occur only around 80% of the time, andevents they deem impossible occur approximately 20% of the time. A related observation is that the subjectivecon�dence intervals people assign to their estimates are far too narrow. Lichtenstein, Fischho�, and Phillips(1982) provide a review of the calibration literature documenting overcon�dence. Hoelzl and Rustichini (2005)de�ne overcon�dence as \a majority of people estimates their skills or abilities to be better than the median"or simply call it \better-than-average e�ect". The de�nition I adopt is commonly used in behavioral �nanceliterature.
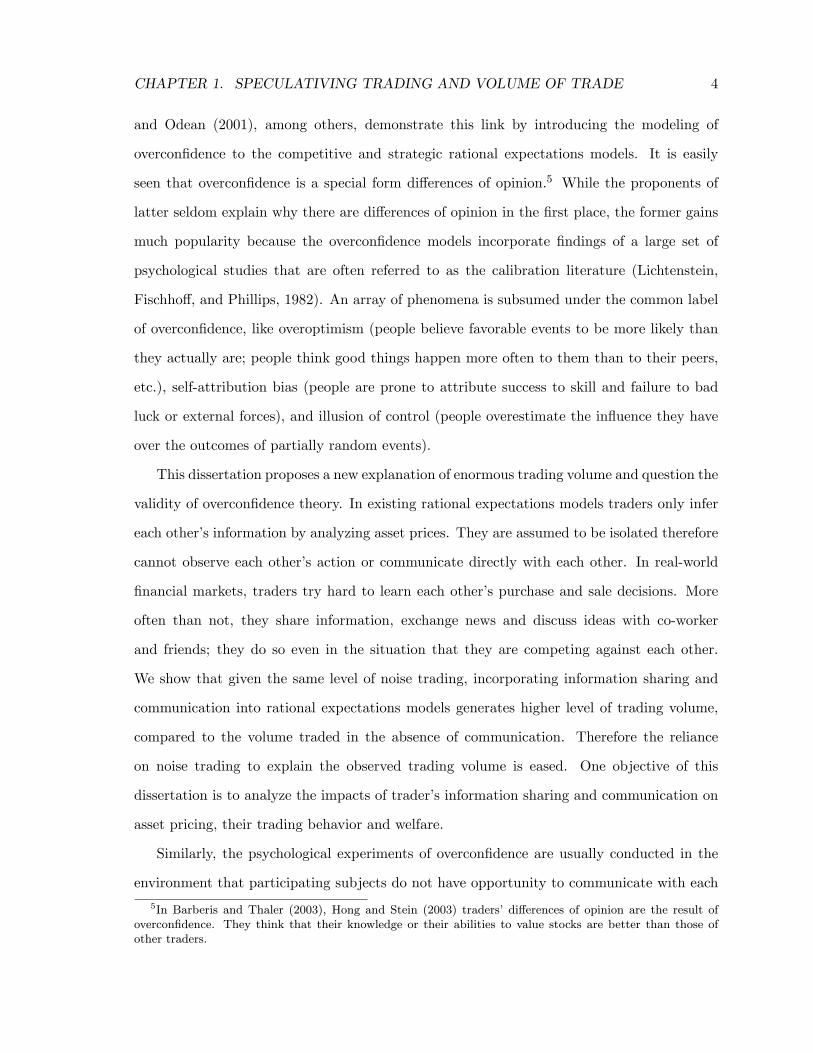
CHAPTER 1. SPECULATIVING TRADING AND VOLUME OF TRADE 4
and Odean (2001), among others, demonstrate this link by introducing the modeling of
overcon�dence to the competitive and strategic rational expectations models. It is easily
seen that overcon�dence is a special form di�erences of opinion.5 While the proponents of
latter seldom explain why there are di�erences of opinion in the �rst place, the former gains
much popularity because the overcon�dence models incorporate �ndings of a large set of
psychological studies that are often referred to as the calibration literature (Lichtenstein,
Fischho�, and Phillips, 1982). An array of phenomena is subsumed under the common label
of overcon�dence, like overoptimism (people believe favorable events to be more likely than
they actually are; people think good things happen more often to them than to their peers,
etc.), self-attribution bias (people are prone to attribute success to skill and failure to bad
luck or external forces), and illusion of control (people overestimate the in uence they have
over the outcomes of partially random events).
This dissertation proposes a new explanation of enormous trading volume and question the
validity of overcon�dence theory. In existing rational expectations models traders only infer
each other's information by analyzing asset prices. They are assumed to be isolated therefore
cannot observe each other's action or communicate directly with each other. In real-world
�nancial markets, traders try hard to learn each other's purchase and sale decisions. More
often than not, they share information, exchange news and discuss ideas with co-worker
and friends; they do so even in the situation that they are competing against each other.
We show that given the same level of noise trading, incorporating information sharing and
communication into rational expectations models generates higher level of trading volume,
compared to the volume traded in the absence of communication. Therefore the reliance
on noise trading to explain the observed trading volume is eased. One objective of this
dissertation is to analyze the impacts of trader's information sharing and communication on
asset pricing, their trading behavior and welfare.
Similarly, the psychological experiments of overcon�dence are usually conducted in the
environment that participating subjects do not have opportunity to communicate with each
5In Barberis and Thaler (2003), Hong and Stein (2003) traders' di�erences of opinion are the result ofovercon�dence. They think that their knowledge or their abilities to value stocks are better than those ofother traders.

CHAPTER 1. SPECULATIVING TRADING AND VOLUME OF TRADE 5
other. In such circumstance, when assessing ability individual might credit (blame) him-
self too much (too less) for successful (unfavorable) outcomes, thus becoming overcon�dent.
However, in reality people not only just learn abilities from their own experiences, but also
learn abilities from comparing their own successes and failures with each other through infor-
mation sharing and communication. Their overcon�dence could be lessened, and it is even
possible that some turn to be undercon�dent. Actually recent new designed psychological
and economic experiments have revealed that over- and undercon�dent subjects are often
observed. As mentioned before, traders frequently share information in �nancial markets,
and some relevant information can impact traders' belief regarding information-processing
ability. It is problematic to assume that traders are generally overcon�dent. This leads us to
the second objective of this dissertation: to examine how communicating traders' changing
con�dences a�ect asset pricing and trading behavior.
Before embarking on the formal analysis, we use this introductory chapter to give an
overview of rational expectations theory, overcon�dence theory and their application to �-
nancial markets. Using two workhorses of �nancial market models, similar to the ones used in
Chapters 2 and 3, we demonstrate that overcon�dent traders determine their demands based
on their own interpretation of information quality and the information contents of prices. The
resulting trading volume is indeed higher than what is generated by rational traders. Next,
we discuss some shortcomings associated with the application of rational expectations and
overcon�dence concept to �nancial markets, which motivate the dissertation. We conclude
by providing an overview of the essays in the dissertation.
1.1 Financial Market Models
In this section we present the competitive and strategic rational expectations models in de-
tails. The most widely used frameworks are developed by Hellwig (1980) and Kyle (1985)
respectively. It is evident that these models di�er in several dimensions. For instance, in
competitive models, all traders take the prices as given, they submit limit order and market
clearing mechanism determines the equilibrium prices; whereas in strategic models, traders
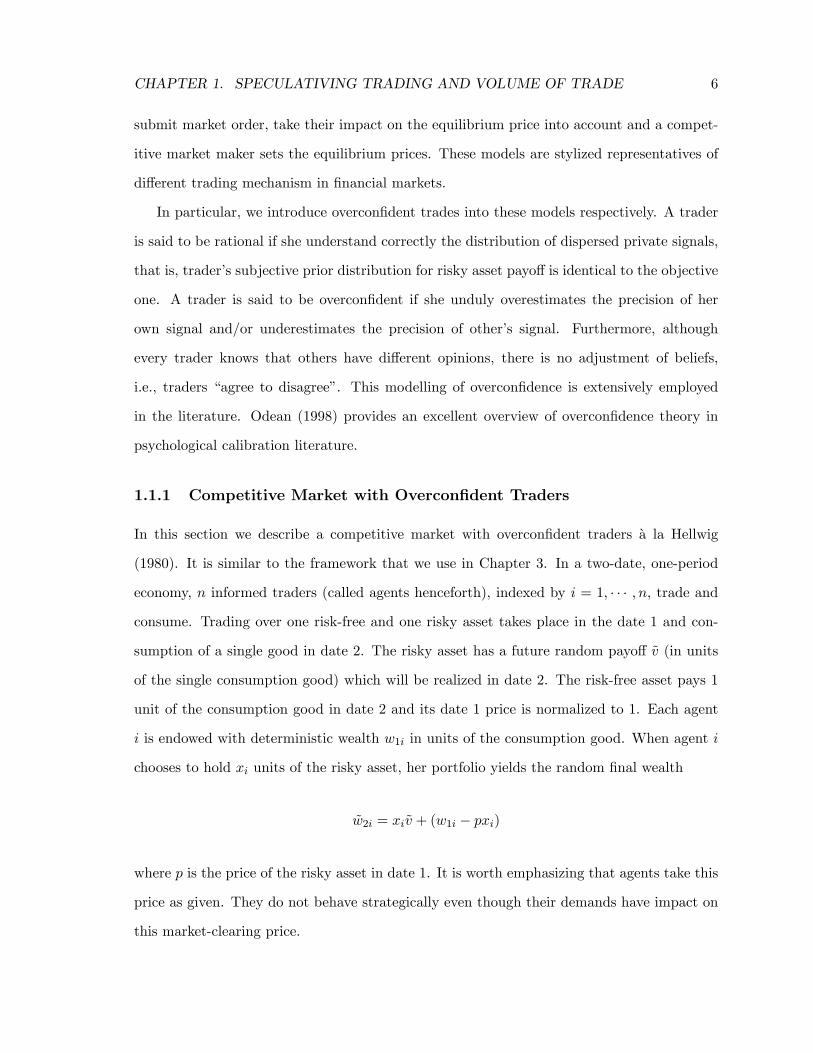
CHAPTER 1. SPECULATIVING TRADING AND VOLUME OF TRADE 6
submit market order, take their impact on the equilibrium price into account and a compet-
itive market maker sets the equilibrium prices. These models are stylized representatives of
di�erent trading mechanism in �nancial markets.
In particular, we introduce overcon�dent trades into these models respectively. A trader
is said to be rational if she understand correctly the distribution of dispersed private signals,
that is, trader's subjective prior distribution for risky asset payo� is identical to the objective
one. A trader is said to be overcon�dent if she unduly overestimates the precision of her
own signal and/or underestimates the precision of other's signal. Furthermore, although
every trader knows that others have di�erent opinions, there is no adjustment of beliefs,
i.e., traders \agree to disagree". This modelling of overcon�dence is extensively employed
in the literature. Odean (1998) provides an excellent overview of overcon�dence theory in
psychological calibration literature.
1.1.1 Competitive Market with Overcon�dent Traders
In this section we describe a competitive market with overcon�dent traders �a la Hellwig
(1980). It is similar to the framework that we use in Chapter 3. In a two-date, one-period
economy, n informed traders (called agents henceforth), indexed by i = 1; � � � ; n, trade and
consume. Trading over one risk-free and one risky asset takes place in the date 1 and con-
sumption of a single good in date 2. The risky asset has a future random payo� ~v (in units
of the single consumption good) which will be realized in date 2. The risk-free asset pays 1
unit of the consumption good in date 2 and its date 1 price is normalized to 1. Each agent
i is endowed with deterministic wealth w1i in units of the consumption good. When agent i
chooses to hold xi units of the risky asset, her portfolio yields the random �nal wealth
~w2i = xi~v + (w1i � pxi)
where p is the price of the risky asset in date 1. It is worth emphasizing that agents take this
price as given. They do not behave strategically even though their demands have impact on
this market-clearing price.

CHAPTER 1. SPECULATIVING TRADING AND VOLUME OF TRADE 7
Agent i has CARA utility function, ui = � exp (� ~w2i), where � 2 (0;1) denotes the
absolute risk aversion coe�cient, which is assumed to be identical for all agents. Agent i
receives a private signal ~si before trading takes place. We assume that ~si = ~v + ~"i where
~v and ~"i are mutually independent and jointly normally distributed. The random vector
(~v;~"1; � � � ;~"n) has the mean (�v; 0; � � � ; 0), and the nonsingular variance-covariance matrix
(�;�; � � � ;�) In+1, where In+1 denotes the (n+ 1) dimensional identity matrix. Setting �v = 0
would greatly simplify the analysis without changing qualitative results. The net supply of
the risky asset, u, coming from noise/liquidity traders, is a realization of random variable
~u which is normally distributed with mean 0 and variance . In addition, ~u is mutually
independent from ~v and ~"i for all i.
Agent i is said to be overcon�dent if she believes that the variance of noise term ~"i is ��
with overcon�dence degree � < 1. In other word, with a smaller �, the precision of noise
term, 1�� , is higher thus the agent is more overcon�dent. Here we simplify the analysis by
assuming that all agents are overcon�dent and � is identical for all. In particular, agent i is
assumed to correctly estimate the precision of ~v; ~u and ~"j for all j 6= i.6 Thus agents have
agreement to disagree over the distribution of private signals. (see Kyle and Wang, 1997).
We suppose that agents know the functional relation between the equilibrium price and
signals, so that
~p = P (~s1; � � � ; ~sn; ~u)
where the function P : Rn ! R delivers the risky asset price for all realizations (s1; � � � ; sn; u)
of (~s1; � � � ; ~sn; ~u). Then each agent i determines her risky asset demand using her expectation
of the risky payo� ~v conditional on the realizations ~si = si and P (~s1; � � � ; ~sn; ~u) = p. Formally,
the equilibrium of this economy is de�ned as follows:
De�nition 1.1 An equilibrium consists of a risky asset price function P (s1; � � � ; sn; u) and
demands fxi (si; p)gi=1;��� ;n such that for all realizations (s1; � � � ; sn; u) of (~s1; � � � ; ~sn; ~u)6Assuming instead that agent i underestimates the precisions of ~v and ~"j (j 6= i) won't a�ect the proposi-
tions.
CHAPTER 1. SPECULATIVING TRADING AND VOLUME OF TRADE 8
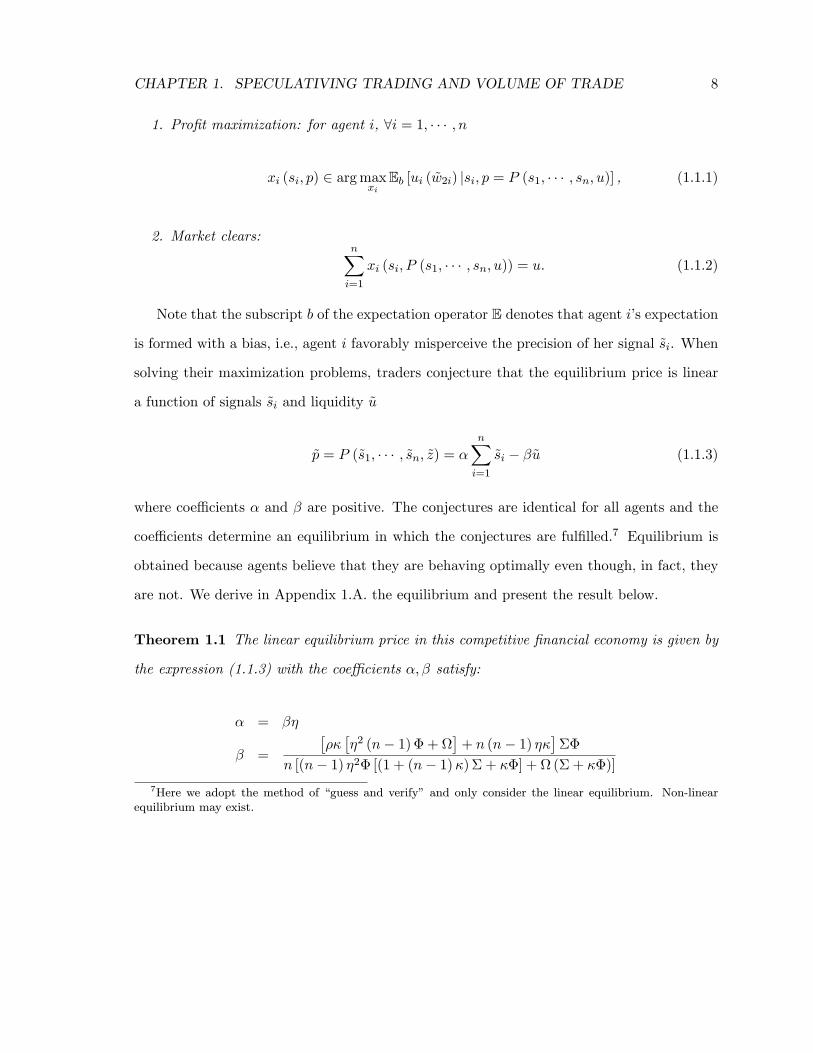
1. Pro�t maximization: for agent i, 8i = 1; � � � ; n
xi (si; p) 2 argmaxxiEb [ui ( ~w2i) jsi; p = P (s1; � � � ; sn; u)] , (1.1.1)
2. Market clears:nXi=1
xi (si; P (s1; � � � ; sn; u)) = u: (1.1.2)
Note that the subscript b of the expectation operator E denotes that agent i's expectation
is formed with a bias, i.e., agent i favorably misperceive the precision of her signal ~si. When
solving their maximization problems, traders conjecture that the equilibrium price is linear
a function of signals ~si and liquidity ~u
~p = P (~s1; � � � ; ~sn; ~z) = �nXi=1
~si � �~u (1.1.3)
where coe�cients � and � are positive. The conjectures are identical for all agents and the
coe�cients determine an equilibrium in which the conjectures are ful�lled.7 Equilibrium is
obtained because agents believe that they are behaving optimally even though, in fact, they
are not. We derive in Appendix 1.A. the equilibrium and present the result below.
Theorem 1.1 The linear equilibrium price in this competitive �nancial economy is given by
the expression (1.1.3) with the coe�cients �; � satisfy:
� = ��
� =
�����2 (n� 1)� +
�+ n (n� 1) ��
���
n [(n� 1) �2� [(1 + (n� 1)�) � + ��] + (� + ��)]7Here we adopt the method of \guess and verify" and only consider the linear equilibrium. Non-linear
equilibrium may exist.

CHAPTER 1. SPECULATIVING TRADING AND VOLUME OF TRADE 9
where � is the real positive root of a cubic equation:8
�� (n� 1)�2�3 + (n� 1) (�� 1)��2 + ���� � = 0 (1.1.4)
The equilibrium demand of agent i is given by
xi (si; p) = �si ��1
n�
�p:
Proof. All proofs are in the Appendix 1.A.
The equilibrium outcome demonstrate that market clearing price only partially convey
the aggregate information to agents. The noise/liquidity trading prevent price to be fully
revealing. When agents observe a high price, they are not certain if it comes from overall
good news or from a high realization of noise/liquidity trading. Based on her own private
signal and the informational content of price, each agent makes demand decision.
Under certain circumstance, �, the real positive root of the cubic equation (1.1.4), is
unique.
Corollary 1.1 The linear equilibrium is unique if any of the following condition is satis�ed:
1. All traders are rational, i.e., � = 1;
2. The number of traders is su�ciently large;
3. There is no uncertainty in asset net supply, i.e., = 0.
In the classic Hellwig (1980) model, it is assumed that all traders are rational and the
number of traders are su�ciently large so that the price-taking assumption is justi�ed. Un-
der these conditions uncertain asset net supply is needed to bypass the \Grossman-Stiglitz
Paradox". very soon we will see that if traders are overcon�dent this paradox will not appear
even in the absence of random liquidity trading.
8The root � has a unique root if
�2�2� (n� 1)�(1� �)2 + 18 (1� �)�� 27�2
�� 4�4�4�32 � 4 (n� 1) (1� �)3
is negative. For a large set of parameters, this is the case. Actually we do not �nd reasonable parameterssuch that this expression is positive.
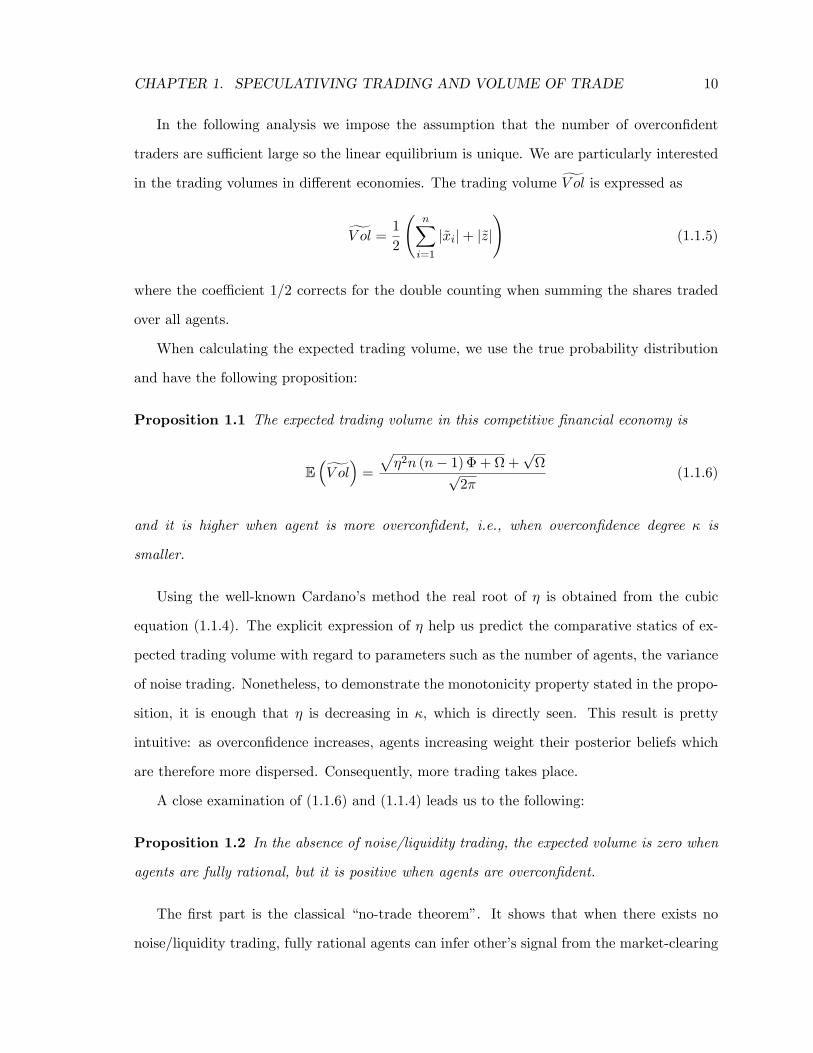
CHAPTER 1. SPECULATIVING TRADING AND VOLUME OF TRADE 10
In the following analysis we impose the assumption that the number of overcon�dent
traders are su�cient large so the linear equilibrium is unique. We are particularly interested
in the trading volumes in di�erent economies. The trading volume gV ol is expressed asgV ol = 1
2
nXi=1
j~xij+ j~zj!
(1.1.5)
where the coe�cient 1=2 corrects for the double counting when summing the shares traded
over all agents.
When calculating the expected trading volume, we use the true probability distribution
and have the following proposition:
Proposition 1.1 The expected trading volume in this competitive �nancial economy is
E�gV ol� = p�2n (n� 1)� + +pp
2�(1.1.6)
and it is higher when agent is more overcon�dent, i.e., when overcon�dence degree � is
smaller.
Using the well-known Cardano's method the real root of � is obtained from the cubic
equation (1.1.4). The explicit expression of � help us predict the comparative statics of ex-
pected trading volume with regard to parameters such as the number of agents, the variance
of noise trading. Nonetheless, to demonstrate the monotonicity property stated in the propo-
sition, it is enough that � is decreasing in �, which is directly seen. This result is pretty
intuitive: as overcon�dence increases, agents increasing weight their posterior beliefs which
are therefore more dispersed. Consequently, more trading takes place.
A close examination of (1.1.6) and (1.1.4) leads us to the following:
Proposition 1.2 In the absence of noise/liquidity trading, the expected volume is zero when
agents are fully rational, but it is positive when agents are overcon�dent.
The �rst part is the classical \no-trade theorem". It shows that when there exists no
noise/liquidity trading, fully rational agents can infer other's signal from the market-clearing

CHAPTER 1. SPECULATIVING TRADING AND VOLUME OF TRADE 11
price. In fact, agents can infer the same information which is the su�cient statistic of all
dispersed private signals. Based on this same information, agents' demand decisions are
identical and no trade can take place. The so-called \Grossman-Stiglitz Paradox" essentially
conveys the same message. It is long held that prices in �nancial markets aggregate informa-
tion e�ciently, but if agents do not trade, how can their information be aggregated into the
price?
It is interesting to note that when agents agree to disagree their interpretation of signal
precision, trading can take place in response to information even when no noise/liquidity
is present. Each agent can still infer the aggregate signal, but each values her portion of
the aggregate di�erently, arrives at a di�erent posterior belief, and is willing to trade. The
\no-trade theorem" is based on the assumption that all agents have concordant beliefs (see
Milgrom and Stokey, 1982) and it is violated when agents overestimate their own signals and
perceive each other's signal either unfavorably or correctly.
Odean (1998) constructs a similar competitive economy in which overcon�dent and myopic
agents trade over two periods. It is shown that even when random liquidity trading is absent,
the expected volume is increasing in agent's overcon�dence degree. Note that this assumption
also guarantees the uniqueness of the linear equilibrium.
1.1.2 Strategic Market with Overcon�dent Traders
In this section we present a version of strategic rational expectation model, also known
as batch auction model, developed by Kyle (1985). We employ the similar framework to
study the social communication among agents in Chapter 2. In a one period asset market
n risk-neutral privately informed agents index by i and uninformed noise traders submit
market orders simultaneously to a risk-neutral market-maker who will set the equilibrium
price. Agents do not observe the realized market clearing price when submitting orders. This
contrasts sharply with the competitive model we study in preceding section. Trading over
one risk-free and one risky asset takes place at date 1, and the risky asset is liquidated and
consumption takes place at date 2. The random payo� of the asset ~v (in units of consumption
good) is normally distributed N (�v;�). We set �v = 0 to simplify notation without a�ecting
CHAPTER 1. SPECULATIVING TRADING AND VOLUME OF TRADE 12
propositions. The risk-free asset pays 1 unit of the consumption good in date 2 and its date
1 price is normalized to 1. Agents are not constrained by wealth, in other word, the initial
wealths of agents play no role in this model. Prior to trading, agent i observes a signal
~si = ~v + ~"i where ~"i is normally and identically distributed N (0;�) for i = 1; � � � ; n. Noise
traders, who trade for idiosyncratic or liquidity reasons exogenous to the model, as a whole
submit random quantity ~u which is normally distributed N (0;). The random variable ~v,
~"i and ~u are assumed to be mutually independent for all i. A competitive market-maker
absorbs the net trade and sets price expecting to earn zero pro�t. The zero-pro�t condition
will be satis�ed if equilibrium price is determined as the outcome of a Bertrand auction for
the order ow between at least two market makers.
As before, agent i is said to be overcon�dent if she believes that the precision of noise
term ~"i is �� with � < 1. We continue to assume that all agents are overcon�dent and � is
identical for all. In particular, agent i is assumed to correctly estimate the precision of ~v and
~"j for all j 6= i. Market maker is fully rational in information distribution. Agent i's trading
strategy is given by a measurable function Xi : R2 ! R, determining her market order as
a function of her private information ~si. For a given strategy, let ~xi = Xi (~si). A strategy
pro�le fX1; � � � ; Xng determines order ow ~! =Pn
i=1 ~xi+~u. Market-maker's pricing strategy
is given by a measurable function P : R ! R. Given (X1; � � � ; Xn; P ), de�ne ~p = P (~!) and
let ~�i = (~v � ~p) ~xi denote the resulting pro�t for agent i.
Agents and market maker behave strategically since each agent takes into account the
fact that her optimal demand, as well as others' purchase or sale decisions, will in uence the
asset price and her pro�t. Market-maker attempts to infer the private information from the
order ow and sets price as e�ciently as possible to protect himself. Both parties understand
the strategies of each other and play accordingly. Noise traders provide camou age for the
agents but create obstacle for the market maker. For instance, when facing a large net order,
market maker is unsure whether it comes from the high demand from informed agents due
to some good news, or just from the high realization of noise trading. As a result, he can
only set a moderate price, compared to the situation in which market maker is certain that
the former is the case. The following equilibrium de�nition summarize the aforementioned
CHAPTER 1. SPECULATIVING TRADING AND VOLUME OF TRADE 13
strategic considerations.
De�nition 1.2 A Bayesian Nash equilibrium consists of agents' trading strategy pro�le
fX1; � � � ; Xng and market-maker's pricing strategy P , such that the following conditions hold:
1. Pro�t maximization: for agent i's any alternative trading strategy X 0i,
Eb (~�ijsi) � Eb
X
0i(si)
"~v � P
Pj 6=i~xj +X
0i(si) + ~u
!#����� si!; (1.1.7)
2. Market semi-strong e�ciency: the pricing strategy P satis�es
P (~!) = E�~v
����~! = nPi=1~xi + ~u
�. (1.1.8)
Note that subscript b only appears in agent's expectation operator. All models follow-
ing Kyle (1985) consider linear trading strategy and linear pricing strategy. Very recently,
Boulatov, Kyle and Livdan (2005) prove that in the single-period trading model of Kyle
(1985), the linear equilibrium is unique within the class of piece-wise continuously di�eren-
tiable functions. In this sense, they show that there does not exist an equilibrium with a
non-linear trading strategy or pricing rule. Huberman and Stanzl (2004) show that the linear
price strategies of the Kyle model do not allow manipulation and also that only linear price
strategies have this property.9
We focus our attention on symmetric linear equilibrium and postulate that agent i's
trading strategy and market-maker's pricing strategy are
X (~si; ~ri) = + �~si, i = 1; � � � ; n, (1.1.9)
P (~!) = � + �~!, (1.1.10)
respectively. We refer to � as \trading intensity parameters" and � as the \market liquid-
ity/depth parameter". A low � means a more liquid (or deeper) market in the sense that the
9In the orginial article of Kyle (1985), he writes in the proof of Theorem 1: \Note that the quadraticobjective (implied by the linear price rule P ) rules out mixed strategy and also makes linear strategies optimaleven when nonlinear strategies are allowed."

CHAPTER 1. SPECULATIVING TRADING AND VOLUME OF TRADE 14
cost of a given trade is low.
Theorem 1.2 There exists a unique symmetric linear equilibrium in the strategic �nancial
economy given by (1.1.9) and (1.1.10) where the parameters are
= 0 (1.1.11)
� =
s
n [� + (2�� 1)�] (1.1.12)
� = 0 (1.1.13)
� =�
(n+ 1)� + 2��
rn [� + (2�� 1)�]
(1.1.14)
The second order condition � > 0 is satis�ed.
The essential properties of this Kyle mode that make it tractable arise from the multivari-
ate normality, which gives linear conditional expectations, and a quadratic objective function,
which has a linear �rst-order condition. Some interesting property of the equilibrium outcome
is evident. For instance, agents' trading intensity is proportional to the standard deviation
of noise trading since any change of noise trading provide camou age for informed agents.
Although market maker realizes that informed agents will increase their trading intensity, he
still cannot distinguish them from noise traders.
As before, we are concerned about the trading volume. In this economy due to the trading
of market-maker, it is de�ned as:10
gV ol = 1
2
�nPi=1j~xij+ j~uj+ j~!j
�(1.1.15)
Again, the coe�cient 1=2 corrects for the double counting when summing trades over all
traders. It turns out that:
10Several existing studies ignore the trading from market-maker so the analysis is incomplete.

CHAPTER 1. SPECULATIVING TRADING AND VOLUME OF TRADE 15
Proposition 1.3 The expected trading volume in this strategic �nancial economy is
E�gV ol� =r
2�
"1 +
sn (� + �)
� + (2�� 1)� +
s(n+ 1)� + 2��
�+ (2�� 1)�
#
and it is higher when agent is more overcon�dent.
Not surprisingly, overcon�dent agents bring forth higher expected trading volume, com-
pared to the economy populated by fully rational agents. Overcon�dent agents overweight
their signals and derives a posterior expectation of the risky asset's payo�, which is further
from the prior than they should. Based on this posterior belief, they trade more aggressively
than is optimal. Even the rational market maker can correct this overreaction to some extent,
he cannot fully negate the intense trading due to the existence of noise trading. As a result,
expected volume increases. By contrast, in the absence of noise trading, the expected trading
volume is zero even if agents are overcon�dent because market maker can infer the aggregate
information thus set price in an appropriate manner, trading is thus prevented.
Proposition 1.4 Expected volume is zero when noise trading does not exist, no matter if
agents are rational or overcon�dent.
Wang (1998) shows the similar result in a multi-period setting. Gervais and Odean
(2001) contributes to this study since in their model, agent's overcon�dence degree is not
�xed. Agent learns her ability from her own trading experience and her con�dence level is
changing according to a biased Bayesian updating rule. Before agent realizes her true ability,
the more overcon�dent she is, the higher the expected volume.
1.2 Motivation of Dissertation
We have seen in preceding section that introducing noise/liquidity trading helps circumvent
the \no-trade theorem" and \Grossman-Stiglitz paradox", but common sense suggests that
ascribing the high levels of trading volume mentioned before solely to noise or liquidity trading
is unsatisfying. Overcon�dence literature has emerged that are able to explain high levels
CHAPTER 1. SPECULATIVING TRADING AND VOLUME OF TRADE 16
of trading volume. In particular, theoretical models predict that overcon�dent agents will
trade more than rational agents, under certain market structure this is even the case when
noise/liquidity trading is assumed away. Empirical studies also suggest that overcon�dence
explanation help account for the �ndings such as men trade more frequently than women as
men is more overcon�dent in their �nance ability (Barber and Odean, 2001).
Before questioning the overcon�dence literature, we �rst noted that some real-world in-
teresting phenomena is overlooked in the standard �nance paradigm. For instance, both
competitive and strategic models assume that agents are making their decision alone. They
might notice that others, who might be their co-worker or close friends, are trading the same
assets, and they try to infer the informational contents of prices, including those of their
friends, but they never share information or communicate with each other.11 Interestingly,
we also �nd that in most experiments that produce supportive evidence of overcon�dence,
participating subjects are not allowed to exchange idea or communicate with each before
making their own choices.
Communication is one of the most fundamental sociological traits of human being and its
impacts on economic behavior have long been recognized by economists and other profession-
als. For example, Shiller and Pound (1989) survey 131 stock market investors and ask them
what prompted their initial interest in their most recent stock purchase or sale. The survey
reveals that it was the discussions with peers for the majority of the investors. Hertz (1998)
provides a study of Shanghai stock market when it was reestablished in 1992. She writes:
\the streets in front of brokerage o�ces were crowded with people, waiting in
line to place, buy and sell orders ... discussing the market with other investors,
gathering information, ... or just enjoying the 'heat and noise'." (p.3.)
Intriguing as these studies have been, they are admittedly just descriptive and leave
many important questions unanswered. In particular, what are the qualitative and quantita-
tive links between social communication and �nancial markets response? Fortunately, very
11To be fair, some existing studies have modelled manipulative or distorted information communication in�nancial markets.
CHAPTER 1. SPECULATIVING TRADING AND VOLUME OF TRADE 17
recently economists have made great progress in demonstrating this quantitative links from
�nancial data. Hong, Kubik, and Stein (2004) test the hypothesis that the decisions of U.S.
households to invest in the stock market or not are in uenced by their social interaction with
neighbors. The data show that those investors whom they characterize as social are about
4% more likely to invest in the stock market than those who they characterize as non-social,
controlling for important background factors such as wealth and education. Their estimate
of the increase in probability of investing for social households is even larger in those states
where proportion of the population investing is the highest. In a di�erent empirical work
(2005), the same authors show that, controlling for what fund managers in other cities are
doing, fund managers are more likely to hold or trade stocks if their neighbors do so. They
�nd that fund managers' holdings of a particular stock as a percentage of their total portfolios
increase by roughly 0.2% when fund managers at di�erent �rms in the same city increase
their holdings in the same stock by 1%. Chapter 2 will provide more detailed review of other
empirical studies that document the communication e�ects in �nancial markets.
Once the prominent role of communication is emphasized, we naturally turn to the reex-
amination of psychological calibration literature. Two observations grab our attention. First,
most experiments supporting overcon�dence are conducted in isolated environment in that
participants cannot talk to each other and share ideas. In real-world, when one faces uncer-
tain task, she can seek advice from peers or elders or search the Internet to �nd answers.
Usually under more experienced guidance, one could rightly interpret her knowledge and abil-
ity. Overcon�dence, even it is possible in some periods, is hardly to persist. Second, di�erent
measures of con�dence degree often generate distinctive results for the same set of data.12 In
other words, agents could be overcon�dent under one measurement or undercon�dent under
di�erent criteria.
Kirchler and Maciejovsky (2002) report that under- and overcon�dence, as well as well-
calibration are often simultaneously observed within the context of an experimental asset
market. Klayman et al. (1999) emphasize that overcon�dence depends on how the exper-
imenter asks his/her questions, what he/she asks, and whom he/she asks. Even in many
12See footnote 3 for di�erent measure methods.

CHAPTER 1. SPECULATIVING TRADING AND VOLUME OF TRADE 18
experiments subjects are asked to compare themselves to an average peer, the lack of direct
comparisons and the ambiguity of comparison targets may lead to biased estimates. Subjects
are mostly overcon�dent because they are free to choose a comparison in a lower rank or at
higher risk. Perlo� and Fetzer (1986) and Hoorens and Buunk (1993) show that the bias is
reduced when the closest friend is used as speci�c target. Alicke et al. (1995) argue that
the reality constraints that are imposed by more direct comparisons diminish the better-
than-average e�ect. In their experiments, they show that by individuating the target and
providing personal contact the magnitude of the e�ect decreases.
Earlier psychological studies do not neglect the possibility of undercon�dence, indeed,
they establish the relationship among overcon�dence, undercon�dence and the di�culty of
the judgement task. Lichtenstein, Fischho� and Phillips (1982) report that overcon�dence for
di�cult questions turns into undercon�dence for easy ones. Interestingly, even this seldom
questioned evidence is counter to recent studies. Hoelzl and Rustichini (2005) report that
choice behavior changes from overcon�dence to undercon�dence when the task changes from
easy and familiar to non-familiar. Cain and Moore (2006) also provide experimental evidence
that people believe themselves to be above average on simple tasks, and below average on
di�cult tasks.
1.3 Overview of Dissertation
The dissertation consists of two self-contained essays. These essays propose new models in
order to achieve two general objectives: (1) to analyze the impacts of social communication on
asset pricing, agents' trading behavior and welfare, and (2) to examine how traders' changing
con�dences resulted from communication a�ect asset pricing and trading behavior.
In Chapter 2 we develop an asset pricing model �a la Kyle (1985) in which agents commu-
nicate information in social networks prior to trading. In particular, an agent who is more
con�dent in her private information puts greater weight on her private signal than on signal
received through communication when aggregating her information. The model generates
several novel implications. First, proximity between agents in networks a�ects correlation of
CHAPTER 1. SPECULATIVING TRADING AND VOLUME OF TRADE 19
agent demands, agreeing with empirical �ndings. Second, individual agent exploits informa-
tion and in uences price distinctly in di�erent networks. Third, risk agents' expected pro�ts
is lowered when they share information, however, social communication is welfare improv-
ing for risk averse agents under certain conditions. Fourth, irrespective of di�erent network
structures, market trading patterns such as market liquidity, trading volume, price volatility
and informational e�ciency of prices are all higher in the presence of social communication
relative to those in economy where agents exploit private signals exclusively. Finally, market
trading patterns are strictly decreasing in (a range of) agents' con�dence in private signals.
Interestingly, social communication can alternatively explain some intriguing empirical facts
such as \gender trading di�erences" which were attributed to overcon�dence. These �nd-
ings have not been previously reported in the literature. In fact, some results are in direct
contrast with existing studies. There are special consideration that we use the framework of
strategic �nancial market model to study the communication e�ects. Introducing information
communication into other setting such as the competitive rational expectation paradigm �a
la Hellwig (1980) will not change the main results of this paper since the driving mechanism
is still applicable. However, in that framework both price and communication convey in-
formation across agents which complicates the analysis of conditional expectation formation
regarding risky asset value. To distinguish the role played by communication from price,
or to make communication a more reliable predicator of asset value compared to price, we
need to unrealistically assume su�ciently large liquidity variance, then variations in price
mainly re ect variations in liquidity rather than variations in information. The advantage of
modelling information communication in Kyle (1985) is evident since agents cannot observe
price when they submit market order, therefore the liquidity/noise trading variance will not
interfere with communication e�ect.
In Chapter 3 we examine the evolution of agents' con�dence degrees in learning their
abilities to obtain precise information and the properties of resulting market trading patterns
in price volatility, trading volume, and expected pro�ts. Agents have two di�erent types,
either of high ability or low ability and they compete against each other in an asset market.
Agents initially do not know their abilities which are related to the qualities of private signals.
CHAPTER 1. SPECULATIVING TRADING AND VOLUME OF TRADE 20
In particular, high ability agents have higher chance to observe signals with higher precision.
After trading in each period, they assess abilities from communicating and comparing quality
of their own signals with that of others. Motivated by recent experimental �ndings that over-
and/or undercon�dence in ability are often observed, agents are assumed to credit (blame)
themselves strongly for favorable (unfavorable) outcomes. For this purpose we develop a
multi-period market model �a la Hellwig (1980) although this study is inspired by Gervais and
Odean (2001) in which a single agent trade and learn in a strategic market with market maker.
Competitive framework is more suitable and tractable to study the trading and learning when
two types of agents coexist. We demonstrate that under reasonable circumstances excessive
price volatility can be associated with undercon�dence. This is opposite to the existing results
that overcon�dence leads to higher price volatility. The asset supply uncertainty (random
noise/liquidity trading) is shown to be crucial for the new �ndings. For instance, when this
uncertainty is removed, market prices are more volatile once agents are more overcon�dent.
This is no longer the case when random asset supply is introduced. We also establish the non-
monotonic relation between expected volume and expected pro�ts, and emphasize the link
between con�dence level and risk aversion. Finally we suggest that some sociological traits of
trading behavior such as direct information communication among agents can alternatively
account for a wide range of empirical �ndings. The dissertation concludes with direction for
future research.
1.A Appendix: Mathematical Preliminaries
Project Theorem Let ~X1 and ~X2 be jointly normally distributed random vectors with
264 ~X1
~X2
375 �N(�;�) where � =264 �1�2
375 and � =
264 �11 �12
�21 �22
375 ;then the conditional distribution of ~X1 given ~X2 = X2 is normal with
~X1jX2 �N��1 +�12�
�122 (X2 � �2) ; �11 ��12�
�122 �21
�
CHAPTER 1. SPECULATIVING TRADING AND VOLUME OF TRADE 21
Statistical Formula Let ~y be a normally distributed random variable and ~y � N (0;�) ;
then
E j~yj =p2�=�:
1.B Appendix: Proof of Results in Main Text
Proof of Theorem 1.1. Given the conjecture (1.1.3), the random vector (~v; ~si; ~p) ;8i =
1; � � � ; n is normally distributed with a mean vector (0; 0; 0) and the variance-covariance
matrix, from the overcon�dent agent i's viewpoint, is
264V11 V12
V21 V22
375 =266664� � n��
� �+ �� n��+ ���
n�� n��+ ��� n2�2�+ (n+ �� 1)�2�+ �2
377775Following normal distribution theory, agent i derives
Eb (~vjsi; p) = V12V�122
0B@sip
1CA� c1si + c2p
varb (~vjsi; p) = V11 � V12V �122 V21
� c3
where
c1 =��2 +���2 (n� 1) (1� �)
(n� 1)�2� [(1 + (n� 1)�) � + ��] + �2 (� + ��)(1.B.1a)
c2 =(n� 1)����
(n� 1)�2� [(1 + (n� 1)�) � + ��] + �2 (� + ��)(1.B.1b)
c3 =���
��2 (n� 1)� + �2
�(n� 1)�2� [(1 + (n� 1)�) � + ��] + �2 (� + ��)
(1.B.1c)

CHAPTER 1. SPECULATIVING TRADING AND VOLUME OF TRADE 22
Solving for agent i's maximization problem (1.1.1) yields
xi (si; p) =Eb (~vjsi; p)� p�varb (~vjsi; p)
=c1si + (c2 � 1) p
�c3
This result, when combined with market clearing condition (1.1.2), delivers
p = P (s1; � � � ; sn; z) =c1Pn
i=1 si � �c3zn (1� c2)
The equilibrium condition (1.1.3) requires that
� =c1
n (1� c2)(1.B.2)
� =�c3
n (1� c2)(1.B.3)
Substituting for �1; �2 and � from (1.B.1a)-(1.B.1c) yields
�
�=
��2 +���2 (n� 1) (1� �)����
��2 (n� 1)� + �2
�=
+����
�2(n� 1) (1� �)
���
����
�2(n� 1)� +
� (1.B.4)
From where we obtain
�
�� � (1.B.5)
where � solves the cubic equation:
�� (n� 1)�2�3 + (n� 1) (�� 1)��2 + ���� � = 0 (1.B.6)
From (1.B.4) and (1.B.5) we get
� =
�����2 (n� 1)� +
�+ n (n� 1) ��
���
n [(n� 1) �2� [(1 + (n� 1)�) � + ��] + (� + ��)]
CHAPTER 1. SPECULATIVING TRADING AND VOLUME OF TRADE 23
Note that the equilibrium demand can be rewritten as
xi (si; p) =c1�c3
si �1� c2�c3
p
=
��
�
�si �
�1
n�
�p.
Next we consider the uniqueness of the linear equilibrium.
A cubic equation is given by
ay3 + by2 + cy + d = 0
where a 6= 0. Every cubic equation with real coe�cients has at least one solution among the
real numbers; this is a consequence of the intermediate value theorem. We can distinguish
several possible cases using the discriminant
� = b2c2 � 4b3d� 4ac3 � 27a2d2 + 18abcd
The following cases need to be considered.
(1) If � > 0, then the equation has three distinct real roots.
(2) If � < 0, then the equation has one real root and a pair of complex conjugate roots.
(3) If � = 0, then (at least) two roots coincide. It may be that the equation has a double
real root and another distinct single real root; alternatively, all three roots coincide yielding a
triple real root. A possible way to decide between these subcases is to compute the resultant
of the cubic and its second derivative: a triple root exists if and only if this resultant vanishes.
For the cubic equation (1.1.4), it is easy to show that the cubic equation (1.1.4) has a
strictly positive real root by the intermediate value theorem.13 The sign of the discriminat
13Letf (�) = �� (n� 1)�2�3 + (n� 1) (�� 1)��2 + ���� � ,
we observe thatf (0) < 0 and f (1) > 0

CHAPTER 1. SPECULATIVING TRADING AND VOLUME OF TRADE 24
is determined by
�2�2� (n� 1)h(1� �)2 + 18 (1� �) �� 27�2
i� 4�4�4�32 � 4 (n� 1) (1� �)3
When this expression is negative, the root is unique.
Proof of Corollary 1.1. For the cubic equation (1.1.4), we have
� =�b2c2 + 18abcd
���4b3d+ 4ac3 + 27a2d2
�where
a = �� (n� 1)�3 > 0
b = (n� 1) (�� 1)� < 0
c = ��� > 0
d = � < 0
so all terms in the �rst and second parentheses are positive.
(1) When � = 1, we have
��=1 = ��4ac3 + 27a2d2
�< 0
and the root of the cubic equation (1.1.4) is unique, and by Cardano's Formula,
� = 3
s
2 (n� 1) ��2
0@ 3
s1 +
r1 +
4
27
�2�
n� 1 �3
s�1 +
r1 +
4
27
�2�
n� 1
1A .(2) When n ! 1, the root is again unique since � is dominated by �4b3d, which is
negative.
CHAPTER 1. SPECULATIVING TRADING AND VOLUME OF TRADE 25
(3) When = 0, the cubic equation becomes
���2�3 + (�� 1) �2 = 0
Due to the strict positivity of the root, the unique solution is
� =1� ����2
.
Proof of Proposition 1.1. We �rst calculate that, using objective probability,
var (~xi) = �2 (� + �) +n�2 (n�+ �) + �2
n2�2� 2��
n�(n�+ �)
=�2 (n� 1)�
n+
n2
We thus have the expected trading volume, using the de�nition (1.1.5) and the statistical
formula:
E�gV ol� =
1p2�
�npvar (~xi) +
p�
=
p�2n (n� 1)� + +
pp
2�
To show that E�gV ol� is higher when � is smaller, when only need to show � is decreasing
in �, and this is obvious due to the cubic equation (1.B.6).
Proof of Proposition 1.2. When noise traders are absent, we have = 0. If all agents are
rational, � = 1, thus � = 0 due to the cubic equation (1.1.4), and expected trading volume is
zero. If agents are overcon�dent, � < 1, then � = (1� �) =���, and
E�gV ol� =
sn (n� 1) (1� �)2
2��2�2�.

CHAPTER 1. SPECULATIVING TRADING AND VOLUME OF TRADE 26
Proof of Theorem 1.2. (1.1.7) means that agent i, taking (1.1.9) with subscript j, for
j 6= i, and (1.1.10) as given, chooses xi to maximize:
Eb
"xi
~v � � � �
Pj 6=i( + �~sj) + xi + ~u
!!����� ~si = si
#
=xi
��si
�+ ��[1� �� (n� 1)]� �xi � (� + � (n� 1))
�,
because
Eb (~vjsi) = Eb (~sj jsi) =�si
�+ ��
The solution to this problem is given by
x�i =� [� + � (n� 1)]
2�+[1� � (n� 1) �] �2� (� + ��)
si.
A equilibrium among agents is found by solving the following equation:
=� [� + � (n� 1)]
2�(1.B.7)
� =[1� � (n� 1) �] �2� (� + ��)
. (1.B.8)
Market maker sets the semi-strong e�cient pricing rule according to (1.1.8), yielding
P =cov (~v;
Pni=1 ( + �~si) + ~u)
var (Pn
i=1 (�+ �~si) + ~u)[~! � n ]
=n��
n2�2�+ n�2�+ [~! � n ]
Equilibrium dictates that
� =�n2 ��
n2�2�+ n�2�+ (1.B.9)
� =n��
n2�2�+ n�2�+ (1.B.10)

CHAPTER 1. SPECULATIVING TRADING AND VOLUME OF TRADE 27
Solving (1.B.7)-(1.B.10) yields unique ; �; � and � as (1.1.11)-(1.1.14) given in the main text.
The second order condition � > 0 is satis�ed.
Proof of Proposition 1.3. The expected trading volume is:
E(gV ol) =1
2E�
nPi=1j~xij+ j~uj+ j~!j
�=
1p2�
hn�p�+ �+
p+
p�2n2�+ n�2�+
i
Substituting for � yields the expected trading volume in the main text. To show that it is
higher when � is smaller, i.e., agents are more overcon�dent, we only need to note that the
last term in the bracket equals
s1 +
n�+ �
�+ (2�� 1)�.

Chapter 2
Communication and Con�dence in
Financial Networks
No man is an island, entire of itself; every man is a piece of the continent, a part
of the main.
||{ Jone Donne, early seventeenth English poet1
2.1 Introduction
Information communication takes various forms in �nancial networks (interchangeably, so-
cial network of traders in �nancial markets) where traders discuss news, share ideas and
learn from each other. The existing literature on asset pricing under asymmetric informa-
tion, inheriting the tradition of classical general equilibrium theory, mainly focuses on the
information aggregation or transmission role played by asset prices and on the resulting trad-
ing patterns under di�erent trading schemes or market arrangements (O'Hara, 1995; Brun-
neimerer, 2001). The social structures where traders directly interact with one another have
been largely unexplored.2 Most times heterogenous traders are assumed to make strategic
decision by monopolistically exploiting their own private information about the fundamental
1Quoted from Meditation XVII in Devotions upon Emergent Occasions.2Indirect social interaction such as information inference from observable actions is the main theme of
social learning theory. Chamley (2004) provides a well-organized introduction to this growing literature.
28

CHAPTER 2. COMMUNICATION AND CONFIDENCE IN NETWORKS 29
value of assets, and they completely ignore word-of-mouth communication and any other
information exchange channels even when they have personal contact with competitors. In
a sense, each trader resides alone in a spatially disconnected island.
A new and burgeoning empirical literature has documented that information communi-
cation in �nancial networks a�ects individual trading behavior and market trading patterns.
The purpose of this paper is to incorporate information communication in di�erent �nancial
networks into strategic rational expectations framework �a la Kyle (1985) and to study its asset
pricing and welfare implications.3 In particular, I propose a framework in which risk neutral
informed traders (henceforth called agents) engage in direct and truthful communication in
an exogenously established social structure, represented by circle or star networks. Simple
as they are, circle and star networks have attracted most attentions by network economists.
For instance, Bala and Goyal (2000) provide theoretical foundation of endogenous network
formation. They show that under certain conditions, agents strategically form either circle
or star network to share the informational bene�ts.4 The novelty of my modelling of commu-
nication is twofold. First, the ow of information transmission prior to trading is one-way
directed and takes a speci�c form. In the circle network, each agent receives a signal, dubbed
network signal, from her closest left side neighbor, and then transmits a linear combination of
her own private signal and this network signal to her closest right side neighbor. In the star
network, in addition to her private signal, one agent receives another signal and entertains a
central position; she similarly transmits a synthetic signal unilaterally to disjointed peripheral
agents. The one-way directed information transmission modelling has the advantages that
3Introducing information communication into other setting such as the competitive rational expectationparadigm �a la Hellwig (1980) will not change the main results of this paper since the driving mechanism is stillapplicable. However, in that framework both price and communication convey information across agents whichcomplicates the analysis of conditional expectation formation regarding risky asset value. To distinguish therole played by communication from price, or to make communication a more reliable predicator of asset valuecompared to price, we need to unrealistically assume su�ciently large liquidity variance, then variations inprice mainly re ect variations in liquidity rather than variations in information. The advantage of modellinginformation communication in Kyle (1985) is evident since agents cannot observe price when they submitmarket order, therefore the liquidity/noise trading variance will not interfere with communication e�ect.
4In Bala and Goyal (2000) social networks are formed by individual decisions that trade o� the costsof forming and maintaining links against the potential rewards from doing so. When an agent's payo� isincreasing in the number of other observable agents including indirect linked agents, and is decreasing in thenumber of directly linked agents, circle network is stable and e�cient with the one-way directed informationtransmission, and so is star network with two-way directed information transmission.
CHAPTER 2. COMMUNICATION AND CONFIDENCE IN NETWORKS 30
it facilitates closed-form solutions of network signal and eases equilibrium analysis. In the
simplest way, the circle network represents the situation in which information is transmitted
symmetrically while the star network captures the asymmetric information communication.5
As a starting point, analysis of these basic networks will further shed light on our understand-
ing of more complicated ones. Second, when forming the linear aggregation of private and
network signals prior to trading, a measure of agent's ex ante con�dence degree of her private
signal is integrated. More precisely, when aggregating and transmitting her information the
agent who is more con�dent in private information puts greater weight on the private signal
than on the network signal received from communication. This modelling is introduced to
capture the �ndings in cognitive psychology that agent tends to believe her private informa-
tion is better than average. It is noteworthy that the information is transmitted truthfully
as no information manipulation or distortion is allowed.6 Even so, in trading equilibrium an
ex post con�dence degree of private signal is selected by agent which might be distinct from
her ex ante one.
One strand of empirical studies focuses on agents' portfolio choice in uenced by their geo-
graphic proximity (Coval and Moskowitz, 1999, 2001; Feng and Seasholes, 2004; Hong, Kubik
and Stein, 2005). This phenomenon is explained either by home bias, local informational ad-
vantage or by word-of-mouth information sharing. My �rst result connects agents' proximity
in �nancial networks to the correlation of their asset demand. Communication creates infor-
mation overlapping among agents. When an agent is closer to her neighbors, the correlation
of their demand is higher, yielding agreement with empirical �ndings. In my model proximity
could be broadly determined by ethnical, cultural and socioeconomic factors, and the same
idea is applicable in other �nancial decisions such as depositors' behavior in bank run (Kelly
and �O Gr�ada, 2000).7
5Here symmetric communication means that each agent receives information from, and transmits informa-tion to, the same number of agents. The more realistic two-way social communication can be regarded eitheras two single one-way directed information transmission with the direction changing in the circle network, oras multiple one-way directed information transmission with the central agent permuted by the peripherals ina rotating manner in the star network. More generally, one-way directed and two-way directed informationtransmissions can coexist in network.
6If agent transmits her information plus an i.i.d. noise term, the main results would not change under mildconditions, that is, the variance of added noise is not large.
7They examine the behavior of Irish depositors in a New York bank during two panics in 1850s. The
CHAPTER 2. COMMUNICATION AND CONFIDENCE IN NETWORKS 31
In the presence of communication, each agent faces richer information about risky asset
value. A natural question arises immediately: how does an agent exploit her own private
signal and the network signal in trading? It turns out that in the circle network each agent
optimally downplays her private signal and relies more on the network signal mainly due to
the fact that the latter is a weighted average of all dispersed private signals and is therefore
more precise than the former regarding asset value. This plus agents' symmetric status
in competition lead to one's favor on the network signal. Interestingly, such information
utilization choice parallels agent's behavior in the so-called \beauty contest" (Keynes, 1936).
In contrast, agent's behavior in the star network is more subtle. Even though each peripheral's
private signal is also less precise than the network signal, one should give priority to the
former in trading when the number of the peripherals is large since the common network
signal received from the central agent is exploited by others; each peripheral's exclusive and
monopolistic signal is more valuable when the competition is very intense. The idea in the
\beauty contest" is only valid when the reverse is true. The central agent's attitude to her
private signal in trading equilibrium exhibits a sharp contrast with her ex ante con�dence in
that signal, in which the more con�dence she has, the more monopoly on that she loses. As
a result she should rely less on her own signal.
Not surprisingly, the impacts of private signal on equilibrium price are distinct in the circle
and star networks. Agents in the circle network in uences, through their private signals, the
equilibrium price in an identical manner. Central agent's private signal in the star network has
greater in uence on equilibrium price because it is exploited by the peripherals too. Trading
behavior in the star network therefore provides an plausible explanation for the often observed
large price swing in �nancial markets without prior signi�cant change in fundamentals.
Despite the dissimilarity of agent's information utilization and social in uence on price
in di�erent networks, I demonstrate that the market trading patterns are similar irrespective
of network structures in that market liquidity, expected trading volume, price volatility and
the informational e�ciency of price, are all higher in communication economies relative to
social network of these recent immigrants, which was largely determined by place of origin in Ireland andneighborhood in New York, turns out to be the prime determinant of behavior.

CHAPTER 2. COMMUNICATION AND CONFIDENCE IN NETWORKS 32
those in the otherwise identical but no communication economies. Communication generates
additional more precise information, agents thus trade more aggressively and on average
trading volume increases. Equilibrium price becomes more volatile as each private signal has
a greater impact on price. The intenser competition lessens the adverse selection faced by
market-maker thus market is more liquid or deeper. At the same time, since more information
is revealed to market-maker who therefore sets price closer to the asset value, as a result price
becomes more informative or more e�cient. These results accord well with the empirical
�ndings of market trading phenomena such as tremendous trading volume and excessive price
volatility. Theoretical work has extensively explored the underlying economic mechanisms.
My information communication explanation is new and complements these studies.
Agents' expected pro�ts are examined to see whether information communication is ben-
e�cial. In the circle network, a bit surprising �nding is that agents' welfare is impaired even
though they gain more precise information. This is mainly because agents lose monopoly on
private signals, and risk neutrality renders the gain in risk assessment less valuable. However,
communication is bene�cial for risk averse agents under some circumstances as they value
more precise information, which dominates the monopoly loss. This trade-o� is reinforced
when the number of agents is small as competition is less intense.8 In the star network, as
predicted, unilateral information transmission leads to welfare improvement for the periph-
erals at the price of the central agent. Unfortunately, the total welfare of informed agents
are lowered.
Last but not the least, I show that in both networks when agent's ex ante con�dence
degree of private signal is high, her ex post con�dence degree is low. In particular, the ef-
fects of high ex ante con�dence degree on signals' relative precision is similar as if agent is
overcon�dent in private signal, i.e., agent mistakenly believes that her private signal is more
precise than others. More signi�cantly, I establish that in both networks market liquidity,
expected trading volume, price volatility and price e�ciency (expected pro�ts) are strictly
decreasing (increasing) in ex ante con�dence degree. These comparative statics are directly
8Note that it is usually easier for agents to form networks in the �rst place when the number of agents issmall.
CHAPTER 2. COMMUNICATION AND CONFIDENCE IN NETWORKS 33
opposite to existing studies in overcon�dence literature which also generates implications ac-
cording well with market trading patterns (Odean, 1998; Wang, 1998; Gervais and Odean,
2001; among others). Moreover, some intriguing empirical facts documented by Barber and
Odean (2001, 2002) that men or online traders on average trade more frequently but less
pro�tably than women or phone-based traders, previously attributed to the former's over-
con�dence tendency, can be alternatively interpreted by the fact that they are more prone
to participate in communication regarding asset information relative to their counterparts.
These �ndings have not been previously reported in the literature; further scrutiny of these
two complementary, but potentially competing explanations is encouraged and welcome.
Other Related Literature. Trading activity is economic as well as sociological. By exam-
ining the network of traders on the oor of the options exchange, Baker (1984) develops a
sociological study of markets and demonstrate that the social structural patterns dramati-
cally a�ected the direction and magnitude of option price volatility. Shiller (2000) provides a
broad and in-depth investigation of world-of-mouth communication among �nancial markets
traders and suggests that these factors, among others, contribute to the \irrational exuber-
ance" of late nineties. In particular, Shiller emphasizes that interpersonal communication is
more in uential in a�ecting investment decision than traditional media.
Nonetheless, only until very recently have economists found actual supporting data.9
Du o and Saez (2002) discover that individual's decision to enroll in particular employer-
sponsored retirement plans and the choice of the mutual fund vendor are a�ected by the
choices of his co-workers. Hong, Kubik, and Stein (2004) reveal that households whom they
characterize as socially active | those who interact with their neighbors, or attend church |
are more likely to invest in the stock markets. Coval and Moskowitz (1999, 2001) demonstrate
that investment managers exhibit preference for locally headquartered �rms and the extent
to which a �rm is held by nearby investors is positively related to its future expected return.
Feng and Seasholes (2004) present that isolated groups of investors in one region of a country
engage in positive correlated trading behavior at a weekly frequency. These studies suggest
9Identifying endogenous social e�ects is plagued by the fact that most individuals' decisions within asocial group may be in uenced by common variables, observed or unobserved, such as taste, background, orenvironmental factors.
CHAPTER 2. COMMUNICATION AND CONFIDENCE IN NETWORKS 34
that investors trade local securities at an informational advantage. Hong, Kubik, and Stein
(2005) show that, even in the absence of local information advantage, a mutual fund manager
is more likely to hold or trade a particular stock in any quarter if other managers from di�erent
fund families located in the same city are holding or trading that stock. Notably, the authors
conclude that:
\One of the main reasons to be interested in the word-of-mouth phenomenon
in the �rst place is the possibility that it might ultimately have nontrivial im-
plications for stock prices. [...] Our �ndings regarding trading behavior do not
by themselves establish a link between word-of-mouth communication and stock
prices. The only hope is that they leave the door open a bit wider than it was
before, and thereby encourage further work on this topic." Hong, Kubik and Stein
(2005, p. 2821-2822)
Fortunately this link is partially built by another strand of empirical studies. The recent
popularity of the Internet chat rooms on �nancial investment as a medium of �nancial markets
discussion, for instance, stock message boards at Yahoo! Finance, attracts a lot of academic
attention. Wysocki (1998) reports that message posting forecast next-day trading volume
and next-day abnormal stock returns. The �rms with high message postings are characterized
by high trading volume. Antweiler and Frank (2004a) �nd that high message posting on a
given day is associated with a small negative return and greater volatility on the next day.
Antweiler and Frank (2004b) consider a much larger database and discover that stocks that
are heavily discussed are particularly heavily traded, unusually volatile, and have surprisingly
poor subsequent returns. My paper contributes to both literature by formally providing
economic mechanism that governs the interaction among information communication, trading
behavior and asset pricing.
Disproportionately, only a few authors develop analytical models to study the e�ects of
information communication in �nancial networks. Ozsoylev (2004) studies the existence and
properties of equilibrium price when social interaction is incorporated into the competitive
rational expectations paradigm �a la Hellwig (1980). On top of the information conveyed

CHAPTER 2. COMMUNICATION AND CONFIDENCE IN NETWORKS 35
through price, each agent infers additional information by observing asset demand of her
one-sided neighbor in the circle, tree or star networks respectively. It is demonstrated that
linear equilibrium price cannot be sustained in circle network, and price taking behavior
may not be justi�ed by a large economy represented by tree or star network.10 Ozsoylev
(2005) allows agents to directly and truthfully share information in social network with very
general structure, in which one-way and two-way directed information transmission may
coexist. He establishes that proximity between agents in network in uence agents' asset
demand correlation, and that communication in network may account for the observed high
volatility ratio of price to fundamentals in �nancial markets. Colla and Mele (2007) develop
a dynamic trading model �a la Kyle (1985) and Foster and Viswanathan (1996). After an
one-shot two-way directed information exchange in the circle network, agents participate in
a sequence of trading; they not only forecast the asset's fundamental value but also forecast
their competitors' forecast. My model generates a number of novel implications regarding
asset pricing and trading behavior, and can be seen as a complement to above analytical
work. Moreover, the modelling of con�dence is a unique feature in my paper, making it
is possible to compare my model with overcon�dence literature which also produces similar
implications consistent with empirical �ndings.11
One-way directed but strategic information communication �a la Kyle (1985) has been
studied intensively in the voluntary disclosure literature, although the social structure among
agents is usually not labeled as star or tree network. Bushman and Indjejikian (1995), and
Shin and Singh (1999) show that an insider can bene�t from disclosing her information
to some extent, which is achieved either by eroding the informational advantages of her
competitors through market-maker's adjusted pricing strategy, or by diluting competitors'
information and regaining monopoly on her additional private signal. Van Bommel (2003)
show that a wealth constrained insider gains by spreading rumor such as \buy or sell" to an
10The former is because every agent forms an expectation on the asset's fundamental value by referringto her very own expectation. The in�nite regress implies no expectation can be formed by any agent so theequilibrium must fail. The latter is due to the fact that the root or central agent's behavior has a larger oreven in�nite impact on equilibrium price.11One-way directed information sharing in circle network is also modelled in Hong and Stein (1999) to
generate stock prices underreaction in security markets.

CHAPTER 2. COMMUNICATION AND CONFIDENCE IN NETWORKS 36
audience of followers when each informed follower continues to pass the rumor to a number
of uninformed followers. In my paper information communication is modeled as sociological
trait associated with trading behavior rather than strategic and bene�cial use of information.
The role of interpersonal and interactive communication through social network in deci-
sion making has long been recognized in other �elds of economic activities. Neighbors are
introduced in models of learning from others' action by Allen (1982a, 1982b). Ellison and
Fudenberg (1995), and Bala and Goyal (1998) show that communication in social networks
play a major role in technology adoption. DeMarzo, Vayanos and Zwiebel (2003) explore
the role of repetitive information communication in social network to understand behavioral
bias in political and marketing issues. Bisin, Horst and �Ozg�ur (2006) analyze static and
dynamic rational expectations equilibria when each agent's utility depends on the action of
a one-sided neighbor. Their model can be used to capture local preference for conformity,
habit persistence, etc.. Jackson (2004, 2006) comprehensively review the progress of net-
work formation and network economics. Vega-Redondo (2007) provides a systematic and
self-contained account of the fast-developing theory of complex social networks.
Layout. Section 2.2 extends Kyle's model, de�nes equilibrium strategies and introduces
the modelling of information communication and con�dence degrees. Section 2.3 and 2.4
derive asset pricing and welfare implications of information communication in the circle and
star networks respectively. Section 2.5 compare the explanations of information communi-
cation and overcon�dence regarding market trading patterns and individual pro�ts. Section
2.6 presents a brief conclusion with directions to future research. All analytical proofs are
relegated to the Appendix 2.A.
2.2 The Basic Framework
My model extends the single period version of Kyle (1985). Section 2.1 describes the infor-
mation structure and equilibrium strategies in a security market. The model allows agents
to observe private signals, and receive information in social network. Section 2.2 details the
form of network signal received from communication, and the ex ante and ex post con�dence
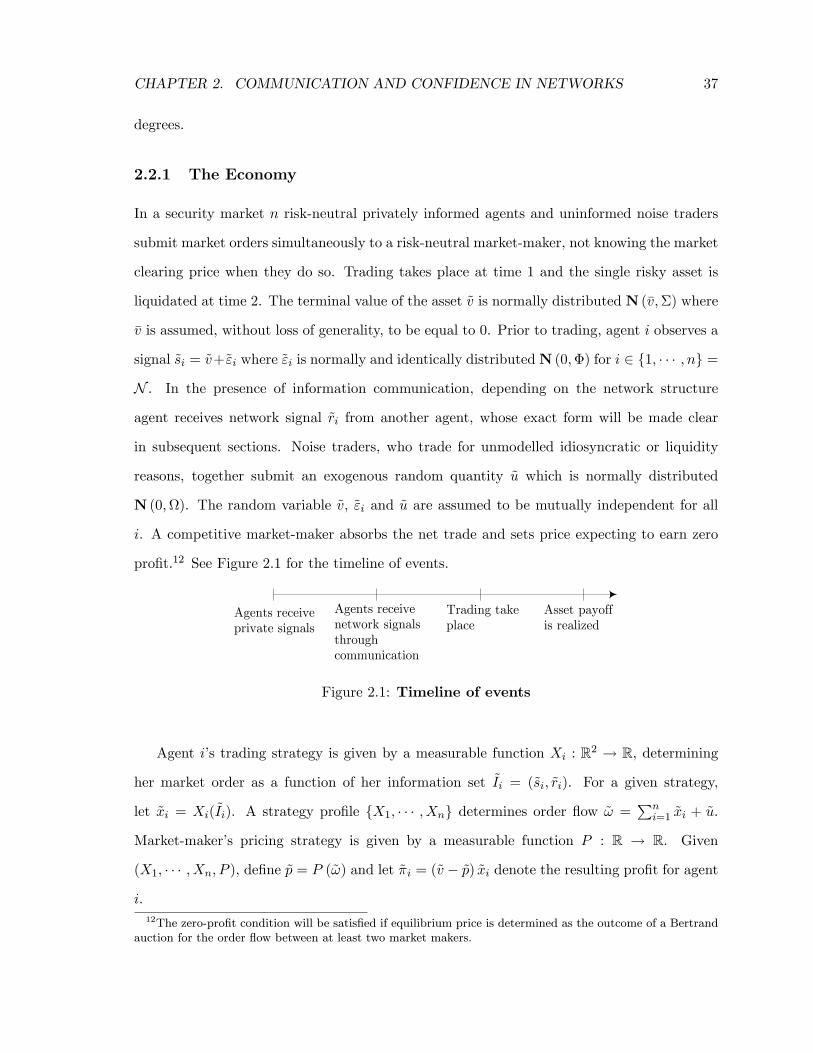
CHAPTER 2. COMMUNICATION AND CONFIDENCE IN NETWORKS 37
degrees.
2.2.1 The Economy
In a security market n risk-neutral privately informed agents and uninformed noise traders
submit market orders simultaneously to a risk-neutral market-maker, not knowing the market
clearing price when they do so. Trading takes place at time 1 and the single risky asset is
liquidated at time 2. The terminal value of the asset ~v is normally distributed N (�v;�) where
�v is assumed, without loss of generality, to be equal to 0. Prior to trading, agent i observes a
signal ~si = ~v+~"i where ~"i is normally and identically distributedN (0;�) for i 2 f1; � � � ; ng =
N . In the presence of information communication, depending on the network structure
agent receives network signal ~ri from another agent, whose exact form will be made clear
in subsequent sections. Noise traders, who trade for unmodelled idiosyncratic or liquidity
reasons, together submit an exogenous random quantity ~u which is normally distributed
N (0;). The random variable ~v, ~"i and ~u are assumed to be mutually independent for all
i. A competitive market-maker absorbs the net trade and sets price expecting to earn zero
pro�t.12 See Figure 2.1 for the timeline of events.
Agents receiveprivate signals
Agents receivenetwork signalsthroughcommunication
Trading takeplace
Asset payoffis realized
Figure 2.1: Timeline of events
Agent i's trading strategy is given by a measurable function Xi : R2 ! R, determining
her market order as a function of her information set ~Ii = (~si; ~ri). For a given strategy,
let ~xi = Xi(~Ii). A strategy pro�le fX1; � � � ; Xng determines order ow ~! =Pn
i=1 ~xi + ~u.
Market-maker's pricing strategy is given by a measurable function P : R ! R. Given
(X1; � � � ; Xn; P ), de�ne ~p = P (~!) and let ~�i = (~v � ~p) ~xi denote the resulting pro�t for agent
i.
12The zero-pro�t condition will be satis�ed if equilibrium price is determined as the outcome of a Bertrandauction for the order ow between at least two market makers.

CHAPTER 2. COMMUNICATION AND CONFIDENCE IN NETWORKS 38
Based on her information set, each agent acts strategically by taking into account the
fact that her optimal demand, as well as others' order decision, will in uence asset price and
her pro�t. Market-maker attempts to infer the private information from the order ow and
sets price as e�ciently as possible to protect himself. All these considerations are formally
expressed below.
De�nition 2.1 A Bayesian Nash equilibrium consists of agents' trading strategy pro�le
fX1; � � � ; Xng and market-maker's pricing strategy P , such that the following conditions hold:
1. Pro�t maximization: for agent i's any alternative trading strategy X 0i,
E�~�ij~Ii = Ii
�� E
X
0i(~Ii)"~v � P
Pj 6=i~xj +X
0i(~Ii) + ~u
!#����� ~Ii = ~Ii
!; (2.2.1)
2. Market semi-strong e�ciency: the pricing strategy P satis�es
P (~!) = E�~v
����~! = nPi=1~xi + ~u
�. (2.2.2)
All extensions of Kyle (1985) focus on equilibrium with linear strategies. We follow this
convention and postulate that agent i's trading strategy and market-maker's pricing strategy
are
Xi (~si; ~ri) = �i~si + �i~ri, i 2 N , (2.2.3)
P (~!) = �~!, (2.2.4)
respectively. We refer to �i and �i as \trading intensity parameters" associated with private
and network signals, and � as the \market liquidity/depth parameter". A low �means a more
liquid (or deeper) market in the sense that the cost of a given trade is low. In the presence of
information communication, symbol subscripts will be used to indicate network structures.
In addition, when agents i and j entertain symmetric role in information processing, their

CHAPTER 2. COMMUNICATION AND CONFIDENCE IN NETWORKS 39
trading strategies are assumed to be symmetric such that
�i = �j = � and �i = �j = �, i; j 2 N .
In the absence of communication, private signals are agents' only information and this
otherwise identical but no communication economy serves as the benchmark for market trad-
ing patterns and individual expected pro�t comparison. The equilibrium conditions in the
benchmark are described in Appendix 2. B.
2.2.2 Information Communication and Con�dence Degree
After observing private signals, agents engage in information communication. Depending
on network structures, an agent directly sends and/or receives truthful information to/from
other agents so that nobody distorts her own private or network signals. The model therefore
rules out strategic information transmission and information-based price manipulation.
More precisely, besides private signal ~si agent i receives a network signal, denoted by ~ri,
from information communication in social network. When a new agent j joins the network
and connects to agent i, they schmooze and the former gets information ~rj from the latter as
information is assumed to be transmitted in one-way direction. The content of ~rj can take
many di�erent forms. For example, agent i may choose to send her private signal only, so
~rj = ~si; or agent i may simply pass her network signal, therefore ~rj = ~ri; or agent i may
disclose all of her information, that is, ~rj = f~si; ~rig. The �rst case is studied by Colla and Mele
(2004), and Ozsoylev (2005), while the last one is essentially the feature of network formation
modeled by Bala and Goyal (2000).13 Figure 2.2 depicts the information transmission from
agent i to agent j.
Above examples have their own merits, nonetheless other possibilities deserve exploring.
In this paper I study a speci�c form of information communication. Agent j is assumed to
receive \synthetic" information from agent i in the sense that ~rj is a linear combination of ~si
13In the model of Bala and Goyal (2000), when agent j is connected to agent i who is linked to agent k,then agent j will derive bene�t from both agents i and k, even though agent j is not connected with agent kdirectly.

CHAPTER 2. COMMUNICATION AND CONFIDENCE IN NETWORKS 40
i j
ri rj
si sj
Figure 2.2: One-way directed information transmission between two agents: Inaddition to private signal, agent j receive a network signal from agent i.
and ~ri, the weight on private signal being denoted by a parameter � 2 [0; 1]. We thus have
~rj = �~si + (1� �) ~ri, i; j 2 N . (2.2.5)
Agent's linear trading strategy in the form of (2.2.3) motivates this speci�cation of infor-
mation transmission.14 Of course when � = 0 or 1, this communication rule coincide with the
�rst two examples mentioned above. It is also compatible with the full-disclosure example
since the weights can be chosen such that ~rj becomes the su�cient statistic of f~si; ~rig in the
following sense:
E (~vj~si; ~ri) = E (~vj~rj) (2.2.6)
var (~vj~si; ~ri) = var (~vjrj) (2.2.7)
It is easy to show that there exists speci�c weights � and 1�� such that ~rj e�ciently aggregates
the informational contents of ~si and ~ri. Choosing such weights, which are determined by the
distributions of ~si and ~ri, will not change the main results of this paper that information
communication can generate asset pricing and welfare implications consistent with empirical
evidence.
Here I am more interested in the impact of varying weights on the resulting individual
trading behavior and market trading patterns. A similar information aggregating rule in
repetitive information communication is studied by DeMarzo, Vayanos and Zwiebel (2003).
14Agent may select the weights � and 1 � � based on her reliance on private and network signals in pasttradings.
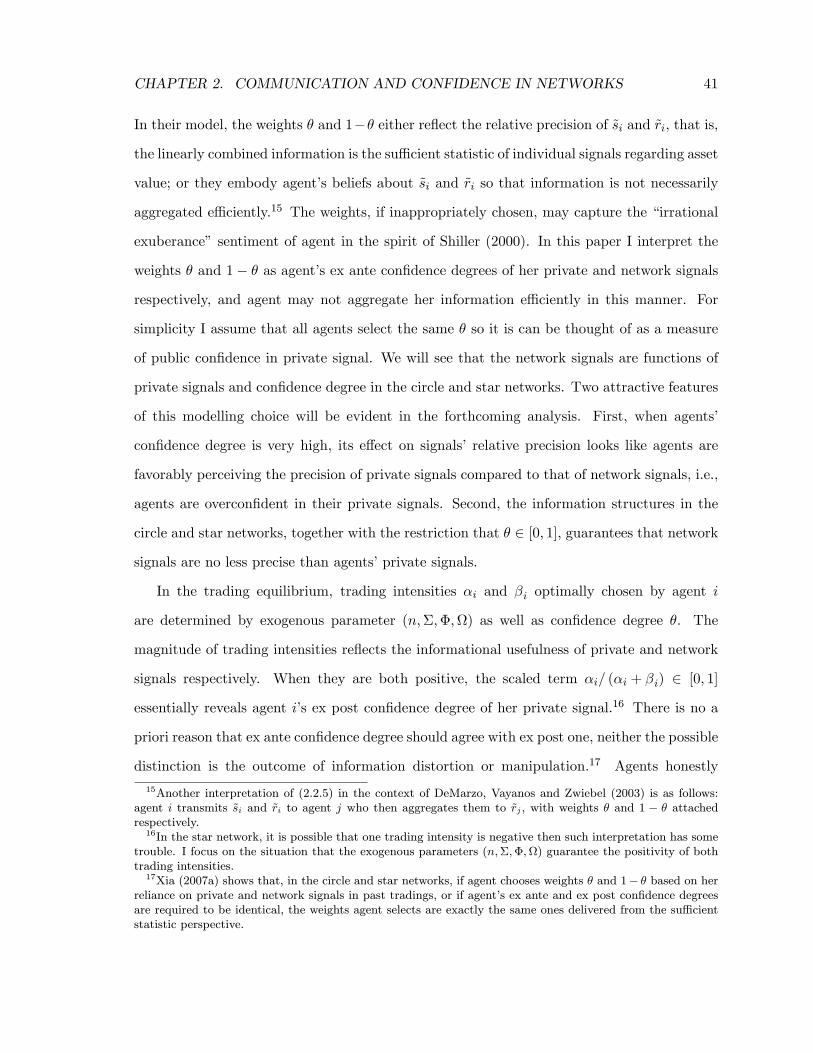
CHAPTER 2. COMMUNICATION AND CONFIDENCE IN NETWORKS 41
In their model, the weights � and 1�� either re ect the relative precision of ~si and ~ri, that is,
the linearly combined information is the su�cient statistic of individual signals regarding asset
value; or they embody agent's beliefs about ~si and ~ri so that information is not necessarily
aggregated e�ciently.15 The weights, if inappropriately chosen, may capture the \irrational
exuberance" sentiment of agent in the spirit of Shiller (2000). In this paper I interpret the
weights � and 1� � as agent's ex ante con�dence degrees of her private and network signals
respectively, and agent may not aggregate her information e�ciently in this manner. For
simplicity I assume that all agents select the same � so it is can be thought of as a measure
of public con�dence in private signal. We will see that the network signals are functions of
private signals and con�dence degree in the circle and star networks. Two attractive features
of this modelling choice will be evident in the forthcoming analysis. First, when agents'
con�dence degree is very high, its e�ect on signals' relative precision looks like agents are
favorably perceiving the precision of private signals compared to that of network signals, i.e.,
agents are overcon�dent in their private signals. Second, the information structures in the
circle and star networks, together with the restriction that � 2 [0; 1], guarantees that network
signals are no less precise than agents' private signals.
In the trading equilibrium, trading intensities �i and �i optimally chosen by agent i
are determined by exogenous parameter (n;�;�;) as well as con�dence degree �. The
magnitude of trading intensities re ects the informational usefulness of private and network
signals respectively. When they are both positive, the scaled term �i= (�i + �i) 2 [0; 1]
essentially reveals agent i's ex post con�dence degree of her private signal.16 There is no a
priori reason that ex ante con�dence degree should agree with ex post one, neither the possible
distinction is the outcome of information distortion or manipulation.17 Agents honestly
15Another interpretation of (2.2.5) in the context of DeMarzo, Vayanos and Zwiebel (2003) is as follows:agent i transmits ~si and ~ri to agent j who then aggregates them to ~rj , with weights � and 1 � � attachedrespectively.16In the star network, it is possible that one trading intensity is negative then such interpretation has some
trouble. I focus on the situation that the exogenous parameters (n;�;�;) guarantee the positivity of bothtrading intensities.17Xia (2007a) shows that, in the circle and star networks, if agent chooses weights � and 1� � based on her
reliance on private and network signals in past tradings, or if agent's ex ante and ex post con�dence degreesare required to be identical, the weights agent selects are exactly the same ones delivered from the su�cientstatistic perspective.

CHAPTER 2. COMMUNICATION AND CONFIDENCE IN NETWORKS 42
integrate their ex ante con�dence degree in communication without the foresight that the ex
post one might change in trading, as their sophisticated thinking only develops afterwards.
Indeed, economists have identi�ed that what people do might be quite di�erent from what
they say (Yezer, Goldfarb and Poppen, 1996). In this paper the circle and star networks
are exogenously given, agents' varying con�dence degrees in information communication may
a�ect the stability of networks. Xia (2007b) explores this question in a multi-period version
of Kyle (1985).
2.3 Trading in Circle Network
In this section I study individual trading behavior and market trading patterns in security
market when information communication structure is presented by a circle graph. The envi-
ronment is identical to what is introduced in section 2.2 except that n informed agents are
ordered clockwise, as to say that agent i has i + 1 to her left and i � 1 to her right. The
graph in Figure 2.3 is a symbolic representation of a circle network. It implies an abstraction
of the reality so communicating agents can be simpli�ed as a set of linked nodes, and arrows
indicate the one-way directed information transmission.18
Prior to trading, an agent, say i+1, obtains information from her closest left side \neigh-
bor" i + 2. Agent i + 1 then determines a linear combination of her private and network
signals, then transmits the synthetic information to her closest right side \neighbor" i, and
so on. It is assumed that the lack of geographical or socioeconomic proximity prevents i+ 2
from directly communicating with i. We therefore have the expression for the network signal:
~ri = �~si+1 + (1� �) ~ri+1 (mod n), i 2 N , � 2 (0; 1]. (2.3.1)
The modular arithmetic with modulus n, denoted by (mod n) is used if necessary. For
18In the language of graph theory, our circle network is a directed cycle, or a circuit. More formally, LetG = (N ;L) be a graph with the set of nodes (vertices) N and the set of links (edges) L. A path from avertex �1 to a vertex �k is an alternating sequence of vertices and edges, (�1; �2; � � � ; �k) ; �i 2 V, all thevertices in the sequence are distinct and successive vertices �i and �i+1 are endpoints of the intermediate edge(�i; �i+1) 2 L: If we only allow the �rst and last vertices to conincide, we call the resulting closed path a cycle.A graph with no cycles is called a tree. Circuit is a path where the initial and terminal node corresponds andis a cycle where all the links are traveled in the same direction.
CHAPTER 2. COMMUNICATION AND CONFIDENCE IN NETWORKS 43
1
2n
... ...
i+2
i+1
i
Figure 2.3: Information transmission in circle network. The set of linked nodes representssocial communication among agents. Arrows indicate the direction of information transmission. For
all i 2 N , in addition to private signal, agent i receives \synthetic" network signal about the riskyasset value from agent i+ 1 (mod n).
example, �ve agents after (n� 2)th agent is the third agent. A notable restriction is that we
have to exclude the weight � = 0, otherwise the network signal has no content in the circle
network and we are back to the no communication economy.
Although the circle network considered is something of a modelling contrivance, it is not
too unrealistic. First, Bala and Goyal (2000) show that under certain conditions agents will
strategically form a circle network when bene�cial information transmission is one-way di-
rected. It is conceivable that, at least in short period, these agents will rely on this established
network without realizing that information communication impairs their welfare. Second, the
modelling captures some important features of communication in �nancial markets. For ex-
ample, the successive circulation of investment newsletters and �nancial press, the orderly and
continuous discussion on Internet stock message boards resemble quite closely the one-way
directed communication in circle network. Third, the information transmission description
should be thought of as a \snapshot" of continuous communication prior to trading.
Assume away repetitive information transmission, the circle network dictates that
~ri = ~ri+n (mod n), i 2 N . (2.3.2)

CHAPTER 2. COMMUNICATION AND CONFIDENCE IN NETWORKS 44
When � 2 (0; 1), (2.3.1) and (2.3.2) together yield
~ri =�Pn�1
k=0 (1� �)k ~si+k+1
1� (1� �)n = ~v +�Pn�1
k=0 (1� �)k ~"i+k+1
1� (1� �)n (mod n), i 2 N , (2.3.3)
thus information received from the closest left side neighbor not only contains her private
signal but also aggregates signals of agents linked by the closest left side neighbor, and signals
of those who are linked by agents linked by the closet left side neighbor, and so on. It is
noteworthy that ~si+k+1, the private signals of agent i's left side neighbors, for k = 0; � � � ; n�1,
are weighted in descending order in agent i's network signal ~ri. In particular, ~si = ~si+n (mod
n) is also a component of ~ri with the least weight�(1��)n�11�(1��)n .
When � = 1, (2.3.3) is replaced with
~ri = ~si+1 (mod n), i 2 N , (2.3.4)
so agent i's network signal is just the private signal of her closest left side neighbor.
It is shown that, for � 2 (0; 1], the network signal is distributed identically as
~ri � N�0; �+
�
2� �1 + (1� �)n
1� (1� �)n��, i 2 N . (2.3.5)
The equilibrium trading and pricing strategies in the circle network are similarly de�ned
as De�nition 1 except that network signal ~ri in information set ~Ii is given by (2.3.3) and
(2.3.4) when � 2 (0; 1) and � = 1 respectively. Subscript � is used below to indicate the circle
network.
When agent's network signal is a linear combination of all dispersed private signals, a
prominent feature of agent's pro�t maximization problem is that her private signal and the
components of her network signal overlap with those of other agents. For example, consider
agents i and j, in the information processing the covariances of (~si; ~rj) and (~ri; ~rj) need to be
calculated explicitly. Fortuitously, a unique symmetric linear equilibrium is solved and the
results are collected in Theorem 2.1. Note that we do not have to deal with � 2 (0; 1) and
� = 1 separately. This is so because only the distribution of network signal matters, and the
CHAPTER 2. COMMUNICATION AND CONFIDENCE IN NETWORKS 45
distribution of ~ri when � = 1 is the limit of that when � 2 (0; 1).
Theorem 2.1 In the circle network, there exists a unique symmetric linear equilibrium given
by
X�i (~si; ~ri) = ��~si + ��~ri, i 2 N , (2.3.6)
P� (~!) = ��
�nPi=1~x�i + ~u
�. (2.3.7)
where the trading intensity parameters �� and ��, and the liquidity parameter �� are given
by
�� =�
2� ��� (2.3.8)
�� = (2� �)s
[1� (1� �)n] 4n [1� (1� �)n] � + 2n�[1 + (1� �)n�1]�
(2.3.9)
�� =�p
r2n [1� (1� �)n]
�2 [1� (1� �)n] � + �[1 + (1� �)n�1]�
�2 (n+ 1) [1� (1� �)n] � + [(3� � 2) (1� �)n�1 + 2 + �]�
(2.3.10)
The second order condition �� > 0 is satis�ed.
Proof. All proofs are in the Appendix 2.A.
Most of the following results hinge on exogenous parameters (n;�;�;) as well as con�-
dence degree � 2 (0; 1]. The comparative statics of exogenous parameters has been intensively
explored by existing studies in the absence of communication. For instance, most extensions
of risk neutral version of Kyle (1985) show that the variance of noise trading does not
a�ect price volatility and price e�ciency because agents scale up their trading intensities in
response to an increase in the amount of noise trading. The same applies to my model. In
other extensions, market liquidity parameter is decreasing in the number of informed agents
because an increase in n intensi�es competition, leading to a decrease in the adverse selection
faced by the market-maker. In the circle network an increase in n also increases the precision
of network signal, which further reinforces the competition between agents, rendering market
to be even more liquid (or deeper). Since con�dence degree � is a new element in my model,
CHAPTER 2. COMMUNICATION AND CONFIDENCE IN NETWORKS 46
in the following analysis I mainly pay attention to its e�ects on individual trading behavior
and market trading patterns.
2.3.1 Correlation of Demands and Information Utilization
The empirical studies by Coval and Moskowitz (1999, 2001), Feng and Seasholes (2004) and
Hong, Kubik, and Stein (2005) suggest that the closer is the geographic proximity between
agents, the more correlated is their trading behavior. Other than the possible local infor-
mation advantage, one way to formalize this observation is to show the relationship between
correlation of agents' demand and their proximity is decreasing.19 Note that the in the circle
network agent i has two neighbors of the same proximity `, i+ ` to her left and i� ` to her
right. We �rst need to demonstrate that the correlation of demand between agents i and
i + ` is equal to that between agents i and i � `. A simple inspection of (2.3.3) may lead
to the impression that agent i + `'s private signal has more in uence on agent i's demand
than agent i � `'s, because in the circle network the private signals of left side neighbors in
i's network signal are weighted in a descending order. It seems that correlation of demand
between agents i and i + ` is larger. This argument is not grounded as it neglects the fact
that agent i's signal has more in uence on agent i � `'s demand than on agent i + `'s. The
same proximity exactly balances the in uences with each other.
Proposition 2.1 reveals the relationship between correlation of demands and proximity in
the circle network. Simply put, the further apart the agents are, the lower the correlation
between their demands.
Proposition 2.1 In the circle network, when n � 4, we have:20
1. The correlation of agent demands is non-increasing in agents' proximity for � = 1. In
particular, the correlation of an agent and her closest neighbors' demands is the largest.
corr (~x�i; ~x�i�1) > corr (~x�i; ~x�i+`) = corr (~x�i; ~x�i+j) (mod n), 2 � j`j < jjj � n=2.
19The local information advantage can be accomodated in the paper if multi-security is introduced into Kyle(1985). See Krishnan and Caballe (1990).20When n = 2 or 3 the proposition is trivial.
CHAPTER 2. COMMUNICATION AND CONFIDENCE IN NETWORKS 47
2. The correlation of agent demands is strictly decreasing in agents' proximity for � 2
(0; 1).
corr (x�i; x�i+`) > corr (x�i; x�i+j) , (mod n), 1 � j`j < jjj � n=2.
In the �rst part when � = 1, we have �� = �� and for i 2 N
corr (x�i; x�i�1) =4� + �
4� + 2�(mod n),
corr (x�i; x�i+j) =2�
2� + �; 2 � jjj � n
2; (mod n).
It's clear that the correlation of an agent and her closest left/right neighbor's demands is the
largest as the overlapping of private signals is the greatest. A stronger monotone relationship
is established in second part when � 2 (0; 1). The reason is straightforward: when agent i+ `
is closer to i than i+j, her private signal has more in uence on i's demand. At the same time,
although agent i's private signal has more in uence on i+ j's demand, the latter's in uence
is dominated by the former's. As a result, the correlation of demands between agents i and
i+ ` is larger than that between agents i and i+ j.21
Next I demonstrate the remarkable e�ects of communication on individual agent's infor-
mation utilization, market trading patterns and agent's expected pro�t. Proposition 2.2 is
crucial for its intuitive appealing in understanding the main results.
Proposition 2.2 In the circle network, precision of the network signal ~ri is strictly higher
than that of the private signal ~si when con�dence degree � 2 (0; 1), and it is strictly decreasing
in � 2 (0; 1] for each agent i 2 N .
Recall the expression of network signal (2.3.3) when � 2 (0; 1), the i.i.d. nature of noise
terms in private signals, after weighted by con�dence degree and linearly aggregated together,
21Some readers may prefer two-way directed social communication. In the circle network this can bethought of as two one-way directed information transmissions with directions changing. All results obtainedunder one-way directed social communication can be extended this way in which corresponding measurementssuch as demand correlations, trading volume are stated in average terms. This consideration has a cost ofcomplication. To see this point, I provide proof for a two-way social communication version of Proposition 1in the Appendix A.
CHAPTER 2. COMMUNICATION AND CONFIDENCE IN NETWORKS 48
naturally render network signal more precise than any private signal regarding asset value.
To understand the monotonicity result, keep two facts in mind. First, in an agent's network
signal the �-dependent weights of signals of her left side neighbors are ranked in a descending
order; Second, the �-dependent weights sum up to one. Therefore when con�dence degree
increases, these weights vary over a broader range which cause the network signal more
volatile, or equivalently, less precise.
In the presence of information communication, how should agent i utilize her private signal
~si and the network signal ~ri in terms of trading intensities choice? Important as it is, this
question is not addressed or irrelevant in other extensions of Kyle (1985) when information
communication is ignored. We �rst distinguish \net" network signal ~rNi from \gross" network
signal ~ri, the latter containing a component of agent i's private signal ~si weighted by�(1��)n1�(1��)n
when � 2 (0; 1). Agent i's trading strategy can be written as
~x�i = ��~si + ��~ri
=
��� +
� (1� �)n
1� (1� �)n���~si + ��~r
Ni , (mod n)
where
~rNi =�Pn�2
k=0 (1� �)k+1 ~si+k+1
1� (1� �)n , (mod n)
When � = 1, we have ~ri = ~rNi = ~si+1. The same question applies to the trading intensities
choice regarding ~si and ~rNi . Proposition 2.3 summaries answers to both questions.
Proposition 2.3 In the circle network, for equilibrium trading strategies we have:
1. Each agent relies on private and (net) network signals equally when � = 1.
2. Each agent relies less on private signal than on (net) network signal when � 2 (0; 1).
That is, �� < �� and �� +�(1��)n�11�(1��)n �� < ��.
The trading intensities choice is complicated by the fact that agent i realizes that her
private signal ~si is also utilized, to di�erent extent, by all other agents, so does the components
of her network signal ~ri (and ~rNi ). Therefore it is not necessarily the case that agent should
CHAPTER 2. COMMUNICATION AND CONFIDENCE IN NETWORKS 49
rely more on her private signal. Inspections of (2.3.8) show that the reverse is true. Roughly
speaking, though the exact information processing is quite involved, agent's information
utilization mainly re ects the fact that the precision of ~ri is higher than that of ~si, as revealed
in Proposition 2. The reason for result regarding ~si and ~rNi is alike.22
More interestingly, the second result reminds us of the in uential thinking about spec-
ulation in �nancial markets. Information communication in the circle network induces
agents' strategic behavior similar to what is described in Keynes's famous \beauty contest"
metaphor.23 When faced with a contest rule such that one wins by submitting a list of beau-
ties that most clearly matches the consensus of all other contest entries, na��ve entrants would
rely on their own concepts of beauty to establish rankings. Other entrants can therefore
enhance winning chance by second guessing the others' reactions, and sophisticated entrants
would attempt to second guess the others' second guessing, and so on. Analogously, most
of trading activities in �nancial markets is driven more by expectations about what other
traders think than expectations about the fundamentals. A parallel can be drawn here. In
my model when each agent attempts to exploit the information about the fundamental value
of an asset, she second guesses her competitors' second guessing and in equilibrium she relies
more on what information other agents have.
How agents utilizes private signal and inferred information is the central theme in social
learning theory in which direct communication is usually prohibited (Chamley, 2004). The
agents' behavior in the circle network is also a reminiscent of the herding behavior in the
informational cascade models pioneered by Banerjee (1992) and Bikhchandani, Hirshleifer
and Welch (1992). In a sequential moving game, a successor often neglects her own private
signal or gives it an inappropriate weight, and blindly imitates the action decisions of a
few predecessors provided that they based actions on their signals and the decisions have
a common value component. Such behavior is justi�ed because the additional information
22The variance of the net network signal ~rNi is�1� (1� �)n�1
1� (1� �)n�2�+
�
2� �1� (1� �)2n�2
[1� (1� �)n]2�
23The idea of \beauty contest" has been formalized in di�erent models such as Morris and Shin (2002),Camerer, Ho and Chong (2004) Angeletos, Lorenzoni and Pavan (2007).

CHAPTER 2. COMMUNICATION AND CONFIDENCE IN NETWORKS 50
inferred from predecessors' actions overwhelms the successor's private signal in the Bayesian
sense. In my model although each agent submits market order simultaneously so nobody
can observe others' actions, the underlying mechanism of their trading intensities choice is
similar to that of information cascades since the network signal is indeed more precise.
2.3.2 Market Patterns and Expected Pro�t
In this section I study the implications of information communication and con�dence degree
on market trading patterns and agent's expected pro�t in the circle network equilibrium. The
former is usually summarized by the patterns in market liquidity, expected trading volume,
price volatility and price e�ciency. The reason that I discuss expected pro�t in this section
will be clear in section 2.5.
Market-maker's pricing strategy (2.2.4) reveals that when liquidity parameter � is low,
an additional order will not cause a large price change, the market is thus very liquid or
deep. Following Admati and P eiderer (1988), total trading volume ~V aggregates trades
that are crossed between traders, informed or uninformed, and net demand presented to the
market-maker, thus it is de�ned by
~V =1
2
�nPi=1j~xij+ j~uj+ j~!j
�(2.3.11)
where the coe�cient 1=2 corrects the double counting when summing trades over all traders.
Price volatility is the variance of equilibrium price ~p. In the literature, price e�ciency, or
informational e�ciency (informativeness) of price is either measured by the posterior precision
of ~v or the residual variance of ~v, conditional on equilibrium price ~p (or order ow ~!). They
are informationally equivalent so I adopt the �rst. In the presence of communication, we
have:
Proposition 2.4 In equilibrium, when n > 1, market liquidity, expected trading volume,
price volatility and price e�ciency in the circle network are strictly larger compared to those
in the otherwise identical but no communication economy. Moreover, when n > 2, they are
strictly decreasing in con�dence degree � 2 (0; 1].

CHAPTER 2. COMMUNICATION AND CONFIDENCE IN NETWORKS 51
The intuition for the �rst part is as follows. Agents trade more aggressively simply
because they can exploit more available information which is also more precise regarding
asset value. Information communication causes prices to be more sensitive to changes in
agents' private signals and less sensitive to changes in noise trader demand. Market-maker
sets price to be the expectation of asset value conditional on order ow and his conjecture
about agents' trading strategy. He realizes that agents trade more intensely and accordingly
moves price less in response to changes in order ow than he would if agents abstain from
communication. In other words, he attens the supply curve, therefore increasing market
liquidity. Because communicating agents trades more in response to private signals, their
expected trading increases relative to that of noise traders. Consequently the signal-to-noise
ratio in total order ow increases and market-maker is able to make better inferences about
agents' signals. The price he sets then varies more in response to changes in private signals
which increases the price volatility. From a di�erent perspective, although market-maker
has attened the supply curve, thus dampening volatility for any given level of expected
order ow, the increased order ow generated by communicating agents more than o�sets
this dampening, and results in increased volatility. At the same time, the better inferences
enable market-maker to form a more accurate posterior expectation of asset value and to set
price that is, on average, closer to asset value. The informativeness or e�ciency of prices is
thus improved.
Preceding analysis reveals that agents trade more aggressively is the key to understand
other market trading patterns. The monotonicity result of the second part comes from the
mechanism given in Proposition 2.2. A higher agents' con�dence degree leads to relatively less
accurate network signals, which impair agents' assessment of asset value. As a consequence
they trade cautiously, thereby market liquidity, price volatility and price e�ciency become
smaller. The monotonicity result does not hold when n = 2, since when information is
transmitted between two agents, each agent can infer other's private signal directly no matter
what the value of � is. To see it more clearly, when n = 2, (2.3.3) can be written as
~ri =~si+1 + (1� �) ~si
2� � (mod 2), i 2 f1; 2g
CHAPTER 2. COMMUNICATION AND CONFIDENCE IN NETWORKS 52
Agent knows the exact values of her own signal and con�dence degree, hence the network
signal is informationally equivalent to her neighbor's private signal.24
Several interesting observations are in order. Shiller conjectures that:
\Word-of-mouth transmission of ideas appears to be an important contributor to
day-to-day or hour-to-hour stock market uctuation [...]." Shiller (2000, p.155)
My model formalizes his thinking about �nancial markets price volatility and further con-
nects information communication to trading volume, market liquidity, and price e�ciency. In
practice, the tremendous trading volume in �nancial markets is a challenge to the \no-trade
theorem" developed by Milgrom and Stoky (1982) in that di�erences in information alone
cannot explain the observed levels of trading volume. Several motives have been extensively
explored in the literature. The competitive and strategic noisy rational expectations models,
pioneered by Grossman and Stiglitz (1980) and Kyle (1985) respectively, demonstrate that
private information and noise (liquidity) trading are the major motive for trade. Although
noise trading is not necessarily irrational, ascribing the enormous trading volume to noise
trading is unappealing theoretically and empirically. My model suggests that once informa-
tion communication is considered, the burden for the required level of noise trading can be
lessened. More recently, heterogeneous prior beliefs has been proposed as another signi�cant
motive for trade. The high levels of trading volume in Varian (1989) Harris and Raviv (1993)
and Kandel and Pearson (1995) arise from \di�erences of opinion" about an asset value, while
in Odean (1998) and Wang (1998) they are due to agent's overcon�dence in private signal's
precision.25 My information communication explanation can accommodate these motives,
thus help us better understand the trading phenomena. A large body of empirical stud-
ies document the positive correlation between trading volume and contemporaneous price
24It is clear seen from Lemma 3 that, when n = 2, � = 12and � = 3
2therefore (2.A.15)-(2.A.17) are invariant
to �.25Although the two strands of literature are usually regarded as distinct, the conceptual di�erence is quite
slight. Di�ences of opinion are sometimes interpreted as a form of overcon�dence, and overcon�dence modelsassume overestimation of signal's precision, which create heterogeneous (posterior) beliefs among agents aswell or make the additional assumption of di�ering beliefs that are common knowledge. See the discussion inGlaser and Weber (2004). For this reason, I focus on comparison of social communication and overcon�denceexplanations in this paper. It is also noteworthy that the idea in di�erences of opinion are questioned by Chari(1989) and Morris (1994).

CHAPTER 2. COMMUNICATION AND CONFIDENCE IN NETWORKS 53
volatility. The recent burgeoning of stock message boards also provide supportive evidence
reviewed earlier. My model's predications accord well with these �ndings.
Communication is a sociological need for human being. In many cooperative contexts
communication brings welfare improvement. Nonetheless, do agents gain from information
communication when they are strategically competing against one another? The answer is
not crystal clear. Communication is bene�cial as well as costly. Agents are able to better
assess asset risk due to more precise network signals, but they lose monopoly on private
signals simultaneously. Proposition 2.5 reveals that the latter outweighs the former in the
circle network.
Proposition 2.5 In equilibrium, when n > 1, agent's expected pro�t in the circle network
is lower compared to that in otherwise identical but no communication economy. Moreover,
when n > 2, it is strictly increasing in con�dence degree � 2 (0; 1].
A key element underlying this welfare impairment result is that agents are risk neutral. To
such agents the advance in risk assessment is not very attractive. Additional more accurate
information generated from communication, accompanied by less monopoly on private signals,
leads to intenser competition among agents which helps market-maker infer asset value better,
equilibrium price is thus on average set closer to asset value. Consequently, each agent is put
in a disadvantage position. This intuition is echoed by the second part of this proposition.
Agents are relatively better o� even though higher con�dence degree of private signal yields
network signal of less precision.
This result raise the concern that information communication in �nancial markets is un-
desirable and the circle network cannot be established in the very beginning. Such pessimistic
conclusion is nonetheless too hasty. As pointed out by Hong, Kubik and Stein (2004), agents
get pleasure from conversation about �nancial markets with friends who are also fellow par-
ticipants. Moreover, when agents are instead risk averse, the bene�t of communication may
exceed its cost. On the one hand, the advantage of more precise network signal, favored by
risk averse agents, may dominate the monopoly loss in private signals. On the other hand,
risk averse agents generally trade cautiously so market-maker gains less informational ad-

CHAPTER 2. COMMUNICATION AND CONFIDENCE IN NETWORKS 54
vantage, resulting in a wider pro�t margin. This e�ect is strengthened when the number of
agents is small, or equivalently, the competition is less intense. Indeed, Eren and Ozsoylev
(2006) formalize these observations in a two-agents Kyle model. I choose to study the risk
neutral case because of its analytical clarity.26
2.3.3 Con�dence Change
In section 2.2, the weight � is interpreted as agent's ex ante con�dence degree of private
signal. In the trading equilibrium, agent i optimally chooses positive trading intensities �
and � to form market order �~si + �~ri. In e�ect, the term �= (�+ �) measures agent's ex
post con�dence degree of private signal. These two con�dence degrees might be distinct from
each other.
Proposition 2.6 In the circle network, agent's ex post con�dence degree of her private signal
is only half of her ex ante one. That is,
���� + ��
=�
2.
This result is closely related to the strategic trading intensities choice investigated in
Proposition 2.3. Whatever the ex ante con�dence degree of private signal each agent has, she
optimally relies less on that signal because of the \beauty contest" concerns. Consequently,
her ex post con�dence degree of private signal decreases. More precisely, the con�dence in
private signal is halved as agents' thinking becomes sophisticated after information commu-
nication.
26It is notorious that when risk aversion is introduced to multiple agents version of Kyle (1985), the equi-librium conditions yield polynomial of degree 5 in market liquidity parameter, therefore we can only resort tonumerical method to examine the equilibrium properties.
CHAPTER 2. COMMUNICATION AND CONFIDENCE IN NETWORKS 55
2.4 Trading in Star Network
In this section I consider a new �nancial network in which information communication struc-
ture is represented by a star graph.27 The information structure is similar to what is in-
troduced in section 2.2, except that one agent receives an additional information from some
non-trading agent or institution.28 This agent, conveniently labeled as agent 1, entertains a
central status and is surrounded by other n� 1 peripheral agents who are disconnected and
do not participate in information communication. To �x notations, the central agent has
private signal ~s1 and received signal ~r1 = ~v+~"0. For simplicity we assume that ~"0 � N (0;�)
and ~"0;~"1;~"i for i 2 Nnf1g are identically and independently distributed. Moreover, ~v;~"0
and ~u are mutually independent.
The central agent truthfully transmit a linear combination of ~s1 and ~r1 to all other
peripheral agents prior to trading in a similar manner speci�ed before. Therefore we have
~ri = �~s1 + (1� �) ~r1, i 2 Nnf1g , � 2 [0; 1] . (2.4.1)
The weight � re ects the central's ex ante con�dence degree of her private signal and is
assumed to be known to the peripherals.29 Clearly � = 1=2 renders ~ri to be the su�cient
statistic of ~s1 and ~r1. The model allows other values of con�dence degree, for instance, the
central agent might choose � > 1=2 because of personal attachment of private signal. Figure
2.4 depicts the ow of information transmission in the star network.
This modelling device captures in a stylized way a number of real-life situation. First,
the central agent may choose to share information simply because of legal requirements. For
instance, Security Exchange Commission requires public traded company to fully disclose
corporate events information that will a�ect stock's subsequent performance. Still, in prac-
tice company has discretion to display distinct information with di�erent emphases. Second,
27In graph theory, a graph with no cycles is called a tree and star is a very special tree in that one node isconnected to all other disjoined terminal nodes.28When the initial information sender also trades, and the other agents' actions follow the description of the
following star network model, it can be shown that the equilibrium conditions deliver a polynomial of degree5 in liquidity parameter, which complicates the analysis without yielding new insights.29This can be interpreted alternatively. After central agent disclose ~s1 and ~r1 separately, the peripherals
select their common ex ante con�dence degrees and aggregate these signals in a linear manner.
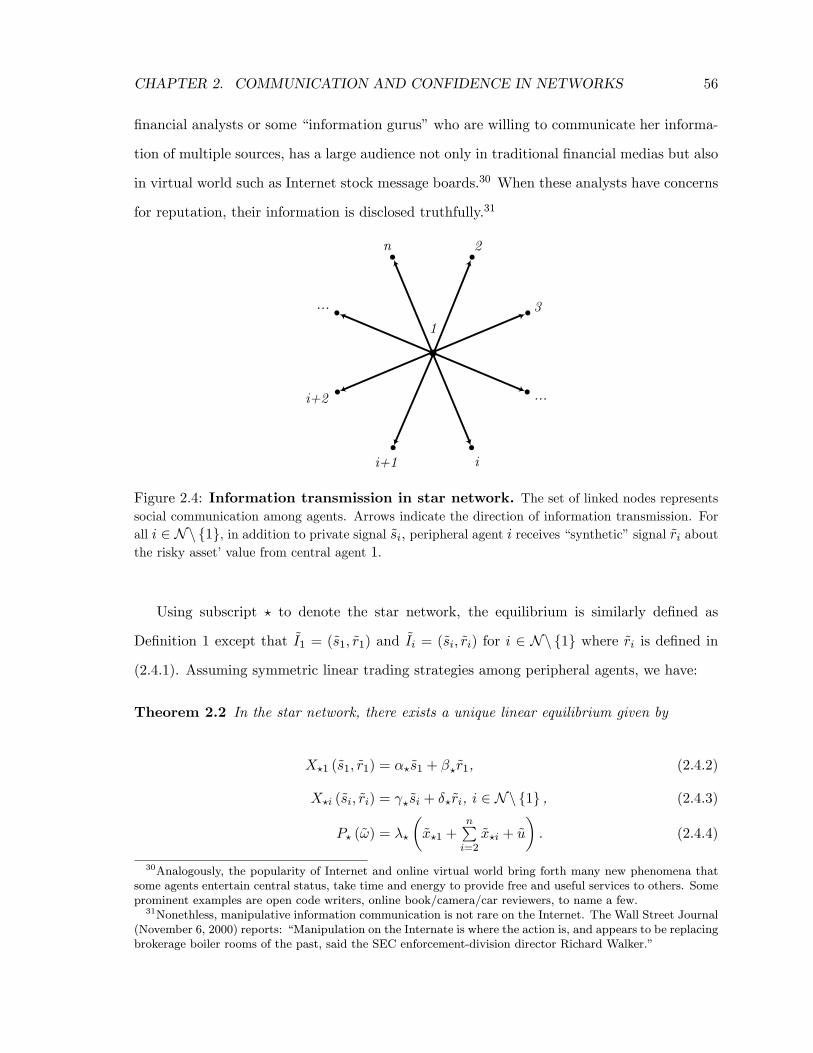
CHAPTER 2. COMMUNICATION AND CONFIDENCE IN NETWORKS 56
�nancial analysts or some \information gurus" who are willing to communicate her informa-
tion of multiple sources, has a large audience not only in traditional �nancial medias but also
in virtual world such as Internet stock message boards.30 When these analysts have concerns
for reputation, their information is disclosed truthfully.31
1
2n
...
...
3
i+2
i+1 i
Figure 2.4: Information transmission in star network. The set of linked nodes representssocial communication among agents. Arrows indicate the direction of information transmission. For
all i 2 Nnf1g, in addition to private signal ~si, peripheral agent i receives \synthetic" signal ~ri aboutthe risky asset' value from central agent 1.
Using subscript ? to denote the star network, the equilibrium is similarly de�ned as
De�nition 1 except that ~I1 = (~s1; ~r1) and ~Ii = (~si; ~ri) for i 2 Nnf1g where ~ri is de�ned in
(2.4.1). Assuming symmetric linear trading strategies among peripheral agents, we have:
Theorem 2.2 In the star network, there exists a unique linear equilibrium given by
X?1 (~s1; ~r1) = �?~s1 + �?~r1, (2.4.2)
X?i (~si; ~ri) = ?~si + �?~ri, i 2 Nnf1g , (2.4.3)
P? (~!) = �?
�~x?1 +
nPi=2~x?i + ~u
�. (2.4.4)
30Analogously, the popularity of Internet and online virtual world bring forth many new phenomena thatsome agents entertain central status, take time and energy to provide free and useful services to others. Someprominent examples are open code writers, online book/camera/car reviewers, to name a few.31Nonethless, manipulative information communication is not rare on the Internet. The Wall Street Journal
(November 6, 2000) reports: \Manipulation on the Internate is where the action is, and appears to be replacingbrokerage boiler rooms of the past, said the SEC enforcement-division director Richard Walker."
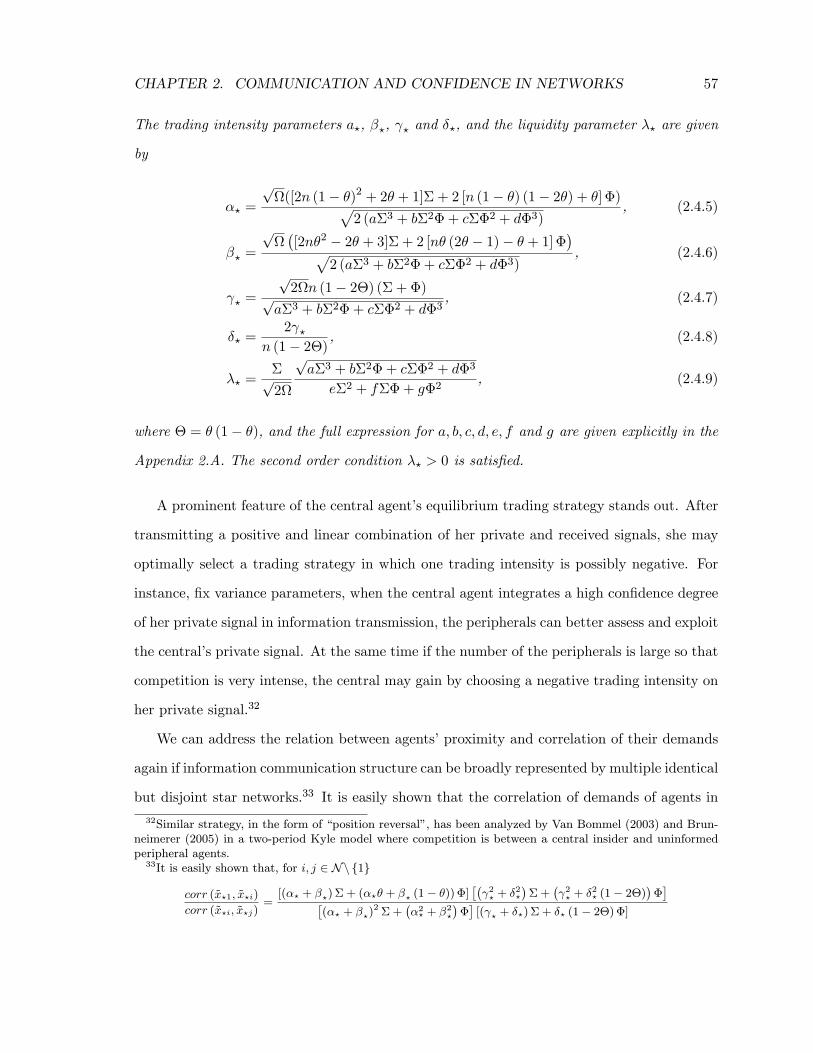
CHAPTER 2. COMMUNICATION AND CONFIDENCE IN NETWORKS 57
The trading intensity parameters a?, �?, ? and �?, and the liquidity parameter �? are given
by
�? =
p([2n (1� �)2 + 2� + 1]� + 2 [n (1� �) (1� 2�) + �] �)p
2 (a�3 + b�2�+ c��2 + d�3), (2.4.5)
�? =
p�[2n�2 � 2� + 3]� + 2 [n� (2� � 1)� � + 1]�
�p2 (a�3 + b�2�+ c��2 + d�3)
, (2.4.6)
? =
p2n (1� 2�) (� + �)p
a�3 + b�2�+ c��2 + d�3, (2.4.7)
�? =2 ?
n (1� 2�) , (2.4.8)
�? =�p2
pa�3 + b�2�+ c��2 + d�3
e�2 + f��+ g�2, (2.4.9)
where � = � (1� �), and the full expression for a; b; c; d; e; f and g are given explicitly in the
Appendix 2.A. The second order condition �? > 0 is satis�ed.
A prominent feature of the central agent's equilibrium trading strategy stands out. After
transmitting a positive and linear combination of her private and received signals, she may
optimally select a trading strategy in which one trading intensity is possibly negative. For
instance, �x variance parameters, when the central agent integrates a high con�dence degree
of her private signal in information transmission, the peripherals can better assess and exploit
the central's private signal. At the same time if the number of the peripherals is large so that
competition is very intense, the central may gain by choosing a negative trading intensity on
her private signal.32
We can address the relation between agents' proximity and correlation of their demands
again if information communication structure can be broadly represented by multiple identical
but disjoint star networks.33 It is easily shown that the correlation of demands of agents in
32Similar strategy, in the form of \position reversal", has been analyzed by Van Bommel (2003) and Brun-neimerer (2005) in a two-period Kyle model where competition is between a central insider and uninformedperipheral agents.33It is easily shown that, for i; j 2 Nnf1g
corr (~x?1; ~x?i)
corr (~x?i; ~x?j)=[(�? + �?)� + (�?� + �? (1� �))�]
�� 2? + �
2?
��+
� 2? + �
2? (1� 2�)
����
(�? + �?)2 �+
��2? + �
2?
���[( ? + �?)� + �? (1� 2�)�]
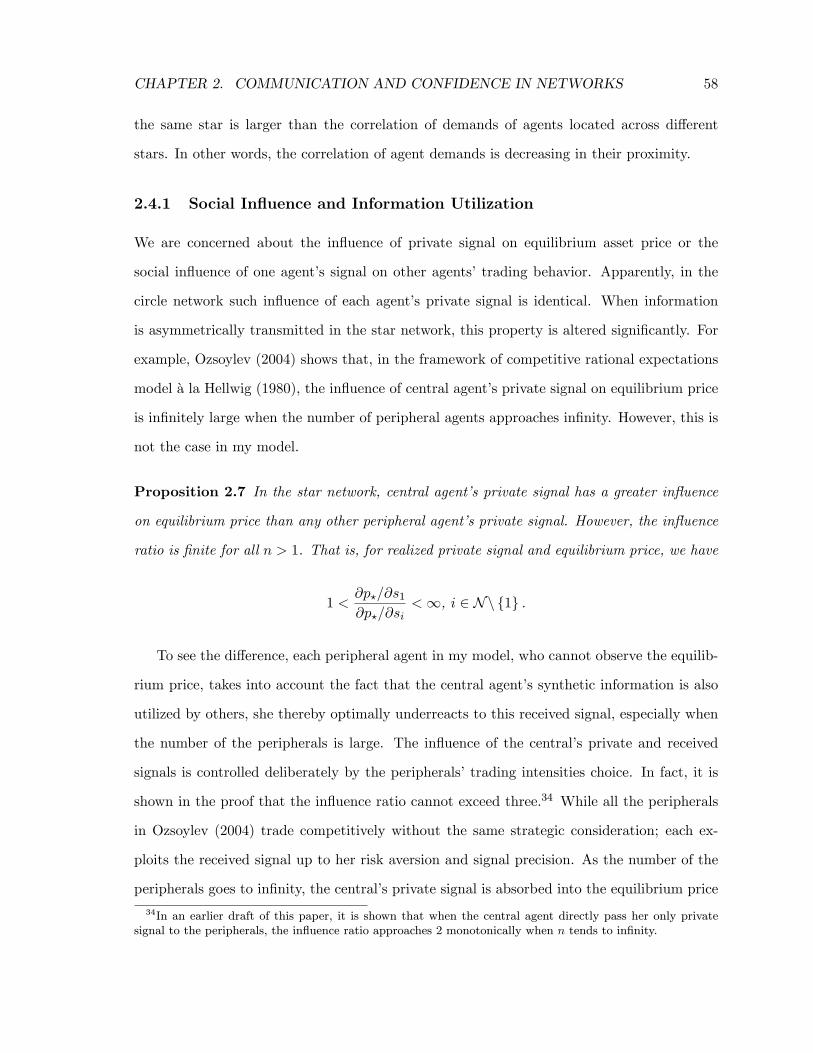
CHAPTER 2. COMMUNICATION AND CONFIDENCE IN NETWORKS 58
the same star is larger than the correlation of demands of agents located across di�erent
stars. In other words, the correlation of agent demands is decreasing in their proximity.
2.4.1 Social In uence and Information Utilization
We are concerned about the in uence of private signal on equilibrium asset price or the
social in uence of one agent's signal on other agents' trading behavior. Apparently, in the
circle network such in uence of each agent's private signal is identical. When information
is asymmetrically transmitted in the star network, this property is altered signi�cantly. For
example, Ozsoylev (2004) shows that, in the framework of competitive rational expectations
model �a la Hellwig (1980), the in uence of central agent's private signal on equilibrium price
is in�nitely large when the number of peripheral agents approaches in�nity. However, this is
not the case in my model.
Proposition 2.7 In the star network, central agent's private signal has a greater in uence
on equilibrium price than any other peripheral agent's private signal. However, the in uence
ratio is �nite for all n > 1. That is, for realized private signal and equilibrium price, we have
1 <@p?=@s1@p?=@si
<1, i 2 Nnf1g .
To see the di�erence, each peripheral agent in my model, who cannot observe the equilib-
rium price, takes into account the fact that the central agent's synthetic information is also
utilized by others, she thereby optimally underreacts to this received signal, especially when
the number of the peripherals is large. The in uence of the central's private and received
signals is controlled deliberately by the peripherals' trading intensities choice. In fact, it is
shown in the proof that the in uence ratio cannot exceed three.34 While all the peripherals
in Ozsoylev (2004) trade competitively without the same strategic consideration; each ex-
ploits the received signal up to her risk aversion and signal precision. As the number of the
peripherals goes to in�nity, the central's private signal is absorbed into the equilibrium price
34In an earlier draft of this paper, it is shown that when the central agent directly pass her only privatesignal to the peripherals, the in uence ratio approaches 2 monotonically when n tends to in�nity.

CHAPTER 2. COMMUNICATION AND CONFIDENCE IN NETWORKS 59
without bound.35
Ozsoylev (2004) nicely remarks that competitive trading in the star network provides
a possible explanation for the large price swing, like bubble or crash, in �nancial markets
without prior signi�cant change in fundamentals. However, my �nite in uence ratio result
seems to be more empirically grounded. Any single agent or institution's in uence on �nancial
markets is reasonably limited, no matter how powerful status or information she has.
Despite the modelling distinction between our star network model and informational
cascade models mentioned before, we can still draw some parallel here. Banerjee (1992)
and Bikhchandani, Hirshleifer and Welch (1992) show that when ranked agents take action
successively in a linear social network, a few predecessors' private signals, when inferred from
the resulting actions by successors, have greater in uence on the latter's action choices than
their own signals. In my model the central di�ers from the peripherals in communication
status rather than in trading time. Nonetheless, the former's information always has greater
in uence on the equilibrium price than the latter's private signal.36
The intuitive Proposition 2.2 in section 2.3.1 help us understand individual trading be-
havior and market trading patterns in the circle network. Analogously, in the star network
we have a similar result. For our purpose we will focus on the case � 2 [1=2; 1] in the following
analysis.
Proposition 2.8 In the star network, precision of the network signal ~ri is strictly higher
than that of ~si when con�dence degree � 2 (0; 1) for each agent i 2 Nnf1g, and it is strictly
decreasing (increasing) in � 2 [1=2; 1] (� 2 [0; 1=2]).
The relative precision of private and received signals determines agents' trading intensities
choice in the circle network. In contrast, in the star network agents' information utilization
is more subtle. For the peripheral agents, their number, rather than the signals' precision,
35For this result, Ozsoylev (2004) also assumes that the variance of liquidity trading goes to in�nity in orderto separate the role of social interaction from the role played by price. In our model the level of noise tradingdoes not matter for this result.36If we examine social communication and informed trading in tree network, then it more clear that agents
close to the initial nodes act like predecessors, and agents close to terminal nodes act like successors. Theformer's information has greater in uence on equilibrium price than the latter's.
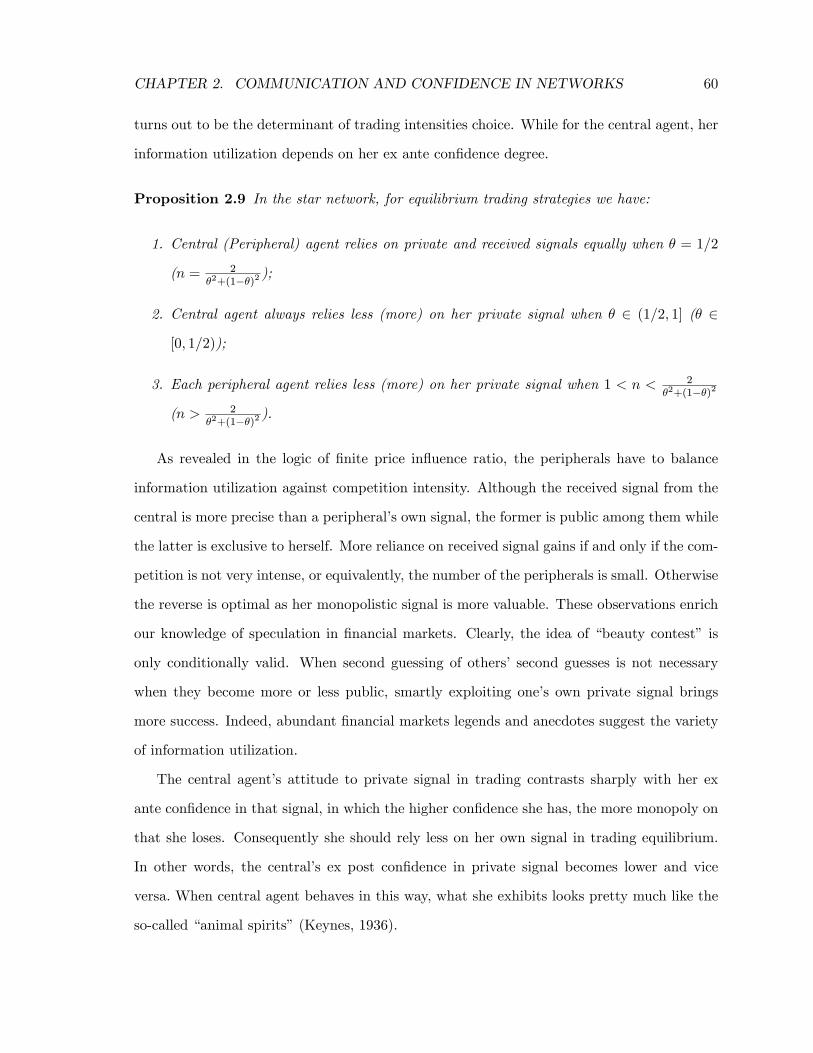
CHAPTER 2. COMMUNICATION AND CONFIDENCE IN NETWORKS 60
turns out to be the determinant of trading intensities choice. While for the central agent, her
information utilization depends on her ex ante con�dence degree.
Proposition 2.9 In the star network, for equilibrium trading strategies we have:
1. Central (Peripheral) agent relies on private and received signals equally when � = 1=2
(n = 2�2+(1��)2 );
2. Central agent always relies less (more) on her private signal when � 2 (1=2; 1] (� 2
[0; 1=2));
3. Each peripheral agent relies less (more) on her private signal when 1 < n < 2�2+(1��)2
(n > 2�2+(1��)2 ).
As revealed in the logic of �nite price in uence ratio, the peripherals have to balance
information utilization against competition intensity. Although the received signal from the
central is more precise than a peripheral's own signal, the former is public among them while
the latter is exclusive to herself. More reliance on received signal gains if and only if the com-
petition is not very intense, or equivalently, the number of the peripherals is small. Otherwise
the reverse is optimal as her monopolistic signal is more valuable. These observations enrich
our knowledge of speculation in �nancial markets. Clearly, the idea of \beauty contest" is
only conditionally valid. When second guessing of others' second guesses is not necessary
when they become more or less public, smartly exploiting one's own private signal brings
more success. Indeed, abundant �nancial markets legends and anecdotes suggest the variety
of information utilization.
The central agent's attitude to private signal in trading contrasts sharply with her ex
ante con�dence in that signal, in which the higher con�dence she has, the more monopoly on
that she loses. Consequently she should rely less on her own signal in trading equilibrium.
In other words, the central's ex post con�dence in private signal becomes lower and vice
versa. When central agent behaves in this way, what she exhibits looks pretty much like the
so-called \animal spirits" (Keynes, 1936).
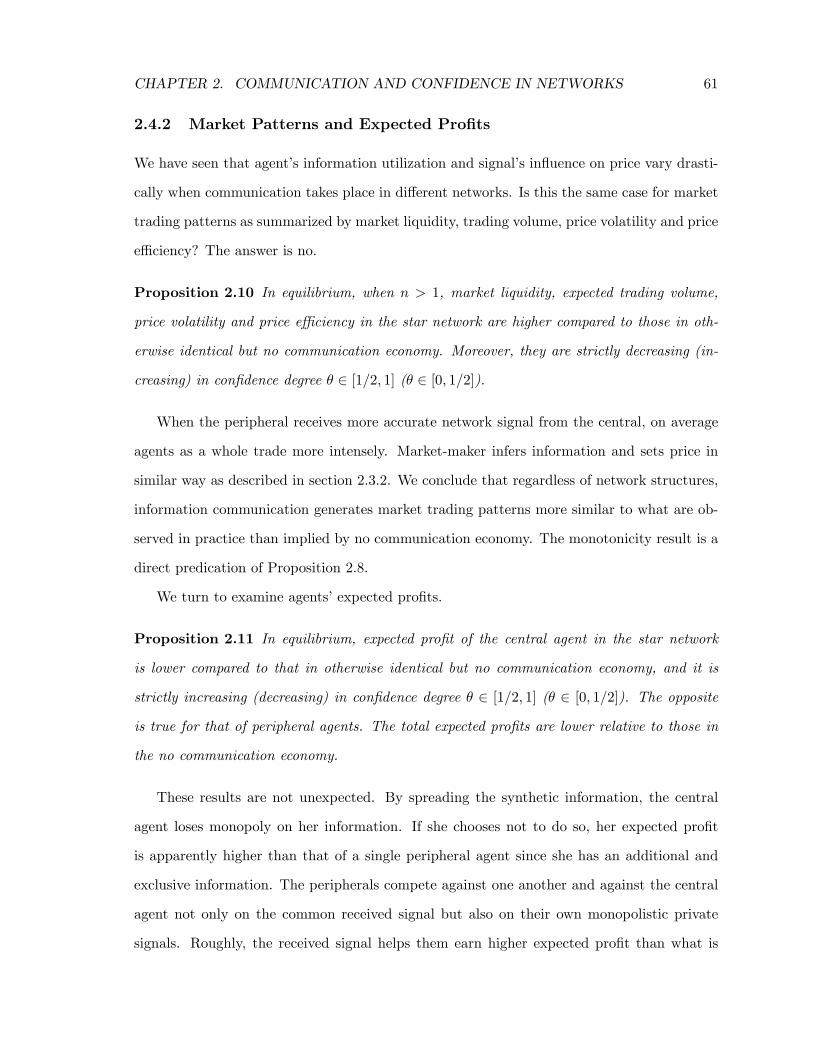
CHAPTER 2. COMMUNICATION AND CONFIDENCE IN NETWORKS 61
2.4.2 Market Patterns and Expected Pro�ts
We have seen that agent's information utilization and signal's in uence on price vary drasti-
cally when communication takes place in di�erent networks. Is this the same case for market
trading patterns as summarized by market liquidity, trading volume, price volatility and price
e�ciency? The answer is no.
Proposition 2.10 In equilibrium, when n > 1, market liquidity, expected trading volume,
price volatility and price e�ciency in the star network are higher compared to those in oth-
erwise identical but no communication economy. Moreover, they are strictly decreasing (in-
creasing) in con�dence degree � 2 [1=2; 1] (� 2 [0; 1=2]).
When the peripheral receives more accurate network signal from the central, on average
agents as a whole trade more intensely. Market-maker infers information and sets price in
similar way as described in section 2.3.2. We conclude that regardless of network structures,
information communication generates market trading patterns more similar to what are ob-
served in practice than implied by no communication economy. The monotonicity result is a
direct predication of Proposition 2.8.
We turn to examine agents' expected pro�ts.
Proposition 2.11 In equilibrium, expected pro�t of the central agent in the star network
is lower compared to that in otherwise identical but no communication economy, and it is
strictly increasing (decreasing) in con�dence degree � 2 [1=2; 1] (� 2 [0; 1=2]). The opposite
is true for that of peripheral agents. The total expected pro�ts are lower relative to those in
the no communication economy.
These results are not unexpected. By spreading the synthetic information, the central
agent loses monopoly on her information. If she chooses not to do so, her expected pro�t
is apparently higher than that of a single peripheral agent since she has an additional and
exclusive information. The peripherals compete against one another and against the central
agent not only on the common received signal but also on their own monopolistic private
signals. Roughly, the received signal helps them earn higher expected pro�t than what is
CHAPTER 2. COMMUNICATION AND CONFIDENCE IN NETWORKS 62
delivered in the no communication economy, and their exclusive private signals ensure them
to gain more relative to the central agent. Unfortunately, the peripheral's total gain is
dominated by the central's loss, so it is not possible to construct a compensation scheme
between the central and the peripheral agents to have everyone better o�.
2.4.3 Con�dence Change
Finally we study the central agent's con�dence change in the star network. Recall that for
some exogenous parameters central agent may choose a strategy that one trading intensity
is negative which will render the con�dence interpretation problematic. This situation will
not arise when the number of agents is small for �xed variance parameter � and �. More
precisely, a su�cient and necessary condition
(1� 6n) �2 + (2� 14n) �� +�n2 � 6n+ 1
��2 < 0 (2.4.10)
is assumed to guarantee the positivity of trading intensities. Meanwhile, when the number
of agents is small, it is easier to establish the star network in the �rst place and to realize
welfare improvement for all agents.
A quick look at Proposition 2.9 reveals that the central agent's ex post con�dence degree
of private signal is equal to ex ante one if and only if � = 1=2. More interestingly, we have:
Proposition 2.12 In the star network, central agent's ex post con�dence degree becomes
smaller than 1=2 if ex ante con�dence degree is larger than it, and vice versa. That is,
�?�? + �?
� 1
2() � � 1
2
Central agent's alternating con�dence degrees re ect her changing attitudes toward her
private signal in communication and in trading. The implications of con�dence changes on
market trading patterns can be seen through the comparative statics analysis of Proposition
10. In particular, the resulting uctuations in market trading patterns roughly resembles
those exhibited in market frenzy and crash. Although most existing studies regard market
CHAPTER 2. COMMUNICATION AND CONFIDENCE IN NETWORKS 63
uctuation as rational agents' optimal response to slightly changing environments (Brun-
neimerer, 2001), some economists still believe that investors' \animal spirits" (Keynes, 1936),
a concept closely related to changing con�dence degrees, are possibly the main contributing
forces. Nonetheless, Shiller pithily remarks that:
\Why should at certain times consumer and investor con�dence be high and at
other times low? Often economist cannot discern any logic to changes in public
con�dence." Shiller (1995, p. 181)
In the star network, the central agent optimally chooses trading intensities, thus con�-
dence degrees uctuate accordingly. In a sense, \animal spirits" and observed market phe-
nomena can be rationalized.
2.5 Communication and Overcon�dence
In the circle network, Proposition 2 demonstrates that when agent is more con�dent in private
signal prior to trading, the resulting more volatile network signal makes private signal, whose
variance is actually unchanged, to be relatively more precise. The same is true in the star
network when the central agent's ex ante con�dence degree is in the range of [1=2; 1]. These
properties render my modelling of con�dence comparable with that of overcon�dence which
is usually captured by agent's tendency to overestimate the precision of private signal and
underestimate that of others or public information. In other words, when an agent exhibits
high ex ante con�dence degree or when she displays overcon�dence in private signal, the
e�ects on signals' relative precision are alike. Odean (1998), Wang (1998), and Gervais and
Odean (2001) show that, in di�erent extensions of Kyle (1985), market trading patterns
such as market liquidity, expected trading volume, price volatility and price e�ciency are all
higher (expected pro�ts are lower) when an insider is overcon�dent in her private signal. More
signi�cantly, in their models market trading patterns are strictly increasing in the insider's
overcon�dence degree, and the reverse is true for expected pro�ts.37 These comparative
37The intuition is straightforward, when insider is more overcon�dent in private signal, she trade moreintensely. The reasons of higher market liquidity, price volatility and price e�ciency are similar as outlined
CHAPTER 2. COMMUNICATION AND CONFIDENCE IN NETWORKS 64
statics are directly opposite to Propositions 4 and 5 in the circle network when � 2 (0; 1],
and are again at odds with Propositions 10 and 11 in the star network when � 2 [1=2; 1].
Another distinction is that their models usually assume that agent's overcon�dence degree is
�xed, while I show that in trading equilibrium, agent's ex ante con�dence degree in private
signal is halved in the circle network, and the central agent's ex post con�dence degree is low
if her ex ante one is high, and vice versa, in the star network.38
Given two contrasting theories regarding market trading patterns and agent's expected
pro�t, empirical work may shed light on which one is more plausible. By studying position
statement and trading activity for a large sample of households, Barber and Odean (2000)
discover that those that trade most earn the lowest annual return.39 After considering other
possible motivations for trading such as liquidity, risk-based rebalancing, and taxes, they
attribute high trading levels and the resulting poor performance to individual investors'
overcon�dence. In subsequent studies, Barber and Odean (2001) document that men trade
more than women but trading reduces men's net annual returns by more percentage points
as opposed to that for women. Barber and Odean (2002) report that when investors switch
from phone-based to online trading, they trade more actively and less pro�tably than before.
These patterns are consistent with the �ndings by Antweiler and Frank (2004a, 2004b). For
the former, they cite psychological research that men are more overcon�dent than women in
areas such as �nance. For the latter, they explain that online investors perform well prior
to switch, therefore are more overcon�dent in their abilities in the new trading platform. As
online investors have access to vast quantities of investment date, their illusions of knowledge
and control further foster their overcon�dence.
Interestingly, these empirical �ndings can be alternatively account for by the implications
of information communication. Casual observation and anecdotal evidence suggest that rela-
tive to women, men are more prone to exchange news regarding asset performance and wealth
before. Agent's expected pro�t decreases simply because her demand is suboptimal. Their conclusions can beextended to the case in which the single overcon�dent insider is replaced by multiple ones.38Most studies assume that overcon�dence degree is �xed. Exceptions include Daniel, Hirshleifer and
Subramanyam (1998), Gervais and Odean (2001), and Xia (2007a).39Financial economists have extensively analyzed the return performance of equities managed by mutual
funds. Carhart (1997) �nd that mutual funds trade often and their trading hurts performance.
CHAPTER 2. COMMUNICATION AND CONFIDENCE IN NETWORKS 65
accumulation.40 Similarly, it is routine for online traders to participate in information shar-
ing and discussion on Internet stock message boards. My model predicts that information
sharing leads to excessive trading and return performance impairment.41
Apparently, information communication and overcon�dence explanations are largely com-
plementary in explaining market trading patterns and individual pro�ts. But in some aspects
they are also competing against each other. In particular, earlier psychological experiments,
requiring participants to respond to questions in isolated environment, seldom consider the
communication and peer e�ects in changing their con�dence degrees, while recent redesigned
experiments have documented that the agent's undercon�dence is also prevalent in decision
making. Prompted by these �ndings, Xia (2007a) provides reasonable conditions that exces-
sive price volatility can be associated with undercon�dence in a competitive economy �a la
Hellwig (1985). Garc��a, Sangiorgi and Uro�sevi�c (2007) show that, when overcon�dent and
rational agents coexist and information is endogenously acquired, agent's overcon�dence is
irrelevant to price volatility under certain conditions. Glaser and Weber (2004) also question
the connection between overcon�dence and trading volume by examining experimental data
and �eld data together. In light of these, future research can be directed to test the validity
and robustness of these two competing theories.
40Barber and Odean (2001) also �nd that, after controlling relevant variables, younger investors trademore actively than older investors while earning lower returns relative to a buy-and-hold portfolio, and thedi�erence in turnover and return performance are even more pronounced between single men and single women.Whether younger or single investors engage in more social communication than older and married investorsare interesting empirical questions.41The interested reader may challenge the results of welfare improvement of the peripheral agents in start
network as they are at odds with the empirical evidence. However, the con ict is mainly due to our modellingof information transmission. Consider a simple combination of circle and star networks in which each riskneutral agent has one private signal. One entertains a central role and sends her signal to all other agents, whileevery other peripheral sends her private signal to her right side neighbor. From preceding discussions, whenequilibrium is achieved in this network, we can predict the followings. There exists decreasing relationshipbetween correlation of demands and proximity between peripheral agents. The central agent's private signalhas more in uence on prices than others. Relative to non-communicating economy, market liquidity, pricevolatility and price e�ciency are all higher. Most importantly, all agents' trade more actively and theirexpected pro�ts are lower.

CHAPTER 2. COMMUNICATION AND CONFIDENCE IN NETWORKS 66
2.6 Conclusion
Recently a remarkable amount of empirical research has concentrated on testing the implica-
tions of information communication in �nancial markets, surprising though this body of work
has elicited little in terms of theoretical work. I extend the single period version of Kyle (1985)
by introducing one-way direct and truthful information transmission in the circle and star
networks. Despite the restrictive modelling choice, this endeavor is encouraging as the model
generates implications according well with empirical �ndings from individual trading behav-
ior to market trading patterns, enriches our understanding of �nancial markets in uential
thinking, and exhibits exibility in that it can be extended under more general assumptions
about market and information structures. In the paper the comparative statics of con�dence
on market trading patterns and individual welfare is contrary to some existing studies, which
encourages further scrutiny of communication and overcon�dence explanations.
Several directions of further research await exploring. On the empirical side, it is interest-
ing to examine the time series and cross sectional implications of information communication
in asset prices. Campbell et al. (2001) document a rise in volatility among publicly traded
companies. Is this an outcome that during last few decades the attention of news media and
�nancial press were more in favor of publicly traded companies? Also, it is interesting to test
the paper's predications of information utilization, con�dence changes in carefully designed
experiments.
On the theoretical side, some key questions are in order. First and foremost, as pointed
out earlier, incorporating information communication into Kyle (1985) has the advantage that
the e�ect of communication on trading can be distinguished from the information aggregation
role played by equilibrium price. A limitation of the analysis is that agents' non-strategic
information communication prior to trading appears to be at odds with their strategic use
of information afterwards.42 The paper provides a number of arguments that this behav-
ior is comprehensible, among which the most relevant supporting empirical evidence is that
informed agents fail to utilize their information to the fullest length. Nonetheless, the anal-
42Some extent of strategic information transmission won't change the main results. See footnote 6.
CHAPTER 2. COMMUNICATION AND CONFIDENCE IN NETWORKS 67
ysis would be more illuminating if the incentive compatibility of information communication
can be characterized in the strategic rational expectation framework. The aforementioned
voluntary disclosure literature may help �ll the gap and I plan to delve into it in the next
project.43 Second, recall that in laboratory experiments agents' con�dence degree is exam-
ined in no communication environment. In order to distinguish the competing explanations
of communication and overcon�dence, we need to study the joint e�ects of communication
and competition on investors' con�dence. Xia (2007a) show that, in a standard competitive
economy, existing asset pricing predications of agents' overcon�dence are not robust, therefore
this study leans toward supporting the communication explanation. As an another example
that communication can alternatively account for empirical �ndings that are attributed to
overcon�dence, Xia (2007c) attempts to connect repetitive information communication in
multi-period trading to the observed security markets under- and overreaction. Finally, the
synergy of network economics and �nance is a new and promising area. Information commu-
nication, or other sociological traits of trading behavior in social network, may raise a lot of
unexplored questions. For instance, what are the asset pricing implications if investors are
more inclined to share good news and withhold bad news, or vice versa? The investigation
shall shed light on our understanding of other puzzling phenomena in economics at large and
in �nance in particular.
2.A Appendix: Proofs of Main Text Results
Proof of Theorem 2.1. When proving the theorem we do not have to treat cases � 2
(0; 1) and � = 1 separately. Only the distribution of ~ri is relevant in maximization and the
distribution of ~ri when � = 1 is the limit of that when � 2 (0; 1). The proof has three steps.
Step one: Agent i, taking (2.3.6) with subscript j, for j 6= i, and (2.3.7) as given, chooses
43One conjecture is that traders are willing to communicate information truthfully before strategica tradingwhen there are multiple assets and information acquisition is costly. It could be bene�cial for each agent toobtain information of individual asset and share the information.

CHAPTER 2. COMMUNICATION AND CONFIDENCE IN NETWORKS 68
x�i to solve:
maxx�i
E
x�i
"~v � ��
Pj 6=i(��~sj + ��~rj) + x�i + ~u
!#����� ~si = si; ~ri = ri
!,
which is equivalent to (2.2.1) with Ii = (si; ri) and can be rewritten as
maxx�i
x�i
[1� ���� (n� 1)]E (~vjsi; ri)� ��x�i � ����
Pj 6=iE (~"j jsi; ri)� ����
Pj 6=iE (~rj jsi; ri)
!.
The solution is given by
x��i =1
2��[1� ���� (n� 1)]E (~vjsi; ri)�
1
2[��
Pj 6=iE (~"j jsi; ri) + ��
Pj 6=iE (~rj jsi; ri)].
The second order condition is �� > 0.
Because all random variables are normally distributed with zero means, by projection
theorem, there exists constant a1; a2; b1; b2; c1 and c2 such that:
E (~vjsi; ri) = a1si + a2ri, (2.A.1a)Pj 6=iE (~"j jsi; ri) = b1si + b2ri, (2.A.1b)
Pj 6=iE (~rj jsi; ri) = c1si + c2ri: (2.A.1c)
The equilibrium dictates
�� =[1� ���� (n� 1)] a1
2��� (��b1 + ��c1)
2,
�� =[1� ���� (n� 1)] a2
2��� (��b2 + ��c2)
2,
therefore we have
�� =A
��and �� =
B
��, (2.A.2)

CHAPTER 2. COMMUNICATION AND CONFIDENCE IN NETWORKS 69
where
A =a1 (2 + c2)� a2c1
[2 + b1 + a1 (n� 1)] (2 + c2)� [b2 + a2 (n� 1)] c1, (2.A.3a)
B =a2 (2 + b1)� a1b2
[2 + b1 + a1 (n� 1)] (2 + c2)� [b2 + a2 (n� 1)] c1. (2.A.3b)
Note that A and B are independent of ��.
The pricing rule set by market-maker must satisfy (2.2.2). Taking (2.3.6) as given,
E (~vj~! = !) =cov (~v; ~!)
var (~!)!,
therefore (2.3.7) satis�es (2.2.2) if �� satis�es
�� =cov (~v; ~!�)
var (~!�)=cov (~v;
Pni=1 ~x�i + ~u)
var(Pn
i=1 ~x�i + ~u)
=n (�� + ��) �
n2 (�� + ��)2�+ n (�� + ��)
2�+ .
Substituting in for �� and �� given by (2.A.2) yields
�� =
vuuthn (A+B)� n2 (A+B)2i�� n (A+B)2�
. (2.A.4)
Step two: The expression of network signal is
~ri = ~v +�Pn�1
k=0 (1� �)k ~"i+k+1
1� (1� �)n , when � 2 (0; 1) ,
~ri = ~si+1, when � = 1.
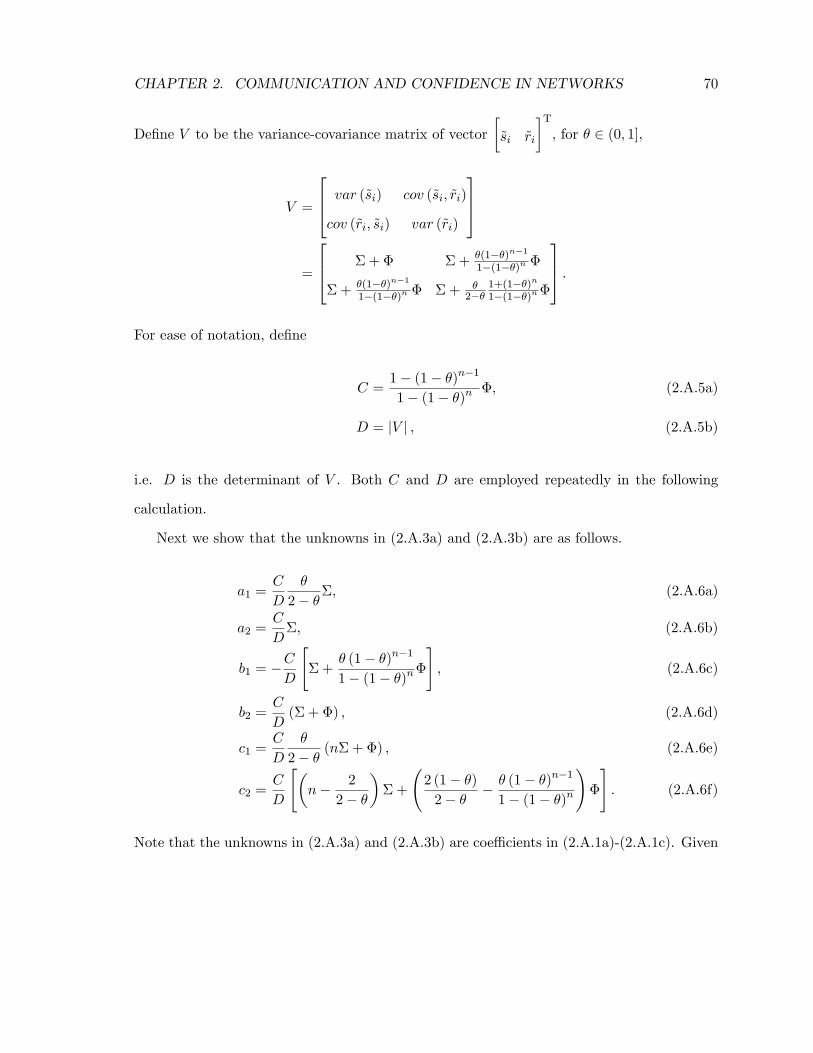
CHAPTER 2. COMMUNICATION AND CONFIDENCE IN NETWORKS 70
De�ne V to be the variance-covariance matrix of vector
�~si ~ri
�T, for � 2 (0; 1],
V =
264 var (~si) cov (~si; ~ri)
cov (~ri; ~si) var (~ri)
375=
264 �+ � �+ �(1��)n�11�(1��)n �
�+ �(1��)n�11�(1��)n � �+ �
2��1+(1��)n1�(1��)n�
375 .For ease of notation, de�ne
C =1� (1� �)n�1
1� (1� �)n �, (2.A.5a)
D = jV j , (2.A.5b)
i.e. D is the determinant of V . Both C and D are employed repeatedly in the following
calculation.
Next we show that the unknowns in (2.A.3a) and (2.A.3b) are as follows.
a1 =C
D
�
2� ��, (2.A.6a)
a2 =C
D�, (2.A.6b)
b1 = �C
D
"�+
� (1� �)n�1
1� (1� �)n�#, (2.A.6c)
b2 =C
D(� + �) , (2.A.6d)
c1 =C
D
�
2� � (n�+ �) , (2.A.6e)
c2 =C
D
"�n� 2
2� �
��+
2 (1� �)2� � � � (1� �)n�1
1� (1� �)n
!�
#. (2.A.6f)
Note that the unknowns in (2.A.3a) and (2.A.3b) are coe�cients in (2.A.1a)-(2.A.1c). Given
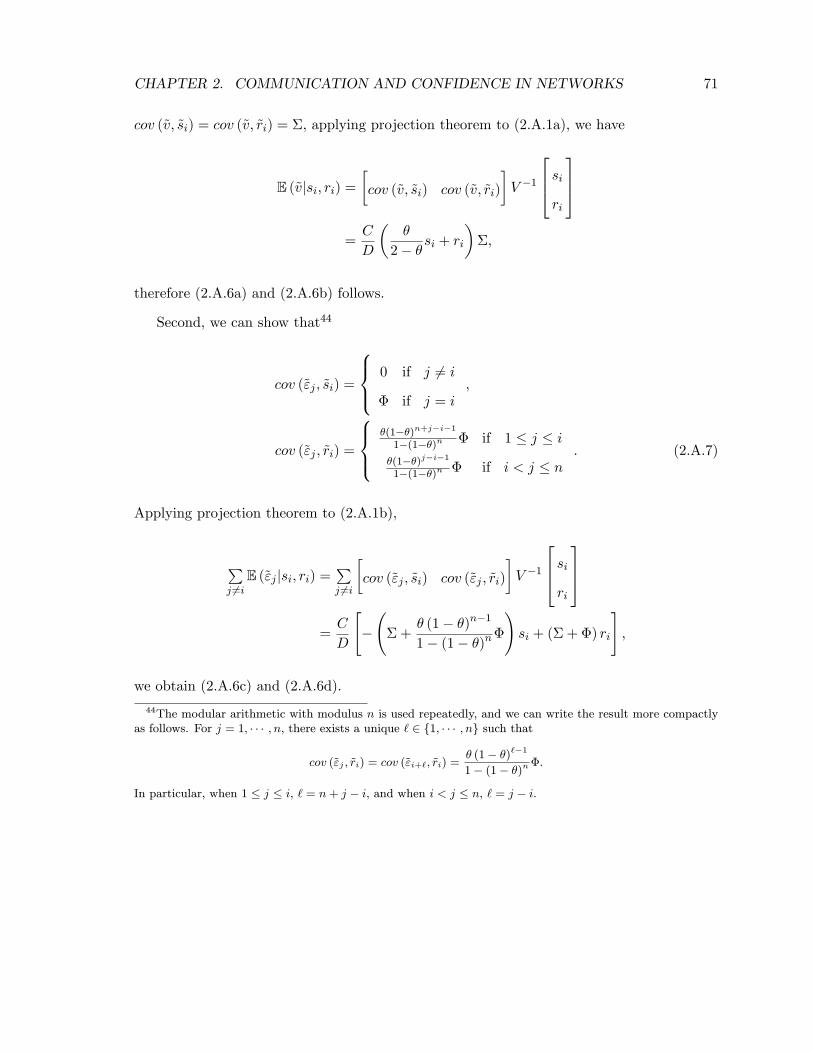
CHAPTER 2. COMMUNICATION AND CONFIDENCE IN NETWORKS 71
cov (~v; ~si) = cov (~v; ~ri) = �, applying projection theorem to (2.A.1a), we have
E (~vjsi; ri) =�cov (~v; ~si) cov (~v; ~ri)
�V �1
264 siri
375=C
D
��
2� �si + ri��,
therefore (2.A.6a) and (2.A.6b) follows.
Second, we can show that44
cov (~"j ; ~si) =
8><>: 0 if j 6= i
� if j = i,
cov (~"j ; ~ri) =
8><>:�(1��)n+j�i�11�(1��)n � if 1 � j � i
�(1��)j�i�11�(1��)n � if i < j � n
. (2.A.7)
Applying projection theorem to (2.A.1b),
Pj 6=iE (~"j jsi; ri) =
Pj 6=i
�cov (~"j ; ~si) cov (~"j ; ~ri)
�V �1
264 siri
375=C
D
"� �+
� (1� �)n�1
1� (1� �)n�!si + (� + �) ri
#,
we obtain (2.A.6c) and (2.A.6d).
44The modular arithmetic with modulus n is used repeatedly, and we can write the result more compactlyas follows. For j = 1; � � � ; n, there exists a unique ` 2 f1; � � � ; ng such that
cov (~"j ; ~ri) = cov (~"i+`; ~ri) =� (1� �)`�1
1� (1� �)n�.
In particular, when 1 � j � i, ` = n+ j � i, and when i < j � n, ` = j � i.

CHAPTER 2. COMMUNICATION AND CONFIDENCE IN NETWORKS 72
Finally, we can show that45
cov (~rj ; ~si) =
8><>: �+ �(1��)i�j�11�(1��)n � if 1 � j < i
�+ �(1��)n+i�j�11�(1��)n � if i � j � n
, (2.A.8)
cov (~rj ; ~ri) =
8><>: �+ �2��
(1��)i�j+(1��)n+j�i1�(1��)n � if 1 � j � i
�+ �2��
(1��)j�i+(1��)n+i�j1�(1��)n � if i � j � n
. (2.A.9)
Applying projection theorem to (2.A.1c),
Pj 6=iE (~rj jsi; ri) =
Pj 6=i
�cov (~rj ; ~si) cov (~rj ; ~ri)
�V �1
264 siri
375=C
D
�
2� � (n�+ �) si
+C
D
"�n� 2
2� �
��+
2 (1� �)2� � � � (1� �)n�1
1� (1� �)n
!�
#ri,
we obtain (2.A.6e) and (2.A.6f).
Step three: Now it is ready to capture the algorithm for calculating trading intensity
parameters ��; �� and liquidity parameter ��. We �rst calculate A and B, de�ned in (2.A.3a)
and (2.A.3b), by substituting (2.A.5a)-(2.A.6f), then �� follows from (2.A.4). Second we get
�� and �� from (2.A.2). Very lengthy algebra yields the �nal results given by (2.3.8)-(2.3.10)
in the main text. Uniqueness is obtained. Next we examine the second order condition.
Observe that
�� =�p
r2n [1� (1� �)n]
�2 [1� (1� �)n] � + �[1 + (1� �)n�1]�
�2 (n+ 1) [1� (1� �)n] � + [(3� � 2) (1� �)n�1 + 2 + �]�
,
45Equivalently, for j = 1; � � � ; n, there exists a unique ` 2 f0; � � � ; n� 1g such that
cov (~rj ; ~si) = cov (~ri+`; ~si) = � +� (1� �)n�`�1
1� (1� �)n �,
cov (~rj ; ~ri) = cov (~ri+`; ~ri) = � +�
2� �(1� �)` + (1� �)n�`
1� (1� �)n �.
In particular, when 1 � j < i, ` = n+ j � i, and when i � j � n, ` = j � i.

CHAPTER 2. COMMUNICATION AND CONFIDENCE IN NETWORKS 73
because n > 1, � 2 (0; 1] and (3� � 2) (1� �)n + 2 + � = 2 [1� (1� �)n] + �[1 + (1� �)n�1],
thus �� > 0 is satis�ed. This completes the proof.
Proof of Proposition 2.1. The proof for the �rst part is provided in the main text. For the
second part, since var (~x�i+`) = var (~x�i+j) for any ` and j, by de�nition of corr (~x�i; ~x�i+`)
we only need to examine the covariance term, that is,
cov (~x�i; ~x�i+`) = �2�cov (~si; ~si+`) + ���� [cov (~si; ~ri+`) + cov (~si+l; ~ri)] + �2�cov (~ri; ~ri+`)
(2.A.10)
Note the results (2.A.7)-(2.A.9) in the proof of Theorem 2.1. We have
cov (~si; ~ri+`) = � +� (1� �)n�`�1
1� (1� �)n �,
cov (~si+`; ~ri) = � +� (1� �)`�1
1� (1� �)n�,
cov (~ri; ~ri+`) = � +�
2� �(1� �)` + (1� �)n�`
1� (1� �)n �.
Substituting these covariance terms and �� = (���) = (2� �) into (2.A.10) and examining the
terms involving `, we only need to show
(1� �)` + (1� �)n�`
is strictly decreasing in integer ` 2 (0; n=2]. Apparently, this is the case. Now we know that
for i 2 N , n � 4 and 1 � ` < j � n=2,
corr (~x�i; ~x�i+`) > corr (~x�i; ~x�i+j) .
The symmetry leads to
corr (~x�i; ~x�i�`) = corr (~x�i; ~x�i+`) ,
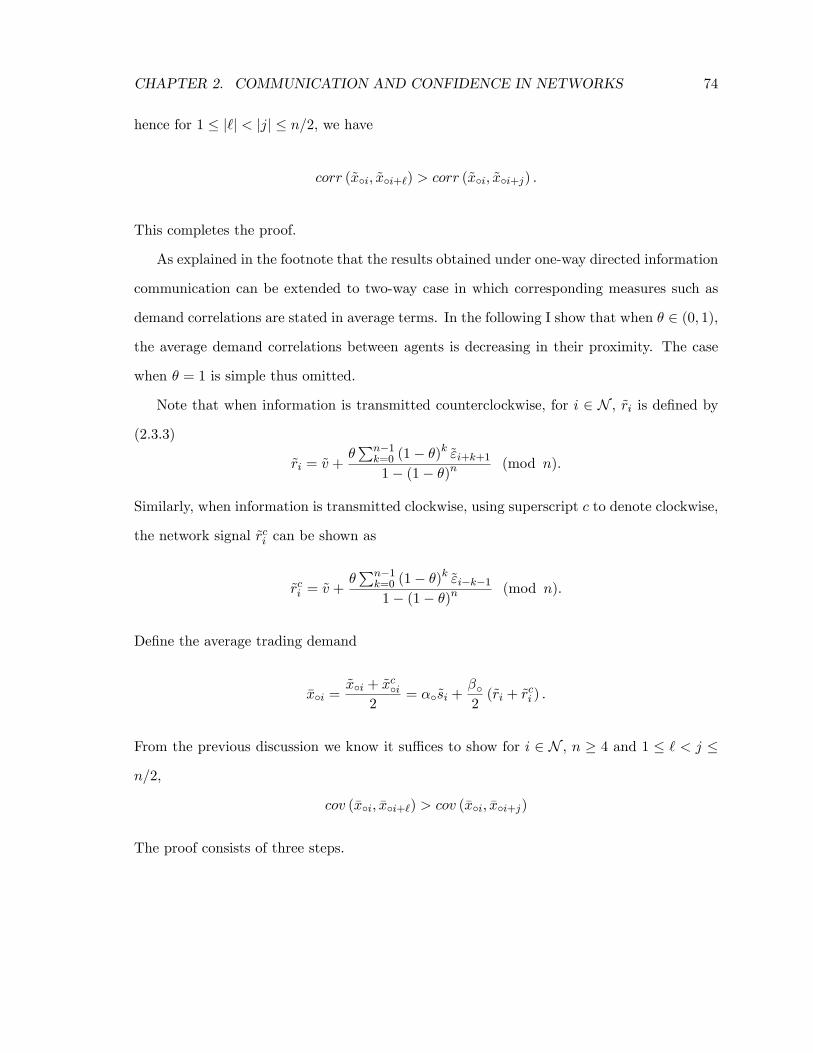
CHAPTER 2. COMMUNICATION AND CONFIDENCE IN NETWORKS 74
hence for 1 � j`j < jjj � n=2, we have
corr (~x�i; ~x�i+`) > corr (~x�i; ~x�i+j) .
This completes the proof.
As explained in the footnote that the results obtained under one-way directed information
communication can be extended to two-way case in which corresponding measures such as
demand correlations are stated in average terms. In the following I show that when � 2 (0; 1),
the average demand correlations between agents is decreasing in their proximity. The case
when � = 1 is simple thus omitted.
Note that when information is transmitted counterclockwise, for i 2 N , ~ri is de�ned by
(2.3.3)
~ri = ~v +�Pn�1
k=0 (1� �)k ~"i+k+1
1� (1� �)n (mod n).
Similarly, when information is transmitted clockwise, using superscript c to denote clockwise,
the network signal ~rci can be shown as
~rci = ~v +�Pn�1
k=0 (1� �)k ~"i�k�1
1� (1� �)n (mod n).
De�ne the average trading demand
�x�i =~x�i + ~xc�i
2= ��~si +
��2(~ri + ~r
ci ) .
From the previous discussion we know it su�ces to show for i 2 N , n � 4 and 1 � ` < j �
n=2,
cov (�x�i; �x�i+`) > cov (�x�i; �x�i+j)
The proof consists of three steps.
CHAPTER 2. COMMUNICATION AND CONFIDENCE IN NETWORKS 75
Step one: Consider integer ` 2 (0; n), we have
cov (�x�i; �x�i+`) = cov
���~si +
��2(~ri + ~r
ci ) ; ��~si+` +
��2
�~ri+` + ~r
ci+`
��= �2��+
����2
�cov
�~si; ~ri+` + ~r
ci+`
�+ cov (~si+`; ~ri + ~r
ci )�
+�2�4cov
�~ri + ~r
ci ; ~ri+` + ~r
ci+`
�. (2.A.11)
Note the results (2.A.7)-(2.A.9) in the proof of Theorem 2.1. Using the de�nition of ~ri and
~rci , we can show that
cov (~si; ~ri+`) = cov (~si+`; ~rci ) = � +
� (1� �)n�`�1
1� (1� �)n �,
cov (~si+`; ~ri) = cov�~si; ~r
ci+`
�= �+
� (1� �)`�1
1� (1� �)n�,
cov (~ri; ~ri+`) = cov�~rci ; ~r
ci+`
�= �+
�
2� �(1� �)` + (1� �)n�`
1� (1� �)n �,
cov�~ri; ~r
ci+`
�= �+
�2 (1� �)`�2 [(`� 1) + (n� `+ 1) (1� �)n][1� (1� �)n]2
�,
cov (~ri+`; ~rci ) = � +
�2 (1� �)n�`�2 [(n� `� 1) + (`+ 1) (1� �)n][1� (1� �)n]2
�.
Substituting these covariance terms and �� = (���)= (2� �) into (2.A.11) and examining the
only terms involving `, we need to show that
f (`) =1� �2
2� �
h(1� �)` + (1� �)n�`
i+� (1� �)` [(`� 1) + (n� `+ 1) (1� �)n]
2 [1� (1� �)n]
+� (1� �)n�` [(n� `� 1) + (`+ 1) (1� �)n]
2 [1� (1� �)n]
is strictly decreasing in integer ` 2 (0; n=2].46 When n = 2 or 3 this is trivial. When n � 4,
there is no simple way to get the desired result by examining the di�erentiation of f (`). We
choose to prove f (`)� f (`+ 1) > 0 for 1 � ` < `+ 1 � n=2.
46Because f (`) = f (n� `), this implies that f (`) is strictly increasing in n=2 � ` < n.

CHAPTER 2. COMMUNICATION AND CONFIDENCE IN NETWORKS 76
Step Two: To simplify notation, let � = 1� � and m = n� `. The target function can
be written as
f (`) = �f1 (`) +�
2f2 (`) ,
where
� =1� �2
2� � ��
2+
�n
2 (1� �n) ��n
2,
f1 (`) = �` + �m,
f2 (`) = �``+ �mm.
Notice that m depends on `, but � does not.
Consider n � 4 and 0 < ` < `+ 1 � n=2, since
f1 (`)� f1 (`+ 1) = �` � �`+1 + �m � �m�1
= ���` � �m�1
�,
f2 (`)� f2 (`+ 1) = �``� �`+1 (`+ 1) + �mm� �m�1 (m� 1)
= �` (�`� �)� �m�1 (�m� 1) ,
we have
f (`)� f (`+ 1) = ����` � �m�1
�+�
2
h�` (�`� �)� �m�1 (�m� 1)
i=��`
2
h2��1� �m�`�1
�+ �`� � � �m�m�`�1 + �m�`�1
i=��`
2[(1� �m� 2�) (�q � 1)� �q]
where q = m� `� 1 � 1 because 1 � ` < `+ 1 � n=2.

CHAPTER 2. COMMUNICATION AND CONFIDENCE IN NETWORKS 77
Next we only need to prove
(1� �m� 2�) (�q � 1)� �q > 0
, (�m+ 2�� 1) (1� �q) > �q
,�n+ q + 1
2+2�� 1�
�>
q
1� �q
,��1� 2�2� � �
1
2
�+
�n
1� �n �n
2
��>
q
1� �q �q
2
, �3�2� � + n
1 + �n
1� �n > q1 + �q
1� �q
De�ne
g1 (q) = q1 + �q
1� �q .
In step three we prove that g1 (q) is strictly increasing and strictly convex. Note that n � q+3
and g01 (q) > 0, we only need to prove the following
g2 (q) =�3�2� � + g1 (q + 3)� g1 (q) > 0.
Since g001 (q) > 0, we have
g02 (q) = g01 (q + 3)� g01 (q) > 0,
therefore g2 (q) � g2 (1) as q � 1. On the other hand, g2 (1) can be simpli�ed as
g2 (1) =4�2�
1� �4 > 0,
therefore g2 (q) > 0 for all q � 1. It follows that f (`) � f (`+ 1) > 0 when n � 4 and
1 � ` < `+ 1 � n=2.
Step Four: We need to prove that g01 (q) > 0 and g001 (q) > 0. By straightforward comput-
ing, we have
g01 (q) =1� �2q + 2�qq log �
(1� �q)2.
CHAPTER 2. COMMUNICATION AND CONFIDENCE IN NETWORKS 78
Let # = �q and
g3 (#) =1� #2 + 2# log #
(1� #)2,
we have # < 1 and g01 (q) = g3 (#). Since 1�#2+2# log # is decreasing in # (the derivative is
2 (log #� #+ 1) < 0), it achieves the minimum value at # = 1, therefore 1�#2+2# log # > 0
on # 2 (0; 1), and g2 (#) > 0, hence g01 (q) > 0.
To prove g001 (q) > 0, we only need to show
g03 (#) = 2(#+ 1) log #� 2#+ 2
(1� #)3< 0.
The derivative of the numerator is (#+ 1) =# + log # � 2 = log # + 1 � 1=# > 0, therefore
the numerator achieves its maximum value at # = 1, hence the numerator is negative, and
g03 (#) < 0. It follows that g001 (q) > 0.
Proof of Proposition 2.2. To see that the precision of ~ri is strictly higher than that of ~si
for i 2 N , it su�ces to show
var (~ri) < var (~si)
, �+�
2� �1 + (1� �)n
1� (1� �)n� < �+ �
, 1� (1� �)1� (1� �)n
1 + (1� �)n
1 + (1� �) < 1. (2.A.13)
The last inequality holds naturally since given � 2 (0; 1) and n > 1, we have (1� �)n < 1��.
To prove the precision of ~ri is strictly decreasing in � 2 (0; 1], notice that we have shown
that the precision of ~ri when � 2 (0; 1) is higher than that when � = 1. We only need to show�2��
1+(1��)n1�(1��)n is strictly increasing in � 2 (0; 1). Equivalently, we can verify log
h�2��
1+(1��)n1�(1��)n
iis strictly increasing in � 2 (0; 1). This requires
1
�+
1
2� � �n (1� �)n�1
1 + (1� �)n �n (1� �)n�1
1� (1� �)n > 0.
CHAPTER 2. COMMUNICATION AND CONFIDENCE IN NETWORKS 79
Simplifying it leads to
(1� �)2n + n� (2� �) (1� �)n�1 < 1.
Let � = 1� �, manipulation yields
��n � �nn
> ��1 � �. (2.A.14)
Given � 2 (0; 1), it is ready to see that the left hand side of (2.A.14) as a function of n is
strictly increasing in n > 0, so the inequalities holds when n > 1.
Proof of Proposition 2.3. When � = 1, we have ~ri = ~rNi = ~si+1 (mod n). The equal
reliance result follows immediately by inspection of (2.3.8). When � 2 (0; 1), (2.3.8) also
reveals that agent relies less on private signal than on network signal, i.e. �� < ��. The
result regarding the comparison of private and net network signals requires
�� +� (1� �)n
1� (1� �)n�� < ��
, �
2� � +� (1� �)n
1� (1� �)n < 1
, �
2� �1 + (1� �)n+1
1� (1� �)n < 1
The last inequality holds with reference to (2.A.13).
Proof of Proposition 2.4. We know that market liquidity parameter is given by (2.3.10).
We �rst show that in equilibrium, expected trading volume, price volatility, price e�ciency
CHAPTER 2. COMMUNICATION AND CONFIDENCE IN NETWORKS 80
and agent's expected pro�t in the circle network are respectively given by
E( ~V�) =r
2�
1 +
pn+
s(n+ 1)� + ��
�+ ��
!, (2.A.15)
var (~p�) =n�2
(n+ 1)� + ��, (2.A.16)
[var (~vj~p�)]�1 =(n+ 1)� + ��
� (� + ��), (2.A.17)
�� =�
(n+ 1)� + ��
r (� + ��)
n, (2.A.18)
where
� =�[1 + (1� �)n�1]2 [1� (1� �)n] , (2.A.19)
� =(3� � 2) (1� �)n�1 + 2 + �
2 [1� (1� �)n] . (2.A.20)
When n = 2, � and � are independent of � 2 (0; 1].
Using the respective de�nitions, when equilibrium is achieved in the circle network we
CHAPTER 2. COMMUNICATION AND CONFIDENCE IN NETWORKS 81
have47
E( ~V�) =1
2E�
nPi=1j~x�ij+ j~uj+ j~!�j
�
=np2�
vuut(�� + ��)2�+"�2� + �
2�
�
2� �1 + (1� �)n
1� (1� �)n + 2����� (1� �)n�1
1� (1� �)n
#�
+
r
2�+
rn2(�� + ��)
2�+ n(�� + ��)2�+
2�,
var (~p�) = var
���
�nPi=1
��~si + ��~ri + ~u
��= �2�
hn2 (�� + ��)
2�+ n (�� + ��)2�+
i,
[var (~vj~p�)]�1 =hvar (~v)� cov (~v; ~p�) [var (~p�)]�1 cov (~v; ~p�)
i�1=n2 (�� + ��)
2�+ n (�� + ��)2�+
�hn (�� + ��)
2�+ i ,
�� = E [~x�i (~v � ~p�)]
= (�� + ��) �� �� (�� + ��)2 (n�+ �) .
Substituting in for ��, �� and �� given by (2.3.8)-(2.3.10) yields (2.A.15)-(2.A.18)
In the absence of information communication, the corresponding values in otherwise iden-
tical economy are given by (2.B.4), (2.B.5)-(2.B.7) in Appendix 2.B. The proof has three
parts.
Part one (market liquidity): Recall that market liquidity is measured by 1=�. So when
market is more liquid, � is smaller. We have to show
�p
r2n [1� (1� �)n]
�2 [1� (1� �)n] � + �
h1 + (1� �)n�1
i��
2 (n+ 1) [1� (1� �)n] � +h(3� � 2) (1� �)n�1 + 2 + �
i�
<�
(n+ 1)� + 2�
rn (� + �)
.
It is equivalent to
� + ��
[(n+ 1)� + ��]2<
�+ �
[(n+ 1)� + 2�]2, (2.A.21)
where (2.A.19) and (2.A.20) are de�ned above. Given the fact that � = 1+ �, simple algebra
47Here a statistic formula is employed. Let ~y be a normally distributed random variable and ~y � N (0;�),then E j~yj =
p2�=�

CHAPTER 2. COMMUNICATION AND CONFIDENCE IN NETWORKS 82
shows that (2.A.21) holds if � < 1 which is indeed the case,
� =1� (1� �)1� (1� �)n
1 + (1� �)n�1
2< 1.
This part of proof only requires n > 1.
To prove when n > 2 market liquidity is strictly decreasing in con�dence degree � 2 (0; 1]
is equivalent to proving d��=d� > 0 when n > 2, so it su�ces to show the left side of (2.A.21)
is strictly increasing in � when n > 2. Observe that
� + ��
[(n+ 1)� + ��]2=
�+ ��
[(n+ 1)� + (1 + �) �]2= g (�) ,
the denominator of g0 (�) is strictly positive, so is numerator of g0 (�) given � < 1:Thus
d��=d� > 0. Here we only need n > 1.
Since d��=d� = (d��=d�) (d�=d�), the �nal step is to verify d�=d� > 0. Using the similar
method shown in the proof of Proposition 2 and let � = 1� �, the proof requires
��(n�1) � �n�1n� 1 > ��1 � �,
which is valid when n > 2.
Part two (expected trading volume): Comparing (2.A.15) and (2.B.5), we have to show
(n+ 1)� + ��
�+ ��>(n+ 1)� + 2�
� + �.
Back-of-envelop algebra shows that it holds given � = 1 + � and � < 1.
Similar method shown in the part one is used to verify that the expected trading volume
is strictly decreasing in con�dence parameter � when n > 2.
Part three (price volatility and price e�ciency): A comparison of price volatilities
(2.A.16) and (2.B.6) we have
n�2
(n+ 1)� + ��>
n�2
(n+ 1)� + 2�
CHAPTER 2. COMMUNICATION AND CONFIDENCE IN NETWORKS 83
immediately because � = 1+ � < 2. This fact also guarantees that the following relationship
between price e�ciencies under di�erent scenarios when comparing (2.A.17) and (2.B.7).
(n+ 1)� + ��
� (� + ��)>(n+ 1)� + 2�
� (� + 2�).
Finally, given d�=d� = d�=d� it is straightforward to see that price volatility and price
e�ciency are strictly decreasing in con�dence parameter when n > 2.
Proof of Proposition 2.5. In di�erent scenarios, the expected pro�ts are given by (2.A.18)
and (2.B.8) respectively. We �rst show the former is smaller when n > 1, that is,
�
(n+ 1)� + ��
r (� + ��)
n<
�
(n+ 1)� + 2�
r (� + �)
n.
This is equivalent to (2.A.21). For monotonicity result, we only have to show �+��
[(1+n)�+��]2
is strictly increasing in con�dence degree � 2 (0; 1] when n > 2. Both have been veri�ed in
part one of the preceding proof.
Proof of Proposition 2.6. When � 2 (0; 1], (2.3.8) delivers the result immediately.
Proof of Theorem 2.2. The proof consists of two steps.
Step one: Central agent 1, taking (2.4.3) for i 6= 1, and (2.4.4) as given, chooses x?1 to
maximize
E�x?1
�~v � �?
�x?1 +
nPi=2( ?~si + �?~ri) + ~u
������ s1; r1�=�(s1 + r1)
2� + �([1� �? ? (n� 1)]x?1 � �?�? (n� 1)) [�s1 + (1� �) r1]x?1 � �x2?1 (2.A.22)
because
E (~vjs1; r1) = E (~sijs1; r1) =� (s1 + r1)
2� + �. (2.A.23)
The second order condition is �? > 0.

CHAPTER 2. COMMUNICATION AND CONFIDENCE IN NETWORKS 84
Peripheral agent i 6= 1, taking (2.4.2), (2.4.3) with subscript j > 1 and j 6= i, and (2.4.4),
chooses xi to maximize
E
x?i
"~v � �?
�?~s1 + �?~r1 + x?i +
Pj>1;j 6=i
( ?~sj + �?~rj) + ~u
!#����� si; ri = rj
!
= x?iE (~vjsi; s1)� �?x2i � �?x?i [�?E (~s1jsi; ri) + �?E (~r1jsi; ri)]
� �?x?i
" ?
Pj>1;j 6=i
E (~sj jsi; ri) + �?P
j>1;j 6=iE (~rj jsi; ri)
#(2.A.24)
The second order condition is �? > 0.
De�ne
� = � (1� �) ,
because of (2.4.1),
~ri = �~s1 + (1� �) ~r1,
by projection theorem we have
E (~vjsi; ri) = E (~r1jsi; ri) = E (~sj jsi; ri) =� [(1� 2�) si + ri]
2 (1��)� + (1� 2�)�,
E (~rj jsi; ri) = ri.
Solving (2.A.22) and (2.A.24) and imposing equilibrium requirement yields
�? =1
2�?
� [1� �? ? (n� 1)]2� + �
� �? (n� 1) �2
,
�? =1
2�?
� [1� �? ? (n� 1)]2� + �
� �? (n� 1) (1� �)2
,
? =1
2�?
(1� 2�)� [1� �? (�? + �? + (n� 2) ?)]2 (1��)� + (1� 2�)� ,
�? =1
2�?
� [1� �? (�? + �? + (n� 2) ?)]2 (1��)� + (1� 2�)� � (n� 2) �?
2.
Manipulation leads to (2.4.8)
�? =2 ?
n (1� 2�),
CHAPTER 2. COMMUNICATION AND CONFIDENCE IN NETWORKS 85
and
�? =1
�?
h2n (� � 1)2 + 2� + 1
i�+ 2 [n (1� �) (1� 2�) + �] �
2 (e�2 + f��+ g�2), (2.A.26a)
�? =1
�?
�2n�2 � 2� + 3
��+ 2 [n� (2� � 1)� � + 1]�
2 (e�2 + f��+ g�2), (2.A.26b)
? =1
�?
n (1� 2�)� (� + �)(e�2 + f��+ g�2)
, (2.A.26c)
where
e = (n+ 1) [n (1� 2�) + 2] ,
f = n (n+ 4) (1� 2�) + n+ 1,
g = 2n (1� 2�) .
Taking (2.4.2) and (2.4.3) as given, market-maker knows that ~!? = �?~s1 + �?~r1 +Pni=2 ( ?~si + �?~r) + ~u and sets �? in the familiar manner,
�? =cov (~v; ~!?)
var (~!?),
where
cov (~v; ~!?) = [�? + �? + (n� 1) ( ? + �?)] �,
var (~!?) = [�? + �? + (n� 1) ( ? + �?)]2�
+h(�? + �? (n� 1) �)2 + (�? + �? (n� 1) (1� �))2 + (n� 1) 2?
i�+ .
Substituting in for �?, �?, ? and �? as given in (2.A.26a)-(2.A.26c) and (2.4.8) yields (2.4.9)
in the main text:
�? =�pa�3 + b�2�+ c��2 + d�3p2 (e�2 + f��+ g�2)
,
CHAPTER 2. COMMUNICATION AND CONFIDENCE IN NETWORKS 86
where
a = 2n [n (1� 2�) + 2]2 ,
b = 6n3 (1� 2�)2 + 4n2�3�2 � 11� + 4
�+ 4n (4� 3�) + 4�� 5,
c = 6n3 (1� 2�)2 + 8n2�3�2 � 4� + 1
�+ (4n� 2) (3� 4�) ,
d = 2 (1� 2�)�n2 [n� 2 (n+ 1)�] + 2n� 1
�.
Step two: We obtain the unique solution of (2.4.5)-(2.4.7) in the main text from (2.A.26a)-
(2.A.26c) and (2.4.9). Finally we show that �? > 0 is satis�ed. First note that n > 1 and
0 � � = � (1� �) � 1=4, so 1� 2� � 1=2 and the constants e, f , and g are strictly positive.
Secondly, it is easy to show the constants a, b, c and d given in are strictly positive. In par-
ticular, b > 0 follows from 3�2�11�+4 � 23=16, 4�3� � 13=4 and 4n (4� 3�)+4��5 >
4 (4� 3�)+4�� 5 = 11� 8� � 9. c > 0 follows from 3�2� 4�+1 � 3=16, and 3� 4� � 2,
and d > 0 follows from n� 2 (n+ 1)� � n� (n+ 1) =2 = (n� 1) =2 > 0.
Proof of Proposition 2.7. In equilibrium, we have
~p? = �?
�[�? + �? (n� 1) �] ~s1 + [�? + �? (n� 1) (1� �)] ~r1 +
nPi=2
?~si + ~u
�
where �?, �?, ? and �? are given by (2.4.5)-(2.4.8), thus for i 6= 1,
@p?=@s1@p?=@si
=�? + �? (n� 1) �
?
=
�2n�2 + 2n� 2� + 1
��+
�4n�2 � 2n� + 2n� 2�
��
2n[�2 + (1� �)2] (� + �).
We have
@p?=@s1@p?=@si
� 1 =��2n�2 + (4n� 2) � + 1
��+ 2� (n� 1)�
2n[�2 + (1� �)2] (� + �)> 0.
The inequality holds because when � 2 [0; 1] and n > 1, analysis reveals that �2n�2 +
(4n� 2) � + 1 � 1. Hence @p?=@s1 > @p?=@si.

CHAPTER 2. COMMUNICATION AND CONFIDENCE IN NETWORKS 87
Since it is cumbersome to directly calculate the upper bound of (@p?=@s1) = (@p?=@si) and
verify it is �nite, we instead choose to prove that, for n > 1,
@p?=@s1@p?=@si
< 3.
Calculation gives
3� @p?=@s1@p?=@si
=
�10n�2 � (12n� 2) � + 4n� 1
��+
�8n�2 � (10n� 2) � + 4n
��
2n[�2 + (1� �)2] (� + �)> 0.
The inequality holds because when � 2 [0; 1], analysis reveals that
10n�2 � (12n� 2) � + 4n� 1 � 4n2 + 2n� 110n
> 0,
8n�2 � (10n� 2) � + 4n � 7n2 + 10n� 18n
> 0.
Similarly, the conclusions are valid for signal r1.
Proof of Proposition 2.8. This is obvious since var (~ri) = � +h�2 + (1� �)2
i� from
(2.4.1).
Proof of Proposition 2.9. This is a direct corollary of Theorem 2.2.
Proof of Proposition 2.10. We take a di�erent approach than the proof of Proposition
4. We �rst show that the monotonicity part. Then we verify that when market statistics
in the star network achieve their lowest values, they are still larger than the corresponding
statistics in no communication economy.
Notice that a?; �?; ?; �? and �? given by (2.4.5)-(2.4.9) are symmetric by � = 1=2. Hence
when a market statistics is strictly increasing in � 2 [0; 1=2], it must be strictly decreasing in
� 2 [1=2; 1].
As an example, we show that market liquidity has the asserted properties. To prove that
CHAPTER 2. COMMUNICATION AND CONFIDENCE IN NETWORKS 88
market liquidity, measured by 1=�?, is strictly increasing in � 2 [0; 1=2], it su�ces to prove
�2? is strictly decreasing in � 2 [0; 1=2]. By straightforward computing,
d�2?d�
=2�2� (� + �) (n� 1) (2� � 1)
��a�3 +�b�2�+ �c��2 + �d�3
� (e�2 + f��+ g�2)
where e; f; g are given in the proof of Theorem 2.2 and
�a = n3 (5� 4�) + n2 (3 + 10�)� 2n (3��) + 2,
�b = 4n3 (2� 3�) + 6n2 (1 + �)� 5n (3� 2�) + 3,
�c = (n� 1) (3n [n+ 3� 2 (n+ 2)�]� 1) ,
�d = 2n (n� 1) (1� 2�) .
Since n > 1 and � 2 [0; 1=4] it is easy to see that they are strictly positive, therefore
sign
�d�2?d�
�= sign [2� � 1] .
The desired monotonicity property follows.
To prove that market liquidity in the star network is higher than that in no communication
economy, comparing (2.4.9) and (2.B.14) we have to show
pa�3 + b�2�+ c��2 + d�3
e�2 + f��+ g�2
������=0
<
q2n (� + �)3 +�(3�2 + 6�� + 2�2)
(n+ 1)�2 + (n+ 4)�� + 2�2(2.A.28)
where e; f; g; a; b; c; d are given in the proof of Theorem 2.2. Equivalently, we have to show
2n (n+ 2)2�3 +
�6n3 + 16n2 + 16n� 5
��2�+
�6n3 + 8n2 + 12n� 6
���2 + 2
�n3 + 2n� 1
��3
[(n+ 1) (n+ 2)�2 + (n2 + 5n+ 1)�� + 2n�2]2
�2n (� + �)
3+�
�3�2 + 6�� + 2�2
�[(n+ 1)�2 + (n+ 4)�� + 2�2]
2 < 0.
The left hand side, when fractions are combined, has a strictly positive denominator while

CHAPTER 2. COMMUNICATION AND CONFIDENCE IN NETWORKS 89
the numerator is calculated to be
�� (� + �) (a�5 + b�4�+ c�3�2 + d�2�3 + e��4 + f�5)
where
a = 7n4 + 2n3 � 24n2 � 2n+ 17,
b = 21n4 + 36n3 � 86n2 � 36n+ 65,
c = 4(5n4 + 20n3 � 26n2 � 29n+ 30),
d = 2 (n� 1)2 (3n2 + 37n+ 55),
e = 16 (n� 1)2 (n+ 3) ,
f = 8 (n� 1)2 .
They are all strictly positive given n > 1. We get the desired result.
For the rest of market statistics, by de�nitions we �rst calculate that
E( ~V?) =1p2�
"p+
pvar (~p?)
�?+q(�? + �?)
2�+��2? + �
2?
��
+ (n� 1)q( ? + �?)
2�+� 2? + �
2?
�2�2 � 2� + 1
���
�, (2.A.29)
var (~p?) = �2?
�[�? + �? + (n� 1) ( ? + �?)]2�+
�+ �2?
�[�? + �? (n� 1) �]2 + [�? + �? (n� 1) (1� �)]2 + (n� 1) 2?
��,
(2.A.30)
[var (~vj~p?)]�1 =var (~p?) =�
2?
�h+
�[�? + �? (n� 1) �]2 + [�? + �? (n� 1) (1� �)]2 + (n� 1) 2?
��i .
(2.A.31)
For the sake of the space we do not substitute in �?, �?, ?, �? and �?. When doing so,
lengthy algebra shows that (2.A.29)-(2.A.31) are strictly increasing in � 2 [0; 1=2] and are
strictly decreasing in � 2 [1=2; 1].4848The general form of the expected volume is involved, but to show its monotonicity property we only need
CHAPTER 2. COMMUNICATION AND CONFIDENCE IN NETWORKS 90
To prove asserted �rst part for expected volume, price volatility and price e�ciency, we
only need to show they are true when � = 0 or � = 1, both of which give the same and lowest
values. In the star network, E( ~V?) j�=0 is
pp2�
"s2 [n (n+ 2) (� + �)� �] [(n+ 1) (n+ 2)�2 + (n2 + 5n+ 1)�� + 2n�2]
2n (n+ 2)2 �3 + (6n3 + 16n2 + 16n� 5)�2�+ (6n3 + 8n2 + 12n� 6)��2 + 2 (n3 + 2n� 1)�3
+
s2 (n+ 2)2 �3 + (6n2 + 14n+ 13)�2�+ 2 (3n2 + 3n+ 4)��2 + 2 (n2 + 1)�3
2n3 (� + �)3 + 8n2� (� + �)2 + 4n (� + �) (2�2 + 2�� + �2)� � (5�2 + 6�� + 2�2)
+
s2 (n� 1)2 (� + �)2
�(n+ 2)2 �+ (n2 + 4)�
�2n3 (� + �)3 + 8n2� (� + �)2 + 4n (� + �) (2�2 + 2�� + �2)� � (5�2 + 6�� + 2�2)
+ 1
35 (2.A.32)
and
var (~p?) j�=0 =n (n+ 2)�3 +
�n2 + 2n� 1
��2�
(n+ 1) (n+ 2)�2 + (n2 + 5n+ 1)�� + 2n�2, (2.A.33)
[var (~vj~p?)]�1 j�=0 =(n+ 1) (n+ 2)�2 +
�n2 + 5n+ 1
���+ 2n�2
� (� + �) [(n+ 2)� + 2n�], (2.A.34)
Algebra reveals that (2.A.32)-(2.A.34) are larger than the corresponding statistics (2.B.15)-
(2.B.17) in no communication economy.49
to show that the expectations ofPn
i=1 j~x?ij and j~!?j are strictly increasing in � 2 [0; 1=2] respectively. Thegeneral form of the price volatility and price e�ciency is relatively simple. Speci�cally,
var (~p?) =n [n (1� 2�) + 2]�3 +
�n2 (1� 2�) + 2n (1� 2�)� 1
��2�
(n+ 1) [n (1� 2�) + 2]�2 + [n (n� 2 (n+ 4)� + 5) + 1]�� + 2n (1� 2�)�2 ,
[var (~vj~p?)]�1 =(n+ 1) [n (1� 2�) + 2]�2 + [n (n� 2 (n+ 4)� + 5) + 1]�� + 2n (1� 2�)�2
� (� + �) [(n (1� 2�) + 2)� + 2n (1� 2�)�] .
49Note that the expression of expected volume in star network when � = 0 and that in island economy 2 areinvolved, but we only need to show each term in (2.A.32) is equal to or higher than the corresponding termin (2.B.15).
CHAPTER 2. COMMUNICATION AND CONFIDENCE IN NETWORKS 91
Proof of Proposition 2.11. By de�nition we calculate expected pro�ts
�1? = (�? + �?) (1� �? [�? + �? + (n� 1) ( ? + �?)]) �
� �? (�? [�? + �? (n� 1) �] + �? [�? + �? (n� 1) (1� �)]) �,
�i? = ( ? + �?) (1� �? [�? + �? + (n� 1) ( ? + �?)]) �
� �?� 2? + �?� [�? + �? (n� 1) �] + �? (1� �) [�? + �? (n� 1) (1� �)]
��.
The monotonicity part of the proposition is omitted in the interest of space. For the �rst
part of comparison, we only need to verify that it is true when � = 0 or � = 1, at which
expected pro�ts of central agent 1 and peripheral agent i 2 Nnf1g achieve the highest and
lowest values respectively. We have
�1? j�=0 =s
=2
2n (n+ 2)2 �3 + (6n3 + 16n2 + 16n� 5)�2�+ (6n3 + 8n2 + 12n� 6)��2 + 2 (n3 + 2n� 1)�3
���2 (n+ 2)2 �3 +
�6n2 + 14n+ 13
��2�+ 2
�3n2 + 3n+ 4
���2 + 2
�n2 + 1
��3�
(n+ 1) (n+ 2)�2 + (n2 + 5n+ 1)�� + 2n�2, (2.A.35)
�i? j�=0 =s
2
2n (n+ 2)2 �3 + (6n3 + 16n2 + 16n� 5)�2�+ (6n3 + 8n2 + 12n� 6)��2 + 2 (n3 + 2n� 1)�3
�� (� + �)
�(n+ 2)2 �2 +
�2n2 + 4n+ 5
���+
�n2 + 2
��2�
(n+ 1) (n+ 2)�2 + (n2 + 5n+ 1)�� + 2n�2. (2.A.36)
As an example we prove that expected pro�t of central agent 1 is lower than that when
there is no information communication. A comparison of (2.A.35) and (2.B.18), together
with the proved inequality (2.A.28), we only need to show
2 (n+ 2)2�3 +
�6n2 + 14n+ 13
��2�+ 2
�3n2 + 3n+ 4
���2 + 2
�n2 + 1
��3
2n (n+ 2)2�3 + (6n3 + 16n2 + 16n� 5)�2�+ (6n3 + 8n2 + 12n� 6)��2 + 2 (n3 + 2n� 1)�3
<(2� + �) (� + 2�)
2
2n (� + �)3+�(3�2 + 6�� + 2�2)
,
CHAPTER 2. COMMUNICATION AND CONFIDENCE IN NETWORKS 92
which is simple to get veri�ed.
Algebra also reveals that expected pro�t of peripheral agent i 2 Nnf1g given by (2.A.36)
is higher than (2.B.19) and the total expected pro�ts is lower than those in no communication
economy. Details for all omitted proofs are available upon request.
Proof of Proposition 2.12. Let �? = �? (�) and �? = �? (�) as given by (2.4.5) and
(2.4.6). Throughout section 2.4.3, we assume that (2.4.10) are satis�ed, therefore �? and �?
are positive. A back-of-envelop calculation shows that �? (�) = �? (1� �) and
�? (�)
�? (�) + �? (�)
>
=
<
1
2() �t
<
=
>
1
2.
2.B Appendix: In the Absence of Information Communica-
tion
Here I collect the equilibrium conditions and statistics regarding trading patterns when agents
do not participate in information communication. The proofs are omitted for sake of space as
we are familiar with the techniques but are available upon request. For clarity no subscript
is used to denote the no communication economy.
Lemma 2.1 When agents in the circle network abstain from information communication,
there exists a unique symmetric linear equilibrium in which Xi and P; are given by
Xi (~si) = �~si, i 2 N , (2.B.1)
P (~!) = �
�nPi=1~xi + ~u
�, (2.B.2)
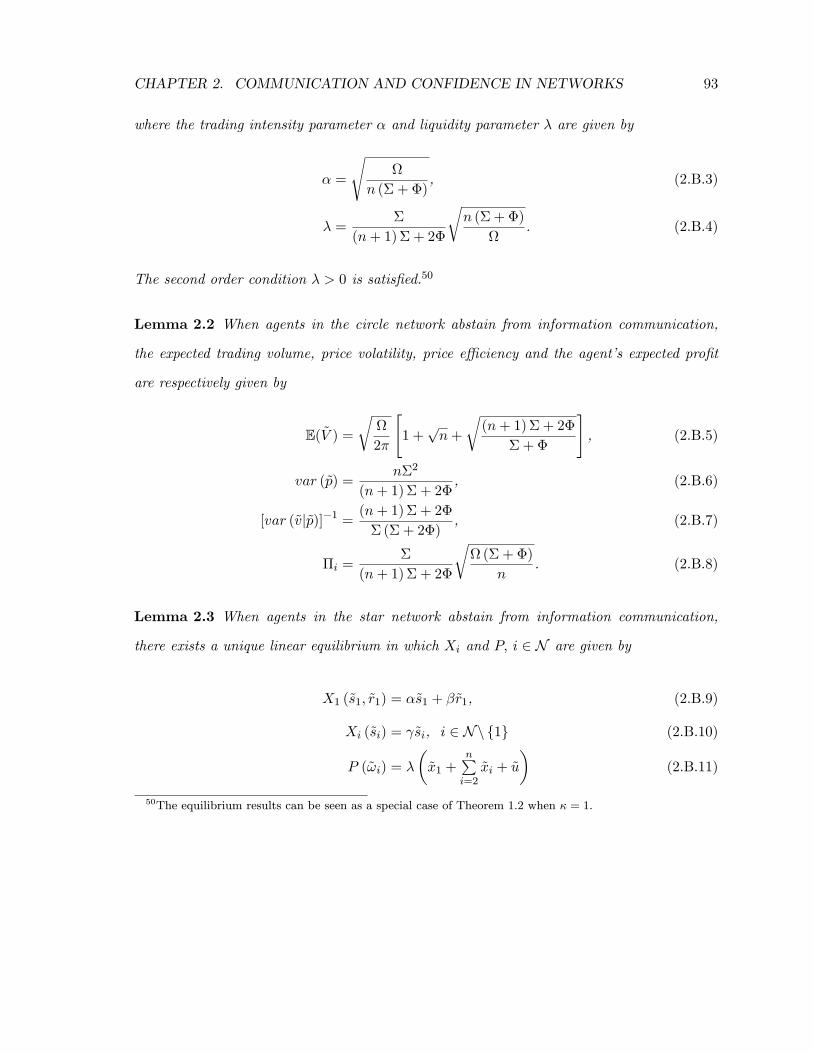
CHAPTER 2. COMMUNICATION AND CONFIDENCE IN NETWORKS 93
where the trading intensity parameter � and liquidity parameter � are given by
� =
s
n (� + �), (2.B.3)
� =�
(n+ 1)� + 2�
rn (� + �)
. (2.B.4)
The second order condition � > 0 is satis�ed.50
Lemma 2.2 When agents in the circle network abstain from information communication,
the expected trading volume, price volatility, price e�ciency and the agent's expected pro�t
are respectively given by
E( ~V ) =r
2�
"1 +
pn+
r(n+ 1)� + 2�
� + �
#, (2.B.5)
var (~p) =n�2
(n+ 1)� + 2�, (2.B.6)
[var (~vj~p)]�1 = (n+ 1)� + 2�
� (� + 2�), (2.B.7)
�i =�
(n+ 1)� + 2�
r (� + �)
n. (2.B.8)
Lemma 2.3 When agents in the star network abstain from information communication,
there exists a unique linear equilibrium in which Xi and P; i 2 N are given by
X1 (~s1; ~r1) = �~s1 + �~r1, (2.B.9)
Xi (~si) = ~si, i 2 Nnf1g (2.B.10)
P (~!i) = �
�~x1 +
nPi=2~xi + ~u
�(2.B.11)
50The equilibrium results can be seen as a special case of Theorem 1.2 when � = 1.
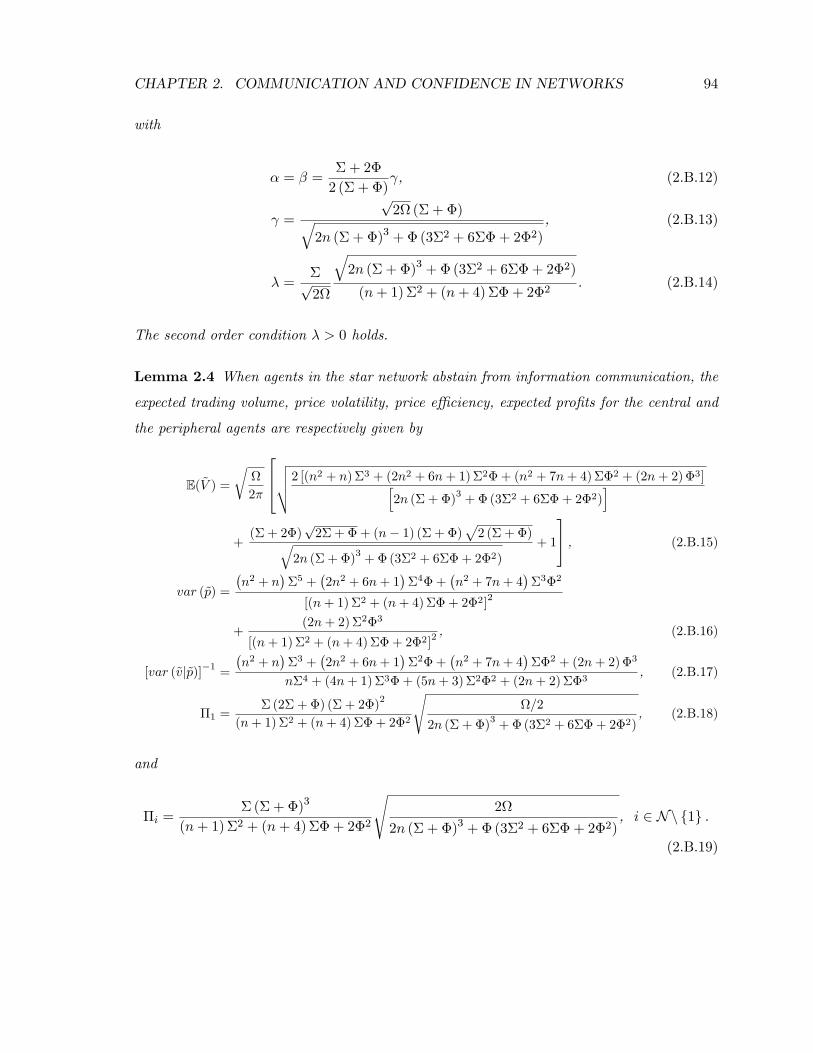
CHAPTER 2. COMMUNICATION AND CONFIDENCE IN NETWORKS 94
with
� = � =�+ 2�
2 (� + �) , (2.B.12)
=
p2 (� + �)q
2n (� + �)3 +�(3�2 + 6�� + 2�2), (2.B.13)
� =�p2
q2n (� + �)3 +�(3�2 + 6�� + 2�2)
(n+ 1)�2 + (n+ 4)�� + 2�2. (2.B.14)
The second order condition � > 0 holds.
Lemma 2.4 When agents in the star network abstain from information communication, the
expected trading volume, price volatility, price e�ciency, expected pro�ts for the central and
the peripheral agents are respectively given by
E( ~V ) =r
2�
264vuut2 [(n2 + n) �3 + (2n2 + 6n+ 1)�2�+ (n2 + 7n+ 4)��2 + (2n+ 2)�3]h2n (� + �)
3+�(3�2 + 6�� + 2�2)
i+(� + 2�)
p2� + � + (n� 1) (� + �)
p2 (� + �)q
2n (� + �)3+�(3�2 + 6�� + 2�2)
+ 1
35 , (2.B.15)
var (~p) =
�n2 + n
��5 +
�2n2 + 6n+ 1
��4�+
�n2 + 7n+ 4
��3�2
[(n+ 1)�2 + (n+ 4)�� + 2�2]2
+(2n+ 2)�2�3
[(n+ 1)�2 + (n+ 4)�� + 2�2]2 , (2.B.16)
[var (~vj~p)]�1 =�n2 + n
��3 +
�2n2 + 6n+ 1
��2�+
�n2 + 7n+ 4
���2 + (2n+ 2)�3
n�4 + (4n+ 1)�3�+ (5n+ 3)�2�2 + (2n+ 2)��3, (2.B.17)
�1 =�(2� + �) (� + 2�)
2
(n+ 1)�2 + (n+ 4)�� + 2�2
s=2
2n (� + �)3+�(3�2 + 6�� + 2�2)
, (2.B.18)
and
�i =�(� + �)3
(n+ 1)�2 + (n+ 4)�� + 2�2
s2
2n (� + �)3 +�(3�2 + 6�� + 2�2), i 2 Nnf1g .
(2.B.19)

Chapter 3
Communicating to Be Over- and
Undercon�dence
We are prone to attribute success to our own dispositions and failure to external
forces.
||{ Hastorf, Schneider, and Polefka (1970)
After a big loss in the stock markets, an investor may experience a sense of regret
over his decision to invest in stocks; he may interpret his loss as a sign that he
is a second-rate investor, thus dealing his ego a painful blow; and he may feel
humiliation in front of friends and family when word leaks out.
||{ Barberis, Huang, and Santos (2001)
3.1 Introduction
Many e�orts have been devoted to modeling and testing the psychological �ndings on decision
making in past few decades. Overcon�dence, the tendency of systematic overestimating one's
ability and overestimating the accuracy of one's knowledge, is considered to be \perhaps the
most robust �nding in the psychology of judgement" (De Bondt and Thaler, 1995, p.389)
and is embraced wholeheartedly by behavioral economists in understanding many puzzling
95
CHAPTER 3. OVER- AND UNDERCONFIDENCE 96
economic phenomena at large and many �nancial market anomalies in particular such as
tremendous volume, excess volatility, speculative bubbles, short-term momentum, long-term
reversal. Is overcon�dence really robust? Are there any features in experiments making
subjects to behave di�erently in experimental settings from economic settings? What are the
consequences of coexistence of over- and undercon�dent investors in �nancial markets? In
this paper I challenge the validity of the widely accepted notion of overcon�dence, point
out the limitation of supporting evidence and hypothesize that undercon�dence, as well
as overcon�dence, are possible when competition, communication and comparison between
investors are incorporated into the conventional models.
To see my motivation, consider a very familiar situation. It is well known that the
outcomes of economist job market uctuate at di�erent times which greatly impacts next
year job market candidates' con�dence level. Even though a junior candidate is aware of
her own ability and the quality of her work are somewhat independent of the senior peers',
she might well be overcon�dent or undercon�dent about her own job landing, at least in a
short period, be the senior peers' outcomes good or bad. In this case con�dence about ability
exhibits the property of complementarity. A more realistic fact is that when one learns about
her ability or the accuracy of her knowledge, she naturally takes into account the numbers of
success and failure of her own and other targets such as peers, neighbors and close friends. By
excluding the in uence of common factors or pure luck, such consideration helps one reach
a more exact estimate. One will only shift upward her belief about ability and knowledge
accuracy when the number of her successes exceed those of her targets. The same idea is
applicable to decision making in �nancial markets.
I build a multi-period model to study the evolution of agents' beliefs about their abilities
in the competitive rational expectations framework �a la Hellwig (1980). Asset net supply
uncertainty is introduced to prevent equilibrium price from being fully information revealing.
Two types of agents have di�erent and unknown abilities which help them to observe private
signals of di�erent precision regarding risky asset payo�. At the end of each period, each
type collects private signals and analyzes the precision, then communicate and compare this
quality information with the other type. They update their beliefs, possibly in a biased way,
CHAPTER 3. OVER- AND UNDERCONFIDENCE 97
about their own abilities accordingly. I show that agents' ability learning will in uence the
properties and dynamics of market trading patterns such as price volatility, expected trading
volume, and expected pro�ts.
For the convenience of analysis, attention is restricted to the situation that high-ability
agents always observe more high precision signals than low-ability agents up to any trading
period. Four plausible economy scenarios are considered under the hypothesis that when com-
petition, communication and comparison are taken into account, agents exhibit over- and/or
undercon�dence in ability learning: all agents are rational in belief updating; overcon�dent
and undercon�dent agents coexist; high-ability agents become overcon�dent while low-ability
ones are rational; and high-ability agents are rational but low-ability ones are undercon�dent.
The main �ndings of the paper is summarized as follows. First, under reasonable conditions,
price volatility is the highest in the \only low-ability agent being undercon�dent" scenario.
In contrast, most existing studies show that price volatility is increasing in overcon�dence
degree. Second, expected trading volume in the \only high-ability agents being overcon�-
dent" scenario is lower than that in the fully rational economy after some initial trading
periods. When this happens, larger overcon�dence degree often implies lower expected trad-
ing volume. In contrast, existing studies show that expected trading volume is increasing
in overcon�dence degree. Third, in the \only high-ability agents being overcon�dent" sce-
nario, high-ability agents' expected pro�t could be higher with larger overcon�dent degree.
In contrast, existing studies show that expected pro�t is decreasing in overcon�dent degree.
The central message is that overcon�dence may not be robust to explain many puzzling
phenomena in �nancial markets.
It turns out that the di�erence mainly results from asset supply uncertainty which is origi-
nally introduced in the literature to circumvent the conceptual di�culties such as \Grossman-
Stiglitz Paradox" and \No-Trade Theorem" (Grossman and Stiglitz, 1980; Milgrom and
Stoky, 1982). Odean (1998) studies the e�ect of agent's overcon�dence in a dynamic hedging
model in which asset supply uncertainty is assumed away for tractability. Consequently, only
private signals are incorporated into equilibrium price. My model shows that in the presence
of asset supply uncertainty, equilibrium price aggregates private signals and asset supply with
CHAPTER 3. OVER- AND UNDERCONFIDENCE 98
appropriate intensities. In addition, there is a trade-o� between intensities. Even when the
variations of private signals and asset supply are identical, if some agents are undercon�dent
and trade less actively in response to private signals so that less information is injected to the
economy, under reasonable conditions the intensity associated with asset supply will domi-
nate that of private signals. As a result, the resulting price volatility might be higher than
that if some agents are overcon�dent.1 Indeed, I show that price volatility is non-monotone
in the variance of private signal and asset supply. With this result in mind, it is easy to
understand others. Note that expected trading volume and expected pro�ts are complicated
nonlinear functions of price volatility. The simple relationship considered in existing stud-
ies are no longer valid. For instance, when high-ability but overcon�dent agents trade with
rational low-ability ones, the former has stronger incentive to trade more, but this does not
necessarily imply that the total trading volume will be higher than full rational economy,
since the latter may trade much less. The same logic can be applied to the expected pro�ts
analysis. The details will be provided in the main text.
Layout. The rest of the paper is structured as follows. Section 3.2 provides brief review
on new experimental evidence that undercon�dence is prevalent in decision making, and
on recent economic studies about the asset pricing implications of overcon�dence. Section
3.3 develops a multi-period trading and learning model with two types of agents. Agents'
beliefs updating is described in four economy scenarios. Section 3.4 studies the properties
and dynamics of market trading patterns such as price volatility, expected trading volume
and expected pro�ts from an ex ante perspective. Section 3.5 discusses the role of asset
supply uncertainty in a wider context and proposes that direct information communication in
�nancial markets contributes to the observed market trading patterns. Section 3.6 concludes.
All the proofs are presented in the Appendix 3.A.
1Note that this is true when informed agents are risk averse. When they are risk neutral and competestrategically as in the framework of Kyle (1985), this relationship no longer holds because informed agents canchange their trading intensity in response to variations of noise trading. So when they become overcon�dent,they indeed trade more and earn less.
CHAPTER 3. OVER- AND UNDERCONFIDENCE 99
3.2 Literature Review
In this section I brie y review new experimental �ndings of over- and undercon�dence coex-
istence, and other analytical studies in overcon�dence literature, especially those relevant to
my model.
3.2.1 New Experimental Evidence
There is indeed a large body of evidence in cognitive psychology and sociological psychology
supporting overcon�dence.2 Lichtenstein, Fischho�, and Phillips (1982) and Odean (1998)
provide excellent and extensive reviews. Most papers in economics and �nance take this evi-
dence as exogenously given, and explore its consequence and implications. A few endogenize
overcon�dence but assume individual updates her belief of ability in isolation. Perhaps the
most cited example is a report that \80% drivers claim that their driving skills are better
than the average".
Recently, the validity of overcon�dence evidence has been challenged by a number of psy-
chologists and economists. They either argue that overcon�dence is not a robust �nding in
more carefully designed experiments, or �nd that undercon�dent subjects often coexist with
overcon�dent ones when competition and monetary rewards are incorporated into experi-
ments. Erev, Wallsten and Budescu (1994) show that both over- and undercon�dence can be
obtained from the same set of data, indicating that the results are actually moderated by the
research method used. Also the results of Juslin, Winman and Olsson (2000) indicate that
the overcon�dence bias depends on the selective attention to particular data sets. Kirchler
and Maciejovsky (2002) report that under- and overcon�dence, as well as well-calibration are
often simultaneously observed within the context of an experimental asset market. Klayman
et al. (1999) emphasize that overcon�dence depends on how the experimenter asks his/her
2Typically, most earlier experiments ask subjects to make judgements and to include some measure of con-�dence. Subjects may be presented with simple multiple-choice questions and prompted to say how con�dentthey are that the answers are correct, or they are asked to provide a �gure, and to give a margin of errorlike a 95 percent con�dence interval. Then judgements are grouped according to the degree of con�denceand compared with actual hit rates, that is, the proportion of those judgements that were is fact correct. Ifthe measure of con�dence is higher than the actual hit rate, given some range of con�dence judgements, thesubjects are said to be overcon�dence in that range.

CHAPTER 3. OVER- AND UNDERCONFIDENCE 100
questions, what he/she asks, and whom he/she asks. They conclude that:
\In the 1980s, the question of bias in con�dence judgements seemed settled: Peo-
ple are grossly overcon�dent on all but the easiest of questions. In the 1990s,
the matter was reopened, and a new conclusion was proposed: People are imper-
fect but generally unbiased judges of con�dence; only the choice of questions was
biased." Klayman et al. (1999; p.243)
Even in many experiments subjects are asked to compare themselves to an average peer,
the lack of direct comparisons and the ambiguity of comparison targets may lead to biased
estimates. Subjects are mostly overcon�dent because they are free to choose a comparison in
a lower rank or at higher risk. Perlo� and Fetzer (1986) and Hoorens and Buunk (1993) show
that the bias is reduced when the closest friend is used as speci�c target. Alicke et al. (1995)
argue that the reality constraints that are imposed by more direct comparisons diminish the
better-than-average e�ect. In their experiments, they show that by individuating the target
and providing personal contact the magnitude of the e�ect decreases.
Earlier psychological studies do not neglect the possibility of undercon�dence, indeed,
they establish the relationship among overcon�dence, undercon�dence and the di�culty of
the judgement task. Lichtenstein, Fischho� and Phillips (1982) report that overcon�dence for
di�cult questions turns into undercon�dence for easy ones. Interestingly, even this seldom
questioned evidence is counter to recent studies. Hoelzl and Rustichini (2005) report that
choice behavior changes from overcon�dence to undercon�dence when the task changes from
easy and familiar to non-familiar. Cain and Moore (2006) also provide experimental evidence
that people believe themselves to be above average on simple tasks, and below average on
di�cult tasks.
3.2.2 Other Related Literature
Perhaps the earliest paper in behavioral �nance, Roll (1986) uses CEO hubris, one form of
overcon�dence, to explain why many mergers and acquisitions are ex-post value-destroying.
Indeed, recent empirical studies report that overcon�dence is made rather than born. The

CHAPTER 3. OVER- AND UNDERCONFIDENCE 101
hypothesis that successful agents tend to be overcon�dent in their abilities is modeled in my
paper. However, Roll leaves a question unanswered which is also neglected in the literature:
Is the hubris of the target company's CEO lessened to some extent or even turned to be
humility?
De Long et al. (1990) address the potential risks faced by rational arbitrageurs when
competing with irrational noise traders. They are motivated by the observation that noise
traders' overly optimistic or pessimistic beliefs about asset payo� can create a risk in the
price of the asset that deters rational arbitrageurs from aggressively betting against them.
In other words, both over- and undercon�dence are possible in �nancial markets. Kyle and
Wang (1997) also allow investors to be either over- or undercon�dent in interpreting the
precision of private signals.3
Directly based on earlier psychological �ndings, Benos (1998)4, Odean (1998)5 develop
one-period models with exogenous overcon�dent investors. All show that price volatility,
expected trading volume, market depth and informativeness increase with informed trader's
overcon�dence. On the other hand, agents' expected welfare decreases. Wang (1998) demon-
strates the same holds in a multi-period setup.6 However, most of these results are questioned
by Garc��a, Sangiorgi and Uro�sevi�c (2007) and Xia (2007a). The former shows that when ra-
tional and overcon�dent agents coexist and private information acquisition is endogenized,
overcon�dence does not a�ect price volatility, information e�ciency, and rational agents'
welfare. Intuitively, the rational agents respond to the presence of overcon�dent agents by
reducing their information acquisition activities since the aggressive trading of the latter
reveals more of their information through prices. The latter shows that information commu-
nication among investors gives rise to excessive price volatility, expected trading volume, etc.
3They also show that overcon�dence strategy can serve as a commitment device in a duopoly game ofhiring fund managers. They also show that overcon�dence can be mitigated by an appropriately designedincentive scheme.
4Benos (1998), Hirshleifer and Luo (2001), and Wang (2001) also studies the survival of overcon�dentagents in �nancial markets.
5One model of Odean (1998) has three periods. He also examines the possibility that market maker isovercon�dent. He �nd that overcon�dent market maker may dampen price volatility.
6Moreover, Wang (1998) show that the informed trader smooths out her trading on asymmetric infor-mation gradually over time, but concentrates her entire trading toward the last few periods because of theheterogeneous beliefs associated with overcon�dence. As a result the model's volume dynamics are consistentwith the U-shaped intraday pattern at the close.
CHAPTER 3. OVER- AND UNDERCONFIDENCE 102
and lower expected pro�ts. When investors are more overcon�dent in their private signals,
price volatility, expected trading volume, etc. decrease while expected pro�ts increase.
Most analytical papers in overcon�dence literature assume that agent is born with over-
con�dence which does not change over time. There are a few exceptions. Gervais and Odean
(2001), to which the information setup in my model is similar, develop a multi-period market
model describing both the process by which a single trader learns about her ability from the
number of successful predictions and how a self-attribution bias in this learning can create
overcon�dence. The trader's expected level of overcon�dence increases in the early stages of
her career. Then, with more experience, she comes to better recognize her own ability. The
patterns in trading volume, price volatility, expected prices, and expected pro�ts resulting
from this endogenous overcon�dence are analyzed. Daniel, Hirshleifer and Subrahmanyam
(1998) consider both �xed con�dence level and outcome-dependent con�dence level. For the
latter, biased self-attribution causes investors' con�dence to shift asymmetrically as a func-
tion of their investment outcomes. They also assume that a representative agent updates
her belief of ability in isolation.7 It deserve mentioning that Daniel, Hirshleifer and Sub-
rahmanyam (1998) provide example that overcon�dence may dampen price volatility. Their
main theme is to show that overcon�dence and self-attribution bias imply security market
under- and overreactions, i.e., the short-lag autocorrelations (\momentum") and negative
long-lag autocorrelations (\reversal") of stock returns. Du (2002) addresses these phenom-
ena by the sequential entry of heterogenous investors with high, medium, and low con�dence
levels.
3.3 The Economy
The model extends the standard one period competitive rational expectations framework �a
la Hellwig (1980) to a settings in which two types of agents trades competitively in a multi-
period security market. Trade takes place in each single period t = 1; 2; � � � and consumption7Some other reasons have been proposed to rationalize overcon�dence. Weinberg (2004) assumes individ-
ual cares about and is risk averse over her belief about her ability. When she chooses tasks based on herinformation, endogenous overcon�dence is expected to be optimal under some conditions.

CHAPTER 3. OVER- AND UNDERCONFIDENCE 103
of a numeraire good at the end of each period. There are two assets in the economy. A riskless
asset (the numeraire) has perfectly elastic supply so its price and payo� are normalized to 1.
A risky asset has stochastic payo� ~Vt at the end of each period t, unknown to all agents at
the beginning of the period. The net supply of the risky asset is taken to be the realization
of a exogenous random variable ~Zt for each period t, which can be thought of coming from
noise/liquidity traders. The two types of agents di�er only in ability which helps them observe
one period advantageous private signals correlated to the true value of the risky asset. For
simplicity, a continuum of agents of the same type are assumed to reside in a group, which
can be as small as a community or as large as a country. The groups are labeled as I and J . A
measure mh 2 (0; 1) of the agent population is of the type h (high-ability) while the measure
m` = 1�mh 2 (0; 1) is of the type ` (low-ability). We assume that mh = m` = 1=2 therefore
agents cannot tell their ability type from the group size. Even though all agents knows that
the two groups have di�erent abilities. I postulate that any agent of one group, say I, does
not known the ability of any member of I or that of J is high or low at the outset. Social
communication takes a special form. At the end of each trading period the representative
agents i and j of two groups exchange some trading information with each other, from which
they update their beliefs regarding abilities and pass new beliefs to members belonging to
their own group respectively. How an agent's ability in uences her signal's quality and how
she assesses her ability will be speci�ed in detail below. Sometimes with a little abuse of
notation, i also denotes the generic agent in the economy when the context is clear.
In short, the snapshot of the market trading and beliefs updating in a single period is
illustrated in Figure 3.1.
3.3.1 Preferences and Information Structure
All agents in the economy have CARA preferences with common absolute risk aversion co-
e�cient � and they maximize their utility over wealth period by period. At this moment
agents' risk aversion magnitude is assumed to be invariant to their beliefs regarding abilities.
At the beginning of period 1 every agent i is endowed with deterministic wealthWi0 (in units
of the numeraire), it is well known that under CARA preferences agent's demand for risky
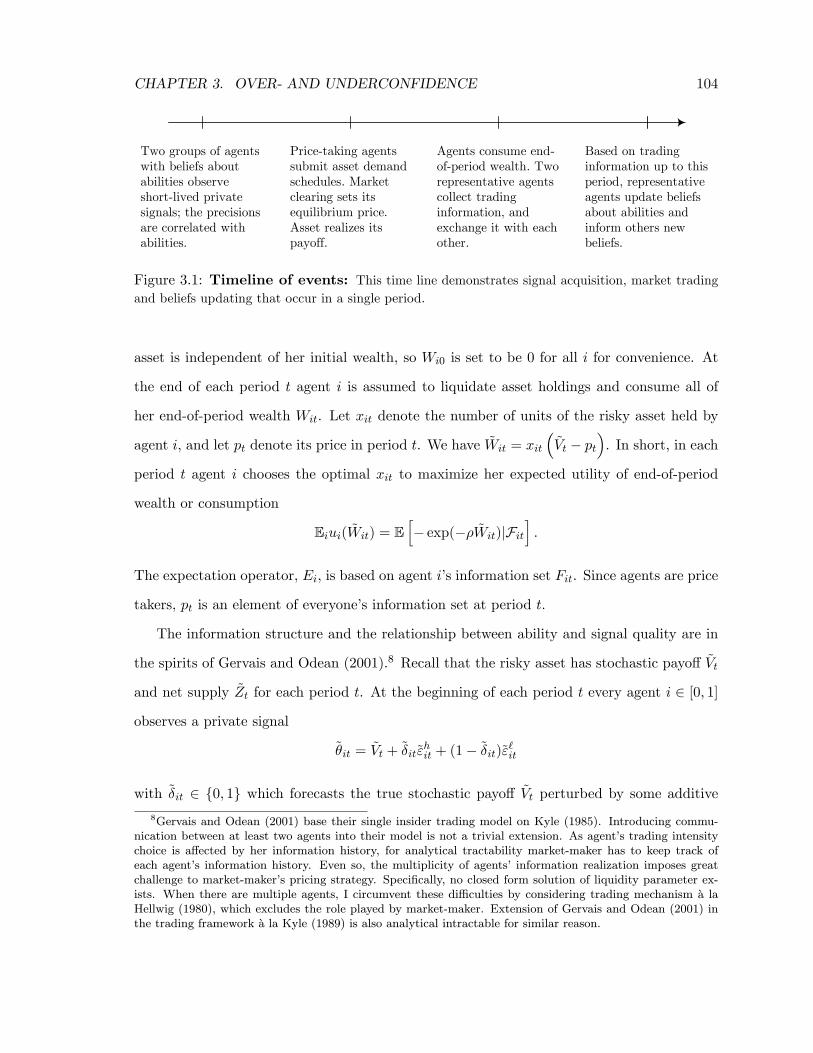
CHAPTER 3. OVER- AND UNDERCONFIDENCE 104
Two groups of agentswith beliefs aboutabilities observeshortlived privatesignals; the precisionsare correlated withabilities.
Pricetaking agentssubmit asset demandschedules. Marketclearing sets itsequilibrium price.Asset realizes itspayoff.
Agents consume endofperiod wealth. Tworepresentative agentscollect tradinginformation, andexchange it with eachother.
Based on tradinginformation up to thisperiod, representativeagents update beliefsabout abilities andinform others newbeliefs.
Figure 3.1: Timeline of events: This time line demonstrates signal acquisition, market tradingand beliefs updating that occur in a single period.
asset is independent of her initial wealth, so Wi0 is set to be 0 for all i for convenience. At
the end of each period t agent i is assumed to liquidate asset holdings and consume all of
her end-of-period wealth Wit. Let xit denote the number of units of the risky asset held by
agent i, and let pt denote its price in period t. We have ~Wit = xit
�~Vt � pt
�. In short, in each
period t agent i chooses the optimal xit to maximize her expected utility of end-of-period
wealth or consumption
Eiui( ~Wit) = Eh� exp(�� ~Wit)jFit
i.
The expectation operator, Ei, is based on agent i's information set Fit. Since agents are price
takers, pt is an element of everyone's information set at period t.
The information structure and the relationship between ability and signal quality are in
the spirits of Gervais and Odean (2001).8 Recall that the risky asset has stochastic payo� ~Vt
and net supply ~Zt for each period t. At the beginning of each period t every agent i 2 [0; 1]
observes a private signal
~�it = ~Vt + ~�it~"hit + (1� ~�it)~"`it
with ~�it 2 f0; 1g which forecasts the true stochastic payo� ~Vt perturbed by some additive
8Gervais and Odean (2001) base their single insider trading model on Kyle (1985). Introducing commu-nication between at least two agents into their model is not a trivial extension. As agent's trading intensitychoice is a�ected by her information history, for analytical tractability market-maker has to keep track ofeach agent's information history. Even so, the multiplicity of agents' information realization imposes greatchallenge to market-maker's pricing strategy. Speci�cally, no closed form solution of liquidity parameter ex-ists. When there are multiple agents, I circumvent these di�culties by considering trading mechanism �a laHellwig (1980), which excludes the role played by market-maker. Extension of Gervais and Odean (2001) inthe trading framework �a la Kyle (1989) is also analytical intractable for similar reason.
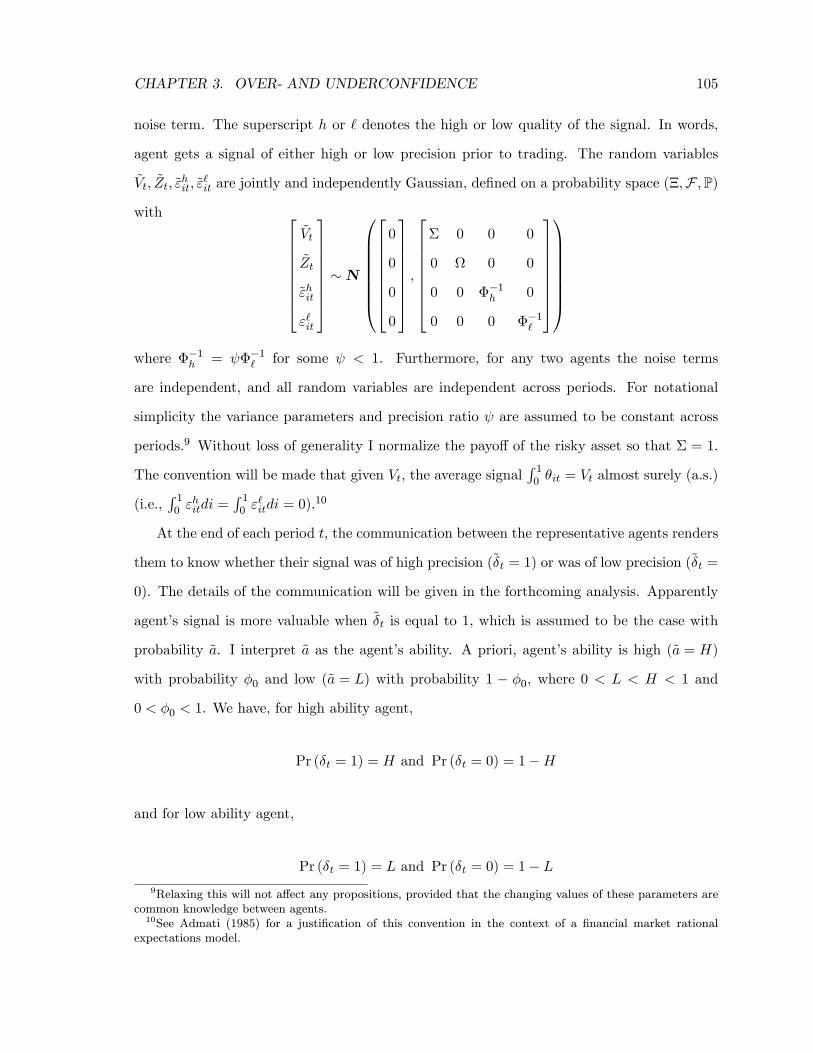
CHAPTER 3. OVER- AND UNDERCONFIDENCE 105
noise term. The superscript h or ` denotes the high or low quality of the signal. In words,
agent gets a signal of either high or low precision prior to trading. The random variables
~Vt; ~Zt;~"hit;~"
`it are jointly and independently Gaussian, de�ned on a probability space (�;F ;P)
with 266666664
~Vt
~Zt
~"hit
"`it
377777775�N
0BBBBBBB@
266666664
0
0
0
0
377777775;
266666664
� 0 0 0
0 0 0
0 0 ��1h 0
0 0 0 ��1`
377777775
1CCCCCCCAwhere ��1h = ��1` for some < 1. Furthermore, for any two agents the noise terms
are independent, and all random variables are independent across periods. For notational
simplicity the variance parameters and precision ratio are assumed to be constant across
periods.9 Without loss of generality I normalize the payo� of the risky asset so that � = 1.
The convention will be made that given Vt, the average signalR 10 �it = Vt almost surely (a.s.)
(i.e.,R 10 "
hitdi =
R 10 "
`itdi = 0).
10
At the end of each period t, the communication between the representative agents renders
them to know whether their signal was of high precision (~�t = 1) or was of low precision (~�t =
0). The details of the communication will be given in the forthcoming analysis. Apparently
agent's signal is more valuable when ~�t is equal to 1, which is assumed to be the case with
probability ~a. I interpret ~a as the agent's ability. A priori, agent's ability is high (~a = H)
with probability �0 and low (~a = L) with probability 1 � �0, where 0 < L < H < 1 and
0 < �0 < 1. We have, for high ability agent,
Pr (�t = 1) = H and Pr (�t = 0) = 1�H
and for low ability agent,
Pr (�t = 1) = L and Pr (�t = 0) = 1� L9Relaxing this will not a�ect any propositions, provided that the changing values of these parameters are
common knowledge between agents.10See Admati (1985) for a justi�cation of this convention in the context of a �nancial market rational
expectations model.

CHAPTER 3. OVER- AND UNDERCONFIDENCE 106
The facts that agent's ability is �xed and agents belonging to the same group have the
same ability tell us that the random variable ~�it is indentically and independent distributed
for i 2 I, so is ~�jt for j 2 J . Furthermore, to facilitate the analysis I impose a strong
assumption that agents in the same group observe diverse signals of the same precision. In
other words, the realization of ~�it is the same as ~�i0tfor i; ii 2 I, so is the realization of ~�jt
and ~�j0t for j; j0 2 J . Bearing in mind the fact that agent i 2 I does not knows the ability
of her own or of any agent j 2 J at the outset, every agent can only assess her ability
through learning by trading and communicating. However, we abstract from the possibility
that learning and trading might improve agent's ability per se.
Note that the di�erent precisions of "ht and "`t raise the possibility that the size of �t may
reveal something about the likelihood of ~�t = 1 before trade and communication take place.
This concern is relieved if we allow the precisions of "ht and "`t to be changing over time.
When they are assumed to be constant for ease of notation, we can nonetheless circumvent
the possibility by requiring agents to be adaptive learners and implicitly ruling out active
experimentation. That is, agents hold current beliefs regarding ability �xed when deciding
future asset demand, and they update their beliefs only after communication.
3.3.2 Communication and Self-Attribution Bias
At the end of trading period t, agents engage in social communication which is simpli�ed by
information exchange and comparison between two representative agents i and j with the
aim to learn each other's abilities. This can be achieved by learning the qualities of signals
that two groups obtained at the beginning of that period, as ability is correlated to signal's
precision. To do so, a representative agent can �rst collect a large number of signals of her
group; the law of large number then helps determine the precision of signals so after the
representative agents exchange the precision information, they know whether the values of
(�it; �jt) are (0; 0) ; (1; 0) ; (0; 1) or (1; 1). Very soon we will see how representative agents
update their beliefs regarding abilities using such information. The new beliefs then are
passed to agents in respective groups and a�ect agents' asset demands in the next period
t+ 1.

CHAPTER 3. OVER- AND UNDERCONFIDENCE 107
At �rst glance, the interested reader may question the plausibility of the described infor-
mation collection and communication. The concern can be relieved if we allow the collected
information to be agents' asset demands or realized pro�ts. The representative agents can
be thought of as two discount brokerage �rms through which agents submit their limit or-
ders. However, given the common knowledge of initial beliefs, risk aversion and observable
market price, demands or pro�ts are informationally equivalent to agents' private signals.
The assumption that a continuum of agents of the same ability reside in the same group
may seem extreme but in fact it is not crucial. Another essentially identical interpretation of
the economy is illuminating and realistic too. Consider two full service brokerage �rms with
unknown abilities which help them to observe signals of same but independent distributions,
being asset true payo� or a pure noise. Formally, ~�it = ~�it~vt +�1� ~�it
�~"it where normal
distributions of ~vt and ~"t are identical but independent, as considered by Gervais and Odean
(2001). Each �rm then provides its own signal with additional independent and idiosyncratic
noise terms to its clients, whom are of identical ability.11 Asset payo� is publicly announced
after competitive trading. The communicating �rms will know the pro�le of (�it; �jt) from
which they update beliefs regarding abilities.12 The paper's purpose is to explore the asset
pricing implications of biased belief learning between two parties, no matter whether they
are average investors or brokerage �rms.
Let ~�it = f~�i1; � � � ; ~�itg and ~sit =Pt
�=1~�i� be agent i's information history and the
number of times that agent i's signal was of high precision in the �rst t periods respectively.
After social communication, the representative agents know �it;�jt; sit and sjt.
In this paper the model in which fully rational agents trade competitively serves as the
benchmark. When agent i is said to be fully rational, she understands that the probability of
high ability is determined by the precision of her own signals and she behaves as a Bayesian.
Therefore at the end of period t, she updates her belief that her ability is high given the
11Admati and P eiderer (1986) show that it is optimal for a monopolistic information owner to sell infor-mation with independent and idiosyncratic noise terms to a large number of buyer.12This is the case since ~vt = ~"t happens with zero probability, given the normal distribution is continuous.

CHAPTER 3. OVER- AND UNDERCONFIDENCE 108
history according to Bayes' rule:
�t (si) = Prf~a = Hj ~�itg
= Pr f~a = Hj~sit = sig
=Hsi (1�H)t�si �0
Hsi (1�H)t�si �0 + Lsi (1� L)t�si (1� �0)(3.3.1)
Note that the posterior belief at the end of period t is captured by the su�cient statistic ~sit
and is history-independent, i.e., di�erent histories with same number of high precision signals
lead to the same posterior belief. The fully rational agent i's updated expected ability at the
end of period t is given by
�t (si) = E[~aj~sit = si]
= H�t (si) + L [1� �t (si)] (3.3.2)
By contrast, when agents behave in an otherwise boundedly rational way, some plausible
behavioral features are assumed as follows. First, agents believe that abilities are interdepen-
dent, and each agent cares about the precision comparison of her own signals and others.13
In particular, they think that abilities exhibit substitutability.14 At the end each period, if
one observes that her information was of high precision while others low precision, she will
think that the success is due to her high-ability relative to others, and vice versa. More
importantly, when outcomes were not the same, agent updates her belief with a biased attri-
bution in the sense that she overweights success or failure too heavily when applying Bayes'
rule to evaluate her own ability. Second, If one observes identical information qualities, she
will update her belief in a fully rational way.
13I restrict attention to information precision comparison in this paper because of its simplicity. In practice,agents might well compare realized pro�ts to learn their abilities. Doing so won't change the main results as Ishow in section 3.4 that higher-ability agents on average earn more than low-ability agents. Some di�cultiesmay arise for this modeling choice. First, the expression of expected pro�ts, given in Equation (3.4.5), is quiteinvolved. Second and more crucially, it is plausible that agents with high beliefs will trade more aggressivelyand earn more in some period, even though their private signals were actually of low precision. Ruling thisout is possible but challenging, given the complicated form of expected pro�ts.14Agents may regard abilities exhibit complementarity. Recall the job market candidate example in intro-
duction. This is less likely when agents are involved in competition.
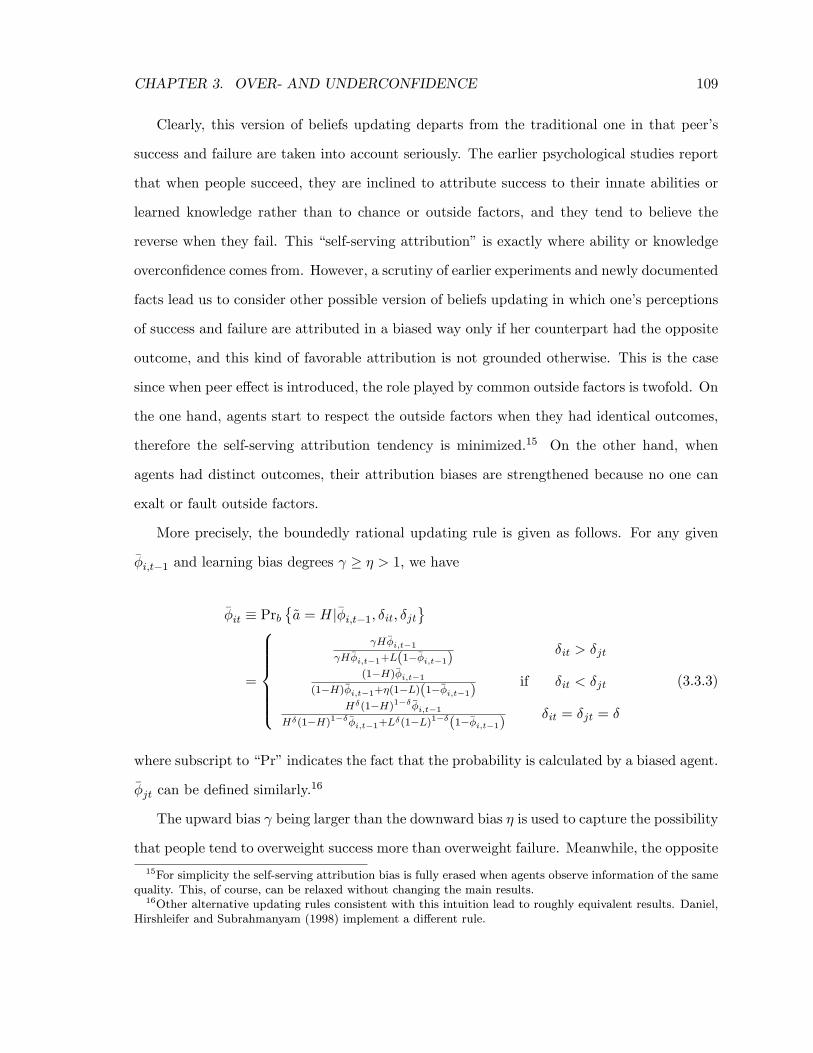
CHAPTER 3. OVER- AND UNDERCONFIDENCE 109
Clearly, this version of beliefs updating departs from the traditional one in that peer's
success and failure are taken into account seriously. The earlier psychological studies report
that when people succeed, they are inclined to attribute success to their innate abilities or
learned knowledge rather than to chance or outside factors, and they tend to believe the
reverse when they fail. This \self-serving attribution" is exactly where ability or knowledge
overcon�dence comes from. However, a scrutiny of earlier experiments and newly documented
facts lead us to consider other possible version of beliefs updating in which one's perceptions
of success and failure are attributed in a biased way only if her counterpart had the opposite
outcome, and this kind of favorable attribution is not grounded otherwise. This is the case
since when peer e�ect is introduced, the role played by common outside factors is twofold. On
the one hand, agents start to respect the outside factors when they had identical outcomes,
therefore the self-serving attribution tendency is minimized.15 On the other hand, when
agents had distinct outcomes, their attribution biases are strengthened because no one can
exalt or fault outside factors.
More precisely, the boundedly rational updating rule is given as follows. For any given
��i;t�1 and learning bias degrees � � > 1, we have
��it � Prb�~a = Hj��i;t�1; �it; �jt
=
8>>>>><>>>>>:
H��i;t�1 H��i;t�1+L(1���i;t�1)
�it > �jt
(1�H)��i;t�1(1�H)��i;t�1+�(1�L)(1���i;t�1)
if �it < �jt
H�(1�H)1����i;t�1H�(1�H)1����i;t�1+L�(1�L)1��(1���i;t�1)
�it = �jt = �
(3.3.3)
where subscript to \Pr" indicates the fact that the probability is calculated by a biased agent.
��jt can be de�ned similarly.16
The upward bias being larger than the downward bias � is used to capture the possibility
that people tend to overweight success more than overweight failure. Meanwhile, the opposite
15For simplicity the self-serving attribution bias is fully erased when agents observe information of the samequality. This, of course, can be relaxed without changing the main results.16Other alternative updating rules consistent with this intuition lead to roughly equivalent results. Daniel,
Hirshleifer and Subrahmanyam (1998) implement a di�erent rule.
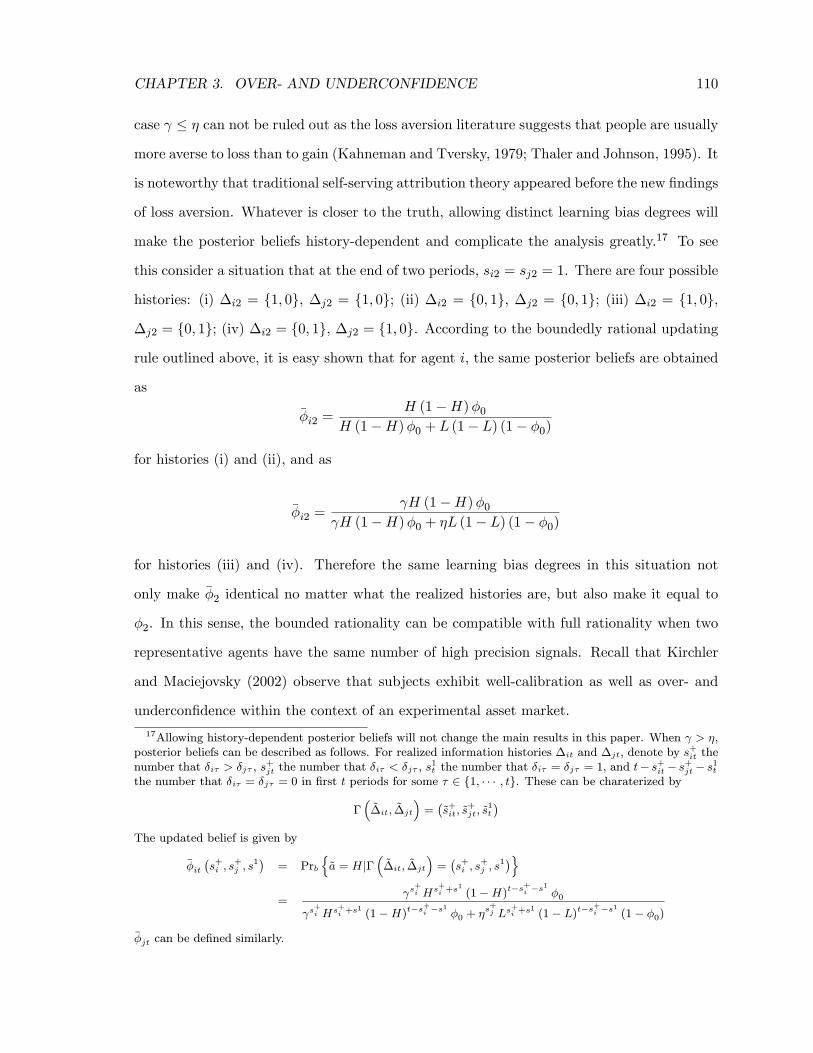
CHAPTER 3. OVER- AND UNDERCONFIDENCE 110
case � � can not be ruled out as the loss aversion literature suggests that people are usually
more averse to loss than to gain (Kahneman and Tversky, 1979; Thaler and Johnson, 1995). It
is noteworthy that traditional self-serving attribution theory appeared before the new �ndings
of loss aversion. Whatever is closer to the truth, allowing distinct learning bias degrees will
make the posterior beliefs history-dependent and complicate the analysis greatly.17 To see
this consider a situation that at the end of two periods, si2 = sj2 = 1. There are four possible
histories: (i) �i2 = f1; 0g, �j2 = f1; 0g; (ii) �i2 = f0; 1g, �j2 = f0; 1g; (iii) �i2 = f1; 0g,
�j2 = f0; 1g; (iv) �i2 = f0; 1g, �j2 = f1; 0g. According to the boundedly rational updating
rule outlined above, it is easy shown that for agent i, the same posterior beliefs are obtained
as
��i2 =H (1�H)�0
H (1�H)�0 + L (1� L) (1� �0)
for histories (i) and (ii), and as
��i2 = H (1�H)�0
H (1�H)�0 + �L (1� L) (1� �0)
for histories (iii) and (iv). Therefore the same learning bias degrees in this situation not
only make ��2 identical no matter what the realized histories are, but also make it equal to
�2. In this sense, the bounded rationality can be compatible with full rationality when two
representative agents have the same number of high precision signals. Recall that Kirchler
and Maciejovsky (2002) observe that subjects exhibit well-calibration as well as over- and
undercon�dence within the context of an experimental asset market.
17Allowing history-dependent posterior beliefs will not change the main results in this paper. When > �,posterior beliefs can be described as follows. For realized information histories �it and �jt, denote by s
+it the
number that �i� > �j� , s+jt the number that �i� < �j� , s
1t the number that �i� = �j� = 1, and t� s+it� s+jt� s1t
the number that �i� = �j� = 0 in �rst t periods for some � 2 f1; � � � ; tg. These can be charaterized by
��~�it; ~�jt
�=�~s+it; ~s
+jt; ~s
1t
�The updated belief is given by
��it�s+i ; s
+j ; s
1� = Prbn~a = Hj�
�~�it; ~�jt
�=�s+i ; s
+j ; s
1�o=
s+i Hs+i +s
1
(1�H)t�s+i �s
1
�0
s+i Hs+i +s
1(1�H)t�s
+i �s1 �0 + �
s+j Ls+i +s
1(1� L)t�s
+i �s1 (1� �0)
��jt can be de�ned similarly.
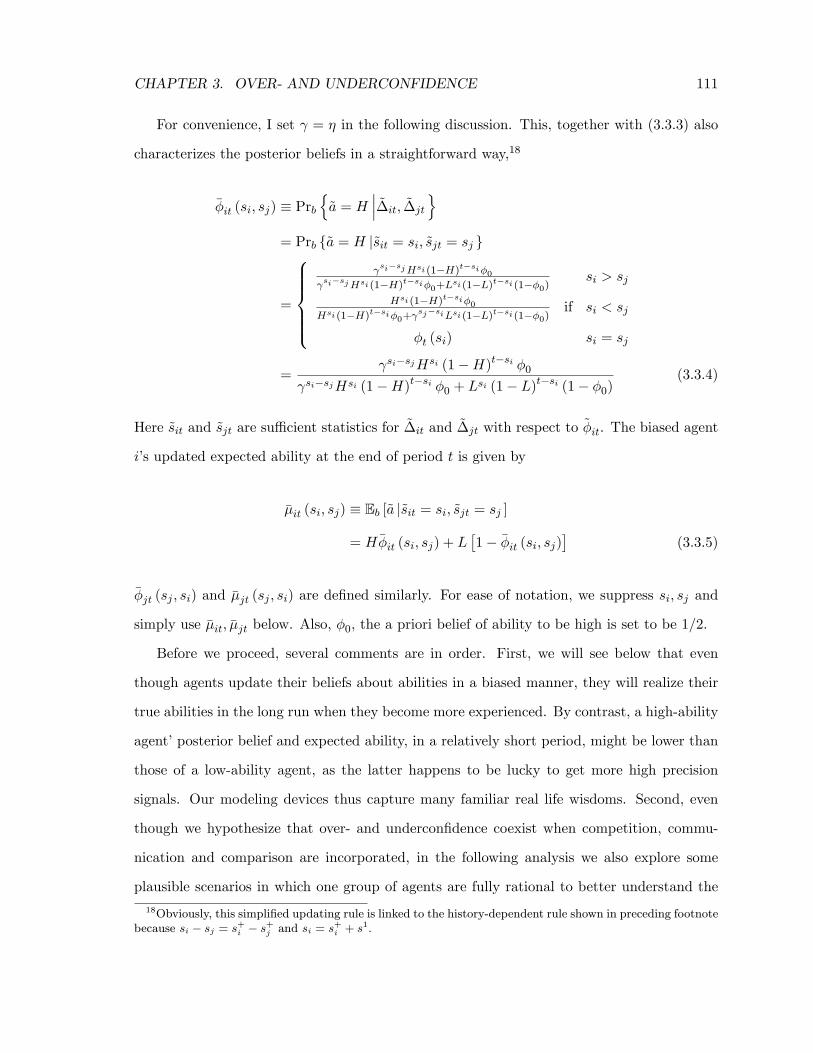
CHAPTER 3. OVER- AND UNDERCONFIDENCE 111
For convenience, I set = � in the following discussion. This, together with (3.3.3) also
characterizes the posterior beliefs in a straightforward way,18
��it (si; sj) � Prbn~a = H
��� ~�it; ~�jt
o= Prb f~a = H j~sit = si; ~sjt = sj g
=
8>>>><>>>>: si�sjHsi (1�H)t�si�0
si�sjHsi (1�H)t�si�0+Lsi (1�L)t�si (1��0)si > sj
Hsi (1�H)t�si�0Hsi (1�H)t�si�0+
sj�siLsi (1�L)t�si (1��0)if si < sj
�t (si) si = sj
= si�sjHsi (1�H)t�si �0
si�sjHsi (1�H)t�si �0 + Lsi (1� L)t�si (1� �0)(3.3.4)
Here ~sit and ~sjt are su�cient statistics for ~�it and ~�jt with respect to ~�it. The biased agent
i's updated expected ability at the end of period t is given by
��it (si; sj) � Eb [~a j~sit = si; ~sjt = sj ]
= H��it (si; sj) + L�1� ��it (si; sj)
�(3.3.5)
��jt (sj ; si) and ��jt (sj ; si) are de�ned similarly. For ease of notation, we suppress si; sj and
simply use ��it; ��jt below. Also, �0, the a priori belief of ability to be high is set to be 1=2.
Before we proceed, several comments are in order. First, we will see below that even
though agents update their beliefs about abilities in a biased manner, they will realize their
true abilities in the long run when they become more experienced. By contrast, a high-ability
agent' posterior belief and expected ability, in a relatively short period, might be lower than
those of a low-ability agent, as the latter happens to be lucky to get more high precision
signals. Our modeling devices thus capture many familiar real life wisdoms. Second, even
though we hypothesize that over- and undercon�dence coexist when competition, commu-
nication and comparison are incorporated, in the following analysis we also explore some
plausible scenarios in which one group of agents are fully rational to better understand the
18Obviously, this simpli�ed updating rule is linked to the history-dependent rule shown in preceding footnotebecause si � sj = s+i � s+j and si = s+i + s1.
CHAPTER 3. OVER- AND UNDERCONFIDENCE 112
relationship between market trading patterns and biased beliefs. For instance, after social
communication representative agents i and j observe si < sj , the former chooses to ignore sj
and updates her belief in the way as speci�ed in (3.3.1), while agent j's takes the comparison
result into account and the downward bias is incorporated in her posterior beliefs.
3.3.3 Equilibrium
As mentioned above, full rationality model serves as the benchmark. In the following analy-
sis, I will consider several other scenarios including the cases that over- and undercon�dent
agents coexist, full rational agents compete against overcon�dent agents, and full rational
agents compete against undercon�dent agents. For notational clarity, the equilibrium and
its characterizations are often stated in the benchmark scenario. Relevant notations can be
adjusted accordingly in other speci�cations.
All information assumed so far is common knowledge among agents. For the described
economy, the equilibrium is de�ned in the fashion of rational expectations.
De�nition 3.1 An equilibrium in the economy consists of a set of trading strategies xit :
R4 ! R for i 2 I, xjt : R4 ! R for j 2 J , and a price function Pt : �! R such that:
1. Each agent's trading strategy maximizes her expected utility of end-of-period wealth
given her information set:
xt 2 argmaxE [� exp (��Wt) jFt]
where Ft = f�t; si;t�1; sj;t�1; ptg
2. The market clears: Z mh
0xit di+
Z m`
0xjt dj = Zt.
In the equilibrium analysis, it is conjectured that equilibrium prices are linear in risky
asset payo� and liquidity, that is, equilibrium prices of the form
P ( ~Vt; ~Zt) = �t ~Vt � �t ~Zt.
CHAPTER 3. OVER- AND UNDERCONFIDENCE 113
Our objective is to �nd �t and �t that are consistent with this conjecture. The standard
technique yields the following result.
Theorem 3.1 Given ~si;t�1 = si;t�1; ~sj;t�1 = sj;t�1, the unique linear competitive equilibrium
price in period t is given by the expression
~pt = P ( ~Vt; ~Zt) = �t ~Vt � �t ~Zt (3.3.6)
with the coe�cients �t and �t satisfy:
�t�t� �t =
�h�[ +At (1� )] , (3.3.7)
�t =�t + �
�t (�t + �) + , (3.3.8)
where
At = mh�h;t�1 +m`�`;t�1. (3.3.9)
The equilibrium demand of agent i in period t is given by
~xit = Bit~�it � Cit~pt (3.3.10)
where
Bit = + �i;t�1 (1� )
���1h, (3.3.11)
Cit =�
�2+ �h [ +At (1� )]+�h� + �i;t�1 (1� )
��
(3.3.12)
Proof. All proofs are in the Appendix 3.A.
A remarkable feature of equilibrium price is that it is ultimately determined by agents'
aggregate (or average) expected ability denoted by A, as other exogenous parameters are
assumed to be constant (In particular, we have assumed that � = 1). More importantly, the
equilibrium price at period t does not depend on the realizations of ~�it for i 2 I and ~�jt for

CHAPTER 3. OVER- AND UNDERCONFIDENCE 114
j 2 J , as the noise terms in private signals cancel out when a continuum of agents submit
their demands. Surely this is not the case for individual agent's equilibrium demand for risky
asset.
Note that in di�erent scenarios, the notations of pt; �t; �t; �t and At; Bt; Ct should be
adjusted accordingly. For example, when over- and undercon�dent agents coexist, At is
replaced by
�At = mh��h;t�1 +m`��`;t�1.
As mentioned before, even though we hypothesize the coexistence of biased agents when
competition, communication and comparison are introduced, we also explore some other
scenarios in which one type of agents is fully rational and the other biased in ability learning.
Such considerations help better understand the relationship between market trading patterns
and biased beliefs. In particular, only by doing so can we disentangle the contributing forces of
over- and undercon�dence, coming from upward and downward learning biases respectively.19
We know in short run it is possible that inexperienced high-ability agents may be unlucky and
receive fewer high precision signals than low-ability agents, making the model description and
notations quite awkward. To circumvent these we assume that, without loss of generality,
agents in group I are of high-ability, and more importantly, we always have sit � sjt up
to any period t, this being true at least in an ex ante perspective. As a consequence, two
conceivable scenarios are of particular interests. When all high-ability agents in group I are
overcon�dent while all low-ability agents in group J rational, their aggregate expected ability
is denoted by
Aot = mh��h;t�1 +m`�`:t�1.
When group I agents are rational while group J agents undercon�dent, the corresponding
value is
Aut = mh�h;t�1 +m`��`;t�1.
The economy scenarios are labelled as E1; E2; E3; E4 in order. Table 3.1 summarizes the sce-19Note that both types of agents becoming overcon�dent or undercon�dent is not very plausible under the
assumption of ability substitutability.
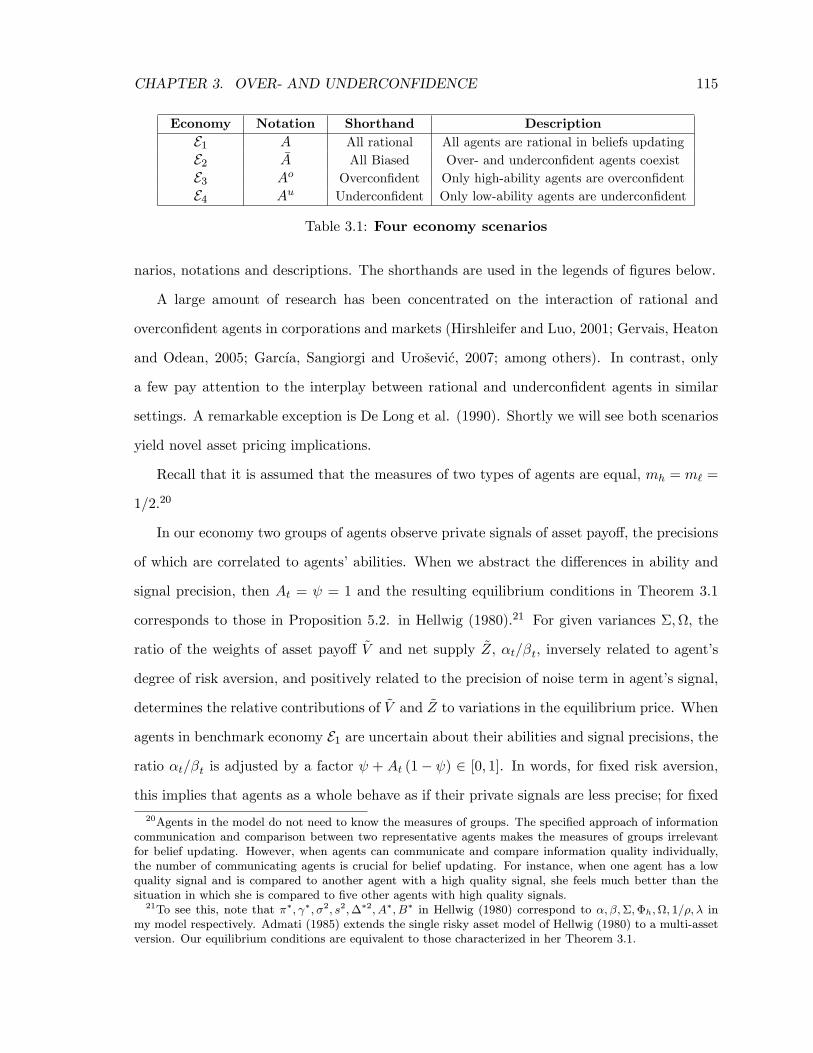
CHAPTER 3. OVER- AND UNDERCONFIDENCE 115
Economy Notation Shorthand Description
E1 A All rational All agents are rational in beliefs updating
E2 �A All Biased Over- and undercon�dent agents coexist
E3 Ao Overcon�dent Only high-ability agents are overcon�dent
E4 Au Undercon�dent Only low-ability agents are undercon�dent
Table 3.1: Four economy scenarios
narios, notations and descriptions. The shorthands are used in the legends of �gures below.
A large amount of research has been concentrated on the interaction of rational and
overcon�dent agents in corporations and markets (Hirshleifer and Luo, 2001; Gervais, Heaton
and Odean, 2005; Garc��a, Sangiorgi and Uro�sevi�c, 2007; among others). In contrast, only
a few pay attention to the interplay between rational and undercon�dent agents in similar
settings. A remarkable exception is De Long et al. (1990). Shortly we will see both scenarios
yield novel asset pricing implications.
Recall that it is assumed that the measures of two types of agents are equal, mh = m` =
1=2.20
In our economy two groups of agents observe private signals of asset payo�, the precisions
of which are correlated to agents' abilities. When we abstract the di�erences in ability and
signal precision, then At = = 1 and the resulting equilibrium conditions in Theorem 3.1
corresponds to those in Proposition 5.2. in Hellwig (1980).21 For given variances �;, the
ratio of the weights of asset payo� ~V and net supply ~Z, �t=�t, inversely related to agent's
degree of risk aversion, and positively related to the precision of noise term in agent's signal,
determines the relative contributions of ~V and ~Z to variations in the equilibrium price. When
agents in benchmark economy E1 are uncertain about their abilities and signal precisions, the
ratio �t=�t is adjusted by a factor + At (1� ) 2 [0; 1]. In words, for �xed risk aversion,
this implies that agents as a whole behave as if their private signals are less precise; for �xed
20Agents in the model do not need to know the measures of groups. The speci�ed approach of informationcommunication and comparison between two representative agents makes the measures of groups irrelevantfor belief updating. However, when agents can communicate and compare information quality individually,the number of communicating agents is crucial for belief updating. For instance, when one agent has a lowquality signal and is compared to another agent with a high quality signal, she feels much better than thesituation in which she is compared to �ve other agents with high quality signals.21To see this, note that ��; �; �2; s2;��2; A�; B� in Hellwig (1980) correspond to �; �;�;�h;; 1=�; � in
my model respectively. Admati (1985) extends the single risky asset model of Hellwig (1980) to a multi-assetversion. Our equilibrium conditions are equivalent to those characterized in her Theorem 3.1.
CHAPTER 3. OVER- AND UNDERCONFIDENCE 116
precision of noise term, agents act as if they are more risk averse. These interpretations
become more evident in economies E3 and E4. For instance, in economy E3 when group
I agents are overcon�dent while group J agents rational, in equilibrium agents altogether
behave as if they mistakenly believe the precision of signals to be higher relative to that in
benchmark economy E1. Apparently, this essentially makes our modeling of overcon�dence
as agents overestimating ability to be compatible with the most common modeling of it
as agents overestimating precision of private signals. More importantly, in this paper the
common risk aversion is assumed to be invariant to agent's belief of ability, but we clear
see the close connection between biases in beliefs and risk aversions. In a sense, studying
the implications of agents' over- and undercon�dence is equivalent to studying the e�ects of
agents' varying risk aversions. Hellwig (1980) examines how agents' di�erent risk aversions
change the properties of equilibrium prices, while I extend the analysis to other aspects of
market trading such as price volatility, expected trading volume and agents' expected pro�ts.
3.4 Properties of the Model
In this section we analyze the e�ects of agents' learning bias on the properties and dynamics of
the economy in the linear equilibrium. I introduce the measure of over- and undercon�dence
and show that the attribution bias result in dynamically evolving over- and undercon�dence.
I then look at the e�ect of this changing over- and undercon�dence on price volatility, trading
volume, as well as agents' pro�ts.
3.4.1 Individual Con�dence Bias
Suppose trading in this security market lasts to in�nity, we would expect that all rational
agents in benchmark economy E1 to eventually learn their exact abilities. Does this result still
hold when agents learn their abilities with attribution bias? When the economy is populated
by only one insider with unknown ability, Gervais and Odean (2001) show that the answer
might be \no". In particular, they demonstrate that while a high-ability agent will learn her
ability precisely in the long run, a low-ability insider may mistakenly do so if her learning

CHAPTER 3. OVER- AND UNDERCONFIDENCE 117
bias is su�ciently extreme, no matter how much experience she has. Fortunately, when it is
common knowledge that there are two di�erent types of agents in the economy, the answer
to above question is \yes" since the high-ability agent will recognize her exact ability when
she collect enough information about her signals' quality as t tends to in�nity. This is shared
with the low-ability agent in the presence of social communication. As a consequence, the
latter must acknowledge her low-ability eventually.22
Proposition 3.1 All agents, biased or not, will eventually learn their abilities correctly.
One central theme of Gervais and Odean (2001) is the evolution of agent's expected level
of overcon�dence. They show that with self-attribution bias, an trader's expected level of
overcon�dence is pronounced in the early stages of her career. Then, with more experience,
she comes to better recognize her own ability. In other words, their model predicts that
more inexperienced agents will be more overcon�dent than experienced agents. However,
Kirchler and Maciejovsky (2002) hypothesize that when predicting asset prices, experiment
participants are expected to be more cautious and less certain in the beginning of trading.
As participants gain more experience across trading period, they are expected to increasingly
place more weight on their predictions, overestimate the accuracy of their judgements and
lower the boundaries of the con�dence intervals. This hypothesis is con�rmed in their studies
and is backed by Gri�n and Tversky (1992) who report that experts may even be more prone
to overcon�dence than novices in certain tasks.23 This discrepancy is mitigated in our model.
To see this more clearly, note that the overcon�dent agent in Gervais and Odean (2001) will
update her belief in the following way
�goit (si; sj) = �it (si) =( H)si (1�H)t�si �0
( H)si (1�H)t�si �0 + Lsi (1� L)t�si (1� �0)22If this is not common knowledge, then the validity of Proposition ## requires that <��LH
�H � 1�L1�H
�1�H� 1H�L
.
23In fact Barber and Odean (1998) �nd that after controlling for gender, marital status, children, andincome, younger investors trade more actively than older investors. But even younger investors have medianage of 48.

CHAPTER 3. OVER- AND UNDERCONFIDENCE 118
Apparently, we have
��it (si; sj) � �goit (si; sj)
3.4.2 Price Volatility
Price volatility is measured by variance of the equilibrium price. LeRoy and Porter (1981),
and Shiller (1981) demonstrate that it is hard to understand the excessive price volatility
in security markets. Financial economists resort to agent's overcon�dence as the underlying
contributing forces. Most existing studies maintain that price volatility is increasing in agent's
overcon�dence degree.24 Nonetheless, this is not always true in my model.
Set
A = �2� 2 �h � �p5�22 � 4
2 (1� ) �h,
A = �2� 2 �h + �p5�22 � 4
2 (1� ) �h,
Lemma 3.1 In economy E1, conditional on agents i and j having received high precision
signals si and sj times in the �rst t periods, i.e., ~sit = si; ~sjt = sj, the price volatility in
period t+ 1 is given by
var (~pt+1jsi; sj) =��2t+1 +
� � �t+1 + �
�t+1 (�t+1 + �) +
�2.
where �t+1 = [ + (1� )At+1] �h=�. When 5�2�4 > 0, price volatility is strictly decreas-
ing in At+1 if
A � At+1 � A (3.4.1)
and is strictly increasing in At+1 otherwise. When 5�2�4 � 0, price volatility is increasing
in At+1. In other economy scenarios, price volatility and At+1 are adjusted appropriately.
At the �rst glance, it may not be very clear why price volatility hinges on agents' ag-
gregate (or average) expected ability A. As mentioned earlier, it plays the role of changing
24The exceptions include Daniel, Hirshleifer and Subrahmanyam (1998), Garc��a, Sangiorgi and Uro�sevi�c(2004).
CHAPTER 3. OVER- AND UNDERCONFIDENCE 119
agents' risk aversion or changing the precision of noise terms in their signals when they feel
uncertain about abilities. Fixed the noise terms precision, a quick inspection of Equation
(3.3.7) reveals that in economy E1 rational agents altogether behave as if their risk aversion is
�= [ + (1� )A] rather than � when they have identical ability. Given this interpretation,
the non-monotonicity of price volatility in risk aversion, or equivalently, agents' aggregate ex-
pected ability, is not surprising. Fix the variances of risky asset payo� and net supply �;,
and the precision of noise term, in general, when agents' risk aversion increases their trading
intensity decreases. The weight � of asset payo� ~V therefore goes down. On the other hand,
since there is less information injected into the economy, the weight � of net supply ~Z goes
up. As a consequence, there is a trade-o� in terms of price volatility. The calculations show
that the decrease in � outweighs the increase in � for su�ciently low risk aversion, hence
price volatility is decreasing. When risk aversion becomes higher, then the trade-o� changes
direction, and price volatility is therefore increasing.25 The same intuition can be applied to
the situation in which agents behave as if their risk aversion is constant but the precision of
noise terms in private signals is practically altered by their aggregate expected ability. The
proposition provides exact conditions that can be equivalently restated in terms of agents'
risk aversion or precision of noise terms.
We are in particular interested in the situation when price volatility is strictly decreas-
ing in agents' aggregate expected ability. When this happens, agents in economy scenario
E4 where only low-ability agents are undercon�dent essentially exhibiting the highest risk
aversion, the resulting price volatility is somewhat unexpected but undeniable the highest.
Meanwhile, we observe the lowest price volatility in economy E3 where only high-ability agents
are overcon�dent. In addition, the price volatilities in benchmark economy E1 and in \over-
and undercon�dent agents coexisting" scenario E2 are in-between, the former being higher
than the latter.
To convince readers, I provide a numerical example to show that it is indeed possible
that high price volatility is associated with undercon�dence rather than overcon�dence when
25The opposite situation happens if we assume that agents only observe private signals correlated withasset net supply prior to trading. Under this assumption, we still have the non-monotonicity result of pricevolatility.
CHAPTER 3. OVER- AND UNDERCONFIDENCE 120
reasonable exogenous parameters are chosen. I �rst set H = 0:8 and L = 0:4 so that on
average agents i and j receive high precision signals 4 and 2 times in the �rst 5 periods, 8
and 4 times in the �rst 10 periods, and so on. Learning bias degree and the precision ratio
are set to be 2 and 0:1 respectively. This four parameters' in uence on the satisfaction
of condition (3.4.1) are minimal. Next, from preceding discussion we know the net supply
variance plays an important role in determining price volatility. Since I have set asset payo�
variance � = 1, a large will render net supply variation to dominate payo� variations in
price volatility, consequently even at a low risk aversion level price volatility will exhibit
increasing in � and decreasing in A. Alternatively, we can directly see that a large will
make it is easier for the condition (3.4.1) to get satis�ed. Hence I set � = = 1 to create
obstacle for the goal. Gervais and Odean (2001) also use these values in their numerical
analysis. Third, the magnitude of absolute risk aversion � is equally important. Note that
for a very low � it is more plausible that 5�2 � 4 � 0, so price volatility is increasing in
agents' aggregate expected ability.26 Therefore the more overcon�dent agents are, the higher
price volatility results in. Although some studies report low value of risk aversion from
subjects attending TV game show (Beetsma and Schotman, 2001), other researchers consider
� to be at least larger than 3 (Hong and Stein, 1999; Veldkamp, 2005).27 As a compromise,
I set � = 1, the most common value selected by a large number of papers (Yuan, 2005).
Finally the high precision of noise terms �h is set to be 1. Given these parameter values, we
have A = �0:111, A = 1. Figure 3.2 shows the expected price volatilities in four economy
26Beetsma and Schotman (2001) use data from a Dutch TV game show and estimate absolute risk aversionto be 0:12�0:20: Nonetheless, the disadvantage of risk aversion estimation using TV game show should not beneglected. Arguably, the behaviour of game-show players may not be representative for behaviour outside thestudio. Players are often in uenced, for example, by social pressure from the audience, remarks and directionsby the game-show host and the unique event of being on national TV. Consequently they generally displaylower risk aversion. The authors point out another possibility, \house money e�ect", renders the estimates tounderstate player's true risk aversion as players are not yet accustomed to the money they have won so farthus are more willing to bet their stakes. A recent study by Post et. al. (2006) estimates players' relative riskaversion in a popular global TV game show \Deal or No Deal". They �nd that the degree of risk aversiondi�ers widely across players and the average relative risk aversion is 1.15, which is also believed to be lowerthan true value.27Empirical estimate of risk attitude is often plagued by problems of joint hypotheses and improper stimuli
for the subjects. Laboratory or classroom experiments generally use hypothetical or small real stakes, andsubjects may not be su�ciently motivated to act optimally and reveal their true preferences and beliefs.Natural experiment like TV game show, often involving simple decision rules and large monetary stakes canovercome this incentive problem to some extent.

CHAPTER 3. OVER- AND UNDERCONFIDENCE 121
scenarios as trading and learning unfold.
Figure 3.2: Price volatilities in four economy scenarios. Ex ante expected price variancesin di�erent scenarios for parameter values H = 0:8; L = 0:4;mh = m` = 0:5; �0 = 0:5; = 2;� = = 1;�h = � = 1 and = 0:1.
Denote period t+1's price volatility in economy Ek by volatilityt+1 (Ek) for k = 1; � � � ; 4,
we have:
Proposition 3.2 Given sit � sjt in the �rst t periods and learning bias parameter > 1,
when
A � Aut+1 � At+1 � �At+1 � Aot+1 � A, (3.4.2)
we have
volatilityt+1 (E4) � volatilityt+1 (E1) � volatilityt+1 (E2) � volatilityt+1 (E3) .
Moreover, when condition (3.4.2) is satis�ed, the price volatility in economy E3 (E4) are lower
(higher) when is larger.
Some comments are in order. First and most importantly, the non-monotonicity of price
CHAPTER 3. OVER- AND UNDERCONFIDENCE 122
volatility in some exogenous parameters is crucial for this new �nding, which results directly
from the randomness of both asset payo� and net supply. When agents observe a high market
clearing price, they are unsure whether it means good news of asset payo� or it simply re ects
low net supply. It can be easily shown that when agents are certain about asset net supply,
the resulting price volatility is monotone in the variance of asset payo�. We all known that
the introduction of random asset net supply is mainly to overcome the \Grossman-Stiglitz
Paradox" in the sense that agents have no incentive to acquire costly signals in the �rst place
if the observable equilibrium prices fully reveal a su�cient statistic of underlying signals. If
this is the case, how could equilibrium prices aggregate agents' signals? Even if the signals
are costless, agents won't condition their demand on private signals it since they are less
informative than equilibrium prices (Grossman, 1978; Grossman and Stiglitz, 1980). To
the best of my knowledge, it is new to the literature that such introduction leads to non-
monotonicity of price volatility. Second, if information communication and comparison are
absent, and all agents exhibit self-serving attribution bias in beliefs updating as speci�ed in
Gervais and Odean (2001), the resulting overcon�dence among all agents will render price
volatility to be even lower than that in economy E3 when a similar condition is satis�ed.
Third, this comparison result does not depend on the speci�ed updating rule (3.3.4). In
particular, when condition (3.4.2) holds, allowing downward bias degree � to be smaller
or larger than the upward bias won't change the price volatility patterns from ex ante
perspective. In fact a very slight learning bias in economy E4 still generates the highest price
volatility. Last but not the least, even when the price volatility patterns are reversed for other
exogenous parameters so that price volatility in economy E3 becomes the highest, we have that
price volatility in economy E2 is higher relative to that in benchmark economy E1. Hence
the coexistence of over- and undercon�dent agents is not incompatible with the observed
excessive price volatility in security markets. Ruling out the possibility of undercon�dence is
not only unwarranted but also unnecessary.

CHAPTER 3. OVER- AND UNDERCONFIDENCE 123
3.4.3 Trading Volume
The enormousness of trading volume in security markets is also a big puzzle to economists
since the \No-Trade Theorem" of Milgrom and Stokey (1982) which claims that if it is
common knowledge that all agents are rational and the current allocation is ex-ante Pareto
e�cient, then new asymmetric information will not lead to trade, provided agents are strictly
risk averse and hold concordant beliefs. The noise or liquidity trading, i.e., the randomness
of asset net supply and agents' heterogeneous prior beliefs have been proposed as signi�cant
motives for trade. Recently agent's overcon�dence is particularly favored because of the
evidence from earlier psychological �ndings. In existing studies it is unanimous that expected
trading volume in the economy populated by overcon�dent agents is higher than that in full
rational economy. Again, my model does not support this claim.
In benchmark equilibrium, agent i optimally determines demand for risky asset.
~xit = Bit~�it � Cit~pt
where Bit and Cit, characterized in () and () respectively, are agent i's trading intensities on
private signal and observed price in period t respectively. In other economy scenarios, Bit
and Cit need to be adjusted accordingly.
It is assumed that after asset realizes its payo� at the end of each period, agents liquidate
asset holdings and consume all of their end-of-period consumption, the trading volume in
period t+ 1 is thus de�ned by,28
gV olt+1 = 1
2
�Z mh
0j~xi;t+1j di+
Z m`
0j~xj;t+1j dj +
��� ~Zt+1���� (3.4.3)
where the coe�cient 1=2 corrects the double counting when summing the shares traded
over all agents. The following lemma provides the value of expected trading volume for the
following discussion.
Lemma 3.2 In economy E1, conditional on the agents i and j having received high precision28Lo and Wang (2000) discuss di�erent de�nitions of trading volume.
CHAPTER 3. OVER- AND UNDERCONFIDENCE 124
signals si and sj times in the �rst t periods, expected trading volume in period t+ 1 is given
by
E�gV olt+1jsi; sj� =r 1
2�
�mh
qvar (~xh;t+1jsi; sj) +m`
qvar (~x`;t+1jsi; sj) +
p
�(3.4.4)
where var (~xh;t+1jsi; sj) is given as (3.A.8) in Appendix 3.A. var (~x`;t+1jsi; sj) can be calcu-
lated similarly. In other economy scenarios, expected trading volume is adjusted accordingly.
From the Appendix we see that the exact forms of var (~xh;t+1jsi; sj) and var (~x`;t+1jsi; sj)
are quite involved. Unlike the price volatility in which the expected abilities �ht and �`t of
two types of agents play their roles collectively through aggregate expected ability At+1,
expected trading volume in period t+ 1 is determined not only by At+1 but also by �ht, �`t
individually, as all other exogenous parameters are assumed to be constant across periods.
The way that �ht; �`t and At+1 enter into the expression of expected trading volume makes
it a formidable task to analyze the resulting comparative statics. The ultimate dependence
of expected trading volume on learning bias degree is equally ambiguous. To see this more
clearly, in period t+ 1 consider a relatively simple comparison of \all agents being rational"
and \only high-ability agents being overcon�dent" scenarios in economies E1 and E3. As
low-ability agents in group J are always rational under these two scenarios, all di�erences
in market trading patterns are ultimately caused by the distinctions of �ht and ��ht. Even
so, it is still extremely hard to answer whether expected trading volume in economy E3 is
always higher than that in economy E1. First of all, let's take a close look of the high-
ability agents' demands for risky asset in economies E1 and E3. Suppose in some period the
realizations of signal ~� and price ~p in both economies are very close, then the magnitudes of
trading intensities Bh and Ch in Equation (3.3.10) of high-ability agents in group I determine
which demand is larger. On the one hand, in economy E3 overcon�dent agents will de�nitely
increase their trading intensity Bh on private signals because either they overestimate the
precision of signals or they become less risk averse. On the other hand, in determining their
demands, overcon�dent agents also respond to observable price, on which the change of their
trading intensity Ch is inde�nite. This can be easily seen through a scrutiny of Equation
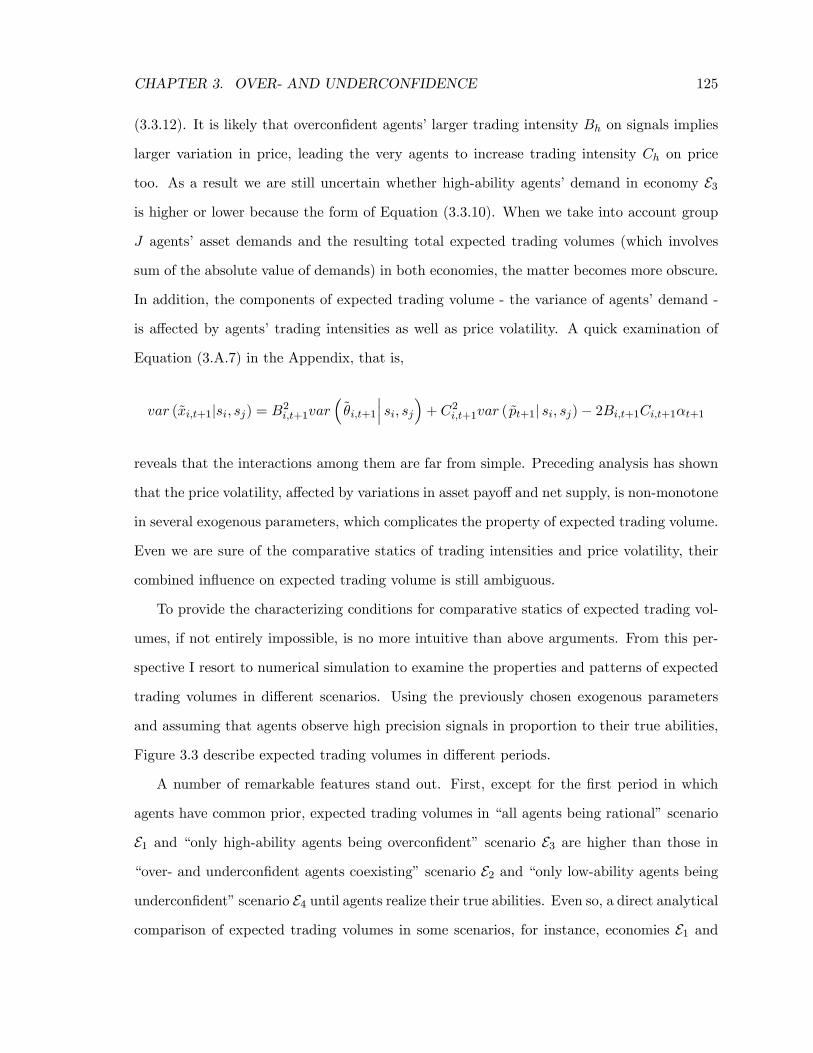
CHAPTER 3. OVER- AND UNDERCONFIDENCE 125
(3.3.12). It is likely that overcon�dent agents' larger trading intensity Bh on signals implies
larger variation in price, leading the very agents to increase trading intensity Ch on price
too. As a result we are still uncertain whether high-ability agents' demand in economy E3
is higher or lower because the form of Equation (3.3.10). When we take into account group
J agents' asset demands and the resulting total expected trading volumes (which involves
sum of the absolute value of demands) in both economies, the matter becomes more obscure.
In addition, the components of expected trading volume - the variance of agents' demand -
is a�ected by agents' trading intensities as well as price volatility. A quick examination of
Equation (3.A.7) in the Appendix, that is,
var (~xi;t+1jsi; sj) = B2i;t+1var�~�i;t+1
��� si; sj�+ C2i;t+1var ( ~pt+1j si; sj)� 2Bi;t+1Ci;t+1�t+1reveals that the interactions among them are far from simple. Preceding analysis has shown
that the price volatility, a�ected by variations in asset payo� and net supply, is non-monotone
in several exogenous parameters, which complicates the property of expected trading volume.
Even we are sure of the comparative statics of trading intensities and price volatility, their
combined in uence on expected trading volume is still ambiguous.
To provide the characterizing conditions for comparative statics of expected trading vol-
umes, if not entirely impossible, is no more intuitive than above arguments. From this per-
spective I resort to numerical simulation to examine the properties and patterns of expected
trading volumes in di�erent scenarios. Using the previously chosen exogenous parameters
and assuming that agents observe high precision signals in proportion to their true abilities,
Figure 3.3 describe expected trading volumes in di�erent periods.
A number of remarkable features stand out. First, except for the �rst period in which
agents have common prior, expected trading volumes in \all agents being rational" scenario
E1 and \only high-ability agents being overcon�dent" scenario E3 are higher than those in
\over- and undercon�dent agents coexisting" scenario E2 and \only low-ability agents being
undercon�dent" scenario E4 until agents realize their true abilities. Even so, a direct analytical
comparison of expected trading volumes in some scenarios, for instance, economies E1 and

CHAPTER 3. OVER- AND UNDERCONFIDENCE 126
Figure 3.3: Expected trading volumes in four economy scenarios. H = 0:8; L =0:4;mh = m` = 0:5; �0 = 0:5; = 2;� = = 1;�h = � = 1 and = 0:1.
E4, is still pretty di�cult.
Second, we see that expected trading volumes in di�erent scenarios exhibit diminishing
patterns for all trading periods until agents' beliefs converge with the only possible exception
being that in economy E3, expected trading volume could be increasing for some initial
periods. This is understandable. When trading begins, agents learn their abilities through
information communication over time. In general, high-ability agents will increase their
trading volumes as they indeed observe signals of high precision or they are prone to believe
so, while low-ability agents will do the opposite. Numerical simulation shows that on average
the magnitude of decreasing volumes outweighs that of increasing ones, despite the same
measure of agents in groups I and J . In economy E3 analysis in section 3.4.2 reveals that
the degree of high-ability agents in group I overestimating their ability is most severe in
some initial periods, they trade far more aggressively than what they do in later periods,
while the changes of trading volume coming from low-ability but rational agents in group J
is not that much. This interplay leads to the increasing portion of expected trading volumes

CHAPTER 3. OVER- AND UNDERCONFIDENCE 127
Figure 3.4: Decomposed expected trading volumes in four economy scenarios.
in economy E3. All these discussions can be seen evidently in a decomposition exercise, as
shown in Figure 3.4, if we roughly measure the expected trading volumes of two types of
agents by mh
pvar (~xh;t+1jsi; sj) =2� and m`
pvar (~x`;t+1jsi; sj) =2� respectively.29
Finally and most relevantly for our purpose, Figure 3.3 reveals that in several initial
periods the expected trading volume in economy E3 is higher relative to that in economy E1,
but this pattern is completely reversed later on. Similar pattern applies to economies E2 and
E4 where the distinction also comes from whether high-ability agents are overcon�dent or
rational in learning. The decomposition exercise in Figure 3.4 shows that expected trading
volumes of rational low-ability agents in economy E3 are always much lower than those of the
very agents in economy E1, while overcon�dent high-ability agents' expected trading volumes
in economy E3 is �rst higher but then dominated by those of rational high-ability agents in
economy E1. When put together, we observe a new pattern of expected trading volumes.
It is partially consistent with existing studies but for most times we see sharp contrast.
Admittedly, an analytical proof is hard to obtain. As explained before, the di�erence in
29It is very interesting to note that, in the left panel of Figure 4, the rough measure of high-ability agents'trading volume in economy E4 is always higher than that in economy E1 although agents are alway rational inlearning their ability (The opposite is true for low-ability agents in economies E4 and E1, see the right panelof Figure 4). The distinction solely results from agent's di�erent trading intensities on price. In economy E4where low-ability agents are undercon�dent, their demand a�fects the equilibrium price in such a way thatit is optimal for high-ability agents to react more to price than they do in economy E1. The same is true forhigh-ability agents' trading volumes in economies E2 and E3 for similar reason.

CHAPTER 3. OVER- AND UNDERCONFIDENCE 128
expected trading volumes is solely determined by the distinction of group I agents' expected
abilities ��ht and �ht. However, the way that group I agents' expected ability enters into the
form of expected trading volume renders comparative statics analysis intractable to a large
extent. For instance, numerical simulation demonstrates that slight changes of ��ht � �ht,
which are always of the same sign for t > 1, will dramatically change the sign of the di�erence
between expected trading volumes in two scenarios at some point.
It is noteworthy to highlight that the pattern of expected trading volumes in four economy
scenarios is retained for many sets of parameters specifying the economy and information
structures (perhaps for all sets, no numerical counterexample is found).30 This is even the
case when the patterns of price volatility are reversed for some sets of parameters so that the
price volatility in \overcon�dent" scenario E3 is the highest while that in \undercon�dent"
E4 the lowest.
Denote period t + 1's expected trading volume in economy Ek by volumet+1 (Ek) for
k = 1; � � � ; 4, the �ndings in numerical simulation is summarized as follows.
Proposition 3.3 For many sets of parameters specifying the economies, given sit � sjt for
all periods t, there exists some periods t > 1 such that
volumet+1 (E1) > volumet+1 (E3) > volumet+1 (E4) > volumet+1 (E2) .
Another speci�c question I want to reexamine is the relationship between expected trading
volume and overcon�dence degree. Most existing studies maintain that when agents mistak-
enly believe that their private signals are more precise, expected trading volume is higher
largely because overcon�dent agents trade more aggressively. For my purpose the attention
is restricted to \only high-ability agents being overcon�dent" scenario E3. My model disagree
with this simple monotone relationship. Before we go to the detail, I need to emphasize that
the economy E3 is distinct from the economies considered in other studies in two aspects.
First, rational agents are usually assumed away in those studies. Either a single overcon�-
dent agent plays a strategic game with market-maker, or many overcon�dent agents trade
30I �x � = 1, mh = m` = 1=2 and �0 = 1=2 for numerical simulations.
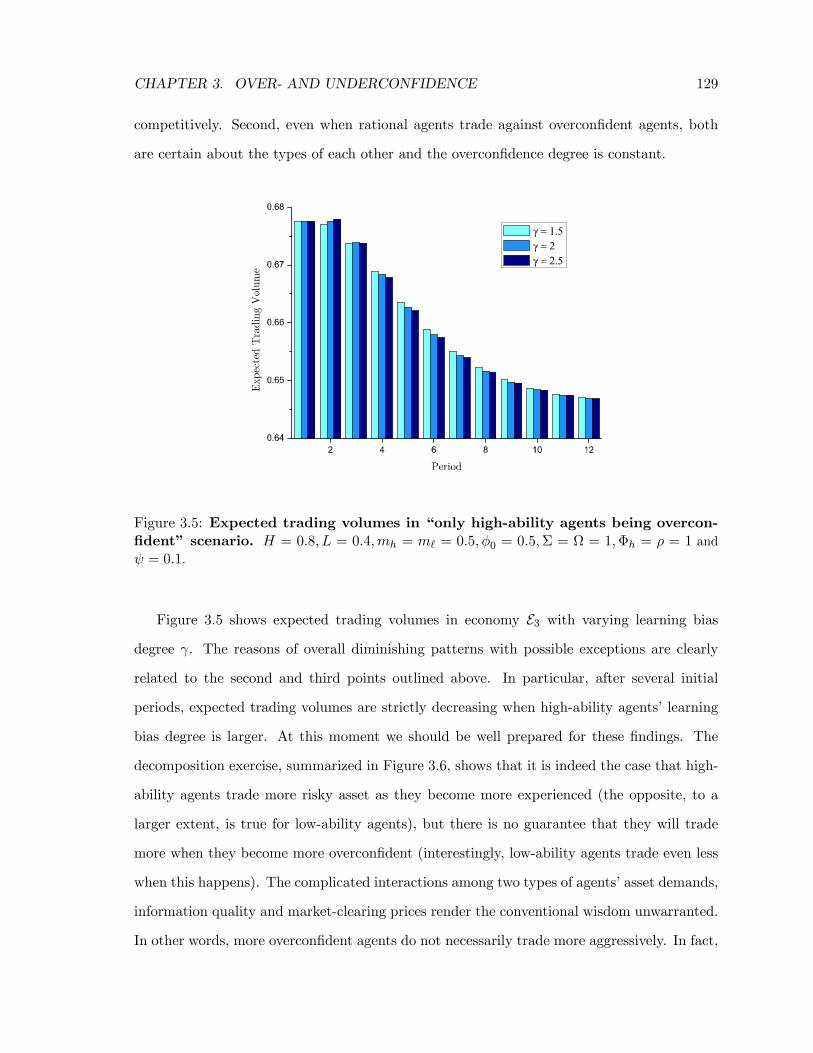
CHAPTER 3. OVER- AND UNDERCONFIDENCE 129
competitively. Second, even when rational agents trade against overcon�dent agents, both
are certain about the types of each other and the overcon�dence degree is constant.
Figure 3.5: Expected trading volumes in \only high-ability agents being overcon-�dent" scenario. H = 0:8; L = 0:4;mh = m` = 0:5; �0 = 0:5;� = = 1;�h = � = 1 and = 0:1.
Figure 3.5 shows expected trading volumes in economy E3 with varying learning bias
degree . The reasons of overall diminishing patterns with possible exceptions are clearly
related to the second and third points outlined above. In particular, after several initial
periods, expected trading volumes are strictly decreasing when high-ability agents' learning
bias degree is larger. At this moment we should be well prepared for these �ndings. The
decomposition exercise, summarized in Figure 3.6, shows that it is indeed the case that high-
ability agents trade more risky asset as they become more experienced (the opposite, to a
larger extent, is true for low-ability agents), but there is no guarantee that they will trade
more when they become more overcon�dent (interestingly, low-ability agents trade even less
when this happens). The complicated interactions among two types of agents' asset demands,
information quality and market-clearing prices render the conventional wisdom unwarranted.
In other words, more overcon�dent agents do not necessarily trade more aggressively. In fact,
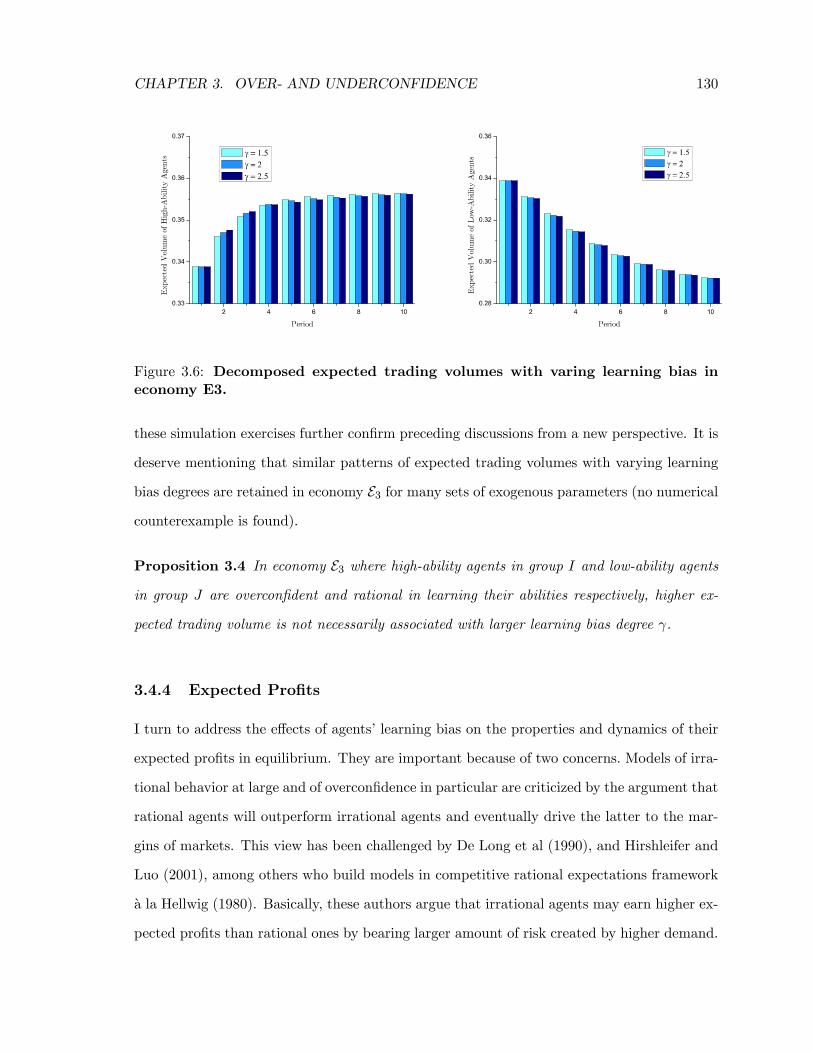
CHAPTER 3. OVER- AND UNDERCONFIDENCE 130
Figure 3.6: Decomposed expected trading volumes with varing learning bias ineconomy E3.
these simulation exercises further con�rm preceding discussions from a new perspective. It is
deserve mentioning that similar patterns of expected trading volumes with varying learning
bias degrees are retained in economy E3 for many sets of exogenous parameters (no numerical
counterexample is found).
Proposition 3.4 In economy E3 where high-ability agents in group I and low-ability agents
in group J are overcon�dent and rational in learning their abilities respectively, higher ex-
pected trading volume is not necessarily associated with larger learning bias degree .
3.4.4 Expected Pro�ts
I turn to address the e�ects of agents' learning bias on the properties and dynamics of their
expected pro�ts in equilibrium. They are important because of two concerns. Models of irra-
tional behavior at large and of overcon�dence in particular are criticized by the argument that
rational agents will outperform irrational agents and eventually drive the latter to the mar-
gins of markets. This view has been challenged by De Long et al (1990), and Hirshleifer and
Luo (2001), among others who build models in competitive rational expectations framework
�a la Hellwig (1980). Basically, these authors argue that irrational agents may earn higher ex-
pected pro�ts than rational ones by bearing larger amount of risk created by higher demand.
CHAPTER 3. OVER- AND UNDERCONFIDENCE 131
For instance, overcon�dent agents overreact to their private signals therefore demand more
risky assets whose expected payo�s are higher.31 However, the results of expected pro�ts
are somewhat mixed. When overcon�dence is modeled in the strategic rational expectations
framework �a la Kyle (1985). Kyle and Wang (1997) show that \Prisoner's Dilemma" arises
between two agents in the sense that both optimally choose to be overcon�dent of private
signals, even though their equilibrium payo�s is lower than those if both are rational. Gervais
and Odean (2001) show that a single insider's expected pro�ts are decreasing in her learning
bias degree.
Lemma 3.3 Conditional on the agents i and j having received high precision signals si and
sj times in the �rst t periods, expected pro�t of agent i in period t+ 1 is given by
E (�i;t+1jsi; sj) =��3h� (�it) �
2 (At+1) + �32�h� (�it) [1 + 2�h� (At+1)] + �
53 [1 + �h� (�it)]
[�2h�2 (At+1) + �2 (1 + �h� (At+1))]
2
(3.4.5)
where
� (y) = + y (1� ) .
Given sit � sjt for all t, high-ability agent' expected pro�t is higher than that of low-ability
agent.
Not unexpectedly, we once again face the situation that agent i's expected pro�t in period
t+1 is determined by her expected ability �it as well as the aggregate expected ability At+1,
a�ecting agent's trading behavior and equilibrium price respectively. The ultimate in uences
of learning bias degree on expected pro�ts in di�erent economy scenarios are obscure, to say
the best. I have to rely on numerical simulations to gain insights about patterns of expected
pro�ts. Fortunately, before doing so an a�rmative conclusion can be drawn: From the ex ante
perspective in the sense that agents observe high precision signal in proportion to their real
abilities, then high-ability agents, whatever rational or overcon�dent, on average earn more
than low-ability agents. This is evident in Figure 3.7 under the same exogenous parameters
used before. The intuition behind this result is straightforward. No matter high-ability
31Of course irrational agents' expected utilities are lower relative to otherwise identical rational agentsbecause they acts suboptimally.

CHAPTER 3. OVER- AND UNDERCONFIDENCE 132
agents are rational or overcon�dent, their private signals are indeed more precise on average.
Other things equal, this implies more expected pro�ts. Moreover, as trading and learning
unfold their evaluation of ability become more accurate. Consequently, their expected pro�ts
rise over time and converge to the highest level. The opposite characterizes the dynamics of
low-ability agents' expected pro�ts.
Figure 3.7: Expected trading pro�ts in four economy scenarios. H = 0:8; L =0:4;mh = m` = 0:5; �0 = 0:5; = 2;� = = 1;�h = � = 1 and = 0:1.
Some other interesting patterns of expected pro�ts arise. First, comparing Figure 3.7
with left panel of Figure 3.5, we see that expected pro�ts are more or less related to agents'
trading behavior. For instance, on average high-ability agents trade more and earn more in
economy E4 relative to economy E1, and same is true in economy E2 relative to E3. However,
we should also note that trading more does not necessarily imply that earning more, and
vice versa. Although high-ability agents' expected pro�ts can be ranked orderly in Figure
3.7, we clearly can not rank their expected trading volume in the same way. At the same
time, comparing Figure 3.7 with right panel of Figure 3.5, we can rank both expected pro�ts
and expected trading volume of low-ability agents, but the one-to-one relationship does not
CHAPTER 3. OVER- AND UNDERCONFIDENCE 133
exist. For instance, low-ability agents trade more but earn less in economy E3 relative to
economy E4 Second, when two types of agents compete together, rational agents' expected
pro�ts may be higher (resp. lower) than overcon�dent (resp. undercon�dent) agents' when
their competitors behave di�erently.32 For instance, for high-ability agents rational ones in
E4 on average earn more than overcon�dent ones in economy E3, and for low-ability agents
rational ones in economy E3 earn less than undercon�dent ones in economy E4.
We can understand above viewpoints such as \trading less does not necessarily imply
earning less" from another perspective. Recall that in left panel of Figure 3.6 when high-
ability agents become more overcon�dent while low-ability agents are always rational in
economy E3, the formers may trade less after several initial periods. The following Figure
3.8, using the same exogenous parameters chosen before, reveals that high-ability agents may
then still earn more.
Proposition 3.5 In economy E3 where group I agents and group J agents are overcon�dent
and rational in learning their abilities respectively, lower expected pro�ts is not necessarily
associated with larger learning bias degree.
The logic behind this result is not surprising, as we are already familiar with the nonlinear
relationship between expected pro�ts and price volatility. To see this more clearly, remember
informed agents' pro�ts come from noise traders' loss. When high-ability but overcon�dent
agents trade more aggressively, they take a larger share of pro�ts relative to rational low
agents. Their higher risk is compensated by higher return. Note that this is not always true,
it is possible that overcon�dent agent's expected pro�t is decreasing in her overcon�dent
degree. For instance, when � = 0:2, we have such an example. For low-ability but rational
agent, for most sets of parameter the expected pro�t is also decreasing in learning bias
parameter.33
32Note that in Figure 7, it is the case that \other thing being equal, on average overcon�dent (undercon�-dent) agents earn more (less) than others."33A close inspection of (??) shows that a su�cient condition for this is �hA
o � 1. The necessary conditioncan be much weaker.

CHAPTER 3. OVER- AND UNDERCONFIDENCE 134
Figure 3.8: Expected pro�ts of high-ability but overcon�dent agents in economyE3. H = 0:8; L = 0:4;mh = m` = 0:5; �0 = 0:5;� = = 1;�h = � = 1 and = 0:1.
3.5 Discussion
In this section I discuss why my model generates asset pricing and welfare implications in
sharp contrast with existing studies. It turns out that the uncertainty of risky asset net supply
is a crucial element which separates my �ndings from others. Furthermore, if we cannot rely
on agent's overcon�dence evidence to explain the observed market trading patterns such
as excessive price volatility, trading volume, what are other possible contributing forces? I
suggest that information communication in �nancial markets is a plausible candidate.
3.5.1 The Role of Asset Random Net Supply
As is well known, randomness of asset net supply, or noise/liquidity trading, is introduced
into competitive or strategic rational expectations frameworks in order to circumvent the
troubles of \Grossman-Stiglitz Paradox" and \No-Trade Theorem". This paper shows that
this uncertainty has somewhat unexpected e�ects on market trading patterns, at least in the
competitive rational expectations framework. For instance, the non-monotonicity of price
CHAPTER 3. OVER- AND UNDERCONFIDENCE 135
volatility in some exogenous parameters lies behind our new �ndings regarding expected
trading volume and pro�ts. Odean (1998) examine the role of overcon�dence �a la a multi-
period version of Hellwig (1980). The author shows that price volatility, expected volume
are increasing in agent's overcon�dence degree. Notably, the net supply of risky asset is
assumed to be constant in every trading period. The purpose of doing so is to show that \the
absence of exogenous noise in this model demonstrates that, with overcon�dence, orderly
trading can take place in response to information even when no noise is present". Also it is
understandable to make this simpli�cation in a complicated dynamic trading model to ease
expositions, the implications of supply uncertainty on market trading patterns are sacri�ced.
It is indeed true that the role of asset random net supply is minimal in a�ecting market
trading patterns in some strategic rational expectations models such as the risk neutral
version of Kyle (1985). For instance, the variance of noise trading does not a�ect price
volatility because agents scale up their trading intensities on private signals in response
to an increase in the amount of noise trading. Nonetheless, the supply uncertainty has
much greater in uence if risk neutral agents are replaced by risk averse ones. Spiegel and
Subrahmanyam (1992) nicely illustrate that a number of conclusions derived in Kyle (1985)
cannot be maintained when traders are risk averse.
3.5.2 The Role of Information Communication
Trading activity is economic as well as sociological. Recently a new and growing empirical
literature has documented that information communication a�ects individual trading behav-
ior and market trading patterns in �nancial markets (Wysocki, 1998; Hong, Kubik and Stein,
2004a, 2004b; Antweiler and Frank, 2004).34 Prompted by these �ndings, Ozsoylev (2005)
builds analytical model and establishes that when investors directly and truthfully share in-
formation in established social network prior to competitive trading, the resulting equilibrium
34Although economists have long recognized the role of social communication in �nancial markets. Directinformation communication is seldom explored for two reasons. First, following the tradition of general equilib-rium theory, economists mainly focus on the situation that investors utilize their information monopolisticallyand exclusively. They may infer other's information from observable prices or actions but seldom engage indirect information exchange. Second, although survey data have long revealed that interpersonal communica-tion is more in uential in a�ecting investment decision than traditional media, only until very recently have�nancial economists found actual supporting data from individual trading accounts.

CHAPTER 3. OVER- AND UNDERCONFIDENCE 136
may account for the observed high volatility ratio of price to fundamentals. In Chapter 2 of
this dissertation we show that, in a context of strategic trading, information communication
in social network generating asset pricing and welfare implications accord well with aforemen-
tioned empirical �ndings. For example, investors will trade more actively but less pro�tably
in the presence of information communication. In particular, the model allows agents to be
overcon�dent in private signals in the sense that they incorporate a disproportionally large
weight of private signals relative to other information in communication. We demonstrate
that price volatility, expected trading volume are strictly decreasing in agents' overcon�dence
degree. These results are opposite to �ndings in overcon�dence literature reviewed in intro-
duction.35. Moreover, we further argues that information communication in �nancial markets
can alternatively explain some intriguing empirical �ndings in overcon�dence literature. For
example, Barber and Odean (2001) document that on average men trade more and earn less
than women. Barber and Odean (2002) report that when investors switch from phone-based
to online trading, they trade more actively and less pro�tably than before. For the former,
they cite psychological research that men are more overcon�dent than women in areas such
as �nance. For the latter, they explain the poor performance of online investors by their
overcon�dence since online investors perform well prior to switch and are more overcon�dent
in their ability in the new trading platform due to self-attribution bias. Instead, in the view
of chapter, information communication plays at least a complementary, if not entirely sub-
stitutable, role in accounting for these �ndings. Casual observation and anecdotal evidence
suggest that relative to women, men are more prone to exchange news regarding asset per-
formance and wealth accumulation. Similarly, it is routine for online traders to participate
in information sharing and discussion on Internet stock message boards.
35In the model each agent has a private signal and receives information from others through communication.Simply put, the \received information" aggregates all private signals in some particular way. When agent ismore overcon�dent in her private signal, the variance of received information actually turns out to higher, i.e.,received information is less precise. Overall agents trade less aggressively and that is why price volatility andexpected trading volume become lower.
CHAPTER 3. OVER- AND UNDERCONFIDENCE 137
3.6 Conclusion
Regarded as one of the most important and di�cult open problem in mathematics, the
Poincar�e Conjecture is a conjecture about the characterization of the three-dimensional sphere
amongst three-dimensional manifolds.36 After nearly a century of e�ort by mathematicians, a
series of papers made available in 2002 and 2003 by Grigori Perelman, following the program of
Richard Hamilton, sketched a solution. Three groups of mathematicians have produced works
�lling in the details of Perelman's proof since then. At the time of my writing, mathematicians
around the world were celebrating the resolution and Grigori Perelman was awarded the Fields
Medal for \his contributions to geometry and his revolutionary insights into the analytical
and geometric structure of the Ricci ow". The Fields Medal is widely considered to be
the top honor a mathematician can receive.37 However, the reclusive Perelman declined to
accept the award for some unknown reason. More unexpectedly and surprisingly, according
to a close friend, when a leading Russian mathematical institute failed to reelect him as a
member, Perelman was left feeling an absolutely ungifted and untalented person and he had a
crisis of con�dence and cut himself o�.38 Some even said that he had abandoned mathematics
entirely.39
This somewhat dramatic story, combined with other new �ndings in psychological ex-
periments, lead us to cast doubt on the widely accepted notion that people tend to exhibit
overcon�dence in ability and knowledge. This paper summarizes several key elements ignored
in previous studies and stresses the potentially important undercon�dence tendency in deci-
sion making. To gain more support, my further research plans to carefully design experiments
36The Poincar�e Conjecture is a conjecture by French mathematician Henri Poincar�e (1854-1912) and con-cerns a space that locally looks like ordinary three dimensional space but is �nite in size and lacks any boundary(a closed 3-manifold). The conjecture claims that if such a space has the additional property that each loop inthe space can be continuously tightened to a point, then it is just a three-dimensional sphere. A standard formof conjecture states that every simply connected compact 3-manifold (without boundary) is homeomorphic toa 3-sphere.37The Fields Medal is a prize awarded to two, three, or four mathematicians not over 40 years of age at
each International Congress of the International Mathematical Union, a meeting that takes place every fouryears.38Nadejda Lobastova and Michael Hirst. \World's top maths genuis jobless and living with mother", The
Daily Telegraph, 2006-08-20.http://www.telegraph.co.uk/news/main.jhtml?xml=/news/2006/08/20/nmaths20.xml39http://top.rbc.ru/index.shtml?/news/society/2006/08/22/22132425 bod.shtml
CHAPTER 3. OVER- AND UNDERCONFIDENCE 138
and directly test the hypothesis that over- and undercon�dence coexist when competition,
communication and comparison. In particular, future experimental studies should allow sub-
jects to share information and exchange idea to some extent since communication is one of
the most prominent traits of human economic and sociological behavior.
Depart from the mainstream overcon�dence literature, I show that many well-known re-
sults and conventional wisdoms are only conditionally valid when informed agents are risk
averse and asset supply uncertainty are incorporated. The Chapter 2 of this dissertation
proposes information communication theory as the alternative to account for puzzling indi-
vidual trading behavior and market trading patterns in �nancial markets. He also demon-
strates that, in the presence of information communication, the relationship between market
trading patterns and investors' con�dence degree contrasts sharply with existing literature.
More analytical and empirical works can be directed to examine these two competing theo-
ries.40 At the same time, delving into information communication further could shed light
on other �nancial market phenomena. For instance, Xia (2007b) attempts to build a con-
nection between information communication and the observed short-term return momentum
and long-term return reversal in security markets.
3.A Appendix: Proofs of Main Text Results
Proof of Theorem 3.1. We conjecture that
~pt = �t ~Vt � �t ~Zt.
Consider an agent i to whom �it = 1 happens with probability �i;t�1,
xit (�it = 1) =E�~Vt
��� �it; pt; si;t�1; sj;t�1; �it = 1�� pt�var
�~Vt
��� �it; pt; si;t�1; sj;t�1; �it = 1� .40Apparently, overcon�dence theory and communication theory are also largely complementary.
CHAPTER 3. OVER- AND UNDERCONFIDENCE 139
By projection theorem, we have
E�~Vt
��� �it; pt; si;t�1; sj;t�1; �it = 1� = �2t��it + �t���1h pt
�2t���1h + �2t
��+ ��1h
� ,var
�~Vt
��� �it; pt; si;t�1; sj;t�1; �it = 1� = �2t���1h
�2t���1h + �2t
��+ ��1h
� ,therefore
xit (�it = 1) =�2t��it +
���t � �2t
����1h �
��+ ��1h
��2t
�pt
��2t���1h
.
Similarly, to this agent �it = 0 happens with probability 1� �i;t�1,
xit (�it = 0) =�2t��it +
���t � �2t
����1` �
��+ ��1`
��2t
�pt
��2t���1`
.
Hence,
xit = �i;t�1xit (�it = 1) +�1� �i;t�1
�xit (�it = 0) . (3.A.1)
By the law of large number, the per capita (average) trade Xit by type i agents is,
Xit =1
mi
Z mi
xitdi
= �i;t�1�2t�Vt +
���t � �2t
����1h �
��+ ��1h
��2t
�pt
��2t���1h
+�1� �i;t�1
� �2t�Vt + ���t � �2t ����1` ���+ ��1`
��2t
�pt
��2t���1`
.
Market clearing condition yields
mhXht +m`X`t = Zt.
Given ��1h = ��1` we obtain
pt =�2t [ + (1� )At] �Vt � ��2t���1h Zt
At���2t � �t
����1h +
��+ ��1h
��2t
�+ (1�At)
���2t � �t
����1` +
��+ ��1`
��2t
� ,

CHAPTER 3. OVER- AND UNDERCONFIDENCE 140
where At is de�ned in (3.3.9) as
At = mh�h;t�1 +m`�`;t�1.
Equilibrium condition dictates that
�t�t= �t =
�2t [ + (1� )At] ���2t��
�1h
=�h�[ + (1� )At] , (3.A.2)
and
�t =��2t��
�1h
At���2t � �t
����1h +
��+ ��1h
��2t
�+ (1�At)
���2t � �t
����1` +
��+ ��1`
��2t
�=
��2t���1h�
[ + (1� )At] � + ��1h��2t+
��2t � �t
����1h
=1
�t + (��)�1 +
��t�
2t � �t
�(��t)
�1 . (3.A.3)
solving (3.A.3) we get
�t =�(�t + �)
�t� (�t + �) + .
When � = 1, (3.3.7) and (3.3.8) are obtained in the main text.
We can rewrite agent i's demand (3.A.1) as
~xit = + �i;t�1 (1� )
���1h
~�it �"�2t�t � �t��t
+��1h + + �i;t�1 (1� )
���1h
#~pt
= + �i;t�1 (1� )
���1h
~�it �"
�
�2+ �h [ +At (1� )]+�h� + �i;t�1 (1� )
��
#~pt,
therefore (3.3.10), (3.3.11) and (3.3.12) are obtained in the main text.
This linear equilibrium is unique because the solution to equation (3.A.2) and (??) is
unique.
Proof of Propsition 3.1.
Suppose (~ai; ~aj) = (H;L) for i 2 I and j 2 J , we show agents i's updated posterior beliefs
CHAPTER 3. OVER- AND UNDERCONFIDENCE 141
��it will converge to 1 almost surely as t ! 1: Agent is expected to observe signal of high
precision a fraction a of the time. When t!1, for unbiased agent i, we have
�it !HHt (1�H)t�Ht �0
HHt (1�H)t�Ht �0 + LHt (1� L)t�Ht (1� �0)
=
(1 +
�1� �0�0
�"�L
H
�H � 1� L1�H
�1�H#t)�1.
To show �it ! 1 as t!1. We only have to show�LH
�H � 1�L1�H
�1�H< 1. De�ne
f (x) = H lnx+ (1�H) ln (1� x) .
It is easily shown that f (x) is strictly increasing if 0 < x � H. Note that
ln
�L
H
�H � 1� L1�H
�1�H= H (lnL� lnH) + (1�H) [ln (1� L)� ln (1�H)]
= f (L)� f (H) < 0.
This yields the desired result for rational agent i.
When t!1, for biased agent i, we have
��it ! Ht�LtHHt (1�H)t�Ht �0
Ht�LtHHt (1�H)t�Ht �0 + LHt (1� L)t�Ht (1� �0)
=
(1 +
�1� �0�0
�"�1
�H�L� LH
�H � 1� L1�H
�1�H#t)�1.
Obviously ��it will converge to 1 as t!1.
Since it is common knowledge that agents of two di�erent types compete against each
other and the convergence results of �it;��it are shared with agent j, biased or not. Agent
j 2 J will eventually acknowledge her low-ability.
Proof of Lemma 3.1. Given (~si;t = si; ~sj = sj) and the equilibrium conditions speci�ed

CHAPTER 3. OVER- AND UNDERCONFIDENCE 142
in Theorem 3.1, we calculate that
var ( ~pt+1j si; sj) = �2t+1 + �2t+1
=��2t+1 +
��2t+1
=��2t+1 +
� � �t+1 + �
�t+1 (�t+1 + �) +
�2, (3.A.4)
where �t+1 = [ + (1� )At+1] �h=�. Straightforward di�erentiation of the expression for
price variance with respect to At+1 yields
hAt+1 +
�h+�2
(1� )�h
i �At+1 �
�2�2 �h��p5�22�4
2(1� )�h
� �At+1 �
�2�2 �h+�p5�22�4
2(1� )�h
�h[ �h + (1� )At+1�h]2 + �2 [1 + �h + (1� )At+1�h]
i3It is easily seen that the monotonicity of price variance depends on the last two terms in the
numerator.
Proof of Proposition 3.2. This follows immediately from Lemma 3.4.
Proof of Lemma 3.2. Without loss of generality, we can assume agents in group I are
of high-ability and use �ht to denote the expected ability of agents in group I at the end of
period t. Similarly, we can de�ne �`t of agents in group J .
Given ~sit = si; ~sjt = sj , we calculate that
var�~�i;t+1
��� si; sj� = E h~�2i;t+1��� si; sji= ai
�1 + ��1h
�+ (1� ai)
�1 + ��1`
�= 1 + ��1h
�ai +
1� ai
�. (3.A.5)
where ai 2 fH;Lg. Note that the variance of signal is determined by agent i's true ability ai
rather than her belief regarding ability.

CHAPTER 3. OVER- AND UNDERCONFIDENCE 143
De�ne
� (y) � + y (1� ) . (3.A.6)
Since all random variables are mutually independent across period, given ~sit = si; ~sjt = sj
and (3.3.10) we have
var (~xi;t+1jsi; sj) = B2i;t+1var�~�i;t+1
��� si; sj�+ C2i;t+1var ( ~pt+1j si; sj)� 2Bi;t+1Ci;t+1�t+1.(3.A.7)
Substituting in (3.3.11), (3.3.12), (3.A.4) and (3.A.5), we get
var (~xi;t+1jsi; sj) =�h�
2 (�it) [1� ai + (ai +�h)]�2
+
��2+ �2h�
2 (At+1)� ��2+ �h� (�it)
��2+ �h� (At+1)
��2�2��2h�
2 (At+1) + �2 (1 + �h� (At+1))�2
�2�2h� (�it) � (At+1)
��2+ �h� (�it)
��2+ �h� (At+1)
���2��2h�
2 (At+1) + �2 (1 + �h� (At+1))�
=�h�
2 (�it) [1� ai + (ai +�h)]�2
+��2+ �h� (�it)
��2+ �h� (At+1)
���2��2h�
2 (At+1) + �2 (1 + �h� (At+1))�2 (3.A.8)
where
= �42 [1 + � (�it) �] + �2�2
��2 (At+1)� � (�it) � (At+1)� � (�it) �2 (At+1) �
��� (�it) �3 (At+1) �4
Using the statistical formula in Appendix 1.A. and the de�nition of trading volume (3.4.3),
we obtain
E�gV olt+1jsi; sj� =r 1
2�
�mh
qvar ( ~xh;t+1j si; sj) +m`
qvar ( ~x`;t+1j si; sj) +
p
�.
(3.A.9)
in which var ( ~xh;t+1j si; sj) and var ( ~x`;t+1j si; sj) are obtained by replacing �it in (3.A.8)
with �ht and �`t respectively.
CHAPTER 3. OVER- AND UNDERCONFIDENCE 144
Proof of Lemma 3.3. Agent i's trading strategy satis�es.
~xi;t+1 = Bi;t+1~�i;t+1 � Ci;t+1~pt+1,
where Bi;t+1 and Ci;t+1 are de�ned in (3.3.11)-(3.3.12).
Given (~sit = si; ~sjt = sj) the expected pro�t for agent i in period t+ 1 can be calculated
as
E ( ~�i;t+1j si; sj) = Eh~xi;t+1
�~Vt+1 � ~pt+1
���� si; sji= Bi;t+1 � �t+1 (Bi;t+1 + Ci;t+1) + Ci;t+1var ( ~pt+1j si; sj)
=��h� (�it)
�2h�2 (At+1) + �2 (1 + �h� (At+1))
+�32
��2h� (�it) � (At+1) + �
2 (1 + �h� (�it))��
�2h�2 (At+1) + �2 (1 + �h� (At+1))
�2 . (3.A.10)
where � (�) is de�ned in (3.A.6). Replacing �it with �ht and �`t we obtain the expected
pro�ts for high-ability and low-ability agents respectively.

Bibliography
Admati, Anat R., \A Noisy Rational Expectation Equilibrium for Multi-Asset Securities
Markets," Econometrica, May 1985, 53 (3), 629{658.
and Paul P eiderer, \A Monopolistic Market for Information," Journal of Economic
Theory, August 1986, 39 (2), 400{438.
and , \A Theory of Intraday Patterns: Volume and Price Variability," Review of
Financial Studies, Spring 1988, 1 (1), 3{40.
Alicke, Mark D., M. L. Klotz, David L. Breitenbecher, Tricia J. Yurak, and Deb-
bie S. Vredenburg, \Personal Contact, Individuation, and the Better-Than-Average
E�ect," Journal of Personality and Social Psycology, May 1988, 68 (5), 804{825.
Allen, Beth, \Some Stochastic Processes of Interdependent Demand and Technological Dif-
fusion of an Innovation Exhibiting Externalities among Adopters," International Eco-
nomic Review, October 1982, 23 (3), 595{608.
, \A Stochastic Interactive Model for the Di�usion of Information," Journal of Mathe-
matical Sociology, 1982, 8, 265{281.
Angeletos, George-Marios, Guido Lorenzoni, and Alessandro Pavan, \Wall Street
and Silicon Valley: A Delicate Interaction," MIT Department of Economics Working
Paper No. 07-25, 2007.
Antweiler, Werner and Murray Z. Frank, \Does Talk Matter? Evidence from a Broad
Cross Section of Stocks," University of British Columbia Working Paper, 2004.
145

BIBLIOGRAPHY 146
and , \Is All That Talk Just Noise? The Information Content of Internet Stock
Message Boards," Journal of Finance, June 2004, 59 (3), 1259{1294.
Baker, Wayne E., \The Social Structure of a National Securities Market," American Jour-
nal of Sociology, January 1984, 89 (4), 775{811.
Bala, Venkatesh and Sanjeev Goyal, \Learning from Neighbours," Review of Economic
Studies, July 1998, 65 (3), 595{621.
and , \A Noncooperative Model of Network Formation," Econometrica, September
2000, 68 (5), 1181{1229.
and , \Conformism and Diversity under Social Learning," Economic Theory, Jan-
uary 2001, 17 (1), 101{120.
Banerjee, Abhijit V., \A Simple Model of Herd Behavior," Quarterly Journal of Eco-
nomics, August 1992, 107 (3), 797{817.
Barber, Brad M. and Terrance Odean, \Trading is Hazardous to Your Wealth: The
Common Stock Investment Performance of Individual Investors," Journal of Finance,
April 2000, 55 (2), 773{806.
and , \Boys Will Be Boys: Gender, Overcon�dence, and Common Stock Invest-
ment," Quarterly Journal of Economics, February 2001, 116 (1), 261{292.
and , \Online Investors: Do the Slow Die First?," Review of Financial Studies,
Special 2002, 15 (2), 455{487.
Barberis, Nicholas and Ming Huang, \The Loss Aversion/Narrow Framing Approach to
the Equity Premium Puzzle," in Rajnish Mehra, ed., Handbook of Investments: Equity
Risk Premium, North-Holland, Amsterdam, 2006, chapter 4.
and Richard Thaler, \A Survey of Behavioral Finance," in George M. Constantinides,
Milton Harris, and Ren�e. Stulz, eds., Handbook of Economics of Finance, Vol. 1B, North-
Holland, Amsterdam, 2003, chapter 18, pp. 1051{1121.
BIBLIOGRAPHY 147
, Ming Huang, and Tano Santos, \Prospect Theory and Asset Prices," Quarterly
Journal of Economics, February 2001, 116 (1), 1{53.
Beetsma, Roel M.W.J. and Peter C. Schotman, \Measuring Risk Attitudes in a Nat-
ural Experiment: Data from the Television Game Show Lingo," Economic Journal,
October 2001, 111 (474), 821{848.
Benos, Alexandros, \Aggressiveness and Survival of Overcon�dent Traders," Journal of
Financial Markets, September 1998, 1 (3-4), 353{383.
Bikhchandani, Sushil, David Hirshleifer, and Ivo Welch, \A Theory of Fads, Fashion,
Custom, and Cultural Change as Informational Cascades," Journal of Political Economy,
October 1992, 100 (5), 992{1026.
Bisin, Alberto, Ulrich Horst, and Onur �Ozg�ur, \Rational Expectations Equilibria of
Economies with Local Interactions," Journal of Economic Theory, March 2006, 127 (1),
74{116.
Boulatov, Alex, Albert S. Kyle, and Dmitry Livdan, \Uniqueness of Equilibrium in
the Single-Period Kyle'85 Model," University of Huston Working Paper, 2005.
Brunnermeier, Markus K., Asset Pricing under Asymmetric Information: Bubbles,
Crashes, Technical Analysis and Herding, New York, NY: Oxford University Press, 2001.
, \Information Leakage and Market E�ciency," Review of Financial Studies, Summer
2005, 18 (2), 417{457.
Bushman, Robert M. and Ra� J. Indjejikian, \Voluntary Disclosures and the Trading
Behavior of Corporate Insiders," Journal of Accounting Research, Autumn 1995, 33 (2),
293{316.
Caball�e, Jordi and J�ozsef S�akovics, \Speculating against an Overcon�dent Market,"
Journal of Financial Markets, April 2003, 6 (2), 199{225.
BIBLIOGRAPHY 148
Cain, Daylian M. and Don A. Moore, \Overcon�dence and Undercon�dence: When
and Why People Underestimate (and Overestimate) the Competition," Carnegie Mellon
Tepper Working Paper No. 2003-E76, 2006.
Camerer, Colin F., Teck-Hua Ho, and Juin-Kuan Chong, \A Cognitive Hierarchy
Model of Games," Quarterly Journal of Economics, August 2004, 119 (3), 861{898.
Carhart, Mark M., \On Persistence in Mutual Fund Performance," Journal of Finance,
March 1997, 52 (1), 57{82.
Chamley, Christophe P., Rational Herds: Economic Models of Social Learning, New York,
NY: Cambridge University Press, 2004.
Chari, V.V., \Di�erences of Opinion in Financial Markets: Commentary," in Courtenay C.
Stone, ed., Financial Risk: Theory, Evidence, and Implications, Kluwer, 1989, pp. 38{40.
Colla, Paolo and Antonio Mele, \Information Linkages and Correlated Trad-
ing," AFA 2008 New Orleans Meetings Paper, 2007. Available at SSRN:
http://ssrn.com/abstract=970070.
Coval, Joshua D. and Tobias J. Moskowitz, \Home Bias at Home: Local Equity Pref-
erence in Domestic Portfolios," Journal of Finance, 1999, 54 (6), 145{166.
and , \The Geography of Investment: Informed Trading and Asset Prices," Journal
of Political Economy, forthcoming, August 2001, 109 (4), 811{841.
Daniel, Kent D., David Hirshleifer, and Avanidhar Subrahmanyam, \Investor Psy-
chology and Security Market Under- and Overreactions," Journal of Finance, December
1998, 53 (6), 1839{1885.
De Bondt, Werner F. M. and Richard H. Thaler, \Financial Decision-Making in
Markets and Firms: A Behavioral Perspective," in R. A. Jarrow, V. Maksimovic, and
W. T. Ziemba, eds., Handbook of Operations Research and Management Science, Vol. 9
Finance, North-Holland, Amsterdam, 2003, pp. 385{410.
BIBLIOGRAPHY 149
DeMarzo, Peter M., Dimitri Vayanos, and Je�rey Zwiebel, \Persuasion Bias, Social
In uence, and Unidimensional Opinions," Quarterly Journal of Economics, August 2003,
118 (3), 909{968.
Diamond, Douglas W. and Robert E. Verrechia, \Information Aggregation in a Noisy
Rational Expectation Economy," Journal of Financial Economics, 1981, 9, 221{235.
Donne, John, \Meditation XVII," in Anthony Raspa, ed., Devotions upon Emgergent Oc-
casions, New York, NY: Oxford University Press, 1987.
Dow, James and Gary Gorton, \Noise Trading, Delegated Portfolio Management, and
Economic Welfare," Journal of Political Economy, 1997, 105, 1024{1050.
Du, Julan, \Heterogeneity of Con�dence and Asset Market Under- and Overreac-
tion," Chinese University of Hong Kong Working Paper, 2002. Available at SSRN:
http://ssrn.com/abstract=302684.
Du o, Esther and Emmaneul Saez, \Participation and Investment Decisions in a Retire-
ment Plan: The In uence of Colleagues' Choices," Journal of Public Economics, July
2002, 85 (1), 121{148.
Ellison, Glenn and Drew Fudenberg, \Word-of-Mouth Communication and Social
Learning," Quarterly Journal of Economics, February 1995, 110 (1), 93{125.
Eren, Nevzat and Han N. Ozsoylev, \Communication Dilemma in Speculative Markets,"
Mimeo, 2006. available at SSRN: http://ssrn.com/abstract=905907.
Erev, Ido, Thomas S. Wallsten, and David V. Budescu, \Simultaneous Over- and
Undercon�dence: The Role of Error in Judgement Processes," Psychological Review,
July 1994, 101 (3), 519{527.
Fischho�, Baruch, Paul Slovic, and Sarah Lichtenstein, \Knowing with Certainty:
The Appropriateness of Extreme Con�dence," Journal of Experimental Psychology,
1977, 3, 552{564.

BIBLIOGRAPHY 150
Foster, F. Douglas and S. Viswanathan, \Strategic Trading When Agents Forecast the
Forecasts of Others," Journal of Finance, September 1996, 54 (4), 1437{1478.
Garc��a, Diego, Francesco Sangiorgi, and Branko Uro�sevi�c, \Overcon�dence and Mar-
ket E�ciency with Heterogeneous Agents," Economic Theory, February 2007, 30 (2),
313{336.
Gervais, Simon and Itay Goldstein, \The Positive E�ects of Biased Self-
Perception in Firms," Duke University Working Paper, 2005. Available at SSRN:
http://ssrn.com/abstract=843508.
and Terrance Odean, \Learning to Be Overcon�dent," Review of Financial Studies,
Spring 2001, 14 (1), 1{27.
Glaser, Markus and Martin Weber, \Overcon�dence and Trading Volume," Mimeo,
2004. Universit�at Mannheim.
Gri�n, Dale and Amos Tversky, \The Weighing of Evidence and the Determinants of
Con�dence," Cognitive Psychology, July 1992, 24 (3), 411{435.
Grossman, Sanford J., \On the E�ciency of Competitive Stock Markets Where Trades
Have Diverse Information," American Economic Review, May 1976, 31 (2), 573{585.
and Joseph E. Stiglitz, \On the Impossibility of Informationally E�cient Markets,"
American Economic Review, June 1980, 70 (3), 393{408.
Harris, Milton and Artur Raviv, \Di�erences of Opinion Make a Horse Race," Review
of Financial Studies, Fall 1985, 6 (3), 473{506.
Hastorf, Albert H., David J. Schneider, and Judith Polefka, Person Perception,
Reading, MA: Addison-Wesley, 1970.
Hellwig, Martin F., \On the Aggregation of Information in Competitive Markets," Journal
of Economic Theory, June 1980, 22 (3), 477{498.
BIBLIOGRAPHY 151
Hertz, Ellen, The Trading Crowd: An Ethnography of the Shanghai Stock Market, Cam-
bridge University Press, 1998.
Hirshleifer, David and Guo Ying Luo, \On the Survival of Overcon�dent Traders in
a Competitive Security Market," Journal of Financial Markets, January 2001, 4 (1),
73{84.
Hoelzl, Erik and Aldo Rustichini, \Overcon�dent: Do You Put Your Money on it?,"
Economic Journal, April 2005, 115 (503), 305{318.
Hong, Harrison and Jeremy C. Stein, \A Uni�ed Theory of Underreaction, Momentum
Trading and Overreaction in Asset Markets," Journal of Finance, December 1999, 54
(6), 2143{2184.
and Jeremy Stein, \Di�erences of Opinion, Short-Sales Constraints, and Market
Crashes," Review of Financial Studies, Summer 2003, 16 (2), 487{525.
, Je�rey D. Kubik, and Jeremy C. Stein, \Social Interactions and Stock Market
Participation," Journal of Finance, February 2004, 59 (1), 137{163.
, , and , \Thy Neighbor's Portfolio: Word-of-Mouth E�ects in the Holdings
and Trades of Money Managers," Journal of Finance, December 2005, 60 (6), 2801{2824.
Hoorens, V. and B. Buunk, \Social Comparison of Health Risks: Locus of Control, the
Person-Positivity Bias, and Unrealistic Optimism," Journal of Applied Social Psychol-
ogy, February 1993, 23 (4), 291{302.
Huberman, Gur and Werner Stanzl, \Price Manipulation and Quasi-Arbitrage," Econo-
metrica, July 2004, 72 (4), 1247{1275.
Jackson, Matthew O., \A Survey of Models of Network Formation: Stability and Ef-
�ciency," in Gabrielle Demange and Myrna Wooders, eds., Group Formation in Eco-
nomics: Networks, Clubs and Coalitions, New York, NY: Cambridge Univerity Press,
2004, chapter 1, pp. 11{57.

BIBLIOGRAPHY 152
, \The Economics of Social Networks," in Richard Blundell, Whitney K. Newey, and
Torsten Persson, eds., Advances in Economics & Econometrics: Theory and Applica-
tions, Ninth World Congress, Vol. 1, New York, NY: Cambridge Univerity Press, 2006,
chapter 1, pp. 1{56.
Juslin, Peter, Anders Winman, and Henrik Olsson, \Naive Empiricism and Dogma-
tism in Con�dence Research: A Critical Examination of the Hard-Easy E�ect," Psycho-
logical Review, April 2000, 107 (2), 384{396.
Kahneman, Daniel and Amos Tversky, \Prospect Theory: An Analysis of Decision
under Risk," Econometrica, March 1979, 47 (2), 263{291.
Kandel, Eugene and Neil D. Pearson, \Di�erential Interpretation of Public Signals and
Trade in Speculative Markets," Journal of Political Economy, August 1995, 103 (4),
831{872.
Kelly, Morgan and Cormac �O Gr�ada, \Market Contagion: Evidence from the Panics of
1854 and 1857," American Economic Review, December 2000, 90 (5), 2000.
Keynes, John Maynard, The General Theory of Employment, Interest, and Money, Cam-
bridge: Cambridge University Press, 1936.
Kirchler, Erich and Boris Maciejovsky, \Simultaneous Over- and Undercon�dence:
Evidence from Experimental Asset Markets," Journal of Risk and Uncertainty, July
2002, 25 (1), 65{85.
Klayman, Joshua, Jack B. Soll, Claudia Gonz�alez-Vallejo, and Sema Barlas, \Over-
con�dence: It Depends on How, What, and Whom You Ask," Organizational Behavior
and Human Decision Processes, September 1999, 79 (3), 216{247.
Ko, K. Jeremy and Zhijian Huang, \Arrogance Can Be a Virtue: Overcon�dence,
Information Acquisition, and Market E�ciency," Journal of Financial Economics, May
2007, 84 (2), 529{560.
BIBLIOGRAPHY 153
Krishnan, Murugappa and Jordi Caballe, \Insider Trading and Asset Pricing in an
Imperfectly Competitive Multi-Security Market," Mimeo, 1990. Purdue University.
Kyle, Albert S., \Continuous Auctions and Insider Trading," Econometrica, November
1985, 53 (6), 1315{1335.
, \Informed Speculation with Imperfect Competition," Review of Economic Studies, July
1989, 56 (3), 317{356.
and F. Albert Wang, \Speculation Duopoly With Agreement to Disagree: Can
Overcon�dence Survive the Market Test?," Journal of Finance, December 1997, 52 (5),
2073{2090.
LeRoy, Stephen F. and Richard. D. Porter, \The Present-Value Relation: Tests Based
on Implied Variance Bounds," Econometrica, May 1981, 49 (3), 555{574.
Lichtenstein, Sarah, Baruch Fischo�, and Lawrence Phillips, \Calibration of Prob-
abilities: The State of the Art to 1980," in Daniel Kahneman, Paul Slovic, and Amos
Tversky, eds., Judgement under Uncertainty: Heuristics and Biases, Cambridge Univer-
sity Press, Cambridge, 1982, chapter 22, pp. 306{334.
Lo, Andrew W. and Jiang Wang, \Trading Volume: De�nitions, Data Analysis, and
Implications of Portfolio Theory," Review of Financial Studies, Summer 2000, 13 (2),
257{300.
Milgrom, Paul and Nancy Stoky, \Information, Trade and Common Knowledge," Econo-
metrica, February 1982, 26 (1), 17{27.
Morris, Stephen, \Trade with Heterogeneous Prior beliefs and Asymmetric Information,"
Econometrica, November 1994, 62 (6), 1327{1347.
and Hyun Song Shin, \Social Value of Public Information," American Economic
Review, December 2002, 92 (5), 1521{1534.

BIBLIOGRAPHY 154
Odean, Terrance, \Volume, Volatility, Price and Pro�t When All Traders are Above Av-
erage," Journal of Finance, December 1998, 53 (6), 1887{1934.
, \Do Investors Trade too Much?," American Economic Review, December 1999, 89 (5),
1279{1298.
O'Hara, Maureen, Market Microstructure Theory, Cambridge, MA: Blackwell Publishers,
1995.
Ozsoylev, Han N., \Knowing Thy Neighbors: Rational Expectations and Social Interaction
in Financial Markets," Mimeo, 2004. University of Oxford.
, \Asset Pricing Implications of Social Networks," Mimeo, 2005. University of Oxford.
Perlo�, Linda S. and Barbara K. Fetzer, \Self-other Judgments and Perceived Vulner-
ability to Victimization," Journal of Personality and Social Psychology, March 1986, 50
(3), 502{510.
Post, Thierry, Martijn J. van den Assem, Guido Baltussen, and Richard H.
Thaler, \Deal or No Deal? Decision Makeing under Risk in A Large-payo� Game
Show," American Economic Review, March 2008, 98 (1), 38{71.
Shiller, Robert J., \Do Stock Prices Move Too Much to be Justi�ed by Subsequent Changes
in Dividends?," American Economic Review, June 1981, 71 (3), 421{498.
, \Conversation, Information, and Herd Behavior," American Economic Review, May
1995, 85 (2), 181{185.
, Irrational Exuberance, Princeton, NJ: Princeton University Press, 2000.
Shin, Jhinyoung and Rajdeep Singh, \Corporate Disclosures: Strategic Donation of
Information," Mimeo, August 2003. Available at http://ssrn.com/abstract=134128.
Spiegel, Matthew and Avanidhar Subrahmanyam, \Informed Speculation and Hedging
in a Noncompetitive Securities Market," Review of Financial Studies, Summer 1992, 5
(2), 307{329.
BIBLIOGRAPHY 155
Van Bommel, Jos, \Rumors," Journal of Finance, August 2003, 58 (4), 1499{1519.
Varian, Hal R., \Divergence of Opinion in Complete Markets: A Note," Journal of Finance,
March 1985, 40 (1), 309{317.
, \Di�erences of Opinion in Financial Markets," in Courtenay C. Stone, ed., Financial
Risk: Theory, Evidence, and Implications, Kluwer, 1989, pp. 3{37.
Vega-Redondo, Fernando, Complex Social Networks, New York, NY: Cambridge Univer-
sity Press, 2007.
Wang, F. Albert, \Strategic Trading, Asymmetric Information and Heterogeneous Prior
Beliefs," Journal of Financial Markets, September 1998, 1 (3-4), 321{352.
, \Overcon�dence, Investor Sentiment, and Evolution," Journal of Financial Intermedi-
ation, April 2001, 10 (2), 138{170.
Weinberg, Bruce A., \A Model of Overcon�dence," Working Paper, 2004. Ohio State
University.
Weinstein, N. D., \Unrealistic Optimism about Future Life Events," Journal of Personality
and Social Psychology, 1980, 39, 806{820.
Wysocki, Peter D., \Cheap Talk on the Web: The Determinants of Postings on Stock
Message Boards," University of Michigan Business School Working Paper No. 98025,
1998.
Xia, Chun, \Communicating to Be Over- and Undercon�dent," Mimeo, 2007a. University
of Minnesota.
, \Communication and Con�dence in Financial Networks," Mimeo, 2007b. University
of Minnesota.
, \Social Communication and Network Stability," Mimeo, 2007c. University of Min-
nesota.
BIBLIOGRAPHY 156
, \Social Communication and Security Markets Under- and Overreactions," Mimeo,
2007d. University of Minnesota.
Yezer, Anthony M., Robert S. Goldfarb, and Paul J. Poppen, \Does Studying
Economics Discourage Cooperation: Watch What We Do, No What We Say or How We
Play," Journal of Economic Perspectives, Winter 1996, 10 (1), 177{186.
Yuan, Kathy, \Asymmetric Price Movements and Borrowing Constraints: A Rational Ex-
pectations Equilibrium Model of Crises, Contagion, and Confusion," Journal of Finance,
February 2005, 60 (1), 379{411.