Commodity Indices – The End of an Era? · Commodity Indices – The End of an Era? Axel...
21
DOI: 10.5817/FAI2014-2-3 No. 2/2014 45 Commodity Indices – The End of an Era? Axel Büscher 1 , Eric Frère 2 , Gerrit Hellwig 3 , Svend Reuse 4 1 Comenius University Bratislava, Faculty of Management Am Wiesental 46, 45133 Essen, Germany E-mail: [email protected] 2 FOM University of Applied Sciences, Essen, Germany, Finance and Entrepreneurship Wolfsbachweg 66, 45133 Essen, Germany E-mail: frè[email protected] 3 Comenius University Bratislava, Faculty of Management Alsterfeld 12, 46049 Oberhausen, Germany E-mail: [email protected] 4 FOM University of Applied Sciences, Essen, Germany HRW Hochschule Ruhr-West, Mülheim, Germany Luxemburger Allee 121, 45470 Mülheim an der Ruhr, Germany E-mail: [email protected] Abstract: Commodities are very important for the welfare of whole nations and so an increased demand, even on the financial markets, can be seen in the 20 th century. For this reason commodities were no longer only product factors. They became more and more a speculative character for investors, especially in times of crisis as a possible safe haven (Mildner / Rudloff / Westphal, 2012, p. 57). Because of their development over two decades, during which time the invested volume grew up to an amount of 320 Billion US-Dollar at the beginning of 2011 (Knoepfel, 2011, p. 2) and the return of investing in commodities had beaten traditional investments, it might be very interesting to invest in commodity indices, if they can diversify an investor´s portfolio while improving the return. For the valuation and comparison of traditional and commodity indices, this article uses the classical approach of the volatility and the Value at Risk (VaR) for risk measurement and logarithmic returns for the performances. The analysis is indexed on July 1998 to get comparable results and aims to test if commodities can diversify a portfolio any longer. Keywords: correlation, value at risk, volatility, diversification, commodities JEL codes: C15, G11, G17, M14 Introduction Since the beginning of mankind, the availability and the use of natural commodities have been decisive for the welfare of a nation. With the beginning of industrialization in the middle of the 18 th century, the industrial use of natural commodities became essential for the prosperity and growth of whole nations.
Transcript of Commodity Indices – The End of an Era? · Commodity Indices – The End of an Era? Axel...

DOI: 10.5817/FAI2014-2-3 No. 2/2014
45
Commodity Indices – The End of an Era?
Axel Büscher1, Eric Frère2, Gerrit Hellwig3, Svend Reuse4
1 Comenius University Bratislava, Faculty of Management Am Wiesental 46, 45133 Essen, Germany E-mail: [email protected]
2 FOM University of Applied Sciences, Essen, Germany, Finance and Entrepreneurship Wolfsbachweg 66, 45133 Essen, Germany
E-mail: frè[email protected]
3 Comenius University Bratislava, Faculty of Management Alsterfeld 12, 46049 Oberhausen, Germany
E-mail: [email protected]
4 FOM University of Applied Sciences, Essen, Germany HRW Hochschule Ruhr-West, Mülheim, Germany
Luxemburger Allee 121, 45470 Mülheim an der Ruhr, Germany E-mail: [email protected]
Abstract: Commodities are very important for the welfare of whole nations and
so an increased demand, even on the financial markets, can be seen in the 20th
century. For this reason commodities were no longer only product factors. They
became more and more a speculative character for investors, especially in times
of crisis as a possible safe haven (Mildner / Rudloff / Westphal, 2012, p. 57).
Because of their development over two decades, during which time the invested
volume grew up to an amount of 320 Billion US-Dollar at the beginning of 2011
(Knoepfel, 2011, p. 2) and the return of investing in commodities had beaten
traditional investments, it might be very interesting to invest in commodity
indices, if they can diversify an investor´s portfolio while improving the return.
For the valuation and comparison of traditional and commodity indices, this article
uses the classical approach of the volatility and the Value at Risk (VaR) for risk
measurement and logarithmic returns for the performances. The analysis is
indexed on July 1998 to get comparable results and aims to test if commodities
can diversify a portfolio any longer.
Keywords: correlation, value at risk, volatility, diversification, commodities
JEL codes: C15, G11, G17, M14
Introduction
Since the beginning of mankind, the availability and the use of natural commodities have been decisive for the welfare of a nation. With the beginning of industrialization in the middle of the 18th century, the industrial use of natural commodities became essential for the prosperity and growth of whole nations.
Financial Assets and Investing
46
In the 20th century, commodities became the center of interest of the financial markets. Commodities developed from a pure production factor to a financial product. More and more, the speculative character of institutional and private investors became relevant for pricing and not only supply and demand. Nowadays, commodities of all kind are not only important for goods production, but also for provision for old age retirement, as an object of investment or partly a safe haven in uncertain times at the markets.
The rising and in the end temporarily hysterical demand for commodities and other goods was often the reason for the most important speculative bubbles and hypes. Some of these bubbles are for example the Dutch tulip crisis in the 1630s (Haaß, 2007, p. 14), the Mississippi Bubble in the 18th century (Brasche, 2013, p. 291) or the crash of the Vienna stock exchange in the 1870s (Priebe, 2012, pp. 67-68). More recent examples are the crash of the New York stock exchange in 1929 (Allgoewer, 2008, p. 54), the burst of the dotcom-bubble in 2000 or the subprime crisis in 2007 (Glebe, 2008, p. 104). The subprime crisis in 2007 was the trigger for the financial crisis in 2008, which ended in a debt crisis of a lot of countries all over the world. But within this crisis, the prices of commodities also increased.
Commodities like oil and gold stand over and over in the center of the investor’s attention. That resulted partly in massive rises in the exchange rates and in higher returns compared to shares (Reuse / Linnertová, 2008a, pp. 50-56). The developments since the financial crisis in 2008 and the resulting debt crisis in Europe and the USA have reduced the commodity euphoria. Also the economic growth in Europe and the USA has reduced significantly since the subprime-crisis in 2007. This has direct and indirect effects onto the listed stocks, stock indices and bonds.
Therefore the central topics of this work can be summarized as follows.
First, it should be investigated, which returns and volatility investments in commodity indices show compared to traditional stock investments, also on an indexed basis. Second, two central questions shall be answered:
1. Is there a direct connection between the development of commodity markets and the development of stock markets?
2. Is it possible to predict the development of the stock markets on the basis of the development of commodity markets? And could commodity markets be an indicator for a boom or a bull market? This investigation is focused on a possible signal function of the commodity markets.

No. 2/2014
47
1 Definition and Structure of Commodity Indices
1.1 Introduction to Commodity Indices
Commodities are natural and raw resources that are used as industrial goods in the industrial sector or as a capital investment in the financial market. For this work, the focus is on commodities, especially commodity indices, as a financial product. Under these circumstances, commodities can be differentiated into two asset classes: hard and soft assets. The hard assets describe commodities like industrial and precious metals, wood or energy commodities like coal and oil. Soft assets are perishable, consumable commodities like grain, oil seed or meat (Krämer, 2002, p. 5).
The commodities themselves and their weighting within the index differ from one commodity index to another and result from their strategy and performance. Commodity indices duplicate the performance of their underlying (Philips, 1999, p. 55), for example precious or industrial metals, oil, gas, coal or grain. Commodity indices can contain hard assets as well as soft assets (Pompian, 2012, p. 178).
Commodity indices show a successful history in the past years. While the investment volume of commodity indices in 1998 was only 5 Billion U.S. Dollar (USD), in ten years the volume grew up to 150 Billion USD (Haase / Markert, 2009, p. 385). In the beginning of 2011, the worldwide investment volume in commodity indices was around 320 Billion USD (Knoepfel, 2011, p. 2). Commodity indices are generally based on commodity futures. The commodity futures are exchange traded and standardized financial contracts, so that funds or indices do not need to invest in physical commodities, like grain or meat, which are perishable. This advantage stands opposite to the disadvantage that investors can only invest in those commodities that are traded in liquid futures contracts. Actually, around 30 tradable commodities exist worldwide (Haase / Markert, 2009, p. 385). A special characteristic of commodity contracts is the rolling effect, which is explained in chapter 1.3. The greatest difference to stock indices is that commodity indices do not represent passively the commodity market like stock indices do in the stock market, because the objective criteria are missing. Objective criteria are for example the weighting of the market capitalization. Beyond that, commodity indices are based on futures contracts, because it isn’t possible to keep the commodities physically in store. These futures contracts have also different terms or remaining terms and thus different prices, so that indices could have different values even if they contain the same commodities (Neumann, 2009, p. 34).
Financial Assets and Investing
48
1.2 Existing Commodity Indices
1.2.1 Thomson Reuters/Jefferies CRB Index (TRJ CRB Index)
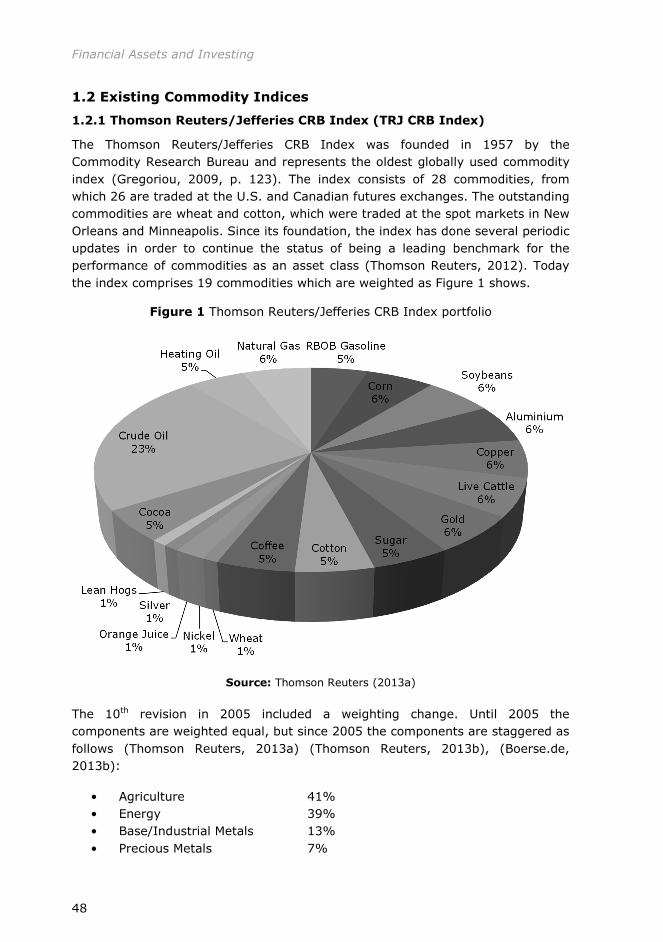
The Thomson Reuters/Jefferies CRB Index was founded in 1957 by the Commodity Research Bureau and represents the oldest globally used commodity index (Gregoriou, 2009, p. 123). The index consists of 28 commodities, from which 26 are traded at the U.S. and Canadian futures exchanges. The outstanding commodities are wheat and cotton, which were traded at the spot markets in New Orleans and Minneapolis. Since its foundation, the index has done several periodic updates in order to continue the status of being a leading benchmark for the performance of commodities as an asset class (Thomson Reuters, 2012). Today the index comprises 19 commodities which are weighted as Figure 1 shows.
Figure 1 Thomson Reuters/Jefferies CRB Index portfolio
Source: Thomson Reuters (2013a)
The 10th revision in 2005 included a weighting change. Until 2005 the components are weighted equal, but since 2005 the components are staggered as follows (Thomson Reuters, 2013a) (Thomson Reuters, 2013b), (Boerse.de, 2013b):
• Agriculture 41% • Energy 39% • Base/Industrial Metals 13% • Precious Metals 7%
No. 2/2014
49
Total RICI Index
Rogers International Commodity Index
Contract Exchange Currency Initial Weight Contract Exchange Currency Initial Weight
Crude Oil NYMEX USD 21.00% Platinum NYMEX USD 1.80%
Brent ICE EU USD 14.00% Gas Oil ICE EU USD 1.20%
Wheat CBOT USD 4.75% Cocoa ICE US USD 1.00%
Corn CBOT USD 4.75% Lean Hogs CME USD 1.00%
Cotton ICE US USD 4.20% Lumber CME USD 1.00%
Aluminum LME USD 4.00% Milling Wheat NYSE Liffe EUR 1.00%
Copper LME USD 4.00% Nickel LME USD 1.00%
Soybeans CBOT USD 3.50% Rubber TOCOM JPY 1.00%
Gold COMEX USD 3.00% Tin LME USD 1.00%
Natural Gas NYMEX USD 3.00% Wheat KCBT USD 1.00%
RBOB Gasoline NYMEX USD 3.00% Canola ICE CA CAD 0.75%
Coffee ICE US USD 2.00% RICE CBOT USD 0.75%
Lead LME USD 2.00% Soybean Meal CBOT USD 0.75%
Live Cattle CME USD 2.00% Orange Juice ICE US USD 0.60%
Silver COMEX USD 2.00% Oats CBOT USD 0.50%
Soybean Oil CBOT USD 2.00% Palladium NYMEX USD 0.30%
Sugar ICE US USD 2.00% Rapeseed NYSE Liffe EUR 0.25%
Zinc LME USD 2.00% Milk Class III CME USD 0.10%
Heating Oil NYMEX USD 1.80%
Furthermore, the 10th revision introduced a monthly rebalancing and rollover schedule. The index is shown in real time.
1.2.2 Rogers International Commodity Index (RICI)
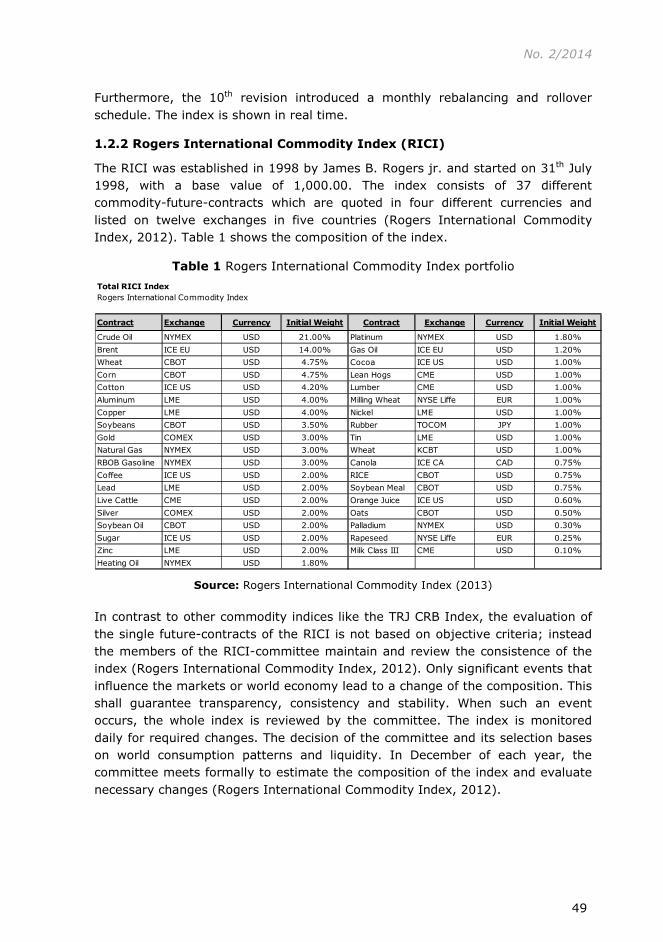
The RICI was established in 1998 by James B. Rogers jr. and started on 31th July 1998, with a base value of 1,000.00. The index consists of 37 different commodity-future-contracts which are quoted in four different currencies and listed on twelve exchanges in five countries (Rogers International Commodity Index, 2012). Table 1 shows the composition of the index.
Table 1 Rogers International Commodity Index portfolio
Source: Rogers International Commodity Index (2013)
In contrast to other commodity indices like the TRJ CRB Index, the evaluation of the single future-contracts of the RICI is not based on objective criteria; instead the members of the RICI-committee maintain and review the consistence of the index (Rogers International Commodity Index, 2012). Only significant events that influence the markets or world economy lead to a change of the composition. This shall guarantee transparency, consistency and stability. When such an event occurs, the whole index is reviewed by the committee. The index is monitored daily for required changes. The decision of the committee and its selection bases on world consumption patterns and liquidity. In December of each year, the committee meets formally to estimate the composition of the index and evaluate necessary changes (Rogers International Commodity Index, 2012).

Financial Assets and Investing
50
1.2.3 Dow Jones UBS-Commodity Index (DJ-UBSCI)
The Dow Jones AIG-Commodity index was founded, with recalculation until January 1991, in July 1998. In May 2009, the UBS bank acquired the index and renamed the index in Dow Jones UBS-Commodity Index. It is simultaneously the youngest and the ultimate index of the four internationally accepted indices. The weight of the components represents the economic importance within the global economy. Trading turnover and liquidity of a future contract are used to evaluate the importance (Dow Jones Indices, 2012). In addition, the worldwide output figures are also considered, but liquidity is more important. The index actually contains 19 various types of commodities. The weight per commodity amounts between at least 2% and at the maximum 15%. None of the seven commodities groups should exceed 33% in the yearly weight adjustment (Boerse.de, 2013a).
1.2.4 Baltic Dry Index (BDI)
In comparison to the above mentioned indices, the Baltic Dry Index is not an index which represents future-contracts on commodities. However in order to examine commodities in this paper as an indicator for a stock market boom, it is necessary to look at this index, because the BDI has established itself as a leading indicator for the world economy (Mallien, 2012). This index is published daily by the Baltic exchange in London since 1985 and is an important price index for the worldwide shipping of dry bulk commodities, mainly coal, mineral ores and agriculture products, on important international standard routes of ocean shipping. Only the information of market players, like brokers, ship owners and charterers are included for the determination of freight rates. The price consists simply of real demand for the transport of commodities. Because of the determination method and the lack of speculation the BDI is very solid and difficult to manipulate (Schneider, 2010, p. 11).
1.3 Risks of Investing in Commodities
An investment in commodities is linked with (two main) risks. Nearly all significant commodities are traded in USD and so a currency risk exists for investors of other currencies. To find remedy investors can hedge the currency risk but the hedging has a price depending on several factors (Mikosch, 2010). The most important factor is the interest margin between USD and the foreign currency. If the short-term interests in the USA are lower than in the foreign currency country, the hedging is more favorable. Further price determinants are the correlation between the foreign currency and the underlying asset as well as the range of variation of the underlying asset. Hedging will be more favorable, the lower the correlation and the range of variation.
Another risk is the rolling effect. Instead of buying commodities physically, it is possible to make business with future contracts. Besides immediate sale in spot-markets, commodities are traded on commodity future markets like the Chicago Board of Trade. A future purchase is a right of delivery of the corresponding

No. 2/2014
51
commodity in a physical form while a sale is linked with the obligation of supply. This happens at availability of the future contracts. But most investors are not interested in a supply of the commodity and want to be long invested. Accordingly, they have to sell the future-contract before its availability and have to buy with its avail the next long-term future contract. This process is called rolling. Rolling can have advantages and disadvantages for the investors. If the price of the matured future is lower than the next one, a loss would occur. This is also called “Contango”. That means that e. g. the commodity is more expensive the further the time of delivery is in the future. This does not allow buying the exact number of contracts of the next long-term future contract (Wohleb / Jochims, 2011). But if the next contract is lower than the matured one, with higher avail more new contracts can be bought and profits can be realized. This situation is called “Backwardation” (Wohleb / Jochims, 2011). In this situation the commodity is priced lower at the time of delivery than it is in the future.
To minimize risk or to have an orientation of the rolling effect, forward curves show the current process of the future-prices of different availabilities. But next to the change of the prices of commodities there is also a change of the forward curves over time.
2 Analysis of Risk/Return and of Commodity Investments and
Traditional Stock Investments
2.1 Historical Development
In the last century, index commodity investments were a volatile investment with the chance of a higher return than traditional investments, for example stock indices. The years before the subprime crisis of 2007 were especially characterized by a fast growing global economy accompanied by increasing commodity prices. Therefore investments in commodity indices ensured a high ROI for the investors.
But the years 2007 and 2008 have shown how dramatically the decline in value can occur. The higher volatility in commodities was the reason for the possible higher return on investment. Before 2007, commodities were often a part of a diversified portfolio. But after this big crash the market for commodity, it seems, on the first view, less and less beneficial for investors. Instead of this, e. g. sustainable investments became more and more important for investors (Büscher / Frère / Hellwig, 2012); (Büscher / Frère / Hellwig / Reuse, 2013).
In order to analyze the historical development in more detail, this article focuses on the following markets: The stock indices DAX 30, EURO STOXX 50 and the MSCI World will be investigated. An investigation of the above mentioned commodity indices Rogers International Commodity Index, Dow Jones UBS Commodity Index, Thomson Reuters/Jefferies CRB Index and the Baltic Dry Index will also be carried out. For both investigations the analysis period is from July 1998 till April 2013.

Financial Assets and Investing
52
0.00
20.00
40.00
60.00
80.00
100.00
120.00
140.00
160.00
180.00
Jul 9
8
Jan
99
Jul 9
9
Jan
00
Jul 0
0
Jan
01
Jul 0
1
Jan
02
Jul 0
2
Jan
03
Jul 0
3
Jan
04
Jul 0
4
Jan
05
Jul 0
5
Jan
06
Jul 0
6
Jan
07
Jul 0
7
Jan
08
Jul 0
8
Jan
09
Jul 0
9
Jan
10
Jul 1
0
Jan
11
Jul 1
1
Jan
12
Jul 1
2
Jan
13
DAX Index EURO STOXX 50 Index MSCI World Index
The development of the stock indices is shown in Figure 2, and the development of the commodity indices are presented in Figure 3. The performance of indexed stock indices and indexed commodities start in July 1998, because the RICI starts at this time. To make the commodity indices comparable, July 1998 is chosen as the starting point.
Figure 2 Indexed performance the stock indices, from July 1998 to April 2013
Source: Author’s calculations based on Bloomberg
The two figures show that the performance from 1998 to 2013 is not similar. Especially The dotcom bubble at the beginning of the 21st century is very distinctive in Figure 2. In Figure 3 the technology hype is only a small peak between 1999 and 2001. The reason for this dissimilarity in the two charts is that the dotcom-bubble was an internet based development that did not have influence on the commodity market. Furthermore, the companies showed a very high price-to-earnings-ratio, far away from its long-term average. However, the economic boom from 2002 to 2008 was characterized by worldwide economic and industrial-based growth, so that commodities had much more importance for the economic growth than they had in the dotcom-hype. The BRIC countries (Brazil, Russia, India, China) had a very high demand for commodities because their gross national product increased continuously. This development is also shown in Figure 2 and Figure 3. Both charts show clearly, a similar development pattern between 2002 and 2008.

No. 2/2014
53
Figure 3 Indexed performance commodity indices, July 1998 to April 2013
Source: Author’s calculations based on Bloomberg
After 2008, development occurred unequally. The stock indices grew following the crash of 2008, with a correction in the middle of June 2011. From the end of 2008, the commodities grew too, but after July 2011 they ran sideways with a slight negative trend.
So the commodity indices developed sideways with a possible negative trend, although the stock indices grew. A few years ago the commodity indices grew if the stock indices did. Does this connection not exist anymore? From the author´s view, one reason could be the extremely loose monetary policy of the central banks of the key industrial nations, because on the one hand the economy declined and on the other hand the riskless interest rate was lower than the dividends of very good companies.
To verify the results, the above mentioned Baltic Dry Index should be considered. Its development is presented in Figure 3 as well.
The development of the commodity indices often followed the BDI, but there was no usable or fixed time lag, which could be used for an investor as an indicator of the future development of the commodities.
2.2 Quantifying Risk and Return
Before we analyze the results of the analysis, the ratios and variables used have to be defined.
0.00
200.00
400.00
600.00
800.00
1000.00
1200.00
1400.00
1600.00Ju
l 98
Jan
99
Jul 9
9
Jan
00
Jul 0
0
Jan
01
Jul 0
1
Jan
02
Jul 0
2
Jan
03
Jul 0
3
Jan
04
Jul 0
4
Jan
05
Jul 0
5
Jan
06
Jul 0
6
Jan
07
Jul 0
7
Jan
08
Jul 0
8
Jan
09
Jul 0
9
Jan
10
Jul 1
0
Jan
11
Jul 1
1
Jan
12
Jul 1
2
Jan
13
RICI Index DJ UBS Commodity Index Baltic Dry Index TRJ CRB Index

Financial Assets and Investing
54
The total return shows the logarithmic added returns of the investigated indices over the defined time period and therefore the overall performance of every investigated index.
∑∑= −=
==
T
1t 1
T
1tti lnrR
t
t
P
P (1)
where:
rt = logarithmic yield at t Ri = total return for a defined time period Pt = Price at t Pt-1 = Price at t-1 T = Time
The average return is the linear average return of all yearly returns, weighted if a year contains less than 12 month (like 2013).
The total volatility based on the standard deviation of the logarithmic yearly returns is calculated as (Reuse, 2011, p. 18):
( )∑=
−=T
ttrT 1
21 µσ (2)
where:
rt = logarithmic yield at t µ = arithmetic average of rt T = Time
The Value-at-Risk is a risk aversion index that measures the estimated maximum loss of a risk position within a certain time period under consideration of the assumption of a defined security level. That level is also called confidential level (Reuse, 2006, p. 369); (Steiner / Bruns / Stöckl, 2012, p. 75). In order to make the analysis easier, the VaR is not defined as the difference from an expected value but as the difference from the actual value of the asset.
The VaR, assuming a normal distribution, is calculated as follows (Reuse, 2011, p. 67). It is called a variance-covariance approach.
zVaR ⋅= σ (3)
where:
VaR = Value at Risk σ = standard deviation of the portfolio
No. 2/2014
55
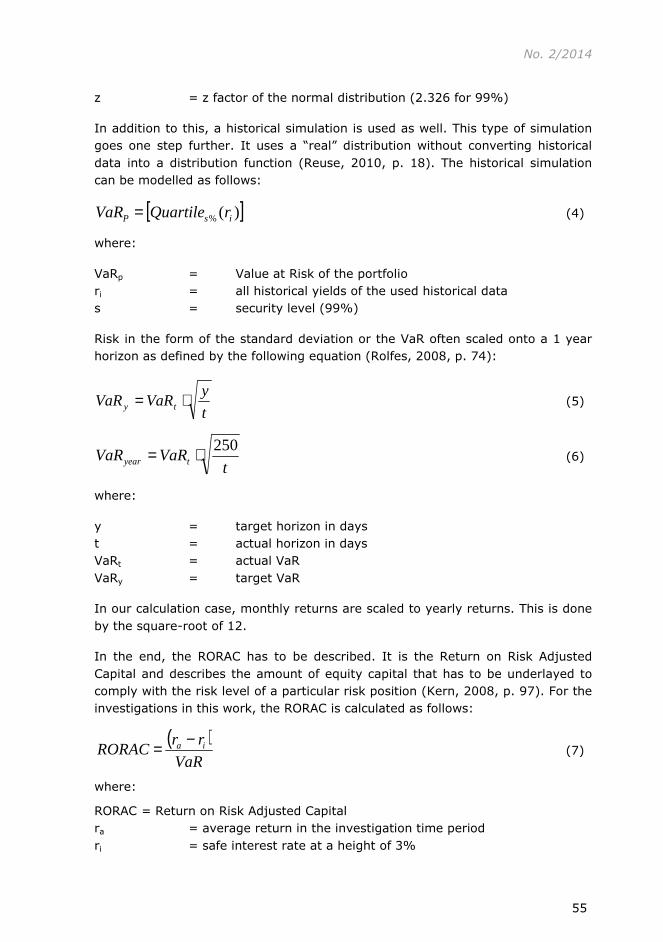
z = z factor of the normal distribution (2.326 for 99%)
In addition to this, a historical simulation is used as well. This type of simulation goes one step further. It uses a “real” distribution without converting historical data into a distribution function (Reuse, 2010, p. 18). The historical simulation can be modelled as follows:
[ ])(% isP rQuartileVaR = (4)
where:
VaRp = Value at Risk of the portfolio ri = all historical yields of the used historical data s = security level (99%)
Risk in the form of the standard deviation or the VaR often scaled onto a 1 year horizon as defined by the following equation (Rolfes, 2008, p. 74):
t
yVaRVaR ty ⋅= (5)
tVaRVaR tyear
250⋅= (6)
where:
y = target horizon in days t = actual horizon in days VaRt = actual VaR VaRy = target VaR
In our calculation case, monthly returns are scaled to yearly returns. This is done by the square-root of 12.
In the end, the RORAC has to be described. It is the Return on Risk Adjusted Capital and describes the amount of equity capital that has to be underlayed to comply with the risk level of a particular risk position (Kern, 2008, p. 97). For the investigations in this work, the RORAC is calculated as follows:
( )VaR
rrRORAC ia −= (7)
where:
RORAC = Return on Risk Adjusted Capital ra = average return in the investigation time period ri = safe interest rate at a height of 3%

Financial Assets and Investing
56
Economy
DAX IndexEURO STOXX
50 IndexMSCI World
IndexRICI Index
DJ UBS Commodity
IndexTRJ CRB Index Baltic Dry Index
Total Return 62.18% 6.87% 44.97% 127.89% 17.67% 84.16% -34.94%
Ø-Return per year (2013 weighted) 5.18% 1.22% 5.47% 7.74% 0.11% 4.99% 3.44%
VolatilityTotal Volatility 27.04% 25.22% 21.06% 22.46% 20.69% 22.06% 89.23%Scaled by monthly return 23.39% 20.37% 16.74% 19.73% 17.42% 17.87% 74.53%
Value-at-Risk99%-Risk quantil by scaled monthly return -68.58% -54.19% -45.51% -50.58% -46.10% -43.87% -270.84%Normal distribution by scaled monthly return -54.40% -47.37% -38.93% -45.89% -40.53% -41.57% -173.37%
RORAC (Ø Return and 99%-Risk quantil by scaled monthly return)
0.032 -0.033 0.054 0.094 -0.063 0.045 0.002
Economy
DAX IndexEURO STOXX
50 IndexMSCI World
IndexRICI Index
DJ UBS Commodity
IndexTRJ CRB Index Baltic Dry Index
Total Return 49.79% 10.26% 46.73% 32.58% 13.08% 23.20% 11.46%
Ø-Return per year (2013 weighted) 12.77% 2.80% 12.46% 7.90% 2.94% 5.61% 4.67%
VolatilityTotal Volatility 14.85% 13.47% 10.19% 11.81% 12.01% 11.80% 77.36%Scaled by monthly return 20.84% 19.94% 17.97% 18.85% 16.99% 16.84% 94.08%
Value-at-Risk99%-Risk quantil by scaled monthly return -57.56% -47.09% -37.24% -46.99% -43.99% -43.70% -252.50%Normal distribution by scaled monthly return -48.48% -46.38% -41.81% -43.85% -39.52% -39.17% -218.83%
RORAC (Ø Return and 99%-Risk quantil by scaled monthly return)
0.170 -0.004 0.254 0.104 -0.001 0.060 0.007
01.1998 - 04.2013
01.2009 - 04.2013
Commodity
Commodity
Stock
Stock
VaR = Value-at-Risk with 99%-Risk quartile by scaled monthly return
2.3 Results of the Historical Analysis
The results of the simulation are presented in Table 2, where two different time horizons are analyzed, a long one from 01.1998 to 04.2013 and a short one from 01.2009 to 04.2013.
Table 2 Investigation of indices risk and return ratios
Source: Author’s calculations based on Bloomberg
According to the long history, the following analysis can be done. The returns per year are very unequal between the different types of indices. But also the returns per year within an index class differ very strong. The negative return of the Baltic Dry Index, which performs conspicuously worse than the other indices. Also by the other ratios the Baltic Dry Index performs very badly in comparison to the other indices.
Another conspicuous detail is the very high total return of the RICI with nearly 128% and the TRJ CRB with over 84%. The highest returns of the stock indices offer the DAX and the MSCI World. With a total return of 62.18% and 44.97% they are much lower than the returns of the RICI and the TRJ CRB. The DJ UBS

No. 2/2014
57
and the EURO STOXX 50 can’t reach the returns of the other indices. But the volatility for this time period is over all indices nearly on the same level. Also the other benchmarks of the commodity indices are on the stock level or better. For this analysis period it could be said that the era of the commodities is not over, because they offer an adequate RORAC, calculated with a risk free rate of 3% (Reuse, 2011, p. 148) compared to the stock indices.
But the question discussed in this work: if the era of the commodities and their possible higher return compared to the stock indices is over, has to be investigated for the time period after the financial and subprime crisis in 2008. A first indication of this possibility was the stark contrast in development of the stock and commodity indices from 2009 to today. Because of that, the above mentioned ratios are calculated from 01.2009 to 04.2013, which is represented in Table 2 as well.
The shorter analysis period shows different results. The returns per year of the stock indices differ a lot from each other. The total return of the DAX 30 Index between 2009 and 2013 is up to 49.79% and the MSCI World Index has a high return of 46.73%. But the EURO STOXX 50 Index performed only with a return of 10.26% in the analysis period. One reason for this lower performance could be the debt crisis in different European countries, especially in the South Europe countries like Greece, Spain or Portugal. Germany’s economy was not hit so hard by the debt crisis, so that the DAX 30 performance was much higher.
The commodity indices performed positively as well, with a total return of 32.58% (RICI), 23.20% (TRJ CRB) and 13.08% (DJ UBS). Also the BDI had a positive performance of 11.46%.
In addition, the results in Table 2 show that the total return and the average yearly return of the commodity indices RICI and TRJ CRB are much lower than the performance of the stock indices DAX and MSCI after the financial crisis in 2008. The performance of the EURO STOXX 50 increases, the performance of the DJ UBS decreases. They are both nearly on a comparable level. The other ratios of all indices are on a comparable level as well.
The volatility is very similar between stock indices and commodity indices. The Baltic Dry Index is an exception again. Its volatility is much higher than the volatility of the other indices, independent from the analysis period.
Also the other values, e.g. the VaR of the Baltic Dry Index for instance, are conspicuously bad opposite to the values of the other indices. But what could be the reason? The stock indices performed positively so the worldwide economic growth should be positive too. The positive performance of the commodity indices point the same way. This question will be answered in chapter 3.
Financial Assets and Investing
58
It should be noted that the opportunity of previous years to earn higher returns with commodities seems to be over. The returns and the volatility of the investigated commodity indices are on the same level or lower than the investigated stock indices, even though the RORAC is a little bit lower than in the stock market.
Finally, it has to be stated that the increasing development of the stock indices in the last 1.5 years was not reflected by the commodity indices. This leads to the assumption that the investors trust the big companies, represented in the stock indices, and their economic success is much bigger than the trust in the commodity companies and the demand for the traded commodities, which are often placed in the emerging markets. . Moreover it can be stated, that the growth rates of the emerging markets, especially the BRIC-states, show weaknesses during the last time interval. Moreover one of the biggest consumers, China, has declining growth and so they stress most of all Russia and Brazil because of the weakening demand for commodities (Scherff, 2013). Additionally, China seeks to strengthen its domestic trend in order to become more independently from exports. The falling commodity prices are also influence the big mine operators, which had invested a lot of money in new projects. But nowadays they have overcapacity because of a lack of demand. The world wide biggest mine operator BHP had recorded a drop of profits for the second year in a row (Frankfurter Allgemeine Zeitung, 2013). Consequently, the authors hold the opinion that the weaknesses of the big consumers for commodities are the reason for the sideways or negative tendency of commodity prices. But if the global economy, especially Europe, grows in the near future, the prices for commodities should also increase. Possibly the strategic business model of the companies in the stock indices beats the real demand for commodities. The future will show how the development of both investment types will occur.
3 Analysis of the Indicator Quality of Commodity Indices
3.1 Correlation Analysis
At the beginning of the 21st century, there was a relationship between economic growth and price increase of commodities. In Figures 2 and 3 the parallel performance of both capital investments explains this relationship. Both figures represent too, that the economic downturn in both indices classes developed parallel too. But after 2008, and especially since 2011, it seems that this relationship no longer exists.
Generally, the correlation is a very important ratio used in the financial sector to assess risks and to evaluate diversification between two or more assets (Reuse, 2011, p. 21). To investigate the relationship between stock indices and commodity indices the correlations are shown in Table 3, where the same differentiation of the relevant historical values as in chapter 2 is presented.
No. 2/2014
59
1998 - 2013 DAX IndexEURO
STOXX 50 Index
MSCI World Index
RICI IndexDJ UBS
Commodity Index
TRJ CRB Index
Baltic Dry Index
DAX Index 1.0000 0.9379 0.8197 0.2335 0.1967 0.2037 0.0101
EURO STOXX 50 Index
0.9379 1.0000 0.8599 0.2665 0.2194 0.2332 0.0213
MSCI World Index 0.8197 0.8599 1.0000 0.4827 0.4561 0.4497 0.1586
RICI Index 0.2335 0.2665 0.4827 1.0000 0.9470 0.9821 0.2678
DJ UBS Commodity Index
0.1967 0.2194 0.4561 0.9470 1.0000 0.9667 0.2513
TRJ CRB Index 0.2037 0.2332 0.4497 0.9821 0.9667 1.0000 0.2396
Baltic Dry Index 0.0101 0.0213 0.1586 0.2678 0.2513 0.2396 1.0000
2009 - 2013 DAX IndexEURO
STOXX 50 Index
MSCI World Index
RICI IndexDJ UBS
Commodity Index
TRJ CRB Index
Baltic Dry Index
DAX Index 1.0000 0.9103 0.8409 0.4860 0.4740 0.4925 -0.3685
EURO STOXX 50 Index
0.9103 1.0000 0.8950 0.5434 0.5246 0.5561 -0.3504
MSCI World Index 0.8409 0.8950 1.0000 0.7612 0.7378 0.7566 -0.2439
RICI Index 0.4860 0.5434 0.7612 1.0000 0.9670 0.9834 -0.0581
DJ UBS Commodity Index
0.4740 0.5246 0.7378 0.9670 1.0000 0.9797 -0.0782
TRJ CRB Index 0.4925 0.5561 0.7566 0.9834 0.9797 1.0000 -0.0928
Baltic Dry Index -0.3685 -0.3504 -0.2439 -0.0581 -0.0782 -0.0928 1.0000
Difference DAX IndexEURO
STOXX 50 Index
MSCI World Index
RICI IndexDJ UBS
Commodity Index
TRJ CRB Index
Baltic Dry Index
DAX Index 0.0000 0.0276 -0.0212 -0.2525 -0.2772 -0.2887 0.3785
EURO STOXX 50 Index
0.0276 0.0000 -0.0351 -0.2769 -0.3052 -0.3230 0.3717
MSCI World Index -0.0212 -0.0351 0.0000 -0.2785 -0.2817 -0.3069 0.4025
RICI Index -0.2525 -0.2769 -0.2785 0.0000 -0.0199 -0.0013 0.3258
DJ UBS Commodity Index
-0.2772 -0.3052 -0.2817 -0.0199 0.0000 -0.0130 0.3296
TRJ CRB Index -0.2887 -0.3230 -0.3069 -0.0013 -0.0130 0.0000 0.3325
Baltic Dry Index 0.3785 0.3717 0.4025 0.3258 0.3296 0.3325 0.0000
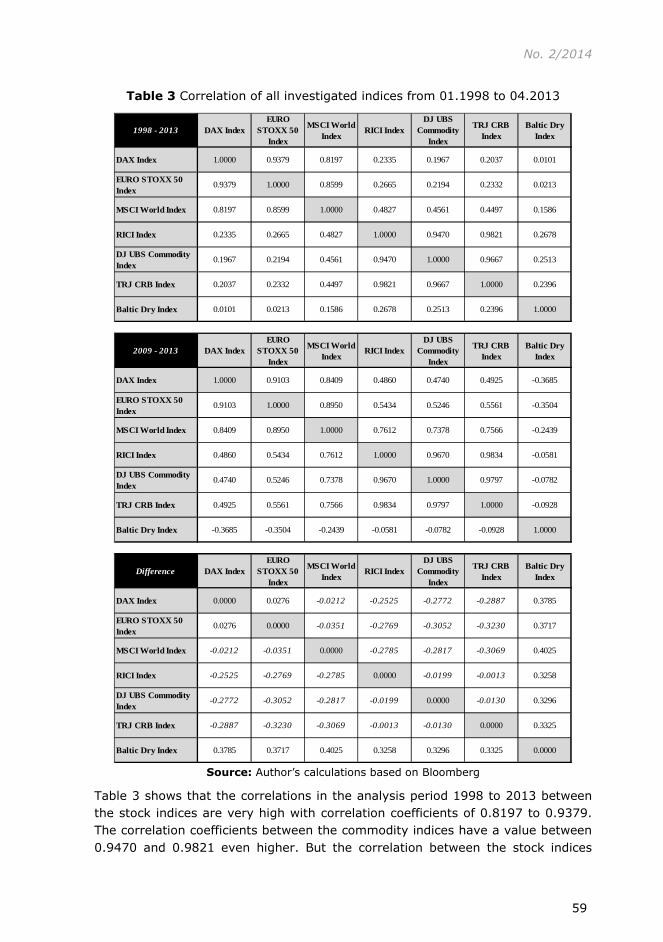
Table 3 Correlation of all investigated indices from 01.1998 to 04.2013
Source: Author’s calculations based on Bloomberg
Table 3 shows that the correlations in the analysis period 1998 to 2013 between the stock indices are very high with correlation coefficients of 0.8197 to 0.9379. The correlation coefficients between the commodity indices have a value between 0.9470 and 0.9821 even higher. But the correlation between the stock indices

Financial Assets and Investing
60
and the commodity indices is surprisingly low from 0.1967 to 0.4827. In the past, e.g. 2008, the price of commodities mostly grew if the world economy grew also. From this point of view, the correlation between stocks and commodities was on such a low level, that it was able to diversify a portfolio (Reuse / Linnertová, 2008b, pp. 531-538). These correlation results show that this relationship is lower than it seems.
These correlations of the Baltic Dry Index, which is often used as an indicator of the future economic development, are very interesting. If the BDI grows, it is a good sign that the economy will also grow. The correlation results, however, do not confirm it. They are from 0.0101 up to 0.2678, so it seems like the BDI is independent from the investigated stock indices. Also the correlation of the Baltic Dry Index to the commodity index shows the same results. A reason can be that the BDI only measures the shipping costs of commodities, which also have to fight with overcapacities in the market for ships. During the boom, a lot of ships were built, which were not needed after the financial crisis. But nevertheless it can be seen that during the period between 1998 and 2013, there was at least a positive correlation between the commodity indices and the BDI.
If the analysis period will be reduced to 01.2009 until 04.2013, the results would change in a very interesting way. The results are also shown in Table 3.
The correlations between the stock indices changed by only a few points. But the correlations between the stock indices and the commodity indices changed more substantially. In the analysis period from 1998 to 2013 the correlations between the two index classes are, as above mentioned, from 0.1967 to 0.4827. In the analysis period from 2009 to 2013, the correlations grew between 0.4740 and 0.7612. But these correlations were not high enough to suppose a direct link between the performance of stock indices or rather economic growth and the performance of commodity indices or rather the world demand for commodities. But the BDI can also be affected by anti-cyclical behavior of demanders, because if someone rebuilds their inventories the prices for freight rates can increase surprisingly. Furthermore as mentioned above, through the massive increase of tonnage, the market shows extreme overcapacities. One of the most simple reasons is that ships cannot be built in a few months. A number of years can lie between an order and the delivery of a ship so that the economic situation can be another one at the delivery time and the market can change. In 2012, an increase of over 20% was planned in addition for shipping capacity while the demand only increased about 3-5% (Mallien, 2012).
The negative correlations of the BDI and the stock and commodity indices are very important for the diversification effects. The correlation result reached from -0.0581 to -0.3685. That means, that there is a negative relationship between the BDI and the commodity indices and a small negative correlation between the BDI and the stock indices. This fact is very surprising, because the BDI is an economic

No. 2/2014
61
index, which is often used as an indicator for future world economic development and also future demand for commodities. If the BDI is not a reliable indicator for economic development or future demand of commodities, the meaning of the BDI must be questioned. That means also, that increasing demand for freight rates and growth of the economy resulting from this positive performance of the BDI is not equated with an increasing stock or commodity market. The BDI is an indicator for the world economic development, but it is not useful as an indicator for the stock or commodity market.
3.2 Conclusions regarding the Indicator Quality
Through consideration of the above mentioned results there is no indication that the investigated commodity indices, never mind the BDI, are reliable indicators of the future performance of the investigated stock indices.
At this moment, it has to be stated that the relationship between worldwide economic growth and commodity development exists between 2009 to 2013 although it is higher than during the period from 1998 to 2013, but it is not a reliable indicator for the future economic growth. Figures 2 and 3 show that economic growth in Germany and in the world is actually still positive, but the development of the global traded commodities does not reflect it.
4 Results and Critical Acknowledgement
In review, one result of the investigation is that commodity indices outperformed the traditional indices in the long term from 1998 until the present. But, as it can be seen from 2009 until now, stock indices perform better than the commodities. The economic crisis after the collapse of Lehman Brothers, which lead in the sovereign debt crisis, could be a reason, as well as the extreme loss of monetary policy in the world’s central banks. Investors look for investments with a real interest rate, so stocks with (high) dividends are preferred. Nevertheless investors could diversify their portfolio both in the long term from 1998 to 2013 and in the short term from 2009 to 2013 by investing in commodity indices, because of the low correlations between stock and commodity indices from 0.1967 to 0.4827 between 1998 and 2013. But in the short term from 2009 until 2013 the correlations between the indices grow between 0.4740 and 0.7612. Despite presence of the correlation, it is not high enough to suppose a direct link between stock and commodity indices. Furthermore, the risk of investing in commodities was lower than the volatility during the analyzed periods. From 1998 until 2013 the total volatility of the commodity indices rose to 22.46% by investment in the RICI index with the highest volatility, while the total volatility was up to 27.04% by investment in the DAX. Another result of the investigation is that commodity indices tended sideways with a downward drift since the middle of 2011. A possible explanation could be, from the perspective of the authors, the continuing sovereign debt crisis in Europe, because governments of several European states, like Italy and Spain, stopped consolidation of national budgets

Financial Assets and Investing
62
and companies are unsure whether to invest in such countries or projects. Furthermore, economic growth limps in the USA and China as different indicators show. This can also be seen by the BDI in Figure 3, which measures the freight rate and stays on a very low level. But as seen in section 3 the BDI has a negative correlation to commodity indices and so the BDI is not an indicator for investing in commodity indices. So it can be stated, that the BDI can only be used as an indicator for the global economy if the market is in at equilibrium. Nowadays, the supply of tonnage is higher than the demand. Furthermore, as seen in Table 2 the BDI shows a very high volatility from up to 78% from January 2009 to April 2013, so the BDI has no significance in the short-term.
The authors have the opinion, that investing in commodities offers a good risk/return profile. By investing in commodity indices investors could diversify their portfolio as shown in this work. So it is useful for investors to invest partially in commodity indices in order to minimize risk and to improve returns. By investing in commodities by futures or forwards the commodities are not physically in the investor portfolio, only synthetically. Those portfolios are called synthetic portfolios. In addition to that, there is also the issuer’s risk, which means, that the issuer of a commodity future can go bankrupt and so the financial products loose their value. Another problem is rolling profits or losses, which result from the contango- or backwardation-effects. If an investor invests in commodity funds, the transparency of its portfolio management and e.g. the correct payment of dividends is also a point an investor has to know.
To answer the question, if there is a direct connection between the development of the commodity markets and the stock markets: the correlation results show, that, at least in consideration of the investigated indices and time periods, there is no direct connection between the commodity and the stock market. The results or rather the correlations from stocks and commodities are too low to speak of as a direct connection.
The question, if the commodity market has a signal function for the stock market is currently hard to answer. In the investigated time period, especially at the beginning of 2002 the commodity indices started to increase one year before the stock market did. This lag could be a signal function but it is not a reliable indicator. A few years earlier, in 1999, the stock indices did not follow the increasing development of the commodity indices at the beginning of 1999. While the commodity indices increased until autumn 2000, the stock indices crashed as a result of the burst of the dotcom-bubble. A parallel development could be the development of the commodity and stock indices at the beginning of 2009. But this positive development of both markets happened at the same time, so that it can’t be described as a signal or signal function. After the crash in mid-2011 it seems that both markets develop independent of each other, at least at this time. So it can be recorded that the results of this investigation show no evidence of a signal function of the commodity market for the stock market or for a boom or

No. 2/2014
63
bull market. The results of this work show too, that the era of the commodities seems not to be over and that they will also be an interesting investment in the future.
References
Allgoewer, E. (2008). Geld-, Währungs- und Wirtschaftskrisen - Der Goldstandard und die Weltwirtschaftskrise. In Spitzeck, H. W. / Weis, M. / Spitzek, H. (eds.): Der Geldkomplex - Kritische Reflexion unsere Geldsystems und mögliche
Zukunftsszenarien. Bern: Haupt Verlag, pp. 48-67.
Boerse.de. (2013a). Dow Jones UBS Commodity Index (DJ-UBSCI). Available from: http://www.boerse.de/grundlagen/rohstoffe/Dow-Jones-UBS-Commodity-Index-DJ-UBSCI-|50, accessed on December 31st, 2013.
Boerse.de. (2013b). CRB (Commodity Research Bureau). Available from: http://www.boerse.de/indizes/CRB-Commodity-Research-Bureau-/XY0000837933 accessed on December 31st, 2013.
Brasche, U. (2013). Europäische Integration: Wirtschaft, Erweiterung und
regionale Effekte. München: Oldenburg Wissenschaftsverlag.
Büscher, A., Frère, E., Hellwig, G. (2012). Sustainable Investments - Eine
alternative Kapitalanlage für Kreditinstitute?, in: Reuse, S. / Zeranski, S. (eds.): Banken-Times Spezial, No. 08 and 09.2012, pp. 5-10.
Büscher, A., Frère, E., Hellwig, G., Reuse, S. (2013). Sustainable Investments - Outperformance gegenüber traditionellen Kapitalanlagen? Controller Magazin, 38(1), pp. 83-89.
Dow Jones Indices (2012). Dow Jones-UBS Commodity Indexes. Available from: http://www.djindexes.com/commodity/, accessed on December 31st, 2013.
Frankfurter Allgemeine Zeitung. (2013). MIDDAY BRIEFING - Unternehmen und Märkte -2-. Available from: http://www.faz.net/agenturmeldungen/unterneh mensnachrichten/midday-briefing-unternehmen-und-maerkte-2-12543875 .html, accessed on December 31st, 2013.
Glebe, D. (2008). Die globale Finanzkrise. Norderstedt: Books on Demand.
Gregoriou, G. N. (2009). Encyclopedia of Alternative Investments. Boca Raton: Taylor & Francis Group.
Haase, M., Markert, V. (2009). Auf der Suche nach der Benchmark: die neue Generation von Rohstoffindizes. Zeitschrift für das gesamte Kreditwesen, 62(8), pp. 385-387.
Haaß, W. (2007). Rendite aus der Fülle der Natur. die bank - Zeitschrift für
Bankpolitik und Praxis (5), pp. 14-19.
Kern, M. (2008). Kapitalmarktorientierter Kreditrisikotransfer - Eine Analyse am
Beispiel deutscher Genossenschaftsbanken. Wiesbaden: Gabler-GWV.
Financial Assets and Investing
64
Knoepfel, I. (2011). Responsible investments in commodities - The issue of stake
and a potential role of institutional investors. Zürich: onValues Investment Strategies and Research.
Krämer, W. (2002). Rohstoffe als Investmentklasse, Available from: http://www.lazardnet.com/lam/de/pdfs/Hintergrund_Rohstoffe_0602.pdf, accessed on December 31st, 2013.
Mallien, J. (2012). Warum der Baltic Dry Index diesmal lügt, 01.02.2012. Available from: http://www.handelsblatt.com/politik/konjunktur/nachrichten/ konjunkturbarometer-stuerzt-ab-warum-der-baltic-dry-index-diesmal-luegt/6135 760.html, accessed on December 31st, 2013.
Mikosch, B. (2010). Wenn der Dollar dem Anleger die Pläne verdirbt. Available from http://www.ftd.de/finanzen/maerkte/:waehrungsrisiko-wenn-der-dollar-dem-anleger-die-plaene-verdirbt/50175810.html, accessed on August 31st, 2013.
Mildner, S.-A., Rudloff, B., Westphal, K. (2012). Aufgaben für eine internationale Rohstoff-Governance. In Braml, J. v., Mair, S., Sandschneider, E. (eds.), Außenpolitik in der Wirtschafts- und Finanzkrise - Jahrbuch Internationale Politik
Band 29 (Vol. 29), München: Oldenburg Wissenschaftsverlag, pp. 57-70.
Neumann, M. (2009). Große Unterschiede bei Rohstoffindizes. asset avenue, pp. 34-35.
Philips, T. K. (1999). The Pros and Cons of Indexing Pension Assets. In: Fabozzi, F. J. (ed.): Perspectives on Investment Management of Public Pension Funds (pp. 50-61). Pennsylvania: Frank J. Fabozzi Associates.
Pompian, M. M. (2012). Behavioral Finance and Investor Types - Managing
Behaviour to Make Better Investment Decisions. New Jersey: John Wiley & Sons.
Priebe, C. (2012). Von Krisen, Crashs und Spekulanten. Norderstedt: Books on Demand.
Reuse, S. (2006). Berechnung des Value-at-Risk mit der Monte-Carlo-Simulation. Bankpraktiker, 1(7), pp. 366-371.
Reuse, S. (2010). Comparing Variance/Covariance and historical simulation in the context of the financial crisis - Do extreme movements have an influence onto portfolio selection? Financial Assets and Investing, 1(1), pp. 15-30.
Reuse, S. (2011). Korrelationen in Extremsituationen - Eine empirische Analyse
des deutschen Finanzmarktes mit dem Fokus auf irrationales Marktverhalten. Wiesbaden: Gabler Verlag.
Reuse, S., Linnertová, D. (2008a). Diversification with the help of commodities -
A historical analysis. Guaranteed commodity trading on commodity exchanges under the auspices of Commissioner of Region South Moravia Ing. Stanislav Juránek on 25.06. – 26.06. 2008 at Faculty of Economics and Administration MU (FEA), pp. 50-56. Brno.

No. 2/2014
65
Reuse, S., Linnertová, D. (2008b). Using commodities as a strategy of
diversification - A historical analysis. In V. Šoltés (Ed.), National and Regional Economics VII., (pp. 531-538). Košice.
Rogers International Commodity Index. (2012). Rogers Raw Materials. Available from: http://www.rogersrawmaterials.com/home.asp, accessed on August 31st, 2013.
Rogers International Commodity Index. (2013). The RICI weighting. Available from: http://www.rogersrawmaterials.com/weight.asp , accessed on August 31st, 2013.
Rolfes, B. (2008). Gesamtbanksteuerung - Risiken ertragsorientiert steuern (2nd ed.). Stuttgart: Schäffer-Poeschel.
Scherff, D. (2013). Schlechte Nachrichten aus den Schwellenländern. Available from: http://www.faz.net/aktuell/finanzen/kommentar-schlechte-nachrichten-aus-den-schwellenlaendern-12545504.html, accessed on August 31st, 2013.
Schneider, K. (2010). Marketing als Steuerungsinstrument in der
Wirtschaftskrise: Der konjunkturelle Einfluss auf die absatzpolitischen
Maßnahmen. Hamburg: Diplomica Verlag.
Steiner, M., Bruns, C., Stöckl, S. (2012). Wertpapiermanagement - Professionelle
Wertpapieranalyse und Portfoliostrukturierung (10 ed.). Stuttgart: Schäffer-Poeschel Verlag.
Thomson Reuters. (2012). Commodity Indices - The world's first commodity
index, in its original and updated forms. Available from http://Thomson reuters.com/products_services/financial/thomson_reuters_indices/indices/commodity_indices/, accessed on August 31st, 2013.
Thomson Reuters. (2013a). Commodity Indices. Available from http://Thomson reuters.com/commodity-indices/, accessed on August 31st, 2013.
Thomson Reuters. (2013b). CRB Reuters Jefferies. Available from: https://customers.reuters.com/d/Reuters_Jefferies_CRB_Index.pdf, accessed on August 31st, 2013.
Wohleb, D., Jochims, D. (2011). Risiken beim Rohstoffhandel - Wie Contango und
Backwardation den Anlageerfolg gefährden. Available from http://www.handelsblatt.com/finanzen/ratgeber/geldanlage/risiken-beim-rohstoff handel-wie-contango-und-backwardation-den-anlageerfolg-gefaehrden/3928166 .html, accessed on August 31st, 2013.