IMF Commodity Price Indices (2005 = 100) - International · PDF file ·...
25
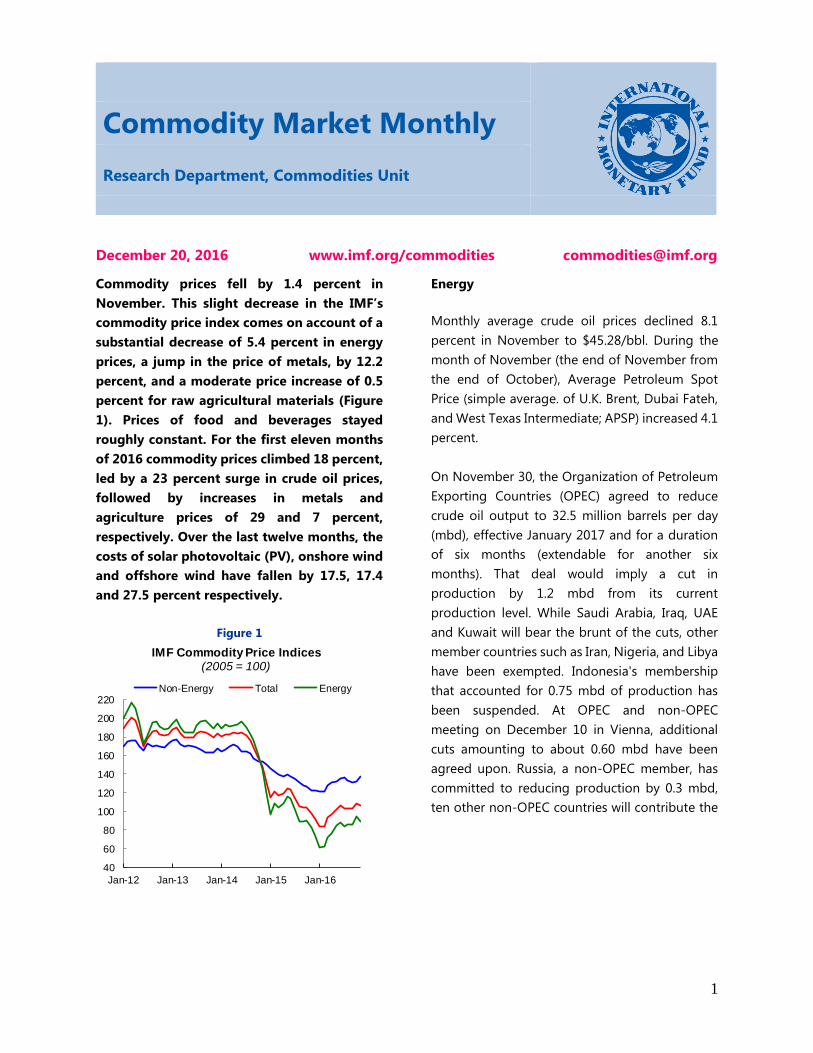
1 December 20, 2016 www.imf.org/commodities [email protected] Commodity prices fell by 1.4 percent in November. This slight decrease in the IMF’s commodity price index comes on account of a substantial decrease of 5.4 percent in energy prices, a jump in the price of metals, by 12.2 percent, and a moderate price increase of 0.5 percent for raw agricultural materials (Figure 1). Prices of food and beverages stayed roughly constant. For the first eleven months of 2016 commodity prices climbed 18 percent, led by a 23 percent surge in crude oil prices, followed by increases in metals and agriculture prices of 29 and 7 percent, respectively. Over the last twelve months, the costs of solar photovoltaic (PV), onshore wind and offshore wind have fallen by 17.5, 17.4 and 27.5 percent respectively. Figure 1 Energy Monthly average crude oil prices declined 8.1 percent in November to $45.28/bbl. During the month of November (the end of November from the end of October), Average Petroleum Spot Price (simple average. of U.K. Brent, Dubai Fateh, and West Texas Intermediate; APSP) increased 4.1 percent. On November 30, the Organization of Petroleum Exporting Countries (OPEC) agreed to reduce crude oil output to 32.5 million barrels per day (mbd), effective January 2017 and for a duration of six months (extendable for another six months). That deal would imply a cut in production by 1.2 mbd from its current production level. While Saudi Arabia, Iraq, UAE and Kuwait will bear the brunt of the cuts, other member countries such as Iran, Nigeria, and Libya have been exempted. Indonesia's membership that accounted for 0.75 mbd of production has been suspended. At OPEC and non-OPEC meeting on December 10 in Vienna, additional cuts amounting to about 0.60 mbd have been agreed upon. Russia, a non-OPEC member, has committed to reducing production by 0.3 mbd, ten other non-OPEC countries will contribute the 40 60 80 100 120 140 160 180 200 220 Jan-12 Jan-13 Jan-14 Jan-15 Jan-16 Non-Energy Total Energy IMF Commodity Price Indices (2005 = 100) Commodity Market Monthly Research Department, Commodities Unit
Transcript of IMF Commodity Price Indices (2005 = 100) - International · PDF file ·...
1
December 20, 2016 www.imf.org/commodities [email protected]
Commodity prices fell by 1.4 percent in
November. This slight decrease in the IMF’s
commodity price index comes on account of a
substantial decrease of 5.4 percent in energy
prices, a jump in the price of metals, by 12.2
percent, and a moderate price increase of 0.5
percent for raw agricultural materials (Figure
1). Prices of food and beverages stayed
roughly constant. For the first eleven months
of 2016 commodity prices climbed 18 percent,
led by a 23 percent surge in crude oil prices,
followed by increases in metals and
agriculture prices of 29 and 7 percent,
respectively. Over the last twelve months, the
costs of solar photovoltaic (PV), onshore wind
and offshore wind have fallen by 17.5, 17.4
and 27.5 percent respectively.
Figure 1
Energy
Monthly average crude oil prices declined 8.1
percent in November to $45.28/bbl. During the
month of November (the end of November from
the end of October), Average Petroleum Spot
Price (simple average. of U.K. Brent, Dubai Fateh,
and West Texas Intermediate; APSP) increased 4.1
percent.
On November 30, the Organization of Petroleum
Exporting Countries (OPEC) agreed to reduce
crude oil output to 32.5 million barrels per day
(mbd), effective January 2017 and for a duration
of six months (extendable for another six
months). That deal would imply a cut in
production by 1.2 mbd from its current
production level. While Saudi Arabia, Iraq, UAE
and Kuwait will bear the brunt of the cuts, other
member countries such as Iran, Nigeria, and Libya
have been exempted. Indonesia's membership
that accounted for 0.75 mbd of production has
been suspended. At OPEC and non-OPEC
meeting on December 10 in Vienna, additional
cuts amounting to about 0.60 mbd have been
agreed upon. Russia, a non-OPEC member, has
committed to reducing production by 0.3 mbd,
ten other non-OPEC countries will contribute the
40
60
80
100
120
140
160
180
200
220
Jan-12 Jan-13 Jan-14 Jan-15 Jan-16
Non-Energy Total Energy
IMF Commodity Price Indices(2005 = 100)
Commodity Market Monthly
Research Department, Commodities Unit
2
remainder. 1 Following the agreement, Saudi
Arabia has indicated it could cut production
beyond its initial commitment in a bid to further
support the rally in oil prices.
The actual impact of the agreement will depend
on the degree of compliance by OPEC countries,
non-OPEC oil producers’ cooperation, and shale
responses. In the past, OPEC members tended to
produce more than their quota to meet their
finance needs. In addition to the issue of quota
compliance, an exempted Nigeria can produce
500 kbd more once they control the Niger delta.
Libya’s production is hard to predict as its civil war
situation determines export.
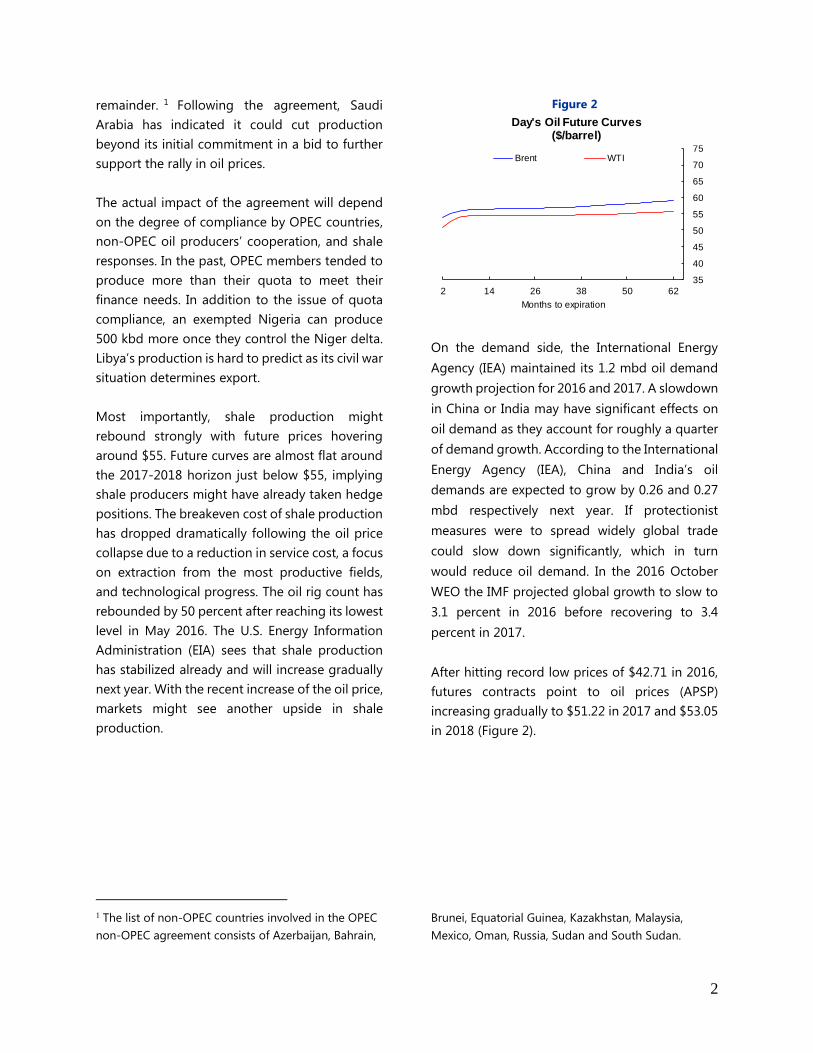
Most importantly, shale production might
rebound strongly with future prices hovering
around $55. Future curves are almost flat around
the 2017-2018 horizon just below $55, implying
shale producers might have already taken hedge
positions. The breakeven cost of shale production
has dropped dramatically following the oil price
collapse due to a reduction in service cost, a focus
on extraction from the most productive fields,
and technological progress. The oil rig count has
rebounded by 50 percent after reaching its lowest
level in May 2016. The U.S. Energy Information
Administration (EIA) sees that shale production
has stabilized already and will increase gradually
next year. With the recent increase of the oil price,
markets might see another upside in shale
production.
1 The list of non-OPEC countries involved in the OPEC
non-OPEC agreement consists of Azerbaijan, Bahrain,
Figure 2
On the demand side, the International Energy
Agency (IEA) maintained its 1.2 mbd oil demand
growth projection for 2016 and 2017. A slowdown
in China or India may have significant effects on
oil demand as they account for roughly a quarter
of demand growth. According to the International
Energy Agency (IEA), China and India’s oil
demands are expected to grow by 0.26 and 0.27
mbd respectively next year. If protectionist
measures were to spread widely global trade
could slow down significantly, which in turn
would reduce oil demand. In the 2016 October
WEO the IMF projected global growth to slow to
3.1 percent in 2016 before recovering to 3.4
percent in 2017.
After hitting record low prices of $42.71 in 2016,
futures contracts point to oil prices (APSP)
increasing gradually to $51.22 in 2017 and $53.05
in 2018 (Figure 2).
Brunei, Equatorial Guinea, Kazakhstan, Malaysia,
Mexico, Oman, Russia, Sudan and South Sudan.
35
40
45
50
55
60
65
70
75
2 14 26 38 50 62
Months to expiration
Brent WTI
Day's Oil Future Curves($/barrel)
3
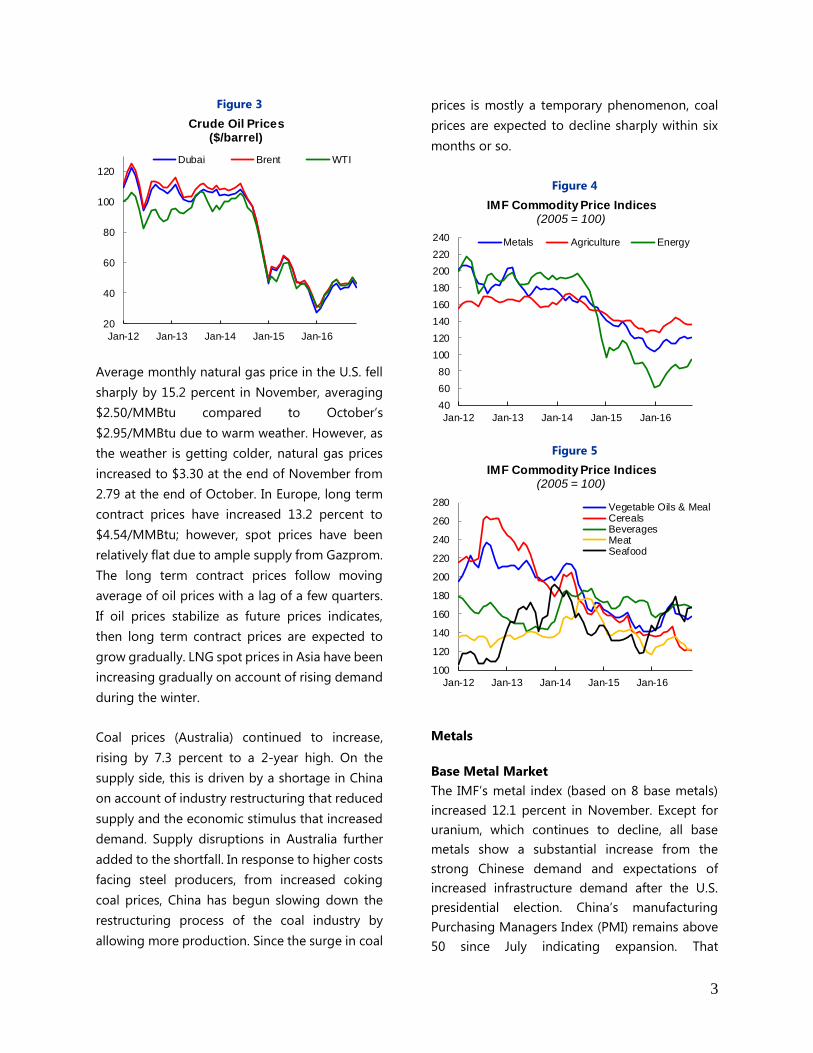
Figure 3
Average monthly natural gas price in the U.S. fell
sharply by 15.2 percent in November, averaging
$2.50/MMBtu compared to October’s
$2.95/MMBtu due to warm weather. However, as
the weather is getting colder, natural gas prices
increased to $3.30 at the end of November from
2.79 at the end of October. In Europe, long term
contract prices have increased 13.2 percent to
$4.54/MMBtu; however, spot prices have been
relatively flat due to ample supply from Gazprom.
The long term contract prices follow moving
average of oil prices with a lag of a few quarters.
If oil prices stabilize as future prices indicates,
then long term contract prices are expected to
grow gradually. LNG spot prices in Asia have been
increasing gradually on account of rising demand
during the winter.
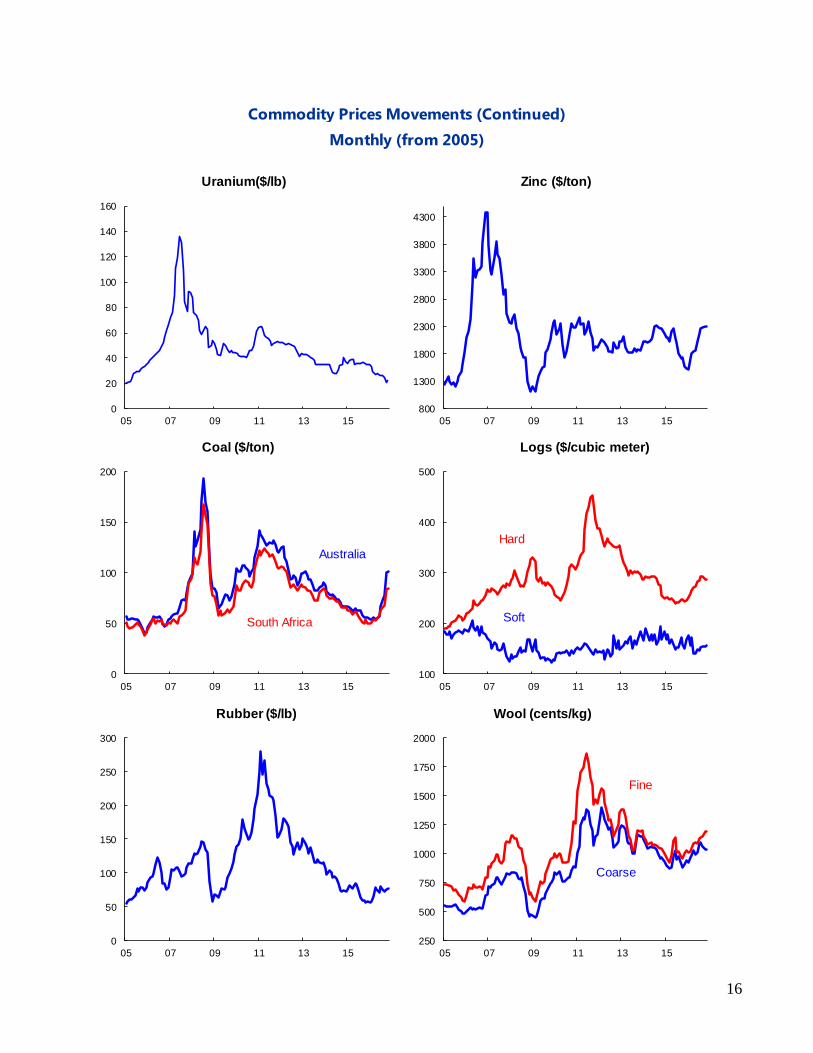
Coal prices (Australia) continued to increase,
rising by 7.3 percent to a 2-year high. On the
supply side, this is driven by a shortage in China
on account of industry restructuring that reduced
supply and the economic stimulus that increased
demand. Supply disruptions in Australia further
added to the shortfall. In response to higher costs
facing steel producers, from increased coking
coal prices, China has begun slowing down the
restructuring process of the coal industry by
allowing more production. Since the surge in coal
prices is mostly a temporary phenomenon, coal
prices are expected to decline sharply within six
months or so.
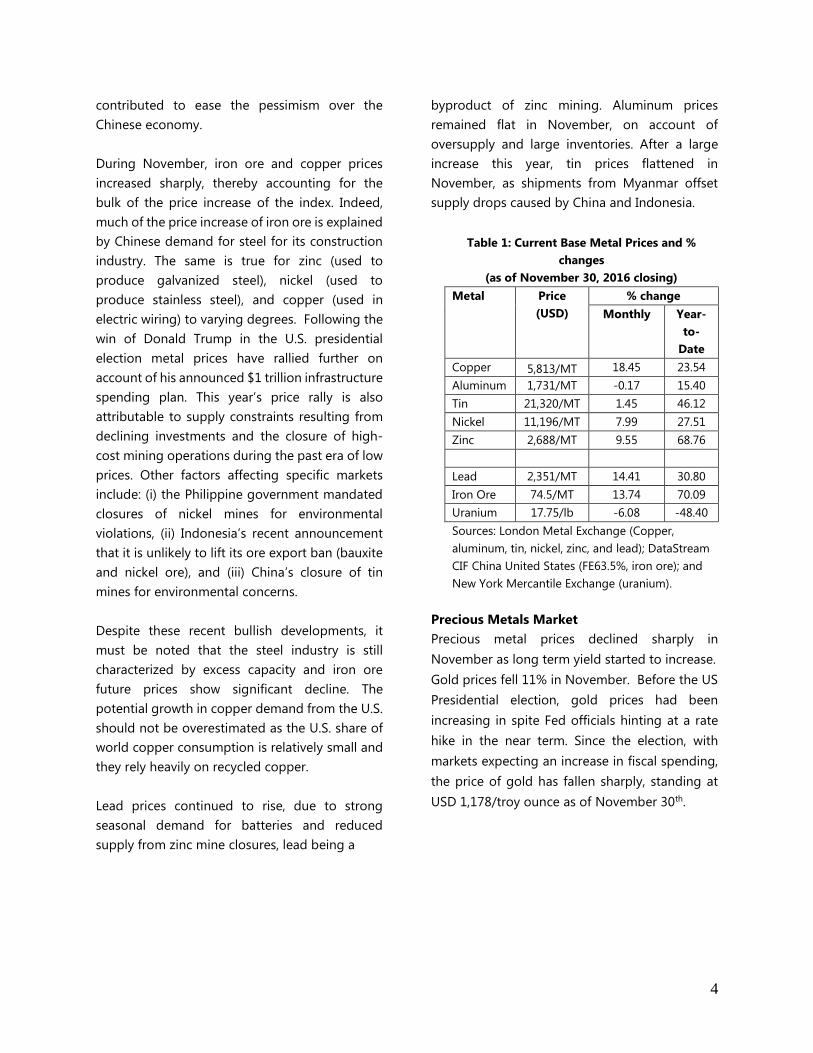
Figure 4
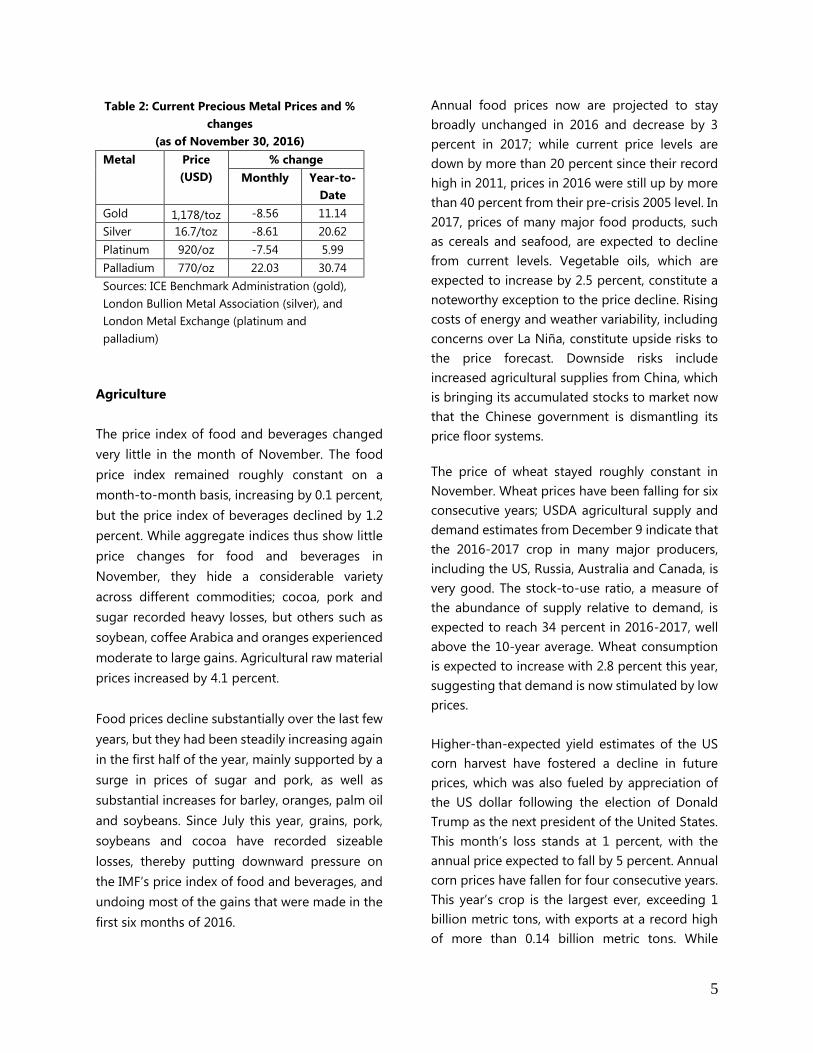
Figure 5
Metals
Base Metal Market
The IMF’s metal index (based on 8 base metals)
increased 12.1 percent in November. Except for
uranium, which continues to decline, all base
metals show a substantial increase from the
strong Chinese demand and expectations of
increased infrastructure demand after the U.S.
presidential election. China’s manufacturing
Purchasing Managers Index (PMI) remains above
50 since July indicating expansion. That
20
40
60
80
100
120
Jan-12 Jan-13 Jan-14 Jan-15 Jan-16
Dubai Brent WTI
Crude Oil Prices ($/barrel)
40
60
80
100
120
140
160
180
200
220
240
Jan-12 Jan-13 Jan-14 Jan-15 Jan-16
Metals Agriculture Energy
IMF Commodity Price Indices(2005 = 100)
100
120
140
160
180
200
220
240
260
280
Jan-12 Jan-13 Jan-14 Jan-15 Jan-16
Vegetable Oils & MealCerealsBeveragesMeatSeafood
IMF Commodity Price Indices(2005 = 100)
4
contributed to ease the pessimism over the
Chinese economy.
During November, iron ore and copper prices
increased sharply, thereby accounting for the
bulk of the price increase of the index. Indeed,
much of the price increase of iron ore is explained
by Chinese demand for steel for its construction
industry. The same is true for zinc (used to
produce galvanized steel), nickel (used to
produce stainless steel), and copper (used in
electric wiring) to varying degrees. Following the
win of Donald Trump in the U.S. presidential
election metal prices have rallied further on
account of his announced $1 trillion infrastructure
spending plan. This year’s price rally is also
attributable to supply constraints resulting from
declining investments and the closure of high-
cost mining operations during the past era of low
prices. Other factors affecting specific markets
include: (i) the Philippine government mandated
closures of nickel mines for environmental
violations, (ii) Indonesia’s recent announcement
that it is unlikely to lift its ore export ban (bauxite
and nickel ore), and (iii) China’s closure of tin
mines for environmental concerns.
Despite these recent bullish developments, it
must be noted that the steel industry is still
characterized by excess capacity and iron ore
future prices show significant decline. The
potential growth in copper demand from the U.S.
should not be overestimated as the U.S. share of
world copper consumption is relatively small and
they rely heavily on recycled copper.
Lead prices continued to rise, due to strong
seasonal demand for batteries and reduced
supply from zinc mine closures, lead being a
byproduct of zinc mining. Aluminum prices
remained flat in November, on account of
oversupply and large inventories. After a large
increase this year, tin prices flattened in
November, as shipments from Myanmar offset
supply drops caused by China and Indonesia.
Precious Metals Market
Precious metal prices declined sharply in
November as long term yield started to increase.
Gold prices fell 11% in November. Before the US
Presidential election, gold prices had been
increasing in spite Fed officials hinting at a rate
hike in the near term. Since the election, with
markets expecting an increase in fiscal spending,
the price of gold has fallen sharply, standing at
USD 1,178/troy ounce as of November 30th.
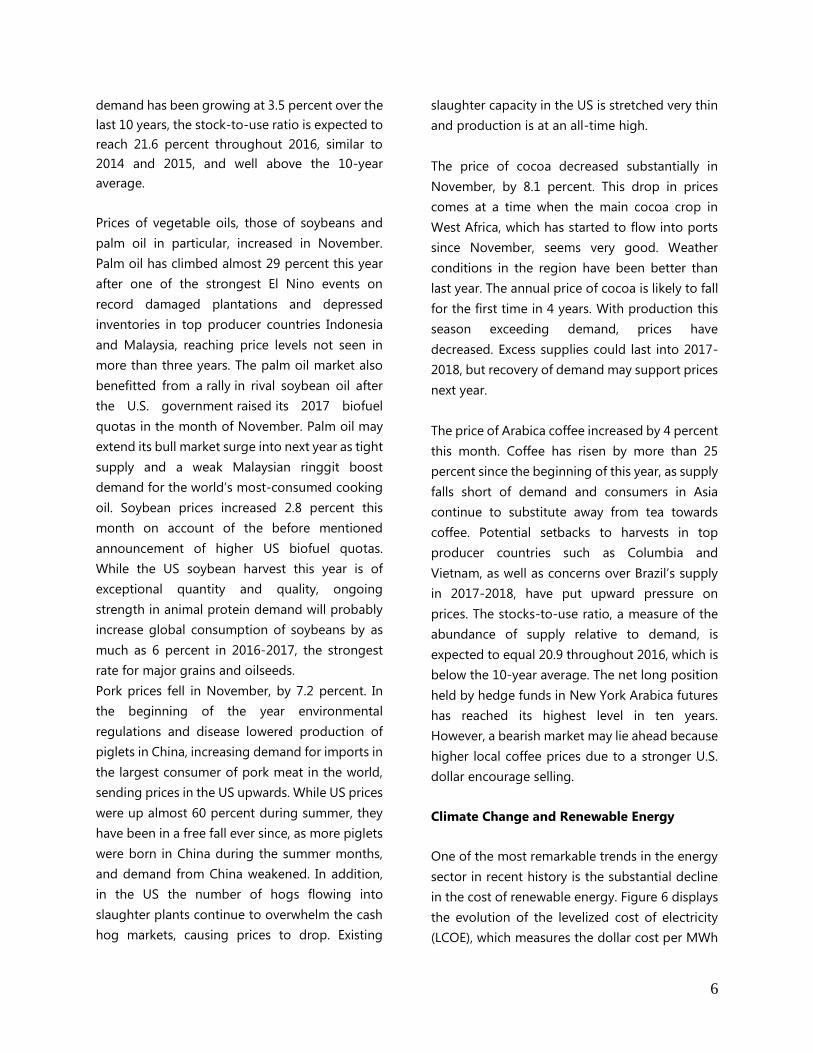
Table 1: Current Base Metal Prices and %
changes
(as of November 30, 2016 closing)
Metal Price
(USD)
% change
Monthly Year-
to-
Date
Copper 5,813/MT 18.45 23.54
Aluminum 1,731/MT -0.17 15.40
Tin 21,320/MT 1.45 46.12
Nickel 11,196/MT 7.99 27.51
Zinc 2,688/MT 9.55 68.76
Lead 2,351/MT 14.41 30.80
Iron Ore 74.5/MT 13.74 70.09
Uranium 17.75/lb -6.08 -48.40
Sources: London Metal Exchange (Copper,
aluminum, tin, nickel, zinc, and lead); DataStream
CIF China United States (FE63.5%, iron ore); and
New York Mercantile Exchange (uranium).
5
Agriculture
The price index of food and beverages changed
very little in the month of November. The food
price index remained roughly constant on a
month-to-month basis, increasing by 0.1 percent,
but the price index of beverages declined by 1.2
percent. While aggregate indices thus show little
price changes for food and beverages in
November, they hide a considerable variety
across different commodities; cocoa, pork and
sugar recorded heavy losses, but others such as
soybean, coffee Arabica and oranges experienced
moderate to large gains. Agricultural raw material
prices increased by 4.1 percent.
Food prices decline substantially over the last few
years, but they had been steadily increasing again
in the first half of the year, mainly supported by a
surge in prices of sugar and pork, as well as
substantial increases for barley, oranges, palm oil
and soybeans. Since July this year, grains, pork,
soybeans and cocoa have recorded sizeable
losses, thereby putting downward pressure on
the IMF’s price index of food and beverages, and
undoing most of the gains that were made in the
first six months of 2016.
Annual food prices now are projected to stay
broadly unchanged in 2016 and decrease by 3
percent in 2017; while current price levels are
down by more than 20 percent since their record
high in 2011, prices in 2016 were still up by more
than 40 percent from their pre-crisis 2005 level. In
2017, prices of many major food products, such
as cereals and seafood, are expected to decline
from current levels. Vegetable oils, which are
expected to increase by 2.5 percent, constitute a
noteworthy exception to the price decline. Rising
costs of energy and weather variability, including
concerns over La Niña, constitute upside risks to
the price forecast. Downside risks include
increased agricultural supplies from China, which
is bringing its accumulated stocks to market now
that the Chinese government is dismantling its
price floor systems.
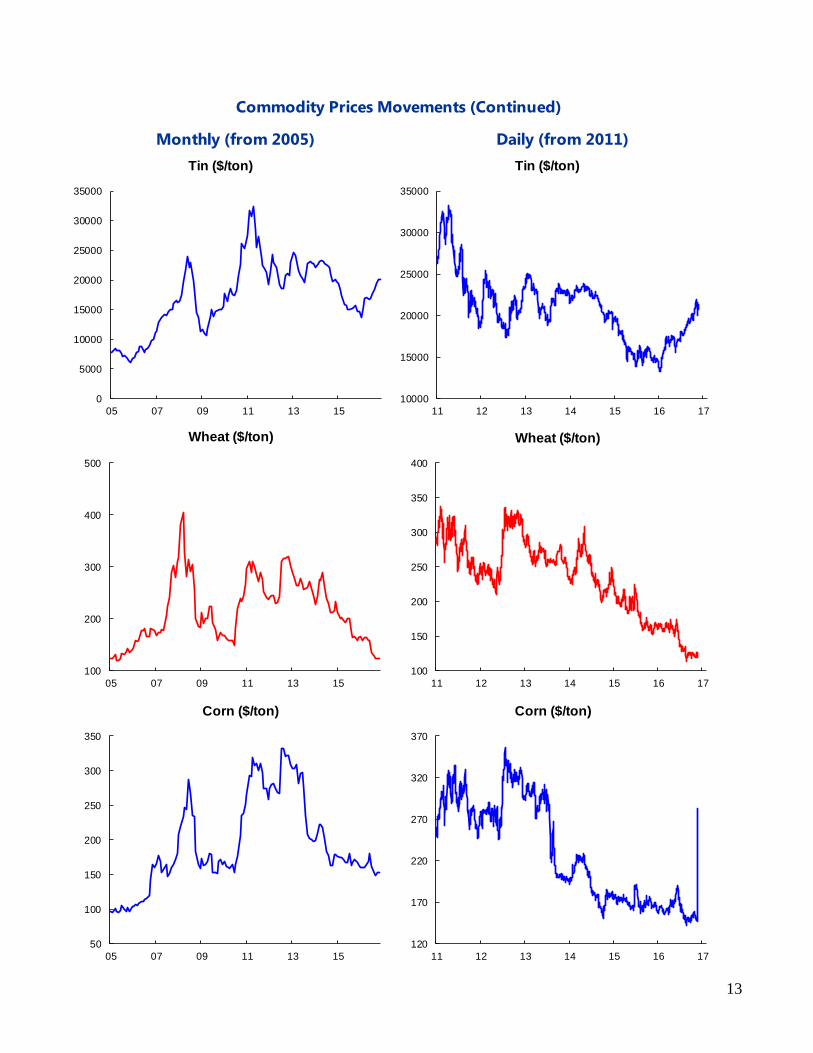
The price of wheat stayed roughly constant in
November. Wheat prices have been falling for six
consecutive years; USDA agricultural supply and
demand estimates from December 9 indicate that
the 2016-2017 crop in many major producers,
including the US, Russia, Australia and Canada, is
very good. The stock-to-use ratio, a measure of
the abundance of supply relative to demand, is
expected to reach 34 percent in 2016-2017, well
above the 10-year average. Wheat consumption
is expected to increase with 2.8 percent this year,
suggesting that demand is now stimulated by low
prices.
Higher-than-expected yield estimates of the US
corn harvest have fostered a decline in future
prices, which was also fueled by appreciation of
the US dollar following the election of Donald
Trump as the next president of the United States.
This month’s loss stands at 1 percent, with the
annual price expected to fall by 5 percent. Annual
corn prices have fallen for four consecutive years.
This year’s crop is the largest ever, exceeding 1
billion metric tons, with exports at a record high
of more than 0.14 billion metric tons. While
Table 2: Current Precious Metal Prices and %
changes
(as of November 30, 2016)
Metal Price
(USD)
% change
Monthly Year-to-
Date
Gold 1,178/toz -8.56 11.14
Silver 16.7/toz -8.61 20.62
Platinum 920/oz -7.54 5.99
Palladium 770/oz 22.03 30.74
Sources: ICE Benchmark Administration (gold),
London Bullion Metal Association (silver), and
London Metal Exchange (platinum and
palladium)
6
demand has been growing at 3.5 percent over the
last 10 years, the stock-to-use ratio is expected to
reach 21.6 percent throughout 2016, similar to
2014 and 2015, and well above the 10-year
average.
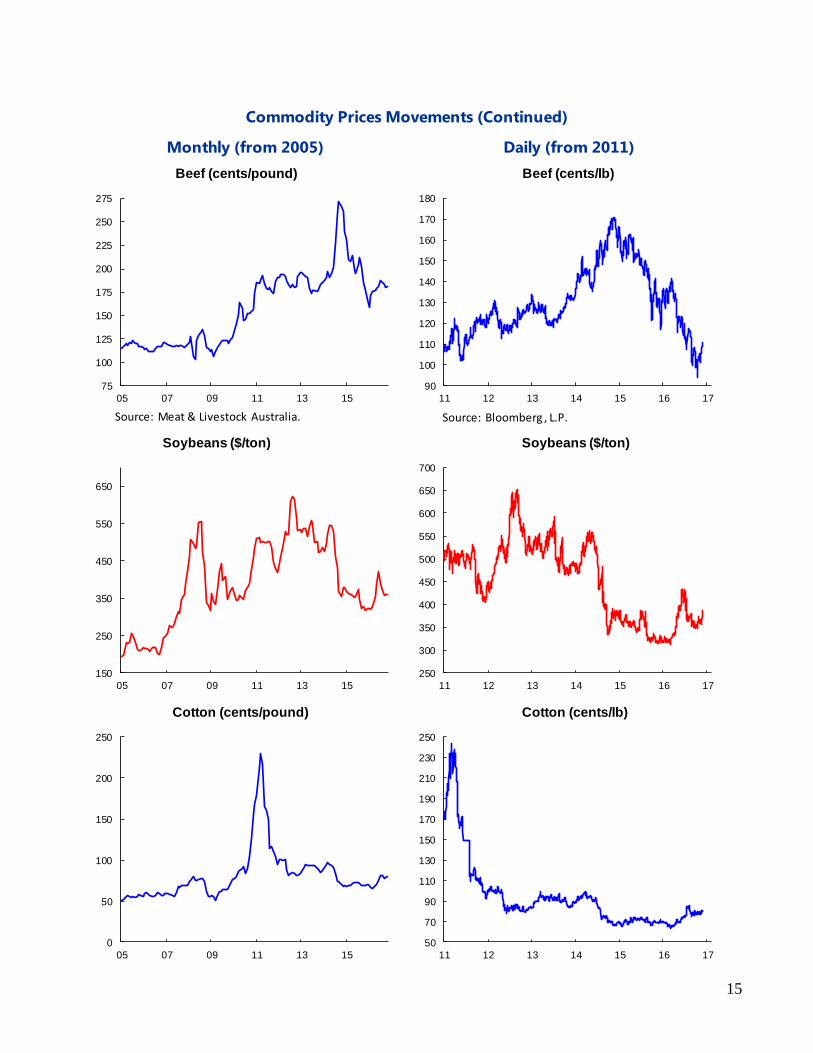
Prices of vegetable oils, those of soybeans and
palm oil in particular, increased in November.
Palm oil has climbed almost 29 percent this year
after one of the strongest El Nino events on
record damaged plantations and depressed
inventories in top producer countries Indonesia
and Malaysia, reaching price levels not seen in
more than three years. The palm oil market also
benefitted from a rally in rival soybean oil after
the U.S. government raised its 2017 biofuel
quotas in the month of November. Palm oil may
extend its bull market surge into next year as tight
supply and a weak Malaysian ringgit boost
demand for the world’s most-consumed cooking
oil. Soybean prices increased 2.8 percent this
month on account of the before mentioned
announcement of higher US biofuel quotas.
While the US soybean harvest this year is of
exceptional quantity and quality, ongoing
strength in animal protein demand will probably
increase global consumption of soybeans by as
much as 6 percent in 2016-2017, the strongest
rate for major grains and oilseeds.
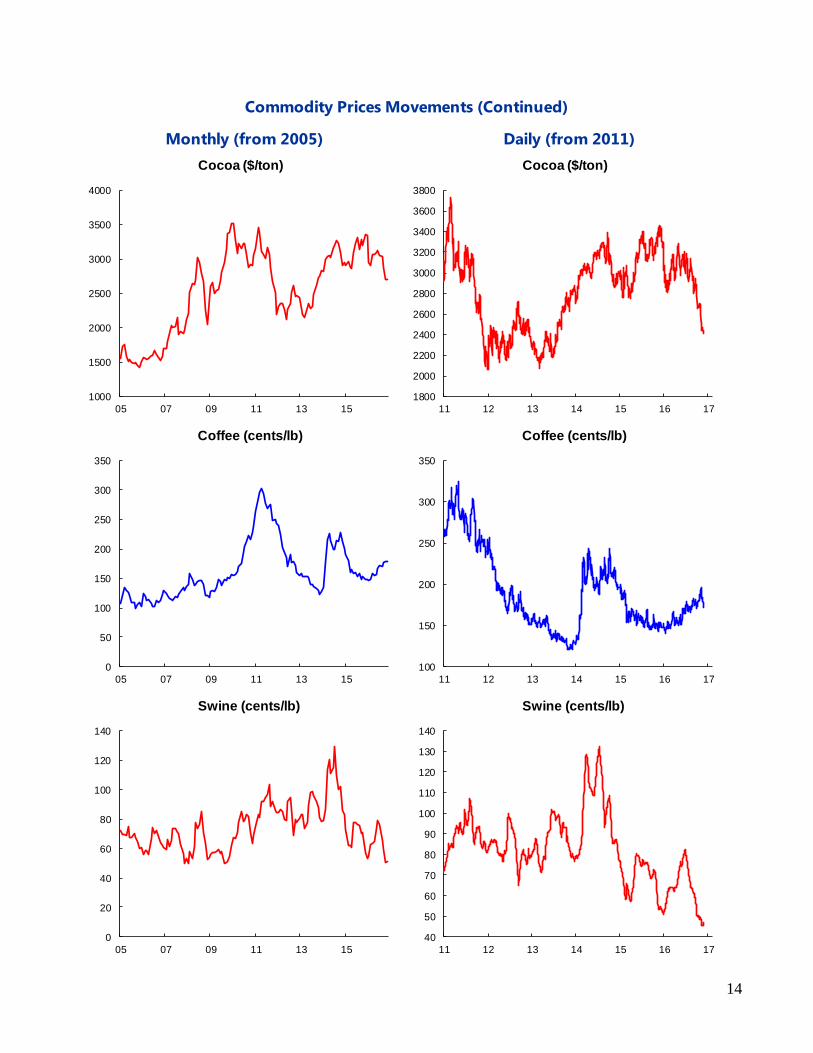
Pork prices fell in November, by 7.2 percent. In
the beginning of the year environmental
regulations and disease lowered production of
piglets in China, increasing demand for imports in
the largest consumer of pork meat in the world,
sending prices in the US upwards. While US prices
were up almost 60 percent during summer, they
have been in a free fall ever since, as more piglets
were born in China during the summer months,
and demand from China weakened. In addition,
in the US the number of hogs flowing into
slaughter plants continue to overwhelm the cash
hog markets, causing prices to drop. Existing
slaughter capacity in the US is stretched very thin
and production is at an all-time high.
The price of cocoa decreased substantially in
November, by 8.1 percent. This drop in prices
comes at a time when the main cocoa crop in
West Africa, which has started to flow into ports
since November, seems very good. Weather
conditions in the region have been better than
last year. The annual price of cocoa is likely to fall
for the first time in 4 years. With production this
season exceeding demand, prices have
decreased. Excess supplies could last into 2017-
2018, but recovery of demand may support prices
next year.
The price of Arabica coffee increased by 4 percent
this month. Coffee has risen by more than 25
percent since the beginning of this year, as supply
falls short of demand and consumers in Asia
continue to substitute away from tea towards
coffee. Potential setbacks to harvests in top
producer countries such as Columbia and
Vietnam, as well as concerns over Brazil’s supply
in 2017-2018, have put upward pressure on
prices. The stocks-to-use ratio, a measure of the
abundance of supply relative to demand, is
expected to equal 20.9 throughout 2016, which is
below the 10-year average. The net long position
held by hedge funds in New York Arabica futures
has reached its highest level in ten years.
However, a bearish market may lie ahead because
higher local coffee prices due to a stronger U.S.
dollar encourage selling.
Climate Change and Renewable Energy
One of the most remarkable trends in the energy
sector in recent history is the substantial decline
in the cost of renewable energy. Figure 6 displays
the evolution of the levelized cost of electricity
(LCOE), which measures the dollar cost per MWh

7
of electricity generated by technology, for solar,
wind and hydropower. Figure 6 shows that
between 2009-2016, the cost of solar PV was
reduced by 66 percent. Over the last twelve
months alone, solar PV fell by 17.5, while onshore
and offshore wind recorded cost reductions of
17.0 and 27.5 percent, respectively.
As a direct result of these cost reductions,
renewables are now competing head-to-head
with coal and gas in Europe, Middle East and
Africa (EMEA) and, to a lesser extent, in the US.
According to December 2016 estimatesfrom
Bloomberg, the cost of coal ($88/MWh) and gas
($78/MWh) in EMEA exceed the cost of onshore
wind ($68/MWh). As shown in Figure 7, coal and
gas are still cheaper than onshore wind in the US,
but the cost difference is small.
Figure 6
Sources: Bloomberg; and IMF staff calculations
Figure 7
Sources: Bloomberg; and IMF staff calculations
While the LCOE is an important factor driving
investment, it is most certainly not the only
determinant. This explains why solar PV
($100/MWh) and offshore wind ($126/MWh)
have been popular investment choices in the US
and Europe during recent years.
The economics of cheap(er) renewable energy is
supporting the energy transition. A wave of
investment in solar PV panels and wind turbines
has increased the share of renewable electricity
generation in both OECD and non-OECD
countries shown in Figure 8 below.
Figure 8
Sources: International Energy Agency; and IMF staff
calculations.
Note: These shares relate to electricity generation only
and exclude the heating sector.
OECD = Organisation for Economic Co-operation and
Development.
Moving forward, the IEA predicts the share of
renewables in world electricity production to
increase to 29 percent by 2040, up from 20
percent today, under current policies.
8
Figure 9
Sources: International Energy Agency; and IMF staff
calculations.
Note: These shares relate to electricity generation only
and exclude the heating sector.
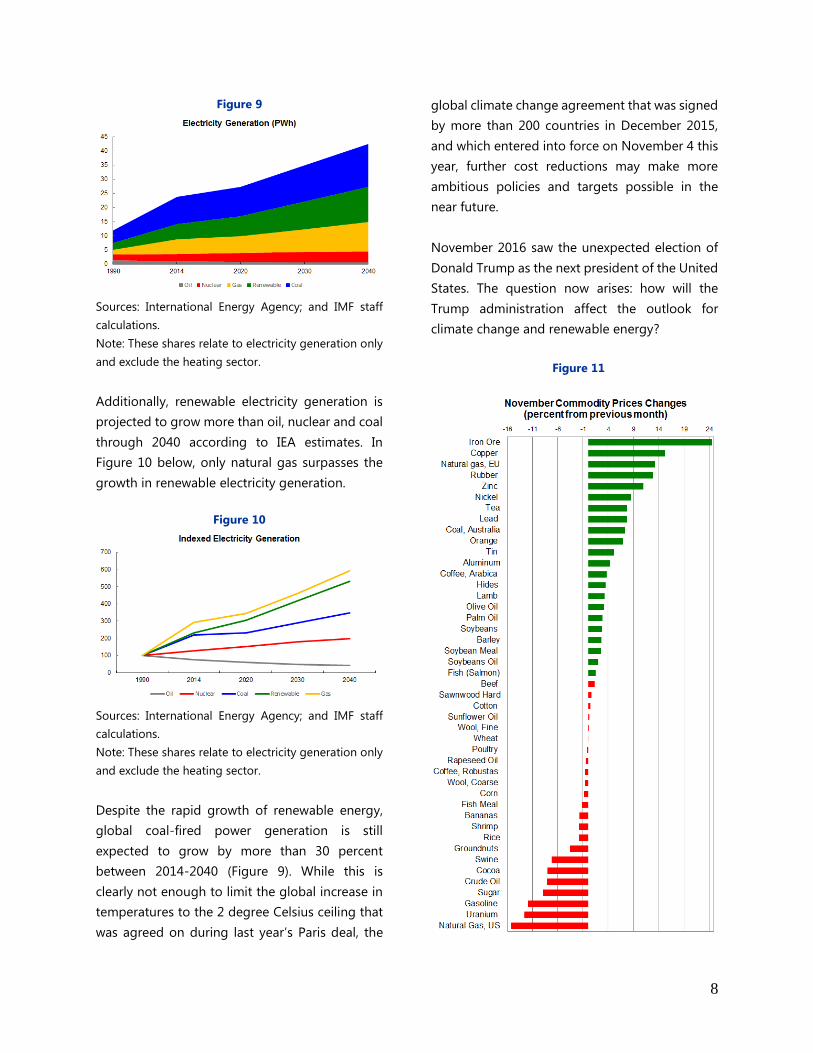
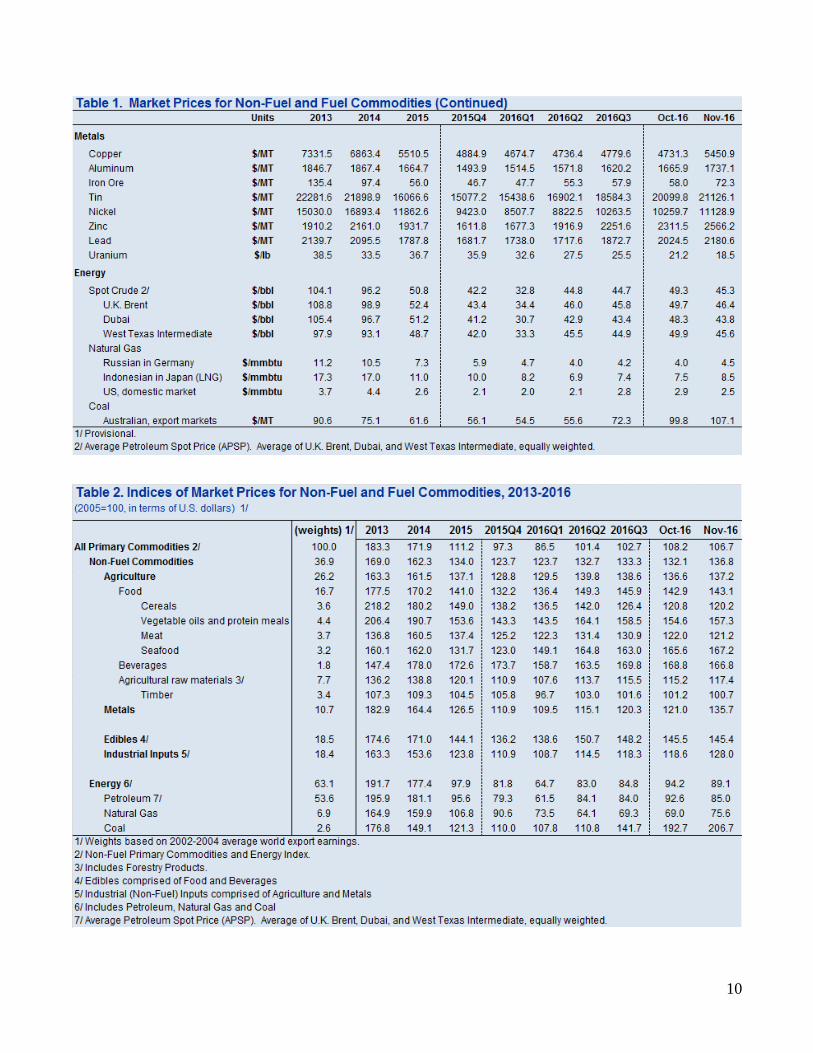
Additionally, renewable electricity generation is
projected to grow more than oil, nuclear and coal
through 2040 according to IEA estimates. In
Figure 10 below, only natural gas surpasses the
growth in renewable electricity generation.
Figure 10
Sources: International Energy Agency; and IMF staff
calculations.
Note: These shares relate to electricity generation only
and exclude the heating sector.
Despite the rapid growth of renewable energy,
global coal-fired power generation is still
expected to grow by more than 30 percent
between 2014-2040 (Figure 9). While this is
clearly not enough to limit the global increase in
temperatures to the 2 degree Celsius ceiling that
was agreed on during last year’s Paris deal, the
global climate change agreement that was signed
by more than 200 countries in December 2015,
and which entered into force on November 4 this
year, further cost reductions may make more
ambitious policies and targets possible in the
near future.
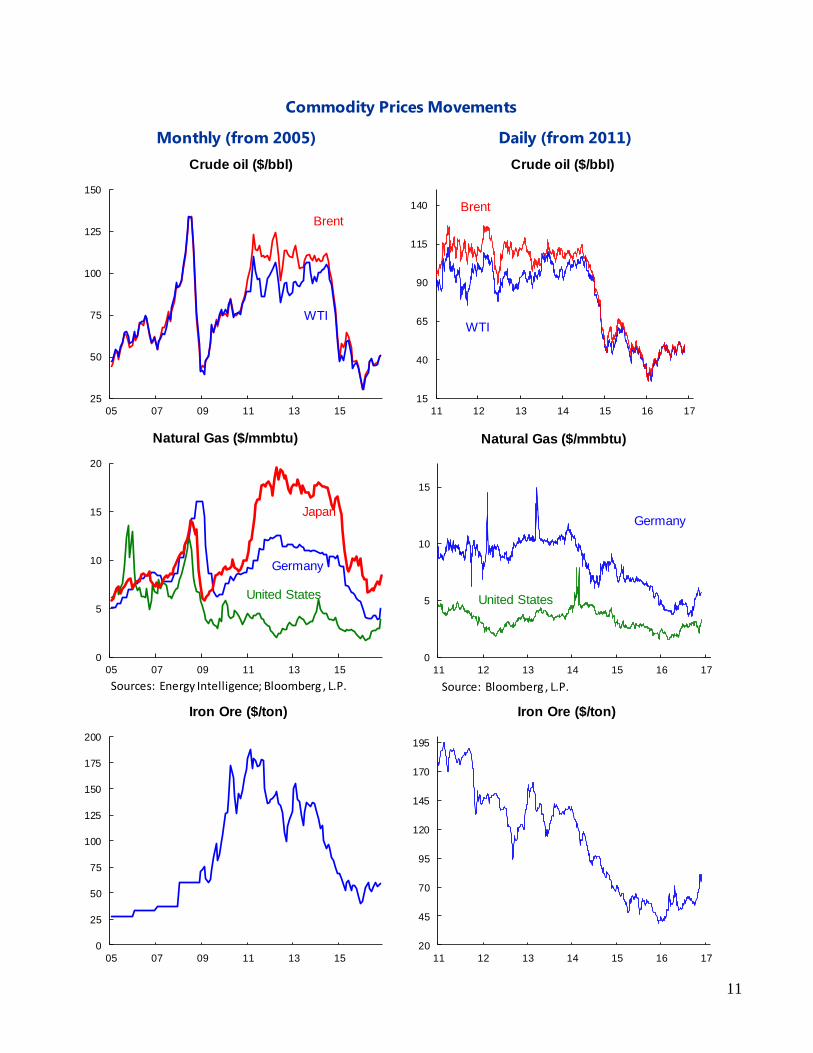
November 2016 saw the unexpected election of
Donald Trump as the next president of the United
States. The question now arises: how will the
Trump administration affect the outlook for
climate change and renewable energy?
Figure 11

9
10
11
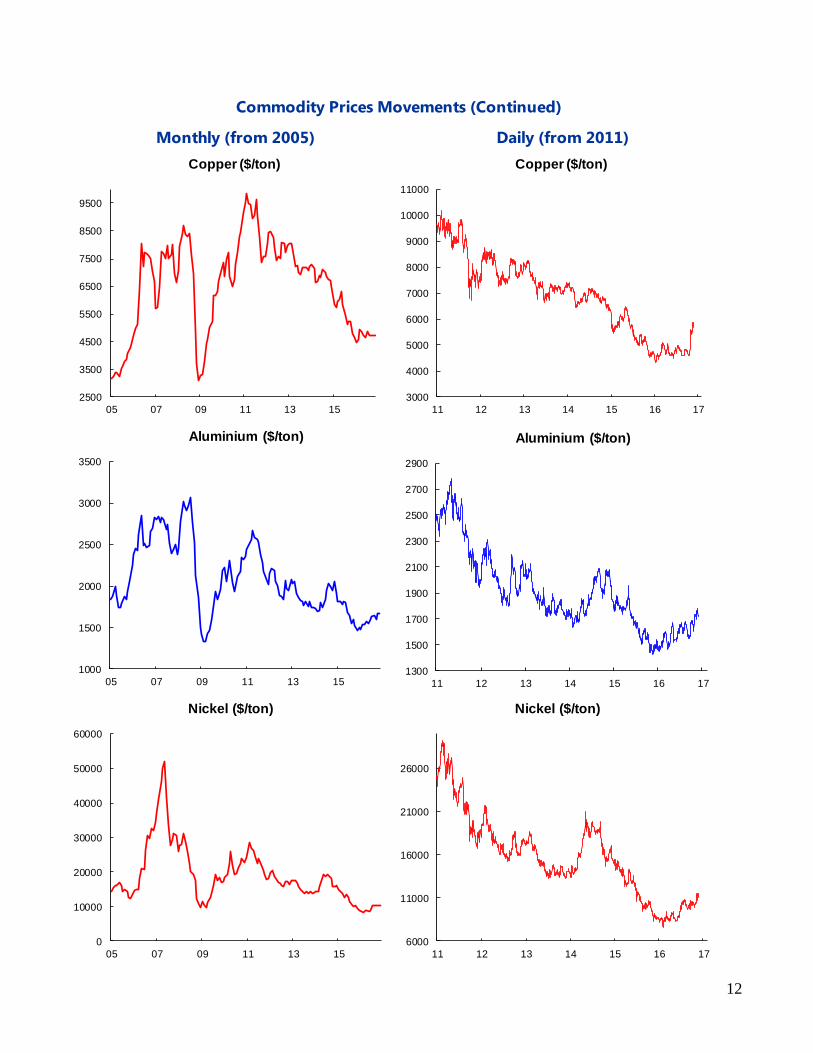
Commodity Prices Movements
Monthly (from 2005) Daily (from 2011)
25
50
75
100
125
150
05 07 09 11 13 15
Crude oil ($/bbl)
Brent
WTI
15
40
65
90
115
140
11 12 13 14 15 16 17
Crude oil ($/bbl)
Brent
WTI
0
5
10
15
20
05 07 09 11 13 15
Natural Gas ($/mmbtu)
Germany
United States
Sources: Energy Intelligence; Bloomberg , L.P.
Japan
0
5
10
15
11 12 13 14 15 16 17
Natural Gas ($/mmbtu)
Source: Bloomberg , L.P.
United States
Germany
0
25
50
75
100
125
150
175
200
05 07 09 11 13 15
Iron Ore ($/ton)
20
45
70
95
120
145
170
195
11 12 13 14 15 16 17
Iron Ore ($/ton)
12
Commodity Prices Movements (Continued)
Monthly (from 2005) Daily (from 2011)
2500
3500
4500
5500
6500
7500
8500
9500
05 07 09 11 13 15
Copper ($/ton)
3000
4000
5000
6000
7000
8000
9000
10000
11000
11 12 13 14 15 16 17
Copper ($/ton)
1000
1500
2000
2500
3000
3500
05 07 09 11 13 15
Aluminium ($/ton)
1300
1500
1700
1900
2100
2300
2500
2700
2900
11 12 13 14 15 16 17
Aluminium ($/ton)
0
10000
20000
30000
40000
50000
60000
05 07 09 11 13 15
Nickel ($/ton)
6000
11000
16000
21000
26000
11 12 13 14 15 16 17
Nickel ($/ton)
13
Commodity Prices Movements (Continued)
Monthly (from 2005) Daily (from 2011)
0
5000
10000
15000
20000
25000
30000
35000
05 07 09 11 13 15
Tin ($/ton)
50
100
150
200
250
300
350
05 07 09 11 13 15
Corn ($/ton)
10000
15000
20000
25000
30000
35000
11 12 13 14 15 16 17
Tin ($/ton)
100
150
200
250
300
350
400
11 12 13 14 15 16 17
Wheat ($/ton)
120
170
220
270
320
370
11 12 13 14 15 16 17
Corn ($/ton)
100
200
300
400
500
05 07 09 11 13 15
Wheat ($/ton)
14
Commodity Prices Movements (Continued)
Monthly (from 2005) Daily (from 2011)
1000
1500
2000
2500
3000
3500
4000
05 07 09 11 13 15
Cocoa ($/ton)
0
50
100
150
200
250
300
350
05 07 09 11 13 15
Coffee (cents/lb)
0
20
40
60
80
100
120
140
05 07 09 11 13 15
Swine (cents/lb)
40
50
60
70
80
90
100
110
120
130
140
11 12 13 14 15 16 17
Swine (cents/lb)
100
150
200
250
300
350
11 12 13 14 15 16 17
Coffee (cents/lb)
1800
2000
2200
2400
2600
2800
3000
3200
3400
3600
3800
11 12 13 14 15 16 17
Cocoa ($/ton)
15
Commodity Prices Movements (Continued)
Monthly (from 2005) Daily (from 2011)
75
100
125
150
175
200
225
250
275
05 07 09 11 13 15
Beef (cents/pound)
Source: Meat & Livestock Australia.
150
250
350
450
550
650
05 07 09 11 13 15
Soybeans ($/ton)
0
50
100
150
200
250
05 07 09 11 13 15
Cotton (cents/pound)
90
100
110
120
130
140
150
160
170
180
11 12 13 14 15 16 17
Beef (cents/lb)
Source: Bloomberg , L.P.
250
300
350
400
450
500
550
600
650
700
11 12 13 14 15 16 17
Soybeans ($/ton)
50
70
90
110
130
150
170
190
210
230
250
11 12 13 14 15 16 17
Cotton (cents/lb)
16
Commodity Prices Movements (Continued)
Monthly (from 2005)
800
1300
1800
2300
2800
3300
3800
4300
05 07 09 11 13 15
Zinc ($/ton)
0
50
100
150
200
05 07 09 11 13 15
Coal ($/ton)
Australia
South Africa
0
20
40
60
80
100
120
140
160
05 07 09 11 13 15
Uranium($/lb)
100
200
300
400
500
05 07 09 11 13 15
Logs ($/cubic meter)
Soft
Hard
0
50
100
150
200
250
300
05 07 09 11 13 15
Rubber ($/lb)
250
500
750
1000
1250
1500
1750
2000
05 07 09 11 13 15
Wool (cents/kg)
Fine
Coarse
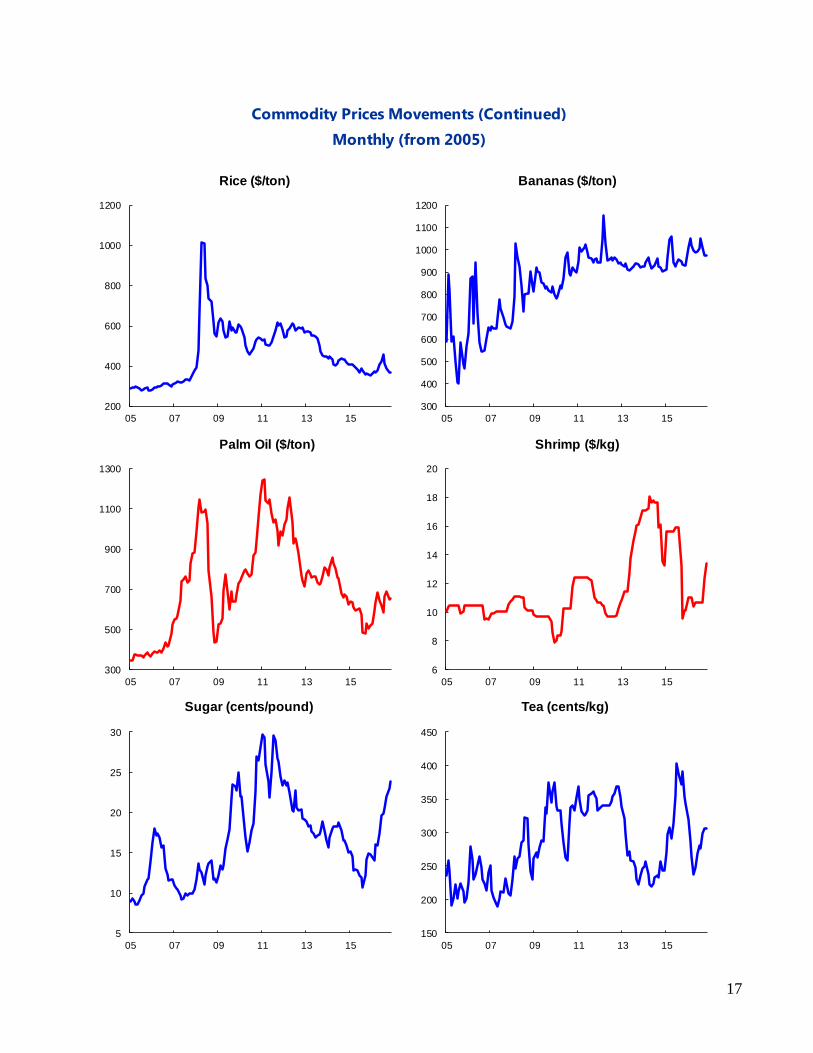
17
Commodity Prices Movements (Continued)
Monthly (from 2005)
200
400
600
800
1000
1200
05 07 09 11 13 15
Rice ($/ton)
300
400
500
600
700
800
900
1000
1100
1200
05 07 09 11 13 15
Bananas ($/ton)
300
500
700
900
1100
1300
05 07 09 11 13 15
Palm Oil ($/ton)
6
8
10
12
14
16
18
20
05 07 09 11 13 15
Shrimp ($/kg)
5
10
15
20
25
30
05 07 09 11 13 15
Sugar (cents/pound)
150
200
250
300
350
400
450
05 07 09 11 13 15
Tea (cents/kg)
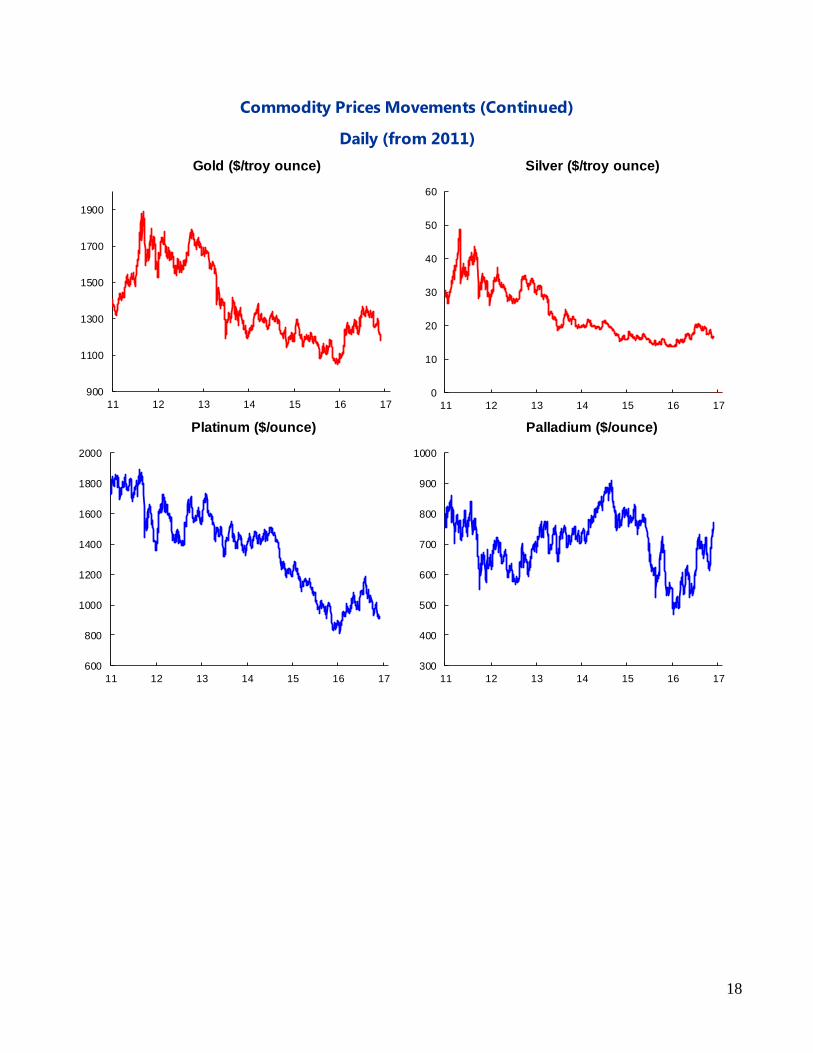
18
Commodity Prices Movements (Continued)
Daily (from 2011)
900
1100
1300
1500
1700
1900
11 12 13 14 15 16 17
Gold ($/troy ounce)
600
800
1000
1200
1400
1600
1800
2000
11 12 13 14 15 16 17
Platinum ($/ounce)
0
10
20
30
40
50
60
11 12 13 14 15 16 17
Silver ($/troy ounce)
300
400
500
600
700
800
900
1000
11 12 13 14 15 16 17
Palladium ($/ounce)
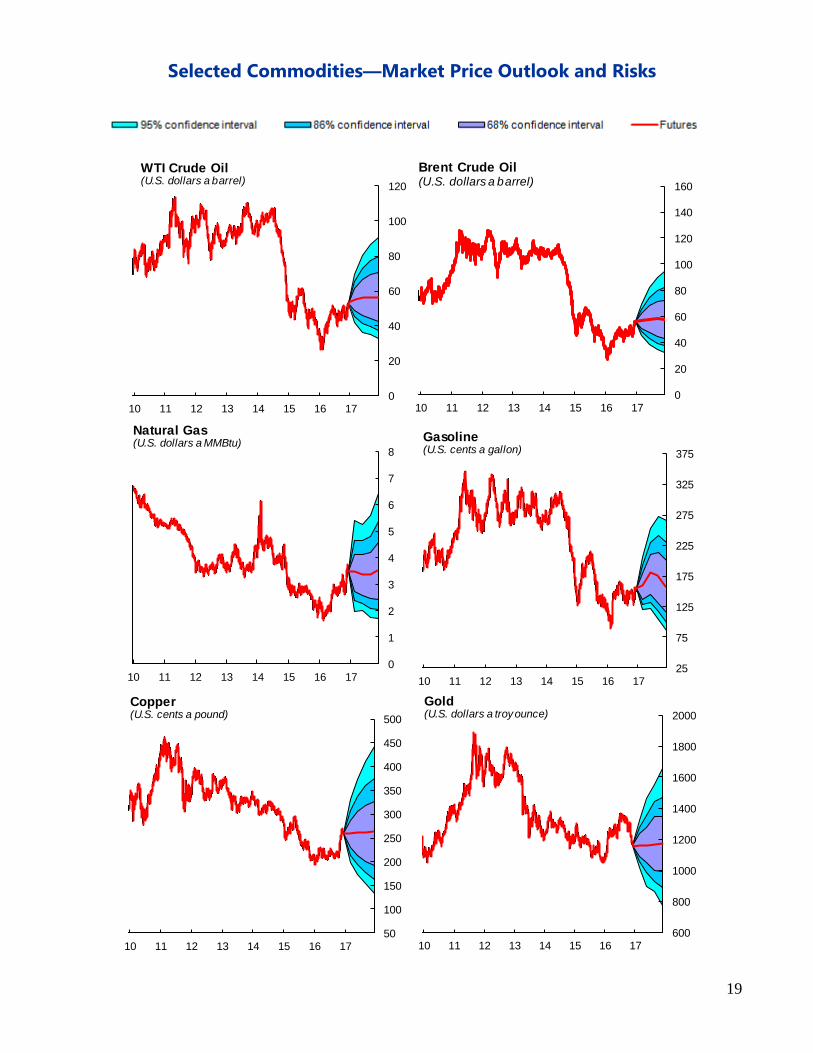
19
0
20
40
60
80
100
120
10 11 12 13 14 15 16 17
WTI Crude Oil (U.S. dollars a barrel)
0
20
40
60
80
100
120
140
160
10 11 12 13 14 15 16 17
Brent Crude Oil (U.S. dollars a barrel)
0
1
2
3
4
5
6
7
8
10 11 12 13 14 15 16 17
Natural Gas (U.S. dollars a MMBtu)
25
75
125
175
225
275
325
375
10 11 12 13 14 15 16 17
Gasoline (U.S. cents a gallon)
50
100
150
200
250
300
350
400
450
500
10 11 12 13 14 15 16 17
Copper (U.S. cents a pound)
600
800
1000
1200
1400
1600
1800
2000
10 11 12 13 14 15 16 17
Gold(U.S. dollars a troy ounce)
Selected Commodities—Market Price Outlook and Risks
20
100
200
300
400
500
600
700
800
900
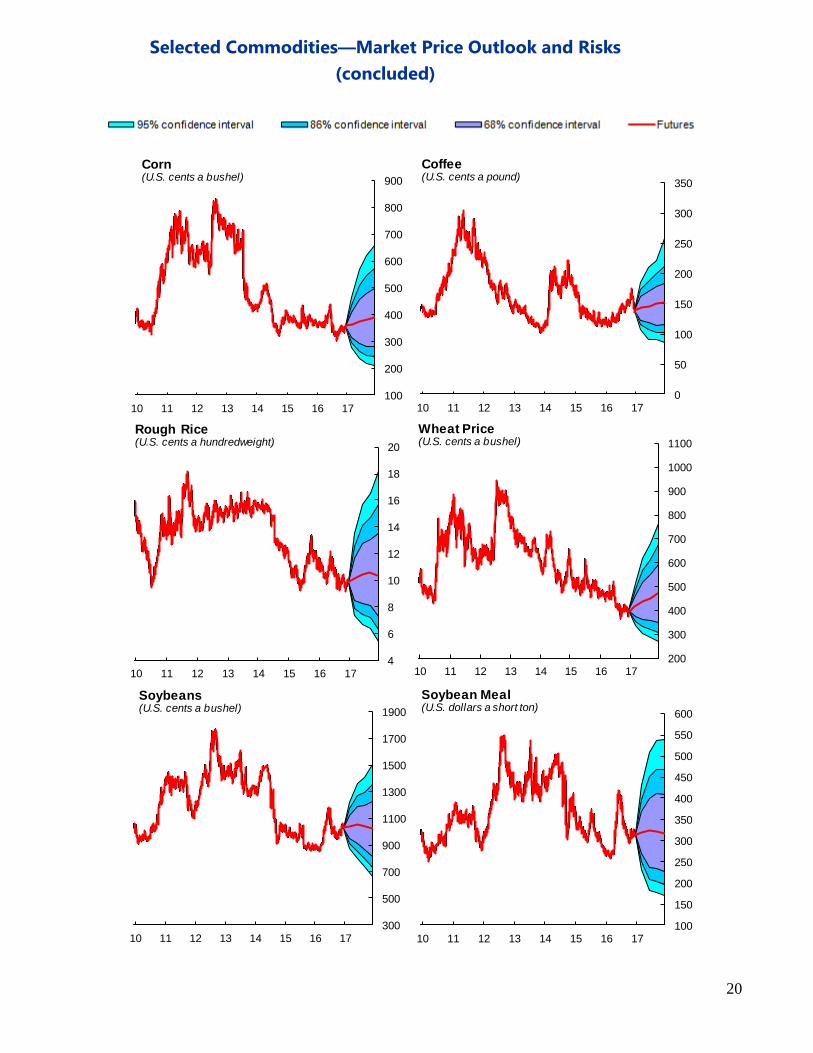
10 11 12 13 14 15 16 17
Corn(U.S. cents a bushel)
0
50
100
150
200
250
300
350
10 11 12 13 14 15 16 17
Coffee(U.S. cents a pound)
4
6
8
10
12
14
16
18
20
10 11 12 13 14 15 16 17
Rough Rice(U.S. cents a hundredweight)
200
300
400
500
600
700
800
900
1000
1100
10 11 12 13 14 15 16 17
Wheat Price(U.S. cents a bushel)
300
500
700
900
1100
1300
1500
1700
1900
10 11 12 13 14 15 16 17
Soybeans (U.S. cents a bushel)
100
150
200
250
300
350
400
450
500
550
600
10 11 12 13 14 15 16 17
Soybean Meal (U.S. dollars a short ton)
Selected Commodities—Market Price Outlook and Risks
(concluded)
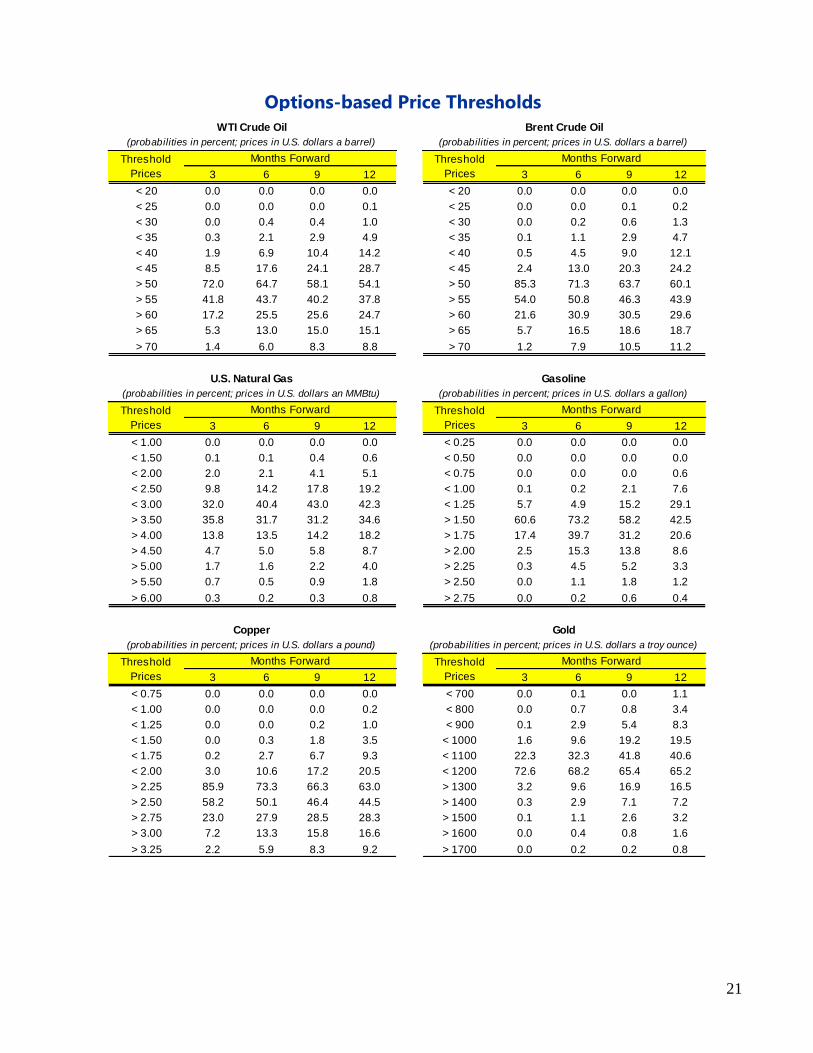
21
3 6 9 12 3 6 9 12
< 20 0.0 0.0 0.0 0.0 < 20 0.0 0.0 0.0 0.0
< 25 0.0 0.0 0.0 0.1 < 25 0.0 0.0 0.1 0.2
< 30 0.0 0.4 0.4 1.0 < 30 0.0 0.2 0.6 1.3
< 35 0.3 2.1 2.9 4.9 < 35 0.1 1.1 2.9 4.7
< 40 1.9 6.9 10.4 14.2 < 40 0.5 4.5 9.0 12.1
< 45 8.5 17.6 24.1 28.7 < 45 2.4 13.0 20.3 24.2
> 50 72.0 64.7 58.1 54.1 > 50 85.3 71.3 63.7 60.1
> 55 41.8 43.7 40.2 37.8 > 55 54.0 50.8 46.3 43.9
> 60 17.2 25.5 25.6 24.7 > 60 21.6 30.9 30.5 29.6
> 65 5.3 13.0 15.0 15.1 > 65 5.7 16.5 18.6 18.7
> 70 1.4 6.0 8.3 8.8 > 70 1.2 7.9 10.5 11.2
3 6 9 12 3 6 9 12
< 1.00 0.0 0.0 0.0 0.0 < 0.25 0.0 0.0 0.0 0.0
< 1.50 0.1 0.1 0.4 0.6 < 0.50 0.0 0.0 0.0 0.0
< 2.00 2.0 2.1 4.1 5.1 < 0.75 0.0 0.0 0.0 0.6
< 2.50 9.8 14.2 17.8 19.2 < 1.00 0.1 0.2 2.1 7.6
< 3.00 32.0 40.4 43.0 42.3 < 1.25 5.7 4.9 15.2 29.1
> 3.50 35.8 31.7 31.2 34.6 > 1.50 60.6 73.2 58.2 42.5
> 4.00 13.8 13.5 14.2 18.2 > 1.75 17.4 39.7 31.2 20.6
> 4.50 4.7 5.0 5.8 8.7 > 2.00 2.5 15.3 13.8 8.6
> 5.00 1.7 1.6 2.2 4.0 > 2.25 0.3 4.5 5.2 3.3
> 5.50 0.7 0.5 0.9 1.8 > 2.50 0.0 1.1 1.8 1.2
> 6.00 0.3 0.2 0.3 0.8 > 2.75 0.0 0.2 0.6 0.4
3 6 9 12 3 6 9 12
< 0.75 0.0 0.0 0.0 0.0 < 700 0.0 0.1 0.0 1.1
< 1.00 0.0 0.0 0.0 0.2 < 800 0.0 0.7 0.8 3.4
< 1.25 0.0 0.0 0.2 1.0 < 900 0.1 2.9 5.4 8.3
< 1.50 0.0 0.3 1.8 3.5 < 1000 1.6 9.6 19.2 19.5
< 1.75 0.2 2.7 6.7 9.3 < 1100 22.3 32.3 41.8 40.6
< 2.00 3.0 10.6 17.2 20.5 < 1200 72.6 68.2 65.4 65.2
> 2.25 85.9 73.3 66.3 63.0 > 1300 3.2 9.6 16.9 16.5
> 2.50 58.2 50.1 46.4 44.5 > 1400 0.3 2.9 7.1 7.2
> 2.75 23.0 27.9 28.5 28.3 > 1500 0.1 1.1 2.6 3.2
> 3.00 7.2 13.3 15.8 16.6 > 1600 0.0 0.4 0.8 1.6
> 3.25 2.2 5.9 8.3 9.2 > 1700 0.0 0.2 0.2 0.8
WTI Crude Oil
(probabilities in percent; prices in U.S. dollars a barrel)
Threshold
Prices
Months Forward
Brent Crude Oil
(probabilities in percent; prices in U.S. dollars a barrel)
Threshold
Prices
Months Forward
U.S. Natural Gas
(probabilities in percent; prices in U.S. dollars an MMBtu)
Threshold
Prices
Months Forward
Gasoline
(probabilities in percent; prices in U.S. dollars a gallon)
Threshold
Prices
Months Forward
Copper
(probabilities in percent; prices in U.S. dollars a pound)
Threshold
Prices
Months Forward
Gold
(probabilities in percent; prices in U.S. dollars a troy ounce)
Threshold
Prices
Months Forward
Options-based Price Thresholds
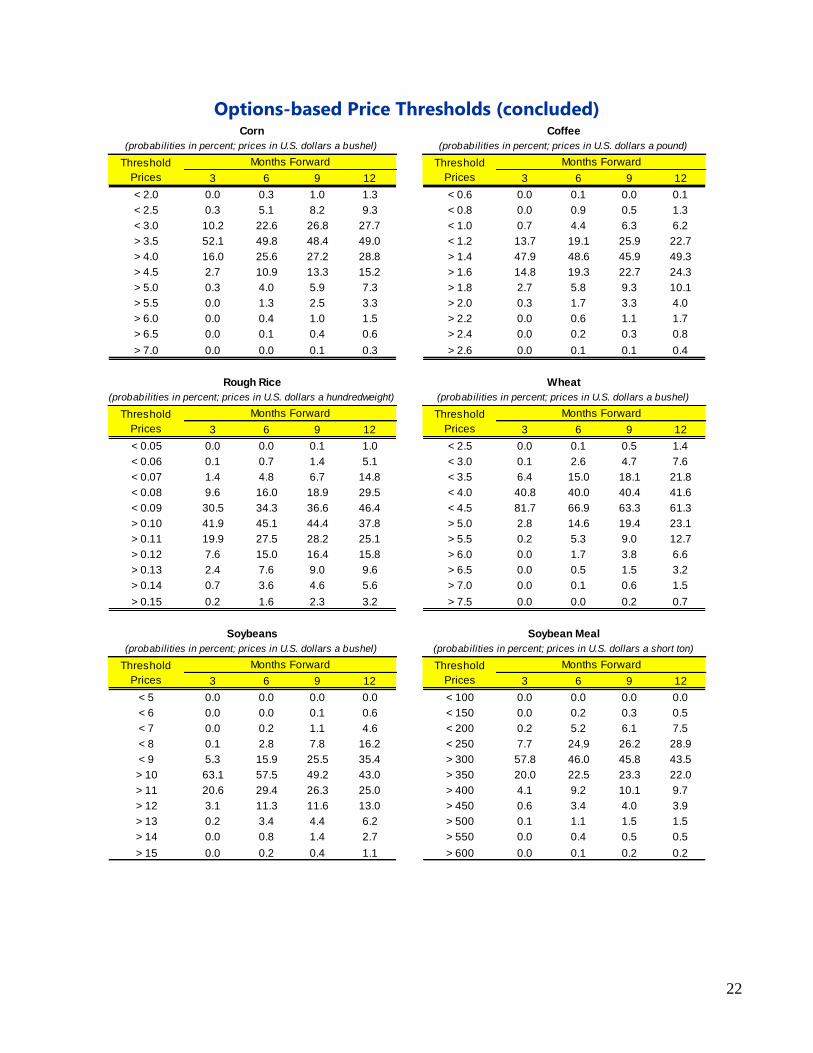
22
Options-based Price Thresholds (concluded)
3 6 9 12 3 6 9 12
< 2.0 0.0 0.3 1.0 1.3 < 0.6 0.0 0.1 0.0 0.1
< 2.5 0.3 5.1 8.2 9.3 < 0.8 0.0 0.9 0.5 1.3
< 3.0 10.2 22.6 26.8 27.7 < 1.0 0.7 4.4 6.3 6.2
> 3.5 52.1 49.8 48.4 49.0 < 1.2 13.7 19.1 25.9 22.7
> 4.0 16.0 25.6 27.2 28.8 > 1.4 47.9 48.6 45.9 49.3
> 4.5 2.7 10.9 13.3 15.2 > 1.6 14.8 19.3 22.7 24.3
> 5.0 0.3 4.0 5.9 7.3 > 1.8 2.7 5.8 9.3 10.1
> 5.5 0.0 1.3 2.5 3.3 > 2.0 0.3 1.7 3.3 4.0
> 6.0 0.0 0.4 1.0 1.5 > 2.2 0.0 0.6 1.1 1.7
> 6.5 0.0 0.1 0.4 0.6 > 2.4 0.0 0.2 0.3 0.8
> 7.0 0.0 0.0 0.1 0.3 > 2.6 0.0 0.1 0.1 0.4
3 6 9 12 3 6 9 12
< 0.05 0.0 0.0 0.1 1.0 < 2.5 0.0 0.1 0.5 1.4
< 0.06 0.1 0.7 1.4 5.1 < 3.0 0.1 2.6 4.7 7.6
< 0.07 1.4 4.8 6.7 14.8 < 3.5 6.4 15.0 18.1 21.8
< 0.08 9.6 16.0 18.9 29.5 < 4.0 40.8 40.0 40.4 41.6
< 0.09 30.5 34.3 36.6 46.4 < 4.5 81.7 66.9 63.3 61.3
> 0.10 41.9 45.1 44.4 37.8 > 5.0 2.8 14.6 19.4 23.1
> 0.11 19.9 27.5 28.2 25.1 > 5.5 0.2 5.3 9.0 12.7
> 0.12 7.6 15.0 16.4 15.8 > 6.0 0.0 1.7 3.8 6.6
> 0.13 2.4 7.6 9.0 9.6 > 6.5 0.0 0.5 1.5 3.2
> 0.14 0.7 3.6 4.6 5.6 > 7.0 0.0 0.1 0.6 1.5
> 0.15 0.2 1.6 2.3 3.2 > 7.5 0.0 0.0 0.2 0.7
3 6 9 12 3 6 9 12
< 5 0.0 0.0 0.0 0.0 < 100 0.0 0.0 0.0 0.0
< 6 0.0 0.0 0.1 0.6 < 150 0.0 0.2 0.3 0.5
< 7 0.0 0.2 1.1 4.6 < 200 0.2 5.2 6.1 7.5
< 8 0.1 2.8 7.8 16.2 < 250 7.7 24.9 26.2 28.9
< 9 5.3 15.9 25.5 35.4 > 300 57.8 46.0 45.8 43.5
> 10 63.1 57.5 49.2 43.0 > 350 20.0 22.5 23.3 22.0
> 11 20.6 29.4 26.3 25.0 > 400 4.1 9.2 10.1 9.7
> 12 3.1 11.3 11.6 13.0 > 450 0.6 3.4 4.0 3.9
> 13 0.2 3.4 4.4 6.2 > 500 0.1 1.1 1.5 1.5
> 14 0.0 0.8 1.4 2.7 > 550 0.0 0.4 0.5 0.5
> 15 0.0 0.2 0.4 1.1 > 600 0.0 0.1 0.2 0.2
Corn
(probabilities in percent; prices in U.S. dollars a bushel)
Threshold
Prices
Months Forward
Coffee
(probabilities in percent; prices in U.S. dollars a pound)
Threshold
Prices
Months Forward
Rough Rice
(probabilities in percent; prices in U.S. dollars a hundredweight)
Threshold
Prices
Months Forward
Wheat
(probabilities in percent; prices in U.S. dollars a bushel)
Threshold
Prices
Months Forward
Soybeans
(probabilities in percent; prices in U.S. dollars a bushel)
Threshold
Prices
Months Forward
Soybean Meal
(probabilities in percent; prices in U.S. dollars a short ton)
Threshold
Prices
Months Forward
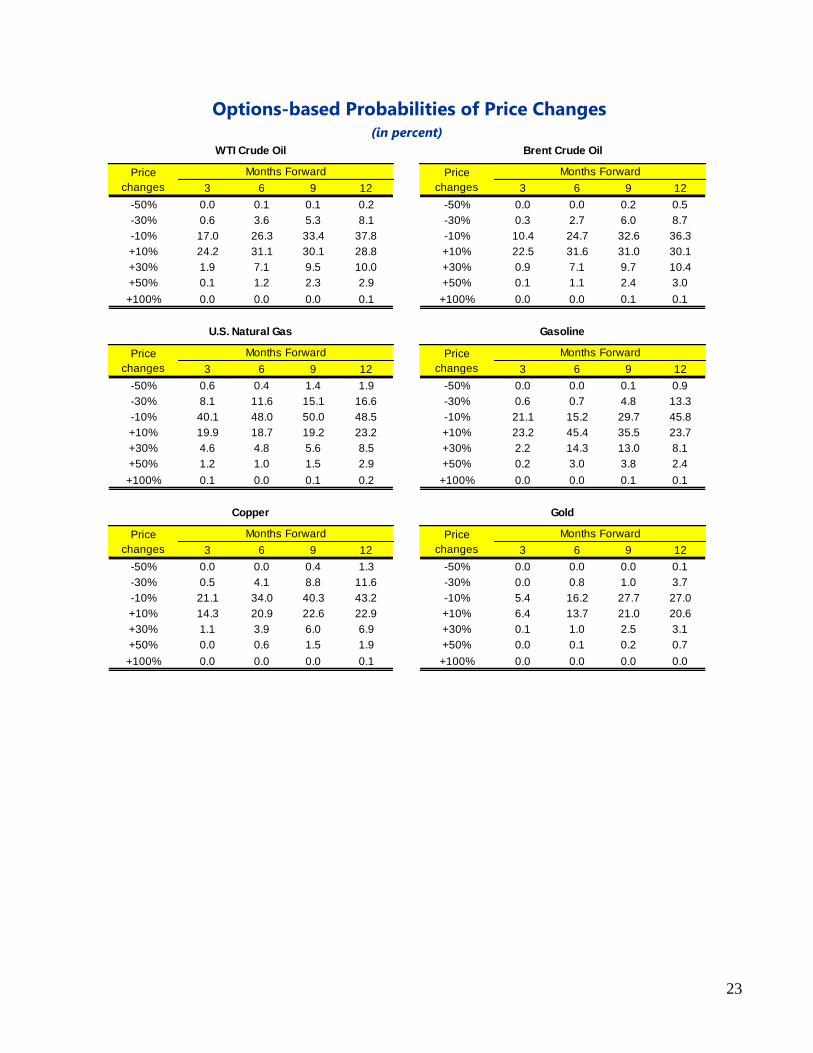
23
Options-based Probabilities of Price Changes (in percent)
3 6 9 12 3 6 9 12
-50% 0.0 0.1 0.1 0.2 -50% 0.0 0.0 0.2 0.5
-30% 0.6 3.6 5.3 8.1 -30% 0.3 2.7 6.0 8.7
-10% 17.0 26.3 33.4 37.8 -10% 10.4 24.7 32.6 36.3
+10% 24.2 31.1 30.1 28.8 +10% 22.5 31.6 31.0 30.1
+30% 1.9 7.1 9.5 10.0 +30% 0.9 7.1 9.7 10.4
+50% 0.1 1.2 2.3 2.9 +50% 0.1 1.1 2.4 3.0
+100% 0.0 0.0 0.0 0.1 +100% 0.0 0.0 0.1 0.1
3 6 9 12 3 6 9 12
-50% 0.6 0.4 1.4 1.9 -50% 0.0 0.0 0.1 0.9
-30% 8.1 11.6 15.1 16.6 -30% 0.6 0.7 4.8 13.3
-10% 40.1 48.0 50.0 48.5 -10% 21.1 15.2 29.7 45.8
+10% 19.9 18.7 19.2 23.2 +10% 23.2 45.4 35.5 23.7
+30% 4.6 4.8 5.6 8.5 +30% 2.2 14.3 13.0 8.1
+50% 1.2 1.0 1.5 2.9 +50% 0.2 3.0 3.8 2.4
+100% 0.1 0.0 0.1 0.2 +100% 0.0 0.0 0.1 0.1
3 6 9 12 3 6 9 12
-50% 0.0 0.0 0.4 1.3 -50% 0.0 0.0 0.0 0.1
-30% 0.5 4.1 8.8 11.6 -30% 0.0 0.8 1.0 3.7
-10% 21.1 34.0 40.3 43.2 -10% 5.4 16.2 27.7 27.0
+10% 14.3 20.9 22.6 22.9 +10% 6.4 13.7 21.0 20.6
+30% 1.1 3.9 6.0 6.9 +30% 0.1 1.0 2.5 3.1
+50% 0.0 0.6 1.5 1.9 +50% 0.0 0.1 0.2 0.7
+100% 0.0 0.0 0.0 0.1 +100% 0.0 0.0 0.0 0.0
Copper Gold
Price
changes
Months Forward Price
changes
Months Forward
U.S. Natural Gas Gasoline
Price
changes
Months Forward Price
changes
Months Forward
WTI Crude Oil Brent Crude Oil
Price
changes
Months Forward Price
changes
Months Forward
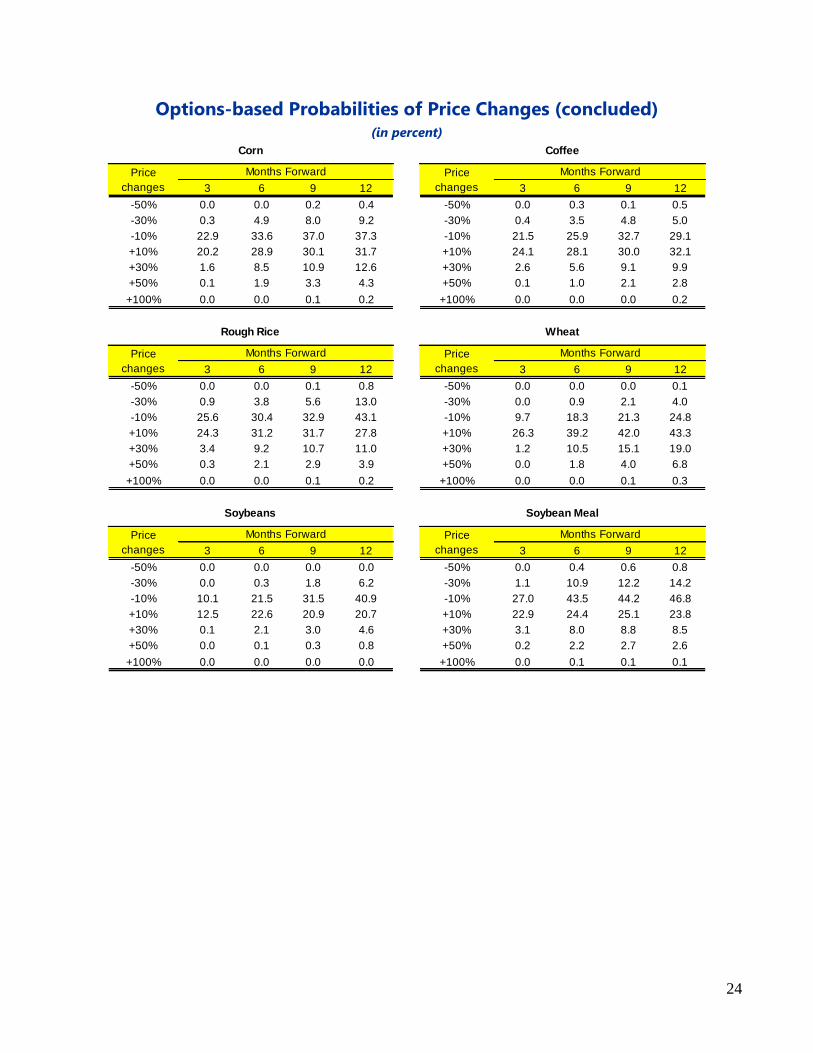
24
Options-based Probabilities of Price Changes (concluded) (in percent)
3 6 9 12 3 6 9 12
-50% 0.0 0.0 0.2 0.4 -50% 0.0 0.3 0.1 0.5
-30% 0.3 4.9 8.0 9.2 -30% 0.4 3.5 4.8 5.0
-10% 22.9 33.6 37.0 37.3 -10% 21.5 25.9 32.7 29.1
+10% 20.2 28.9 30.1 31.7 +10% 24.1 28.1 30.0 32.1
+30% 1.6 8.5 10.9 12.6 +30% 2.6 5.6 9.1 9.9
+50% 0.1 1.9 3.3 4.3 +50% 0.1 1.0 2.1 2.8
+100% 0.0 0.0 0.1 0.2 +100% 0.0 0.0 0.0 0.2
3 6 9 12 3 6 9 12
-50% 0.0 0.0 0.1 0.8 -50% 0.0 0.0 0.0 0.1
-30% 0.9 3.8 5.6 13.0 -30% 0.0 0.9 2.1 4.0
-10% 25.6 30.4 32.9 43.1 -10% 9.7 18.3 21.3 24.8
+10% 24.3 31.2 31.7 27.8 +10% 26.3 39.2 42.0 43.3
+30% 3.4 9.2 10.7 11.0 +30% 1.2 10.5 15.1 19.0
+50% 0.3 2.1 2.9 3.9 +50% 0.0 1.8 4.0 6.8
+100% 0.0 0.0 0.1 0.2 +100% 0.0 0.0 0.1 0.3
3 6 9 12 3 6 9 12
-50% 0.0 0.0 0.0 0.0 -50% 0.0 0.4 0.6 0.8
-30% 0.0 0.3 1.8 6.2 -30% 1.1 10.9 12.2 14.2
-10% 10.1 21.5 31.5 40.9 -10% 27.0 43.5 44.2 46.8
+10% 12.5 22.6 20.9 20.7 +10% 22.9 24.4 25.1 23.8
+30% 0.1 2.1 3.0 4.6 +30% 3.1 8.0 8.8 8.5
+50% 0.0 0.1 0.3 0.8 +50% 0.2 2.2 2.7 2.6
+100% 0.0 0.0 0.0 0.0 +100% 0.0 0.1 0.1 0.1
Soybeans Soybean Meal
Price
changes
Months Forward Price
changes
Months Forward
Rough Rice Wheat
Price
changes
Months Forward Price
changes
Months Forward
Corn Coffee
Price
changes
Months Forward Price
changes
Months Forward
25
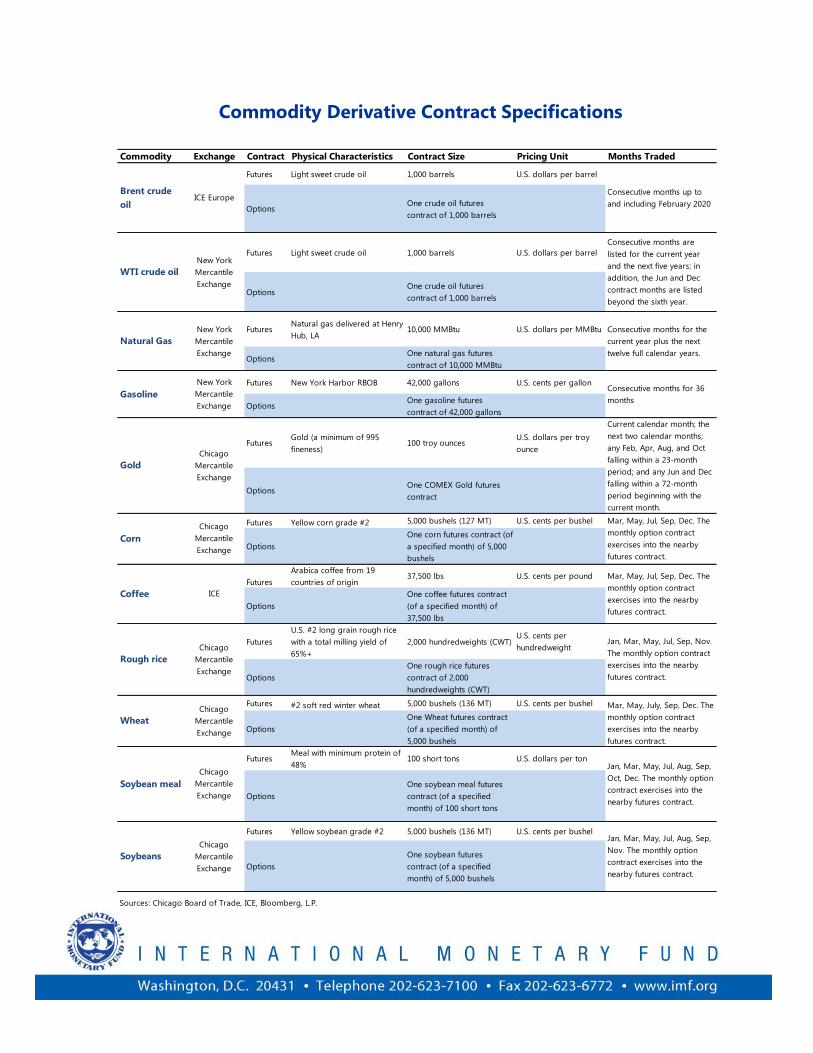
Commodity Exchange Contract Physical Characteristics Contract Size Pricing Unit Months Traded
Futures Light sweet crude oil 1,000 barrels U.S. dollars per barrel
OptionsOne crude oil futures
contract of 1,000 barrels
Futures Light sweet crude oil 1,000 barrels U.S. dollars per barrel
OptionsOne crude oil futures
contract of 1,000 barrels
FuturesNatural gas delivered at Henry
Hub, LA10,000 MMBtu U.S. dollars per MMBtu
OptionsOne natural gas futures
contract of 10,000 MMBtu
Futures New York Harbor RBOB 42,000 gallons U.S. cents per gallon
OptionsOne gasoline futures
contract of 42,000 gallons
FuturesGold (a minimum of 995
fineness)100 troy ounces
U.S. dollars per troy
ounce
OptionsOne COMEX Gold futures
contract
Futures Yellow corn grade #2 5,000 bushels (127 MT) U.S. cents per bushel
Options
One corn futures contract (of
a specified month) of 5,000
bushels
Futures
Arabica coffee from 19
countries of origin37,500 lbs U.S. cents per pound
Options
One coffee futures contract
(of a specified month) of
37,500 lbs
Futures
U.S. #2 long grain rough rice
with a total milling yield of
65%+
2,000 hundredweights (CWT)U.S. cents per
hundredweight
Options
One rough rice futures
contract of 2,000
hundredweights (CWT)
Futures #2 soft red winter wheat 5,000 bushels (136 MT) U.S. cents per bushel
Options
One Wheat futures contract
(of a specified month) of
5,000 bushels
FuturesMeal with minimum protein of
48%100 short tons U.S. dollars per ton
Options
One soybean meal futures
contract (of a specified
month) of 100 short tons
Futures Yellow soybean grade #2 5,000 bushels (136 MT) U.S. cents per bushel
Options
One soybean futures
contract (of a specified
month) of 5,000 bushels
Sources: Chicago Board of Trade, ICE, Bloomberg, L.P.
Current calendar month; the
next two calendar months;
any Feb, Apr, Aug, and Oct
falling within a 23-month
period; and any Jun and Dec
falling within a 72-month
period beginning with the
current month.
Consecutive months up to
and including February 2020
WTI crude oil
Consecutive months are
listed for the current year
and the next five years; in
addition, the Jun and Dec
contract months are listed
beyond the sixth year.
Gasoline
Consecutive months for the
current year plus the next
twelve full calendar years.
Consecutive months for 36
months
Brent crude
oil
Natural Gas
ICE Europe
New York
Mercantile
Exchange
New York
Mercantile
Exchange
New York
Mercantile
Exchange
Corn
Wheat
Soybeans
Gold
Chicago
Mercantile
Exchange
Coffee
Rough rice
Soybean meal
Chicago
Mercantile
Exchange
ICE
Chicago
Mercantile
Exchange
Chicago
Mercantile
Exchange
Chicago
Mercantile
Exchange
Chicago
Mercantile
Exchange
Jan, Mar, May, Jul, Aug, Sep,
Nov. The monthly option
contract exercises into the
nearby futures contract.
Mar, May, Jul, Sep, Dec. The
monthly option contract
exercises into the nearby
futures contract.
Mar, May, Jul, Sep, Dec. The
monthly option contract
exercises into the nearby
futures contract.
Jan, Mar, May, Jul, Sep, Nov.
The monthly option contract
exercises into the nearby
futures contract.
Mar, May, July, Sep, Dec. The
monthly option contract
exercises into the nearby
futures contract.
Jan, Mar, May, Jul, Aug, Sep,
Oct, Dec. The monthly option
contract exercises into the
nearby futures contract.
Commodity Derivative Contract Specifications