COMMITTING TO INCLUSIVE GROWTH - Brookings … · COMMITTING TO INCLUSIVE GROWTH 4 N ashville is...
56
RYAN DONAHUE, BRAD MCDEARMAN, AND RACHEL BARKER September 2017 COMMITTING TO INCLUSIVE GROWTH Lessons for metro areas from the Inclusive Economic Development Lab
-
Upload
truongtuong -
Category
Documents
-
view
216 -
download
0
Transcript of COMMITTING TO INCLUSIVE GROWTH - Brookings … · COMMITTING TO INCLUSIVE GROWTH 4 N ashville is...

RYAN DONAHUE, BRAD MCDEARMAN, AND RACHEL BARKER
September 2017
COMMITTING TO INCLUSIVE GROWTH Lessons for metro areas from the Inclusive Economic Development Lab

COMMITTING TO INCLUSIVE GROWTH 2
EXECUTIVE SUMMARY
As U.S. cities and metropolitan areas struggle to generate inclusive
growth, regional economic development leaders can play a significant
role in shaping policies and programs that expand equality of
opportunity in their communities. Building on a companion report, “Opportunity
for growth: How reducing barriers to economic inclusion can benefit workers”,
firms, and local economies, this paper describes how economic development
leaders can begin to approach that goal. Many of these lessons stem from
Brookings’ Inclusive Economic Development Lab, a six-month process in which
Brookings worked with regional economic development organizations (EDOs)
in Indianapolis, Nashville, and San Diego to explore how these groups can
contribute to more inclusive economic outcomes. This paper summarizes that
process and its findings.
Inclusive growth is an increasingly urgent local priority. The problem is accelerating as more of the population—by one measure up to half of one region’s families—is pushed into precarious economic positions. The challenges range from shifts in local industry structure, to insufficient access to transit, to a lack of affordable housing that makes it difficult to access jobs and sustain livelihoods, and to the increasing price of education that poses a potent challenge to boosting mobility. These dynamics inhibit individual opportunity, harm businesses, and hinder regional growth. Besides the moral imperative to ensure equality of opportunity, therefore, firms and the economic development community face a growing business-driven imperative to ensure that people in their communities have the chance to succeed.
Regional EDOs have a significant role to play in promoting inclusive growth. Because of the business community’s role in shaping the labor market and a geographical scope that aligns with the regional economy, regional EDOs have powerful–but largely untapped–potential to apply new energy, resources, and perspectives to shape discussions and spark action to address inclusive growth.

COMMITTING TO INCLUSIVE GROWTH 3
Meaningful action will require continuing an evolution in the field and reconciling various stakeholders’ demands. Leading EDOs are shifting from a focus dominated by business attraction and marketing, which has failed to create broad-based prosperity, to prioritizing long-term investments in innovation, skills, and traded-sector assets. To foster inclusive growth, they must invest in these drive¬rs of competitiveness while simultaneously finding ways to extend opportunity to more of the population. As they redefine their role to embrace both, EDOs face competing pressures from firms, elected leaders, community and workforce development officials, and others inside and outside the organization–some of which advocate for entrenched interests while others push for dramatic transformation.
Stepping back and making the case that inclusive growth is fundamentally an economic development issue can be an effective precursor to strategy development. With little experience in many dimensions of inclusive growth and given the overwhelming nature of the problem, EDOs will struggle to develop effective and sustainable responses without first creating a compelling narrative that convinces key stakeholders that inclusive growth matters to their bottom line and that market-oriented solutions exist. The Inclusive Economic Development Lab led EDOs through a process to de-mystify the problem and develop a response that involved examining populations excluded from prosperity, the barriers they face, the costs of that exclusion, and how the EDOs’ tools could be applied to seek solutions. The process offers a model for how EDOs can develop an understanding of the problem and how it relates to their growth mission, deepen local partnerships, lay the groundwork for necessary institutional change, and ultimately better position their efforts for success.
EDOs can intervene in many ways, but need to strategically target efforts to match their strengths and resources. Staking an institutional position on inclusive growth will require weighing the EDOs’ strengths, capabilities, and purpose against the magnitude of the problem and the many pressures from stakeholders. They can deploy or re-fashion efforts in the broad areas of practice (e.g., expanding access to business networks and better targeting programs that help companies), policy (e.g., advocating for new investments in transit and affordable housing), and partnership (e.g., using their convening power to unite and educate leaders across sectors and communities). However, EDOs should take a strategic approach, considering how to link and collaborate with existing efforts in the region (especially in the areas of community and workforce development), the groups’ own competencies, and the potential for the greatest impact in the absence of major new resources.

COMMITTING TO INCLUSIVE GROWTH 4
Nashville is the leading economic success story of the new South, held
up by most other mid-sized U.S. metro areas as an aspirational example
of what successful economic development looks like. Beginning in the
late 1990s, the city pulled ahead of a pack of sprawling southern cities, fueled
by its specialization in professional and health care services. Newly-acquired
professional sports teams and a growing music scene gave the city the varnish
of big-city success. Growth skyrocketed, churning out jobs and turning the city
into a magnet for skilled workers. Forbes recently ranked it as the top metro
area–by far–for creating high-wage professional services jobs.1 Unemployment
is below the national average for every racial group. Today, cranes dot the
downtown, old neighborhoods are quickly being redeveloped with high-end
housing and retail, and Nashville hot chicken and country music are the
province of hipsters around the country.
But that’s only one side of the story. Amid this unprecedented boom, earnings
for the average worker fell by nearly 2 percent from 2010-2015–a larger decline
than the U.S. overall–and half the region’s families still earn less than $50,000
a year. Runaway growth in downtown and newly upscale neighborhoods like
Germantown exists alongside stagnation in parts of adjacent neighborhoods
like historically African American North Nashville.2 For a city that served as
an epicenter of civil rights-era activism, race remains a clear dividing line for
economic success. Criminal records, underperforming schools, and multi-
generational poverty all keep a significant share of residents from participating
in the Music City’s boom and contribute to the fact that Davidson County, at
the core of the region, is one of the hardest places in the country for a poor
person to ascend to the middle class.3 Moreover, while current residents in these
neighborhoods are isolated from the benefits of growth, they are battered by
its downsides: Nashville’s boom created an affordable housing crisis pushing
low-income residents into outlying, car-dependent suburban communities. As a
result, in the first decade of the 2000s, the number of distressed neighborhoods
in the suburbs rose five-fold.
COMMITTING TO INCLUSIVE GROWTH 5
INTRODUCTION
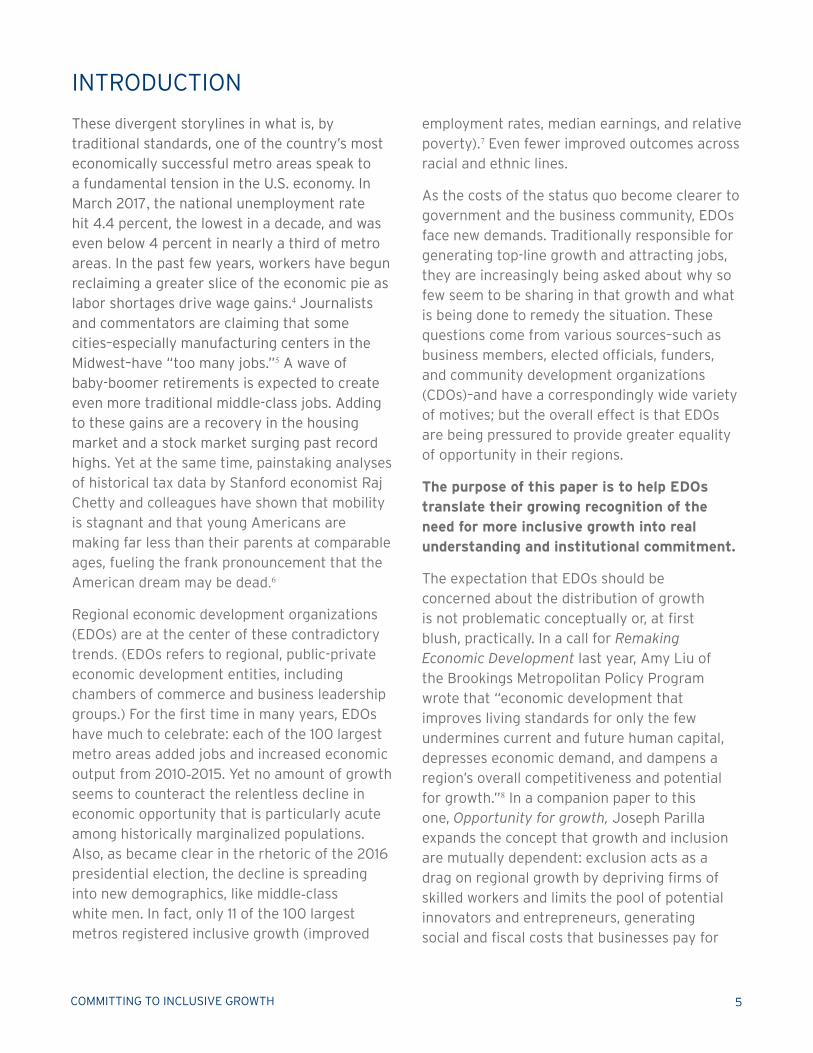
These divergent storylines in what is, by traditional standards, one of the country’s most economically successful metro areas speak to a fundamental tension in the U.S. economy. In March 2017, the national unemployment rate hit 4.4 percent, the lowest in a decade, and was even below 4 percent in nearly a third of metro areas. In the past few years, workers have begun reclaiming a greater slice of the economic pie as labor shortages drive wage gains.4 Journalists and commentators are claiming that some cities–especially manufacturing centers in the Midwest–have “too many jobs.”5 A wave of baby-boomer retirements is expected to create even more traditional middle-class jobs. Adding to these gains are a recovery in the housing market and a stock market surging past record highs. Yet at the same time, painstaking analyses of historical tax data by Stanford economist Raj Chetty and colleagues have shown that mobility is stagnant and that young Americans are making far less than their parents at comparable ages, fueling the frank pronouncement that the American dream may be dead.6
Regional economic development organizations (EDOs) are at the center of these contradictory trends. (EDOs refers to regional, public-private economic development entities, including chambers of commerce and business leadership groups.) For the first time in many years, EDOs have much to celebrate: each of the 100 largest metro areas added jobs and increased economic output from 2010-2015. Yet no amount of growth seems to counteract the relentless decline in economic opportunity that is particularly acute among historically marginalized populations. Also, as became clear in the rhetoric of the 2016 presidential election, the decline is spreading into new demographics, like middle-class white men. In fact, only 11 of the 100 largest metros registered inclusive growth (improved
employment rates, median earnings, and relative poverty).7 Even fewer improved outcomes across racial and ethnic lines.
As the costs of the status quo become clearer to government and the business community, EDOs face new demands. Traditionally responsible for generating top-line growth and attracting jobs, they are increasingly being asked about why so few seem to be sharing in that growth and what is being done to remedy the situation. These questions come from various sources–such as business members, elected officials, funders, and community development organizations (CDOs)–and have a correspondingly wide variety of motives; but the overall effect is that EDOs are being pressured to provide greater equality of opportunity in their regions.
The purpose of this paper is to help EDOs translate their growing recognition of the need for more inclusive growth into real understanding and institutional commitment.
The expectation that EDOs should be concerned about the distribution of growth is not problematic conceptually or, at first blush, practically. In a call for Remaking Economic Development last year, Amy Liu of the Brookings Metropolitan Policy Program wrote that “economic development that improves living standards for only the few undermines current and future human capital, depresses economic demand, and dampens a region’s overall competitiveness and potential for growth.”8 In a companion paper to this one, Opportunity for growth, Joseph Parilla expands the concept that growth and inclusion are mutually dependent: exclusion acts as a drag on regional growth by depriving firms of skilled workers and limits the pool of potential innovators and entrepreneurs, generating social and fiscal costs that businesses pay for

COMMITTING TO INCLUSIVE GROWTH 6
A framework for inclusive growth
Dynamism Skills Access
Practice Support entrepreneurs and business acceleration services (productivity, exports, worker training)
Motivate employers to invest in workers
Help employers determine the skills they need
Promote physically accessible locations
Policy Streamline permit processes and regulations
Occupational licensing
Promote pre K-12 education and workforce development
Help eliminate other work barriers (e.g., childcare, criminal records etc.)
Promote helpful land use and zoning reforms
Support transit investments
Partnership Coordinate firms with accelerators/incubators, cluster groups and extension partnerships
Provide sector-based training partnerships
Provide work-based learning opportunities for youth
Place-conscious strategies with community development organizations, metropolitan planning organizations, and transportation agencies
directly and indirectly, and creating conditions for social unrest. Yet building inclusive growth is becoming more difficult due to disruptive forces, especially globalization and automation, which will accelerate in coming years. Therefore, Parilla argues that, to remain competitive, regions must focus more on providing all residents with access to opportunity. Strategies for doing so involve supporting new and expanding firms that produce opportunity-sustaining growth, dismantling barriers that prevent people from attaining skills, and ensuring they can physically access jobs. EDOs can address each of these with their current tools (categorized as partnership, policy, and practice).
While the logic laid out in the papers by Liu and Parilla dictates that economic inclusion and economic growth are increasingly interdependent, that logic belies the difficulties that EDOs face in shifting long-established practices and reshaping their role to truly prioritize inclusive growth. Even as calls for EDOs to understand and respond to inclusive
growth have grown too loud to ignore, most are still stuck, unsure how to respond or even talk about the subject.
This can be uncomfortable, or at least uncertain, territory for EDOs. It means they must grapple with deeply-entrenched problems often far outside their existing portfolios and skill-sets. Also, they must deal with different constituencies that have long-standing commitments to these problems, and often have tangential or strained relationships with EDOs and businesses. Further, they need to resolve many competing pressures in their organizations at a time when resources are limited. These organizations are designed around the function of selling their regions to companies which might locate there, which makes it difficult to publicly acknowledge problems. And although frameworks like Brookings’ Metro Monitor define the outcomes that characterize inclusive growth (“a process that encourages robust long-run growth by improving the productivity of individuals and firms in order to raise local
COMMITTING TO INCLUSIVE GROWTH 7
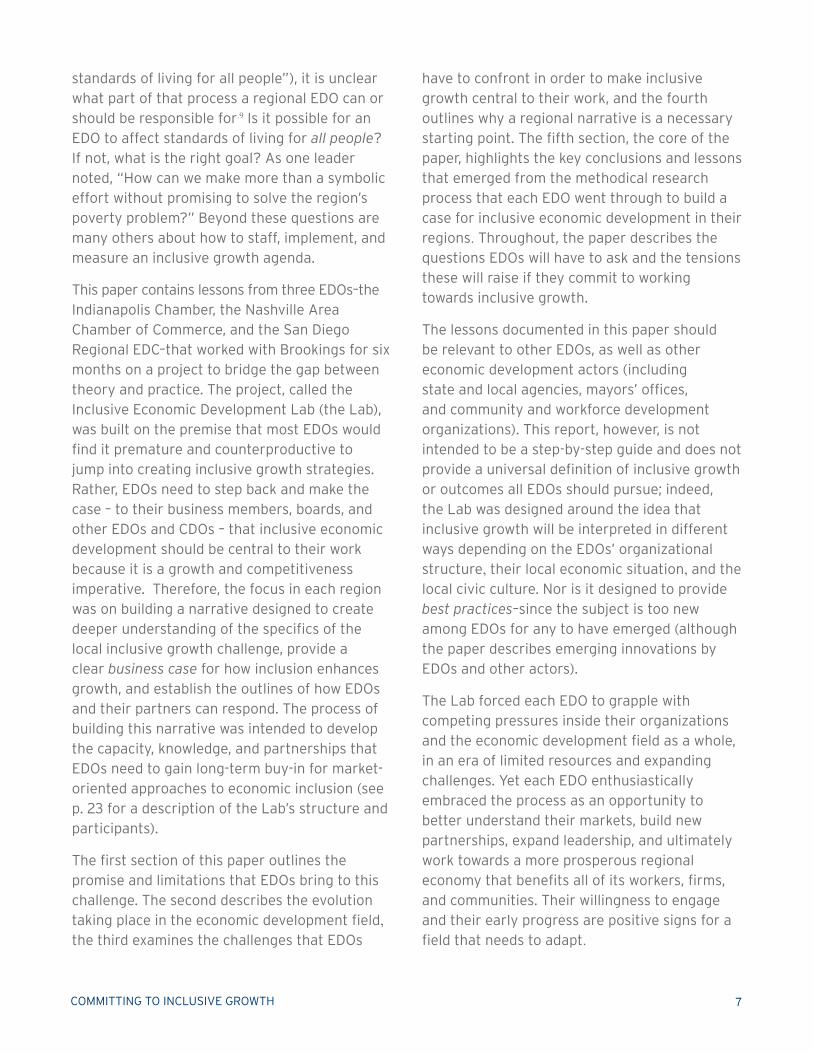
standards of living for all people”), it is unclear what part of that process a regional EDO can or should be responsible for.9 Is it possible for an EDO to affect standards of living for all people? If not, what is the right goal? As one leader noted, “How can we make more than a symbolic effort without promising to solve the region’s poverty problem?” Beyond these questions are many others about how to staff, implement, and measure an inclusive growth agenda.
This paper contains lessons from three EDOs–the Indianapolis Chamber, the Nashville Area Chamber of Commerce, and the San Diego Regional EDC–that worked with Brookings for six months on a project to bridge the gap between theory and practice. The project, called the Inclusive Economic Development Lab (the Lab), was built on the premise that most EDOs would find it premature and counterproductive to jump into creating inclusive growth strategies. Rather, EDOs need to step back and make the case – to their business members, boards, and other EDOs and CDOs – that inclusive economic development should be central to their work because it is a growth and competitiveness imperative. Therefore, the focus in each region was on building a narrative designed to create deeper understanding of the specifics of the local inclusive growth challenge, provide a clear business case for how inclusion enhances growth, and establish the outlines of how EDOs and their partners can respond. The process of building this narrative was intended to develop the capacity, knowledge, and partnerships that EDOs need to gain long-term buy-in for market-oriented approaches to economic inclusion (see p. 23 for a description of the Lab’s structure and participants).
The first section of this paper outlines the promise and limitations that EDOs bring to this challenge. The second describes the evolution taking place in the economic development field, the third examines the challenges that EDOs
have to confront in order to make inclusive growth central to their work, and the fourth outlines why a regional narrative is a necessary starting point. The fifth section, the core of the paper, highlights the key conclusions and lessons that emerged from the methodical research process that each EDO went through to build a case for inclusive economic development in their regions. Throughout, the paper describes the questions EDOs will have to ask and the tensions these will raise if they commit to working towards inclusive growth.
The lessons documented in this paper should be relevant to other EDOs, as well as other economic development actors (including state and local agencies, mayors’ offices, and community and workforce development organizations). This report, however, is not intended to be a step-by-step guide and does not provide a universal definition of inclusive growth or outcomes all EDOs should pursue; indeed, the Lab was designed around the idea that inclusive growth will be interpreted in different ways depending on the EDOs’ organizational structure, their local economic situation, and the local civic culture. Nor is it designed to provide best practices–since the subject is too new among EDOs for any to have emerged (although the paper describes emerging innovations by EDOs and other actors).
The Lab forced each EDO to grapple with competing pressures inside their organizations and the economic development field as a whole, in an era of limited resources and expanding challenges. Yet each EDO enthusiastically embraced the process as an opportunity to better understand their markets, build new partnerships, expand leadership, and ultimately work towards a more prosperous regional economy that benefits all of its workers, firms, and communities. Their willingness to engage and their early progress are positive signs for a field that needs to adapt.

COMMITTING TO INCLUSIVE GROWTH 8
“EDOs need to step back
and make the case – to their
business members, boards,
and other EDOs and CDOs
– that inclusive economic
development should be
central to their work
because it is a growth and
competitiveness imperative.”

COMMITTING TO INCLUSIVE GROWTH 9
THREE VERSIONS OF ONE PROBLEM
The inclusive growth challenge in any metro area is a reflection of disruptive mega-trends that extend beyond municipal or even regional boundaries: globalization’s role in increasing competitive pressures on firms, technology’s promise to alter the nature of work and displace middle skill jobs, an impending majority-minority population historically disconnected from economic opportunity, and the tendency of high-value economic activity to cluster in a few regions (and often in their urban centers). Collectively, these trends are driving a wedge between the haves and have-nots in every region. The three EDOs that participated in this project were chosen partly because their regions provide different manifestations of these trends. Nashville, as described previously, illustrates how even in a booming Sun Belt region, a large and growing number of people are excluded from the gains of growth.
One of the mid-sized, slower-growth U.S. regions that Brookings describes as American Middleweights, Indianapolis sees itself straddling the line between the Sun Belt and Rust Belt. In recent years, the downtown core has filled with high-end apartments, farm-to-table restaurants, and tech jobs crowned by the newly-renamed Salesforce Tower. Among the 20 metro areas that added the most tech jobs from 2013-2015, Indianapolis trailed only the boomtowns of Denver and Charlotte in its growth rate.10 Yet, like many Midwestern metro areas, the transformation from a manufacturing-based economy to one driven by talent and innovation has been
far from seamless: 30,000 manufacturing jobs were lost in recent decades, more than any metro area except Cleveland and Detroit. (And this was before Carrier, the air conditioner manufacturer, decided to downsize in the region, sparking headlines and tweets from then-President-elect Donald Trump). These lost manufacturing jobs, 90 percent of which were in the region’s urban core, have largely been replaced by jobs in the transportation and logistics industries. But these jobs pay just over half as much, on average, and tend to be located far from where potential employees live. As a result, poverty has skyrocketed by 80 percent in metro Indianapolis since the early 2000s, spreading into inner-ring suburbs.11 Meanwhile, the region’s merged city and county—a victory for regionalism several decades ago—is facing a financial squeeze, partly due to the flight of high-income families to the suburbs. This means major challenges for the regional economy, but as one leader said, it remains difficult to build consensus around the fact that “as goes Indy, so goes the region.”
San Diego got a several-decades head start over most cities in building an innovation-driven economy. Its ocean-side Torrey Pines Mesa is home to the Salk Institute, the University of California-San Diego, and various firms and research institutions that helped put the region at the center of innovation in genomics, cellular technology, and defense applications. In 2015, Indianapolis-headquartered Eli Lilly announced it would double the size of its

COMMITTING TO INCLUSIVE GROWTH 10
EXAMPLE SLIDE FROM METRO NARRATIVES
R&D center in San Diego, due to the region’s density of life sciences research and talent. Jobs in these advanced industries, which offer good opportunities to people of all skill levels, are partly responsible for the region’s relatively high levels of inter-generational mobility.12 Yet high-tech San Diego is still inaccessible to many, particularly Hispanic and black communities concentrated south of the “8” expressway that bisects the region. The dominant attitude in these neighborhoods is less “I need to raise venture capital” than “I need to raise a paycheck,” according to one business leader. Further, growth generated by these industries, coupled with local
opposition to new housing, has vastly increased costs (the median home price is $525,000), squeezing all but the wealthiest residents and making it difficult for firms to attract and retain even mid-level employees with solid six-figure salaries. There is growing recognition that these cost pressures need to be addressed, and that traditionally excluded populations need to be trained to join the innovation economy, if the region is to avoid the workforce shortages that bedevil places like Silicon Valley and ultimately remain prosperous as it becomes majority-minority.
A two-sided economy in Indianapolis

COMMITTING TO INCLUSIVE GROWTH 11
I. WHY REGIONAL EDOs
Much has been written about why the economic development field needs to change, and how it might do so.13 But the field is not monolithic or even a tight-knit group of actors with closely-aligned incentives. Rather, in any region, economic development is the concern of many different, overlapping organizations with varying (and sometimes contradictory) tools, responsibilities, and philosophies, and which work at the state, region, county, and city levels. Also part of the mix are government agencies, public-private entities, and privately-funded business groups. Beyond these core actors, there is a constellation of other entities that deal with related issues, such as industry associations, entrepreneurship groups, planning and housing authorities, universities and community colleges, and more. Further, as the economic development field begins to focus on inclusion, they are entering the orbit of other local organizations that, as Parilla writes in Opportunity for growth, are “driven by different cultures and politics, pursue distinct goals, and respond to non-overlapping metrics”.
Because of its complex structure, broad prescriptions about how the field needs to change will not likely translate to sustained, meaningful change in any particular organization: rather, each actor will need to change independently, through a process that considers its particular “structure, mandate, and role within a network of other stakeholders”.14 This paper focuses on describing how one type of entity–regional, public-private EDOs and chambers of commerce–can approach this process.
Why, given the breadth of the field, do these organizations merit particular attention? Regional EDOs occupy a unique position within the economic development field. Their geographic scope aligns with the need for solutions that match the regional scale of
labor markets. They are recognized as thought leaders that can set a regional agenda and goals that influence the work and funding of other organizations and initiatives. They maintain a wide web of relationships across regions and between otherwise separate entities. They bring a growth agenda to debates that have largely revolved around different ways to divide up a fixed pie. Their connection to businesses, both in and out of the market, gives them a unique perspective on how the private sector views the issues and the ability to bring firms to the table in ways that most other organizations cannot.
This is not to suggest that EDOs can unilaterally affect economic dynamics, especially the structural forces that widen inequality and reduce opportunity. Indeed, there is no conclusive evidence that EDOs can influence a firm’s decisions or organize the collective action required to shift these structural economic trends. One reason they are limited is that they operate within confines set by other actors, including federal and state governments. And, while the devolution of policymaking at the federal level has created new optimism and energy behind locally-led solutions, it also promises to strain existing fiscal and governing models. States continue to control significant policies at the local level, particularly in areas without home rule powers. These structural challenges are just the beginning. As this paper describes, EDOs face many institutional barriers–some of their own making–that threaten their ability to effectively translate their authority and capacity into solutions for inclusive growth.
If, however, these organizations can determine how to work within these constraints and overcome these barriers, it would represent a new infusion of resources and different perspectives to what is arguably the defining economic and social challenge facing cities and regions.

COMMITTING TO INCLUSIVE GROWTH 12
“If, however, these
organizations can determine
how to work within these
constraints and overcome
these barriers, it would
represent a new infusion
of resources and different
perspectives to what is
arguably the defining
economic and social challenge
facing cities and regions.”

COMMITTING TO INCLUSIVE GROWTH 13
LESSONS FROM THE LAB: WHO IS PUSHING WHOM TO ENGAGE IN INCLUSIVE GROWTH?
This paper notes that EDOs are pressured by leaders from many different sectors in their regions–business, government, academic, and civic organizations–to do something about inclusive growth. Yet it also argues that to move forward, EDOs need to first convince these leaders that inclusive growth is an economic development issue. Are EDOs playing catch-up, and finally responding to a set of consistent and clearly-articulated demands from stakeholders to deal with inclusion? Or are they visionaries at the leading edge of the cause? How can both be true?
The answer is that not everyone within these broad sectors is uniformly aware of the issue or convinced that there is a role for EDOs to play in addressing it. There may be a small number of influential leaders in a given sector that believe both of these things, but they do not necessarily represent the current understanding or position of the majority of their peers. The business community may include both the most active proponents of EDO involvement in inclusive growth (typically large and well-resourced firms) as well as the greatest skeptics. Therefore, while pressure to engage may be exerted by certain representatives of the business community, the case for action must ultimately be made to skeptical and ambivalent actors also within the business community. Similar dynamics exist on boards: a single influential board member
may be the primary force of the EDO’s engagement, while other members may sound the loudest alarms about the EDO’s ability to tackle these issues without diluting its main growth-oriented mission. Thus an EDO can both be pushed by, and have to push its board to act.
There is a second way in which EDOs can seem to be simultaneously playing catch-up and leading the charge. Compared to any one sector or organization that has a strong view or existing initiatives (especially community and workforce development organizations), an EDO will take an exploratory approach and be open to taking input and guidance from these organizations. Often, however, these other actors have different motivations, incentives, and perspectives, even if the term “inclusive growth” has given them a shared vocabulary. Thus, while EDOs avoid taking bold positions in areas where these actors might disagree, they may still play an important leadership role. As the collaborator general, an EDO can lead on building bridges between organizations, identifying areas of common interest, and offering a broader vision for the region.
The challenge for the EDO is to carefully deconstruct these various demands and build a single, unified framework for understanding and addressing the issue that spans divisions within and between business, civic, and political actors.

COMMITTING TO INCLUSIVE GROWTH 14
II. AN EVOLUTION IN ECONOMIC DEVELOPMENT
As EDOs begin to shift their sights towards inclusive growth, they are simultaneously wrestling with a broader set of dynamics that challenge their traditional practices and threaten their relevance. Inclusive growth is a complicated concept in its own right, but the underlying reason that EDOs are struggling to respond is that the economic development field as a whole is being disrupted by forces that are increasing the pressure to act while decreasing the efficacy of their current practices.
The disruption
For the last decade, the declining viability of business attraction–one of the core tenets of traditional economic development practice–has disrupted the field (including at the state and local levels). Relocations of firms were never responsible for more than a few percentage points of jobs created in any state or region. But the number of major corporate expansions and relocations–the lifeblood of most EDOs–declined by 50 percent from 2000-2012, according to Conway Data. The projects in EDOs’ pipelines are now smaller than they used to be: 72 percent of net growth from 2009-2014 came from firms that, on average, expanded from 10 to 30 employees over that five-year period.16 Mergers and acquisitions are more common than greenfield investments: more than three-quarters of industries have become more concentrated over the past 20 years.17 (This has also reduced the number of home-grown Fortune 500 firms that often support the work of EDOs.) And expansions now often occur with few or no added jobs: due to automation, $1 million in manufacturing output required 25 jobs in 1980 but only five jobs in 2015.18 Further, start-ups are not filling the void: the rate at which they are created and the share that quickly achieve meaningful scale has declined significantly over the past few
decades. Together, these trends are making it more and more difficult for EDOs to keep pace with the “job creation” targets that they have traditionally used to explain and measure their impact.
The response
Some regions have responded by doubling down on marketing and incentives. With very few exceptions, this is not working. Because fewer firms do major relocations, these places are providing larger incentives for fewer or lower-quality jobs. Amazon is the most prominent symbol of this trend. According to the non-profit research group Good Jobs First, Amazon has received about $250 million in incentives (largely state and county) since the start of 2015.19 For these places, an economic development win looks like the Amazon warehouse in Whitestown, Ind., 25 miles from downtown Indianapolis. In return for the 1,200 jobs brought by this development–at the time one of Amazon’s largest–the company collected over $5 million in incentives from 2009-2011 (not including massive public investment in infrastructure for the site).
Though many regions and states, especially those in desperate circumstances, argue they have to compete aggressively for these facilities (EDOs in the Indianapolis region were pressured to replace lost manufacturing jobs), this is increasingly regarded as a low-road strategy. EDOs often subsidize the developments despite the fact that Amazon’s strategy requires it to locate warehouses near every major metropolitan area, regardless of tax breaks. (Typically a state or local government provides the incentive, but regional EDOs spend a lot of time coordinating this activity.) Further, warehouse jobs create few spillovers that typically justify incentives, pay low wages, and

COMMITTING TO INCLUSIVE GROWTH 15
their usual location—in the exurban outskirts of a city—make them largely inaccessible to car-less urban workers. EDOs face the challenge of squaring what looks like a traditional business-attraction win with a new set of concerns: do these jobs pay middle-class wages? Do they offer a path for upward mobility? Are they accessible for workers without cars? Do they displace existing retail jobs?
This critique is gaining resonance. For more EDOs, a win now resembles a much different version of Amazon–this time, 25 miles from downtown San Diego, where no incentives were necessary to attract the newest outpost of Amazon Game Studios, a video game development outfit created in 2014 designed to complement the firm’s multi-billion dollar cloud computing business. In this case, Amazon was drawn by the depth of talent in the region’s video game cluster: the first hire was a veteran of Sony’s local operation who had since created several startups, and at the time this paper was written there were more than a dozen job openings at the location for senior engineers and programmers. Every region is trying to grow creative, digital, R&D
and STEM-intensive advanced industries like these that emerge organically from–and, in turn, reinforce–unique concentrations of high-end talent. EDOs increasingly aim to do so not through transactional deal-making, but by creating conditions that are naturally conducive to high-quality growth. This approach involves making long-term investments in innovation, skills, and infrastructure that matter to traded sector industries–and redefining success to include, or even prioritize, the competiveness of existing firms.
This is a positive trend. As Amy Liu wrote, the economic development field is “most effective when it focuses on improving the shared assets that support clusters and advanced industries, rather than providing subsidies… to individual firms.” She added that, although this approach emphasizes high-end skills, it does not come at the expense of the less educated: half of these jobs do not require a four-year degree, and they offer a significant wage premium at every education level.20 Further, these industries generate considerable multiplier effects that create jobs in other sectors.
EXAMPLE SLIDE FROM METRO NARRATIVES
San Diego Regional EDC’s shifting priorities
Shifting economy has caused a strategic shift in economic development priorities
Business Attraction
Other
Business Attraction
Innovation
Entrepreneurship
Workforce & Talent
Expansion & Retention
Exports & FDI

COMMITTING TO INCLUSIVE GROWTH 16
An incomplete evolution
This evolution represents real but difficult progress. It has forced EDOs to reorganize internally, revamp their marketing strategies, and change their goals and metrics. Yet it is clear that the evolution is still incomplete. Despite their efforts, EDOs are a long way from helping their regions achieve deep prosperity, defined by Liu as growth that is robust, shared, and enduring.21 Maryann Feldman and Michael Storper describe it somewhat differently: “Economic development occurs when individuals have the opportunity to actively engage and contribute to society and are likely to realize their potential.”22
Pursuing either version of Amazon–and most EDOs do both–fails to address mounting concerns about the hollowing-out of the middle class, persistent under-performance of minority populations, and decreasing labor force participation. In either case, EDOs are essentially accelerating prevailing market forces, rather than trying to shape the economy so it provides more broad-based opportunity. This calls into question why EDOs do what they do. They often pursue growth as if it is an end in itself, but most believe that the purpose of growth is, in the end, to make people’s lives better. Thus, EDOs are asking if 1,200 low-wage warehouse jobs are really a win if the workers must have two jobs (or even three) to make ends meet, or if a handful of high-end jobs at a software firm responds–even indirectly–to lost middle-wage manufacturing jobs (Indianapolis lost 30,000 since 1995 and San Diego lost 12,000 since 2000). This conundrum is amplified by the fact
that those software jobs often are not available to the local unemployed population, or even to people who live in the region at all–and the in-migration to fill these jobs further harms the populations already most squeezed by housing costs. Indeed, in many metro areas, what appears to be an evolution from low-road to high-road economic development is actually little more than a transition from firm attraction to talent attraction. The basic operating principle is still that economic development is about bringing in outside resources rather than developing from within.
As EDOs begin to confront the realization that, despite their recent evolution, their work is still only indirectly relevant to their region’s most pressing economic challenges, they also face the fact that the same trends that are increasing the scale of the exclusion problem are also rendering their traditional tools less effective. The decline in business relocation activity makes it more difficult to relocate firms to particular neighborhoods that have been excluded from growth. The decline in startups makes it harder to lift up minority populations through entrepreneurship programs. It is difficult to deliver industry-led workforce training strategies when most job creation is coming from anonymous ten- to twenty-employee firms adding just a few jobs at a time. Delivering real gains in equality of opportunity will therefore require more than just a new strategy built on the same foundation, or new ways to deploy existing tools. Rather, it will demand a continued evolution that is more systemic and challenging than the one that many EDOs have undergone in recent years.

COMMITTING TO INCLUSIVE GROWTH 17
III. CONTINUING THE EVOLUTION: THE CHALLENGES EDOs MUST CONFRONT
The reason very few EDOs have yet to begin the next phase of their evolution and address inclusive growth is that they will need to confront some daunting challenges. The most obvious is an information gap: Little research exists on the topic and there are few examples of interventions suitable for EDOs specifically. In Opportunity for growth, Parilla begins to address this gap by providing research and a framework for action and cites several other papers that do the same.
Even if the information gap was narrowed (which would require EDOs to complement outside research with robust local efforts), most EDOs would still be unable to move forward because they lack the organizational capacity to translate research into sustained, effective action. (Organizational capacity refers to a common understanding and vision among staff and board, established and effective partnerships, the right tools, and the resources needed to apply them at the right scale.) If an EDO tried to engage on inclusive growth without this capacity, its efforts would likely dissipate (due to lack of support) or create a few disconnected one-off programs that please certain constituencies but fail to make use of the EDO’s unique position and tools. Either outcome would damage its credibility among its partners. The following four additional challenges must therefore also be confronted, regardless of how much quality research an EDO may have at its disposal.
The first and perhaps most daunting challenge is that acknowledging the need for inclusive growth calls into question the way EDOs have defined their work. These organizations are built on a fundamental faith in market forces: it is assumed that sufficient overall growth rates will ensure broad economic inclusion, which explains why EDOs are driven by metrics like the
growth in jobs and output. To be sure, growth is crucial to inclusive growth. But the recognition that large swaths of a region’s population can be left behind, even as EDOs succeed by traditional metrics, is a recognition of a profound flaw in the traditional economic development model. To engage in inclusive growth, EDOs have to acknowledge this flaw while also defending the importance of growth. This requires questioning deeply-embedded practices and metrics that treat business success as an end in itself, determining when and how competitiveness actually delivers inclusive outcomes, and restructuring strategies accordingly. Also, it requires publicly grappling with these problems while continuing to deliver a well-honed marketing pitch. Doing so risks alienating important supporters that value and fund the organization’s traditional work.
A second challenge is that EDOs not only have to react to the inclusive growth imperative, but also understand and explain its origins and why it matters. Members and partner organizations look to EDOs not just as service providers, but also as local economic think tanks that provide a regional storyline on how the economy is changing and a framework for how non-EDO actors should shape policies and practices. Thus, they need real knowledge of global and regional economic dynamics, and how these relate to education, infrastructure, transportation, housing, and land use. But most EDOs are fundamentally oriented to promoting their region to outside investors. If they are to tackle inclusive growth, they must more deeply examine the local market (and its failings), rather than merely its competitive advantage over peer markets.
A third challenge involves reconciling complex and sometimes conflicting demands from

COMMITTING TO INCLUSIVE GROWTH 18
different stakeholders with varying motivations. Businesses, CDOs, elected officials, philanthropic foundations, and others may recognize the need to connect more people to the economy, but disagree on basic issues such as the underlying problems, how to remedy them, or how to measure success. The following examples explain the different perspectives of key actors and the role they want EDOs to play.
• Firms push EDOs to become involved in inclusive growth for one primary reason: they want there to be as many qualified workers as possible in the regional labor pool. Their objective is to avoid the higher costs of acquiring and retaining workers that arise in tight labor markets (including training and attracting talent from outside the market). They are aligned with CDOs and non-profits in treating increased labor force participation as a desired outcome, but differ sharply with them about the need for wage increases or their own ability to raise wages given competitive pressures (some firms even use the policy arms of EDOs to advocate against minimum wage hikes). They tend to think on a regional scale, have short-term horizons, and often expect results soon after a strategy is launched.
• Community development organizations see higher wages as a key objective of inclusive growth–or even the key objective. Several CDOs interviewed as part of the Lab argued that low-wage jobs were plentiful in the area, but these workers had to work two to three jobs to pay for even affordable housing or a car. Unlike firms, CDOs care little about the function of regional labor markets unless the impacts are evident within their particular jurisdiction. They expect, and are willing to invest in, long-term change, and typically want an EDO to be more emphatic about the private sector’s responsibility towards workers and the community.
• Mayors and other elected officials tend to share some parts of the firms’ and CDOs’ perspectives. They are increasingly rallying behind new strategies for affordable housing and summer jobs. Perhaps even more than firms, they have a short timeline for impact. Like CDOs, they are interested in interventions at the sub-regional level and have ambitious visions for the wide range of people who should be included. At the same time, mayors may demand that the EDO continue to deliver on its traditional role of marketing the region and attracting firms that provide visible “wins”.
Reconciling these competing demands–without resorting to scattershot programs to address each separately–is not easy. To add to the complexity, many of the actors already have ongoing initiatives, so they may be defensive about competition from an EDO–especially if the EDO’s efforts reflect a theory different from their own. This makes it easier to stay out of the fray.
Last, there is a major practical challenge. Even as EDOs are pushed to address this issue, they are still pressured to focus on top-line growth, competitiveness, and high-end jobs. EDOs aren’t expected to switch to a new focus on inclusive growth; rather, they’re expected to add it to their existing portfolio, often without any new resources. Certainly, there are win-win interventions that support both growth and inclusion, but pursuing these still requires new staff or taking resources away from existing programs that have dedicated constituencies. It is reasonable for an EDO to think that combating threats to its region’s competitiveness–such as the increasing concentration of innovative industries in a few metro areas, or growing competition from China even in advanced industries–is more than a full-time job. It is hard enough for most EDOs to make progress on building an advanced economy without having to also think about the distribution of the gains.

COMMITTING TO INCLUSIVE GROWTH 19
“But the recognition that large
swaths of a region’s population
can be left behind, even as
EDOs succeed by traditional
metrics, is a recognition of a
profound flaw in the traditional
economic development model.”
LESSONS FROM THE LAB: YAY OR NAY ON A HIGHER MINIMUM WAGE?
Boosting the minimum wage has recently won support in many cities, but the proposal can generate complicated reactions among EDOs’ stakeholders. Firms and their advocates often object to increases, arguing that higher labor costs are unsustainable and will lead to fewer jobs, potentially via automation. Non-profits and CDOs, meanwhile, point to the difficulty
for minimum-wage workers to afford housing and support their families, even before considering the impact of irregular scheduling, the rise of non-compete clauses for non-professional occupations, and other challenges. But as they engage in inclusive growth, EDOs must address these tensions and develop an institutional position.

COMMITTING TO INCLUSIVE GROWTH 20
EXAMPLE SLIDES FROM METRO NARRATIVES
IV. THE STARTING POINT: A REGIONAL NARRATIVE
Given the scale of the problem, combined with the institutional challenges and divergent expectations outlined above, EDOs rightfully aren’t sure where to begin. There is a constant temptation by both EDO staff and their funders and partners to jump to solutions. But there is a danger in acting reflexively. The causes, solutions, and institutional changes required for EDOs to effectively implement strategies are very complex; and there are few, if any, proven models or best practices for them to follow. This complexity, combined with the pressure to act, means that, according to the head of one EDO, the process “tends to become highly politicized and focused on whatever can be forced through a city council”. Thus, a logical first step is to build the case for why inclusive growth is more than a moral imperative, but also a growth and competitiveness imperative.
The purpose of the business case is to build support for fundamental, permanent behavior change within the EDO and to shift the local dialogue within the region. Building the case is not a substitute for action–it is a necessary precursor to action, designed to establish
a base of informed and committed buy-in so that when strategies are ultimately implemented, they will be aimed at the right problems, aligned with what the rest of the EDO and its key partners are doing, and have the necessary support and funding to have real long-term impact. The business case, therefore, must convince both internal and external audiences that inclusive growth is an economic development issue. (To clarify that this case would extend beyond moral arguments, some participants in the Lab referred to this as the “business case” for economic inclusion, but it might more accurately be described as the “growth case” as it is not intended to only speak to business interests.) Those who believe the EDO needs to focus solely on generating growth have to be convinced that expanding economic opportunity is a driver of growth. Those who don’t think economic exclusion is a serious problem (e.g. certain businesses, elected officials from wealthier suburbs) have to be convinced that there are significant, if indirect, costs associated with the status quo and that these costs are certain to increase. And those who believe economic exclusion is a highly local or
Educational disparities in an increasingly diverse San Diego
55% 52% 48% 46%
30%
27% 30% 32% 33%
46%
0%
10%
20%
30%
40%
50%
60%
70%
80%
90%
100%
2000 2005 2010 2016 2050
Hispanic
Two or more
Other
Hawaiian or Pacific Islander
Asian
American Indian or Alaska Native
Black
White
10
A demographic shift is on the horizon
Sources: 2000, 2010 Decennial Census; 2016 American Community Survey, 1-year estimates; Census Bureau Population Projections
2010 San Diego became a
majority minority county
13%
19%
31%
37%
33%
24% 27%
17%
8%
24%
42%
25%
12%
19%
31%
38%
12% 13%
25%
50%
0%
10%
20%
30%
40%
50%
60%
Less than high schooldiploma
High school graduate(includes equivalency)
Some college orassociate's degree
Bachelor's degree orhigher
Educational Attainment Rates, 2016
San Diego County Hispanic Black White Asian
But disparities exist in educational attainment by race & ethnicity
Source: 2016 American Community Survey, 1-year estimates
17% Latinos with a BA
or higher
19% tech jobs held
by Latinos

COMMITTING TO INCLUSIVE GROWTH 21
primarily social issue need to be convinced that there are regional, market-oriented solutions. This evidence should ultimately add up to a clear rationale for why new goals, metrics, and tools are needed across the organizations.
The business case should be embedded within a broader narrative about the region’s economic trajectory, which can take the form of a presentation or written document. The narrative should speak to outside partners as much as to internal audiences; it should draw input from other organizations working on related issues and show how their work is or could be complementary to whatever an EDO might do. This approach directly addresses the challenges that keep EDOs from fully embracing inclusive growth, as laid out in the previous section.
• It enables the EDO to defend the importance of its traditional focus on regional growth and competitiveness, while situating that work in a new context.
• It provides an opportunity to explain the broader economic forces that are reducing opportunity, which reinforces the EDO’s position as a reliable source of insight and enables it to inform other local and regional actors how and why they, too, should change their practices.
• It allows the EDO to highlight potential new roles and strategies that reconcile the divergent concerns of businesses, community advocates, and elected officials.
• It helps convince other organizations that the EDO is a sincere partner by recognizing their longstanding efforts; it also clarifies that the EDO has capacity constraints and intends to intervene only where it can be effective and complementary to existing initiatives.
Creating this narrative should be approached as a significant project in its own right, not just a symbolic effort that paves the way to develop strategies. Indeed, it took the EDOs that participated in the Lab six months of intensive work to design the narrative. Even for organizations where there is wide acceptance of the importance of inclusive growth, there remain many fundamental questions about how an EDO should engage, to what extent, and with whom. As one participant noted, the process of sorting through these questions “can be messy, non-linear, and has the potential to induce identity crises”. These identity crises stem from the fact that EDOs tend to fall under the illusion that they have meaningful control over market outcomes when they focus on facilitating prevailing trends (such as the opening of Amazon facilities in every region). This identity is hardened by the tendency of EDOs to publicly tout job-creation figures as evidence of their impact. But when confronted with the prospect of working against prevailing market trends (such as the disappearance of middle-wage jobs), EDOs must face the limits of their tools and grapple with the purpose of their work. Doing so is time-consuming, and not at all incidental to the process of building organizational capacity for addressing inclusive growth.

COMMITTING TO INCLUSIVE GROWTH 22
V. BUILDING THE CASE FOR INCLUSIVE ECONOMIC DEVELOPMENT
The rest of this report documents the six-month process that the Nashville, San Diego and Indianapolis EDOs followed to build their local narratives. The discussion is wide-ranging but ultimately reflects the Lab’s relatively narrow scope, which was organized around each EDO producing a local narrative in the form of a 30-slide presentation. Though each is built on rigorous research and designed to create a platform for developing a strategy, the
narratives should not be viewed as in-depth research documents, strategic plans, or policy analyses. Rather, they should be understood as a combination of research and storytelling designed to make the case for more inclusive growth and change key audiences’ perspective of the EDOs’ roles. Thus, the conclusions described here are sometimes more influenced by which storylines resonated most with those audiences than by a purely scientific assessment of available data.
CONFRONTING THE DIFFICULT QUESTIONS
The following is a sample of questions that swirled around the EDOs in the Lab from the beginning of the process of developing their narratives. Some involve the practicalities of developing and implementing new strategies, while others relate to the identity crisis described above.
• Who is left behind in our region? What is different now, since disparities have always existed to some extent?
• How are so many people unable to find decent jobs even as companies complain about having unfilled open positions? Is it a work ethic issue? Should companies be doing more?
• Which of the trends behind rising inequality, declining labor force participation, etc., can be addressed at the regional scale and with economic development tools?
• To what extent can EDOs shape the economy? Is it possible to counter
market trends, such as job polarization, on any meaningful scale?
• Can EDOs spur economic activity that benefits specific populations, or steer development to specific disadvantaged areas? Should a regional EDO intervene at the neighborhood level?
• What new areas can EDOs engage in that would have the most effect? Workforce training, housing, infrastructure? What other actors do this work locally and how could the EDOs’ capabilities and perspective benefit their work?
• What local policies would better connect people to growth or mitigate its downsides? What state and federal policies matter most?
• How does inclusion fit into a growth agenda? Where does inclusion directly contribute to growth, and where should it be pursued to offset the downsides of growth?
COMMITTING TO INCLUSIVE GROWTH 23
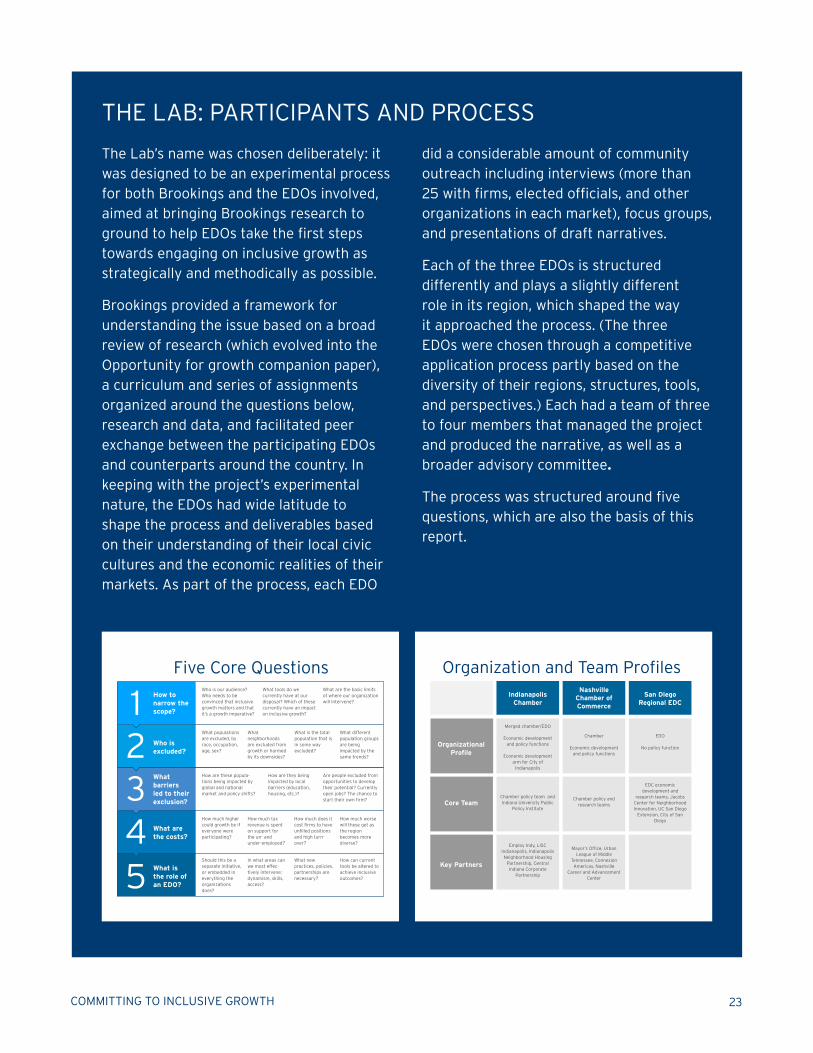
THE LAB: PARTICIPANTS AND PROCESS
The Lab’s name was chosen deliberately: it was designed to be an experimental process for both Brookings and the EDOs involved, aimed at bringing Brookings research to ground to help EDOs take the first steps towards engaging on inclusive growth as strategically and methodically as possible.
Brookings provided a framework for understanding the issue based on a broad review of research (which evolved into the Opportunity for growth companion paper), a curriculum and series of assignments organized around the questions below, research and data, and facilitated peer exchange between the participating EDOs and counterparts around the country. In keeping with the project’s experimental nature, the EDOs had wide latitude to shape the process and deliverables based on their understanding of their local civic cultures and the economic realities of their markets. As part of the process, each EDO
did a considerable amount of community outreach including interviews (more than 25 with firms, elected officials, and other organizations in each market), focus groups, and presentations of draft narratives.
Each of the three EDOs is structured differently and plays a slightly different role in its region, which shaped the way it approached the process. (The three EDOs were chosen through a competitive application process partly based on the diversity of their regions, structures, tools, and perspectives.) Each had a team of three to four members that managed the project and produced the narrative, as well as a broader advisory committee.
The process was structured around five questions, which are also the basis of this report.
12345
Five Core QuestionsHow to narrow the scope?
Who is excluded?
What barriers led to their exclusion?
What are the costs?
What is the role of an EDO?
Who is our audience? Who needs to be convinced that inclusive growth matters and that it’s a growth imperative?
What tools do we currently have at our disposal? Which of these currently have an impact on inclusive growth?
What are the basic limits of where our organization will intervene?
How are these popula-tions being impacted by global and national market and policy shifts?
How are they being impacted by local barriers (education, housing, etc.)?
Are people excluded from opportunities to develop their potential? Currently open jobs? The chance to start their own firm?
What populations are excluded, by race, occupation, age, sex?
What neighborhoods are excluded from growth or harmed by its downsides?
What is the total population that is in some way excluded?
What different population groups are being impacted by the same trends?
How much higher could growth be if everyone were participating?
How much tax revenue is spent on support for the un- and under-employed?
How much does it cost firms to have unfilled positions and high turn-over?
How much worse will these get as the region becomes more diverse?
Should this be a separate initiative, or embedded in everything the organizations does?
In what areas can we most effec-tively intervene: dynamism, skills, access?
What new practices, policies, partnerships are necessary?
How can current tools be altered to achieve inclusive outcomes?
Organization and Team Profiles
Merged chamber/EDO
Economic development and policy functions
Economic development arm for City of
Indianapolis
Chamber
Economic development and policy functions
EDO
No policy function
Chamber policy team and Indiana University Public
Policy Institute
Chamber policy and research teams
EDC economic development and
research teams, Jacobs Center for Neighborhood Innovation, UC San Diego
Extension, City of San Diego
Mayor’s Office, Urban League of Middle
Tennessee, Connexion Americas, Nashville
Career and Advancement Center
Employ Indy, LISC Indianapolis, Indianapolis Neighborhood Housing
Partnership, Central Indiana Corporate
Partnership
Organizational Profile
Indianapolis Chamber
Nashville Chamber of Commerce
San Diego Regional EDC
Core Team
Key Partners

COMMITTING TO INCLUSIVE GROWTH 24
1. How to narrow the scope?
As EDOs start to craft a compelling narrative and explore possible new roles around inclusive growth, they will inevitably be pulled in many directions by those with differing expectations of what an EDO can or should do. Therein lies one of the main challenges of this exercise: the EDO must explore a wide variety of research and engage open-mindedly with new stakeholders and perspectives, while setting realistic expectations for its involvement that remain true to its core economic development purpose. If it is to efficiently navigate this process, drive constructive dialogue, and ultimately determine how best to engage, the EDO must be clear about narrowing the scope at the outset of the process by establishing basic parameters in two key areas: (a) the EDO’s current core functions and (b) the primary audiences towards which the case will be targeted.
Confirming the EDO’s function
As an EDO begins to publicly explore how to engage on inclusive growth for the first time, it is likely to encounter three basic reactions. The first will come from those who are extremely eager for the EDO’s involvement (a more common outcome than initially expected). For example, many CDOs feel they have been working in obscurity, without the attention of,
or connections to, the business community. They may raise dozens of issues they want the EDO to tackle. A second reaction, from another set of community development and civic organizations, will be skeptical of any EDO involvement based on their perception that the EDO has been indifferent about equity in the past. Those skeptics fear that the EDO will consume a portion of their existing (and limited) organizational resources or that its corporate viewpoint is counter to community interests. They may also think the EDO simply lacks credibility on the subject. A third reaction will probably come from some board members and staff who also oppose the EDO’s involvement: they will not want the EDO to be deterred from its focus on current performance metrics or burdened by added responsibilities around such complicated issues.
This implies that an EDO must begin the process with a confident sense of its abilities and boundaries that will enable it to thoughtfully decline roles to which it isn’t well suited, regardless of demand, and argue convincingly about why it should assume roles where it can have real impact, regardless of skepticism. This requires it to undertake an early, honest self-assessment of its current economic development function (i.e., strengths, capabilities, and purpose).
Spectrums of EDO Involvement
Unemployed
Entrepreneur
Sub-neighborhood
Immediate
(0-1 year)
Awareness
Outsourced Separate Initiative Fully Integrated
Convene Coordinate/Advocacy Direct Programmatic
Medium term
(2-5 years)Long term
(6-15 years)
Neighborhood Portion (Center City/Suburb) Region
Small Middle Market Large/HQ
Underemployed, unstable Employed but stagnating wages or declining industry
Note: chart is for illustration purposes only - the content and placement of the bars will differ by EDO/region.
Excluded Population(by income percentile)
Size of Firms
Geographic Scale
Impact Timeline
Level of Involvement
Level of Adoption
0% 10% 30% 60%
COMMITTING TO INCLUSIVE GROWTH 25
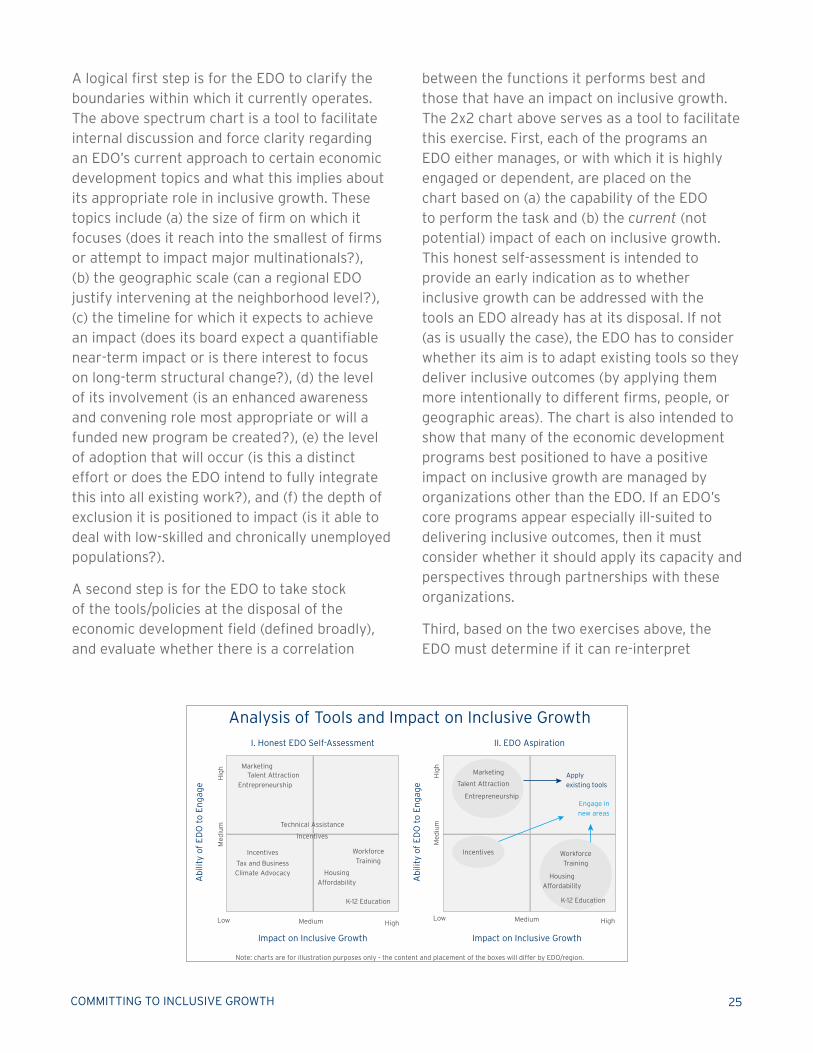
A logical first step is for the EDO to clarify the boundaries within which it currently operates. The above spectrum chart is a tool to facilitate internal discussion and force clarity regarding an EDO’s current approach to certain economic development topics and what this implies about its appropriate role in inclusive growth. These topics include (a) the size of firm on which it focuses (does it reach into the smallest of firms or attempt to impact major multinationals?), (b) the geographic scale (can a regional EDO justify intervening at the neighborhood level?), (c) the timeline for which it expects to achieve an impact (does its board expect a quantifiable near-term impact or is there interest to focus on long-term structural change?), (d) the level of its involvement (is an enhanced awareness and convening role most appropriate or will a funded new program be created?), (e) the level of adoption that will occur (is this a distinct effort or does the EDO intend to fully integrate this into all existing work?), and (f) the depth of exclusion it is positioned to impact (is it able to deal with low-skilled and chronically unemployed populations?).
A second step is for the EDO to take stock of the tools/policies at the disposal of the economic development field (defined broadly), and evaluate whether there is a correlation
between the functions it performs best and those that have an impact on inclusive growth. The 2x2 chart above serves as a tool to facilitate this exercise. First, each of the programs an EDO either manages, or with which it is highly engaged or dependent, are placed on the chart based on (a) the capability of the EDO to perform the task and (b) the current (not potential) impact of each on inclusive growth. This honest self-assessment is intended to provide an early indication as to whether inclusive growth can be addressed with the tools an EDO already has at its disposal. If not (as is usually the case), the EDO has to consider whether its aim is to adapt existing tools so they deliver inclusive outcomes (by applying them more intentionally to different firms, people, or geographic areas). The chart is also intended to show that many of the economic development programs best positioned to have a positive impact on inclusive growth are managed by organizations other than the EDO. If an EDO’s core programs appear especially ill-suited to delivering inclusive outcomes, then it must consider whether it should apply its capacity and perspectives through partnerships with these organizations.
Third, based on the two exercises above, the EDO must determine if it can re-interpret
Analysis of Tools and Impact on Inclusive Growth
I. Honest EDO Self-Assessment
Impact on Inclusive Growth Impact on Inclusive Growth
Ab
ility
of
ED
O t
o E
ng
age
Ab
ility
of
ED
O t
o E
ng
age
II. EDO Aspiration
Hig
hM
ediu
m
Medium HighLow
Hig
hM
ediu
m
Medium HighLow
Note: charts are for illustration purposes only - the content and placement of the boxes will differ by EDO/region.
MarketingTalent Attraction
Entrepreneurship
Technical Assistance
Incentives
Incentives
Tax and Business
Climate Advocacy
Workforce
Training
Housing
Affordability
K-12 Education
Marketing
Incentives Workforce
Training
Engage in
new areas
Apply
existing tools
Housing
Affordability
K-12 Education
Entrepreneurship
Talent Attraction

COMMITTING TO INCLUSIVE GROWTH 26
its current mission statement to justify its engagement on inclusive growth, or if engaging with this topic would require a significant
revision to the organization’s mission. This should provide an early sense of how much direct engagement with board leadership the
LESSONS FROM THE LAB: CONFIRMING THE EDO’S FUNCTION
Openness of partners. While the Lab teams expected to encounter (potentially strong) resistance from certain groups and individuals during the process, there was actually little open skepticism. The vast majority of those working in community development, workforce development, mayor’s offices, and housing entities welcomed the dialogue and a potential role for the EDO because they believed this represented a new energy and perspective for the cause. These groups repeatedly stressed the need to bring the weight of the business community to bear on this subject and the fact that they do not currently have these business connections. However, this positive response was based on reactions during the planning stages and EDOs would be wise to assume there is at least some level of latent skepticism, even if invisible early on.
Awareness, convening, and policy. Regional EDOs (such as in San Diego) are most likely to zero in quickly on a primary role involving awareness building and convening/collaboration, which represent two of the EDOs’ core strengths that their investors value highly: regional EDOs can build coalitions that are essential to coordinating across the separate efforts of most other EDOs and CDOs. Further, because they typically don’t control actual economic development tools (i.e., incentives and workforce training), or have a policy
role, they are limited in the new programs they can implement. Where the EDO is within a Chamber (such as in Indianapolis and Nashville), this is extended to include a major policy role, particularly around topics such as transit, workforce, and affordable housing.
Mismatch of strengths and impacts. By plotting their programs on the 2x2 chart, Lab metros quickly realized that their core regional economic development programs, as currently implemented, have little direct positive impact on inclusive growth (except for job training and skills development), and that they do not directly control the systems (such as K-12 education and workforce development) that have the greatest potential impact on inclusive outcomes. This early realization drove home the point that to be effective, the EDO must partner with and elevate other agencies that are responsible for implementing programs. However, the results of the 2x2 chart drove the Nashville team to consider how its traditional economic development functions could be made more inclusive. They were honest in their self-assessment of where their programs are now (upper left corner, i.e., not intentionally contributing to inclusive outcomes). This led them to consider what an aspirational version of the 2x2 chart might entail, with some of their traditional functions moving to the upper right-hand corner.

COMMITTING TO INCLUSIVE GROWTH 27
process will require. If inclusive growth does not fit with the current mission, is it important enough to adapt the mission? If so, how must it change and will the board support this direction? As part of these deliberations, the EDO must determine if it has the resources to adopt a significant new role without diluting its current mission and programs. It must also consider the potential downsides of not engaging, such as becoming less relevant or forgoing funding from current and potential investors (including foundations and government agencies).
Identifying the audience
The EDO must also focus on the core audiences it needs to convince to either think or act differently if collective inclusive growth efforts
are to succeed. This allows the narrative to be crafted with each target audience in mind: for example, a presentation intended to convince a community development group that the EDO is a sincere and credible partner might look very different from one intended to convince a group of businesses to change their hiring practices, or one intended to convince suburban mayors that their growth depends on the success of currently-excluded populations in the urban core. Thus, a clear definition of the audience not only makes the narrative more convincing, but also provides a way to put boundaries around what could otherwise be an almost limitless exploration.
LESSONS FROM THE LAB: IDENTIFYING THE AUDIENCE
One narrative, different emphasis. Initially, the project called for each metro team to produce one narrative to use with all audiences. However, each Lab metro found it needed to adapt versions to appeal more directly to each target audience. The solution they devised was to create one regional narrative with a modular section (about five of the 30 slides) that allowed the story to emphasize key messages that would best resonate with each unique audience. This ensured that the regional EDO’s basic case remained consistent and clear, but also allowed for tailored messages that more directly supported the broader case with targeted groups. For example, the Indianapolis Chamber selected the following as key target audiences: (a) state legislators to underscore the importance of the state to addressing relevant issues in
the Indianapolis metro area, (b) suburban mayors to ensure an understanding that this is a regional issue (and gain their buy-in to solicit state support), and (c) business and civic leaders that drive the economic development agenda in the region. While the overall message of the narrative should resonate with every group, the Chamber will ensure that each unique audience also receives a targeted message that reflects its priorities.
Origins of the business case. One of the Lab’s objectives was to determine whether the business case (or growth case) for more inclusive growth would come from businesses themselves through interviews, or if the case would need to be made to businesses for why this matters to them. While some larger firms understand and

COMMITTING TO INCLUSIVE GROWTH 28
embrace the subject, and are often out in front driving the EDO to engage more directly, the general answer is that EDOs will need to help smaller and mid-size businesses realize the importance of inclusive growth to their own bottom lines. With this realization, the San Diego Regional EDC identified companies in the innovation economy as one of their primary audiences. While many larger firms, such as Northrop Grumman and BAE Systems, recognize the relevance of the issue to their own competitiveness and are acting on it, smaller to mid-size firms tend to be less aware or able to respond on their own. As the EDC has begun to deliver the message to these firms, the reception has been positive and firms readily acknowledge that their problems related to issues such as workforce are connected to broader trends that imply the need for more inclusive growth.
Common target audiences. Ultimately, each EDO identified some version of the same priority audiences. These include the following:
• The EDO’s members/investors, to ensure that business leaders and local economic development officials understand the threat this issue poses to them and the regional economy, and to gain investor support for increased EDO engagement;
• State and local elected officials, to recognize the importance of state and local policy to the issue, confirm its importance to the business community, and promote more regional cooperation;
• Community and workforce development organizations, to increase recognition of the EDO as an important potential partner in inclusive growth, begin to build a needed bridge that connects economic and community development, and work through any latent issues;
• Foundations and philanthropies, to gain the support of key potential champions and secure funding for new initiatives that reflect their objectives.
Defining these basic parameters is a first step, but should not be a one-time exercise. Throughout the process of building the narrative, the EDO should continually revisit the spectrums, the 2x2 chart, and its stated mission. This will allow it to thoughtfully evaluate the potential roles and interventions
suggested by internal and external stakeholders against a consistent and mutually agreed-upon benchmark. The EDO should also regularly revisit and refine its intended audience, to ensure that its narrative directly responds to the concerns of those it needs to convince of the need for change.

COMMITTING TO INCLUSIVE GROWTH 29
STORIES FROM THE FIELD
Managing regional civics
In January 1970, Indianapolis and Marion County (the region’s core) merged, forming a consolidated city-county government. But five decades later, the core county finds itself squeezed as the outlying suburban and exurban counties have mushroomed in the ensuing decades. Today, 40 cents of every $1 earned in Marion County is made by workers who live outside the county and pay income taxes in their home municipalities, although they use Marion County public services like roads and public safety. With property taxes capped, the city’s budget is strained by accelerating poverty and growing demand for services. Facing these challenges and more complicated local distribution of opportunity as wealth returns downtown and first ring suburbs inside and increasingly outside of Marion County experience economic decline, Indianapolis and other regions face the task of redefining regionalism—determining how urban and suburban residents and local governments relate to one another, generate income, consume and pay for services, and work for common goals.
Community development partners
Within a commercial and residential corridor revitalized as part of Indianapolis’s 2012 Super Bowl Legacy Project, the John H. Boner Community Center concentrated its housing, transportation, community development, financial assistance and other resources in a two-level, block-wide hub for services on the city’s near East Side. In 2015, the center led the federal Promise Zone application for the former manufacturing area where nearly a quarter of residents are now unemployed. Through the Promise Zone, the Boner Center and partners from both city-wide institutions and East Side neighborhoods are implementing new approaches to improve local housing, workforce development, economic development, safety, and education. (One significant goal, which leaders hope to pursue with the Indy Chamber, is to redevelop a large RCA manufacturing plant empty since the mid-1990s). This coordinated, high-capacity approach has allowed the area to attract tens of millions of dollars in new funding, pilot new approaches to help residents, and potentially serve as a key collaborator with the Chamber as it expands it role.
2. Who is excluded?
The increasingly stark divides in the Nashville, Indianapolis, and San Diego stories have led to different versions of the tale of two cities story in each region. This story is by no means a caricature; rather, it is a realistic representation of economic dynamics, and it can serve as a valuable catalyst for unified action. At the
same time, such stories ultimately have limited value as a starting point for an EDO attempting to undertake the complex task of defining its specific responsibilities for inclusive growth and understanding how exactly its tools can best be applied. That’s because the losing half in the two cities narrative likely contains populations that face vastly different levels of exclusion, ranging from the homeless to underemployed college
COMMITTING TO INCLUSIVE GROWTH 30
graduates to middle-class workers whose wages are stagnating. Addressing the exclusion of each of these different populations may require vastly different strategies. The foundation of a narrative, therefore, is a far more specific segmentation of excluded populations (Lab metros produced approximately six to eight profiles of distinctly different groups).
While not every narrative ultimately included each of these profiles, this is a crucial early step in the process for two reasons. The first relates to regional consensus-building, since a thorough definition of a region’s excluded populations will reveal that the problem spans racial, geographic, and educational boundaries. For example, it will expose widespread myths that most people without jobs lack work ethic or rely heavily on government assistance. This helps gain buy-in for a regional approach from actors that may not have previously seen economic inclusion as relevant (e.g., firms that employ an exclusively highly-skilled workforce) and from organizations whose understanding of the situation was highly localized (e.g., CDOs). The second relates to program and policy design: By defining which populations are excluded, an EDO can then progress to understanding what forces led to their exclusion, which, in turn, reveals what interventions could counteract those forces.
But constructing a set of profiles that serves both purposes is challenging. The population segments must be detailed enough to differentiate between people facing meaningfully different situations, to resonate with a range of audiences with narrow interests,
and to humanize abstract concepts like inclusion, inequality, and economic mobility. These segments must also create a picture broad enough to reflect the severity and pervasiveness of the problem–capturing not only those who are excluded from the economy entirely (the unemployed), but also those who have been excluded from growth or harmed by its downsides (the underemployed or anxiously employed). How can a single narrative present the legacy of discrimination and exclusion in a particular black urban neighborhood, and also build a case for regional action based on the fact that the same economic challenges are now far more widespread–including in predominantly white suburbs?
Because the profiles of excluded populations serve as both a research tool and the basis of a consensus-building narrative, an EDO must consider quantitative evidence as well as anecdotes and narratives that continually surface in interviews. It must also decide whether to define populations based on typical demographic factors (race, education and age), or other characteristics–which are sometimes less easily measured but potentially more meaningful–such as neighborhood, the types of firms people work for (or don’t work for), or their occupations. And it requires somewhat subjective decisions about how to define these segments when there is substantial overlap in the populations covered by two seemingly different, equally compelling definitions (e.g., between concentrated poverty and racial minorities, or between suburban poverty and middle-aged industrial workers).

COMMITTING TO INCLUSIVE GROWTH 31
LESSONS FROM THE LAB: IDENTIFYING EXCLUDED POPULATIONS
Breadth of exclusion. The San Diego Regional EDC knew from the beginning that it wanted to focus on making the innovation economy more accessible. But defining excluded populations only in terms of their relation to the innovation economy would have called into question its role as a credible authority on inclusive growth and sacrificed its ability to act as a regional convener on the issue. Thus, it was crucial to recognize the full extent of exclusion before moving to the narrower issue of innovation. To this end, it cited a study from the Center on Policy Initiatives, which found that more than a third of working-age households in the region–or one million individuals–had incomes too low to cover basic expenses.23 For its part, Nashville sought to quash stereotypes of poverty in its narrative using data to show that half of the region’s families earned less than the $50,000 self-sufficiency level, despite working two jobs. (And that, contrary to popular perception, most of these families did not live in public housing.) Indianapolis
used a similar report to the same effect: according to the United Way, over a third of households in the metro area were “asset limited, income constrained, and employed”–earning more than poverty level wages but not enough to afford the basic cost of living.24 Beyond providing a succinct way to capture the extent of economic exclusion in these regions, the measures underscored the fact that simply creating more jobs is an insufficient response.
Anxiously employed. Another way to illustrate the breadth of exclusion is to profile the anxiously employed, a category that may extend even higher up the income spectrum than the measures noted above. For Indianapolis, a common question was, “What are we going to do with the Carrier employee who has a job now but might not in a few years?” It was widely understood that labor-intensive manufacturing jobs have a high risk of disappearing, and that the track record of retraining programs is not encouraging. Invoking the idea of a
Who Doesn’t Have Access?
Those left behind are primarily unemployed, older and in non-family households
Those left behind are uneducated and live in public housing
Myth
Who Doesn’t Have Access?
Reality Reality CheckThe Jones Family
Typical of 50% of population:• Two gainfully employed working adults• Earn less than $50,000 • No housing subsidy• No health insurance
Monthly Income: $4,167
Rent (2BR, Fair Mkt) $1,000Utilities $ 250Childcare $1,600Food $ 800Transportation $ 600
Clothing, entertainment, emergencies, health, school costs….
Monthly Remaining: - $ 100
Monthly Expenses:
EXAMPLE SLIDES FROM METRO NARRATIVES
Myth and reality in Nashville

COMMITTING TO INCLUSIVE GROWTH 32
wave of workers who might soon join the ranks of the excluded is an effective way to underscore the urgency of addressing the needs of those already excluded. For example, in San Diego and Nashville, high and rising housing costs are the main source of anxiety among those who may be doing well by traditional measures. San Diego hesitated to define an engineer making $110,000 per year as excluded. But in the context of making a business case, it resonates: firms in San Diego have trouble recruiting and retaining employees even at those wage levels (and higher) due to housing costs. While this population may not inspire much sympathy from most audiences, the issues they are dealing with–lack of housing supply relative to demand, and long commutes–are directly related to those of lower-income populations. Thus, tapping into business concerns about lack of middle-management talent may be an effective, novel way to build support for housing reform and transit investment.
Industry structure. In areas undergoing major shifts in industry structure, or stark divides that relate to industry dynamics,
it may be most revealing to segment populations based on the parts of the economy to which they have historically been attached (although this may technically be a proxy for many other educational, geographic, and demographic characteristics). Indianapolis divided its economy into three tiers for this purpose.25 The high-income, innovation-driven segment–the focus of the Chamber’s recent Accelerate Indy five-year strategy–is growing as a share of the economy, and wages grew from 2005-2015. The other two segments, middle-income labor-oriented jobs and low-income service-oriented jobs, make up 81 percent of the region’s economy, and these workers have been excluded from growth: wages fell in real terms from 2005-2015. Further, the middle-income segment is shrinking as a share of the economy, taking with it bridge jobs that used to provide a pathway into the middle class and beyond: the region lost 30,000 manufacturing jobs from 1995-2015 that paid over $73,000 on average and were replaced primarily with jobs in transportation and logistics, paying only $43,000 on average, and
INDY’S SHRINKING MIDDLE WAGE JOBS
CHANGING NATURE OF WORKSOURCES: Indiana Department of Workforce Development
$24,011 $26,522 $26,504
$51,358 $54,390 $55,154
$56,086
$69,043 $73,577
$20,000
$30,000
$40,000
$50,000
$60,000
$70,000
$80,000
1995 2005 2015
Average Wage by Sector in 2015 Dollars
Lower Income/Service Middle Income/Labor
Higher Income/Innovation
35.0% 46.0% 19.0%2015
Lower Income/Service Middle Income/LaborHigher Income/Innovation
29.4% 56.4% 14.1%1950
Job Distribution by Level
THE CHANGING NATURE OF JOBS
NEW ECONOMY, NEW SKILLSSOURCES: EmployIndy
JOB TYPE CHANGE IN JOBS (1995-2015)
2015 WAGES
Manufacturing -30,743 $72,861
Government -203 $52,484
Mining 116 $65,019
Wholesale 1,051 $66,426
Management 1,075 $91,692
Agriculture 1,312 $41,661
Utilities 1,501 $89,577
FIRE 2,140 $76,845
Real Estate 2,768 $49,625
Construction 3,357 $56,137
Arts 4,544 $47,246
Other 4,922 $35,216
Retail 6,929 $28,617
Education 8,836 $36,600
TDL` 22,290 $43,737
Pro Services 22,321 $73,348
Food Services 24,992 $16,705
Waste/Administration
41,090 $30,946
Health Care 53,482 $52,653
CHANGE IN JOBS (1995-2015)
+22,2902015 WAGES
$43,737
CHANGE IN JOBS (1995-2015)
+53,4822015 WAGES
$52,653
TDL
HEALTH CARE
CHANGE IN JOBS (1995-2015)
-30,7432015 WAGES
$72,861
MANUFACTURING
EXAMPLE SLIDES FROM METRO NARRATIVES
The changing nature of jobs in Indianapolis

COMMITTING TO INCLUSIVE GROWTH 33
healthcare, paying $53,000. In San Diego, the industry structure story was simpler: Because the innovation economy provides such a meaningful wage and mobility premium, those excluded from it merit particular attention. Again, this is a proxy for many other characteristics such as gender (men outnumber women 2-1 in tech fields), ethnicity (about 74 percent of tech employees are white or Asian), and education (those with two-year degrees can gain access but have limited mobility).26
Suburban and concentrated poverty. Where one lives is a major determinant of economic opportunity or the lack of it, so it is not surprising that each metro area identified specific neighborhoods in which all residents could be identified as excluded. Two characteristics tended to be especially important. One was distance from job centers, which can affect urban areas that might be far from suburban greenfield developments (such as logistics jobs on the outskirts of Indianapolis) or suburban areas that lack transit and are far from major downtown employers (such as anchor institutions or maritime jobs in San Diego). Another is concentrated poverty, which, regardless of geographic proximity to job opportunities, leaves people disconnected from social and professional networks. For example, Indianapolis had a 19 percent increase in the share of poor people living in neighborhoods of highly concentrated poverty since 2000, which was the fourth highest increase nationally.27 In either case, highlighting both suburban and urban examples of geographic exclusion was seen
as a way to dismantle stereotypes and gain broad buy-in.
Generational and age-related. Those at either end of the working-age population face distinct barriers. A common theme was disconnected youth, from 16-24, that are neither in school nor employed. Nashville found that 13 percent of Hispanic and black residents from 20-24 fit this description (compared to 7 percent of whites and 4 percent of Asians), and that there is a national trend towards longer-term unemployment (lasting an entire year) among young men without college degrees.28 San Diego highlighted the fact that today’s Hispanic youth will comprise the bulk of the workforce in the future, but that only 17 percent of the Hispanic population possess a bachelor’s degree (compared to over 37 percent for the region as a whole).29 And in Indianapolis, low levels of inter-generational mobility–the disappearance of the American Dream–formed the core of the narrative: a child born in the bottom quintile of the income distribution has only a 4.8 percent chance of reaching the top quintile by adulthood–one of the lowest rates outside of the southeast.30 This is problematic given that there are currently over 90,000 youth already in poverty in the region that face particularly steep uphill climbs into the middle class. At the other end of the spectrum, Nashville included individuals from 55-64 who were not attached to the labor force as an excluded population. This age group faces education, health, and transit mobility challenges.

COMMITTING TO INCLUSIVE GROWTH 34
STORIES FROM THE FIELD
Suburban poverty
The Antioch community lies southeast of Nashville, beyond the expressways that ring downtown and its honky-tonk bars and health-care headquarters. A cul-de-sac-lined suburban community, Antioch has evolved from a quiet, semi-rural area to the fastest growing corner of the county, home to a diverse population of Hispanic immigrants and a significant black population. The community is trying to address the shifting needs of its population: for example, a long-underutilized mall now hosts a vibrant community center, library, ice hockey center, a corporate office for Bridgestone Americas, and an outpost of Nashville State Community College. Regional leaders and local boosters point to a soon-to open IKEA and other investments as evidence of local momentum. But Antioch is also emblematic of a growing phenomenon documented several years ago by our colleagues Elizabeth Kneebone and Alan Berube: the growth of poverty in the suburbs is stressing existing capacities and resources that were not designed to address these challenges.31
Helping formerly incarcerated individuals
Formerly incarcerated individuals face many barriers to succeeding in the labor market, from stigma to a lack of recent work experience and marketable skills. Recycleforce, an Indianapolis recycling services social enterprise, targets these barriers and others with a transitional workforce program for former offenders. The program offers a six-month work experience, along with coaching, counseling, connections to permanent employers, and
other services supported by the proceeds from the recycling business. Recycleforce has helped hundreds of individuals since 2006, finding that re-integrating in society can be complicated work. But success means satisfying multiple goals. These include connecting participants with in-demand credentials that ease the process of finding a job and help employers fill positions, fulfilling the social justice mission of helping formerly incarcerated individuals succeed, and addressing the public policy goal of limiting the high costs of recidivism.
Building a more diverse entrepreneurial ecosystem
Starting a business is hard for anyone—as recent statistics pointing to a decline in entrepreneurship attest—but women and minorities have traditionally faced particular challenges, from outright bias to gaining access to capital and networks typically outside their reach. Closing these gaps and ensuring that more entrepreneurs have the opportunity to see their ideas to fruition is key to metro economies reaching their full potential. In the tech sector, where these barriers are particularly potent and the opportunities for wealth-building are significant, a growing number of cities are launching strategies to broaden access. In San Diego, the 30-year old innovation organization CONNECT recently launched an initiative, CONNECT ALL, to engage diverse founders and innovators, starting with building trust in under-represented communities. Other efforts, led by EDOs or independent groups, are also underway in cities including Atlanta, Chicago, and Portland.32

COMMITTING TO INCLUSIVE GROWTH 35
3. What barriers have led to their exclusion?
The various forms of exclusion described above are not supposed to exist when unemployment rates are hovering around 3 percent to 4 percent, as they are in all three Lab metros. With sufficient growth, it is assumed people will be drawn into the labor force as firms raise wages and expand recruitment efforts. There is broad agreement that public investments in workforce training are needed to minimize frictions in this process, but otherwise the market is expected to sort itself out. But the depth and breadth of exclusion in each region is a stark reminder that people in all but the highest strata of the skills spectrum face various structural barriers to contributing to (or benefiting from) economic growth, and that these barriers remain stubborn even in the face of extraordinary growth rates. Defining excluded populations gives a sense of scale and motivates action, but defining which barriers prevent each of those populations from participating in the economy begins to point towards a potential role for an EDO.
There is no single definition of what constitutes a barrier, so the process of defining them is necessarily subjective. At the most basic level, barriers are any force (besides lack of overall economic growth) that prevents an individual from meaningfully participating in the economy. Thus, before an EDO defines the barriers, it needs to define meaningful participation. While data can and should inform this definition, there is no objective benchmark to rely upon; rather, a region essentially needs to decide what level of, and types of, exclusion it is willing or able to tolerate. The natural starting point for defining meaningful participation is the ability of workers to earn wages in line with historical rates for their level of education. But, given the realities of automation and globalization and the limited ability of regional EDOs to counteract such trends, most places interpret the concept more
modestly for low-skilled workers (e.g., any job, or a living wage even if it is lower than historical norms) and more ambitiously for higher-skilled workers (e.g., wage gains in line with overall economic growth, or the ability to buy a home). Ultimately, there are many different but equally reasonable ways to think about this question. Some regions define an inclusive economy as one that minimizes inequality while others define it as one that maximizes income mobility (even if inequality remains high). Still others focus on static measures of well-being, such as availability of living- or middle-wage jobs.
In defining barriers, it is important not to focus too narrowly on the impediments people face in accessing the region’s existing job opportunities. In addition to frictions that plague local labor markets, it is important to examine the arguably more profound (if less visible) barriers to economic mobility imposed by macro-economic trends. Local barriers are the ones that companies complain about–the misalignment between the specific skills required for available jobs and those the workers have (the skills gap) or between the location of jobs and where workers live (spatial mismatch). Many CDOs are also likely to highlight barriers in this category, like policies that disadvantage workers (such as those behind low minimum wages or declines in unionization) or companies’ practices (discrimination in hiring). But in most regions it is likely that the jobs that don’t currently exist–due to the disappearance of middle-wage jobs as a result of automation or global competition–are an equally important barrier to inclusive growth. Solving either category of barrier alone is insufficient: a region will have made little progress towards inclusive growth if it increases access to existing jobs that don’t pay a living wage, or creates middle-wage jobs that excluded populations can’t access.
There is yet another layer to what constitutes a barrier. Maryann Feldman and her colleagues

COMMITTING TO INCLUSIVE GROWTH 36
note that economic development occurs not when people are “reduced to a static factor in the production process” but when “they have the freedom to realize their potential”.33 Thus, the concept of meaningful participation in the economy should refer not only to individuals’ ability to find decent jobs within the confines of their current skill-sets, but should also reflect their freedom to pursue new skills and contribute through innovation and entrepreneurship. If the definition of barriers is limited to the concepts discussed above, those with high-school degrees who manage to earn wages in excess of historical norms would not be thought to face barriers, although they may not be realizing their true economic potential.
The outcome of this stage of the process is a matrix that shows which populations face which barriers, as well as which barriers impact which
populations. This serves three purposes. It helps an EDO make strategic decisions about which programs or policies to pursue (some will choose to work on the most pervasive barriers while others will focus on those that are somewhat widespread but comparatively less difficult to dismantle). Also, it helps set expectations by showing which communities face multi-layered barriers that may take an entire generation to unravel and which face relatively recent, surmountable barriers that may be relatively more reversible (such as middle-aged industrial workers that may just need to be trained to work in a more automated environment). Further, when making the case, it helps to show that populations across geographic or racial boundaries share similar economic outcomes and are also impeded by the same barriers.
EXAMPLE SLIDE FROM METRO NARRATIVES
Exclusion and opportunity in Nashville
Opportunity For/ Rate Of Upward Mobility
Intensity Of Exclusion
Non Citizen
Ex-offender
NearEast
Near South
Ex-urban
Low-skill/Wage
Mental Health
DisabledChronic Health
Conditions
Age 18-24 Not in LF
Age 55-64 not in LF
= 10,000 PersonsHigh
Low
Low High
Social Capital/Network Access
Near North
Nashville: Talent Needs Access
Source: The Research Center, Nashville Area Chamber of Commerce 2017
Where you live
Who you know
Health status
Level of education

COMMITTING TO INCLUSIVE GROWTH 37
LESSONS FROM THE LAB: IDENTIFYING BARRIERS
The lessons below are organized according to the framework of barriers described in Opportunity for growth. It is important to note that these barriers, while described in isolation, build on one another and concentrate in certain neighborhoods or among certain populations. For example, Indianapolis applied a multidimensional poverty framework to illustrate how barriers reinforce one another and make escaping poverty more daunting than any one indicator would suggest.34
Dynamism barriers
Firm performance. Where you work matters. A small but growing body of evidence suggests that much of the inequality among workers can be explained by inequality in the performance of the firms for which they work. San Diego found that firms with fewer than 100 employees account for nearly 60 percent of the region’s employment, but that firms with 0-19 employees only pay approximately 80 percent of the region’s average wage, and those between 20-49 employees pay 83 percent.35 If the firms that people work for are confronting barriers to success and expansion, then their employees are likely to be excluded from the gains that similarly qualified workers at larger or more successful firms are enjoying. There are, of course, many reasons for the underperformance of firms and EDOs already have programs to address these issues. However, few of them have been targeted towards firms in disadvantaged neighborhoods or that employ above-average numbers of
disadvantaged employees (many of these firms are not in the traded sector clusters that EDOs typically focus on).
Firm hiring, pay, and promotion practices. The ways that companies hire people, and then the degree to which they offer upward mobility can constitute a significant barrier to economic opportunity. In tight labor markets, firms are expected to hire from different populations, pay higher wages, and invest more in upgrading the skills of their employees than during downturns, when they can afford to be picky. Yet eight years removed from the official end of the recession, many firms have not updated their practices to match current realities. A leader of an employment agency in one market said that firms that became accustomed to paying low wages for over-qualified candidates have yet to adjust their expectations: For example, in San Diego, many employers in the innovation economy continue to demand “UCSD or better” (University of California at San Diego) candidates, even as the local unemployment rate for engineers hovers around 2 percent (and even if the hiring managers themselves did not attend a “UCSD or better” school). Another workforce leader said that employees can gain entry into relatively well-paid technology occupations with a two-year degree but struggle to move upwards or shift between companies, regardless of demonstrated experience. A decline in on-the-job training further blunts opportunities for upward advancement. And companies, despite workforce shortages,

COMMITTING TO INCLUSIVE GROWTH 38
still tend to not readily hire or provide added support to various disadvantaged populations including ex-offenders, non-native English speakers, single parents, and those without reliable transportation.
Skill barriers
Cost of education. Education is an obvious determinant of economic opportunity. But its rising cost, even if justified in long-term wage premium, presents a barrier. This was clear in San Diego, where graduates of UCSD command a strong position, but tuition there increased nearly 90 percent from 2008-2017. And while graduates of community college certificate programs experience an average wage gain of $6 an hour or $13,000 a year, tuition at these institutions has soared by between 40 percent and almost 90 percent in recent years.36 While this may only translate to $500 a year, that–along with foregone wages while attending school–may present an insurmountable obstacle to the region’s many residents who are working but are below self-sufficiency. (The quality of K-12 education was not highlighted as a key barrier by any EDO because its importance is already broadly recognized and several of the EDOs already have robust, long-standing policy efforts and practices related to the issue.)
Access barriers
Social and business networks. Who you know matters. Social networks inform people about what skills are in demand and what jobs are available, and ultimately enable them to get hired and promoted. Yet numerous structural barriers prevent excluded populations from tapping into
networks that offer opportunities for upward mobility. Nashville highlighted the fact that different demographic groups have varying levels of access to different types of social capital networks. For example, African-Americans tend to have strong survival networks, but weak socio-economic mobility ones. Those between the ages of 55-64 that are not in the labor force are another demographic with particularly weak mobility networks. (The foreign-born population, by contrast, tends to have strong versions of both types of networks.) In San Diego, these barriers were described as cliques. As one interviewee said, “It’s an insider’s game–the best way to gain access is to find someone who is already connected.” This is one reason why men outnumber women by a factor of two to one in the tech industry. The implication is clear: those who live in neighborhoods or are part of racial groups that are outside of mainstream networks are unable to break into certain industries and occupations, even as firms bemoan workforce shortages.
Housing affordability. As mentioned earlier, housing affordability is a major and growing concern in Nashville and San Diego, which appears in many indirect ways discussed elsewhere (spatial mismatch, suburbanization of poverty, network access) but also directly keeps people from participating in the gains of the growing economy. In Nashville, 40 percent of all jobs (and 26 of the top 50 occupations) do not pay enough for workers to afford fair-market rent for a one-bedroom apartment.37 In San Diego, seemingly high incomes don’t go very far in a market with the second highest median home price and fourth highest median rent among the 50

COMMITTING TO INCLUSIVE GROWTH 39
largest metro areas: For example, in the metro area, a teacher earning the median income for that occupation can only afford 14 percent of homes. Even a household headed by two teachers each earning the median income can afford fewer than 60 percent of homes.38
Spatial mismatch. This is a reoccurring theme in each region, in which the areas where excluded populations live are disconnected from job opportunities. In Indianapolis, the tens of thousands of manufacturing jobs lost over the past two decades were primarily in the urban core, while most of the new jobs suitable for those populations are in far-flung
suburban areas with limited transit access. (One reason why the region, despite its very inexpensive housing stock, still has a relatively high cost-of-living when average commute costs are added in.) In San Diego, high housing prices near job centers have pushed low-income and unemployed people to distant residential areas. The average resident saw a nearly 8 percent increase in the number of nearby jobs from 2000-2012 while the number of jobs near the average poor resident fell by 4 percent.39 Only a few very large firms interviewed for this project had the resources to provide transportation for employees without cars.
STORIES FROM THE FIELD
The cost of housing
On North Nashville’s historically black Buchanan Street, it is not uncommon to find popular new restaurants, galleries, and even signs advertising deals for buying and razing neighborhood properties. Buchanan Street’s complicated renaissance speaks to broader tensions in Nashville’s rise to “It City” status, which have manifested themselves perhaps most obviously in the region’s housing market. On one hand, new interest in the corridor and other areas has brought new amenities and investment. On the other, it prices out existing residents, despite efforts by some developers to be attentive to these concerns. The region’s struggle to preserve affordable housing
has attracted growing attention; earlier this year, the Tennessean launched a series on The Costs of Growth and Change, pointing to data that the average Nashville home price increased from $167,500 to $266,408 in the last several years.40 Programs to expand housing affordability are part of the Nashville Chamber’s policy agenda at both the state and local levels and the Chamber supported an inclusionary zoning measure approved last fall requiring workforce housing units in certain developments. And with city estimates projecting a deficit of 31,000 affordable rental units by 2025, Mayor Megan Barry responded by making affordable housing a priority of her administration, including calling for millions of dollars of new investment in this year’s

COMMITTING TO INCLUSIVE GROWTH 40
4. What are the costs of exclusion?
The ability of an EDO to successfully reframe the local dialogue on inclusive growth hinges on confronting a major hurdle: while there are perhaps a few individual champions driving EDOs to focus on more inclusive growth, the broader business community and other key local leaders lack a true awareness of the breadth of the problem and the very real and direct economic threat it poses. However, if these business and government leaders who have not become involved are to be motivated to rise to the challenge, they must understand that a greater number of firms, people, and neighborhoods are experiencing declining access to opportunity, that this affects them directly, and that proactively dealing with it is a smart business and economic strategy. The
previous two sections focused on defining the problem; the paper now describes why it matters to the audiences most influential to an EDO’s ability to move forward.
There are several reasons why those who might be generally aware of the issue, and even sympathetic from a moral perspective, haven’t fully recognized the cost. One is that the measures people typically use to assess the health of the economy, such as unemployment rates and per capita income growth, show that most regions appear to be performing quite well–and there is little reason to believe that exclusion is worsening or more than a social issue. Another is that the key audiences often are disconnected from the parts of the region that aren’t doing well, and therefore simply don’t experience the issue in their daily lives: for example, business leaders in Indianapolis
State of the Metro address.41 Still, signs point to a complicated path forward: as in many communities, NIMBYism remains a barrier to expanding housing. And the state, where homeownership interests hold significant sway, seems willing to override local action.
Getting to work
As many metropolitan residents look for jobs, they have a problem: positions are in distant suburban or exurban areas largely inaccessible without a car or hours-long commutes on public transit. Though the recession put a temporary halt on job sprawl, our colleagues Elizabeth Kneebone and Natalie Holmes found in a 2015 report that the number of jobs close to both urban and suburban workers declined significantly from 2000-2012, reducing the number
of jobs near 32.7 million city residents and 59.4 million suburban residents nationally.42 In northeast Ohio, the Fund for our Economic Future, a consortium of philanthropies, firms, and other civic actors focused on revitalizing the region, is trying to concentrate employment around “job hubs” that already include multiple traded-sector firms and institutions.43 After collaborating with planners and the private sector to map these hubs, the Fund is seeking buy-in from other regional entities, with the goal of informing decision-making around economic development, transportation planning, workforce development, and other areas. Ultimately, the Fund believes this approach will deliver benefits for both workers and firms that often struggle to fill positions in outlying locations, fitting within a broader strategy to build both growth and opportunity.

COMMITTING TO INCLUSIVE GROWTH 41
who would be poised to act on this issue tend to live in affluent suburbs such as Fishers (with a median household income of over $90,000) and commute to work in the city’s thriving downtown. They may never go to neighborhoods only a mile or two from downtown, which experience radically different economic trajectories. This dynamic also plays out with public officials from suburban districts: they might empathize for the parts of the region that are struggling, but probably don’t grasp the ramifications of spreading inequality to their own districts. Last, people may recognize certain costs, but attribute them to something other than exclusion–a business leader may be highly attuned to the costs of talent shortages, but not recognize that the cause isn’t related to work ethic, but systemic barriers for excluded populations.
The purpose of defining the costs is to address these forms of oversight and tap into people’s strongly-held sense of loss aversion–the notion (confirmed in a number of famous economic experiments) that people are far more motivated by the idea of avoiding losses than acquiring gains of the same magnitude. The idea is to convince audiences not (only) that there are potential gains from addressing exclusion, but
that something they already have is, or will be, lost if action is not taken. There are essentially three ways to define costs.
The most basic is simply to provide an additional way to think about the scale of the problem–to note that exclusion not only affects a large and diverse population, but that the impact adds up to a significant economic impact. Experience from the Lab suggests that billion-dollar estimates of impact at the regional scale (in the form of foregone GDP due to low inter-generational mobility or childhood poverty, examples of which are in Opportunity for Growth) are not particularly persuasive for many audiences. But, such estimates are relatively easy to calculate based on available studies and may help make the case to other EDOs for which GDP growth is a performance metric, or staff from mayors’ offices that can readily translate such figures into tax revenues.
The next is to clarify that key audiences are already paying the costs of exclusion directly (or soon will be), and that they aren’t just abstract, diffuse costs that the region pays. Business leaders may only have a passing interest in whether a region’s GDP grows by 1.5 percent or 2.5 percent, but they are likely to be highly
EXAMPLE SLIDES FROM METRO NARRATIVES
Worker and employer perspectives in Indianapolis
WORKER PROFILE: CAROL
ECONOMIC ACCESSSOURCES: In-Person Interviews
FAMILY STATUS: Single mother of two children
JOB STATUS: Recently hired at ABC Call Center, earning a starting wage of $13.50/hour.
PROS: In-house health clinic access, extensive employer training
CHALLENGES: Long commute via IndyGo bus system to and from work at inconvenient times, disqualified from child care voucher if wage exceeds $16/hour, housing options limited due to low wages
EMPLOYER PROFILE: ABC CALL CENTER
ECONOMIC ACCESSSOURCES: In-Person Interviews, Center for Economic & Policy Research
JOB REQUIREMENTS: High school diploma
WAGES & BENEFITS: Starting wages of $13.50/hour, in-house health clinic, training
CHALLENGES: 15% of employees ride IndyGo, employees refuse wage increases from $15/hour to $16/hour to remain eligible for child care voucher
TURNOVER COSTS: 4-6 weeks of expensive onboarding for 50 new hires per month (600 annually), 40% new hire turnover (240 annually), turnover costs 86% of salary ($5.7 million annually)

COMMITTING TO INCLUSIVE GROWTH 42
attuned to the costs to their business from unfilled positions or high turnover. These costs just need to be calculated (using many available studies), either for an individual business or for the region’s business community as a whole, and re-framed as being direct results of the barriers described in the previous section (high turnover may just be one manifestation of barriers such as spatial mismatch and lack of transport or affordable childcare). In this context, costs don’t necessarily need to be dollar figures; rather, they can include the specter of future workforce shortages (based on current demographic projections) that will occur unless new training systems are created for currently-excluded populations, or the threat of future tax increases.
The third is to calculate the costs of specific barriers (this time it is important that estimates are in the form of actual dollar figures) to compare them to the expense of potential solutions, to convince each relevant audience that they can’t afford not to deal with this issue
because the status quo is far more expensive than the solution.
Experience from the Lab suggests that these costs are a complement to an urgent moral case, not a substitute. Some ideas that inspire people can’t be quantified. One example, cited in Opportunity for growth is that any region may have an untold number of lost Einsteins due to the failure to provide equality of opportunity for all youth. And even profit-minded business leaders react strongly when the problem is framed as the American Dream is no longer available to everyone, or when the reality of the situation is juxtaposed with firmly-held notions of the region’s culture of generosity towards its own residents and neighbors. These arguments matter–but clearly defined costs may be what ultimately give certain people the cover they need to actually do something.
LESSONS FROM THE LAB: CLARIFYING COSTS
Clarifying the costs of exclusion is at the core of making the business case for more inclusive growth. However, grappling with this became one of the more difficult exercises for the three EDOs in the Lab. They were challenged by the lack of data to quantify actual costs and the difficulty of translating qualitative findings and the identified problems into monetary costs that would strongly support the case. While this exercise will require ongoing analysis by the Lab teams, a basic set of approaches emerged during the process—which involved
the EDOs’ attempting to localize and personalize available data and test what resonates with its target audiences.
Forgone economic opportunities. At the highest level, there are the costs to regional GDP and income. The Indy Chamber calculated that if its rate of inter-generational economic mobility were to mirror that of San Diego, its regional GDP would rise by $5 billion-$16 billion each year (or 6 percent to 15 percent of its entire regional economy).44 Further, according to

COMMITTING TO INCLUSIVE GROWTH 43
PolicyLink, the Indianapolis region would generate an additional $10.6 billion in GDP by closing the racial equity gap.45
Tax-related costs. Since businesses are already aware of their tax burden, it was useful to invoke the idea of the higher taxes that would be needed to address the effects of economic exclusion (incarceration, public safety or healthcare) or, less directly, that these expenditures would mean that taxes (even if held at current levels) would increasingly be dedicated to these problems rather than business priorities like infrastructure (roads, airport and transit), education, and livability (parks and other amenities that help attract talent). In Indianapolis, overall tax revenue decreases meant that public safety and criminal justice consumed a large and increasing portion (about 89 percent in 2014) of Marion County’s $594 million General Fund expenditures, limiting investment in business priorities, such as infrastructure, parks, and workforce.
Workforce and talent costs. Firms bear a significant cost burden, including those related to unfilled positions due to lack of skills, turnover due to lack of affordable housing or adequate transport, and other workforce constraints. Indianapolis identified one of its biggest costs as the long-term risk of an aging population and shrinking workforce, which demands they either provide opportunity for excluded populations or risk the exodus of employers as they seek areas with deeper talent pools. From a firm’s perspective, it is estimated that an Indianapolis company with 500 employees is hit with $8.7 million in workforce turnover costs each year. For
its part, San Diego is stressing the cost to business (particularly in its innovation sector) and the entire region of having an unprepared local workforce, since virtually every other region has a workforce deficit in key industries (making it impossible to solve the issue through talent attraction) and the fact that the future workforce will be primarily Hispanic (a population that historically has had the lowest education attainment rates in the region). Nashville is highlighting the possibility that, given current demographic and growth trends, it may not have enough workers to satisfy demand in five years.
Costs to certain places. Certain neighborhoods, urban and suburban areas of the region, and even rural areas in the state outside of the region, directly bear the costs of exclusion. For example, Indianapolis is stressing the costs of potential regional stagnation to state revenues and the ability of the state to fund critical programs for rural areas. The Indianapolis region represents 20 percent of the state’s land area but 40 percent of its economic output–and therefore contributes an outsized share of state tax revenue–meaning that rural areas will suffer if exclusion dampers the region’s growth.
Costs of decreased livability. The various barriers have a cumulative effect on a region’s livability. San Diego highlighted how high home prices have forced lower and middle-income residents to move farther into the region’s periphery, resulting in increased commute times, traffic congestion, and less time to work or be with family. This represents not only a moral case, but a business case, as it impacts the

COMMITTING TO INCLUSIVE GROWTH 44
ability of firms to be productive, attract workforce, and maintain happy employees: one biotech firm reported that at least 100 of its employees would be willing to relocate out of state, and a specialized manufacturer reported that it lost employees due to cost of living and commute times. A recent EDC study found that even the seemingly high wages in San Diego’s genomics industry lag other regions when adjusted for cost of living.
Cost of potential civic unrest. Metro areas across the country are increasingly concerned about the potential for riots and other civic unrest, which not only represents failed policies, but, from a business case perspective, a hit to reputation, potentially impacting tourism, business growth, and the ability to attract and retain talent. St. Louis, Baltimore, Charlotte, Milwaukee, and Minneapolis, among others, have experienced this in recent years.
STORIES FROM THE FIELD
Business and inclusion
Three large employers had been in the San Diego region for decades—two in highly-sophisticated technical fields and the other in tourism—and all three were committed to the area’s well-being. Given a deep interest in the region’s ability to provide qualified STEM workers and a stable business environment, one of the firms also considered the principle of corporate citizenship and diversity to be a competitive advantage. Another firm, also with significant operations and workforce needs, worked with local high schools and a community college to develop customized training programs, offered on-site skills training and language lessons, and was active in its neighborhood (in part after the local community pushed for it). For its part, the tourism company described itself
as a training ground for youth and the workplace, teaching the soft skills related to customer service, client interaction, and work ethic that employers often feel are missing. Driven by a combination of corporate responsibility and self-interest, these firms provided a glimpse into the potential business case for economic inclusion.
Advocating for policy change
When the Indianapolis City-County Council voted in late February 2017 to expand mass transit, it marked the end of a hard-fought 13-year campaign, including a public referendum the previous fall. With its partners, the Indy Chamber led the effort, engaging elected officials, community groups, businesses, the public, and others, for expanded bus service that

COMMITTING TO INCLUSIVE GROWTH 45
will benefit thousands of residents and workers. The Chamber cast the expansion in terms of both growth and inclusion, pointing to an expanded talent pool that benefits employers and greater job access
for residents at a time when the number of jobs close to the urban core had declined. For EDOs with policy arms, this model offers one approach for lowering barriers to inclusion.
5. What is the role of an EDO?
If done well, the narrative will make an EDO’s stakeholders impatient for it to explain how it will change. Which raises the question: of all of the potential problems raised during the research described above, which ones should the EDO commit to addressing, and how? What is the appropriate scope and scale of an EDO’s involvement? And what should it expect other actors to tackle? While the process of creating a narrative is not designed to lead to specific strategies, it should enable an EDO to clearly define its role and issue a compelling “call to action” to other actors (including businesses).
The research is a starting point for such decisions. In theory, armed with answers to the questions posed in the above sections, a small team in an EDO could easily create a logical approach, producing a matrix of excluded populations, barriers, and costs, and think about the issue in entirely technical terms. After this, various interventions might seem appropriate, based on the following critical questions: (a) Which barriers could be dismantled for the lowest price relative to the costs they currently impose? (b) What is the easiest set of barriers to dismantle that would release enough workers to satisfy an inadequate supply? (c) What geographic areas should be targeted based on evidence of deep, multi-generational exclusion with high costs to government? However, technical considerations are only one set of factors influencing how an EDO establishes its role in inclusive economic development, and at
least three others must be considered.
First, for regional EDOs, collaboration and convening is both a means to an end (by ensuring a policy is implemented effectively) and an end in itself. Thus, rather than choose interventions based purely on their potential quantitative impact, an EDO must inspire a collective response from key partners. This means finding areas of overlap between, for example, a mayor’s office with which the EDO has a contract to deliver certain services within city boundaries, major corporate members that expect it to focus on regional branding and talent attraction, a broad base of small to mid-size business members that expect it to pursue a traditional pro-business policy agenda, and CDOs that have completely different programs and policy interests. Also, some interventions may be justified purely on research but are non-starters for at least one key audience.
Second, as regional umbrella organizations, EDOs will need to defer to existing programs and initiatives. A role that broadly appeals to each stakeholder might still prove problematic if the specific initiatives approved end up duplicating or disrupting others in the region: for example, in one region, it was noted that economic development actors are very concerned with staying within their clearly-defined roles, or swim lanes. Further, the importance of integrating with existing efforts pushes EDOs towards roles that either involve interventions that are totally different

COMMITTING TO INCLUSIVE GROWTH 46
from what other organizations are doing, or for which it is relatively easy to demonstrate how their involvement adds to what is already being done. While each EDO identified several distinct initiatives that they could lead, they tended to adopt roles that involved aligning, scaling up, and bringing business perspective (and involvement) to disparate initiatives run by actors with comparatively narrow geographic or topical interests.
Third, most EDOs will need to tackle this work without a major infusion of new resources. Moreover, the interventions that seem most doable will not necessarily have the greatest impact; nor are they the ones most demanded by stakeholders. Rather, they are the ones which allow an EDO to effectively intervene using existing tools and resources. Further, the EDO will also need to consider the influence of corporate and philanthropic foundations and may mold its role or adopt specific interventions based on how likely it is that they will appeal to local and national funders’ interests.
There is no scientific process to sort through all these considerations. Instead, it requires returning to the beginning of the process and overlaying the spectrums and 2x2 charts with the research on excluded populations, barriers, and costs. After this, an EDO has to consider the following: (a) What are the areas of overlap among the most pervasive or costly issues and the EDO’s greatest capacity? (b) Which efforts are most likely to appeal to and galvanize further action, among the largest group of stakeholders? (c) Do the interventions cover policy, practice, and partnerships? (d) Do they cover skills, access, and dynamism? (e) How realistic is it for an EDO to adopt this role without new resources? Will it require some staff to focus exclusively on inclusive growth (a new department)? Or will all staff need to spend some of their time on it (infused across the organization)? (f) What trade-offs will this require (cutting back on other programs to free up resources)?
LESSONS FROM THE LAB: IDENTIFYING THE EDO ROLE
Because developing strategy was not part of the process, the following lessons are intended to outline an EDO’s potential role. While some strategies and tactics are described here, these are generally pre-existing programs that the EDOs realized could be adapted or strengthened based on their existing or potential impact on inclusive growth. Some interventions are not attributed to specific EDOs because they are nascent ideas that have not been fully vetted locally.
Practice
Building networks. Each EDO found that individuals’ inability to tap into opportunity-enhancing personal and business networks is a major barrier to inclusive growth. As noted earlier, firms hire from within their networks, which deepens the gap between excluded populations and everyone else. Businesses usually do not interact with other local firms outside their industry, which stifles the transmission of good ideas. Thus, creating more robust networks emerged as a key opportunity for EDOs, and one that already fits their core role

COMMITTING TO INCLUSIVE GROWTH 47
as regional conveners and collaborators. One model is the Nashville Chamber’s six Area Advisory Councils, which serve a similar function as the Chamber but have a geographic focus. This enables firms that might not hold board leadership positions to engage with one another and raise concerns to the Chamber’s leaders. Another EDO is considering creating an SME board that would facilitate access among small companies and the large firms that are most represented on the board leadership, potentially including direct mentoring opportunities. Along the same lines, the Nashville Chamber launched Leadership Connect, a program to expose leaders of small businesses to executives of larger firms as a way to broaden the diversity of leadership circles and consider the concerns of a new set of stakeholders. The Indianapolis Chamber is leading an anchor institution strategy (see below) that will connect major employers with smaller local-serving firms that aren’t typically part of an EDO’s universe but can provide quality jobs in under-served neighborhoods. It also runs a how to do business with series that introduces potential suppliers to large companies.
Assisting and motivating firms. Firms have to grow in order to provide jobs; and, larger, more innovative and profitable firms tend to pay more. Therefore, helping firms be more competitive–something most EDOs already do to some extent–is a necessary precursor to inclusive growth. Targeting assistance to certain types of firms that are especially likely to provide middle-wage jobs or hire from certain populations or neighborhoods is even more effective. Because helping small or disadvantaged
firms to scale up does not tend to drive the major, immediate job gains that EDOs seek, most have treated this role as secondary to regional branding and business attraction. But this may be changing. San Diego offers several examples. The EDC’s Metro Connect program helps small firms diversify their customer base through exports; the 15 firms in the 2016 cohort reported a $5.8 million increase in export sales; and the EDC is part of a regional team that recently received a $1.8 million grant from the Department of Defense to improve the resiliency of small firms in the defense industry supply chain (according to an EDC survey, more than three-quarters of these firms employ fewer than 20 people), which also helps them diversify their customer base. The Indianapolis Chamber offers another example in its Business Ownership Initiative, which provides business coaching and lending for both start-ups and existing firms. It has staff focused specifically on female-owned businesses, the Hispanic population, and formerly incarcerated entrepreneurship support.
Neighborhood focus. While regional EDOs tend to focus exclusively on local issues, partly due to pressure from city- and county-level EDOs, many of the most severe barriers are mainly at the sub-regional level. In order to effectively expand economic opportunity, regional EDOs may therefore need to consider how to engage more in specific neighborhoods. The Nashville Chamber, like most of its peers, has historically focused on mid- to large-sized companies in a few target sectors, but now recognizes it needs to more strategically target its business recruitment and expansion efforts in disadvantaged

COMMITTING TO INCLUSIVE GROWTH 48
areas. Some EDOs have begun discussing how they might use their site selection function to better align location decisions with workforce availability and transport access (although any move to favor particular areas is almost certain to be controversial).
Policy
Education and skills. In every region, some form of post-secondary education is a prerequisite for living wages and upward mobility. The Nashville Chamber’s policy agenda is focused in large part on the region’s K-12 school system. Their focus also includes expanding industry certifications, increasing literacy instruction, and expanding high-quality pre-K. The Indianapolis Chamber also advocates for various changes to the educational and workforce development system. Based on projections that 51 percent of the area’s new jobs will require post-secondary training but only 42 percent of the region currently has such training, it is now emphasizing post-secondary education: its policy platform supports state-based incentives for employer-sponsored co-ops, transferability and reciprocity of course credits between the state’s public community colleges and universities, and the state’s return and complete initiative aimed at re-engaging students with some college credit but no degree.
Transit and housing. Based on data showing that Indianapolis residents spend almost as much on transportation as housing, the Indianapolis Chamber is pushing for an approach that extends beyond affordable housing: it is supporting the Indianapolis
Neighborhood Housing Partnership (INHP) as it develops a multi-million dollar equitable transit-oriented development fund to build affordable housing along future transport corridors. The Nashville Chamber’s policy agenda in this area is focused mainly on passing a transit referendum in May 2018. In the meantime, the Chamber played a major role in ensuring the IMPROVE Act (which raised the gas tax and allowed municipalities to add a surcharge to various taxes to fund transport projects) was approved in the general assembly’s last legislative session.
Re-entry. The Indianapolis Chamber focused on ex-offender re-entry as a significant part of its 2017 legislative agenda. Though state legislation prohibited ban the box legislation at the local level (which would have prevented employers from asking applicants about their criminal records), the Chamber supported incentives for hiring ex-offenders and advocated for adding liability protections for employers that hire them as long as the offense is unrelated to the job.
Partnership
Building awareness. Each EDO committed to the narrative-building process by communicating the business case for inclusion to new and wider audiences. EDOs have a platform for bringing the voice of businesses to issues that they have until now not widely addressed, and an ability to communicate the problem in a dispassionate way. Nashville offers one concrete example of how this work could be extended. As part of its annual Vital Signs report, the Chamber is expanding the
COMMITTING TO INCLUSIVE GROWTH 49
scope of its regional survey to capture the average Nashville resident’s experiences with economic inclusion, housing affordability, and prosperity—intending to build awareness of not only the problem, but also potential and existing solutions. The San Diego Regional EDC plans to promote examples of companies that are adapting their own practices to solve issues related to inclusive growth, such as diversity hiring initiatives and increased flexibility for workers. And the Indianapolis Chamber is developing a regional dashboard, modeled on one created in Minneapolis-Saint Paul, that will track inclusion metrics (such as transit capacity and average wages) rather than focusing solely on traditional growth-related metrics (like capital expenditure and job creation).
Convening and collaboration. These efforts emerged as among the most important roles for EDOs and most difficult to define. However, there were a few examples. The San Diego Regional EDC is not an advocacy organization and is ill-equipped to lead on controversial policies related to land-use and zoning. But it can help create
regional consensus on how to respond to the affordability crisis by providing solid economic data on the importance of increasing housing supply and better aligning employment with population centers. The Nashville Chamber took on this role through several programs to create more robust partnerships between businesses and public schools, including a major career fair for high school freshmen and partnership councils that share industry trends with career-and theme-based high schools. For its part, the Indianapolis Chamber convened a large group of regional stakeholders in 2013 to identify operational efficiencies that Indianapolis Public Schools could pursue to solve a projected $30 million budget deficit. Perhaps the largest challenge to emerge was defining the optimal relationship between EDOs and community development actors. For many EDOs, collaboration across economic development entities remains a work in progress, and strengthening the links with CDOs is both a daunting proposition and an area for further experimentation.
STORIES FROM THE FIELD
Expanding access to networks
Starting a business can be an all-consuming endeavor for entrepreneurs, leaving little time to build new relationships outside their neighborhood or community. This can be
particularly challenging for entrepreneurs from groups that have narrower networks and less access to capital, expertise, and the connections needed to succeed and grow. A new initiative launched by the Nashville Chamber provides one model

COMMITTING TO INCLUSIVE GROWTH 50
for EDOs to address this gap that builds capacity among small-business owners and develops a broader pipeline of civic leaders for the community. Later this year, the Chamber will lead a group of 10 small-business leaders through a six-month program consisting of monthly workshops with community experts organized around different topics, as well as lunch-and-learn opportunities with local leaders. They will also be eligible to participate in the Chamber’s annual Leadership Study Mission to another U.S. city. Both will offer participants new knowledge, skills, and connections to continue to build their businesses and position them to assume greater leadership roles in the community. The program, which is expected to be repeated annually, is open to existing Chamber members and other small businesses more than two-years old.
Making economic inclusion an organizational priority
Before joining the Syracuse, NY-based EDO CenterState CEO, Dominic Robinson spent over a decade as a non-profit leader on the city’s north side, developing workforce strategies to connect residents to employment at local hospitals, helping immigrants start new businesses, and building relationships with other civic groups like CenterState CEO. When poverty and lack of opportunity (and their impact on regional competitiveness) inspired the group to address these issues with a Department of Economic Inclusion, Robinson joined it, bringing a level of understanding and community trust that helped the organization develop a comprehensive approach to inclusive
economic development. That includes activities around job and career paths, small and minority-owned business development, community development, and broader efforts to convene leaders and help change policies. By institutionalizing this focus, CenterState CEO has also been able to integrate inclusion across other portfolios, such as ensuring that its innovation and entrepreneurship efforts consider ways to support minority business owners.46
Inclusive growth as an institutional mission
Portland, Ore. was no stranger to urban renewal and bulldozing neighborhoods to build highways and other large-scale developments in the 1950s and even more recently. But as other cities are now removing those highways, Portland is going a step further: it is re-orienting its entire city economic development practice to make amends for those practices and other policies that contributed to the exclusion of disadvantaged populations. Earlier this year, the Portland Development Commission, the city’s economic development agency, re-named Prosper Portland, adopted the goal of building an equitable economy. While it will continue to focus on growth, it will also support goals including inclusive entrepreneurship, public health, and workforce development, involving formerly incarcerated individuals (among others). Portland’s strong stance on equity is partly fostered by the fact that it is a city agency which does not answer directly to business leadership. But by deeply embedding inclusion in its institutional model, and launching its

COMMITTING TO INCLUSIVE GROWTH 51
own initiatives, it presents an interesting experiment for others.
Anchor strategies
Rows of hydroponic lettuce are sprouting in the dead of a cold Midwestern winter at Farm360 on Indianapolis’ Near East Side. Majority-owned by the Englewood Community Development Corporation, Farm360 is an urban farm housed in a converted HVAC facility in the city’s federally-designated Promise Zone, providing job opportunities for neighborhood residents, including formerly incarcerated individuals. Farm360 hopes to expand by ensuring that local hospitals and educational institutions buy its locally-grown spring mix, rather than greens sourced from California. Convincing anchor institutions to put their procurement might behind local and often-minority owned businesses is increasingly seen as low-hanging fruit for inclusive economic development, intentionally harnessing demand from strong local institutions and building capacity among smaller firms and suppliers. In Indianapolis, the Indy Chamber is leading a broader strategy, working with 20 county universities, hospitals, and other anchors. Centered around three goals—getting anchors and their employees to live, buy, and hire in Marion County—the initiative focuses on areas where anchors and local businesses can find shared value through business opportunities, rather than traditional charitable giving. In Chicago, the three-year old Chicago Anchors for a Strong Economy initiative has developed a four-part strategy, working with anchors to reform procurement policies and develop neighborhood strategies, with
local businesses and suppliers to deliver on anchor contracts, and with workforce development officials to develop local talent for these firms. That effort has involved 16 anchors and over 350 local businesses to date.47
Targeted skills interventions
Inside a trailer bordering Naval Base San Diego and the San Diego Bay, Navy veterans and service members sit back-to-back at two rows of computers for lessons in welding and other advanced manufacturing trades before going to a neighboring warehouse to test their knowledge hands-on. The students are in a four-month program, Workshops for Warriors, designed for veterans and service members who often struggle to translate their military experience to civilian careers. The curriculum is industry-driven and provides certifications for nationally-recognized credentials, giving graduates the skills that are in demand. As of 2015, 94 percent of graduates were placed into jobs and as of 2017, 436 graduates had earned over 2,000 industry-recognized credentials. The program is an example of tailoring an intervention to address both specific barriers and demands for labor.
Aligning systems to expand opportunity
In Seattle, several local and national analyses showing widening disparities prompted regional public and private leaders, including the City of Seattle, King County, Seattle Metropolitan Chamber of Commerce, and the Seattle Foundation to launch the Seattle Regional Partnership to better coordinate disparate workforce efforts. With a focus on technology,

COMMITTING TO INCLUSIVE GROWTH 52
CONCLUSION
In July 2017, as the Nashville, San Diego, and Indianapolis groups put the finishing touches on their narratives, the U.S. economy closed its recession-era jobs gap.48 Payrolls have rebounded to re-employ those who lost jobs during the Great Recession and provide new opportunities for those who entered the labor market since the crash. Nine years after plummeting housing values, mass layoffs, and the failure or near-failure of large financial institutions spurred panic about the future of the U.S. economy, the sense of immediate crisis has faded.
Yet a sense of relief is shortsighted. As the companion paper, Opportunity for growth, observes, the recovery obscures deeper ills within an economy that leaves many behind and faces further disruption. A child born in metropolitan America, a student graduating from high school or completing a post-secondary degree or credential, and even workers well into careers all face increasingly unstable trajectories. The digitization of skills, depressed wages, and business practices are injecting uncertainty into hiring, scheduling, and other foundations of work. Firms, meanwhile, face the headwinds of an increasingly competitive global
economy and the urgent need to jump-start productivity. Their communities, in turn, face the challenge of reconciling populations unprepared for the future and plagued by myriad other barriers—among them insufficient access to transport, drug use, and a dearth of affordable housing—with an economy delivering less robust, innovative growth.
Building an advanced economy that works for all is a mission that is crucial to the future of America’s cities and metropolitan areas, but not necessarily an easy road for EDOs nor one they can pursue on their own. The organizations profiled in this report are at the vanguard of defining how they can assert leadership, yet they are also at the beginning. Making the case to act must lead to taking action. And as the challenges accelerate, more places, more organizations, and more partners will need to step up and question how their missions, strategies, and practices address the complex mix of economic, sociological, and ultimately political questions facing the U.S. over the coming decades.
healthcare, and manufacturing industries and on paths to middle-wage good jobs, the Partnership is examining occupations, employer needs, and workforce strategies already underway to pinpoint gaps. This will inform areas ripe for more coordinated
approaches and new solutions, including ways to address transport, child care, and other barriers. The Partnership’s approach to convening, coordinating, and aligning across sectors offers a model for tackling skill challenges at a regional scale.

COMMITTING TO INCLUSIVE GROWTH 53
ENDNOTES
1 Joel Kotkin, “The cities creating the most high
wage jobs,” Forbes, June 26, 2017.
2 David Plazas, “The Costs of Growth and Change in
Nashville,” The Tennessean, January 29, 2017.
3 Raj Chetty and Nathaniel Hendren, “The Effects of Neighborhoods on Intergenerational Mobility II: County-Level Estimates,” Working Paper No. 23002, (Cambridge, MA: National Bureau of Economic Research, 2017).
4 Neil Irwin, “Workers Are Getting a Bit More of the
Economic Pie (And Shareholders Less),” The New
York Times, May 3, 2016.
5 Danielle Paquette, “In this part of the Midwest,
the problem isn’t China. It’s too many jobs.,” The
Washington Post, June 20, 2017.
6 Jim Tankersley, “American dream collapsing
for young adults, study says, as odds plunge that
children will earn more than their parents,” The
Washington Post, December 8, 2016.
7 Richard Shearer and Alan Berube, “The surprisingly short list of US metro areas achieving inclusive economic growth,” The Avenue, April 27, 2017.
8 Amy Liu, “Remaking Economic Development: The Markets and Civics of Continuous Growth and Prosperity” (Washington: Brookings Institution, 2016).
9 Richard Shearer et al., “Metro Monitor: An index
of inclusive economic growth in the 100 largest
U.S. metropolitan areas,” (Washington: Brookings
Institution, 2017).
10 Mark Muro, “Tech in metros: The strong are
getting stronger,” The Avenue, March 8, 2017.
11 Mark Fisher and Matt Impink, “The socioeconomic
stakes of transit,” The Avenue, March 28, 2017.
12 Raj Chetty et al., “Where is the Land of
Opportunity? The Geography of Intergenerational
Mobility in the United States,” Quarterly Journal of
Economics 129 (4), (2014).
13 Louise Anderson and Joshua M. Hurwitz, “Opportunity for All: Strategies for Inclusive Economic Development” (Washington: International Economic Development Council, 2016). Chris Benner and Manuel Pastor, “Embracing the Challenge: The Diversity, Equity, and Inclusion Imperative for Chambers of Commerce” (Alexandria, VA: Association of Chamber of Commerce Executives, 2017).
14 Joseph Parilla, “Opportunity for growth: How
reducing barriers to economic opportunity can
benefit workers, firms, and local economies,”
(Washington: Brookings Institution, 2017).
16 Gary Kunkle, “Building scale and sustaining
growth: The surprising drivers of job creation”
(Cassopolis, MI: Institute for Exceptional Growth
Companies, 2013).
17 Gustavo Grullon, Yelena Larkin, and Roni Michaely,
“Are US Industries Becoming More Concentrated?,”
2017, available at: https://ssrn.com/abstract=2612047.
18 Mark Muro, “It won’t be easy to bring back millions
of manufacturing jobs,” The Avenue, November 18,
2016.
19 Thomas Cafcas and Greg LeRoy, “Will Amazon
Fool Us Twice? Why State and Local Governments
Should Stop Subsidizing the Online Giant’s Growing
Distribution Network,” (Washington: Good Jobs First,
2016).
20 Liu, “Remaking Economic Development: The
Markets and Civics of Continuous Growth and
Prosperity”.
21 Ibid.
22 Maryann Feldman and Michael Storper, “Economic
growth and economic development: Geographic
dimensions, definitions, and disparities.” In Gordon
Clark et al., eds, The New Handbook of Economic

COMMITTING TO INCLUSIVE GROWTH 54
Geography (Oxford: Oxford University Press, 2016).
23 Center for Policy Initiatives, “Making Ends Meet,”
2017, available at: https://www.cpisandiego.org/
reports/making-ends-meet-2/.
24 Stephanie Hoopes, “The United Way Alice Report
– 2016 Update for Indiana”, (Indianapolis: Indiana
Association of United Ways, 2016).
25 Indianapolis Chamber analysis of data from
Indiana Department of Workforce Development.
26 San Diego Regional EDC analysis of data from
EMSI.
27 Elizabeth Kneebone and Natalie Holmes, “U.S.
Concentrated Poverty in the Wake of the Great
Recession,” (Washington: Brookings Institution, 2016).
28 Martha Ross and Nicole Prchal Svajlenka,
“Employment and Disconnection Among Teens
and Young Adults: The Role of Place, Race, and
Education,” (Washington: Brookings Institution, 2016).
Erik Hurst, “Video killed the radio star,” Chicago
Booth Review, September 1, 2016.
29 San Diego Regional EDC analysis of data from
U.S. Census Bureau, EMSI, and San Diego Association
of Governments.
30 Raj Chetty et al., “Where is the Land of
Opportunity? The Geography of Intergenerational
Mobility in the United States”.
31 Elizabeth Kneebone and Alan Berube, Confronting
Suburban Poverty in America (Washington, D.C.:
Brookings Institution, 2013).
32 Rachel Barker and Joseph Parilla, “Trying to
create more seats on the innovation rocket ship,” The
Avenue, July 10, 2017.
33 Maryann Feldman et al., “Economic Development:
A Definition and Model for Investment,” (Washington:
U.S. Economic Development Administration, 2014).
34 Richard Reeves, Elizabeth Kneebone, and Edward
Rodrigue, “Five evils: Multidimensional poverty and
race in America,” (Washington: Brookings Institution,
2016).
35 San Diego Regional EDC analysis of data from
California Employment Development Department.
36 San Diego Regional EDC analysis of data
from University of California, Cal State University,
University of San Diego, National University, and Mira
Costa College.
37 Nashville Chamber analysis of data from U.S.
Department of Housing and Urban Development and
EMSI.
38 Cheryl Young, “Teacher, teacher, can you live
here?,” Trulia’s Blog, April 12, 2017.
39 Elizabeth Kneebone and Natalie Holmes, “The
growing distance between people and jobs in
metropolitan America,” (Washington: Brookings,
2015).
40 David Plazas, “The Costs of Growth and Change
in Nashville,” The Tennessean, January 29, 2017.
41 On housing needs, see Joey Garrison, “Nashville
needs 31,000 new affordable housing rental units by
2025, report says,” The Tennessean, May 23, 2017. On
Barry’s proposal, see Joey Garrison, “Megan Barry’s
new $2.2B budget hits on affordable housing, policy
body cameras, transit,” The Tennessean, April 26,
2017.
42 Elizabeth Kneebone and Natalie Holmes,
“The growing distance between people and jobs
in metropolitan America,” (Washington, D.C: The
Brookings Institution, 2015).
43 Peter Truog, “One Key to a Rust Belt Comeback:
Job Hubs,” CityLab, June 25, 2017.
44 Katharine Bradbury and Robert K. Triest, “Inequality of Opportunity and Aggregate Economic Performance,” RSF: The Russell Sage Foundation Journal of the Social Sciences 2(2) (2016).
45 Sarah Treuhaft, Justin Scoggins, and Jennifer
Tran, “The Equity Solution: Racial Inclusion Is Key to

COMMITTING TO INCLUSIVE GROWTH 55
Growing a Strong Economy,” (Oakland, CA: PolicyLink,
2014).
46 Amy Liu, “Including inclusion: A new approach
to economic development in Upstate New York,” The
Avenue, February 4, 2016.
47 Chicago Anchors for a Strong Economy, http://
www.chicagoanchors.com, accessed August 15, 2017.
48 Diane Whitmore Schanzenback et al., “The
Closing of the Jobs Gap: A Decade of Recession and
Recovery,” (Washington: Brookings, 2017).

COMMITTING TO INCLUSIVE GROWTH 56
ACKNOWLEDGMENTS
The Brookings Institution is a nonprofit organization devoted to independent research and policy solutions. Its mission is to conduct high-quality, independent research, and, based on that research, to provide innovative, practical recommendations for policymakers and the public. The conclusions and recommendations of any Brookings publication are solely those of its author(s), and do not reflect the views of the Institution, its management, or its other scholars.
The Brookings Metropolitan Policy Program wishes to acknowledge the Metropolitan Council, a network of business, civic, and philanthropic leaders who act as financial and intellectual partners of the Program. The San Diego Regional Economic Development Corporation is a member of the Metropolitan Council.
Brookings recognizes that the value it provides is in its absolute commitment to quality, independence, and impact. Activities supported by its donors reflect this commitment.
For their partnership on the Inclusive Economic Development Learning Laboratory, the authors thank Julia Kraeger, Joe Parilla and the teams from the Indianapolis Chamber (Mark Fisher and Matt Impink, and Drew Klacik of the IU Public Policy Institute), the Nashville Chamber (Garrett Harper, Courtney Ross, and Whitney Weeks), and San Diego Regional EDC (Erik Caldwell of the City of San Diego, Nikia Clarke, Kate Gallagher, Matt Sanford, Eduardo Velasquez, Mary Walshok of UC San Diego, and Reginald Jones of the Jacobs Center). For their comments or advice on drafts of this paper, the authors thank Nikia Clarke, Mark Fisher, Michael Gurton, Garrett Harper, Matt Impink, Drew Klacik, Amy Liu, Noah Siegel, Eduardo Velazquez, and Whitney Weeks. The authors would also like to thank a broader group of local leaders that provided insights from their communities: MarySue Barrett, Tawanna Black, Pat O’Brien, Dominic Robinson, Rob Simpson, Ben Sio, Peter Truog, Brad Whitehead, Mary Ellen Wiederwohl, and Alessandra Zielinski. Thanks are also given to Barbara Koeppel for editing, Shanthony Exum for layout and design, and Anthony Fiano and David Lanham for web layout.
IMAGE CREDITSCover photo by MCC_Indianapolis/Flickr.
Metropolitan Policy Program at Brookings
1775 Massachusetts Avenue, NW
Washington, D.C. 20036-2188
Telephone: 202.797.6000
Fax: 202.797.6004
Website: www.brookings.edu
About the Metropolitan Policy Program at Brookings
The Metropolitan Policy Program at Brookings delivers research and solutions to help metropolitan leaders build an advanced economy that works for all. To learn more, visit www.brookings.edu/metro.