Commitments Slide (002)
2
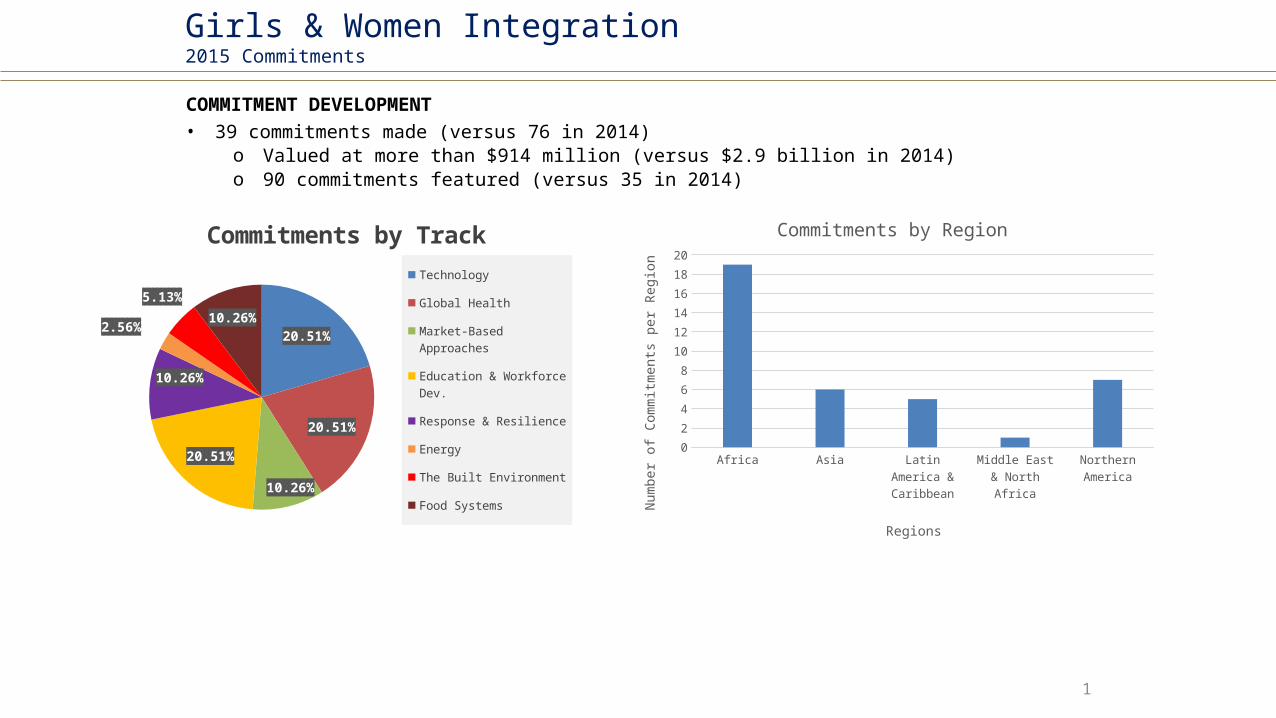
1 COMMITMENT DEVELOPMENT • 39 commitments made (versus 76 in 2014) o Valued at more than $914 million (versus $2.9 billion in 2014) o 90 commitments featured (versus 35 in 2014) Girls & Women Integration 2015 Commitments 20.51% 20.51% 10.26% 20.51% 10.26% 2.56% 5.13% 10.26% Commitments by Track Technology Global Health Market-Based Approaches Education & Workforce Dev. Response & Resilience Energy The Built Environment Food Systems Africa Asia Latin America & Caribbean Middle East & North Africa Northern America 0 2 4 6 8 10 12 14 16 18 20 Commitments by Region Regions Number of Commitments per Region
-
Upload
sumaiya-sarawat -
Category
Documents
-
view
22 -
download
0
Transcript of Commitments Slide (002)
1
COMMITMENT DEVELOPMENT• 39 commitments made (versus 76 in 2014)
o Valued at more than $914 million (versus $2.9 billion in 2014)o 90 commitments featured (versus 35 in 2014)
Girls & Women Integration2015 Commitments
20.51%
20.51%
10.26%
20.51%
10.26%
2.56%
5.13%10.26%
Commitments by Track
Technology
Global Health
Market-Based Approaches
Education & Workforce Dev.
Response & Resilience
Energy
The Built Environment
Food Systems
Africa
Asia
Latin
Ameri
ca &
Car
ibbea
n
Middle
East &
North
Afric
a
Norther
n America
0
4
8
12
16
20
Commitments by Region
Regions
Num
ber o
f Com
mitm
ents
per
Reg
ion
2
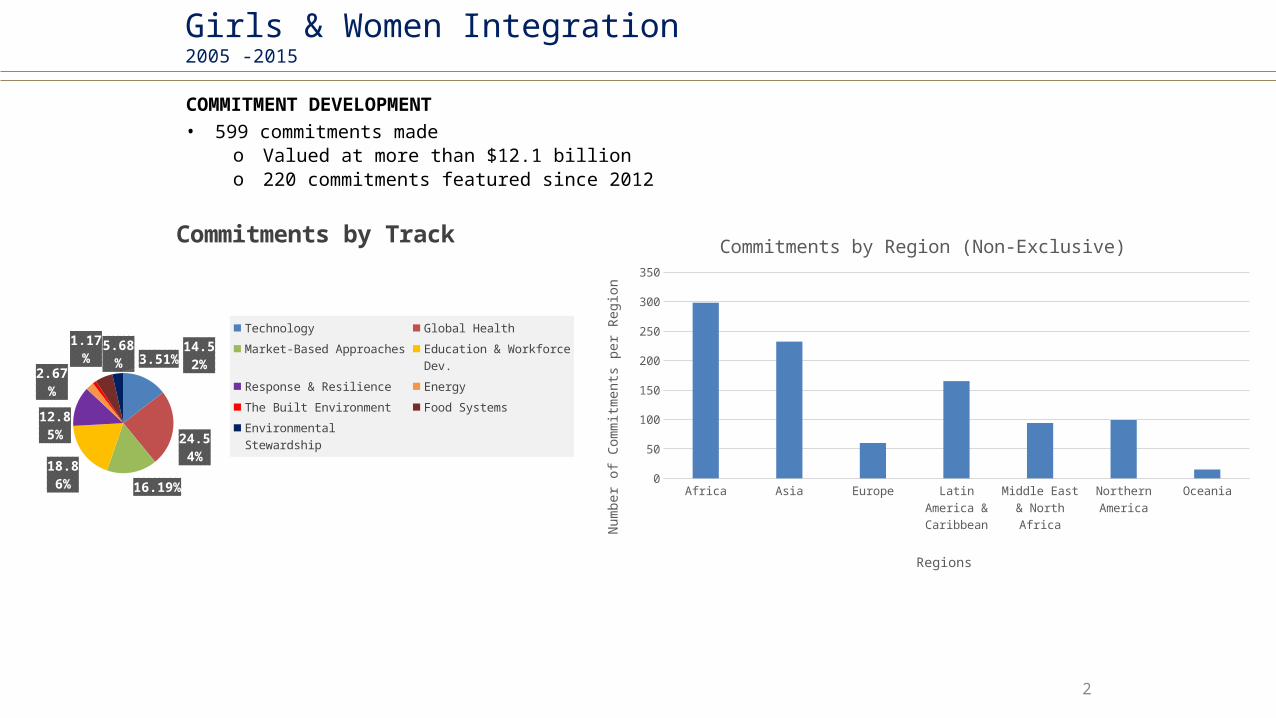
COMMITMENT DEVELOPMENT• 599 commitments made
o Valued at more than $12.1 billiono 220 commitments featured since 2012
Girls & Women Integration2005 -2015
14.52%
24.54%
16.19%
18.86%
12.85%
2.67%
1.17%
5.68%
3.51%
Commitments by Track
TechnologyGlobal HealthMarket-Based ApproachesEducation & Workforce Dev.Response & ResilienceEnergyThe Built EnvironmentFood SystemsEnvironmental Stewardship
Africa Asia Europe Latin America & Caribbean
Middle East & North Africa
Northern America
Oceania0
50
100
150
200
250
300
350
Commitments by Region (Non-Exclusive)
Regions
Num
ber o
f Com
mitm
ents
per
Reg
ion