Commentary on the Klamath River Settlement...
19
November 9, 2007 Commentary on the Klamath River Settlement Agreement Bill Trush 980 7 th Street McBain and Trush Arcata, California 95518 Introduction The Klamath Settlement Independent Review Project, through the Northcoast Environmental Center, contracted two independent scientists to review and evaluate the Draft Settlement Agreement. As a river ecologist, my review focuses on the potential biological, geomorphic, and ecological risks and benefits of proposed and modeled instream flows (e.g., the WRIMS R31 instream flow prediction) for the Upper Klamath River mainstem and whether, or to what extent, these ecological concerns have been adequately and clearly accommodated in the Settlement Agreement. Decommissioning the four dams will be the key to recovering anadromous salmonids to the upper Klamath River Basin. Without decommissioning, future salmon access to cold water (a commodity in short supply) would be denied, the opportunity of re-establishing diverse life history strategies (an insurance policy against catastrophic events) would be effectively eliminated, and the prospect of reducing fish disease significantly jeopardized. Instream flows that promote good spawning and juvenile rearing habitat conditions will help realize the tremendous potential benefits that dam decommissioning offers. Pre-Project Annual Hydrographs at Keno Pre-project annual hydrographs for the USGS gaging station at Keno from WY1905 to 1913 provide the most straightforward record of how unregulated daily average streamflows likely varied in the upper mainstem Klamath River (Figure 1). Hecht and Kamman (1996, Figure 6) plot mean annual precipitation from WY1905 to WY1993 and conclude that (p.13): “…the 1905 through 1912 period was one of slightly greater-than- average rainfall and runoff in much of the upper Klamath basin.” This 7-yr period, relative to the entire record in their Figure 6, does not appear especially wet. Hecht and Kamman (1996) note that: “The long term rainfall record for Klamath Falls, Oregon suggests this was a period of normal precipitation, averaging 104 percent of the mean for the period 1905 through 1994.” The greatest deficiency/uncertainty of the WY1905 to
-
Upload
phungkhuong -
Category
Documents
-
view
216 -
download
0
Transcript of Commentary on the Klamath River Settlement...

November 9, 2007
Commentary on the Klamath River Settlement Agreement
Bill Trush
980 7th Street
McBain and Trush Arcata, California 95518
Introduction The Klamath Settlement Independent Review Project, through the Northcoast Environmental Center, contracted two independent scientists to review and evaluate the Draft Settlement Agreement. As a river ecologist, my review focuses on the potential biological, geomorphic, and ecological risks and benefits of proposed and modeled instream flows (e.g., the WRIMS R31 instream flow prediction) for the Upper Klamath River mainstem and whether, or to what extent, these ecological concerns have been adequately and clearly accommodated in the Settlement Agreement. Decommissioning the four dams will be the key to recovering anadromous salmonids to the upper Klamath River Basin. Without decommissioning, future salmon access to cold water (a commodity in short supply) would be denied, the opportunity of re-establishing diverse life history strategies (an insurance policy against catastrophic events) would be effectively eliminated, and the prospect of reducing fish disease significantly jeopardized. Instream flows that promote good spawning and juvenile rearing habitat conditions will help realize the tremendous potential benefits that dam decommissioning offers.
Pre-Project Annual Hydrographs at Keno Pre-project annual hydrographs for the USGS gaging station at Keno from WY1905 to 1913 provide the most straightforward record of how unregulated daily average streamflows likely varied in the upper mainstem Klamath River (Figure 1). Hecht and Kamman (1996, Figure 6) plot mean annual precipitation from WY1905 to WY1993 and conclude that (p.13): “…the 1905 through 1912 period was one of slightly greater-than-average rainfall and runoff in much of the upper Klamath basin.” This 7-yr period, relative to the entire record in their Figure 6, does not appear especially wet. Hecht and Kamman (1996) note that: “The long term rainfall record for Klamath Falls, Oregon suggests this was a period of normal precipitation, averaging 104 percent of the mean for the period 1905 through 1994.” The greatest deficiency/uncertainty of the WY1905 to

WY1912 unregulated annual hydrographs as a representative sample of unregulated annual hydrographs is that very wet and very dry annual hydrographs are absent. Annual hydrographs were infrequently used in the instream flow analyses, especially these unimpaired annual hydrographs. Reliance on mean monthly streamflows, and exceedence probabilities of these mean monthly streamflows, divorced researchers from the reality of variable streamflows in the mainstem Klamath that a single Chinook salmon fry, for example, might experience over several months or even within a month. An effective ecological analysis of streamflows cannot be accomplished using monthly, bi-weekly, or average exceedence probability curves because none of these sufficiently portray the within-year and between-year flow variability. Each annual hydrograph uniquely influences the aquatic ecosystem, including salmon and steelhead. Our Chinook fry emerging from the gravel on February 15 isn’t exposed to an averaged fluvial environment described via a probability distribution, but a fluvial environment specific to that day’s streamflow. As our fry’s life unfolds, its immediate success - surviving yet another day – will depend in large part on how good former days were. An ecological analysis sensitive to day-to-day influences is best accommodated by annual daily average hydrographs. Figure 1. Unimpaired annual hydrographs at Keno from WY1905 through WY1912.
Klamath River at Keno, OR
Annual Daily Average Hydrographs (WY1905 to WY1913)
USGS Gaging Station # 11-509500
Drainage area: 3,920 sq. mi.
0
1,000
2,000
3,000
4,000
5,000
6,000
7,000
8,000
9,000
10,000
Oct Nov Dec Jan Feb Mar Apr May Jun Jul Aug Sep
Day of Year
Da
ily
Av
era
ge
Str
ea
mfl
ow
(c
fs)
WY 1905 WY 1906 WY 1907
WY 1908 WY 1909 WY 1910
WY 1911 WY 1912 WY 1913
To include more water years in assessing unimpaired streamflows, annual hydrographs without diversion or flow manipulation, a USBR natural flow study (USBR 2005) modeled unimpaired monthly streamflows at Keno from WY1949 to WY2000 (tabulated for each water year in Table B-1 of the Phase II Final Report (Hardy, Addley, and Saraeva 2006)). This study was essential to objectively assessing instream flows.

Monthly estimates at several exceedences were overlaid onto the WY1905 through WY1912 unimpaired annual hydrographs for comparison (Figure 2). These modeled unimpaired monthly exceedence curves appear to underestimate unimpaired streamflows during the snowmelt runoff period April through July, a time period critical to fry and juvenile Chinook salmon rearing and outmigration. Given that these monthly unimpaired exceedence estimates were used in formulating and evaluating instream flows (e.g., as in the Phase II Final Report), a formal analysis of this bias is needed. Seemingly small errors in estimating streamflow magnitude and timing during April through July can have important effects on habitat abundance and/or habitat quality for anadromous salmonids. Figure 2. Annual unimpaired daily average hydrographs at Keno with modeled unimpaired flow exceedences from the USBR Natural Flow Study.
Klamath River at Keno, OR
Annual Daily Average Hydrographs (WY1905 to WY1913)
with Modeled Unimpaired Flow Exceedences
USGS Gaging Station # 11-509500
Drainage area: 3,920 sq. mi .
0
1,000
2,000
3,000
4,000
5,000
6,000
Oct Nov Dec Jan Feb Mar Apr May Jun Jul Aug Sep
Day of Year
Daily A
vera
ge S
tream
flo
w (
cfs
)
WY 1905 WY 1906 WY 1907
WY 1908 WY 1909 WY 1910
WY 1911 WY 1912 WY 1913
90% Modeled Unimpaired Flow Exceedence 70% Modeled Unimpaired Flow Exceedence 50% Modeled Unimpaired Flow Exceedence
30% Modeled Unimpaired Flow Exceedence 10% Modeled Unimpaired Flow Exceedence Farther downstream and more than 800 mi2 of additional watershed, where Iron Gate Dam is now sited, daily average streamflows would have conservatively been at least another 250 cfs higher (e.g., springs in the Boyle bypass reach), and considerably even higher in wetter months. So there could be more water in the system than the models show? What could this mean for fish, farmers, settlement parties in general? For use in assessing instream flows below Iron Gate Dam, the Keno annual hydrographs in Figure 2 must be shifted upward to account for streamflow augmentation originating from more than 800 mi2 of additional drainage area between Keno and Iron Gate Dam. Adjustment upward of the Keno annual hydrographs was kept simple and conservatively low (underestimating the more likely higher streamflows at Iron Gate). These conservatively (low) augmented Keno annual hydrographs exhibited the same dissimilarities from the

modeled IGD flow exceedences under USBR’s Proposed Action (USBR 2007,Table 3-18, p.210) at Iron Gate Dam and “natural” unimpaired streamflow exceedences in the Phase II Final Report (Hardy, Addley, and Saraeva 2006, Table L-2) at Iron Gate Dam. Visual differences in magnitude were not great, but subtle differences in timing could be extremely important in using modeled unimpaired monthly streamflows as a baseline for ecological analyses.
Instream Flows Downstream of Iron Gate Dam A quantitative comparison among unimpaired, historic impaired, and proposed future annual streamflows needed a common denominator relative to Chinook salmon recovery. After inspecting all the instream flows studies providing streamflow – habitat relationships, and the supporting data/analyses developed for the R-Ranch and Tree-of-Heaven study sites, a streamflow range of 2000 cfs to 6000 cfs in February through April provides abundant, high quality Chinook fry habitat and a streamflow range of 2500 cfs to 9000 cfs in April through June provides abundant, high quality Chinook juvenile habitat. To have a ‘Good’ year for Chinook rearing, fry and juvenile habitat should be abundant all months from mid-February through Mid-June. To have a ‘Poor’ year for Chinook rearing, juvenile habitat would not be abundant in all months from April through mid-June while fry habitat might, or might not, be abundant (because a fry requires less habitat than a juvenile) in all months from mid-February through April. To have a ‘Bad’ year, both juvenile and fry habitat would not be abundant. I first applied this simplified protocol for assessing whether a particular water year was Good, Fair/Poor, or Bad to the unimpaired condition to establish as the idealized recovery goal (i.e., using the USBR natural flow study (Table B-1 WY1949 to WY2000 in the appendices of the Phase II Final Report)). Then I contrasted this ‘goal’ (i.e., how many Good years, Fair/Poor years, and Bad years) to other streamflow scenarios including: (1) USGS impaired streamflows at Iron Gate Dam, (2) USBR WRIMS Iron Gate Dam Proposed Action (USBR 2007 Table 3-18), (3) R32 WRIMS Refuge (October 01, 2007), (4) Phase II Final Integrated Instream Flow Recommendations, and (5) USGS WY1905 to WY1913 annual hydrographs at Keno adjusted to Iron Gate Dam. The percentages of Good, Fair/Poor, and Bad years providing abundant Chinook salmon rearing under different natural and regulated streamflow scenarios were as follows: USBR Natural Flow Study (Table B-3 Monthly by WY, Phase II Final Report 2006)
Good 79% Fair/Poor 15% Bad 6% WY1905 to WY1913 (USGS at Keno Annual Hydrographs Conservatively Adjusted to Iron Gate Dam)
Good 78% Fair/Poor 22% Bad 0% USBR Natural Flow Study (Table L-2 Flow Exceedence Probabilities, Phase II Final Report 2006)
Good 75% Fair/Poor 20% Bad 5%
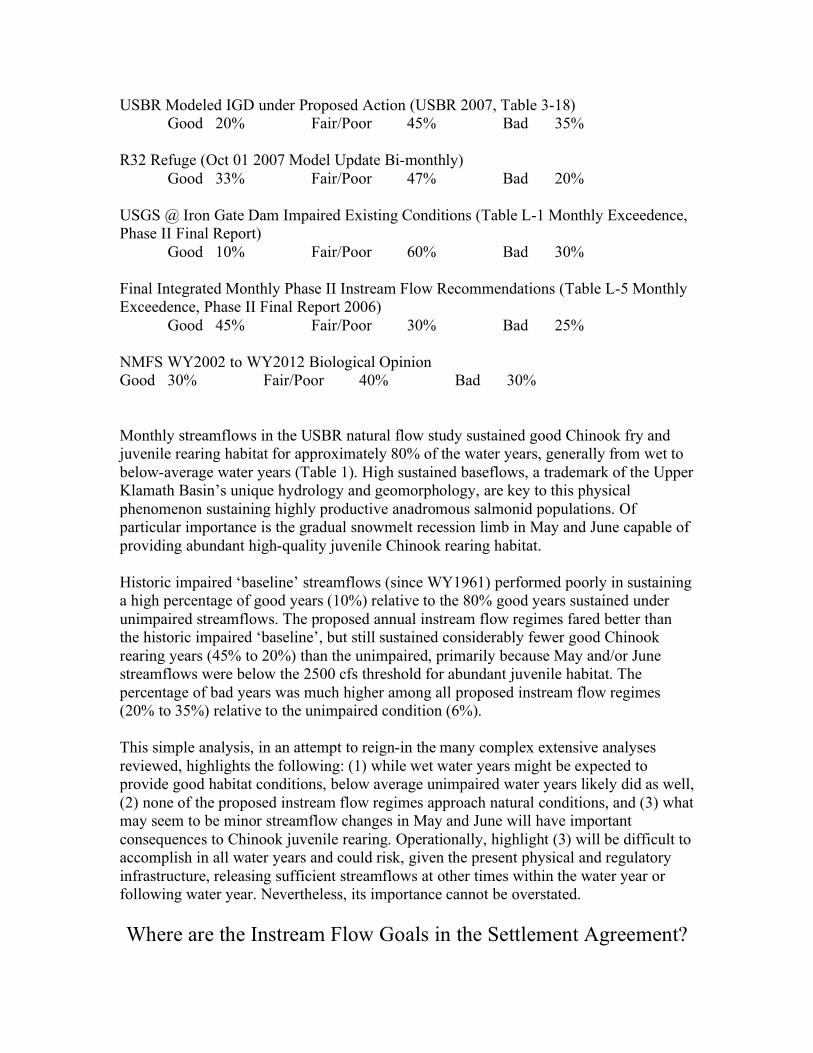
USBR Modeled IGD under Proposed Action (USBR 2007, Table 3-18) Good 20% Fair/Poor 45% Bad 35%
R32 Refuge (Oct 01 2007 Model Update Bi-monthly)
Good 33% Fair/Poor 47% Bad 20% USGS @ Iron Gate Dam Impaired Existing Conditions (Table L-1 Monthly Exceedence, Phase II Final Report)
Good 10% Fair/Poor 60% Bad 30% Final Integrated Monthly Phase II Instream Flow Recommendations (Table L-5 Monthly Exceedence, Phase II Final Report 2006)
Good 45% Fair/Poor 30% Bad 25% NMFS WY2002 to WY2012 Biological Opinion Good 30% Fair/Poor 40% Bad 30% Monthly streamflows in the USBR natural flow study sustained good Chinook fry and juvenile rearing habitat for approximately 80% of the water years, generally from wet to below-average water years (Table 1). High sustained baseflows, a trademark of the Upper Klamath Basin’s unique hydrology and geomorphology, are key to this physical phenomenon sustaining highly productive anadromous salmonid populations. Of particular importance is the gradual snowmelt recession limb in May and June capable of providing abundant high-quality juvenile Chinook rearing habitat. Historic impaired ‘baseline’ streamflows (since WY1961) performed poorly in sustaining a high percentage of good years (10%) relative to the 80% good years sustained under unimpaired streamflows. The proposed annual instream flow regimes fared better than the historic impaired ‘baseline’, but still sustained considerably fewer good Chinook rearing years (45% to 20%) than the unimpaired, primarily because May and/or June streamflows were below the 2500 cfs threshold for abundant juvenile habitat. The percentage of bad years was much higher among all proposed instream flow regimes (20% to 35%) relative to the unimpaired condition (6%). This simple analysis, in an attempt to reign-in the many complex extensive analyses reviewed, highlights the following: (1) while wet water years might be expected to provide good habitat conditions, below average unimpaired water years likely did as well, (2) none of the proposed instream flow regimes approach natural conditions, and (3) what may seem to be minor streamflow changes in May and June will have important consequences to Chinook juvenile rearing. Operationally, highlight (3) will be difficult to accomplish in all water years and could risk, given the present physical and regulatory infrastructure, releasing sufficient streamflows at other times within the water year or following water year. Nevertheless, its importance cannot be overstated. Where are the Instream Flow Goals in the Settlement Agreement?
Considerable fisheries research has centered on assessing instream flows below Iron Gate Dam as a function of streamflow variability. Wetter years justify greater instream flow releases and should provide more salmon habitat with possibly cooler water temperatures. The Phase II study adopted this approach, recommending instream flows below Iron Gate Dam based on unimpaired streamflow exceedences and streamflow - habitat relationships (Hardy, Addley, and Saraeva (2006), Table L-5). In contrast, the USBR followed a minimalist approach in assessing instream flows, presenting a set of minimum monthly instream flows independent of water year type (USBR 2007, Table 1-3). These minimums are an improvement over the historical impaired minimum instream flow releases since WY1961. WY1961. But what about higher instream flows? USBR states (USBR 2007, p. 15) that: “Annual IGD releases to the river will be higher [than the stated minimums] in most other years, with striving toward target flows being the goal.” What are the ‘target flows’ referenced as ‘goals’? Element 3, Section 1 in the USBR Biological Assessment (p. 18) is titled: “Target River Flows and Lake Elevations.” However, nowhere in this two-paragraph section are target flows presented or referenced. There are no stated instream flow goals other than the minimum releases in Table 1-3. Instead, the Interactive Management (IM) team/process has been offered as a substitute. An integrative management team working on real-time flow management is a good idea, but even such a team must have goals commensurate with recovery, and not simply be held to the minimum monthly releases. USBR (2007) employed the WRIMS model to forecast what instream flows an IM process might produce using the WY1961 to WY2004 historical data. Monthly flow exceedences presented in Table 1-5 and in Table 3-18 (expressed in 5% exceedence increments) are presumably these “target” flows without them actually being defined goals. USBR cautions that (p. 20): “It should be noted that WRIMS has the luxury of going back in time and using actual historical UKL, LRDC and KSD inflows to adjust monthly distributions for river flows and lake levels. Specific replication of these scenarios today would be somewhat limited by the unpredictable future of the inflows listed above as well as a number of other factors including: precipitation, snow pack and soil moisture content, temperature, etc. Operations in the future would attempt to achieve similar results using the IM process described in the BA.” Given USBR having Element 1 (in USBR 2007) as its primary responsibility, should Table 3-18 be considered a best case scenario? What are the consequences to USBR’s contracted water users if Table 3-18 is wrong, i.e., If the projected instream flows prove wrong, will the water users be expected to help rectify them? The January 20, 2007 Settlement Framework provides no reassurance that instream flows commensurate with the Fisheries Program’s purpose “to restore and sustain natural production of fisheries species” or “establish conditions which will contribute to the natural sustainability of fisheries and a robust harvest surplus” (SA Section 6.2) will be released. The Settlement Agreement provides almost no guidance other than referring to USBR: “PacifiCorp shall maintain flow levels and fluctuations pursuant to the Bureau of Reclamation’s annual Klamath Irrigation Project Operations Plan or other requirement. PacifiCorp shall coordinate with Governmental and Tribal Parties in the development of
a plan to provide temporarily enhanced flows on an emergency basis utilizing the estimated active storage at Iron Gate and Copco Reservoirs of 52,000 acre-ft.” So the Settlement Agreement plans to develop a plan for emergency instream flow releases that will establish a robust harvest surplus. With 1 cfs for 24 hours requiring approximately 2 ac-ft of water, bringing a minimum May baseflow from 1500 cfs up to 2500 cfs (for abundant juvenile Chinook habitat) will quickly deplete a 52,000 ac-ft reserve (you do the math, e.g., a 500 cfs release for one day will require 1000 ac-ft of storage). Without quantitative instream flow goals there appears little incentive, as an outside reviewer, to create as many good years as needed for recovery under USBR’s proposed flow management, rather than as many good years as conveniently doable. USBR summarizes (USBR 2007, p.233) their intent as: “Reclamation proposes to use these minimum monthly dry water year type flows in place of four or five (what was referred to as below average, average, above average, and wet in the NMFS 2002 BO). In most years, Reclamation anticipates to be operating above cumulatively monthly minimum flows.” There is no apparent motivation, to an outside reviewer as I, for recovery in this proposal. Water year classification, though far from perfect, nevertheless provides a management framework from which to strive for a desired occurrence of water years that will sustain good Chinook rearing and spawning habitat below Iron Gate Dam and, someday, below Keno Dam. However, in the October 10, 2007 SA an instream flow goal appears, as an alternative to Section 15.3.3, as: The United States acting in its trustee capacity and the Yurok [Hoopa Valley, Karuk]Tribe shall, within 60 days of the signing of this Settlement Agreement, provide a written assurance from these two parties, in the form attached hereto as Appendix __, providing interim assurance that the two will not assert (1) tribal water or fishing rights theories or tribal trust theories in a manner, and (3) the two parties will not assert Yurok [Hoopa Valley, Karuk]tribal or trust water rights in the State of California, whatever they may be, in a manner, that will interfere with the diversion, use or reuse of water for the Klamath Project that is not precluded by the limitation on diversions of water from Upper Klamath Lake and the Klamath River as provided in Appendix ___ in any administrative context or proceeding, or any judicial proceeding, or otherwise provided that the combined effect of such diversions and the water supply enhancement or “water bank” provisions of this Agreement satisfy the recommendations of Hardy, et al., Evaluation of Instream Flow Needs in the Lower Klamath River, Phase II, at 182, Table 27 (July 31, 2006). The Settlement Agreement must establish quantitative goals not just as it does for the water users, but for the salmon as well. The Settlement Agreement needs quantitative criteria for its qualitative desired outcome. The Phase II instream flow allocation is a recommendation for how to achieve a goal, but is not the goal itself. With regard to Chinook salmon below Iron Gate Dam, a stated instream flow goal of sustaining 60% good years (still a major decrease from naturally occurring good years) and less than a doubling of bad years (no more than 10%) would be a good starting point. Without quantitative goals, even if how to reach these goals remains unresolved today, the risk of achieving the Settlement’s fishery goals rises significantly.
While the Phase II recommendations in Table 27 (Hardy, Addley, and Saraeva 2006) provide needed quantitative criteria to the vague language of the Settlement Agreement relative to instream flow releases, these monthly exceedence instream flows should be considered starting points and not final recommendations. The Settlement Agreement must provide a vehicle for taking these recommendations and then understanding why/how they work (see spawning habitat discussion below). In doing so, they can be modified to perform better and require less water. Portions of the Phase II results can be re-analyzed as binary data (i.e., assigning the blue shaded areas (combined depth/velocity preferences greater than 0.75) as good habitat) to better distinguish streamflow – habitat relationships using only the high quality habitat.

Coarse Sediment Re-Introduction Improves Instream Flows
Section 3.5.2 in the Jan 20, 2007 Draft Settlement Framework reads: “Gravel Augmentation. PacifiCorp shall, in consultation with Governmental and Tribal Parties, add approximately 50 cubic yards of spawning gravel suitable for redband trout spawning in four locations in the J.C. Boyle bypass reach and two locations in the Copco bypass reach, and add approximately 200 yards of spawning gravel suitable for anadromous species in the area immediately downstream of Iron Gate Dam.” This provision is extremely inadequate. Unfortunately the Phase II Final Report (Hardy, Addley, and Saraeva 2006, p. 48) contends most alluvial features and associated vegetative communities remain dynamic downstream of Iron Gate Dam. In contrast, PacifiCorp’s geomorphic study (PacifiCorp 2004, Figure 6.7-65, p. 6-155) found almost no alluvial features upstream of Cottonwood Creek (9 miles downstream of Iron Gate Dam), in contrast to farther downstream, and concluded (in 6.7.16.2 Watershed Area Quantification, p. 6-157) that “From this analysis, it appears that Project impacts on river corridor geomorphology downstream of Iron Gate Dam are probably no longer significant near the confluence with the Shasta River and almost certainly are no longer significant near the confluence with the Scott River.” The Project effect of eliminating most coarse bed material supply, but still passing flood magnitudes capable of significant coarse sediment transport, will require much more than a 200 cubic yard infusion as mitigation below Iron Gate or a 50 cubic yard infusion farther upstream in the bypass reaches. Coarse sediment re-introduction was recognized and adopted as a key management strategy for partially mitigating dam impacts and creating more available anadromous salmonid habitat on the Trinity River. The Settlement participants should adopt, and specify in the Settlement Agreement, a similar strategy for the mainstem Klamath River from Keno to the Shasta River confluence. The R-Ranch site likely has been significantly modified by the Klamath Hydroelectric Project, geomorphically and with respect to woody riparian vegetation, despite the Phase II Report’s assertion otherwise. With the dams eliminating most bedload supply, but still passing many high magnitude events, bed coarsening and channel cross sectional changes were inevitable. Selection of the Phase II R-Ranch site to quantify streamflow – habitat relationships in the mainstem Klamath River above the Shasta River confluence likely misrepresents the mainstem channel’s potential for supplying abundant habitat under existing and proposed instream flow regimes. The ecological consequence of restoring mainstem sediment storage, and sustaining a dynamic channel, should be an improvement to anadromous salmonid rearing and spawning habitat. As channel storage returns from re-introduction, abundant habitat should be sustained over a wider range of streamflows (than shown on the Phase II habitat rating curves) during the snowmelt peak and recession limb in May and June. This seems to be where, on the annual hydrograph, the proposed Settlement instream flows perform most poorly in providing abundant Chinook rearing habitat as discussed previously. Coarse sediment management, therefore, should be considered by Settlement participants as an opportunity to improve the performance of instream flows in providing more habitat for the entire freshwater life cycle of anadromous salmonids (not simply adding gravel to a few spawning sites).
Coarse sediment re-introduction would occur in two stages. The first would be to add coarse bed material (including sizes outside the range for spawning habitat to create alluvial features such as point bars) at an accelerated rate to replenish lost sediment storage, followed by a lower rate to maintain a dynamic equilibrium. The PacifiCorp geomorphology report (PacifiCorp 2004, p. 6-146) estimates that the actual potential deficit of bedload sediment trapped above Iron Gate Dam is approximately 10,000 cubic yards annually. Recommend Section 3.5.2 in the January 20, 2007 SA to read something like: PacifiCorp shall, in consultation with Governmental and Tribal Parties, develop a coarse sediment introduction plan within two years following Settlement agreement that will specify quantitative (yds3) annual introduction coarse sediment volumes for replenishing coarse sediment storage and sustaining a dynamic coarse sediment balance. In the interim of completing this plan, approximately 10,000 cubic yards annually will be re-introduced and monitored below Iron Gate Dam. Given the important role of Cottonwood Creek, providing sediment as well as streamflow close to Iron Gate Dam, annual estimates of bedload input into the mainstem should be made in developing the coarse sediment management plan. The Settlement Agreement implies that dam de-commissioning would eventually result in a replenished and dynamic mainstem channel because coarse sediment trapped behind the four dams would be released. While coarse sediment supply would be made available for downstream transport, if the four dams are decommissioned by 2015, the replenishment and eventual establishment of an equilibrial mainstem channel will take considerably longer to achieve. Given the considerable risk from the uncertainty of sufficient instream flow releases to create many Good years, coarse bed material augmentation, beginning now, is a straightforward measure to counter this risk. Believe No ‘Optimal’ Streamflow for Chinook Spawning Habitat A good spawning year is not measured by the ft2 of spawning area provided by streamflows, as often considered when recommending the ‘optimal streamflow” providing the most spawning habitat, but rather by the percentage of eggs laid that survive to emerge as fry. The USGS Keno annual hydrographs from WY1905 through WY1913 clearly show a gradual ramping-up of autumn streamflows into early-winter (Figure 1). Conservatively adding 250 cfs to the curves in Figure 1 to approximate unimpaired annual hydrographs at Iron Gate Dam, streamflows varied inter-annually roughly between 1000 cfs and 1500 cfs in early-October but reached 1400 cfs to 2000 cfs by mid-November. Following mid-November, annual rainfall generated a wider spread among the water years such that near the end of December streamflows varied from 1900 cfs to 2800 cfs (Figure 1). The relatively high streamflows in WY1905 are likely a result of WY1904 being an extremely large and late snowmelt runoff event (from a partial USGS annual hydrograph for WY1904), with high streamflows (originating from a highly recharged shallow aquifer?) carrying over into the next water year.

Over this range of ramping streamflows, the best salmon spawning habitat will shift location within a given alluvial feature as depths, velocities, and proximity to cover change with streamflow. Subtle shifts in good spawning habitat (combined depth and velocity preference greater than 0.75) can be traced at the Tree-of-Heaven Site from 1123 cfs up to 2048 cfs in Figure 95 through Figure 98 from Hardy and Addley (2001). Habitat shifts would be most pronounced riverwide in a complex channel with topographically variable depositional features. By varying streamflow, different portions of the channelbed will offer high quality spawning habitat through the spawning season. Cumulatively, over the entire spawning migration period, a variable hydrograph will create more spawning habitat than provided by the single steady streamflow. Biological outcomes of this natural strategy would be to offer more cumulative channelbed area for spawning, exceeding the spawning area provided the ‘optimal’ streamflow, and to reduce the likelihood of females excavating existing redds … both leading to greater fry production. A constant streamflow at the ‘optimum’ would not be as productive. A third factor also may come into play. As streamflows increase, good spawning habitat ‘shifts’ from the channel centerline (as out in the tailout of a pool) and toward the banks as water column depths, but particularly velocities, become too high farther out near the centerline. Redds constructed in pool tail-outs at high streamflows will occur more upstream as well as closer to the banks. These channel locations will have a lower risk of deep scour during peak runoff events, than locations farther out and downstream in the pool tail-out. By varying streamflows during the spawning runs, as the natural hydrograph did, the risk of scouring all or most redds from winter storms will be diminished. Operationally, streamflow allocation in the fall is extremely difficult given the uncertainty of forecasting future runoff, e.g., Will the months following spawning be wet or dry months? The effort could be worth it, at least in some years, if the benefits are quantified. The recommended Phase II instream flows (Hardy, Addley, and Saraeva 2006 Table 27, p.182) for October to December do ramp-up at a given exceedence. A better defense for allocating ramping baseflows, rather than relying on natural streamflow patterns as a justification to an often skeptical audience, would be to demonstrate how ramping could diminish risk and females digging up existing redds, and ultimately make even more spawning habitat available than under a steady ‘optimal’ streamflow. For example, USBR (2007, p.205) argues: “Hardy and Addley’s (2006) Maximum Habitat Appendix Tables I-8, I-9, I-10, and I-11, show only minor reductions in the maximum available habitat in the IGD to Seiad reach between IGD releases of 1,300 cfs and 1,000 cfs. A potential change in minimum instream flows, in conjunction with these relatively minor reductions in the maximum available coho salmon habitat, may present increased opportunities to store, spill, or release up to 90,000 AF of additional water later in the year. The results of this change would significantly increase the likelihood of higher spring flows during the months of March through May.” With a more process-backed justification for ramped baseflows, USBR’s comment can be evaluated and possibly recommended. This ecological approach also will help avoid recommendations based on the “optimum” streamflow as again noted by USBR (2007, p.205): “NMFS also stated in
its (p.42, NMFS 2002 BO) that “Model results presented in the draft Phase II report (Hardy and Addley 2001) for Chinook salmon spawning habitat indicate that spawning habitat is maximized at approximately 1300 cfs …” This statement likely led NMFS to recommend 1300 cfs as its minimum monthly instream flow from October through February in all water year types (NMFS 2002 Table 9). Monthly exceedence flows plotted for several flow scenarios being modeled (refer to Greg Kamman’s review) are showing that fall and early-winter baseflows would be considerably lower than under unimpaired or even historically-impaired monthly streamflows. For example, under the 30% monthly exceedence curve (Above Normal Conditions) baseflows ramp-up 1000 cfs from October through early-December under unimpaired and historically-impaired streamflows, but with essentially no ramping under various WRIMS alternatives. Active management of spawning habitat, via fall instream flow prescription, will require a broader sampling strategy than employed in the Phase II investigation. From Iron Gate Dam downstream to the Shasta River confluence, at least 10 to 15 spawning locations should be included. Quantification of spawning habitat – streamflow relationships is a relatively easy life stage habitat to quantify. Other field methods, such as expert habitat mapping (or some derivative), can very efficiently quantify many sites and would require a small budget. By knowing how habitat changes throughout the reach (e.g., down to the Shasta confluence or only above Cottonwood Creek) as a function of streamflow, innovative instream flow prescriptions can be customized to a particular water year.
There’s an Elephant in the Room: Fish Disease The USBR report (USBR 2007) discusses the issue, as does the Phase II Final Report (Hardy, Addley, and Saraeva 2006), but flow recommendations have not been explicitly offered. The connection between nutrient loading, dense benthic algal growth, and abundance of Ceratomyxa’s polychaete host Manayunkia speciosa must be investigated. The release of periodic high flows to scour the algae and the invertebrate host is being discussed, outside the Settlement Agreement language, but I have not been able to pursue this issue as I would have liked.
What About Keno Instream Flow Releases?
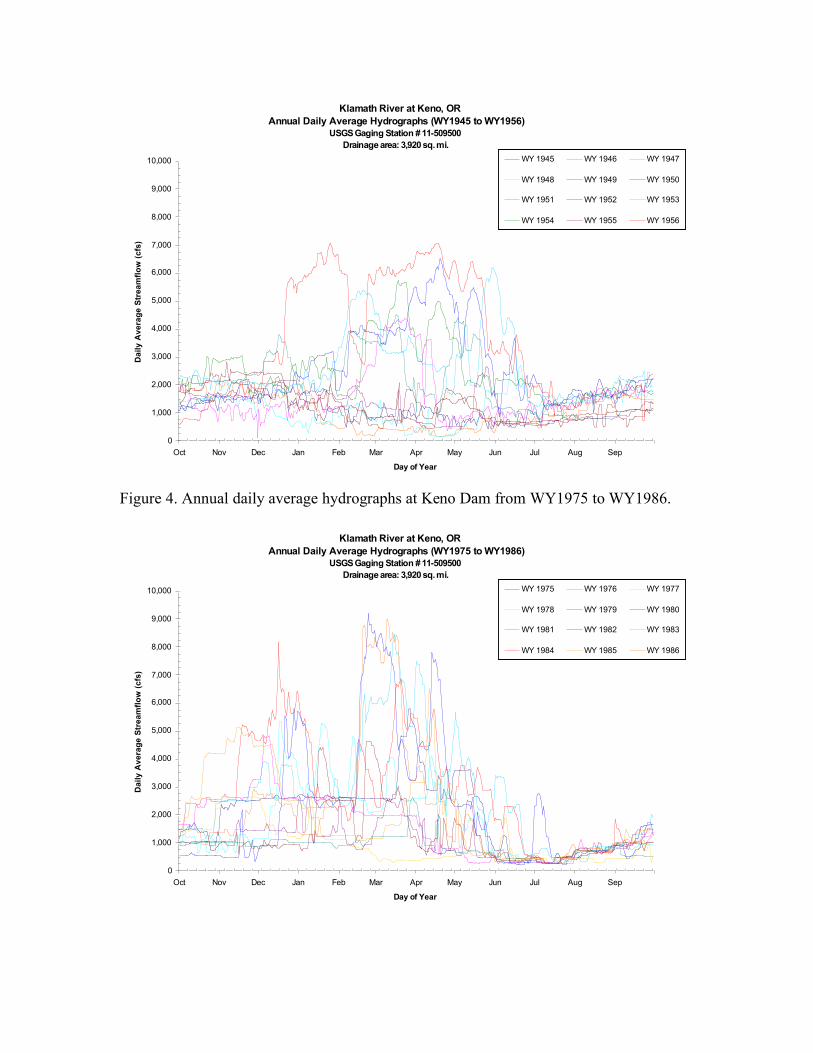
Dam removal below Keno is being considered a major step to salmon and steelhead recovery in the Upper Klamath Basin. Just the mainstem Klamath above Iron Gate Dam up to Keno Dam, considered separately, has considerable potential for providing abundant, high quality spawning and rearing habitat. Instream flows released from Keno Dam will largely affect to what extent this potential will be realized. The Settlement Agreement under Section 3.2.1 states that: PacifiCorp shall manage Keno Dam as a modified run of the river facility and it shall discharge inflow as available below Keno Dam. PacifiCorp shall maintain river flows below Keno Dam to within plus/minus 10 percent of the three-day average Project inflows. Otherwise, PacifiCorp shall maintain existing management of water levels behind the dam during the interim period. Will the present management of Keno releases be a good future habitat provider for salmon and steelhead downstream when the dams downstream are removed? And will provisions in the Settlement Agreement change Keno’s instream flow releases? While many might consider this issue a relatively distant concern (i.e., worry about it after the dams are removed), or possibly that nothing can be done following dam removal, the Settlement Agreement should guarantee some management directive regarding future Keno instream flows and salmon/steelhead recovery. Annual hydrographs at Keno have changed considerably since the early-1900’s. Annual hydrographs for mostly unimpaired WY1905 through WY1913 (Figure 1) are very different from impaired annual hydrographs in WY1945 to WY1956 (Figure 3) and WY1975 to WY1986 (Figure 4). The greater scatter between January and June for impaired annual hydrographs is conspicuous. Figure 3 gives the appearance of the snowmelt hydrograph being scooped out, relative to the unimpaired hydrographs in Figure 1. March and late-June will be crucial to rearing new salmon generations. If former annual hydrographs (e.g., Figures 3 and 4) forecast future annual hydrographs, when the other dams are removed, do the agencies consider these annual hydrographs conducive to salmon and steelhead recovery? The Settlement Agreement does not address this concern, which could be a major set-back given the huge step of dam de-commissioning to access miles of habitat only to surmise that the flows don’t fit. Figure 3. Annual daily average hydrographs at Keno Dam from WY1945 to WY1956.
Klamath River at Keno, OR
Annual Daily Average Hydrographs (WY1945 to WY1956)
USGS Gaging Station # 11-509500
Drainage area: 3,920 sq. mi.
0
1,000
2,000
3,000
4,000
5,000
6,000
7,000
8,000
9,000
10,000
Oct Nov Dec Jan Feb Mar Apr May Jun Jul Aug Sep
Day of Year
Da
ily
Av
era
ge
Str
ea
mfl
ow
(c
fs)
WY 1945 WY 1946 WY 1947
WY 1948 WY 1949 WY 1950
WY 1951 WY 1952 WY 1953
WY 1954 WY 1955 WY 1956
Figure 4. Annual daily average hydrographs at Keno Dam from WY1975 to WY1986.
Klamath River at Keno, OR
Annual Daily Average Hydrographs (WY1975 to WY1986)
USGS Gaging Station # 11-509500
Drainage area: 3,920 sq. mi.
0
1,000
2,000
3,000
4,000
5,000
6,000
7,000
8,000
9,000
10,000
Oct Nov Dec Jan Feb Mar Apr May Jun Jul Aug Sep
Day of Year
Da
ily
Av
era
ge
Str
ea
mfl
ow
(c
fs)
WY 1975 WY 1976 WY 1977
WY 1978 WY 1979 WY 1980
WY 1981 WY 1982 WY 1983
WY 1984 WY 1985 WY 1986
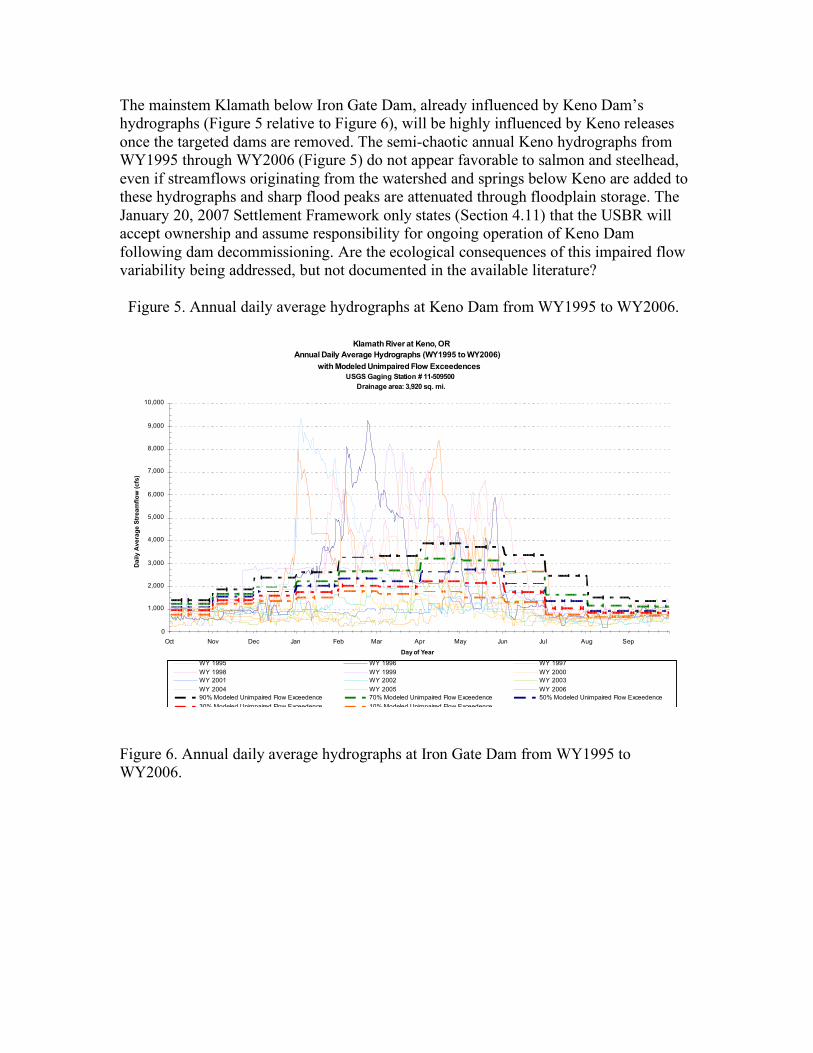
The mainstem Klamath below Iron Gate Dam, already influenced by Keno Dam’s hydrographs (Figure 5 relative to Figure 6), will be highly influenced by Keno releases once the targeted dams are removed. The semi-chaotic annual Keno hydrographs from WY1995 through WY2006 (Figure 5) do not appear favorable to salmon and steelhead, even if streamflows originating from the watershed and springs below Keno are added to these hydrographs and sharp flood peaks are attenuated through floodplain storage. The January 20, 2007 Settlement Framework only states (Section 4.11) that the USBR will accept ownership and assume responsibility for ongoing operation of Keno Dam following dam decommissioning. Are the ecological consequences of this impaired flow variability being addressed, but not documented in the available literature? Figure 5. Annual daily average hydrographs at Keno Dam from WY1995 to WY2006.
Klamath River at Keno, OR
Annual Daily Average Hydrographs (WY1995 to WY2006)
with Modeled Unimpaired Flow Exceedences
USGS Gaging Station # 11-509500
Drainage area: 3,920 sq. mi.
0
1,000
2,000
3,000
4,000
5,000
6,000
7,000
8,000
9,000
10,000
Oct Nov Dec Jan Feb Mar Apr May Jun Jul Aug Sep
Day of Year
Daily A
vera
ge S
tream
flo
w (
cfs
)
WY 1995 WY 1996 WY 1997
WY 1998 WY 1999 WY 2000
WY 2001 WY 2002 WY 2003
WY 2004 WY 2005 WY 2006
90% Modeled Unimpaired Flow Exceedence 70% Modeled Unimpaired Flow Exceedence 50% Modeled Unimpaired Flow Exceedence
30% Modeled Unimpaired Flow Exceedence 10% Modeled Unimpaired Flow Exceedence Figure 6. Annual daily average hydrographs at Iron Gate Dam from WY1995 to WY2006.

Klamath River below Iron Gate Dam
Annual Daily Average Hydrographs (WY1995 to WY2006)
USGS Gaging Station # 11-516530
0
1,000
2,000
3,000
4,000
5,000
6,000
7,000
8,000
9,000
10,000
Oct Nov Dec Jan Feb Mar Apr May Jun Jul Aug Sep
Day of Year
Da
ily
Av
era
ge
Str
ea
mfl
ow
(c
fs)
WY 1995 WY 1996 WY 1997
WY 1998 WY 1999 WY 2000
WY 2001 WY 2002 WY 2003
WY 2004 WY 2005 WY 2006

Summary
Many fisheries-related actions in the Settlement Agreement will depend on future plans, technical teams, and committees. Without knowing how these future efforts will perform, the risk of not realizing the full potential that dam decommissioning offers seems very high. To responsibly state and realistically achieve the purposes of the Settlement Agreement, such as a robust salmon harvest surplus, the resource agencies and others should quantitatively state in the Settlement Agreement what they want and propose how to achieve it. Neither is obvious from reading the Settlement Agreement. Several key observations/comments/recommendations from my review are:
(1) Future instream flow projections including NMFS’s 2002, Phase II Final Report, USBR’s Proposed Action, and various WRIMS models all fared better than the historic impaired ‘baseline’, but still sustained considerably fewer good Chinook rearing years (45% to 20%) than under unimpaired annual hydrographs at Iron Gate Dam, primarily because May and/or June streamflows were below the 2500 cfs threshold for abundant juvenile habitat;
(2) With the recent effort in meetings and in the Settlement Agreement, as much effort should be placed on guaranteeing enough good years for anadromous salmonid spawning and rearing conditions, as has been expended on guaranteeing the frequency and intensity of bad (drought) years are kept acceptably low. Recovery, as a goal stated in the Settlement Agreement, requires both;
(3) While the Phase II recommendations in Table 27 (Hardy, Addley, and Saraeva 2006) provide needed quantitative criteria to the Settlement Agreement relative to instream flow releases, these monthly exceedence instream flows should be considered starting points and not final recommendations. Potential underestimation of unimpaired streamflows in May and June, in USBR’s natural flow modeling, must be checked for the Phase II recommendations;
(4) Following-up on (2), an ecological analysis of instream flows will be required to identify and quantify why/how natural flow variability is necessary. As pressure will undoubtedly mount for each ac-ft, instream flow recommendations must have a more process-based justification rather than rely on natural flow variability as the selling argument. An ecological analysis cannot be accomplished using exceedence probability curves, but rather by evaluating individual water years to adequately assess variable streamflows. An ecological analysis also cannot be accomplished by continuing the use of the “optimum” streamflow concept typically relied-on in PHABSIM analyses because optimums rarely if ever exist in nature;
(5) A key objective in recommending future instream flows will be shifting higher baseflows later into the snowmelt period, especially mid-May through late-June and especially in wetter years. Operationally this will be a difficult challenge, but a necessary one, even if successful in some years;
(6) Coarse sediment management at the river scale, not simply augmenting spawning gravel at a few spawning sites, will be necessary to improve habitat

availability/quality and to make instream flow releases more effective, mainly downstream of Iron Gate Dam to Cottonwood Creek confluence, but farther downstream to the Shasta River confluence as well. Both bypass mainstem reaches will require similar consideration of creating a coarse sediment management strategy for replenishing and then sustaining these channels;
(7) Maintenance flow releases, as well as instream releases to curb/reverse woody riparian encroachment, have not been addressed and should be;
(8) “Flat-lining” of fall baseflows in several instream flow models, compared to natural ramping upward, could significantly reduce spawning success.
(9) Although water year classification as an integral step in allocating annual instream flows has its difficulties, no acceptable alternative has been presented for managing instream flows;
(10) The focus on instream flows has been on Iron Gate Dam releases, yet Keno Dam will be the release point following dam decommissioning. The Settlement Agreement must address this transition;

Literature Cited
Hardy, T.B. and R.C. Addley. 2001. Evaluation of interim instream flow needs in the Klamath River. Phase II Final Report. Institute for Natural Systems Engineering, Utah Water Research Laboratory, Utah State University, Logan, Utah. November 21, 2001. 304 p. Hardy, T.B., Addley, R.C., and E. Saraeva. 2006. Evaluation of instream flow needs in the Lower Klamath River. Phase II Final Report. Institute for Natural Systems Engineering, Utah Water Research Laboratory, Utah State University, Logan, Utah. July 31, 2006. 229 p. Hecht, B. and G.R. Kamman. 1996. Initial assessment of pre- and pos-Klamath Project Hydrology on the Klamath River and impacts of the Project on instream flows and fishery habitat. Prepared for: The Yurok Tribe. Balance Hydrologics, Inc. March 1996. 39 p. + figures and appendices. McBain and Trush, Inc. 1995. River channel morphology and sediment changes in the Klamath Basin, Oregon and California: Summary of available geomorphic data, data deficiencies, and identification of critical geomorphic issues. Prepared for: Technical Working Group, Klamath Fisheries Task Force. May 1995. 13 p. with appendix. NMFS. 2002. Biological Opinion: Klamath Project Operation. May 31, 2002. 105 p. PacifiCorp. 2004. Analysis of project effects on sediment transport and river geomorphology. Water Resources Final Technical Report, Section 6.0, FERC Project No. 2082. February 2004. 170 p. USBR. 2005. Natural flow of the Upper Klamath River – Phase I. Water Resources Services, Tech Service Center, Klamath Basin Area Office. November 2005. 79 p. USBR. 2007. Biological Assessment: The effects of the proposed action to operate the Klamath Project from April 1, 2008 to March 31, 2018 on federally-listed threatened and endangered species. Klamath Basin Area Office, Mid-Pacific Region. October 2007. 332 p. www.usbr.gov/mp/kbao/