Energy Efficiency Indicators and Potential Energy Savings in

© OECD/IEA 2010
Medstat III – Energy sector Paris, 30 November 2011
Collecting data to build energy efficiency indicators and support decision-making in
energy policies
Jean-Yves Garnier Head, Energy Statistics Division
International Energy Agency

© OECD/IEA 2010 © OECD/IEA, 2010
World energy-related CO2 emission savings by technology in the 450 Scenario relative to the Current Policies Scenario
20
25
30
35
40
45
2008 2015 2020 2025 2030 2035
Gt
Efficiency 53%
Renewables 21%
Biofuels 3%
Nuclear 9%
CCS 15%
Share of cumulative abatement
between 2010-2035 42.6 Gt
21.7 Gt 450 Scenario
20.9 Gt
Current Policies
Scenario
More than 50% of the reduction of CO2 emissions should come from
energy efficiency
Energy Efficiency is key for any sustainable future

© OECD/IEA 2010 © OECD/IEA, 2010
0
5
10
15
20
25
30
35
40
45
50
55
60
2010 2015 2020 2025 2030 2035 2040 2045 2050
Gt C
O2
CCS 19%
Renewables 17%
Nuclear 6%
Power generation efficiency and fuel switching 5%
End-use fuel switching 15%
End-use fuel and electricity efficiency 38%
BLUE Map emissions 14 Gt
Baseline emissions 57 Gt
WEO 2009 450 ppmcase ETP2010 analysis
Energy efficiency will account for almost half of the reduction
Energy Efficiency is key for any sustainable future

© OECD/IEA 2010 © OECD/IEA, 2010
Energy efficiency is “the” solution in many respects
Save energy in all sectors:
Residential, Transports, Industry, Services
Electricity generation
Concerns a variety of economic players
Households, governments, utilities, manufacturers, etc.
Increase exports - reduce imports
Increase domestic (and global) energy security
Strengthen RD&D
Create jobs
Reduce greenhouse gas (mainly CO2) emissions

© OECD/IEA 2010 © OECD/IEA, 2010
China Reduce CO2 intensity of the economy by 40-45% between 2005 and 2020
India Reduce CO2 intensity of the economy by 20% between 2005 and 2020
European Union
20-20-20 programme energy efficiency to reduce energy consumption by 20% by 2020
Russia: Reduce the energy intensity of GDP of the Russian economy by 40% compared to the 2007 levels.
How to identify priorities for energy efficiency policies?
Assess progresses and failures of policies?
And verify if countries meet their targets?
Countries are adopting ambitious targets

© OECD/IEA 2010 © OECD/IEA, 2010
Lack of proper indicators could lead to major uncertainties for formulating action plans
Residential And the 1st priority is...
Industry!
And the last priority is...
Residential!
The extreme situation
© OECD/IEA 2010 © OECD/IEA, 2010
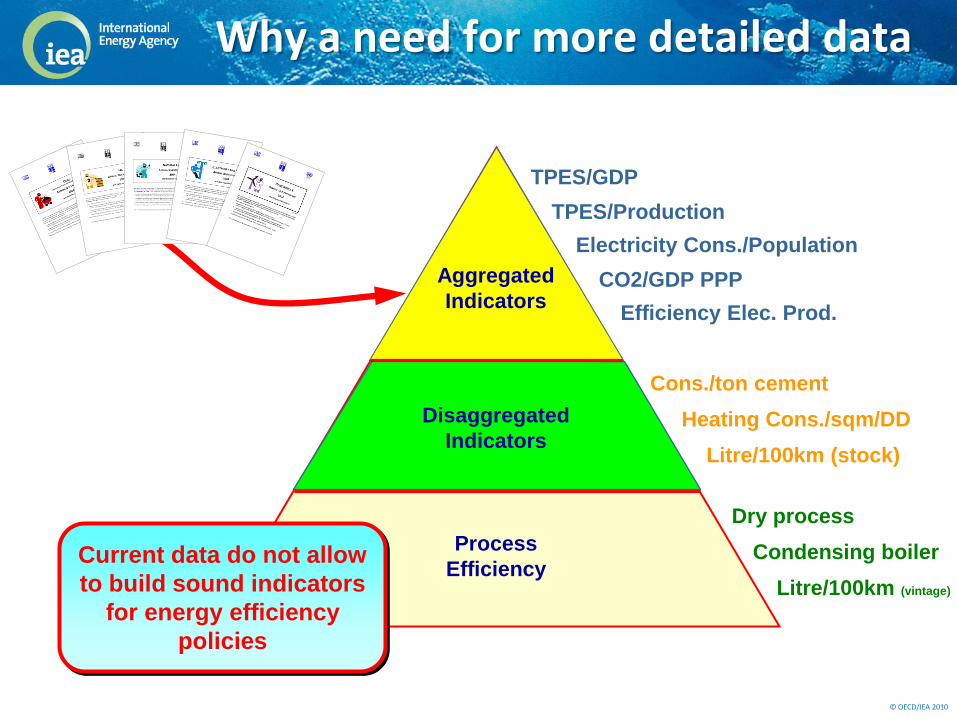
Aggregated
Indicators
TPES/GDP
TPES/Production
Electricity Cons./Population
CO2/GDP PPP
Efficiency Elec. Prod.
Cons./ton cement
Heating Cons./sqm/DD
Litre/100km (stock)
Current data do not allow
to build sound indicators
for energy efficiency
policies
Dry process
Condensing boiler
Litre/100km (vintage)
Why a need for more detailed data
Process
Efficiency
Disaggregated
Indicators

© OECD/IEA 2010 © OECD/IEA, 2010
70%
80%
90%
100%
110%
120%
130%
140%
150%
160%
1973
1974
1975
1976
1977
1978
1979
1980
1981
1982
1983
1984
1985
1986
1987
1988
1989
1990
1991
1992
1993
1994
1995
1996
1997
19
73
= 1
00
%
Total Energy
Basic energy
statistics
Example of Canada’s Residential Sector
Why Go Beyond Aggregate Energy
Consumption Data?

© OECD/IEA 2010 © OECD/IEA, 2010
70%
80%
90%
100%
110%
120%
130%
140%
150%
160%
1973
1974
1975
1976
1977
1978
1979
1980
1981
1982
1983
1984
1985
1986
1987
1988
1989
1990
1991
1992
1993
1994
1995
1996
1997
19
73
= 1
00
%
Total Energy
Total Energy, CC
Why Go Beyond Aggregate Energy
Consumption Data?
Example of Canada’s Residential Sector

© OECD/IEA 2010 © OECD/IEA, 2010
70%
80%
90%
100%
110%
120%
130%
140%
150%
160%
1973
1974
1975
1976
1977
1978
1979
1980
1981
1982
1983
1984
1985
1986
1987
1988
1989
1990
1991
1992
1993
1994
1995
1996
1997
19
73 =
100%
Total Energy
Total Energy, CC
Total/Capita
Total/household
Total/Sq. m
Space heat/Sq. m
Why Go Beyond Aggregate Energy
Consumption Data?
Example of Canada’s Residential Sector
+50%
vs.
-20%
© OECD/IEA 2010 © OECD/IEA, 2010
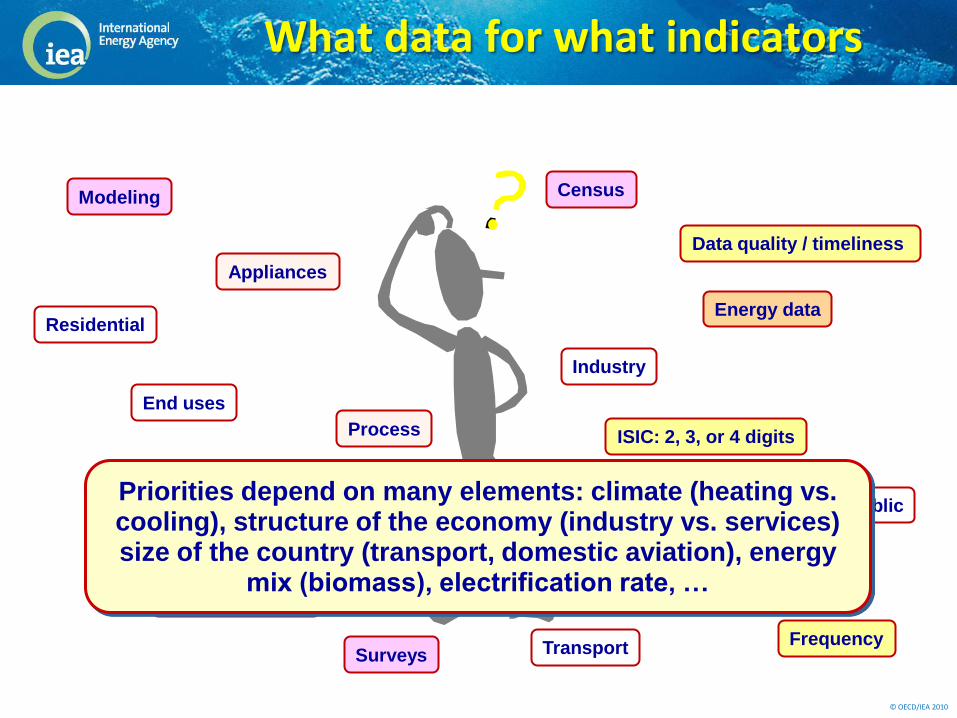
Modeling
Commercial/public
Industry
Socio-economic
Process
Residential Energy data
Transport
End uses
ISIC: 2, 3, or 4 digits
Surveys
Census
Appliances
Data quality / timeliness
Monetary data
Fleet of vehicles
Frequency
Priorities depend on many elements: climate (heating vs. cooling), structure of the economy (industry vs. services) size of the country (transport, domestic aviation), energy
mix (biomass), electrification rate, …
What data for what indicators

© OECD/IEA 2010 © OECD/IEA, 2010
320
350
370
floor area
Other indicators include energy/energy ratio (efficiency of a
furnace) or activity/activity ratio (electrification rate)
What data for what indicators (cont.)

© OECD/IEA 2010 © OECD/IEA, 2010
Please Help
Me…
… too many data do not necessarily help…
Do not over collect…

© OECD/IEA 2010 © OECD/IEA, 2010
The IEA has defined a minimum set of data to be collected
} Energy
consumption
and activity
data

© OECD/IEA 2010 © OECD/IEA, 2010
End-Use Coverage
Residential
Space heating
Water heating
Cooking
Lighting
Appliances
Services
Total
services
Passenger
Travel
Car &light
duty vehicles
Motorcycles
Buses
Passenger
rail
Passenger
ships
Domestic
planes
Freight
Transport
Trucks
Freight rail
Domestic
shipping
Domestic
air freight
Manufacturing
Food, beverages
& tobacco
Paper, pulp &
printing
Industrial
chemicals
Non-metallic
minerals
Primary metals
Metal products &
equipment
Other
Other
Industry
Agriculture,
forestry
&fishing
Mining
Construction
Electricity,
gas & water
© OECD/IEA 2010 © OECD/IEA, 2010
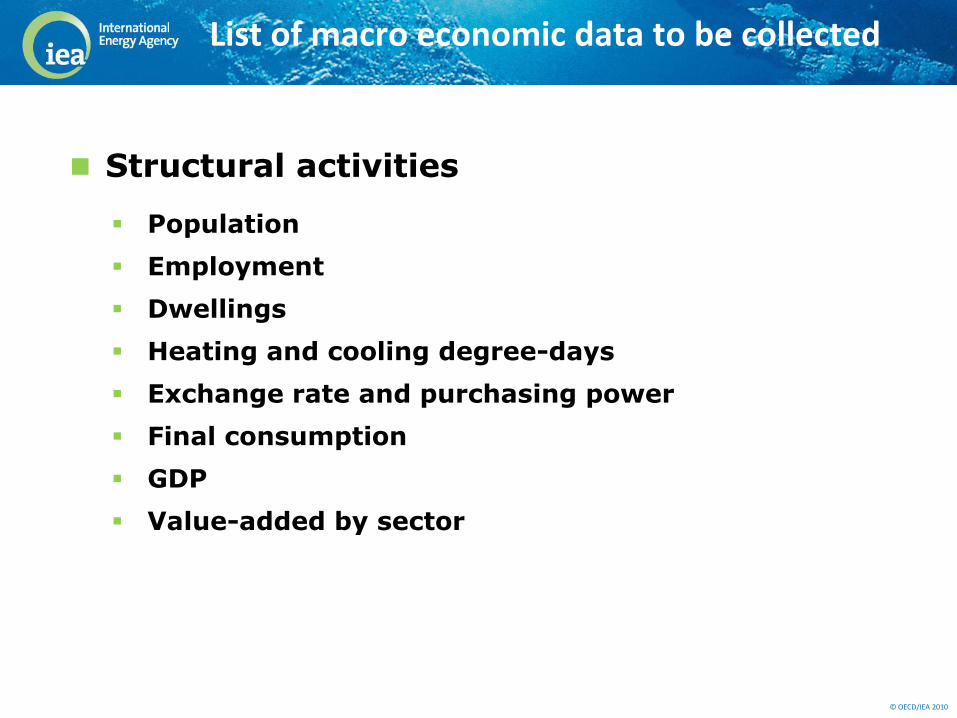
Structural activities
Population
Employment
Dwellings
Heating and cooling degree-days
Exchange rate and purchasing power
Final consumption
GDP
Value-added by sector
List of macro economic data to be collected
© OECD/IEA 2010 © OECD/IEA, 2010
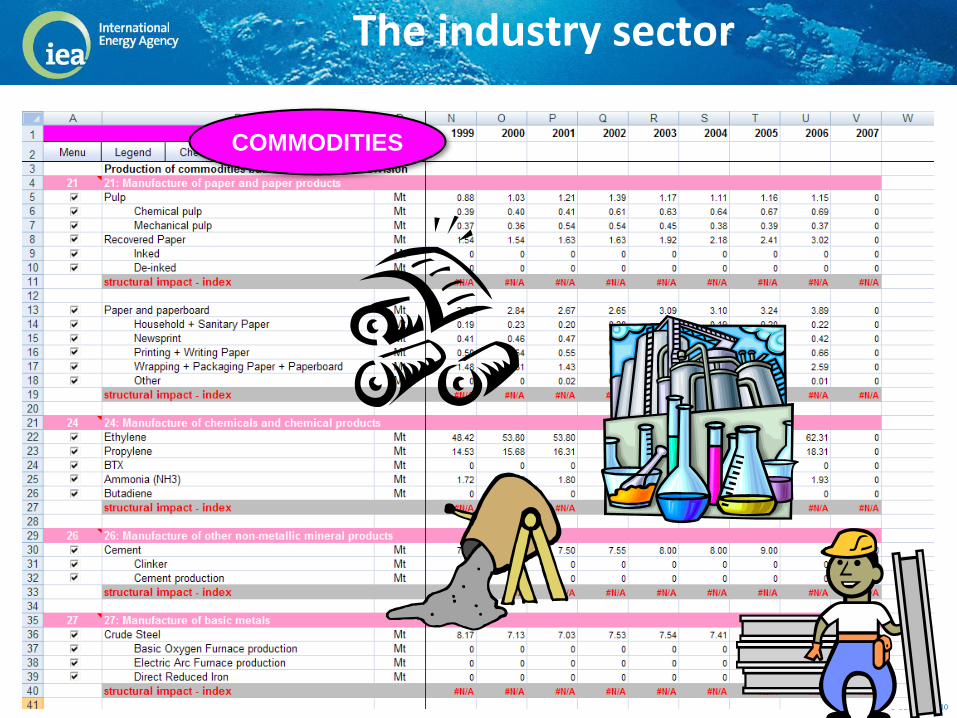
COMMODITIES
The industry sector

© OECD/IEA 2010 © OECD/IEA, 2010
I am not su I am not su
SERVICES
The services sector

© OECD/IEA 2010 © OECD/IEA, 2010
RESIDENTIAL
%
106
kW
h/u
nit
The residential sector

© OECD/IEA 2010 © OECD/IEA, 2010
TRANSPORT
pas
s-k
m
ton
nes
To
nn
es
-km
V
eh
-km
1
06
The transport sector

© OECD/IEA 2010 © OECD/IEA, 2010
Space Heating
Space Cooling
Water Heating
Cooking
Pre-filled time series
User-friendliness of the template

© OECD/IEA 2010 © OECD/IEA, 2010
A report on the coverage status is automatically updated when new data are entered.
User-friendliness of the template
Missing
data 100%
coverage

© OECD/IEA 2010 © OECD/IEA, 2010
Various options offered for plotting indicators
User-friendliness of the template

© OECD/IEA 2010 © OECD/IEA, 2010
Possibility to compare indicators
User-friendliness of the template

© OECD/IEA 2010 © OECD/IEA, 2010
A few words on the validation process
Internal consistency
Consistency with IEA energy balances
Checks against secondary sources
Plausibility
Gross vs Net Calorific Value
Coverage / definitions
The aim is to try to understand “how” to help countries overcome the difficulties they face in providing quality data

© OECD/IEA 2010 © OECD/IEA, 2010
Energy Use in a New
Millennium
Worldwide Trends in
Energy Use and
Efficiency
Tracking Industrial
Energy Efficiency and
CO2 Emissions
Towards a More Energy
Efficient Future
Dissemination is essential
The IEA Scoreboard
2011

© OECD/IEA 2010 © OECD/IEA, 2010
Without the savings from improved energy efficiency since 1974 in 11 IEA countries, energy use would now be 63% higher.
0
20
40
60
80
100
120
140
160
180
1974 1976 1978 1980 1982 1984 1986 1988 1990 1992 1994 1996 1998 2000 2002 2004 2006 2008
EJ
Electricity Other Coal Gas Oil Savings
Actual energy use
Hypothetical energy use without
energy efficiency improvements Savings
Support to decision makers
63%

© OECD/IEA 2010 © OECD/IEA, 2010
Out of a total growth in residential energy consumption of 2.5 EJ in 18 IEA member countries, 1.7 EJ is attributable to appliances and electronics
IEA18
Support to decision makers

© OECD/IEA 2010 © OECD/IEA, 2010
Most of the increase is due to “other appliances”
Support to decision makers
White or large
appliances
dominated the
consumption
Other appliances are
now dominating the
consumption
A need for tougher
standards on small
appliances

© OECD/IEA 2010 © OECD/IEA, 2010
Thermal Energy Requirement per ton of Clinker by Country including Alternate Fuels
Support to decision makers
Good news:
Intensity is
decreasing
However, there is
still a huge
potential for
improvement in
several countries

© OECD/IEA 2010 © OECD/IEA, 2010
1,0
1,5
2,0
2,5
3,0
3,5
4,0
4,5
5,0
5,5
6,0
1990 1992 1994 1996 1998 2000 2002 2004 2006 2008
MJ p
er
tkm
Truck freight energy intensity Norway
Greece
United Kingdom
Japan
New Zealand
United States
Italy
Canada
France
IEA18
Netherlands
Denmark
Switzerland
Sweden
Spain
Finland
Australia
Austria
Germany
Support to decision makers

© OECD/IEA 2010 © OECD/IEA, 2010
An electronic manual to help

© OECD/IEA 2010 © OECD/IEA, 2010
The IEA-Eurostat
Manual
A user-friendly manual
to give necessary
information to
newcomers to
understand/complete
annual questionnaires
As a follow up to the success of the IEA-Eurostat Manual, the IEA is currently developing a Manual on statistics for energy efficiency indicators

© OECD/IEA 2010 © OECD/IEA, 2010
The Manual is now available in 10 languages
and widely used all around the world
As a follow up to the success of the IEA-Eurostat Manual, the IEA is currently developing a Manual on statistics for energy efficiency indicators

© OECD/IEA 2010 © OECD/IEA, 2010
The Manual will neither be a reference manual on
energy statistics nor a reference manual on
energy efficiency indicators.
However, it will be difficult to talk about the
statistics behind the indicators without briefly
touching upon what are energy efficiency
indicators and why they are part of any sound
energy efficiency policy.
The main focus will really be on how to collect
the data needed to build those indicators.
So, what role do we see for the manual

© OECD/IEA 2010 © OECD/IEA, 2010
How to collect the data needed
There is no universal recipe to collect those data. It
depends on the needs, situation, time, resources.
However, the most frequently used methodologies
can be grouped into four main categories:
Surveys
Metering and Measuring
Modelling
Administrative Sources
Each methodology has advantages and
disadvantages, pros and cons, limits, associated
costs, etc.
© OECD/IEA 2010 © OECD/IEA, 2010
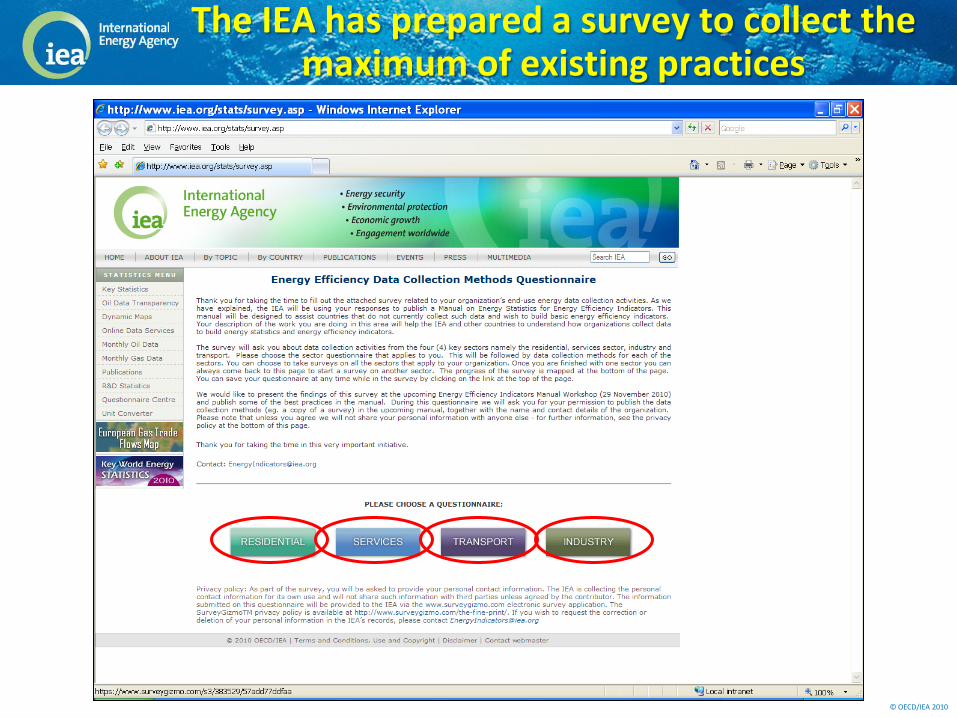
The IEA has prepared a survey to collect the maximum of existing practices
© OECD/IEA 2010 © OECD/IEA, 2010
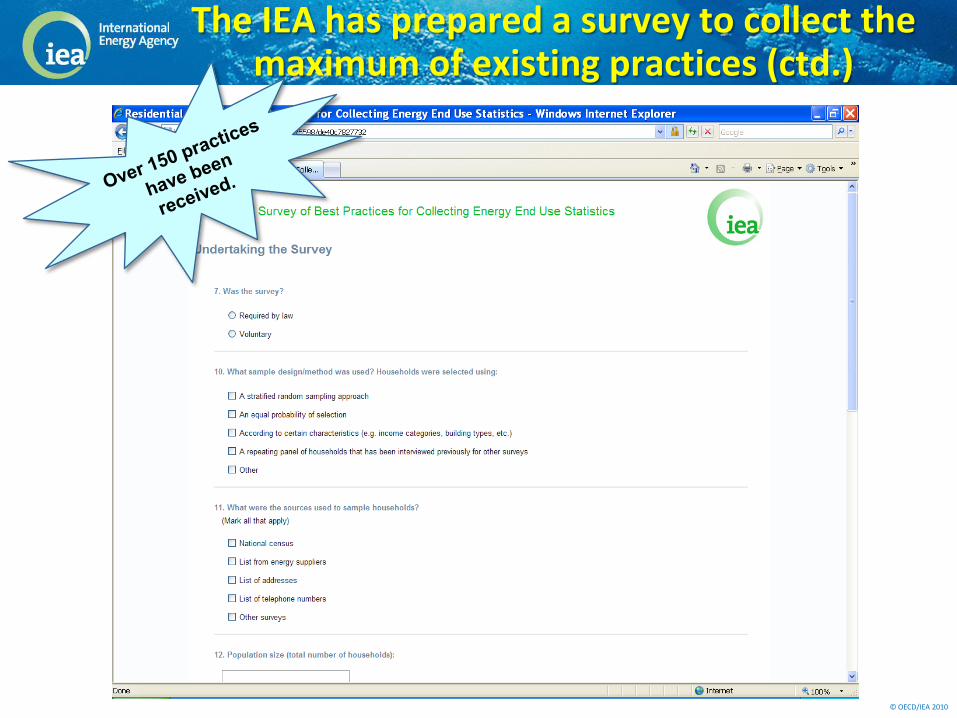
The IEA has prepared a survey to collect the maximum of existing practices (ctd.)

© OECD/IEA 2010 © OECD/IEA, 2010
So, what we would like to do with this manual is to offer the readers/users a large menu of practices already existing world wide.
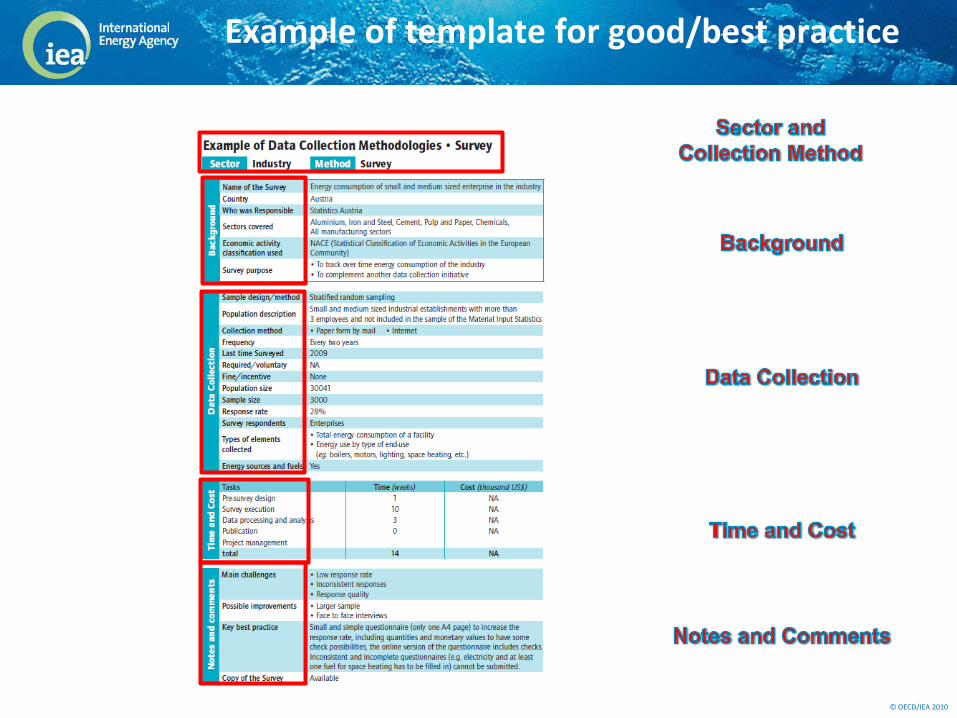
Each practice will be summarized under a common format highlighting the main elements of the methodology used.
For instance, information on a survey will include objectives and target, consumption and activity data looked for, preparation work, size of the sample, selection process, training, conduct of the survey, breakdown of the cost, frequency, processing, derived indicators, dissemination, main issues encountered, etc.
The manual: a large menu of good practices

© OECD/IEA 2010 © OECD/IEA, 2010
Foreword Why a Manual Describe the goals and purpose of the manual. Show the growing importance of energy efficiency in the energy policy world. Explain that currently only limited data are available to build meaningful energy efficiency indicators. The purpose of the book is to help bridge the gap and to provide examples of good and best practices to collect the data needed to build energy efficiency indicators. Energy Efficiency Indicators: What are they? Description of energy efficiency indicators, their importance, and their limits. The Data behind the Indicators: How to collect them? Provide general background information on energy-related data and activity-related data. The chapter will discuss how to collect data through four key approaches namely: Surveying, Measuring, Modeling and Administrative Sources. Collecting What and How for the Residential Sector (See the more detailed outline in the example on the residential chapter)
Collecting What and How for the Commercial and Public Services Sector (See the residential chapter) Collecting What and How for the Industry Sector (See the residential chapter) Collecting What and How for the Transport Sector (See the residential chapter) Validating and Disseminating Discuss validation methods used for the different sectors. Also discuss best practices for effective data presentation and dissemination. Annexes
I. Selected good and best practices for the residential sector II. Selected good and best practices for the commercial sector III. Selected good and best practices for the industry sector IV. Selected good and best practices for the transport sector V. Specific issues (to be identified at a later stage)
A quick overview of the table of contents

© OECD/IEA 2010 © OECD/IEA, 2010
Residential
What does the residential sector mean and cover? A brief discussion of what the residential sector is and what it does and does not include (such as transport). Why is the residential sector important? The residential sector accounts for a quarter of global total final consumption. However, there are huge variations between countries from less than 10% to more than 90%. There are many players having an influence on the energy consumption of the sector: households, policy makers, utilities, appliance manufacturers, architects. What are the main end-uses driving the consumption of the sector? A description of the main energy end-uses: heating, cooling, domestic hot water, lighting, cooking, appliances, etc. There are also large variations in the respective shares of the end-uses. It ranges from countries with a large share for heating in cold countries to a large share for cooking in developing countries which are highly dependent on fuelwood. What are the most frequently used indicators? A commented list of the most frequently used indicators for the residential sector. Indicators cover many different aspects: heating consumption per square meter, average electricity consumption per type of appliance, average lighting per household, etc. A discussion will be included on other useful indicators not directly considered as energy efficiency indicators, such as electrification rate, dependency on fuel wood. The data behind the indicators Most indicators include a numerator (an energy consumption) and a denominator (an activity data). A description will be provided of both energy consumption data and activity data needed to build the indicators mentioned in the previous paragraph. How to collect the data? This constitutes the main part of the chapter. A description of the most commonly used methodologies for collecting the data used to build indicators. Methodologies include surveys, metering, modeling, administrative sources. Selected examples will be given. Specific issues with data on households A list of the most common issues encountered in collecting the data. Examples of possible solutions to deal with those issues will be presented. Communicating indicators effectively If collecting data and building indicators are essential steps, preparing powerful graphs and other
materials to disseminate the indicators is equally essential. Selected examples on how to make the
indicators meaningful and powerful will be presented.
A chapter at a glance
© OECD/IEA 2010 © OECD/IEA, 2010
Example of template for good/best practice

© OECD/IEA 2010 © OECD/IEA, 2010
A few words to conclude
Thank you
The plan is to have the Manual complemented
by a CD with survey forms, also available on
Internet.
The IEA is now collecting statistics for energy
efficiency indicators for the year 2009, and is
actively working with countries, ODYSSEE, others
to improve quality and coverage
The IEA will organise a 2-day workshop on
energy efficiency indicators on 14-15 March 2012.
Statisticians, Analysts, Policy Makers: The three
faces of the same coin.
Cooperation is key to boost energy efficiencies world wide.