Meso-level eco-efficiency indicators to assess...
74
Meso-level eco-efficiency indicators to assess technologies and their uptake in water use sectors Collaborative project, Grant Agreement No: 282882 Deliverable 1.3 Populated Technology Inventory December 2013
Transcript of Meso-level eco-efficiency indicators to assess...
Meso-level eco-efficiency indicators to assess
technologies and their uptake in water use sectors
Collaborative project, Grant Agreement No: 282882
Deliverable 1.3
Populated Technology Inventory
December 2013
D1.3 Populated Technology inventory Page 2 of 74
DOCUMENT INFORMATION
Project
Project acronym: EcoWater
Project full title: Meso-level eco-efficiency indicators to assess technologies and their uptake in water use sectors
Grant agreement no.: 282882
Funding scheme: Collaborative Project
Project start date: 01/11/2011
Project duration: 36 months
Call topic: ENV.2011.3.1.9-2: Development of eco-efficiency meso-level indicators for technology assessment
Project web-site: 1
Document
Deliverable number: D1.3
Deliverable title: Populated technology inventory
Due date of deliverable: 31/10/2013
Actual submission date: 18/12/2013
Editor(s): Åsa Nilsson and Sara Alongi Skenhall, IVL
Author(s): Åsa Nilsson, Sara Alongi Skenhall, and Felipe Oliveira, IVL; Dionysis Assimacopoulos, George Arampatzis and Thanos Angelis-Dimakis, NTUA. Contributions to the data inventory by all partners.
Reviewer(s): Dionysis Assimacopoulos, NTUA
Work Package no.: 1
Work Package title: Framework and tools for meso-level ecoefficiency and technology assessment
Work Package Leader: Dionysis Assimacopoulos
Dissemination level: PU
Version: 1
Draft/Final: Final
No of pages (including cover): 74
Keywords: Technology, inventory, economic, environmental, efficiency, parameters.

D1.3 Populated Technology inventory Page 3 of 74
Abstract
This report presents the populated technology inventory, i.e. the database compiled
after collecting information on the technologies relevant to the EcoWater Case
Studies.
In addition to the generic database information, the inventory holds data on
technology economic parameters, technology environmental parameters and
technology efficiency parameters.
The actual technology inventory is delivered as an Excel workbook, holding one
sheet per EcoWater Case Study. Each Case Study worksheet follows the same
structure, but they differ in terms of which parameters are considered of importance
to the technologies added. This technology inventory (Deliverable 1.3), has been
populated with data from the Case Studies.
This report also describes the theory around the water system and innovative
technologies researched in the project, as well as the environmental midpoint impact
categories used to assess the environmental performance of technologies in the
Case Studies.
D1.3 Populated Technology inventory Page 4 of 74
Contents
Abstract ..................................................................................................................... 3
1 Introduction ........................................................................................................ 5
2 Description of the technology inventory .............................................................. 6
2.1 Methodology ............................................................................................... 6
2.2 Inventory structure ...................................................................................... 6
2.3 Common database fields ............................................................................. 7
2.4 Technology parameter groups..................................................................... 8
2.5 Parameter specifications ............................................................................. 9
3 Description of the EcoWater indicators ............................................................. 10
4 Innovative technologies in the water use sector ............................................... 11
4.1 The meso-level water use system ............................................................. 11
4.2 Innovative technologies in a meso level water use system ........................ 12
4.2.1 Technology Classification ...................................................................... 12
4.2.2 Technology Selection Criteria ................................................................ 15
5 Discussion ........................................................................................................ 17
6 References ....................................................................................................... 18
Annex I Parameter specification ......................................................................... 19
Performance / - / Technology lifetime ............................................................... 19
Performance / - / Reliability .............................................................................. 19
Economic / Cost / ............................................................................................. 19
Economic / Value / ........................................................................................... 20
Environmental / Emissions to air / .................................................................... 20
Environmental / Water quality influence / .......................................................... 20
Environmental / Water use / ............................................................................. 21
Environmental / Resource use / ....................................................................... 22
Environmental / Solid waste ............................................................................. 23
Environmental / Background impacts / ............................................................. 23
Efficiency / Energy / ......................................................................................... 23
Efficiency / Physical /........................................................................................ 23
Annex II Midpoint environmental impact categories ............................................. 24
References ....................................................................................................... 30
Annex III List of innovative technologies ............................................................... 31
D1.3 Populated Technology inventory Page 5 of 74
1 Introduction
The purpose of EcoWater Task 1.2 Technology inventory for eco-efficient water
systems and use was to design and populate a data inventory for technologies
relevant to the EcoWater Case Studies (CS). The main environmental, cost and
efficiency parameters associated with the technologies were included. It is worth
noting that the term “efficiency parameter” refers to technology efficiency when used
in the context of T1.2. It is different from the eco-efficiency indicators developed in
Task 1.1 Review and selection of eco-efficiency indicators according to Case Study
specificities. However, this report briefly presents the chosen midpoint environmental
indicators that are part of the eco-efficiency indicators.
This deliverable is the second of two from T1.2 and it reports on the population of the
technology inventory. The deliverable consists of two parts; this document, which
describes the parameters used in the inventory, and the actual populated technology
inventory (Excel-file).
The populated inventory will serve as a database of technologies to be integrated
into the EcoWater tools developed in T5.3 Development of toolbox for meso-level
eco-efficiency of systems/products.
The Description of work (DoW) states the following: “D1.3) Populated technology
inventory: The populated technology inventory (information base) will include
structured information on technologies for improving the environmental footprint of
water use in agricultural, industrial and urban settings.”(DoW EcoWater)
IVL has edited and compiled this report and the data inventory. Section 3 is jointly
compiled by IVL and the NTUA. NTUA is author of Section 4, midpoint indicator
description in Annex II, and the literature survey of technologies in Annex III.
D1.3 Populated Technology inventory Page 6 of 74
2 Description of the technology inventory
2.1 Methodology
A first draft of the inventory template was composed by IVL; taking into account a
technology database structure previously used in the European project OPTIMA
(OPTIMA website) and the specific needs of the EcoWater project. The technology
inventory template was then further developed through discussions in the working
group of T1.2.
The group decided that a good way to pinpoint the important technological
parameters was to add a few example technologies to the first draft of the template
(Deliverable 1.2). Adding example data for those technologies would help specifying
the parameters. The members of the working group provided input on example
technologies and specific parameters relevant to the EcoWater case study each
member is linked to. The Case Study leaders have also been consulted, some of
which are not part of the working group of T1.2. Discussions following that exercise
helped streamlining the interpretation of parameters across the working group.
During the first three Case Study development phases, several more parameters
have been added, and some deleted or renamed.
Input from WP2-WP4 provided info on which technologies to be included, values on
the representative data on the inventory parameters and/or help on where to find the
sources of information to fill out the inventory with values. The inventory has been
populated with data for currently used technologies (for Business As Usual, BAU,
scenarios) as well as new technologies.
In particular, information and data was gathered from the work on
Value chain mapping, in tasks T2.1, T3.1 and T4.1.
Baseline assessment, in tasks T2.2, T3.2 and T4.2.
Identification of technologies for eco-efficiency improvements, were done in
tasks T2.3, T3.3 and T4.3.
2.2 Inventory structure
The EcoWater technology inventory consists of an Excel workbook holding a front
page and subsequently one worksheet per Case Study. The structure of the CS
worksheets is the same across cases, although technology economic / environmental
/ efficiency parameters differ between the CS.
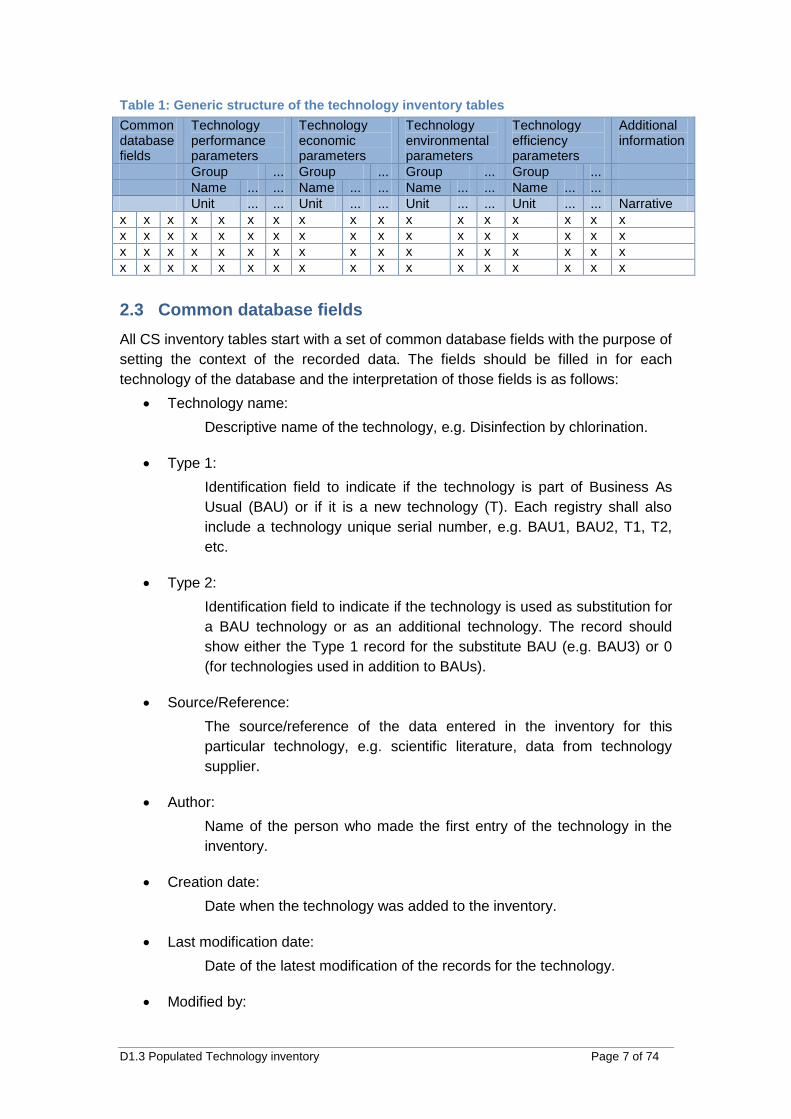
The general format of the CS inventory tables (worksheets) is presented in Table 1.
Information on technologies has been entered as records (x) in the rows of the
worksheet. Each row holds the information on one registered technology.
D1.3 Populated Technology inventory Page 7 of 74
Table 1: Generic structure of the technology inventory tables
Common database fields
Technology performance parameters
Technology economic parameters
Technology environmental parameters
Technology efficiency parameters
Additional information
Group ... Group ... Group ... Group ...
Name ... ... Name ... ... Name ... ... Name ... ...
Unit ... ... Unit ... ... Unit ... ... Unit ... ... Narrative
x x x x x x x x x x x x x x x x x
x x x x x x x x x x x x x x x x x
x x x x x x x x x x x x x x x x x
x x x x x x x x x x x x x x x x x
2.3 Common database fields
All CS inventory tables start with a set of common database fields with the purpose of
setting the context of the recorded data. The fields should be filled in for each
technology of the database and the interpretation of those fields is as follows:
Technology name:
Descriptive name of the technology, e.g. Disinfection by chlorination.
Type 1:
Identification field to indicate if the technology is part of Business As
Usual (BAU) or if it is a new technology (T). Each registry shall also
include a technology unique serial number, e.g. BAU1, BAU2, T1, T2,
etc.
Type 2:
Identification field to indicate if the technology is used as substitution for
a BAU technology or as an additional technology. The record should
show either the Type 1 record for the substitute BAU (e.g. BAU3) or 0
(for technologies used in addition to BAUs).
Source/Reference:
The source/reference of the data entered in the inventory for this
particular technology, e.g. scientific literature, data from technology
supplier.
Author:
Name of the person who made the first entry of the technology in the
inventory.
Creation date:
Date when the technology was added to the inventory.
Last modification date:
Date of the latest modification of the records for the technology.
Modified by:
D1.3 Populated Technology inventory Page 8 of 74
Name of the person who made the latest modification of the technology
in the inventory.
Short description:
Text describing the technology. Concise description but more
informative than the “Technology name” field.
Process:
The record should be the name of the process where the technology is
(or can be) applied, e.g. Abstraction by pumping, Water purification.
Reference unit:
The technology reference unit for which the subsequent parameter
values apply, e.g. one piece of XX equipment with YY capacity, or
specific equipment model, if relevant.
Level of maturity (narrative):
The level of maturity of the technology is described using the
Technology Readiness Level (from experimental level to applied
technology which is successfully operating) (DOE, 2011)..
During the development of the inventory, and since submission of D1.2, the field
“level of maturity” was added in addition to the original fields.
2.4 Technology parameter groups
After the common database fields follows a couple of technology performance
parameters, which do not fall within any of the three parameter categories
(economic/environmental/efficiency). Currently listed performance parameters are:
Technology lifetime
Reliability
What follow after is, in turn, the technology economic parameters, the technology
environmental parameters and the technology efficiency parameters. Since the
number of parameters within each category is quite large, they have been clustered
into groups for simplification. The parameter groups are:
For economic parameters
o Cost
o Value
For environmental parameters
o Emissions to air
o Water quality influence
o Water use
o Resource use
o Solid waste
D1.3 Populated Technology inventory Page 9 of 74
o Background impacts
For efficiency parameters
o Energy
o Physical
The inventory format allows for using groups within the performance parameter
category as well.
The last column of the technology inventory template holds a narrative field for
additional information. It can be used to record any qualitative information about the
technology, such as:
Complexity of the technology
Acceptance of technology by stakeholders/actors involved or affected by its
actual implementation
Foreseeable barriers for introduction of technology (cultural, regulatory or
other)
Foreseeable drivers for introduction of technology (cultural, regulatory or
other)
Lessons from previous use of technology in other fields of application.
2.5 Parameter specifications
For practical reasons parameter names used in the technology inventory had to be
relatively short. The technology performance, economic, environmental and
efficiency parameters needed to be specified and described so that users of the
technology inventory can understand what the recorded data represents.
For enhanced readability of this report, the actual specifications of parameters are
presented in 0. It holds the longer, more descriptive, definitions and specifications of
the parameters. The annex is thought to serve as a look-up section when seeking
information on a particular parameter from the technology inventory.
The report and 0 in particular can be viewed as a reference document to accompany
the populated inventory in an attempt to avoid confusion on what the listed
parameters represent.
The parameters currently included in the inventory are up to date for the Deliverable
D1.3. Some changes were made to parameter names during the course of T1.2 work
and Case Study development. They are described group-wise, following the overall
structure that was presented in Section 2.2 above.
D1.3 Populated Technology inventory Page 10 of 74
3 Description of the EcoWater indicators
The parameters for each technology are thought to serve as a basis for the impact
assessment from each case study, i.e. the eco-efficiency evaluation. Eco-efficiency
indicators are basically a set of indicators, based on economic terms and several
environmental midpoint indicators. The environmental midpoint indicators are
calculated based on parameter value and a characterisation factor, according to Life
Cycle Impact Assessment (LCIA) methodology (JRC, 2011).
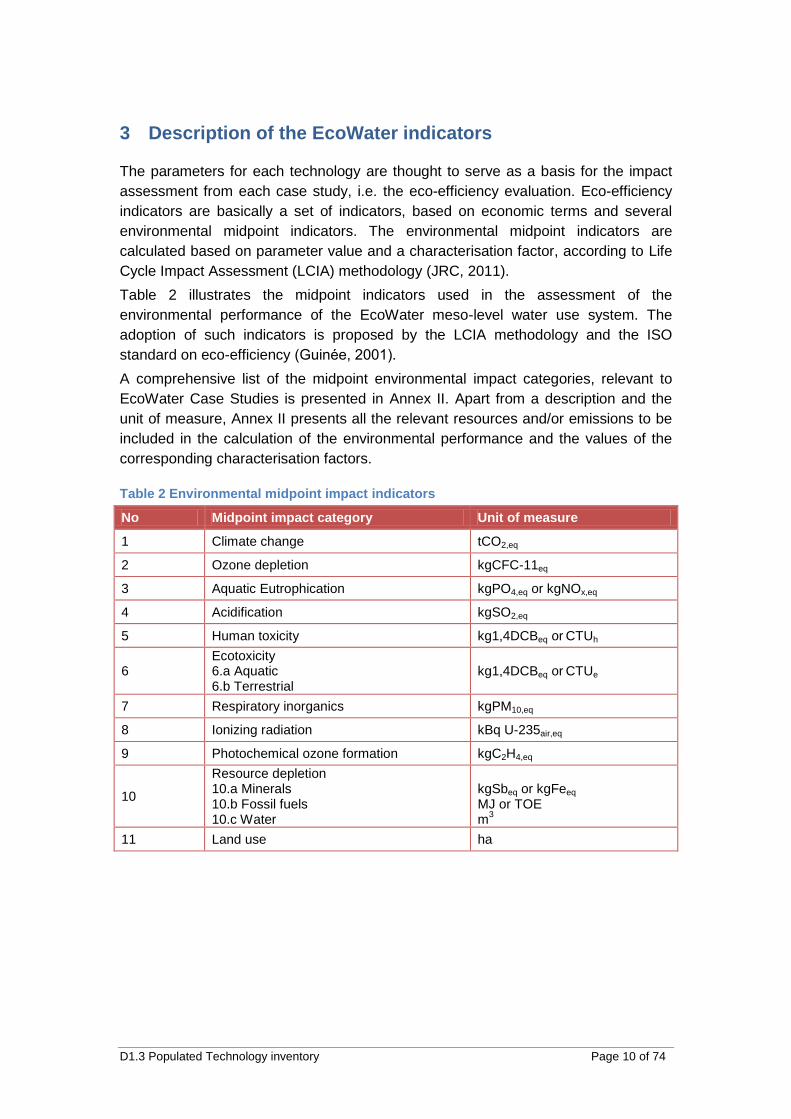
Table 2 illustrates the midpoint indicators used in the assessment of the
environmental performance of the EcoWater meso-level water use system. The
adoption of such indicators is proposed by the LCIA methodology and the ISO
standard on eco-efficiency (Guinée, 2001).
A comprehensive list of the midpoint environmental impact categories, relevant to
EcoWater Case Studies is presented in Annex II. Apart from a description and the
unit of measure, Annex II presents all the relevant resources and/or emissions to be
included in the calculation of the environmental performance and the values of the
corresponding characterisation factors.
Table 2 Environmental midpoint impact indicators
No Midpoint impact category Unit of measure
1 Climate change tCO2,eq
2 Ozone depletion kgCFC-11eq
3 Aquatic Eutrophication kgPO4,eq or kgNOx,eq
4 Acidification kgSO2,eq
5 Human toxicity kg1,4DCBeq or CTUh
6 Ecotoxicity 6.a Aquatic 6.b Terrestrial
kg1,4DCBeq or CTUe
7 Respiratory inorganics kgPM10,eq
8 Ionizing radiation kBq U-235air,eq
9 Photochemical ozone formation kgC2H4,eq
10
Resource depletion 10.a Minerals 10.b Fossil fuels 10.c Water
kgSbeq or kgFeeq MJ or TOE m
3
11 Land use ha
D1.3 Populated Technology inventory Page 11 of 74
4 Innovative technologies in the water use sector
The main objective of the EcoWater project is to propose eco-efficiency indicators for
assessing technologies, using water service systems as case application examples.
This will enhance the understanding of how innovative technological changes in
water systems interrelate and influence the economic and environmental profile and
the overall eco-efficiency of water use in different sectors.
One of the outcomes of the project is the inventory from this deliverable that includes
novel technologies relevant to the context of the EcoWater Case Studies and
describes their main environmental and cost parameters (Task 1.2). The inventory
will also be incorporated in the EcoWater Toolbox, as part of Task 5.3.
This section aims to provide a brief representation of meso-level water use systems,
as these are analysed in the EcoWater Case Studies, and to describe how the
application of new and/or innovative technologies can contribute in the overall
improvement of such systems in terms of eco-efficiency. It is structured as follows:
Section 4.1 is dedicated to the description of meso-level water use systems;
Section 4.2 describes the classification of technologies and the criteria for
technology selection in the examined water use systems.
Annex III complements this section and presents the thus far proposed technologies,
and brief descriptions of these based on the available literature
4.1 The meso-level water use system
A meso-level water use system combines the typical water supply chain with the
corresponding water use chain, as illustrated in Figure 1. It incorporates a specific
water use with all the processes needed to render the water suitable (both
qualitatively and quantitatively) for this use, and the treatment and discharge of the
generated effluents to the environment.
The boundaries of the system encompass all the processes related to the water
supply and the water use chains. These processes can be grouped into four generic
stages:
Stage 1: Water Abstraction and Distribution
Stage 2: Water Treatment
Stage 3: Water Use
Stage 4: Wastewater Treatment
Each process represents an activity, implementing a specific technology, where
generic materials (water, raw materials, energy, etc.) are processed and transformed
into other materials, while releasing emissions external to the system (air, land,
water).
The economic analysis of the meso-level water use system also entails the
consideration of the interdependencies and the socio-economic interactions of all the
heterogeneous actors involved in the water supply and production chain. As a result,
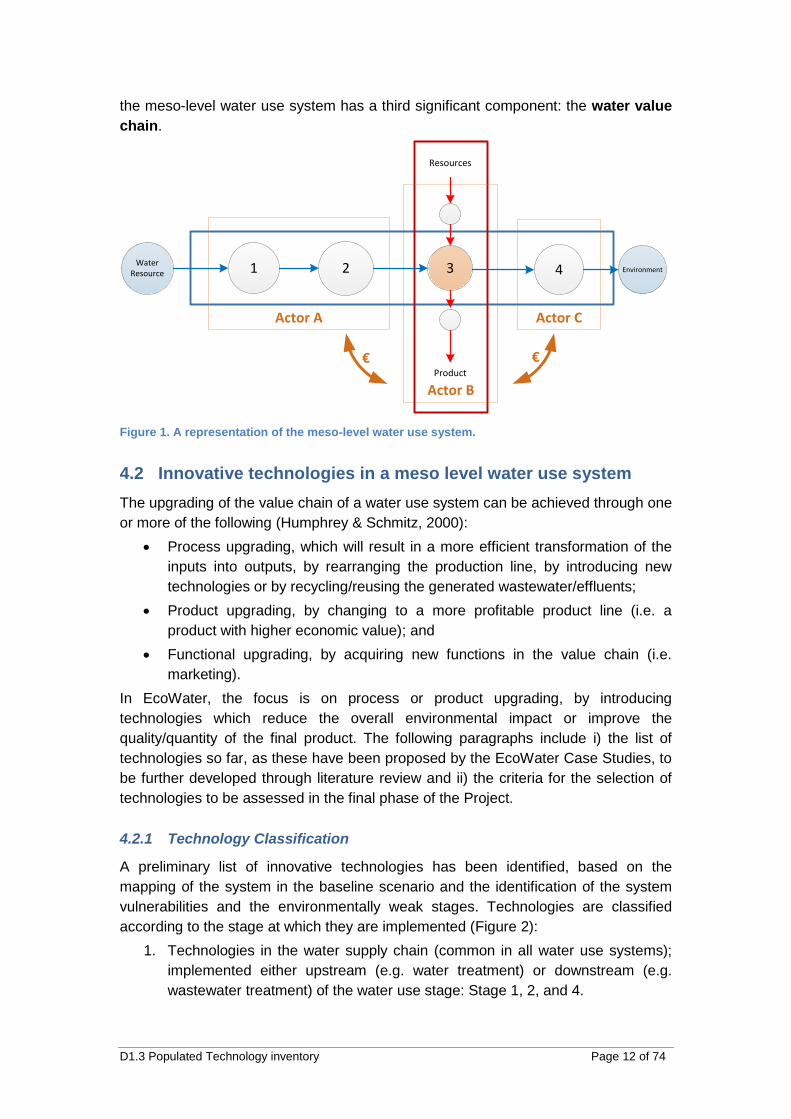
D1.3 Populated Technology inventory Page 12 of 74
the meso-level water use system has a third significant component: the water value
chain.
Figure 1. A representation of the meso-level water use system.
4.2 Innovative technologies in a meso level water use system
The upgrading of the value chain of a water use system can be achieved through one
or more of the following (Humphrey & Schmitz, 2000):
Process upgrading, which will result in a more efficient transformation of the
inputs into outputs, by rearranging the production line, by introducing new
technologies or by recycling/reusing the generated wastewater/effluents;
Product upgrading, by changing to a more profitable product line (i.e. a
product with higher economic value); and
Functional upgrading, by acquiring new functions in the value chain (i.e.
marketing).
In EcoWater, the focus is on process or product upgrading, by introducing
technologies which reduce the overall environmental impact or improve the
quality/quantity of the final product. The following paragraphs include i) the list of
technologies so far, as these have been proposed by the EcoWater Case Studies, to
be further developed through literature review and ii) the criteria for the selection of
technologies to be assessed in the final phase of the Project.
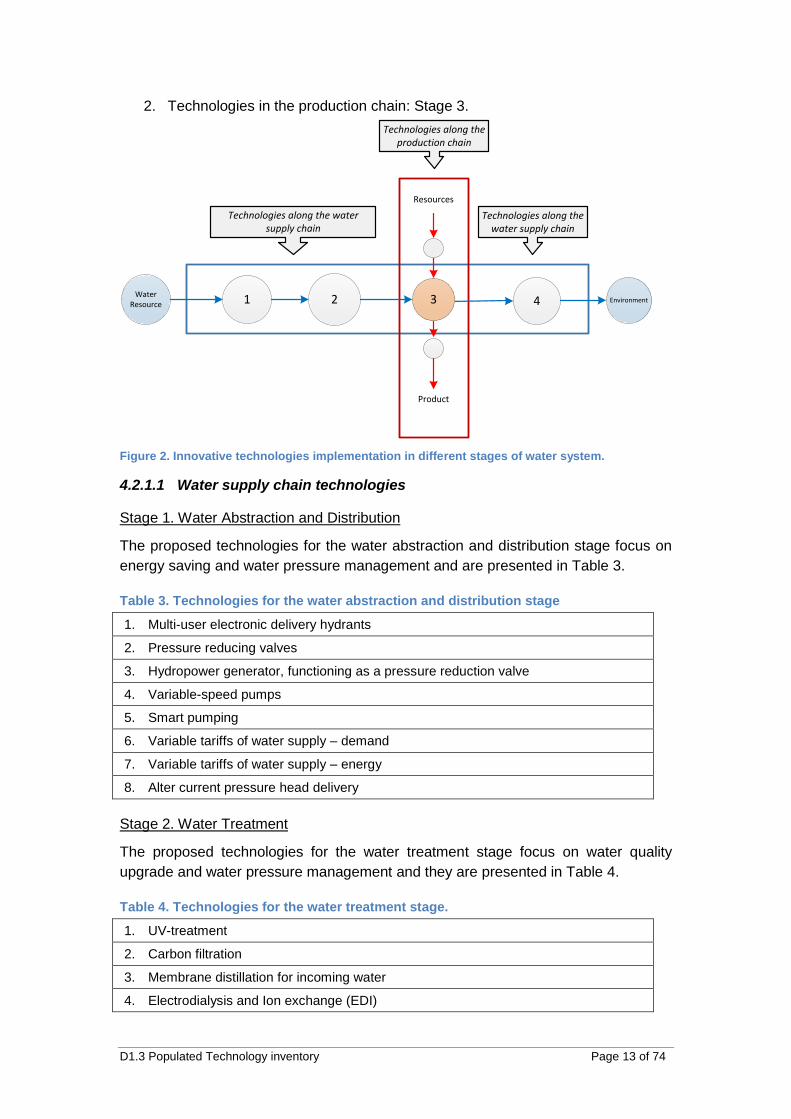
4.2.1 Technology Classification
A preliminary list of innovative technologies has been identified, based on the
mapping of the system in the baseline scenario and the identification of the system
vulnerabilities and the environmentally weak stages. Technologies are classified
according to the stage at which they are implemented (Figure 2):
1. Technologies in the water supply chain (common in all water use systems);
implemented either upstream (e.g. water treatment) or downstream (e.g.
wastewater treatment) of the water use stage: Stage 1, 2, and 4.
Actor B
Actor CActor A
2 3Water Resource 4 Environment
Product
Resources
1
€ €
D1.3 Populated Technology inventory Page 13 of 74
2. Technologies in the production chain: Stage 3.
Figure 2. Innovative technologies implementation in different stages of water system.
4.2.1.1 Water supply chain technologies
Stage 1. Water Abstraction and Distribution
The proposed technologies for the water abstraction and distribution stage focus on
energy saving and water pressure management and are presented in Table 3.
Table 3. Technologies for the water abstraction and distribution stage
1. Multi-user electronic delivery hydrants
2. Pressure reducing valves
3. Hydropower generator, functioning as a pressure reduction valve
4. Variable-speed pumps
5. Smart pumping
6. Variable tariffs of water supply – demand
7. Variable tariffs of water supply – energy
8. Alter current pressure head delivery
Stage 2. Water Treatment
The proposed technologies for the water treatment stage focus on water quality
upgrade and water pressure management and they are presented in Table 4.
Table 4. Technologies for the water treatment stage.
1. UV-treatment
2. Carbon filtration
3. Membrane distillation for incoming water
4. Electrodialysis and Ion exchange (EDI)
2 3Water Resource 4 Environment
Product
Resources
1
Technologies along the water supply chain
Technologies along the water supply chain
Technologies along the production chain
D1.3 Populated Technology inventory Page 14 of 74
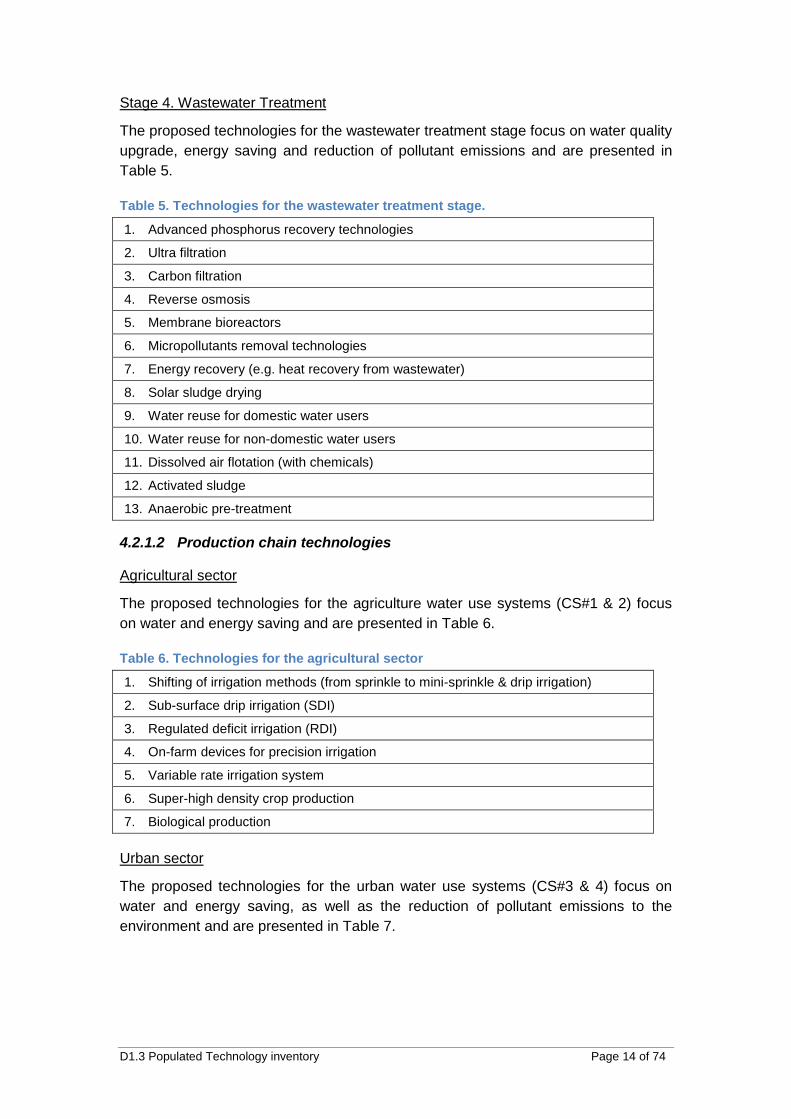
Stage 4. Wastewater Treatment
The proposed technologies for the wastewater treatment stage focus on water quality
upgrade, energy saving and reduction of pollutant emissions and are presented in
Table 5.
Table 5. Technologies for the wastewater treatment stage.
1. Advanced phosphorus recovery technologies
2. Ultra filtration
3. Carbon filtration
4. Reverse osmosis
5. Membrane bioreactors
6. Micropollutants removal technologies
7. Energy recovery (e.g. heat recovery from wastewater)
8. Solar sludge drying
9. Water reuse for domestic water users
10. Water reuse for non-domestic water users
11. Dissolved air flotation (with chemicals)
12. Activated sludge
13. Anaerobic pre-treatment
4.2.1.2 Production chain technologies
Agricultural sector
The proposed technologies for the agriculture water use systems (CS#1 & 2) focus
on water and energy saving and are presented in Table 6.
Table 6. Technologies for the agricultural sector
1. Shifting of irrigation methods (from sprinkle to mini-sprinkle & drip irrigation)
2. Sub-surface drip irrigation (SDI)
3. Regulated deficit irrigation (RDI)
4. On-farm devices for precision irrigation
5. Variable rate irrigation system
6. Super-high density crop production
7. Biological production
Urban sector
The proposed technologies for the urban water use systems (CS#3 & 4) focus on
water and energy saving, as well as the reduction of pollutant emissions to the
environment and are presented in Table 7.
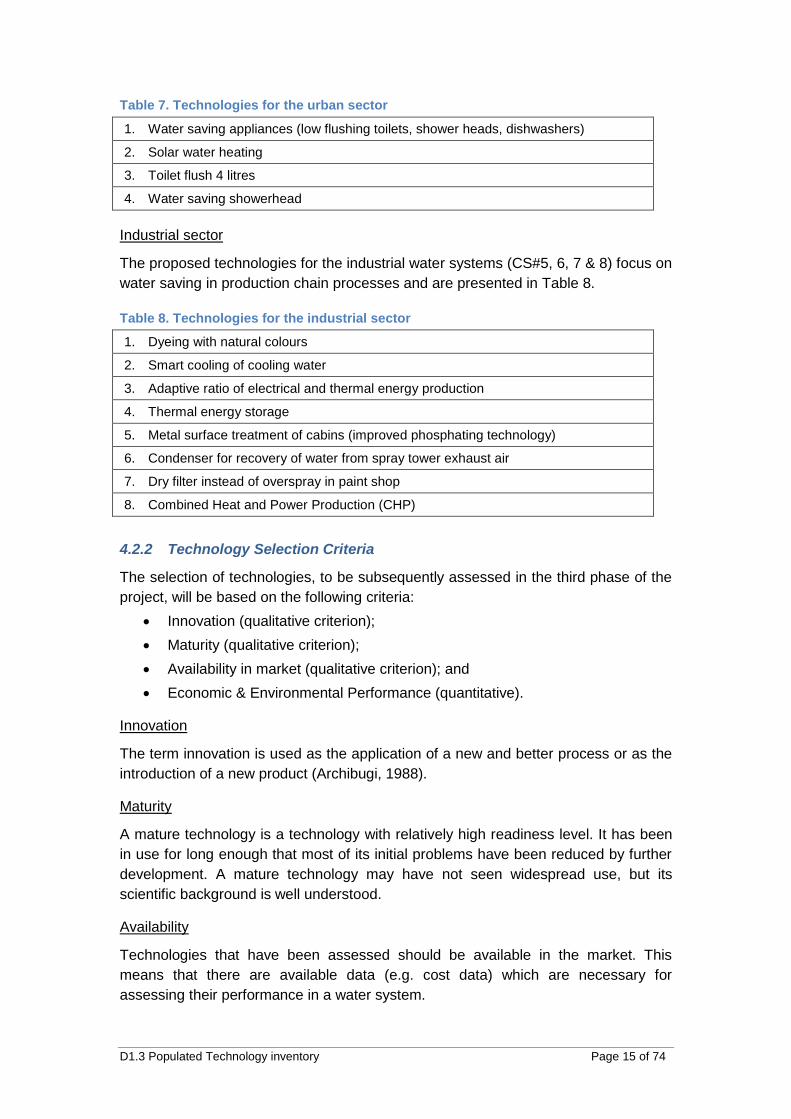
D1.3 Populated Technology inventory Page 15 of 74
Table 7. Technologies for the urban sector
1. Water saving appliances (low flushing toilets, shower heads, dishwashers)
2. Solar water heating
3. Toilet flush 4 litres
4. Water saving showerhead
Industrial sector
The proposed technologies for the industrial water systems (CS#5, 6, 7 & 8) focus on
water saving in production chain processes and are presented in Table 8.
Table 8. Technologies for the industrial sector
1. Dyeing with natural colours
2. Smart cooling of cooling water
3. Adaptive ratio of electrical and thermal energy production
4. Thermal energy storage
5. Metal surface treatment of cabins (improved phosphating technology)
6. Condenser for recovery of water from spray tower exhaust air
7. Dry filter instead of overspray in paint shop
8. Combined Heat and Power Production (CHP)
4.2.2 Technology Selection Criteria
The selection of technologies, to be subsequently assessed in the third phase of the
project, will be based on the following criteria:
Innovation (qualitative criterion);
Maturity (qualitative criterion);
Availability in market (qualitative criterion); and
Economic & Environmental Performance (quantitative).
Innovation
The term innovation is used as the application of a new and better process or as the
introduction of a new product (Archibugi, 1988).
Maturity
A mature technology is a technology with relatively high readiness level. It has been
in use for long enough that most of its initial problems have been reduced by further
development. A mature technology may have not seen widespread use, but its
scientific background is well understood.
Availability
Technologies that have been assessed should be available in the market. This
means that there are available data (e.g. cost data) which are necessary for
assessing their performance in a water system.
D1.3 Populated Technology inventory Page 16 of 74
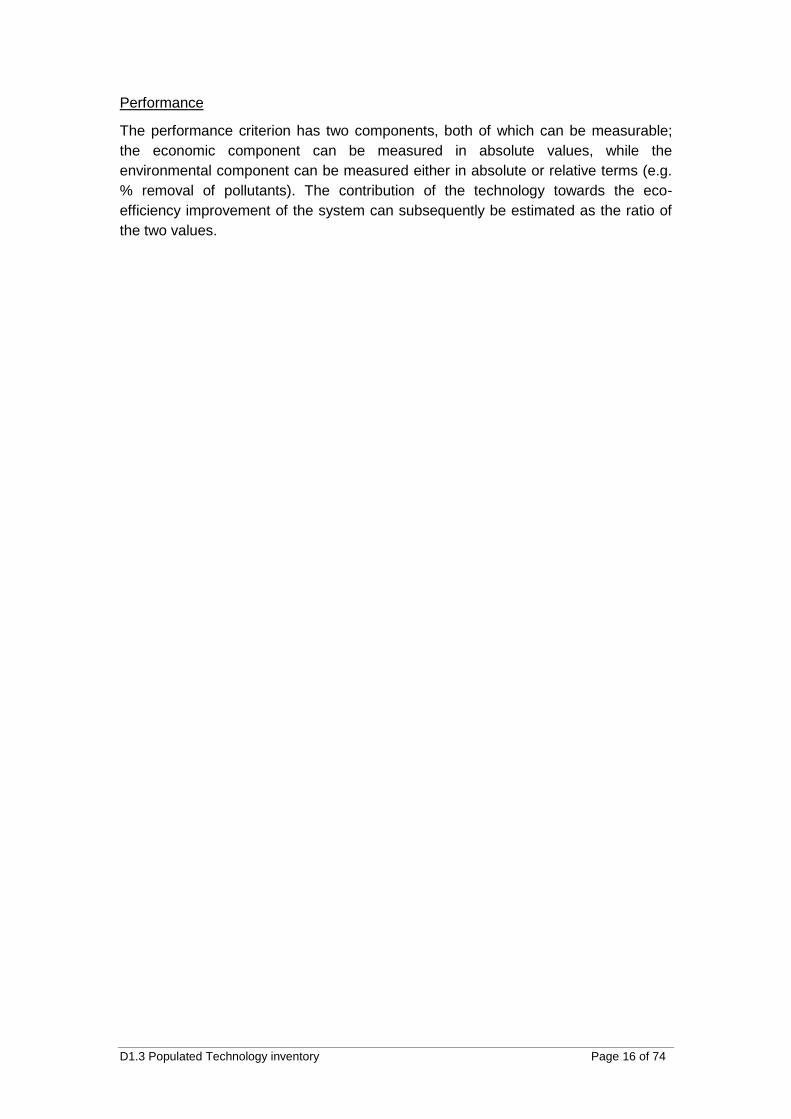
Performance
The performance criterion has two components, both of which can be measurable;
the economic component can be measured in absolute values, while the
environmental component can be measured either in absolute or relative terms (e.g.
% removal of pollutants). The contribution of the technology towards the eco-
efficiency improvement of the system can subsequently be estimated as the ratio of
the two values.
D1.3 Populated Technology inventory Page 17 of 74
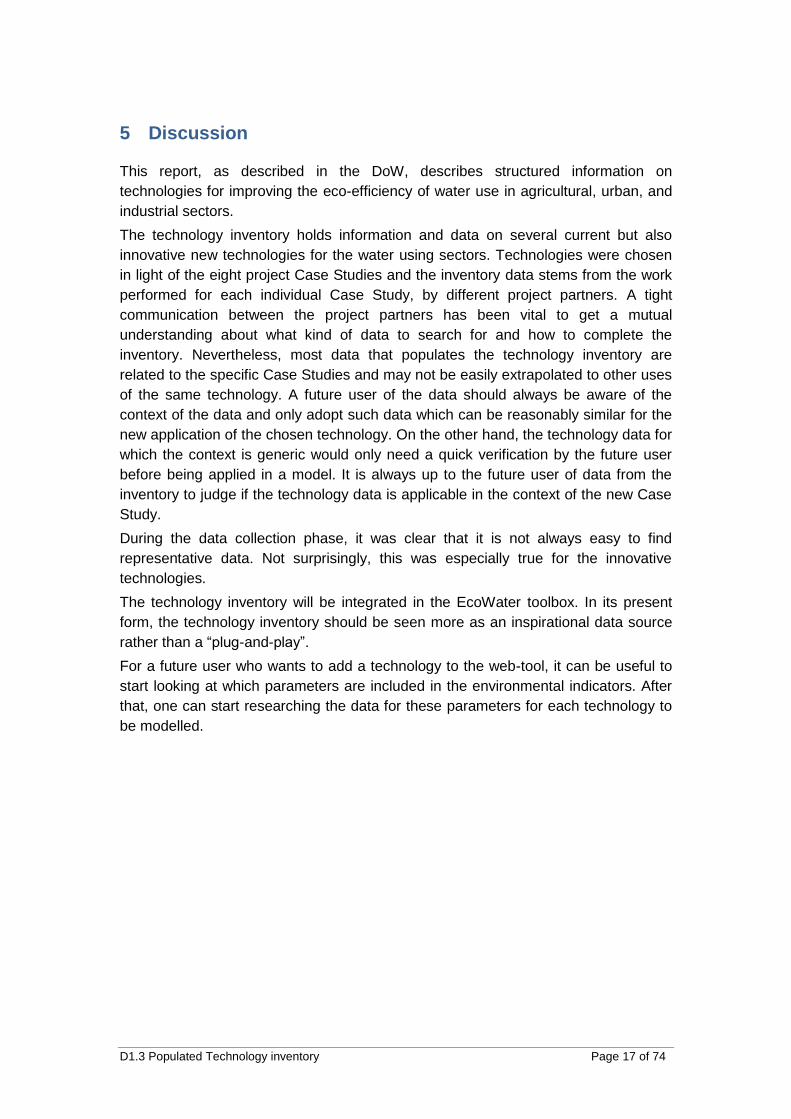
5 Discussion
This report, as described in the DoW, describes structured information on
technologies for improving the eco-efficiency of water use in agricultural, urban, and
industrial sectors.
The technology inventory holds information and data on several current but also
innovative new technologies for the water using sectors. Technologies were chosen
in light of the eight project Case Studies and the inventory data stems from the work
performed for each individual Case Study, by different project partners. A tight
communication between the project partners has been vital to get a mutual
understanding about what kind of data to search for and how to complete the
inventory. Nevertheless, most data that populates the technology inventory are
related to the specific Case Studies and may not be easily extrapolated to other uses
of the same technology. A future user of the data should always be aware of the
context of the data and only adopt such data which can be reasonably similar for the
new application of the chosen technology. On the other hand, the technology data for
which the context is generic would only need a quick verification by the future user
before being applied in a model. It is always up to the future user of data from the
inventory to judge if the technology data is applicable in the context of the new Case
Study.
During the data collection phase, it was clear that it is not always easy to find
representative data. Not surprisingly, this was especially true for the innovative
technologies.
The technology inventory will be integrated in the EcoWater toolbox. In its present
form, the technology inventory should be seen more as an inspirational data source
rather than a “plug-and-play”.
For a future user who wants to add a technology to the web-tool, it can be useful to
start looking at which parameters are included in the environmental indicators. After
that, one can start researching the data for these parameters for each technology to
be modelled.
D1.3 Populated Technology inventory Page 18 of 74
6 References
Annex I – ”Description of Work”, EcoWater, Grant agreement no:282882.
Archibugi, D. (1988). In Search of a Useful Measure of Technological Innovation (to Make Economists Happy without Discontenting Technologists). Technological Forecasting and Social Change , 34, 253-277.
DOE (2011). Technology Readiness Assessment Guide. United States Department of Energy, Office of Management. (DOE G 413.3-4).
Guinée, B. J. et al., (2001). Handbook on Life Cycle Assessment: Operational Guide to the ISO Standards. Dordrecht: Kluwer Academic Publishers.
Humphrey, J., & Schmitz, H. (2000). Governance and Upgrading: Linking Industrial Cluster and Global Value Chain Research. Working Paper 120, IDS.
JRC. (2011). European Commission – Joint Research Centre – Institute for Environment and Sustainability: International Reference Life Cycle Data system (ILCD) Handbook: Recommendations for Life Cycle Impact Assessment in the European context. First Edition. Luxembourg: Publication Office of the European Union.
OPTIMA project website, www.ess.co.at/OPTIMA, visited Jan-2012.
D1.3 Populated Technology inventory Page 19 of 74
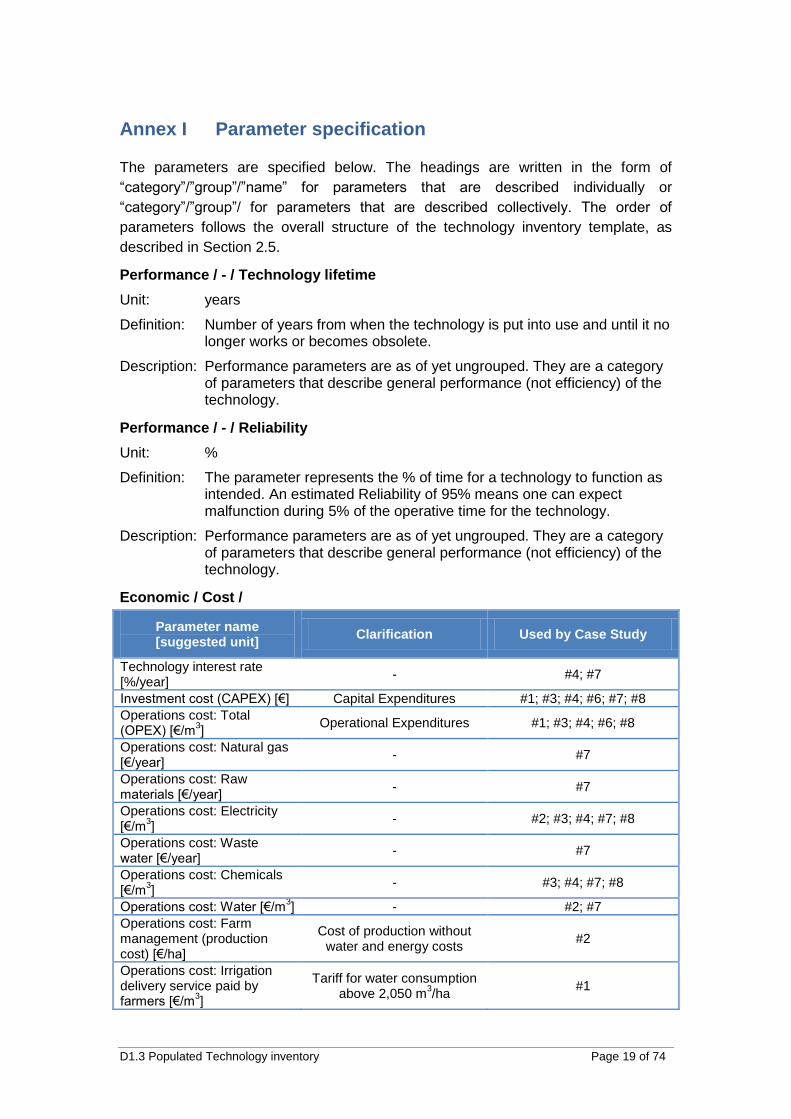
Annex I Parameter specification
The parameters are specified below. The headings are written in the form of
“category”/”group”/”name” for parameters that are described individually or
“category”/”group”/ for parameters that are described collectively. The order of
parameters follows the overall structure of the technology inventory template, as
described in Section 2.5.
Performance / - / Technology lifetime
Unit: years
Definition: Number of years from when the technology is put into use and until it no longer works or becomes obsolete.
Description: Performance parameters are as of yet ungrouped. They are a category of parameters that describe general performance (not efficiency) of the technology.
Performance / - / Reliability
Unit: %
Definition: The parameter represents the % of time for a technology to function as intended. An estimated Reliability of 95% means one can expect malfunction during 5% of the operative time for the technology.
Description: Performance parameters are as of yet ungrouped. They are a category of parameters that describe general performance (not efficiency) of the technology.
Economic / Cost /
Parameter name [suggested unit]
Clarification Used by Case Study
Technology interest rate [%/year]
- #4; #7
Investment cost (CAPEX) [€] Capital Expenditures #1; #3; #4; #6; #7; #8
Operations cost: Total (OPEX) [€/m
3]
Operational Expenditures #1; #3; #4; #6; #8
Operations cost: Natural gas [€/year]
- #7
Operations cost: Raw materials [€/year]
- #7
Operations cost: Electricity [€/m
3]
- #2; #3; #4; #7; #8
Operations cost: Waste water [€/year]
- #7
Operations cost: Chemicals [€/m
3]
- #3; #4; #7; #8
Operations cost: Water [€/m3] - #2; #7
Operations cost: Farm management (production cost) [€/ha]
Cost of production without water and energy costs
#2
Operations cost: Irrigation delivery service paid by farmers [€/m
3]
Tariff for water consumption above 2,050 m
3/ha
#1

D1.3 Populated Technology inventory Page 20 of 74
Maintenance cost [€/year] - #3; #4; #6; #8
Yearly financial costs of technology [€/year]
- #3; #4; #6
Financial costs to treat 1m³ [€/m
3]
- #3; #4
Description: Parameters representing a cost incurred from using the technology. The
cost could be e.g. reported as a total cost or individually for the
resources used when applying the technology.
Economic / Value /
Parameter name [suggested unit]
Clarification Used by Case Study
Benefits for actors changing technology/substance/crop [€/year]
#6
Value from by-products (e.g. biogas) [€/year]
#3; #7
Value from export of electricity to the grid [€/year]
#7
Value from products [€/year] #7
Description: Parameters representing a value created from using the technology.
The value could be e.g. added value of water, value from by-products or
other value to the user of the technology.
Environmental / Emissions to air /
Parameter name [suggested unit]
Midpoint impact category Used by Case Study
CH4 [t/year] Climate change -
CO2 [t/year] Climate change #2; #7
N2O formation in WWTP [kg/year]
Climate change #7
SOx [kg/year] Acidification potential #7
Clarification: Substances emitted to air by the technology, affecting its quality.
Description: Can include a range of substances important for air quality or other
environmental impact categories
Environmental / Water quality influence /
Parameter name [suggested unit]
Midpoint impact category Used by Case Study
Ammonia nitrogen (NH4-N) [kg/year]
Aquatic Eutrophication #7
Nitrogen total (N) [∆mg/l] Aquatic Eutrophication #3; #7
PO4 [∆mg/l] Aquatic Eutrophication #3
Phosphorus total (P) [∆mg/l] Aquatic Eutrophication #3; #4; #7; #8
BOD (Biological oxygen demand) [∆mg/l]
Parameter of interest. Not within the chosen indicators
#3; #4; #8
COD (Chemical oxygen demand) [∆mg/l]
Aquatic Eutrophication #3; #4; #7; #8
TSS (Total suspended solids) [∆mg/l]
Parameter of interest. Not within the chosen indicators
#3
Micro pollutants [kg/year] Parameter of interest. Not #7
D1.3 Populated Technology inventory Page 21 of 74
within the chosen indicators
Mineral oil [∆mg/l] Parameter of interest. Not
within the chosen indicators #8
Nickel (Ni) [∆mg/l] Human Toxicity; Aquatic
Ecotoxicity #5; #8
Zinc (Zn) [∆mg/l] Human Toxicity; Aquatic
Ecotoxicity #5; #8
TEH (Total extractable hydrocarbons) [∆mg/l]
Parameter of interest. Not within the chosen indicators
#5
Cadmium (Cd) [∆mg/l] Human Toxicity; Aquatic
Ecotoxicity #5
Lead (Pb) [∆mg/l] Human Toxicity; Aquatic
Ecotoxicity #4; #5
Mercury (Hg) [∆mg/l] Human Toxicity; Aquatic
Ecotoxicity #5
Chromium (Cr) [∆mg/l] Human Toxicity; Aquatic
Ecotoxicity #5
Copper (Cu) [∆mg/l] Human Toxicity; Aquatic
Ecotoxicity #5
Arsenic (As) [∆mg/l] Human Toxicity; Aquatic
Ecotoxicity #5
Selenium (Se) [∆mg/l] Human Toxicity; Aquatic
Ecotoxicity #5
Antimony (Sb) [∆mg/l] Human Toxicity; Aquatic
Ecotoxicity #5
Tin (Sn) [∆mg/l] Human Toxicity; Aquatic
Ecotoxicity #5
Cobalt (Co) [∆mg/l] Human Toxicity; Aquatic
Ecotoxicity #5
Molybdenum (Mo) [∆mg/l] Human Toxicity; Aquatic
Ecotoxicity #5
Temperature or emitted thermal load [∆degrees °C]
Parameter of interest. Not within the chosen indicators
#6
Clarification: Substances (pollutants) in the water, affecting its quality.
Description: The parameter group describes the difference in concentration for the
substances (parameters) before and after the technology step in the
node. For example a filter absorbing PAH, will give a negative value
since the concentration of PAH in the water is lower after the filter.
Environmental / Water use /
Parameter name [suggested unit]
Midpoint impact category Used by Case Study
Total volume per year [m
3/year]
Parameter of interest. Not within the chosen indicators
#1; #2; #3; #4; #5; #6; #8
Re-used water [m3/year]
Parameter of interest. Not within the chosen indicators
#4
Water discharged after use of technology [m
3/year]
Parameter of interest. Not within the chosen indicators
#3; #6
Water lost (leakages) [m
3/year]
Parameter of interest. Not within the chosen indicators
#3; #5
Surface water [m3/year]
Resource Depletion – Fresh Water
#3; #4; #5; #6; #8
Groundwater [m3/year]
Resource Depletion – Fresh Water
#4; #5; #8
Unspecified water [m3/year] Parameter of interest. Not #4; #8
D1.3 Populated Technology inventory Page 22 of 74
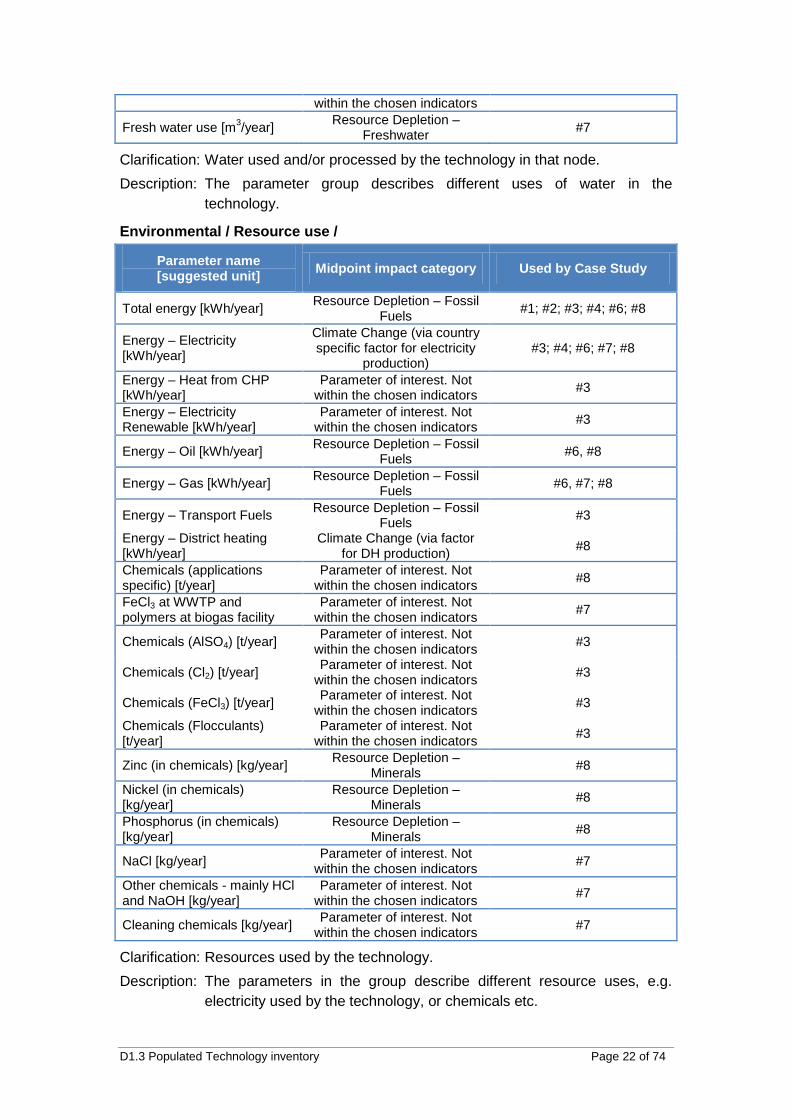
within the chosen indicators
Fresh water use [m3/year]
Resource Depletion – Freshwater
#7
Clarification: Water used and/or processed by the technology in that node.
Description: The parameter group describes different uses of water in the
technology.
Environmental / Resource use /
Parameter name [suggested unit]
Midpoint impact category Used by Case Study
Total energy [kWh/year] Resource Depletion – Fossil
Fuels #1; #2; #3; #4; #6; #8
Energy – Electricity [kWh/year]
Climate Change (via country specific factor for electricity
production) #3; #4; #6; #7; #8
Energy – Heat from CHP [kWh/year]
Parameter of interest. Not within the chosen indicators
#3
Energy – Electricity Renewable [kWh/year]
Parameter of interest. Not within the chosen indicators
#3
Energy – Oil [kWh/year] Resource Depletion – Fossil
Fuels #6, #8
Energy – Gas [kWh/year] Resource Depletion – Fossil
Fuels #6, #7; #8
Energy – Transport Fuels Resource Depletion – Fossil
Fuels #3
Energy – District heating [kWh/year]
Climate Change (via factor for DH production)
#8
Chemicals (applications specific) [t/year]
Parameter of interest. Not within the chosen indicators
#8
FeCl3 at WWTP and polymers at biogas facility
Parameter of interest. Not within the chosen indicators
#7
Chemicals (AlSO4) [t/year] Parameter of interest. Not
within the chosen indicators #3
Chemicals (Cl2) [t/year] Parameter of interest. Not
within the chosen indicators #3
Chemicals (FeCl3) [t/year] Parameter of interest. Not
within the chosen indicators #3
Chemicals (Flocculants) [t/year]
Parameter of interest. Not within the chosen indicators
#3
Zinc (in chemicals) [kg/year] Resource Depletion –
Minerals #8
Nickel (in chemicals) [kg/year]
Resource Depletion – Minerals
#8
Phosphorus (in chemicals) [kg/year]
Resource Depletion – Minerals
#8
NaCl [kg/year] Parameter of interest. Not
within the chosen indicators #7
Other chemicals - mainly HCl and NaOH [kg/year]
Parameter of interest. Not within the chosen indicators
#7
Cleaning chemicals [kg/year] Parameter of interest. Not
within the chosen indicators #7
Clarification: Resources used by the technology.
Description: The parameters in the group describe different resource uses, e.g.
electricity used by the technology, or chemicals etc.
D1.3 Populated Technology inventory Page 23 of 74
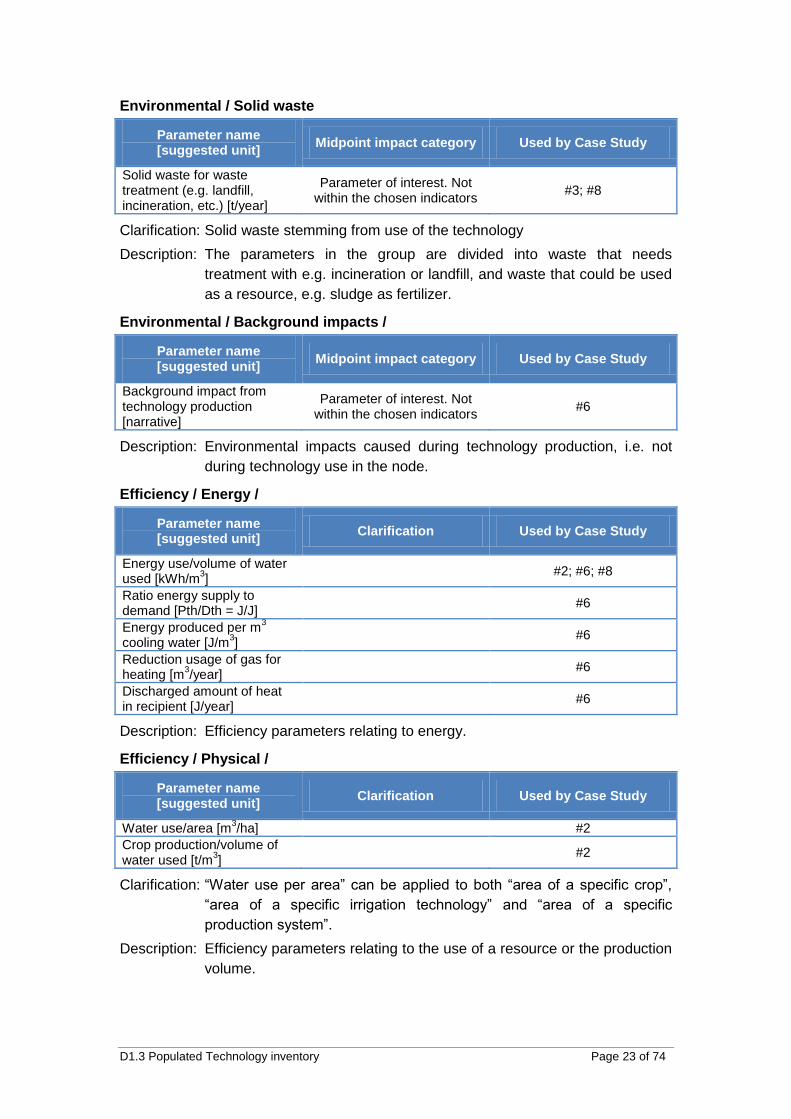
Environmental / Solid waste
Parameter name [suggested unit]
Midpoint impact category Used by Case Study
Solid waste for waste treatment (e.g. landfill, incineration, etc.) [t/year]
Parameter of interest. Not within the chosen indicators
#3; #8
Clarification: Solid waste stemming from use of the technology
Description: The parameters in the group are divided into waste that needs
treatment with e.g. incineration or landfill, and waste that could be used
as a resource, e.g. sludge as fertilizer.
Environmental / Background impacts /
Parameter name [suggested unit]
Midpoint impact category Used by Case Study
Background impact from technology production [narrative]
Parameter of interest. Not within the chosen indicators
#6
Description: Environmental impacts caused during technology production, i.e. not
during technology use in the node.
Efficiency / Energy /
Parameter name [suggested unit]
Clarification Used by Case Study
Energy use/volume of water used [kWh/m
3]
#2; #6; #8
Ratio energy supply to demand [Pth/Dth = J/J]
#6
Energy produced per m3
cooling water [J/m3]
#6
Reduction usage of gas for heating [m
3/year]
#6
Discharged amount of heat in recipient [J/year]
#6
Description: Efficiency parameters relating to energy.
Efficiency / Physical /
Parameter name [suggested unit]
Clarification Used by Case Study
Water use/area [m3/ha] #2
Crop production/volume of water used [t/m
3]
#2
Clarification: “Water use per area” can be applied to both “area of a specific crop”,
“area of a specific irrigation technology” and “area of a specific
production system”.
Description: Efficiency parameters relating to the use of a resource or the production
volume.
D1.3 Populated Technology inventory Page 24 of 74
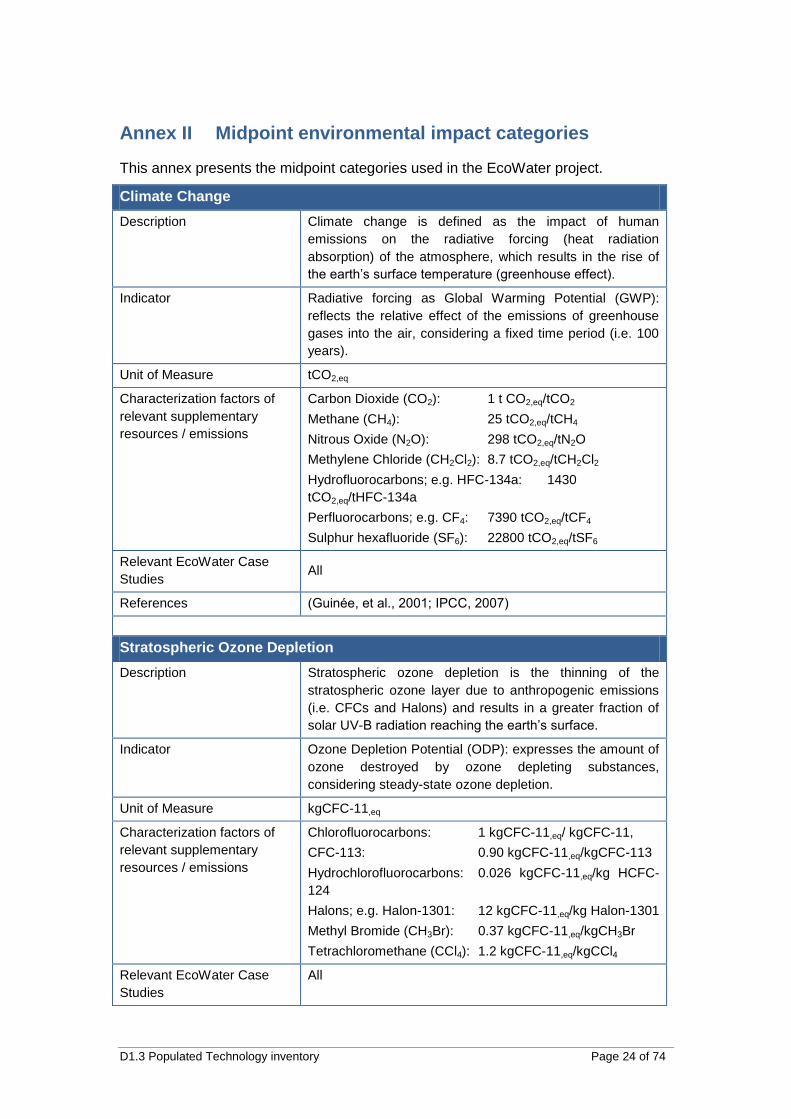
Annex II Midpoint environmental impact categories
This annex presents the midpoint categories used in the EcoWater project.
Climate Change
Description Climate change is defined as the impact of human
emissions on the radiative forcing (heat radiation
absorption) of the atmosphere, which results in the rise of
the earth’s surface temperature (greenhouse effect).
Indicator Radiative forcing as Global Warming Potential (GWP):
reflects the relative effect of the emissions of greenhouse
gases into the air, considering a fixed time period (i.e. 100
years).
Unit of Measure tCO2,eq
Characterization factors of
relevant supplementary
resources / emissions
Carbon Dioxide (CO2): 1 t CO2,eq/tCO2
Methane (CH4): 25 tCO2,eq/tCH4
Nitrous Oxide (N2O): 298 tCO2,eq/tN2O
Methylene Chloride (CH2Cl2): 8.7 tCO2,eq/tCH2Cl2
Hydrofluorocarbons; e.g. HFC-134a: 1430
tCO2,eq/tHFC-134a
Perfluorocarbons; e.g. CF4: 7390 tCO2,eq/tCF4
Sulphur hexafluoride (SF6): 22800 tCO2,eq/tSF6
Relevant EcoWater Case
Studies All
References (Guinée, et al., 2001; IPCC, 2007)
Stratospheric Ozone Depletion
Description Stratospheric ozone depletion is the thinning of the
stratospheric ozone layer due to anthropogenic emissions
(i.e. CFCs and Halons) and results in a greater fraction of
solar UV-B radiation reaching the earth’s surface.
Indicator Ozone Depletion Potential (ODP): expresses the amount of
ozone destroyed by ozone depleting substances,
considering steady-state ozone depletion.
Unit of Measure kgCFC-11,eq
Characterization factors of
relevant supplementary
resources / emissions
Chlorofluorocarbons: 1 kgCFC-11,eq/ kgCFC-11,
CFC-113: 0.90 kgCFC-11,eq/kgCFC-113
Hydrochlorofluorocarbons: 0.026 kgCFC-11,eq/kg HCFC-
124
Halons; e.g. Halon-1301: 12 kgCFC-11,eq/kg Halon-1301
Methyl Bromide (CH3Br): 0.37 kgCFC-11,eq/kgCH3Br
Tetrachloromethane (CCl4): 1.2 kgCFC-11,eq/kgCCl4
Relevant EcoWater Case
Studies
All
D1.3 Populated Technology inventory Page 25 of 74
References (Guinée, et al., 2001; Goedkoop, et al., 2008; EPA, 2006)
Eutrophication
Description Eutrophication covers all potential impacts of excessively
high environmental levels of macronutrients, the most
important of which are nitrogen (N) and phosphorus (P).
Nutrient enrichment may cause an undesirable shift in
species composition and elevated biomass production in
both aquatic and terrestrial ecosystems. In addition, high
nutrient concentrations may also render surface waters
unacceptable as a source of drinking water.
Indicator Eutrophication Potential (EP): measures the fraction of
nutrients, which cause over-fertilization of water.
Unit of Measure kgPO4,eq or kgNOx,eq
Characterization factors of
relevant supplementary
resources / emissions
Ammonia (NH3): 0.35 kgPO43-
,eq/kgNH3
Ammonium (NH4+): 0.33 kgPO4
3-,eq/kgNH4
+
Nitrates (NO3-): 0.1 kgPO4
3-,eq/kgNO3
-
Nitric Acid (HNO3): 0.1 kgPO43-
,eq/kgHNO3
Nitrogen Total (N): 0.42 kgPO43-
,eq/kgN
Nitrogen Monoxide (NO): 0.2 kgPO43-
,eq/kgNO
Nitrogen Dioxide (NO2): 0.13 kgPO43-
,eq/kgNO2
Nitrogen Oxides (NOx): 0.13 kgPO43-
,eq/kgNOx
Nitrous Oxide (N2O): 0.27 kgPO43-
,eq/kgN2O
Phosphates (PO43-
): 1 kgPO43-
,eq/kgPO43-
,eq
Phosphoric Acid (H3PO4): 0.97 kgPO43-
,eq/kgH3PO4
Total Phosphorus (P): 3.06 kgPO43-
,eq/kgP
Phosphorus Oxide (P2O5): 1.34 kgPO43-
,eq/kgP2O5
Chemical Oxygen Demand: 0.022kgPO43-
,eq/kgCOD
Relevant EcoWater Case
Studies All
References (Guinée, et al., 2001)
Acidification
Description Acidification refers to the processes that increase the
acidity of water and soil systems through hydrogen ion
concentration and it is caused by the acidifying effects of
anthropogenic emissions (i.e. NOx, SO2).
Indicator Acidification Potential (AP): describes the impacts of
emissions of acidifying substances on natural ecosystems.
The time span is eternity and the geographical scale varies
between local and continental.
Unit of Measure kgSO2,eq
Characterization factors of
relevant supplementary
resources / emissions
Ammonia (NH3): 1.88 kgSO2,eq/kgNH3
Hydrogen Chloride (HCl): 0.88 kgSO2,eq/kgHCl
Hydrogen Fluoride (HF): 1.60 kgSO2,eq/kgHF
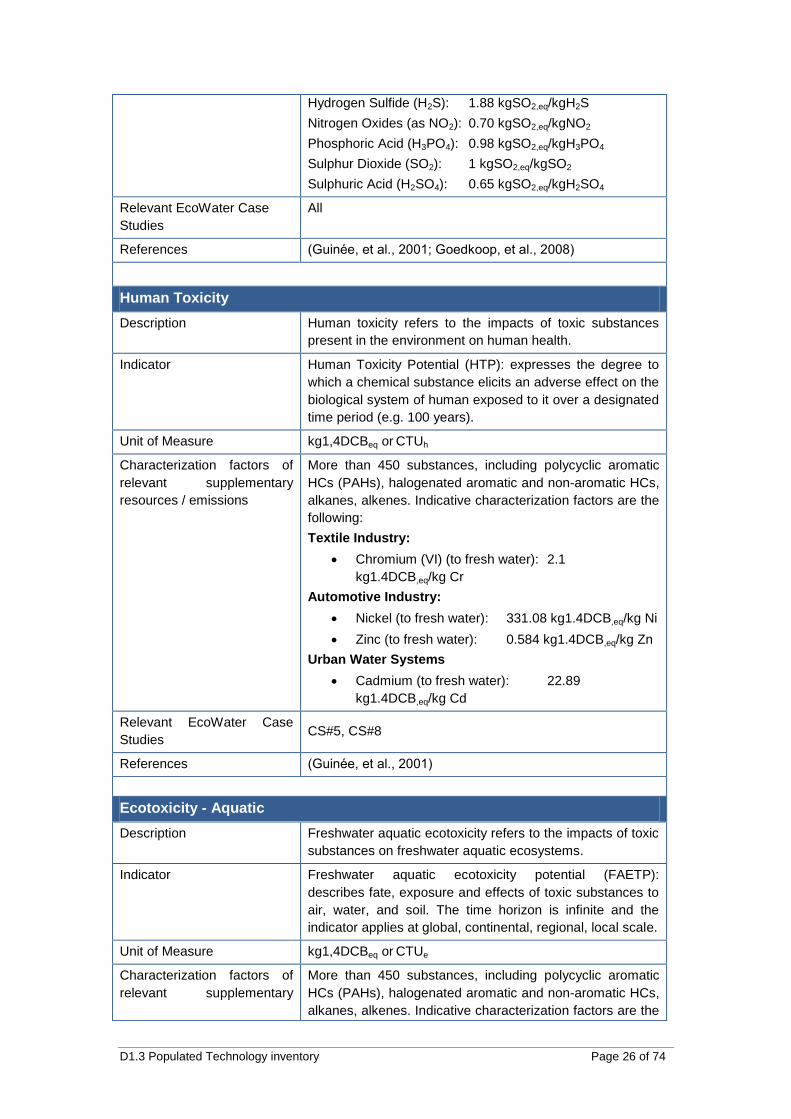
D1.3 Populated Technology inventory Page 26 of 74
Hydrogen Sulfide (H2S): 1.88 kgSO2,eq/kgH2S
Nitrogen Oxides (as NO2): 0.70 kgSO2,eq/kgNO2
Phosphoric Acid (H3PO4): 0.98 kgSO2,eq/kgH3PO4
Sulphur Dioxide (SO2): 1 kgSO2,eq/kgSO2
Sulphuric Acid (H2SO4): 0.65 kgSO2,eq/kgH2SO4
Relevant EcoWater Case
Studies
All
References (Guinée, et al., 2001; Goedkoop, et al., 2008)
Human Toxicity
Description Human toxicity refers to the impacts of toxic substances
present in the environment on human health.
Indicator Human Toxicity Potential (HTP): expresses the degree to
which a chemical substance elicits an adverse effect on the
biological system of human exposed to it over a designated
time period (e.g. 100 years).
Unit of Measure kg1,4DCBeq or CTUh
Characterization factors of
relevant supplementary
resources / emissions
More than 450 substances, including polycyclic aromatic
HCs (PAHs), halogenated aromatic and non-aromatic HCs,
alkanes, alkenes. Indicative characterization factors are the
following:
Textile Industry:
Chromium (VI) (to fresh water): 2.1
kg1.4DCB,eq/kg Cr
Automotive Industry:
Nickel (to fresh water): 331.08 kg1.4DCB,eq/kg Ni
Zinc (to fresh water): 0.584 kg1.4DCB,eq/kg Zn
Urban Water Systems
Cadmium (to fresh water): 22.89
kg1.4DCB,eq/kg Cd
Relevant EcoWater Case
Studies CS#5, CS#8
References (Guinée, et al., 2001)
Ecotoxicity - Aquatic
Description Freshwater aquatic ecotoxicity refers to the impacts of toxic
substances on freshwater aquatic ecosystems.
Indicator Freshwater aquatic ecotoxicity potential (FAETP):
describes fate, exposure and effects of toxic substances to
air, water, and soil. The time horizon is infinite and the
indicator applies at global, continental, regional, local scale.
Unit of Measure kg1,4DCBeq or CTUe
Characterization factors of
relevant supplementary
More than 450 substances, including polycyclic aromatic
HCs (PAHs), halogenated aromatic and non-aromatic HCs,
alkanes, alkenes. Indicative characterization factors are the
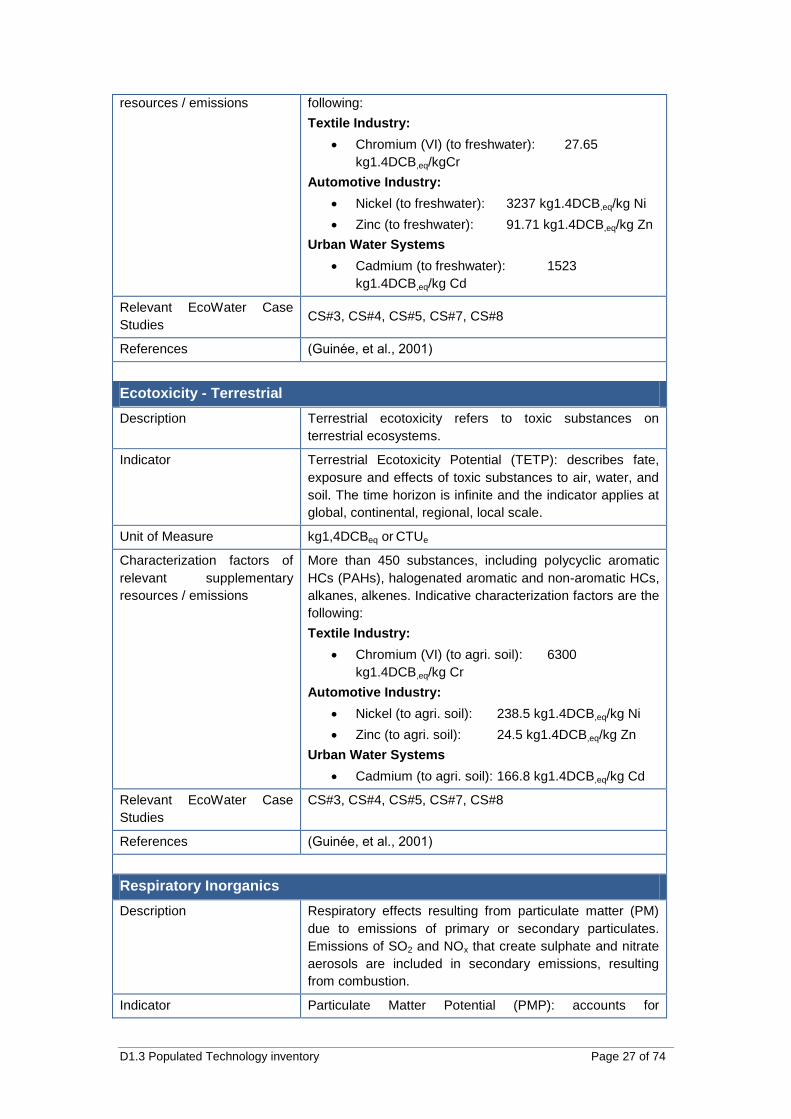
D1.3 Populated Technology inventory Page 27 of 74
resources / emissions following:
Textile Industry:
Chromium (VI) (to freshwater): 27.65
kg1.4DCB,eq/kgCr
Automotive Industry:
Nickel (to freshwater): 3237 kg1.4DCB,eq/kg Ni
Zinc (to freshwater): 91.71 kg1.4DCB,eq/kg Zn
Urban Water Systems
Cadmium (to freshwater): 1523
kg1.4DCB,eq/kg Cd
Relevant EcoWater Case
Studies CS#3, CS#4, CS#5, CS#7, CS#8
References (Guinée, et al., 2001)
Ecotoxicity - Terrestrial
Description Terrestrial ecotoxicity refers to toxic substances on
terrestrial ecosystems.
Indicator Terrestrial Ecotoxicity Potential (TETP): describes fate,
exposure and effects of toxic substances to air, water, and
soil. The time horizon is infinite and the indicator applies at
global, continental, regional, local scale.
Unit of Measure kg1,4DCBeq or CTUe
Characterization factors of
relevant supplementary
resources / emissions
More than 450 substances, including polycyclic aromatic
HCs (PAHs), halogenated aromatic and non-aromatic HCs,
alkanes, alkenes. Indicative characterization factors are the
following:
Textile Industry:
Chromium (VI) (to agri. soil): 6300
kg1.4DCB,eq/kg Cr
Automotive Industry:
Nickel (to agri. soil): 238.5 kg1.4DCB,eq/kg Ni
Zinc (to agri. soil): 24.5 kg1.4DCB,eq/kg Zn
Urban Water Systems
Cadmium (to agri. soil): 166.8 kg1.4DCB,eq/kg Cd
Relevant EcoWater Case
Studies
CS#3, CS#4, CS#5, CS#7, CS#8
References (Guinée, et al., 2001)
Respiratory Inorganics
Description Respiratory effects resulting from particulate matter (PM)
due to emissions of primary or secondary particulates.
Emissions of SO2 and NOx that create sulphate and nitrate
aerosols are included in secondary emissions, resulting
from combustion.
Indicator Particulate Matter Potential (PMP): accounts for
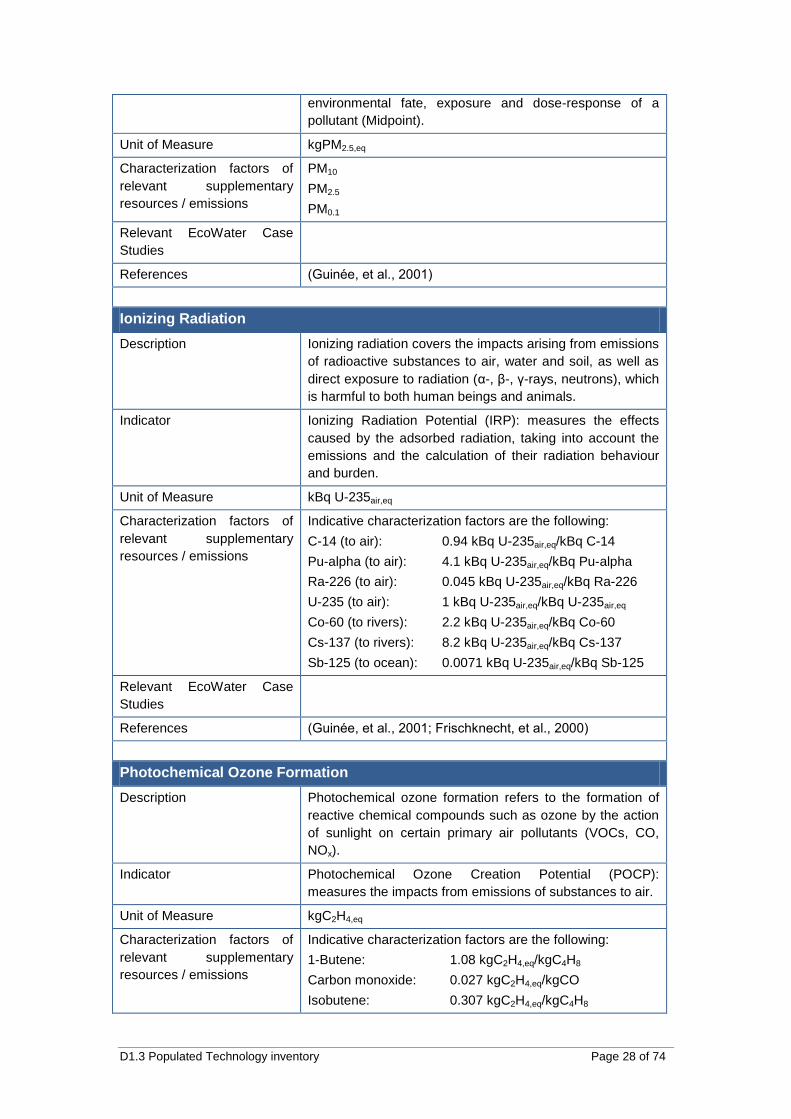
D1.3 Populated Technology inventory Page 28 of 74
environmental fate, exposure and dose-response of a
pollutant (Midpoint).
Unit of Measure kgPM2.5,eq
Characterization factors of
relevant supplementary
resources / emissions
PM10
PM2.5
PM0.1
Relevant EcoWater Case
Studies
References (Guinée, et al., 2001)
Ionizing Radiation
Description Ionizing radiation covers the impacts arising from emissions
of radioactive substances to air, water and soil, as well as
direct exposure to radiation (α-, β-, γ-rays, neutrons), which
is harmful to both human beings and animals.
Indicator Ionizing Radiation Potential (IRP): measures the effects
caused by the adsorbed radiation, taking into account the
emissions and the calculation of their radiation behaviour
and burden.
Unit of Measure kBq U-235air,eq
Characterization factors of
relevant supplementary
resources / emissions
Indicative characterization factors are the following:
C-14 (to air): 0.94 kBq U-235air,eq/kBq C-14
Pu-alpha (to air): 4.1 kBq U-235air,eq/kBq Pu-alpha
Ra-226 (to air): 0.045 kBq U-235air,eq/kBq Ra-226
U-235 (to air): 1 kBq U-235air,eq/kBq U-235air,eq
Co-60 (to rivers): 2.2 kBq U-235air,eq/kBq Co-60
Cs-137 (to rivers): 8.2 kBq U-235air,eq/kBq Cs-137
Sb-125 (to ocean): 0.0071 kBq U-235air,eq/kBq Sb-125
Relevant EcoWater Case
Studies
References (Guinée, et al., 2001; Frischknecht, et al., 2000)
Photochemical Ozone Formation
Description Photochemical ozone formation refers to the formation of
reactive chemical compounds such as ozone by the action
of sunlight on certain primary air pollutants (VOCs, CO,
NOx).
Indicator Photochemical Ozone Creation Potential (POCP):
measures the impacts from emissions of substances to air.
Unit of Measure kgC2H4,eq
Characterization factors of
relevant supplementary
resources / emissions
Indicative characterization factors are the following:
1-Butene: 1.08 kgC2H4,eq/kgC4H8
Carbon monoxide: 0.027 kgC2H4,eq/kgCO
Isobutene: 0.307 kgC2H4,eq/kgC4H8
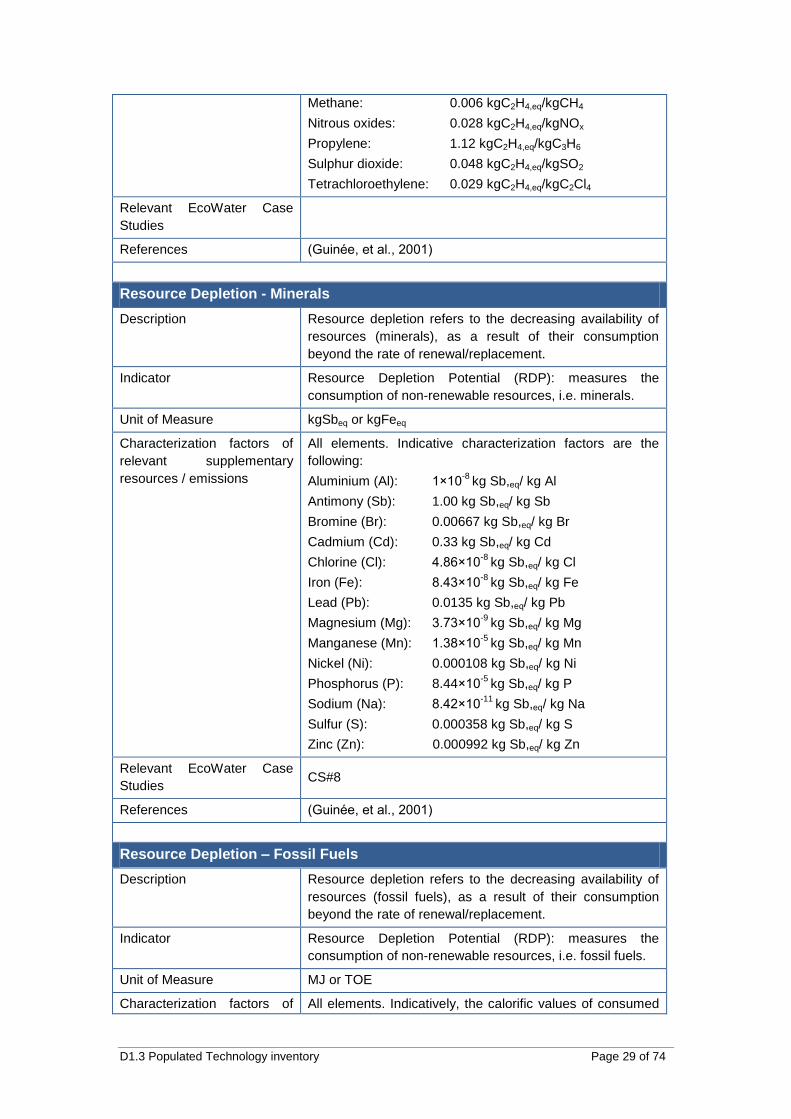
D1.3 Populated Technology inventory Page 29 of 74
Methane: 0.006 kgC2H4,eq/kgCH4
Nitrous oxides: 0.028 kgC2H4,eq/kgNOx
Propylene: 1.12 kgC2H4,eq/kgC3H6
Sulphur dioxide: 0.048 kgC2H4,eq/kgSO2
Tetrachloroethylene: 0.029 kgC2H4,eq/kgC2Cl4
Relevant EcoWater Case
Studies
References (Guinée, et al., 2001)
Resource Depletion - Minerals
Description Resource depletion refers to the decreasing availability of
resources (minerals), as a result of their consumption
beyond the rate of renewal/replacement.
Indicator Resource Depletion Potential (RDP): measures the
consumption of non-renewable resources, i.e. minerals.
Unit of Measure kgSbeq or kgFeeq
Characterization factors of
relevant supplementary
resources / emissions
All elements. Indicative characterization factors are the
following:
Aluminium (Al): 1×10⁻⁸
kg Sb,eq/ kg Al
Antimony (Sb): 1.00 kg Sb,eq/ kg Sb
Bromine (Br): 0.00667 kg Sb,eq/ kg Br
Cadmium (Cd): 0.33 kg Sb,eq/ kg Cd
Chlorine (Cl): 4.86×10⁻⁸
kg Sb,eq/ kg Cl
Iron (Fe): 8.43×10⁻⁸
kg Sb,eq/ kg Fe
Lead (Pb): 0.0135 kg Sb,eq/ kg Pb
Magnesium (Mg): 3.73×10⁻⁹
kg Sb,eq/ kg Mg
Manganese (Mn): 1.38×10⁻⁵
kg Sb,eq/ kg Mn
Nickel (Ni): 0.000108 kg Sb,eq/ kg Ni
Phosphorus (P): 8.44×10⁻⁵
kg Sb,eq/ kg P
Sodium (Na): 8.42×10⁻¹¹
kg Sb,eq/ kg Na
Sulfur (S): 0.000358 kg Sb,eq/ kg S
Zinc (Zn): 0.000992 kg Sb,eq/ kg Zn
Relevant EcoWater Case
Studies CS#8
References (Guinée, et al., 2001)
Resource Depletion – Fossil Fuels
Description Resource depletion refers to the decreasing availability of
resources (fossil fuels), as a result of their consumption
beyond the rate of renewal/replacement.
Indicator Resource Depletion Potential (RDP): measures the
consumption of non-renewable resources, i.e. fossil fuels.
Unit of Measure MJ or TOE
Characterization factors of All elements. Indicatively, the calorific values of consumed
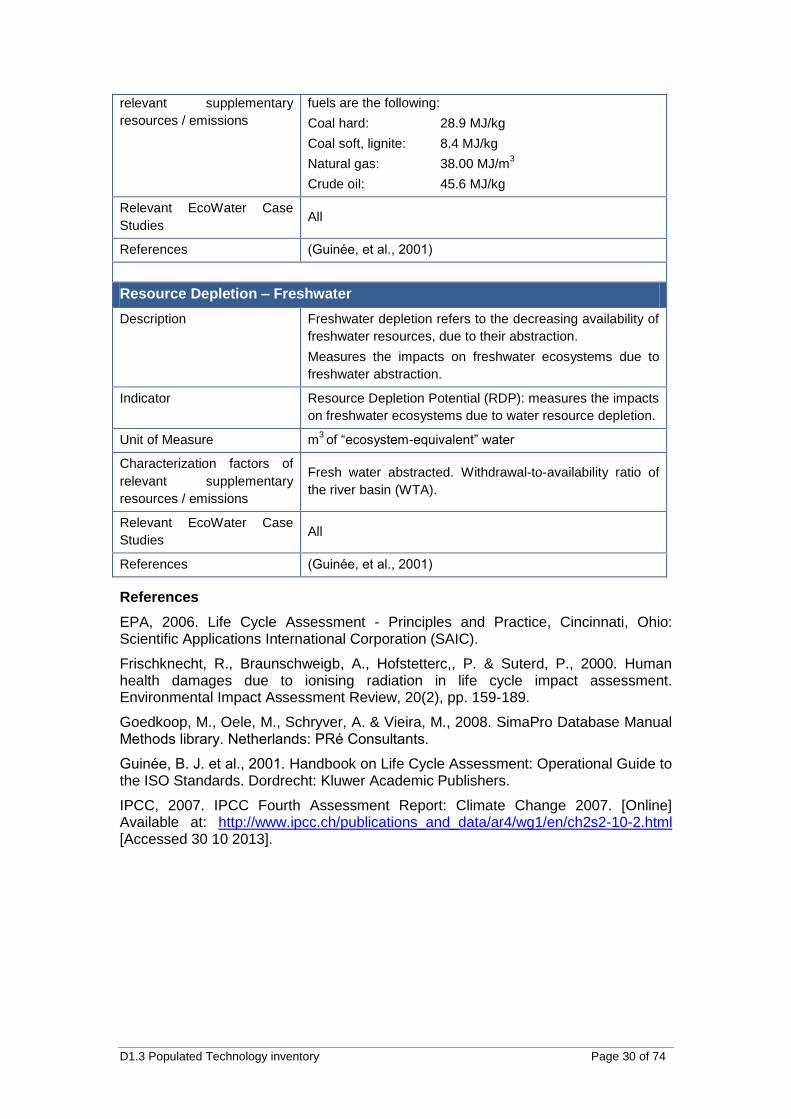
D1.3 Populated Technology inventory Page 30 of 74
relevant supplementary
resources / emissions
fuels are the following:
Coal hard: 28.9 MJ/kg
Coal soft, lignite: 8.4 MJ/kg
Natural gas: 38.00 MJ/m3
Crude oil: 45.6 MJ/kg
Relevant EcoWater Case
Studies All
References (Guinée, et al., 2001)
Resource Depletion – Freshwater
Description Freshwater depletion refers to the decreasing availability of
freshwater resources, due to their abstraction.
Measures the impacts on freshwater ecosystems due to
freshwater abstraction.
Indicator Resource Depletion Potential (RDP): measures the impacts
on freshwater ecosystems due to water resource depletion.
Unit of Measure m3 of “ecosystem-equivalent” water
Characterization factors of
relevant supplementary
resources / emissions
Fresh water abstracted. Withdrawal-to-availability ratio of
the river basin (WTA).
Relevant EcoWater Case
Studies All
References (Guinée, et al., 2001)
References
EPA, 2006. Life Cycle Assessment - Principles and Practice, Cincinnati, Ohio: Scientific Applications International Corporation (SAIC).
Frischknecht, R., Braunschweigb, A., Hofstetterc,, P. & Suterd, P., 2000. Human health damages due to ionising radiation in life cycle impact assessment. Environmental Impact Assessment Review, 20(2), pp. 159-189.
Goedkoop, M., Oele, M., Schryver, A. & Vieira, M., 2008. SimaPro Database Manual Methods library. Netherlands: PRé Consultants.
Guinée, B. J. et al., 2001. Handbook on Life Cycle Assessment: Operational Guide to the ISO Standards. Dordrecht: Kluwer Academic Publishers.
IPCC, 2007. IPCC Fourth Assessment Report: Climate Change 2007. [Online] Available at: http://www.ipcc.ch/publications_and_data/ar4/wg1/en/ch2s2-10-2.html [Accessed 30 10 2013].

D1.3 Populated Technology inventory Page 31 of 74
Annex III List of innovative technologies
This annex describes several innovative technologies, researched in the EcoWater
Case Study work.
D1.3 Populated Technology inventory Page 32 of 74
Techology Variable Speed Pump
Short Description
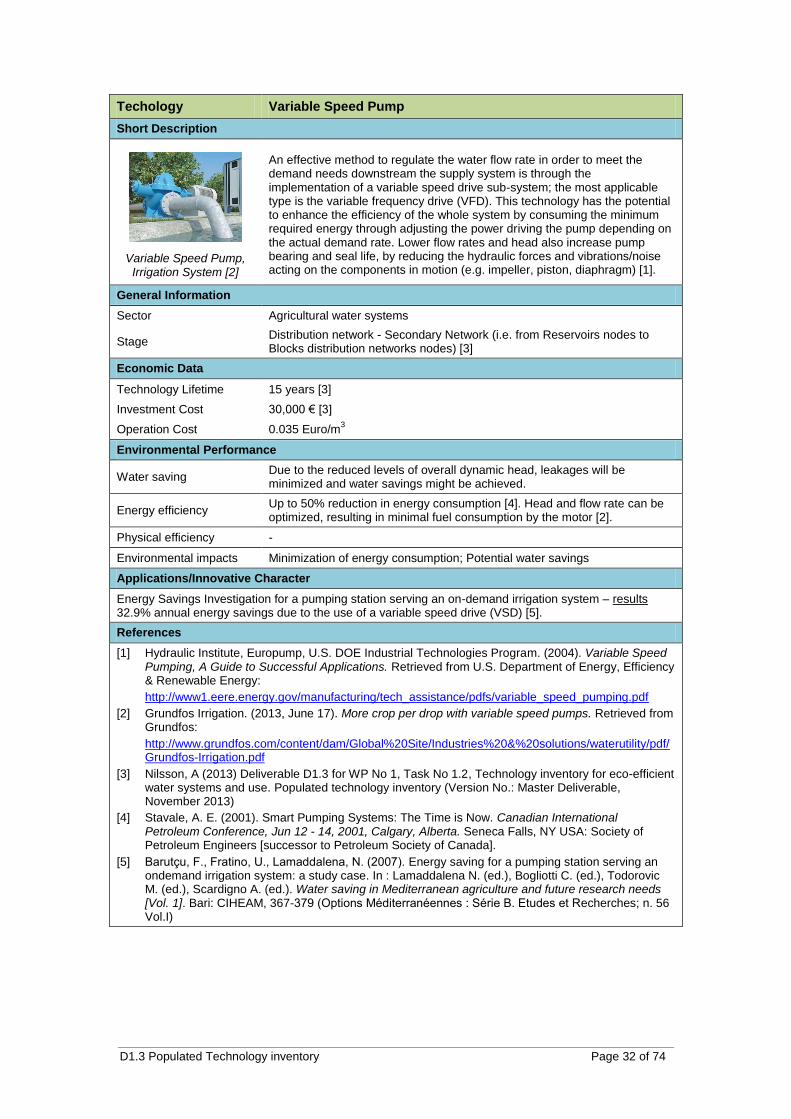
Variable Speed Pump, Irrigation System [2]
An effective method to regulate the water flow rate in order to meet the demand needs downstream the supply system is through the implementation of a variable speed drive sub-system; the most applicable type is the variable frequency drive (VFD). This technology has the potential to enhance the efficiency of the whole system by consuming the minimum required energy through adjusting the power driving the pump depending on the actual demand rate. Lower flow rates and head also increase pump bearing and seal life, by reducing the hydraulic forces and vibrations/noise acting on the components in motion (e.g. impeller, piston, diaphragm) [1].
General Information
Sector Agricultural water systems
Stage Distribution network - Secondary Network (i.e. from Reservoirs nodes to Blocks distribution networks nodes) [3]
Economic Data
Technology Lifetime 15 years [3]
Investment Cost 30,000 € [3]
Operation Cost 0.035 Euro/m3
Environmental Performance
Water saving Due to the reduced levels of overall dynamic head, leakages will be minimized and water savings might be achieved.
Energy efficiency Up to 50% reduction in energy consumption [4]. Head and flow rate can be optimized, resulting in minimal fuel consumption by the motor [2].
Physical efficiency -
Environmental impacts Minimization of energy consumption; Potential water savings
Applications/Innovative Character
Energy Savings Investigation for a pumping station serving an on-demand irrigation system – results 32.9% annual energy savings due to the use of a variable speed drive (VSD) [5].
References
[1] Hydraulic Institute, Europump, U.S. DOE Industrial Technologies Program. (2004). Variable Speed Pumping, A Guide to Successful Applications. Retrieved from U.S. Department of Energy, Efficiency & Renewable Energy:
http://www1.eere.energy.gov/manufacturing/tech_assistance/pdfs/variable_speed_pumping.pdf
[2] Grundfos Irrigation. (2013, June 17). More crop per drop with variable speed pumps. Retrieved from Grundfos:
http://www.grundfos.com/content/dam/Global%20Site/Industries%20&%20solutions/waterutility/pdf/Grundfos-Irrigation.pdf
[3] Nilsson, A (2013) Deliverable D1.3 for WP No 1, Task No 1.2, Technology inventory for eco-efficient water systems and use. Populated technology inventory (Version No.: Master Deliverable, November 2013)
[4] Stavale, A. E. (2001). Smart Pumping Systems: The Time is Now. Canadian International Petroleum Conference, Jun 12 - 14, 2001, Calgary, Alberta. Seneca Falls, NY USA: Society of Petroleum Engineers [successor to Petroleum Society of Canada].
[5] Barutçu, F., Fratino, U., Lamaddalena, N. (2007). Energy saving for a pumping station serving an ondemand irrigation system: a study case. In : Lamaddalena N. (ed.), Bogliotti C. (ed.), Todorovic M. (ed.), Scardigno A. (ed.). Water saving in Mediterranean agriculture and future research needs [Vol. 1]. Bari: CIHEAM, 367-379 (Options Méditerranéennes : Série B. Etudes et Recherches; n. 56 Vol.I)
D1.3 Populated Technology inventory Page 33 of 74
Technology Multi – User Electronic Delivery Hydrants
Short Description
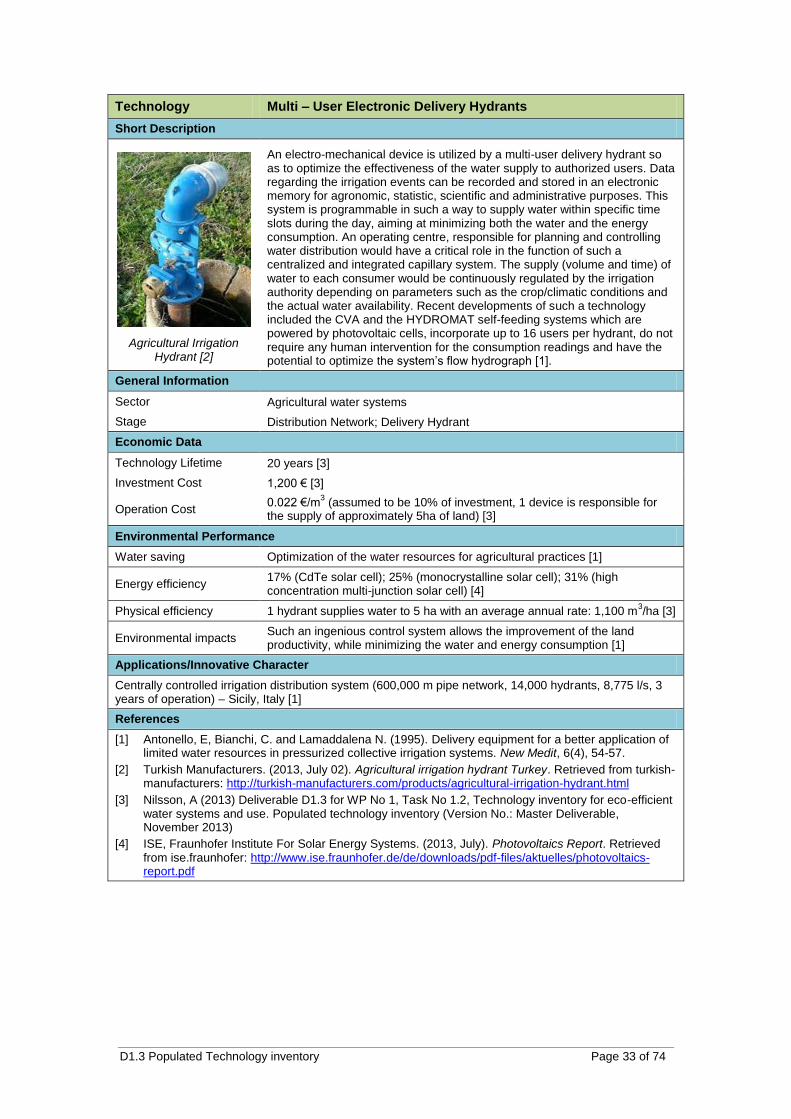
Agricultural Irrigation Hydrant [2]
An electro-mechanical device is utilized by a multi-user delivery hydrant so as to optimize the effectiveness of the water supply to authorized users. Data regarding the irrigation events can be recorded and stored in an electronic memory for agronomic, statistic, scientific and administrative purposes. This system is programmable in such a way to supply water within specific time slots during the day, aiming at minimizing both the water and the energy consumption. An operating centre, responsible for planning and controlling water distribution would have a critical role in the function of such a centralized and integrated capillary system. The supply (volume and time) of water to each consumer would be continuously regulated by the irrigation authority depending on parameters such as the crop/climatic conditions and the actual water availability. Recent developments of such a technology included the CVA and the HYDROMAT self-feeding systems which are powered by photovoltaic cells, incorporate up to 16 users per hydrant, do not require any human intervention for the consumption readings and have the potential to optimize the system’s flow hydrograph [1].
General Information
Sector Agricultural water systems
Stage Distribution Network; Delivery Hydrant
Economic Data
Technology Lifetime 20 years [3]
Investment Cost 1,200 € [3]
Operation Cost 0.022 €/m
3 (assumed to be 10% of investment, 1 device is responsible for
the supply of approximately 5ha of land) [3]
Environmental Performance
Water saving Optimization of the water resources for agricultural practices [1]
Energy efficiency 17% (CdTe solar cell); 25% (monocrystalline solar cell); 31% (high concentration multi-junction solar cell) [4]
Physical efficiency 1 hydrant supplies water to 5 ha with an average annual rate: 1,100 m3/ha [3]
Environmental impacts Such an ingenious control system allows the improvement of the land productivity, while minimizing the water and energy consumption [1]
Applications/Innovative Character
Centrally controlled irrigation distribution system (600,000 m pipe network, 14,000 hydrants, 8,775 l/s, 3 years of operation) – Sicily, Italy [1]
References
[1] Antonello, E, Bianchi, C. and Lamaddalena N. (1995). Delivery equipment for a better application of limited water resources in pressurized collective irrigation systems. New Medit, 6(4), 54-57.
[2] Turkish Manufacturers. (2013, July 02). Agricultural irrigation hydrant Turkey. Retrieved from turkish-manufacturers: http://turkish-manufacturers.com/products/agricultural-irrigation-hydrant.html
[3] Nilsson, A (2013) Deliverable D1.3 for WP No 1, Task No 1.2, Technology inventory for eco-efficient water systems and use. Populated technology inventory (Version No.: Master Deliverable, November 2013)
[4] ISE, Fraunhofer Institute For Solar Energy Systems. (2013, July). Photovoltaics Report. Retrieved from ise.fraunhofer: http://www.ise.fraunhofer.de/de/downloads/pdf-files/aktuelles/photovoltaics-report.pdf
D1.3 Populated Technology inventory Page 34 of 74
Technology On-Farm Devices for Precision Irrigation
Short Description
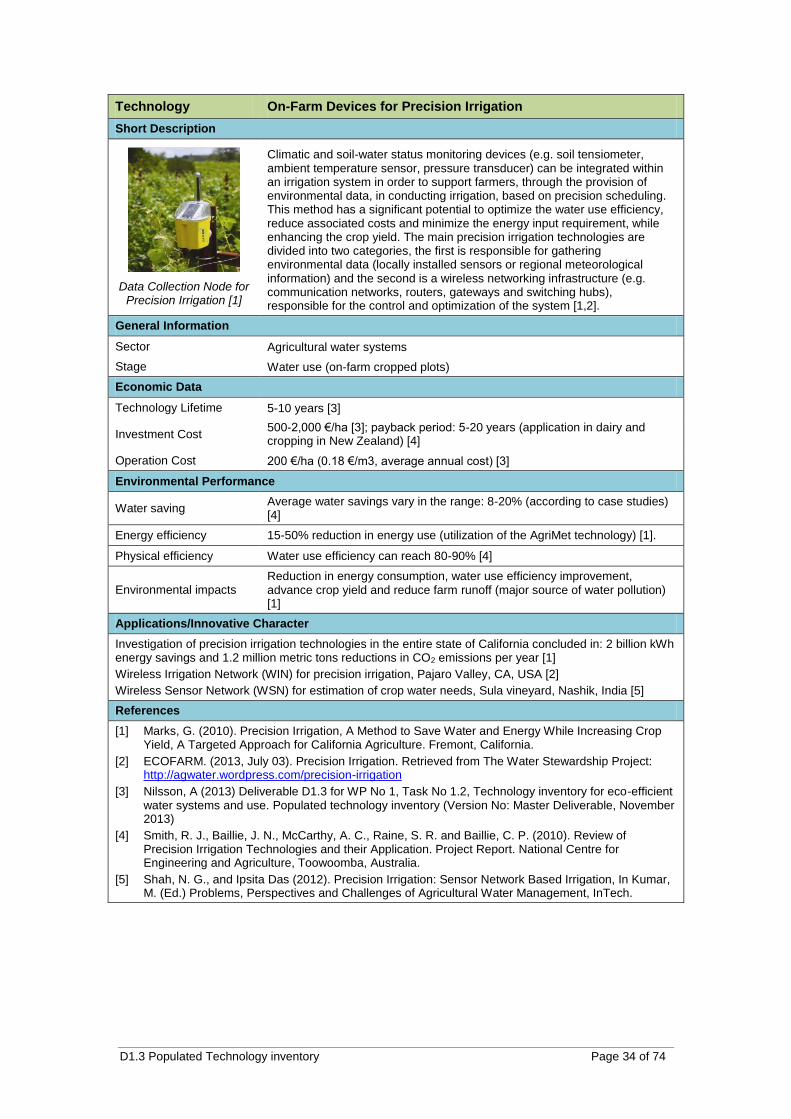
Data Collection Node for Precision Irrigation [1]
Climatic and soil-water status monitoring devices (e.g. soil tensiometer, ambient temperature sensor, pressure transducer) can be integrated within an irrigation system in order to support farmers, through the provision of environmental data, in conducting irrigation, based on precision scheduling. This method has a significant potential to optimize the water use efficiency, reduce associated costs and minimize the energy input requirement, while enhancing the crop yield. The main precision irrigation technologies are divided into two categories, the first is responsible for gathering environmental data (locally installed sensors or regional meteorological information) and the second is a wireless networking infrastructure (e.g. communication networks, routers, gateways and switching hubs), responsible for the control and optimization of the system [1,2].
General Information
Sector Agricultural water systems
Stage Water use (on-farm cropped plots)
Economic Data
Technology Lifetime 5-10 years [3]
Investment Cost 500-2,000 €/ha [3]; payback period: 5-20 years (application in dairy and cropping in New Zealand) [4]
Operation Cost 200 €/ha (0.18 €/m3, average annual cost) [3]
Environmental Performance
Water saving Average water savings vary in the range: 8-20% (according to case studies) [4]
Energy efficiency 15-50% reduction in energy use (utilization of the AgriMet technology) [1].
Physical efficiency Water use efficiency can reach 80-90% [4]
Environmental impacts Reduction in energy consumption, water use efficiency improvement, advance crop yield and reduce farm runoff (major source of water pollution) [1]
Applications/Innovative Character
Investigation of precision irrigation technologies in the entire state of California concluded in: 2 billion kWh energy savings and 1.2 million metric tons reductions in CO2 emissions per year [1]
Wireless Irrigation Network (WIN) for precision irrigation, Pajaro Valley, CA, USA [2]
Wireless Sensor Network (WSN) for estimation of crop water needs, Sula vineyard, Nashik, India [5]
References
[1] Marks, G. (2010). Precision Irrigation, A Method to Save Water and Energy While Increasing Crop Yield, A Targeted Approach for California Agriculture. Fremont, California.
[2] ECOFARM. (2013, July 03). Precision Irrigation. Retrieved from The Water Stewardship Project: http://agwater.wordpress.com/precision-irrigation
[3] Nilsson, A (2013) Deliverable D1.3 for WP No 1, Task No 1.2, Technology inventory for eco-efficient water systems and use. Populated technology inventory (Version No: Master Deliverable, November 2013)
[4] Smith, R. J., Baillie, J. N., McCarthy, A. C., Raine, S. R. and Baillie, C. P. (2010). Review of Precision Irrigation Technologies and their Application. Project Report. National Centre for Engineering and Agriculture, Toowoomba, Australia.
[5] Shah, N. G., and Ipsita Das (2012). Precision Irrigation: Sensor Network Based Irrigation, In Kumar, M. (Ed.) Problems, Perspectives and Challenges of Agricultural Water Management, InTech.
D1.3 Populated Technology inventory Page 35 of 74
Technology Sub-surface Drip Irrigation (SDI)
Short Description
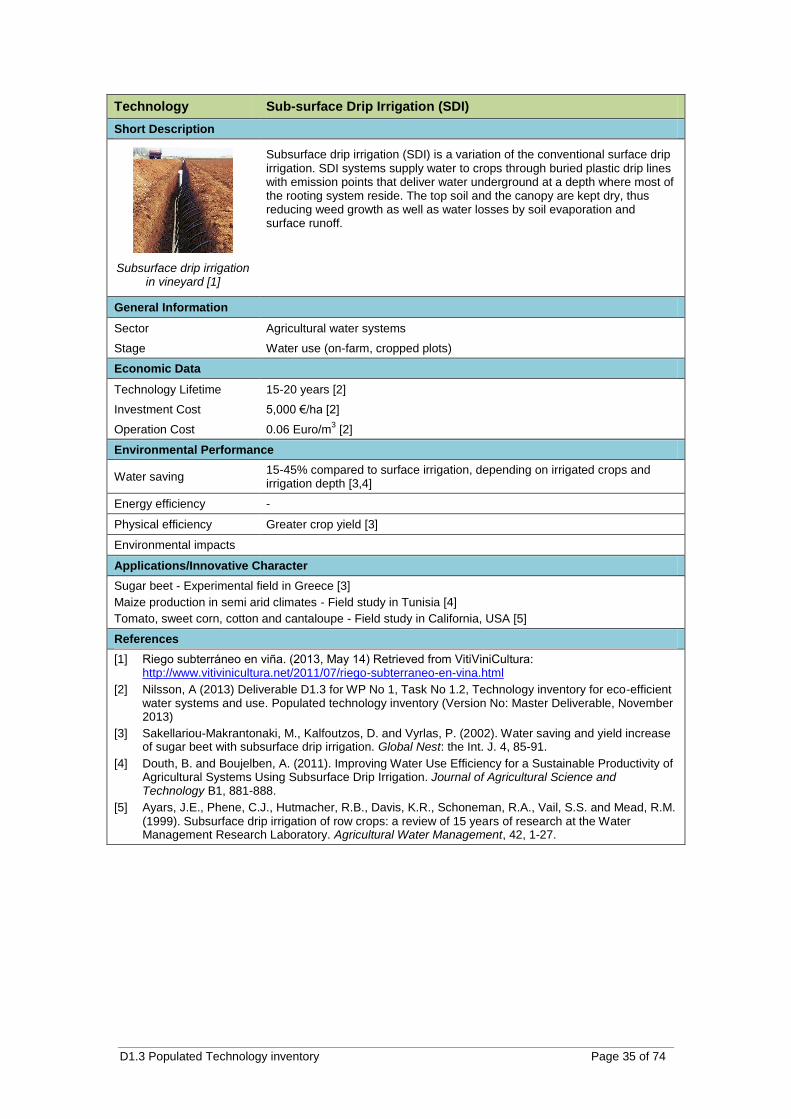
Subsurface drip irrigation in vineyard [1]
Subsurface drip irrigation (SDI) is a variation of the conventional surface drip irrigation. SDI systems supply water to crops through buried plastic drip lines with emission points that deliver water underground at a depth where most of the rooting system reside. The top soil and the canopy are kept dry, thus reducing weed growth as well as water losses by soil evaporation and surface runoff.
General Information
Sector Agricultural water systems
Stage Water use (on-farm, cropped plots)
Economic Data
Technology Lifetime 15-20 years [2]
Investment Cost 5,000 €/ha [2]
Operation Cost 0.06 Euro/m3 [2]
Environmental Performance
Water saving 15-45% compared to surface irrigation, depending on irrigated crops and irrigation depth [3,4]
Energy efficiency -
Physical efficiency Greater crop yield [3]
Environmental impacts
Applications/Innovative Character
Sugar beet - Experimental field in Greece [3]
Maize production in semi arid climates - Field study in Tunisia [4]
Tomato, sweet corn, cotton and cantaloupe - Field study in California, USA [5]
References
[1] Riego subterráneo en viña. (2013, May 14) Retrieved from VitiViniCultura: http://www.vitivinicultura.net/2011/07/riego-subterraneo-en-vina.html
[2] Nilsson, A (2013) Deliverable D1.3 for WP No 1, Task No 1.2, Technology inventory for eco-efficient water systems and use. Populated technology inventory (Version No: Master Deliverable, November 2013)
[3] Sakellariou-Makrantonaki, M., Kalfoutzos, D. and Vyrlas, P. (2002). Water saving and yield increase of sugar beet with subsurface drip irrigation. Global Nest: the Int. J. 4, 85-91.
[4] Douth, B. and Boujelben, A. (2011). Improving Water Use Efficiency for a Sustainable Productivity of Agricultural Systems Using Subsurface Drip Irrigation. Journal of Agricultural Science and Technology B1, 881-888.
[5] Ayars, J.E., Phene, C.J., Hutmacher, R.B., Davis, K.R., Schoneman, R.A., Vail, S.S. and Mead, R.M. (1999). Subsurface drip irrigation of row crops: a review of 15 years of research at the Water Management Research Laboratory. Agricultural Water Management, 42, 1-27.
D1.3 Populated Technology inventory Page 36 of 74
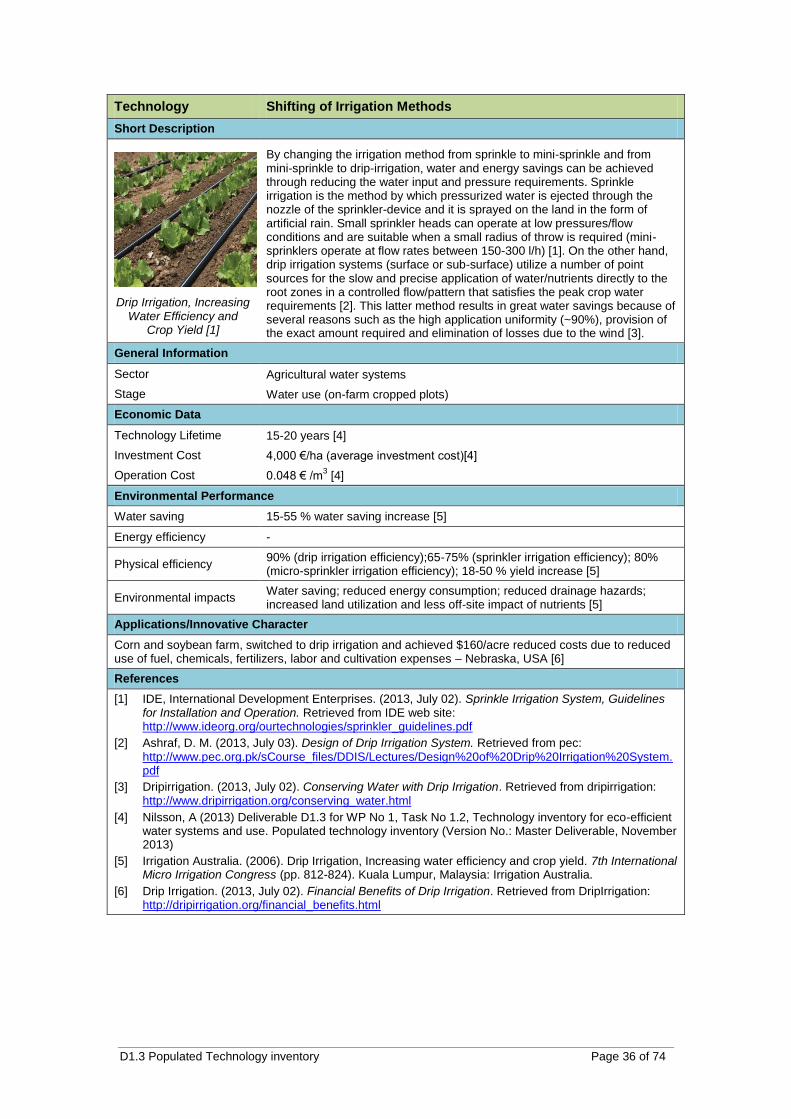
Technology Shifting of Irrigation Methods
Short Description
Drip Irrigation, Increasing Water Efficiency and
Crop Yield [1]
By changing the irrigation method from sprinkle to mini-sprinkle and from mini-sprinkle to drip-irrigation, water and energy savings can be achieved through reducing the water input and pressure requirements. Sprinkle irrigation is the method by which pressurized water is ejected through the nozzle of the sprinkler-device and it is sprayed on the land in the form of artificial rain. Small sprinkler heads can operate at low pressures/flow conditions and are suitable when a small radius of throw is required (mini-sprinklers operate at flow rates between 150-300 l/h) [1]. On the other hand, drip irrigation systems (surface or sub-surface) utilize a number of point sources for the slow and precise application of water/nutrients directly to the root zones in a controlled flow/pattern that satisfies the peak crop water requirements [2]. This latter method results in great water savings because of several reasons such as the high application uniformity (~90%), provision of the exact amount required and elimination of losses due to the wind [3].
General Information
Sector Agricultural water systems
Stage Water use (on-farm cropped plots)
Economic Data
Technology Lifetime 15-20 years [4]
Investment Cost 4,000 €/ha (average investment cost)[4]
Operation Cost 0.048 € /m3 [4]
Environmental Performance
Water saving 15-55 % water saving increase [5]
Energy efficiency -
Physical efficiency 90% (drip irrigation efficiency);65-75% (sprinkler irrigation efficiency); 80% (micro-sprinkler irrigation efficiency); 18-50 % yield increase [5]
Environmental impacts Water saving; reduced energy consumption; reduced drainage hazards; increased land utilization and less off-site impact of nutrients [5]
Applications/Innovative Character
Corn and soybean farm, switched to drip irrigation and achieved $160/acre reduced costs due to reduced use of fuel, chemicals, fertilizers, labor and cultivation expenses – Nebraska, USA [6]
References
[1] IDE, International Development Enterprises. (2013, July 02). Sprinkle Irrigation System, Guidelines for Installation and Operation. Retrieved from IDE web site: http://www.ideorg.org/ourtechnologies/sprinkler_guidelines.pdf
[2] Ashraf, D. M. (2013, July 03). Design of Drip Irrigation System. Retrieved from pec: http://www.pec.org.pk/sCourse_files/DDIS/Lectures/Design%20of%20Drip%20Irrigation%20System.pdf
[3] Dripirrigation. (2013, July 02). Conserving Water with Drip Irrigation. Retrieved from dripirrigation: http://www.dripirrigation.org/conserving_water.html
[4] Nilsson, A (2013) Deliverable D1.3 for WP No 1, Task No 1.2, Technology inventory for eco-efficient water systems and use. Populated technology inventory (Version No.: Master Deliverable, November 2013)
[5] Irrigation Australia. (2006). Drip Irrigation, Increasing water efficiency and crop yield. 7th International Micro Irrigation Congress (pp. 812-824). Kuala Lumpur, Malaysia: Irrigation Australia.
[6] Drip Irrigation. (2013, July 02). Financial Benefits of Drip Irrigation. Retrieved from DripIrrigation: http://dripirrigation.org/financial_benefits.html
D1.3 Populated Technology inventory Page 37 of 74
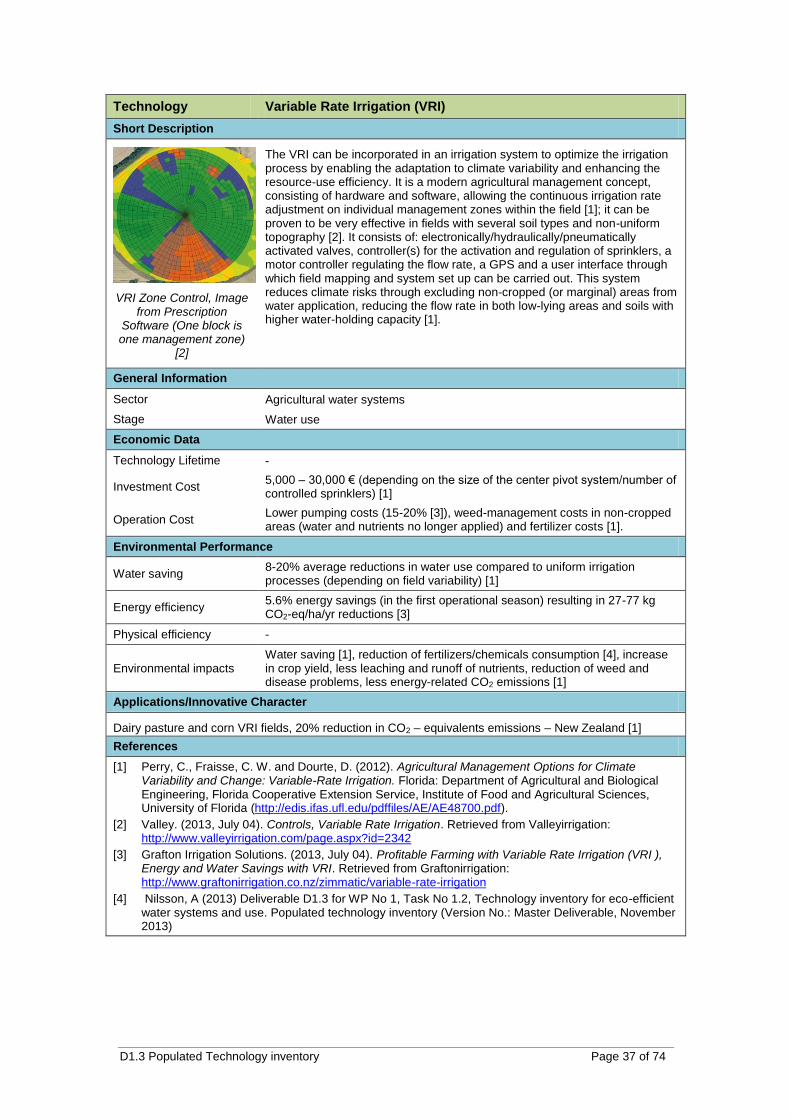
Technology Variable Rate Irrigation (VRI)
Short Description
VRI Zone Control, Image from Prescription
Software (One block is one management zone)
[2]
The VRI can be incorporated in an irrigation system to optimize the irrigation process by enabling the adaptation to climate variability and enhancing the resource-use efficiency. It is a modern agricultural management concept, consisting of hardware and software, allowing the continuous irrigation rate adjustment on individual management zones within the field [1]; it can be proven to be very effective in fields with several soil types and non-uniform topography [2]. It consists of: electronically/hydraulically/pneumatically activated valves, controller(s) for the activation and regulation of sprinklers, a motor controller regulating the flow rate, a GPS and a user interface through which field mapping and system set up can be carried out. This system reduces climate risks through excluding non-cropped (or marginal) areas from water application, reducing the flow rate in both low-lying areas and soils with higher water-holding capacity [1].
General Information
Sector Agricultural water systems
Stage Water use
Economic Data
Technology Lifetime -
Investment Cost 5,000 – 30,000 € (depending on the size of the center pivot system/number of controlled sprinklers) [1]
Operation Cost Lower pumping costs (15-20% [3]), weed-management costs in non-cropped areas (water and nutrients no longer applied) and fertilizer costs [1].
Environmental Performance
Water saving 8-20% average reductions in water use compared to uniform irrigation processes (depending on field variability) [1]
Energy efficiency 5.6% energy savings (in the first operational season) resulting in 27-77 kg CO2-eq/ha/yr reductions [3]
Physical efficiency -
Environmental impacts Water saving [1], reduction of fertilizers/chemicals consumption [4], increase in crop yield, less leaching and runoff of nutrients, reduction of weed and disease problems, less energy-related CO2 emissions [1]
Applications/Innovative Character
Dairy pasture and corn VRI fields, 20% reduction in CO2 – equivalents emissions – New Zealand [1]
References
[1] Perry, C., Fraisse, C. W. and Dourte, D. (2012). Agricultural Management Options for Climate Variability and Change: Variable-Rate Irrigation. Florida: Department of Agricultural and Biological Engineering, Florida Cooperative Extension Service, Institute of Food and Agricultural Sciences, University of Florida (http://edis.ifas.ufl.edu/pdffiles/AE/AE48700.pdf).
[2] Valley. (2013, July 04). Controls, Variable Rate Irrigation. Retrieved from Valleyirrigation: http://www.valleyirrigation.com/page.aspx?id=2342
[3] Grafton Irrigation Solutions. (2013, July 04). Profitable Farming with Variable Rate Irrigation (VRI ), Energy and Water Savings with VRI. Retrieved from Graftonirrigation: http://www.graftonirrigation.co.nz/zimmatic/variable-rate-irrigation
[4] Nilsson, A (2013) Deliverable D1.3 for WP No 1, Task No 1.2, Technology inventory for eco-efficient water systems and use. Populated technology inventory (Version No.: Master Deliverable, November 2013)
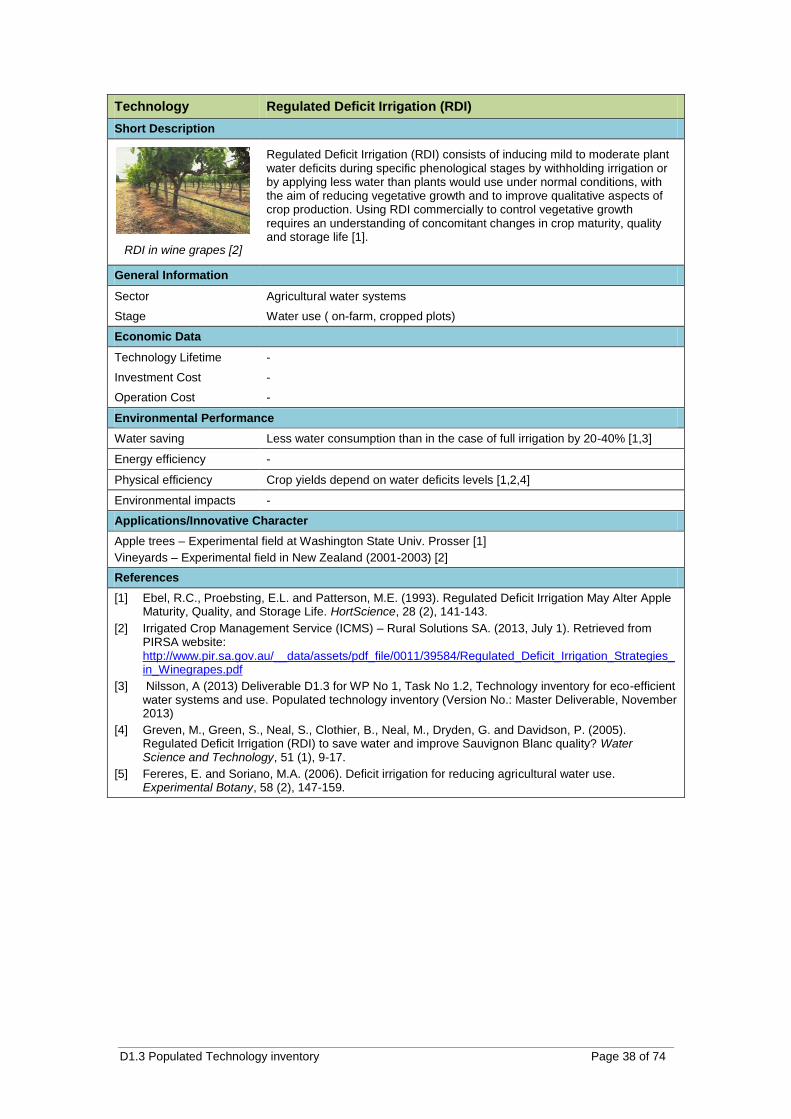
D1.3 Populated Technology inventory Page 38 of 74
Technology Regulated Deficit Irrigation (RDI)
Short Description
RDI in wine grapes [2]
Regulated Deficit Irrigation (RDI) consists of inducing mild to moderate plant water deficits during specific phenological stages by withholding irrigation or by applying less water than plants would use under normal conditions, with the aim of reducing vegetative growth and to improve qualitative aspects of crop production. Using RDI commercially to control vegetative growth requires an understanding of concomitant changes in crop maturity, quality and storage life [1].
General Information
Sector Agricultural water systems
Stage Water use ( on-farm, cropped plots)
Economic Data
Technology Lifetime -
Investment Cost -
Operation Cost -
Environmental Performance
Water saving Less water consumption than in the case of full irrigation by 20-40% [1,3]
Energy efficiency -
Physical efficiency Crop yields depend on water deficits levels [1,2,4]
Environmental impacts -
Applications/Innovative Character
Apple trees – Experimental field at Washington State Univ. Prosser [1]
Vineyards – Experimental field in New Zealand (2001-2003) [2]
References
[1] Ebel, R.C., Proebsting, E.L. and Patterson, M.E. (1993). Regulated Deficit Irrigation May Alter Apple Maturity, Quality, and Storage Life. HortScience, 28 (2), 141-143.
[2] Irrigated Crop Management Service (ICMS) – Rural Solutions SA. (2013, July 1). Retrieved from PIRSA website: http://www.pir.sa.gov.au/__data/assets/pdf_file/0011/39584/Regulated_Deficit_Irrigation_Strategies_in_Winegrapes.pdf
[3] Nilsson, A (2013) Deliverable D1.3 for WP No 1, Task No 1.2, Technology inventory for eco-efficient water systems and use. Populated technology inventory (Version No.: Master Deliverable, November 2013)
[4] Greven, M., Green, S., Neal, S., Clothier, B., Neal, M., Dryden, G. and Davidson, P. (2005). Regulated Deficit Irrigation (RDI) to save water and improve Sauvignon Blanc quality? Water Science and Technology, 51 (1), 9-17.
[5] Fereres, E. and Soriano, M.A. (2006). Deficit irrigation for reducing agricultural water use. Experimental Botany, 58 (2), 147-159.
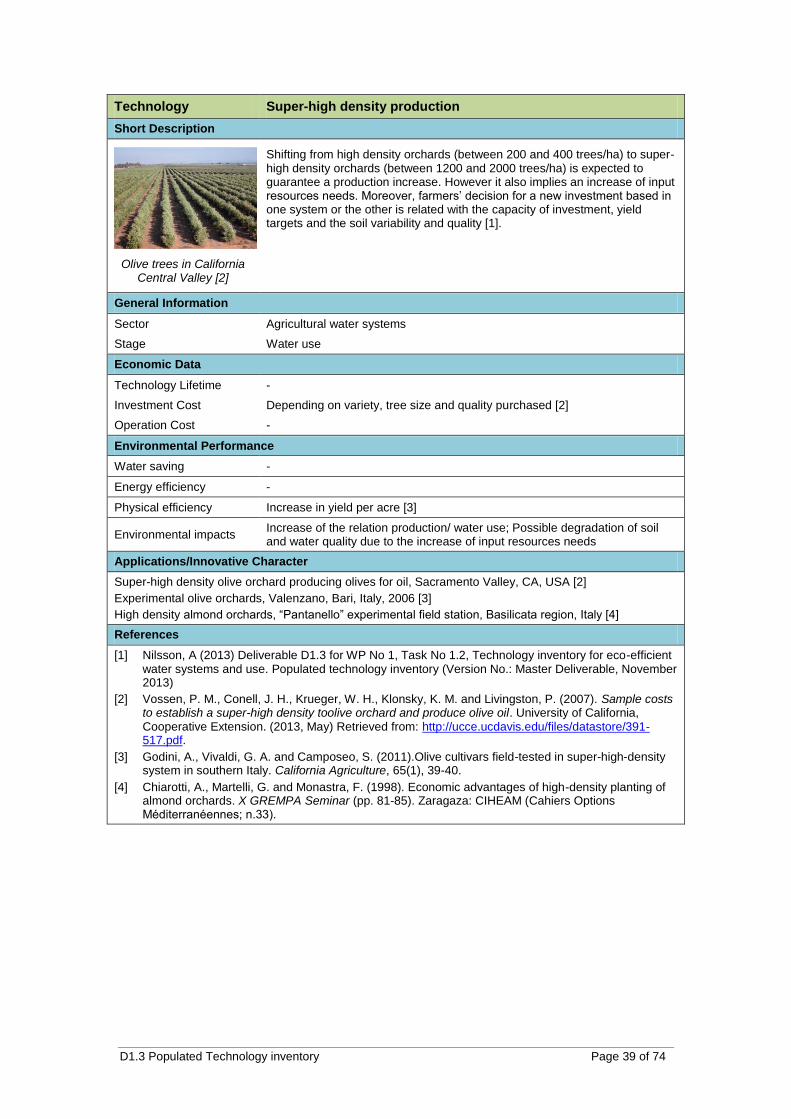
D1.3 Populated Technology inventory Page 39 of 74
Technology Super-high density production
Short Description
Olive trees in California Central Valley [2]
Shifting from high density orchards (between 200 and 400 trees/ha) to super-high density orchards (between 1200 and 2000 trees/ha) is expected to guarantee a production increase. However it also implies an increase of input resources needs. Moreover, farmers’ decision for a new investment based in one system or the other is related with the capacity of investment, yield targets and the soil variability and quality [1].
General Information
Sector Agricultural water systems
Stage Water use
Economic Data
Technology Lifetime -
Investment Cost Depending on variety, tree size and quality purchased [2]
Operation Cost -
Environmental Performance
Water saving -
Energy efficiency -
Physical efficiency Increase in yield per acre [3]
Environmental impacts Increase of the relation production/ water use; Possible degradation of soil and water quality due to the increase of input resources needs
Applications/Innovative Character
Super-high density olive orchard producing olives for oil, Sacramento Valley, CA, USA [2]
Experimental olive orchards, Valenzano, Bari, Italy, 2006 [3]
High density almond orchards, “Pantanello” experimental field station, Basilicata region, Italy [4]
References
[1] Nilsson, A (2013) Deliverable D1.3 for WP No 1, Task No 1.2, Technology inventory for eco-efficient water systems and use. Populated technology inventory (Version No.: Master Deliverable, November 2013)
[2] Vossen, P. M., Conell, J. H., Krueger, W. H., Klonsky, K. M. and Livingston, P. (2007). Sample costs to establish a super-high density toolive orchard and produce olive oil. University of California, Cooperative Extension. (2013, May) Retrieved from: http://ucce.ucdavis.edu/files/datastore/391-517.pdf.
[3] Godini, A., Vivaldi, G. A. and Camposeo, S. (2011).Olive cultivars field-tested in super-high-density system in southern Italy. California Agriculture, 65(1), 39-40.
[4] Chiarotti, A., Martelli, G. and Monastra, F. (1998). Economic advantages of high-density planting of almond orchards. X GREMPA Seminar (pp. 81-85). Zaragaza: CIHEAM (Cahiers Options Méditerranéennes; n.33).
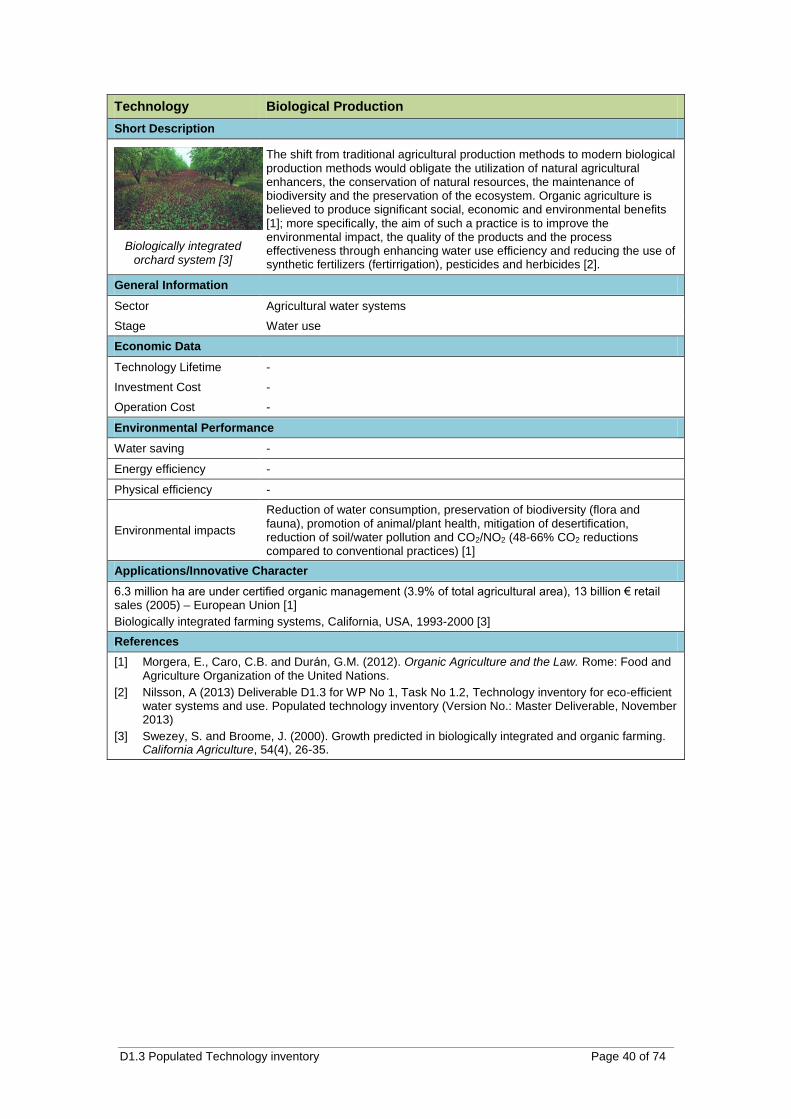
D1.3 Populated Technology inventory Page 40 of 74
Technology Biological Production
Short Description
Biologically integrated orchard system [3]
The shift from traditional agricultural production methods to modern biological production methods would obligate the utilization of natural agricultural enhancers, the conservation of natural resources, the maintenance of biodiversity and the preservation of the ecosystem. Organic agriculture is believed to produce significant social, economic and environmental benefits [1]; more specifically, the aim of such a practice is to improve the environmental impact, the quality of the products and the process effectiveness through enhancing water use efficiency and reducing the use of synthetic fertilizers (fertirrigation), pesticides and herbicides [2].
General Information
Sector Agricultural water systems
Stage Water use
Economic Data
Technology Lifetime -
Investment Cost -
Operation Cost -
Environmental Performance
Water saving -
Energy efficiency -
Physical efficiency -
Environmental impacts
Reduction of water consumption, preservation of biodiversity (flora and fauna), promotion of animal/plant health, mitigation of desertification, reduction of soil/water pollution and CO2/NO2 (48-66% CO2 reductions compared to conventional practices) [1]
Applications/Innovative Character
6.3 million ha are under certified organic management (3.9% of total agricultural area), 13 billion € retail sales (2005) – European Union [1]
Biologically integrated farming systems, California, USA, 1993-2000 [3]
References
[1] Morgera, E., Caro, C.B. and Durán, G.M. (2012). Organic Agriculture and the Law. Rome: Food and Agriculture Organization of the United Nations.
[2] Nilsson, A (2013) Deliverable D1.3 for WP No 1, Task No 1.2, Technology inventory for eco-efficient water systems and use. Populated technology inventory (Version No.: Master Deliverable, November 2013)
[3] Swezey, S. and Broome, J. (2000). Growth predicted in biologically integrated and organic farming. California Agriculture, 54(4), 26-35.
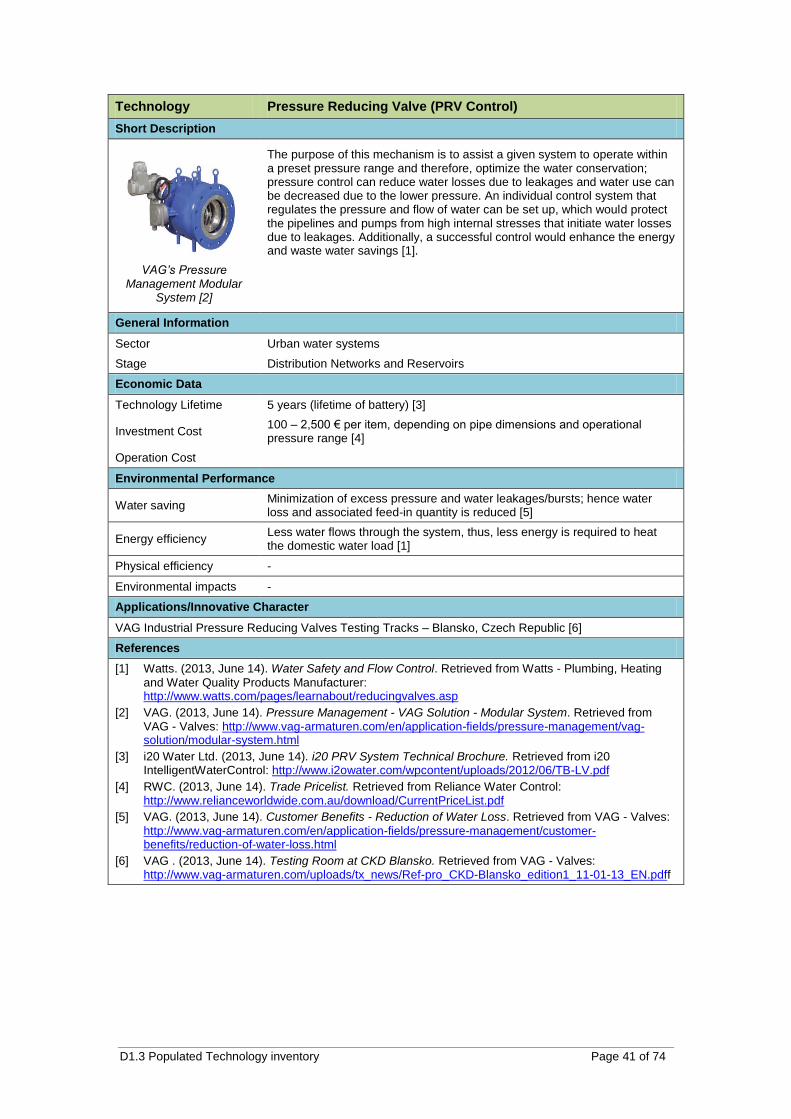
D1.3 Populated Technology inventory Page 41 of 74
Technology Pressure Reducing Valve (PRV Control)
Short Description
VAG’s Pressure Management Modular
System [2]
The purpose of this mechanism is to assist a given system to operate within a preset pressure range and therefore, optimize the water conservation; pressure control can reduce water losses due to leakages and water use can be decreased due to the lower pressure. An individual control system that regulates the pressure and flow of water can be set up, which would protect the pipelines and pumps from high internal stresses that initiate water losses due to leakages. Additionally, a successful control would enhance the energy and waste water savings [1].
General Information
Sector Urban water systems
Stage Distribution Networks and Reservoirs
Economic Data
Technology Lifetime 5 years (lifetime of battery) [3]
Investment Cost 100 – 2,500 € per item, depending on pipe dimensions and operational pressure range [4]
Operation Cost
Environmental Performance
Water saving Minimization of excess pressure and water leakages/bursts; hence water loss and associated feed-in quantity is reduced [5]
Energy efficiency Less water flows through the system, thus, less energy is required to heat the domestic water load [1]
Physical efficiency -
Environmental impacts -
Applications/Innovative Character
VAG Industrial Pressure Reducing Valves Testing Tracks – Blansko, Czech Republic [6]
References
[1] Watts. (2013, June 14). Water Safety and Flow Control. Retrieved from Watts - Plumbing, Heating
and Water Quality Products Manufacturer: http://www.watts.com/pages/learnabout/reducingvalves.asp
[2] VAG. (2013, June 14). Pressure Management - VAG Solution - Modular System. Retrieved from VAG - Valves: http://www.vag-armaturen.com/en/application-fields/pressure-management/vag-solution/modular-system.html
[3] i20 Water Ltd. (2013, June 14). i20 PRV System Technical Brochure. Retrieved from i20 IntelligentWaterControl: http://www.i2owater.com/wpcontent/uploads/2012/06/TB-LV.pdf
[4] RWC. (2013, June 14). Trade Pricelist. Retrieved from Reliance Water Control: http://www.relianceworldwide.com.au/download/CurrentPriceList.pdf
[5] VAG. (2013, June 14). Customer Benefits - Reduction of Water Loss. Retrieved from VAG - Valves:
http://www.vag-armaturen.com/en/application-fields/pressure-management/customer-benefits/reduction-of-water-loss.html
[6] VAG . (2013, June 14). Testing Room at CKD Blansko. Retrieved from VAG - Valves: http://www.vag-armaturen.com/uploads/tx_news/Ref-pro_CKD-Blansko_edition1_11-01-13_EN.pdff
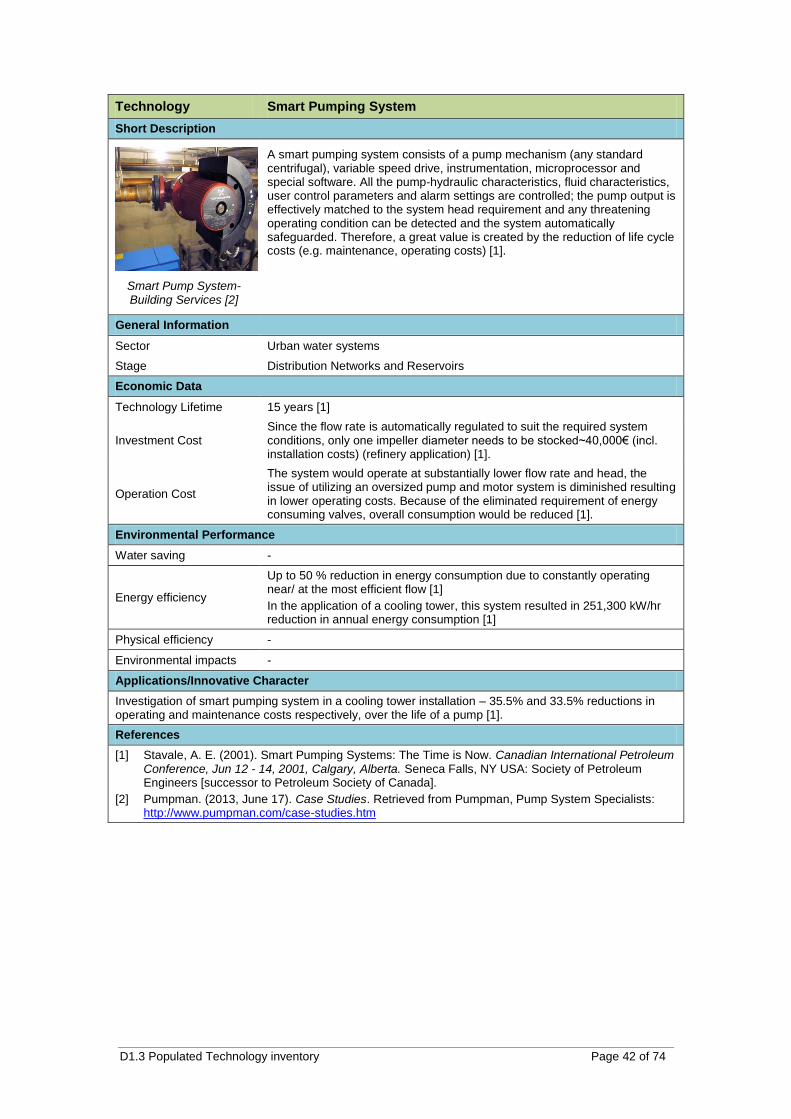
D1.3 Populated Technology inventory Page 42 of 74
Technology Smart Pumping System
Short Description
Smart Pump System-Building Services [2]
A smart pumping system consists of a pump mechanism (any standard centrifugal), variable speed drive, instrumentation, microprocessor and special software. All the pump-hydraulic characteristics, fluid characteristics, user control parameters and alarm settings are controlled; the pump output is effectively matched to the system head requirement and any threatening operating condition can be detected and the system automatically safeguarded. Therefore, a great value is created by the reduction of life cycle costs (e.g. maintenance, operating costs) [1].
General Information
Sector Urban water systems
Stage Distribution Networks and Reservoirs
Economic Data
Technology Lifetime 15 years [1]
Investment Cost Since the flow rate is automatically regulated to suit the required system conditions, only one impeller diameter needs to be stocked~40,000€ (incl. installation costs) (refinery application) [1].
Operation Cost
The system would operate at substantially lower flow rate and head, the issue of utilizing an oversized pump and motor system is diminished resulting in lower operating costs. Because of the eliminated requirement of energy consuming valves, overall consumption would be reduced [1].
Environmental Performance
Water saving -
Energy efficiency
Up to 50 % reduction in energy consumption due to constantly operating near/ at the most efficient flow [1]
In the application of a cooling tower, this system resulted in 251,300 kW/hr reduction in annual energy consumption [1]
Physical efficiency -
Environmental impacts -
Applications/Innovative Character
Investigation of smart pumping system in a cooling tower installation – 35.5% and 33.5% reductions in operating and maintenance costs respectively, over the life of a pump [1].
References
[1] Stavale, A. E. (2001). Smart Pumping Systems: The Time is Now. Canadian International Petroleum Conference, Jun 12 - 14, 2001, Calgary, Alberta. Seneca Falls, NY USA: Society of Petroleum Engineers [successor to Petroleum Society of Canada].
[2] Pumpman. (2013, June 17). Case Studies. Retrieved from Pumpman, Pump System Specialists: http://www.pumpman.com/case-studies.htm
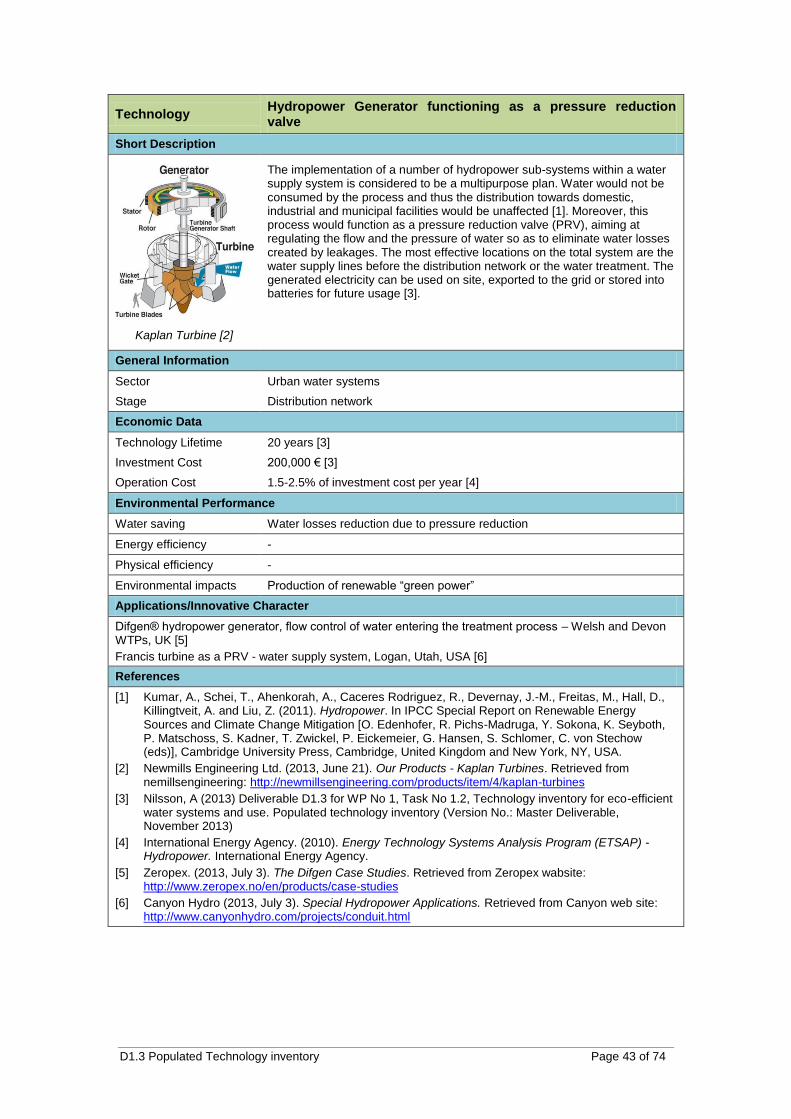
D1.3 Populated Technology inventory Page 43 of 74
Technology Hydropower Generator functioning as a pressure reduction valve
Short Description
Kaplan Turbine [2]
The implementation of a number of hydropower sub-systems within a water supply system is considered to be a multipurpose plan. Water would not be consumed by the process and thus the distribution towards domestic, industrial and municipal facilities would be unaffected [1]. Moreover, this process would function as a pressure reduction valve (PRV), aiming at regulating the flow and the pressure of water so as to eliminate water losses created by leakages. The most effective locations on the total system are the water supply lines before the distribution network or the water treatment. The generated electricity can be used on site, exported to the grid or stored into batteries for future usage [3].
General Information
Sector Urban water systems
Stage Distribution network
Economic Data
Technology Lifetime 20 years [3]
Investment Cost 200,000 € [3]
Operation Cost 1.5-2.5% of investment cost per year [4]
Environmental Performance
Water saving Water losses reduction due to pressure reduction
Energy efficiency -
Physical efficiency -
Environmental impacts Production of renewable “green power”
Applications/Innovative Character
Difgen® hydropower generator, flow control of water entering the treatment process – Welsh and Devon WTPs, UK [5]
Francis turbine as a PRV - water supply system, Logan, Utah, USA [6]
References
[1] Kumar, A., Schei, T., Ahenkorah, A., Caceres Rodriguez, R., Devernay, J.-M., Freitas, M., Hall, D., Killingtveit, A. and Liu, Z. (2011). Hydropower. In IPCC Special Report on Renewable Energy Sources and Climate Change Mitigation [O. Edenhofer, R. Pichs-Madruga, Y. Sokona, K. Seyboth, P. Matschoss, S. Kadner, T. Zwickel, P. Eickemeier, G. Hansen, S. Schlomer, C. von Stechow (eds)], Cambridge University Press, Cambridge, United Kingdom and New York, NY, USA.
[2] Newmills Engineering Ltd. (2013, June 21). Our Products - Kaplan Turbines. Retrieved from nemillsengineering: http://newmillsengineering.com/products/item/4/kaplan-turbines
[3] Nilsson, A (2013) Deliverable D1.3 for WP No 1, Task No 1.2, Technology inventory for eco-efficient water systems and use. Populated technology inventory (Version No.: Master Deliverable, November 2013)
[4] International Energy Agency. (2010). Energy Technology Systems Analysis Program (ETSAP) - Hydropower. International Energy Agency.
[5] Zeropex. (2013, July 3). The Difgen Case Studies. Retrieved from Zeropex wabsite: http://www.zeropex.no/en/products/case-studies
[6] Canyon Hydro (2013, July 3). Special Hydropower Applications. Retrieved from Canyon web site: http://www.canyonhydro.com/projects/conduit.html
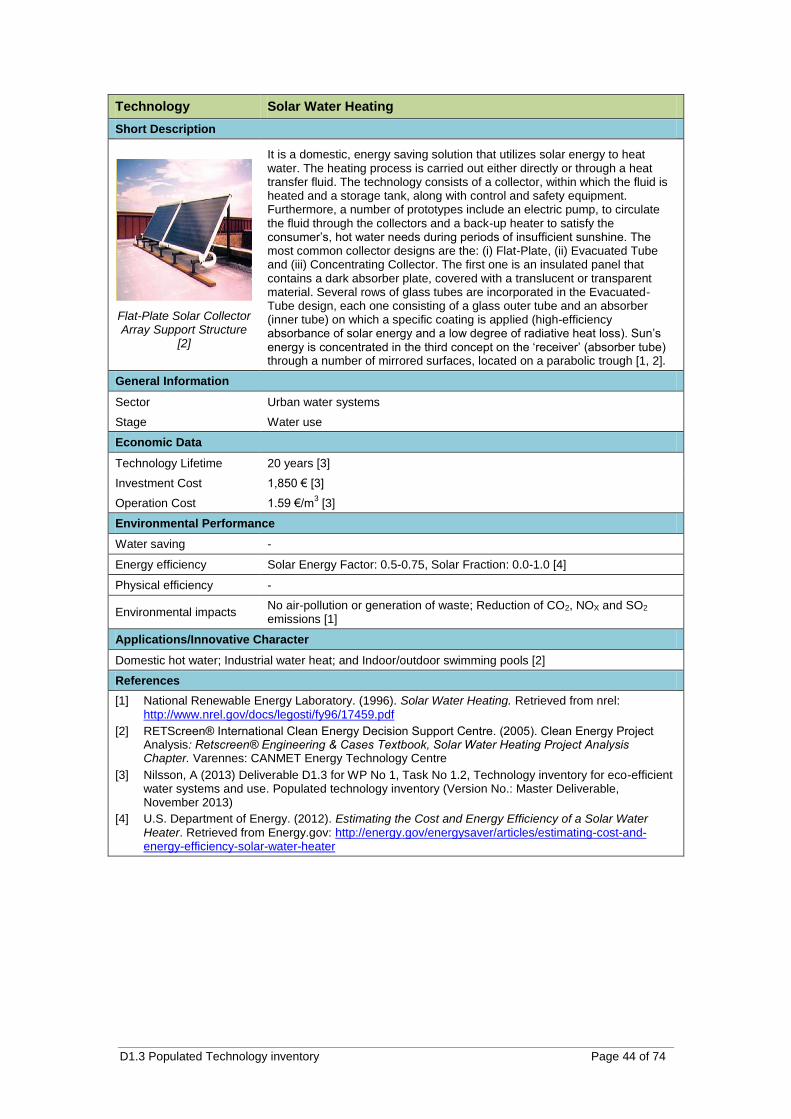
D1.3 Populated Technology inventory Page 44 of 74
Technology Solar Water Heating
Short Description
Flat-Plate Solar Collector Array Support Structure
[2]
It is a domestic, energy saving solution that utilizes solar energy to heat water. The heating process is carried out either directly or through a heat transfer fluid. The technology consists of a collector, within which the fluid is heated and a storage tank, along with control and safety equipment. Furthermore, a number of prototypes include an electric pump, to circulate the fluid through the collectors and a back-up heater to satisfy the consumer’s, hot water needs during periods of insufficient sunshine. The most common collector designs are the: (i) Flat-Plate, (ii) Evacuated Tube and (iii) Concentrating Collector. The first one is an insulated panel that contains a dark absorber plate, covered with a translucent or transparent material. Several rows of glass tubes are incorporated in the Evacuated-Tube design, each one consisting of a glass outer tube and an absorber (inner tube) on which a specific coating is applied (high-efficiency absorbance of solar energy and a low degree of radiative heat loss). Sun’s energy is concentrated in the third concept on the ‘receiver’ (absorber tube) through a number of mirrored surfaces, located on a parabolic trough [1, 2].
General Information
Sector Urban water systems
Stage Water use
Economic Data
Technology Lifetime 20 years [3]
Investment Cost 1,850 € [3]
Operation Cost 1.59 €/m3 [3]
Environmental Performance
Water saving -
Energy efficiency Solar Energy Factor: 0.5-0.75, Solar Fraction: 0.0-1.0 [4]
Physical efficiency -
Environmental impacts No air-pollution or generation of waste; Reduction of CO2, NOX and SO2 emissions [1]
Applications/Innovative Character
Domestic hot water; Industrial water heat; and Indoor/outdoor swimming pools [2]
References
[1] National Renewable Energy Laboratory. (1996). Solar Water Heating. Retrieved from nrel: http://www.nrel.gov/docs/legosti/fy96/17459.pdf
[2] RETScreen® International Clean Energy Decision Support Centre. (2005). Clean Energy Project Analysis: Retscreen® Engineering & Cases Textbook, Solar Water Heating Project Analysis Chapter. Varennes: CANMET Energy Technology Centre
[3] Nilsson, A (2013) Deliverable D1.3 for WP No 1, Task No 1.2, Technology inventory for eco-efficient water systems and use. Populated technology inventory (Version No.: Master Deliverable, November 2013)
[4] U.S. Department of Energy. (2012). Estimating the Cost and Energy Efficiency of a Solar Water Heater. Retrieved from Energy.gov: http://energy.gov/energysaver/articles/estimating-cost-and-energy-efficiency-solar-water-heater
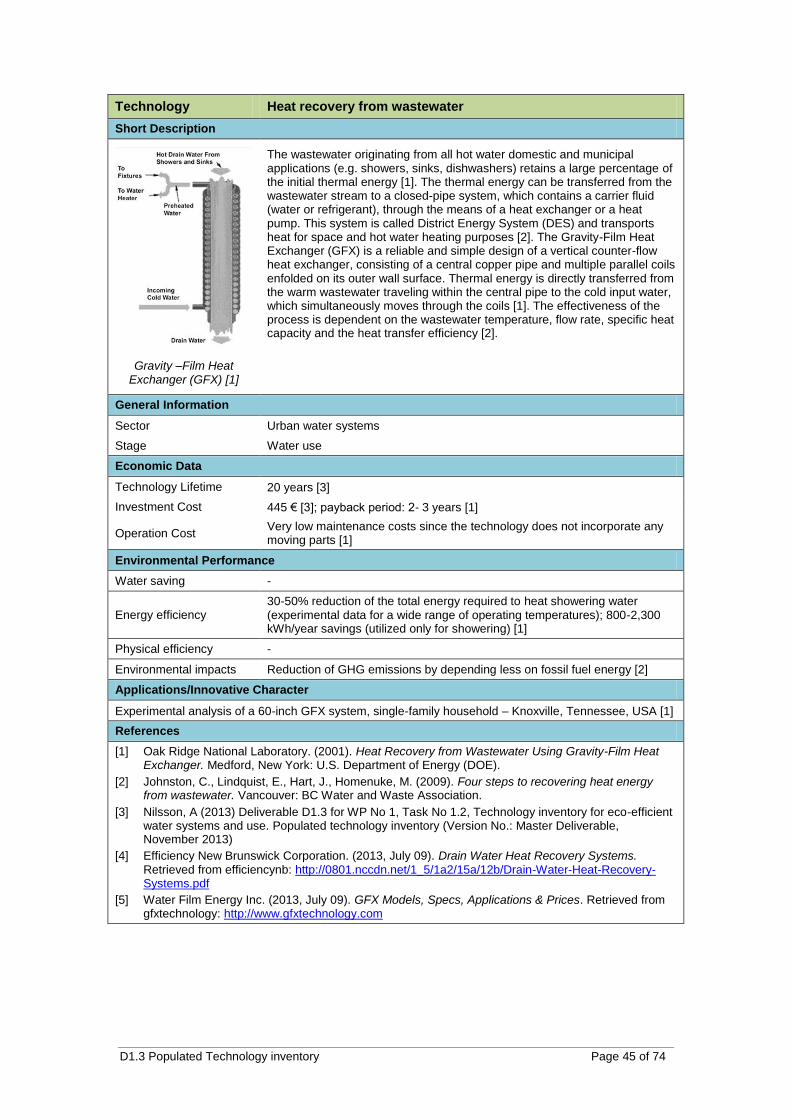
D1.3 Populated Technology inventory Page 45 of 74
Technology Heat recovery from wastewater
Short Description
Gravity –Film Heat Exchanger (GFX) [1]
The wastewater originating from all hot water domestic and municipal applications (e.g. showers, sinks, dishwashers) retains a large percentage of the initial thermal energy [1]. The thermal energy can be transferred from the wastewater stream to a closed-pipe system, which contains a carrier fluid (water or refrigerant), through the means of a heat exchanger or a heat pump. This system is called District Energy System (DES) and transports heat for space and hot water heating purposes [2]. The Gravity-Film Heat Exchanger (GFX) is a reliable and simple design of a vertical counter-flow heat exchanger, consisting of a central copper pipe and multiple parallel coils enfolded on its outer wall surface. Thermal energy is directly transferred from the warm wastewater traveling within the central pipe to the cold input water, which simultaneously moves through the coils [1]. The effectiveness of the process is dependent on the wastewater temperature, flow rate, specific heat capacity and the heat transfer efficiency [2].
General Information
Sector Urban water systems
Stage Water use
Economic Data
Technology Lifetime 20 years [3]
Investment Cost 445 € [3]; payback period: 2- 3 years [1]
Operation Cost Very low maintenance costs since the technology does not incorporate any moving parts [1]
Environmental Performance
Water saving -
Energy efficiency 30-50% reduction of the total energy required to heat showering water (experimental data for a wide range of operating temperatures); 800-2,300 kWh/year savings (utilized only for showering) [1]
Physical efficiency -
Environmental impacts Reduction of GHG emissions by depending less on fossil fuel energy [2]
Applications/Innovative Character
Experimental analysis of a 60-inch GFX system, single-family household – Knoxville, Tennessee, USA [1]
References
[1] Oak Ridge National Laboratory. (2001). Heat Recovery from Wastewater Using Gravity-Film Heat Exchanger. Medford, New York: U.S. Department of Energy (DOE).
[2] Johnston, C., Lindquist, E., Hart, J., Homenuke, M. (2009). Four steps to recovering heat energy from wastewater. Vancouver: BC Water and Waste Association.
[3] Nilsson, A (2013) Deliverable D1.3 for WP No 1, Task No 1.2, Technology inventory for eco-efficient water systems and use. Populated technology inventory (Version No.: Master Deliverable, November 2013)
[4] Efficiency New Brunswick Corporation. (2013, July 09). Drain Water Heat Recovery Systems. Retrieved from efficiencynb: http://0801.nccdn.net/1_5/1a2/15a/12b/Drain-Water-Heat-Recovery-Systems.pdf
[5] Water Film Energy Inc. (2013, July 09). GFX Models, Specs, Applications & Prices. Retrieved from gfxtechnology: http://www.gfxtechnology.com
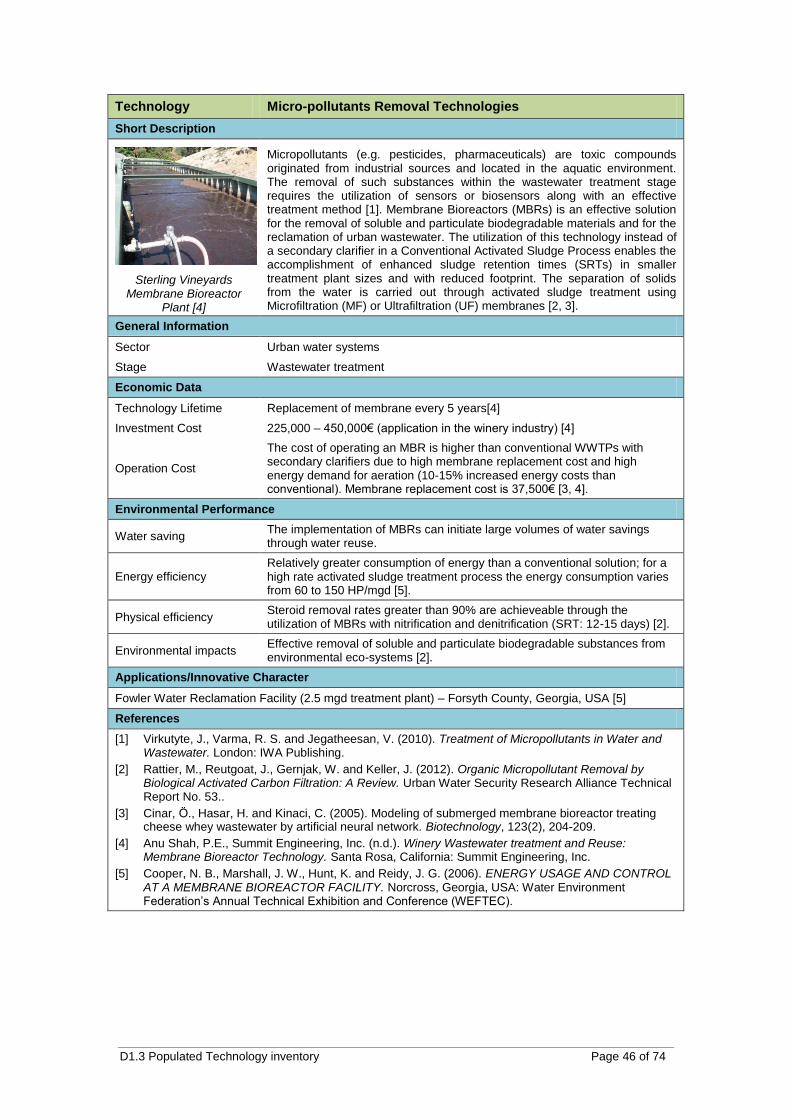
D1.3 Populated Technology inventory Page 46 of 74
Technology Micro-pollutants Removal Technologies
Short Description
Sterling Vineyards Membrane Bioreactor
Plant [4]
Micropollutants (e.g. pesticides, pharmaceuticals) are toxic compounds originated from industrial sources and located in the aquatic environment. The removal of such substances within the wastewater treatment stage requires the utilization of sensors or biosensors along with an effective treatment method [1]. Membrane Bioreactors (MBRs) is an effective solution for the removal of soluble and particulate biodegradable materials and for the reclamation of urban wastewater. The utilization of this technology instead of a secondary clarifier in a Conventional Activated Sludge Process enables the accomplishment of enhanced sludge retention times (SRTs) in smaller treatment plant sizes and with reduced footprint. The separation of solids from the water is carried out through activated sludge treatment using Microfiltration (MF) or Ultrafiltration (UF) membranes [2, 3].
General Information
Sector Urban water systems
Stage Wastewater treatment
Economic Data
Technology Lifetime Replacement of membrane every 5 years[4]
Investment Cost 225,000 – 450,000€ (application in the winery industry) [4]
Operation Cost
The cost of operating an MBR is higher than conventional WWTPs with secondary clarifiers due to high membrane replacement cost and high energy demand for aeration (10-15% increased energy costs than conventional). Membrane replacement cost is 37,500€ [3, 4].
Environmental Performance
Water saving The implementation of MBRs can initiate large volumes of water savings through water reuse.
Energy efficiency Relatively greater consumption of energy than a conventional solution; for a high rate activated sludge treatment process the energy consumption varies from 60 to 150 HP/mgd [5].
Physical efficiency Steroid removal rates greater than 90% are achieveable through the utilization of MBRs with nitrification and denitrification (SRT: 12-15 days) [2].
Environmental impacts Effective removal of soluble and particulate biodegradable substances from environmental eco-systems [2].
Applications/Innovative Character
Fowler Water Reclamation Facility (2.5 mgd treatment plant) – Forsyth County, Georgia, USA [5]
References
[1] Virkutyte, J., Varma, R. S. and Jegatheesan, V. (2010). Treatment of Micropollutants in Water and Wastewater. London: IWA Publishing.
[2] Rattier, M., Reutgoat, J., Gernjak, W. and Keller, J. (2012). Organic Micropollutant Removal by Biological Activated Carbon Filtration: A Review. Urban Water Security Research Alliance Technical Report No. 53..
[3] Cinar, Ӧ., Hasar, H. and Kinaci, C. (2005). Modeling of submerged membrane bioreactor treating cheese whey wastewater by artificial neural network. Biotechnology, 123(2), 204-209.
[4] Anu Shah, P.E., Summit Engineering, Inc. (n.d.). Winery Wastewater treatment and Reuse: Membrane Bioreactor Technology. Santa Rosa, California: Summit Engineering, Inc.
[5] Cooper, N. B., Marshall, J. W., Hunt, K. and Reidy, J. G. (2006). ENERGY USAGE AND CONTROL AT A MEMBRANE BIOREACTOR FACILITY. Norcross, Georgia, USA: Water Environment Federation’s Annual Technical Exhibition and Conference (WEFTEC).
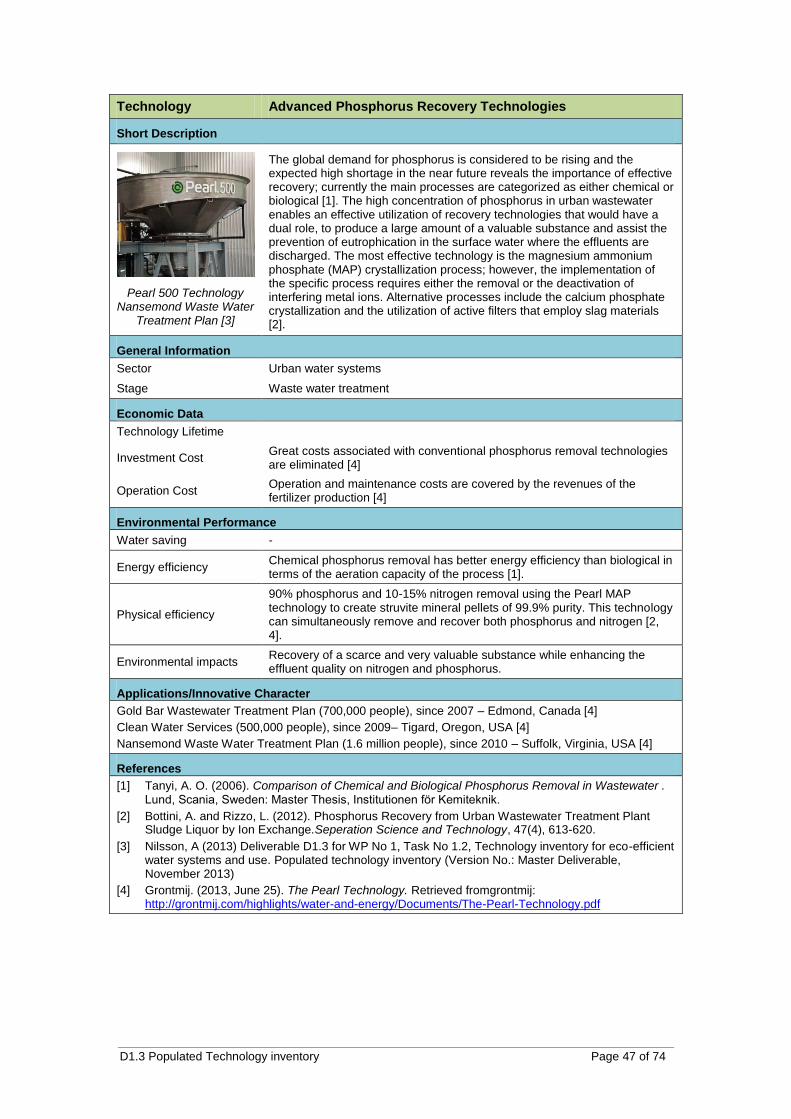
D1.3 Populated Technology inventory Page 47 of 74
Technology Advanced Phosphorus Recovery Technologies
Short Description
Pearl 500 Technology Nansemond Waste Water
Treatment Plan [3]
The global demand for phosphorus is considered to be rising and the expected high shortage in the near future reveals the importance of effective recovery; currently the main processes are categorized as either chemical or biological [1]. The high concentration of phosphorus in urban wastewater enables an effective utilization of recovery technologies that would have a dual role, to produce a large amount of a valuable substance and assist the prevention of eutrophication in the surface water where the effluents are discharged. The most effective technology is the magnesium ammonium phosphate (MAP) crystallization process; however, the implementation of the specific process requires either the removal or the deactivation of interfering metal ions. Alternative processes include the calcium phosphate crystallization and the utilization of active filters that employ slag materials [2].
General Information
Sector Urban water systems
Stage Waste water treatment
Economic Data
Technology Lifetime
Investment Cost Great costs associated with conventional phosphorus removal technologies are eliminated [4]
Operation Cost Operation and maintenance costs are covered by the revenues of the fertilizer production [4]
Environmental Performance
Water saving -
Energy efficiency Chemical phosphorus removal has better energy efficiency than biological in terms of the aeration capacity of the process [1].
Physical efficiency
90% phosphorus and 10-15% nitrogen removal using the Pearl MAP technology to create struvite mineral pellets of 99.9% purity. This technology can simultaneously remove and recover both phosphorus and nitrogen [2, 4].
Environmental impacts Recovery of a scarce and very valuable substance while enhancing the effluent quality on nitrogen and phosphorus.
Applications/Innovative Character
Gold Bar Wastewater Treatment Plan (700,000 people), since 2007 – Edmond, Canada [4]
Clean Water Services (500,000 people), since 2009– Tigard, Oregon, USA [4]
Nansemond Waste Water Treatment Plan (1.6 million people), since 2010 – Suffolk, Virginia, USA [4]
References
[1] Tanyi, A. O. (2006). Comparison of Chemical and Biological Phosphorus Removal in Wastewater . Lund, Scania, Sweden: Master Thesis, Institutionen för Kemiteknik.
[2] Bottini, A. and Rizzo, L. (2012). Phosphorus Recovery from Urban Wastewater Treatment Plant Sludge Liquor by Ion Exchange.Seperation Science and Technology, 47(4), 613-620.
[3] Nilsson, A (2013) Deliverable D1.3 for WP No 1, Task No 1.2, Technology inventory for eco-efficient water systems and use. Populated technology inventory (Version No.: Master Deliverable, November 2013)
[4] Grontmij. (2013, June 25). The Pearl Technology. Retrieved fromgrontmij: http://grontmij.com/highlights/water-and-energy/Documents/The-Pearl-Technology.pdf
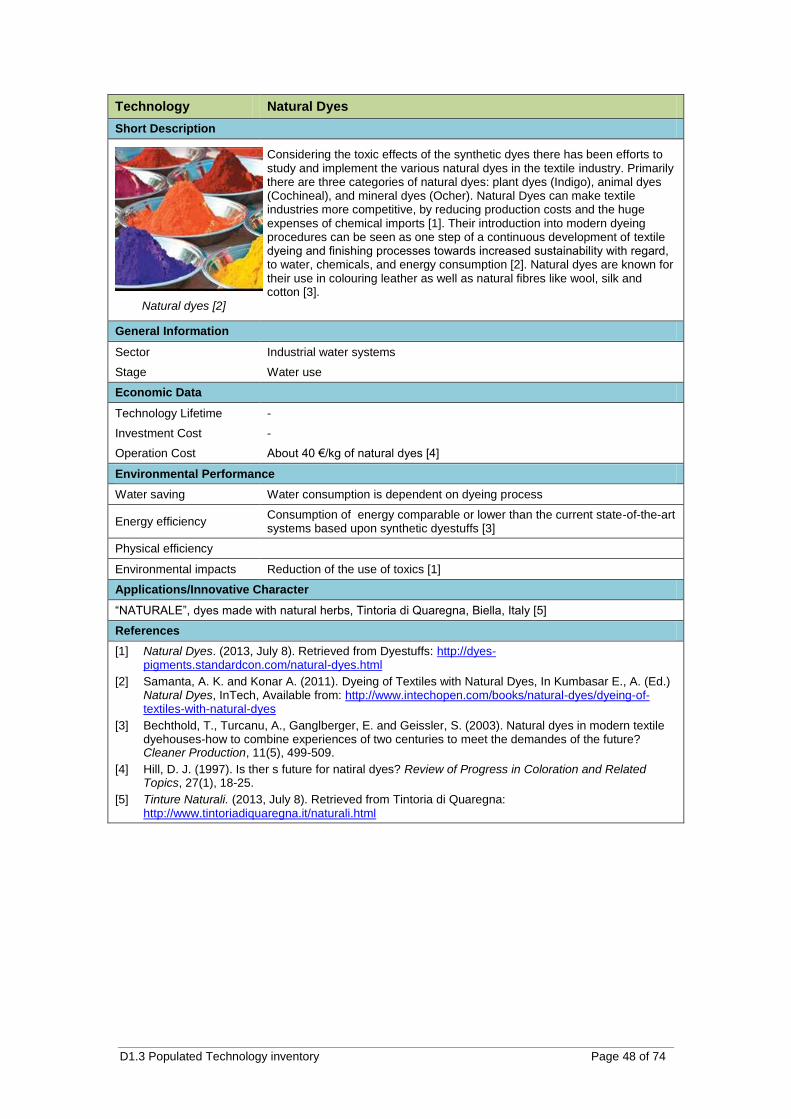
D1.3 Populated Technology inventory Page 48 of 74
Technology Natural Dyes
Short Description
Natural dyes [2]
Considering the toxic effects of the synthetic dyes there has been efforts to study and implement the various natural dyes in the textile industry. Primarily there are three categories of natural dyes: plant dyes (Indigo), animal dyes (Cochineal), and mineral dyes (Ocher). Natural Dyes can make textile industries more competitive, by reducing production costs and the huge expenses of chemical imports [1]. Their introduction into modern dyeing procedures can be seen as one step of a continuous development of textile dyeing and finishing processes towards increased sustainability with regard, to water, chemicals, and energy consumption [2]. Natural dyes are known for their use in colouring leather as well as natural fibres like wool, silk and cotton [3].
General Information
Sector Industrial water systems
Stage Water use
Economic Data
Technology Lifetime -
Investment Cost -
Operation Cost About 40 €/kg of natural dyes [4]
Environmental Performance
Water saving Water consumption is dependent on dyeing process
Energy efficiency Consumption of energy comparable or lower than the current state-of-the-art systems based upon synthetic dyestuffs [3]
Physical efficiency
Environmental impacts Reduction of the use of toxics [1]
Applications/Innovative Character
“NATURALE”, dyes made with natural herbs, Tintoria di Quaregna, Biella, Italy [5]
References
[1] Natural Dyes. (2013, July 8). Retrieved from Dyestuffs: http://dyes-pigments.standardcon.com/natural-dyes.html
[2] Samanta, A. K. and Konar A. (2011). Dyeing of Textiles with Natural Dyes, In Kumbasar E., A. (Ed.) Natural Dyes, InTech, Available from: http://www.intechopen.com/books/natural-dyes/dyeing-of-textiles-with-natural-dyes
[3] Bechthold, T., Turcanu, A., Ganglberger, E. and Geissler, S. (2003). Natural dyes in modern textile dyehouses-how to combine experiences of two centuries to meet the demandes of the future? Cleaner Production, 11(5), 499-509.
[4] Hill, D. J. (1997). Is ther s future for natiral dyes? Review of Progress in Coloration and Related Topics, 27(1), 18-25.
[5] Tinture Naturali. (2013, July 8). Retrieved from Tintoria di Quaregna: http://www.tintoriadiquaregna.it/naturali.html
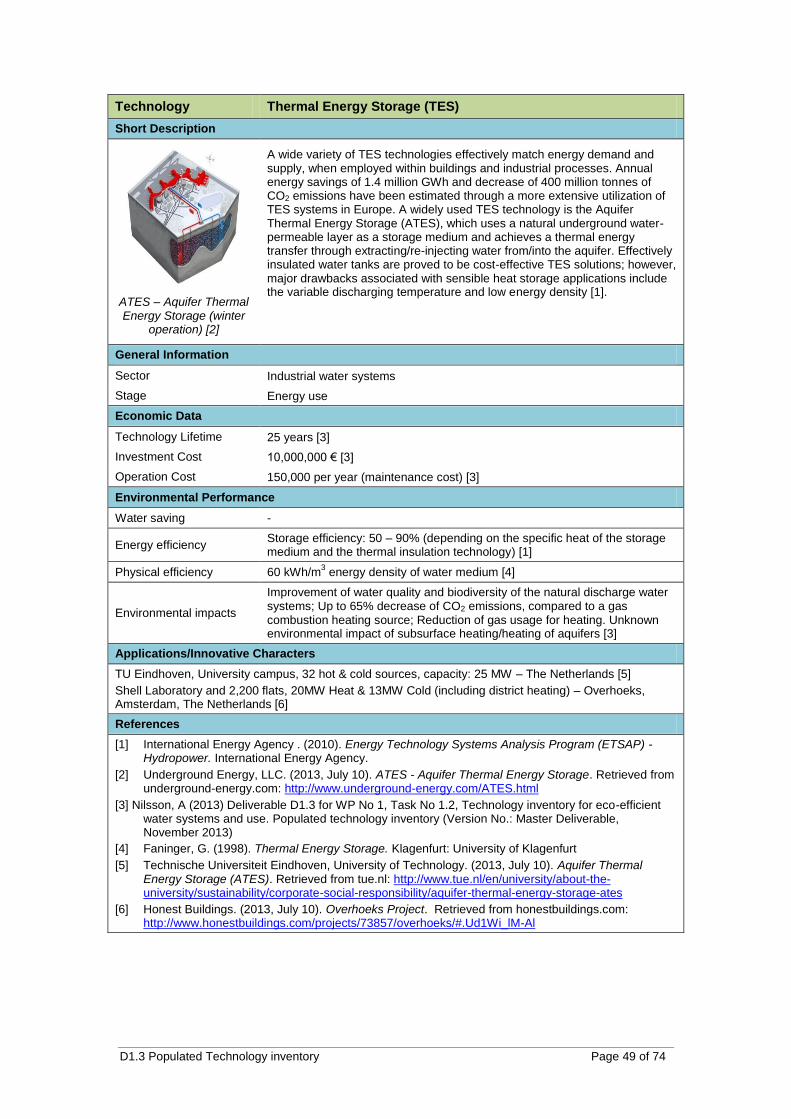
D1.3 Populated Technology inventory Page 49 of 74
Technology Thermal Energy Storage (TES)
Short Description
ATES – Aquifer Thermal Energy Storage (winter
operation) [2]
A wide variety of TES technologies effectively match energy demand and supply, when employed within buildings and industrial processes. Annual energy savings of 1.4 million GWh and decrease of 400 million tonnes of CO2 emissions have been estimated through a more extensive utilization of TES systems in Europe. A widely used TES technology is the Aquifer Thermal Energy Storage (ATES), which uses a natural underground water-permeable layer as a storage medium and achieves a thermal energy transfer through extracting/re-injecting water from/into the aquifer. Effectively insulated water tanks are proved to be cost-effective TES solutions; however, major drawbacks associated with sensible heat storage applications include the variable discharging temperature and low energy density [1].
General Information
Sector Industrial water systems
Stage Energy use
Economic Data
Technology Lifetime 25 years [3]
Investment Cost 10,000,000 € [3]
Operation Cost 150,000 per year (maintenance cost) [3]
Environmental Performance
Water saving -
Energy efficiency Storage efficiency: 50 – 90% (depending on the specific heat of the storage medium and the thermal insulation technology) [1]
Physical efficiency 60 kWh/m3 energy density of water medium [4]
Environmental impacts
Improvement of water quality and biodiversity of the natural discharge water systems; Up to 65% decrease of CO2 emissions, compared to a gas combustion heating source; Reduction of gas usage for heating. Unknown environmental impact of subsurface heating/heating of aquifers [3]
Applications/Innovative Characters
TU Eindhoven, University campus, 32 hot & cold sources, capacity: 25 MW – The Netherlands [5]
Shell Laboratory and 2,200 flats, 20MW Heat & 13MW Cold (including district heating) – Overhoeks, Amsterdam, The Netherlands [6]
References
[1] International Energy Agency . (2010). Energy Technology Systems Analysis Program (ETSAP) - Hydropower. International Energy Agency.
[2] Underground Energy, LLC. (2013, July 10). ATES - Aquifer Thermal Energy Storage. Retrieved from underground-energy.com: http://www.underground-energy.com/ATES.html
[3] Nilsson, A (2013) Deliverable D1.3 for WP No 1, Task No 1.2, Technology inventory for eco-efficient water systems and use. Populated technology inventory (Version No.: Master Deliverable, November 2013)
[4] Faninger, G. (1998). Thermal Energy Storage. Klagenfurt: University of Klagenfurt
[5] Technische Universiteit Eindhoven, University of Technology. (2013, July 10). Aquifer Thermal Energy Storage (ATES). Retrieved from tue.nl: http://www.tue.nl/en/university/about-the-university/sustainability/corporate-social-responsibility/aquifer-thermal-energy-storage-ates
[6] Honest Buildings. (2013, July 10). Overhoeks Project. Retrieved from honestbuildings.com: http://www.honestbuildings.com/projects/73857/overhoeks/#.Ud1Wi_lM-Al
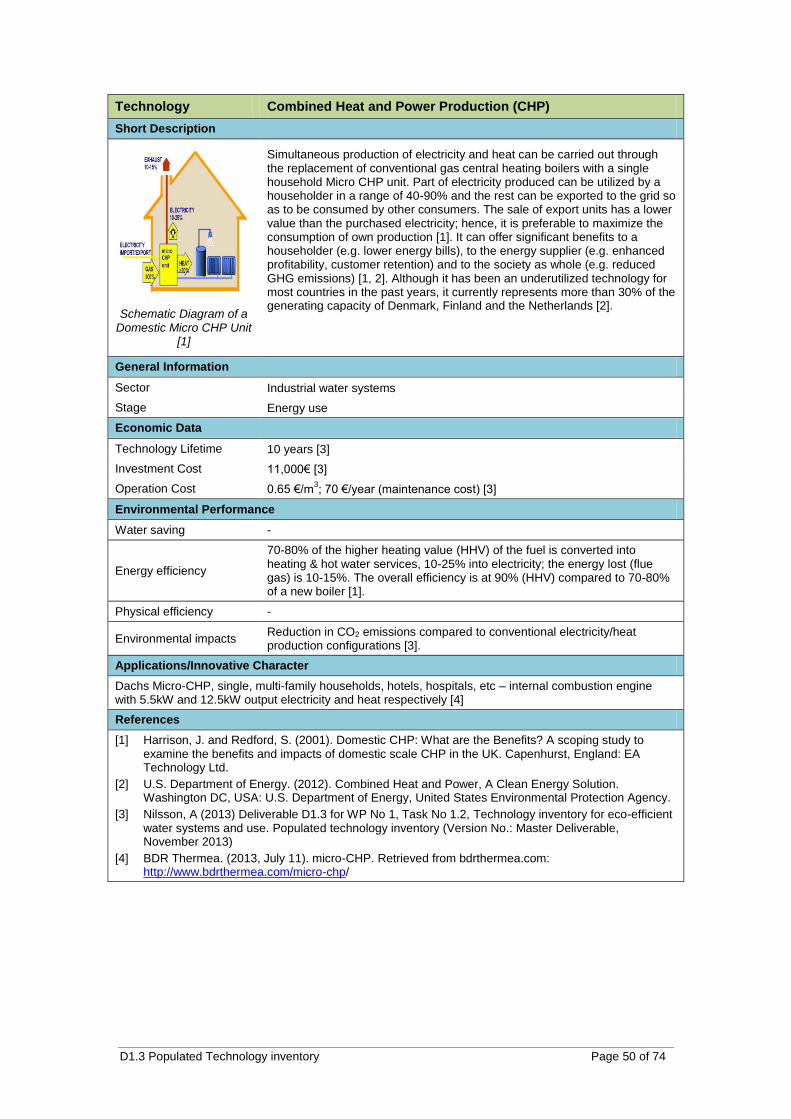
D1.3 Populated Technology inventory Page 50 of 74
Technology Combined Heat and Power Production (CHP)
Short Description
Schematic Diagram of a Domestic Micro CHP Unit
[1]
Simultaneous production of electricity and heat can be carried out through the replacement of conventional gas central heating boilers with a single household Micro CHP unit. Part of electricity produced can be utilized by a householder in a range of 40-90% and the rest can be exported to the grid so as to be consumed by other consumers. The sale of export units has a lower value than the purchased electricity; hence, it is preferable to maximize the consumption of own production [1]. It can offer significant benefits to a householder (e.g. lower energy bills), to the energy supplier (e.g. enhanced profitability, customer retention) and to the society as whole (e.g. reduced GHG emissions) [1, 2]. Although it has been an underutilized technology for most countries in the past years, it currently represents more than 30% of the generating capacity of Denmark, Finland and the Netherlands [2].
General Information
Sector Industrial water systems
Stage Energy use
Economic Data
Technology Lifetime 10 years [3]
Investment Cost 11,000€ [3]
Operation Cost 0.65 €/m3; 70 €/year (maintenance cost) [3]
Environmental Performance
Water saving -
Energy efficiency
70-80% of the higher heating value (HHV) of the fuel is converted into heating & hot water services, 10-25% into electricity; the energy lost (flue gas) is 10-15%. The overall efficiency is at 90% (HHV) compared to 70-80% of a new boiler [1].
Physical efficiency -
Environmental impacts Reduction in CO2 emissions compared to conventional electricity/heat production configurations [3].
Applications/Innovative Character
Dachs Micro-CHP, single, multi-family households, hotels, hospitals, etc – internal combustion engine with 5.5kW and 12.5kW output electricity and heat respectively [4]
References
[1] Harrison, J. and Redford, S. (2001). Domestic CHP: What are the Benefits? A scoping study to examine the benefits and impacts of domestic scale CHP in the UK. Capenhurst, England: EA Technology Ltd.
[2] U.S. Department of Energy. (2012). Combined Heat and Power, A Clean Energy Solution. Washington DC, USA: U.S. Department of Energy, United States Environmental Protection Agency.
[3] Nilsson, A (2013) Deliverable D1.3 for WP No 1, Task No 1.2, Technology inventory for eco-efficient water systems and use. Populated technology inventory (Version No.: Master Deliverable, November 2013)
[4] BDR Thermea. (2013, July 11). micro-CHP. Retrieved from bdrthermea.com: http://www.bdrthermea.com/micro-chp/
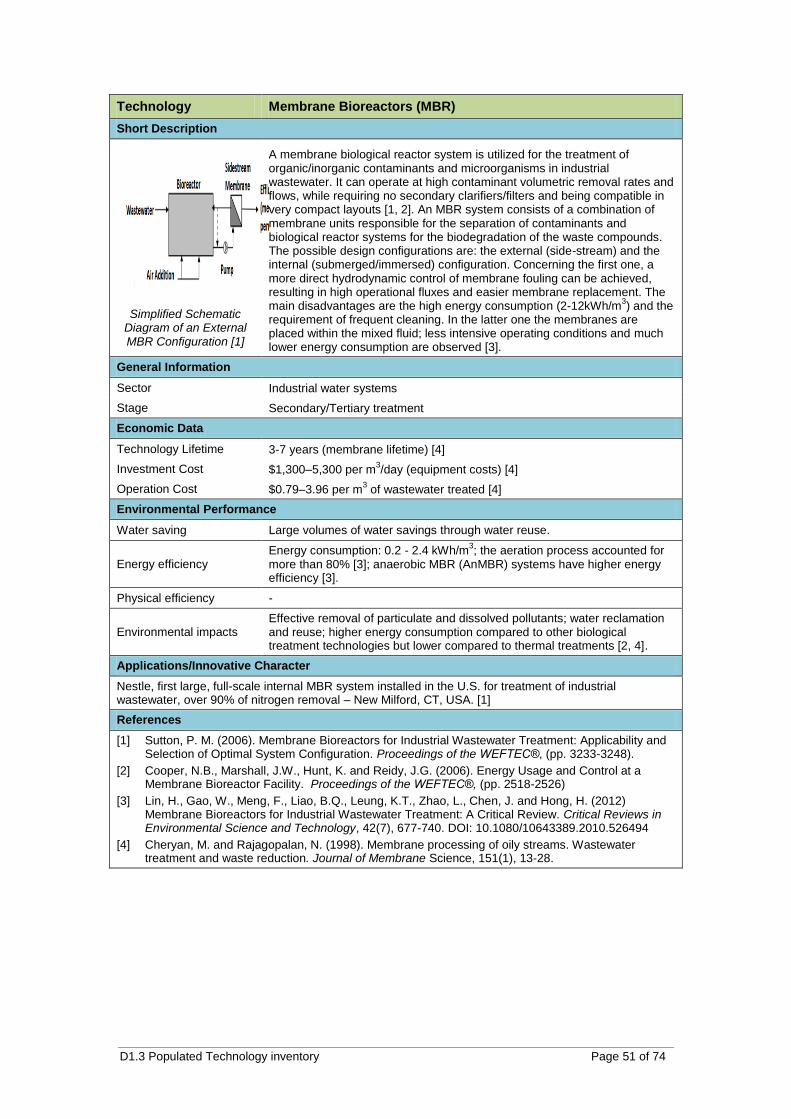
D1.3 Populated Technology inventory Page 51 of 74
Technology Membrane Bioreactors (MBR)
Short Description
Simplified Schematic Diagram of an External MBR Configuration [1]
A membrane biological reactor system is utilized for the treatment of organic/inorganic contaminants and microorganisms in industrial wastewater. It can operate at high contaminant volumetric removal rates and flows, while requiring no secondary clarifiers/filters and being compatible in very compact layouts [1, 2]. An MBR system consists of a combination of membrane units responsible for the separation of contaminants and biological reactor systems for the biodegradation of the waste compounds. The possible design configurations are: the external (side-stream) and the internal (submerged/immersed) configuration. Concerning the first one, a more direct hydrodynamic control of membrane fouling can be achieved, resulting in high operational fluxes and easier membrane replacement. The main disadvantages are the high energy consumption (2-12kWh/m
3) and the
requirement of frequent cleaning. In the latter one the membranes are placed within the mixed fluid; less intensive operating conditions and much lower energy consumption are observed [3].
General Information
Sector Industrial water systems
Stage Secondary/Tertiary treatment
Economic Data
Technology Lifetime 3-7 years (membrane lifetime) [4]
Investment Cost $1,300–5,300 per m3/day (equipment costs) [4]
Operation Cost $0.79–3.96 per m3 of wastewater treated [4]
Environmental Performance
Water saving Large volumes of water savings through water reuse.
Energy efficiency Energy consumption: 0.2 - 2.4 kWh/m
3; the aeration process accounted for
more than 80% [3]; anaerobic MBR (AnMBR) systems have higher energy efficiency [3].
Physical efficiency -
Environmental impacts Effective removal of particulate and dissolved pollutants; water reclamation and reuse; higher energy consumption compared to other biological treatment technologies but lower compared to thermal treatments [2, 4].
Applications/Innovative Character
Nestle, first large, full-scale internal MBR system installed in the U.S. for treatment of industrial wastewater, over 90% of nitrogen removal – New Milford, CT, USA. [1]
References
[1] Sutton, P. M. (2006). Membrane Bioreactors for Industrial Wastewater Treatment: Applicability and Selection of Optimal System Configuration. Proceedings of the WEFTEC®, (pp. 3233-3248).
[2] Cooper, N.B., Marshall, J.W., Hunt, K. and Reidy, J.G. (2006). Energy Usage and Control at a Membrane Bioreactor Facility. Proceedings of the WEFTEC®, (pp. 2518-2526)
[3] Lin, H., Gao, W., Meng, F., Liao, B.Q., Leung, K.T., Zhao, L., Chen, J. and Hong, H. (2012) Membrane Bioreactors for Industrial Wastewater Treatment: A Critical Review. Critical Reviews in Environmental Science and Technology, 42(7), 677-740. DOI: 10.1080/10643389.2010.526494
[4] Cheryan, M. and Rajagopalan, N. (1998). Membrane processing of oily streams. Wastewater treatment and waste reduction. Journal of Membrane Science, 151(1), 13-28.
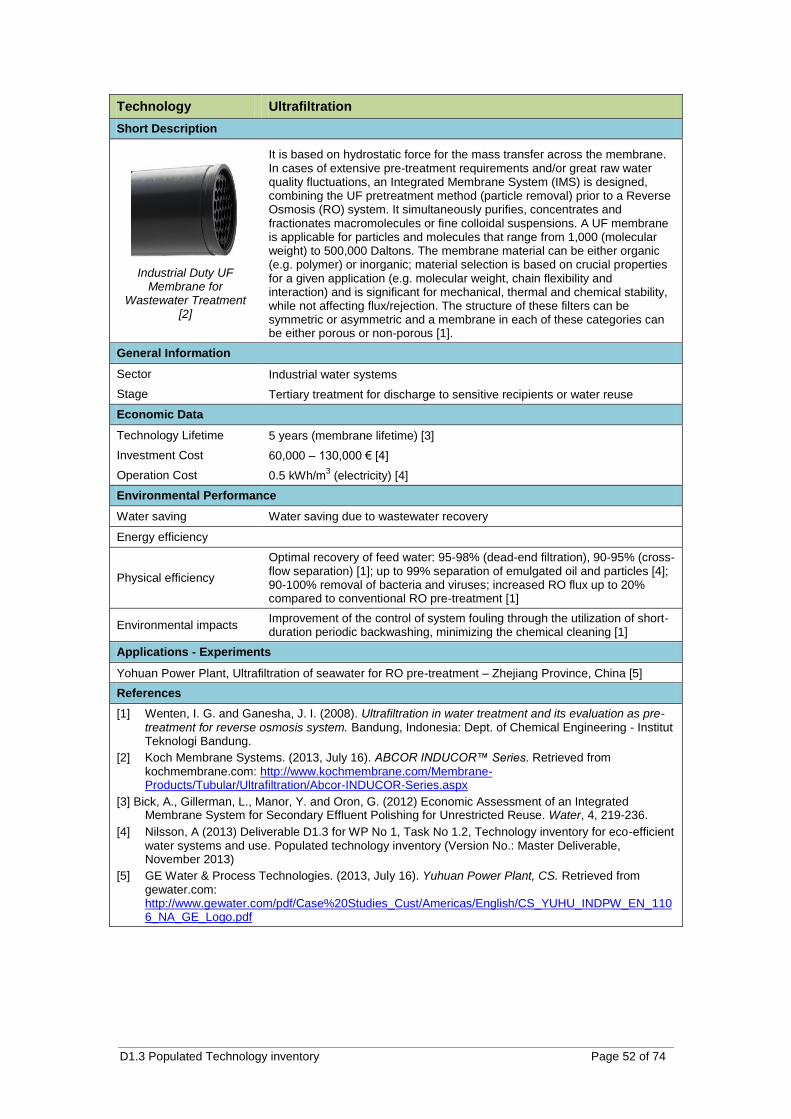
D1.3 Populated Technology inventory Page 52 of 74
Technology Ultrafiltration
Short Description
Industrial Duty UF Membrane for
Wastewater Treatment [2]
It is based on hydrostatic force for the mass transfer across the membrane. In cases of extensive pre-treatment requirements and/or great raw water quality fluctuations, an Integrated Membrane System (IMS) is designed, combining the UF pretreatment method (particle removal) prior to a Reverse Osmosis (RO) system. It simultaneously purifies, concentrates and fractionates macromolecules or fine colloidal suspensions. A UF membrane is applicable for particles and molecules that range from 1,000 (molecular weight) to 500,000 Daltons. The membrane material can be either organic (e.g. polymer) or inorganic; material selection is based on crucial properties for a given application (e.g. molecular weight, chain flexibility and interaction) and is significant for mechanical, thermal and chemical stability, while not affecting flux/rejection. The structure of these filters can be symmetric or asymmetric and a membrane in each of these categories can be either porous or non-porous [1].
General Information
Sector Industrial water systems
Stage Tertiary treatment for discharge to sensitive recipients or water reuse
Economic Data
Technology Lifetime 5 years (membrane lifetime) [3]
Investment Cost 60,000 – 130,000 € [4]
Operation Cost 0.5 kWh/m3 (electricity) [4]
Environmental Performance
Water saving Water saving due to wastewater recovery
Energy efficiency
Physical efficiency
Optimal recovery of feed water: 95-98% (dead-end filtration), 90-95% (cross-flow separation) [1]; up to 99% separation of emulgated oil and particles [4]; 90-100% removal of bacteria and viruses; increased RO flux up to 20% compared to conventional RO pre-treatment [1]
Environmental impacts Improvement of the control of system fouling through the utilization of short-duration periodic backwashing, minimizing the chemical cleaning [1]
Applications - Experiments
Yohuan Power Plant, Ultrafiltration of seawater for RO pre-treatment – Zhejiang Province, China [5]
References
[1] Wenten, I. G. and Ganesha, J. I. (2008). Ultrafiltration in water treatment and its evaluation as pre-treatment for reverse osmosis system. Bandung, Indonesia: Dept. of Chemical Engineering - Institut Teknologi Bandung.
[2] Koch Membrane Systems. (2013, July 16). ABCOR INDUCOR™ Series. Retrieved from kochmembrane.com: http://www.kochmembrane.com/Membrane-Products/Tubular/Ultrafiltration/Abcor-INDUCOR-Series.aspx
[3] Bick, A., Gillerman, L., Manor, Y. and Oron, G. (2012) Economic Assessment of an Integrated Membrane System for Secondary Effluent Polishing for Unrestricted Reuse. Water, 4, 219-236.
[4] Nilsson, A (2013) Deliverable D1.3 for WP No 1, Task No 1.2, Technology inventory for eco-efficient water systems and use. Populated technology inventory (Version No.: Master Deliverable, November 2013)
[5] GE Water & Process Technologies. (2013, July 16). Yuhuan Power Plant, CS. Retrieved from gewater.com: http://www.gewater.com/pdf/Case%20Studies_Cust/Americas/English/CS_YUHU_INDPW_EN_1106_NA_GE_Logo.pdf
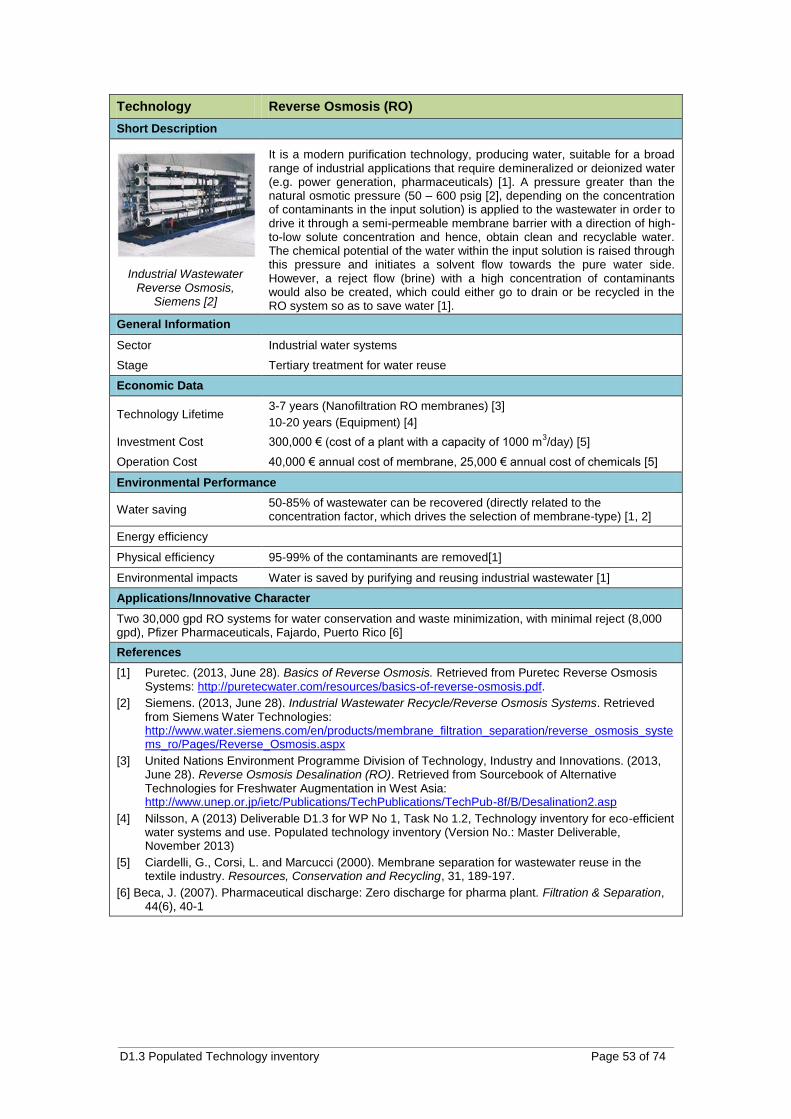
D1.3 Populated Technology inventory Page 53 of 74
Technology Reverse Osmosis (RO)
Short Description
Industrial Wastewater Reverse Osmosis,
Siemens [2]
It is a modern purification technology, producing water, suitable for a broad range of industrial applications that require demineralized or deionized water (e.g. power generation, pharmaceuticals) [1]. A pressure greater than the natural osmotic pressure (50 – 600 psig [2], depending on the concentration of contaminants in the input solution) is applied to the wastewater in order to drive it through a semi-permeable membrane barrier with a direction of high-to-low solute concentration and hence, obtain clean and recyclable water. The chemical potential of the water within the input solution is raised through this pressure and initiates a solvent flow towards the pure water side. However, a reject flow (brine) with a high concentration of contaminants would also be created, which could either go to drain or be recycled in the RO system so as to save water [1].
General Information
Sector Industrial water systems
Stage Tertiary treatment for water reuse
Economic Data
Technology Lifetime 3-7 years (Nanofiltration RO membranes) [3]
10-20 years (Equipment) [4]
Investment Cost 300,000 € (cost of a plant with a capacity of 1000 m3/day) [5]
Operation Cost 40,000 € annual cost of membrane, 25,000 € annual cost of chemicals [5]
Environmental Performance
Water saving 50-85% of wastewater can be recovered (directly related to the concentration factor, which drives the selection of membrane-type) [1, 2]
Energy efficiency
Physical efficiency 95-99% of the contaminants are removed[1]
Environmental impacts Water is saved by purifying and reusing industrial wastewater [1]
Applications/Innovative Character
Two 30,000 gpd RO systems for water conservation and waste minimization, with minimal reject (8,000 gpd), Pfizer Pharmaceuticals, Fajardo, Puerto Rico [6]
References
[1] Puretec. (2013, June 28). Basics of Reverse Osmosis. Retrieved from Puretec Reverse Osmosis Systems: http://puretecwater.com/resources/basics-of-reverse-osmosis.pdf.
[2] Siemens. (2013, June 28). Industrial Wastewater Recycle/Reverse Osmosis Systems. Retrieved from Siemens Water Technologies: http://www.water.siemens.com/en/products/membrane_filtration_separation/reverse_osmosis_systems_ro/Pages/Reverse_Osmosis.aspx
[3] United Nations Environment Programme Division of Technology, Industry and Innovations. (2013, June 28). Reverse Osmosis Desalination (RO). Retrieved from Sourcebook of Alternative Technologies for Freshwater Augmentation in West Asia: http://www.unep.or.jp/ietc/Publications/TechPublications/TechPub-8f/B/Desalination2.asp
[4] Nilsson, A (2013) Deliverable D1.3 for WP No 1, Task No 1.2, Technology inventory for eco-efficient water systems and use. Populated technology inventory (Version No.: Master Deliverable, November 2013)
[5] Ciardelli, G., Corsi, L. and Marcucci (2000). Membrane separation for wastewater reuse in the textile industry. Resources, Conservation and Recycling, 31, 189-197.
[6] Beca, J. (2007). Pharmaceutical discharge: Zero discharge for pharma plant. Filtration & Separation, 44(6), 40-1
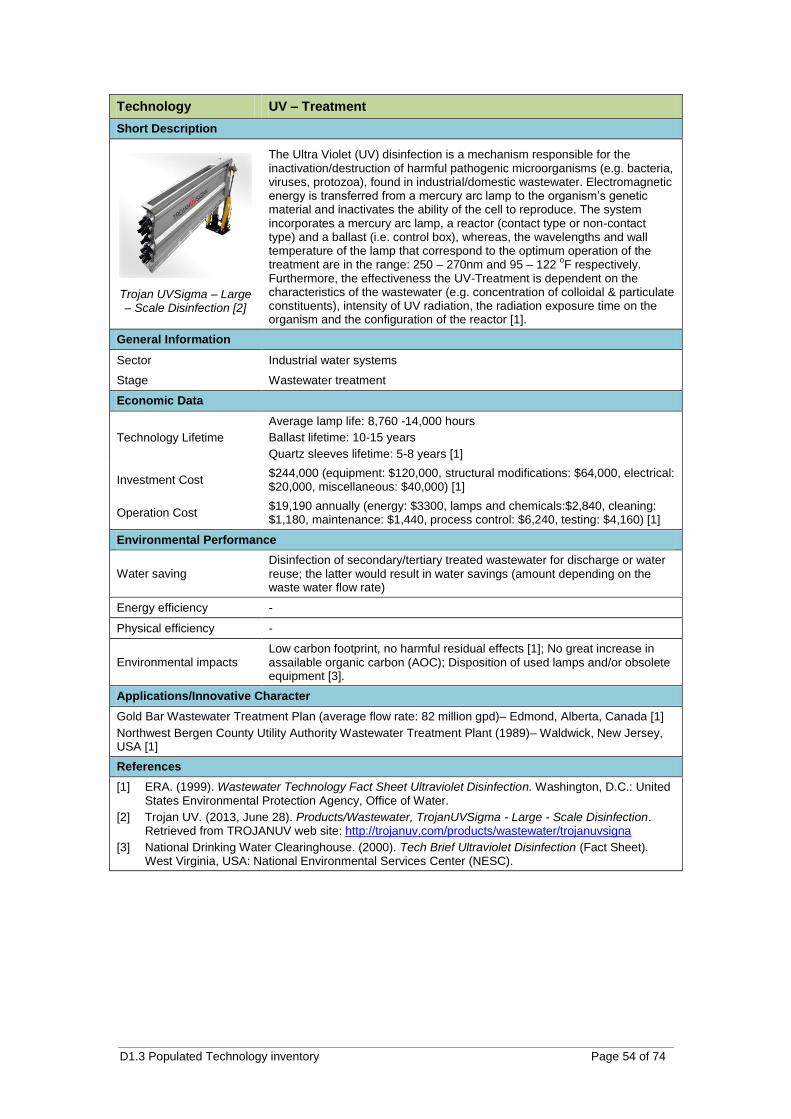
D1.3 Populated Technology inventory Page 54 of 74
Technology UV – Treatment
Short Description
Trojan UVSigma – Large – Scale Disinfection [2]
The Ultra Violet (UV) disinfection is a mechanism responsible for the inactivation/destruction of harmful pathogenic microorganisms (e.g. bacteria, viruses, protozoa), found in industrial/domestic wastewater. Electromagnetic energy is transferred from a mercury arc lamp to the organism’s genetic material and inactivates the ability of the cell to reproduce. The system incorporates a mercury arc lamp, a reactor (contact type or non-contact type) and a ballast (i.e. control box), whereas, the wavelengths and wall temperature of the lamp that correspond to the optimum operation of the treatment are in the range: 250 – 270nm and 95 – 122
oF respectively.
Furthermore, the effectiveness the UV-Treatment is dependent on the characteristics of the wastewater (e.g. concentration of colloidal & particulate constituents), intensity of UV radiation, the radiation exposure time on the organism and the configuration of the reactor [1].
General Information
Sector Industrial water systems
Stage Wastewater treatment
Economic Data
Technology Lifetime
Average lamp life: 8,760 -14,000 hours
Ballast lifetime: 10-15 years
Quartz sleeves lifetime: 5-8 years [1]
Investment Cost $244,000 (equipment: $120,000, structural modifications: $64,000, electrical: $20,000, miscellaneous: $40,000) [1]
Operation Cost $19,190 annually (energy: $3300, lamps and chemicals:$2,840, cleaning: $1,180, maintenance: $1,440, process control: $6,240, testing: $4,160) [1]
Environmental Performance
Water saving Disinfection of secondary/tertiary treated wastewater for discharge or water reuse; the latter would result in water savings (amount depending on the waste water flow rate)
Energy efficiency -
Physical efficiency -
Environmental impacts Low carbon footprint, no harmful residual effects [1]; No great increase in assailable organic carbon (AOC); Disposition of used lamps and/or obsolete equipment [3].
Applications/Innovative Character
Gold Bar Wastewater Treatment Plan (average flow rate: 82 million gpd)– Edmond, Alberta, Canada [1]
Northwest Bergen County Utility Authority Wastewater Treatment Plant (1989)– Waldwick, New Jersey, USA [1]
References
[1] ERA. (1999). Wastewater Technology Fact Sheet Ultraviolet Disinfection. Washington, D.C.: United States Environmental Protection Agency, Office of Water.
[2] Trojan UV. (2013, June 28). Products/Wastewater, TrojanUVSigma - Large - Scale Disinfection. Retrieved from TROJANUV web site: http://trojanuv.com/products/wastewater/trojanuvsigna
[3] National Drinking Water Clearinghouse. (2000). Tech Brief Ultraviolet Disinfection (Fact Sheet). West Virginia, USA: National Environmental Services Center (NESC).
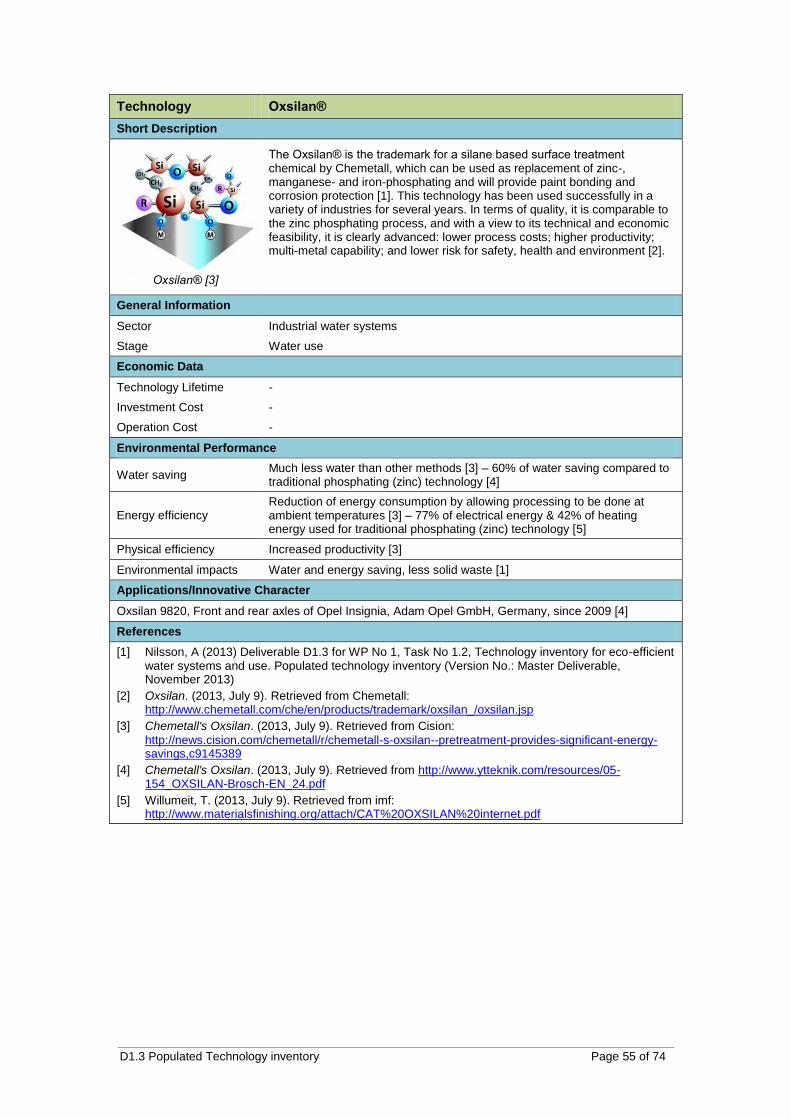
D1.3 Populated Technology inventory Page 55 of 74
Technology Oxsilan®
Short Description
Oxsilan® [3]
The Oxsilan® is the trademark for a silane based surface treatment chemical by Chemetall, which can be used as replacement of zinc-, manganese- and iron-phosphating and will provide paint bonding and corrosion protection [1]. This technology has been used successfully in a variety of industries for several years. In terms of quality, it is comparable to the zinc phosphating process, and with a view to its technical and economic feasibility, it is clearly advanced: lower process costs; higher productivity; multi-metal capability; and lower risk for safety, health and environment [2].
General Information
Sector Industrial water systems
Stage Water use
Economic Data
Technology Lifetime -
Investment Cost -
Operation Cost -
Environmental Performance
Water saving Much less water than other methods [3] – 60% of water saving compared to traditional phosphating (zinc) technology [4]
Energy efficiency Reduction of energy consumption by allowing processing to be done at ambient temperatures [3] – 77% of electrical energy & 42% of heating energy used for traditional phosphating (zinc) technology [5]
Physical efficiency Increased productivity [3]
Environmental impacts Water and energy saving, less solid waste [1]
Applications/Innovative Character
Oxsilan 9820, Front and rear axles of Opel Insignia, Adam Opel GmbH, Germany, since 2009 [4]
References
[1] Nilsson, A (2013) Deliverable D1.3 for WP No 1, Task No 1.2, Technology inventory for eco-efficient water systems and use. Populated technology inventory (Version No.: Master Deliverable, November 2013)
[2] Oxsilan. (2013, July 9). Retrieved from Chemetall: http://www.chemetall.com/che/en/products/trademark/oxsilan_/oxsilan.jsp
[3] Chemetall's Oxsilan. (2013, July 9). Retrieved from Cision:
http://news.cision.com/chemetall/r/chemetall-s-oxsilan--pretreatment-provides-significant-energy-savings,c9145389
[4] Chemetall's Oxsilan. (2013, July 9). Retrieved from http://www.ytteknik.com/resources/05-154_OXSILAN-Brosch-EN_24.pdf
[5] Willumeit, T. (2013, July 9). Retrieved from imf: http://www.materialsfinishing.org/attach/CAT%20OXSILAN%20internet.pdf
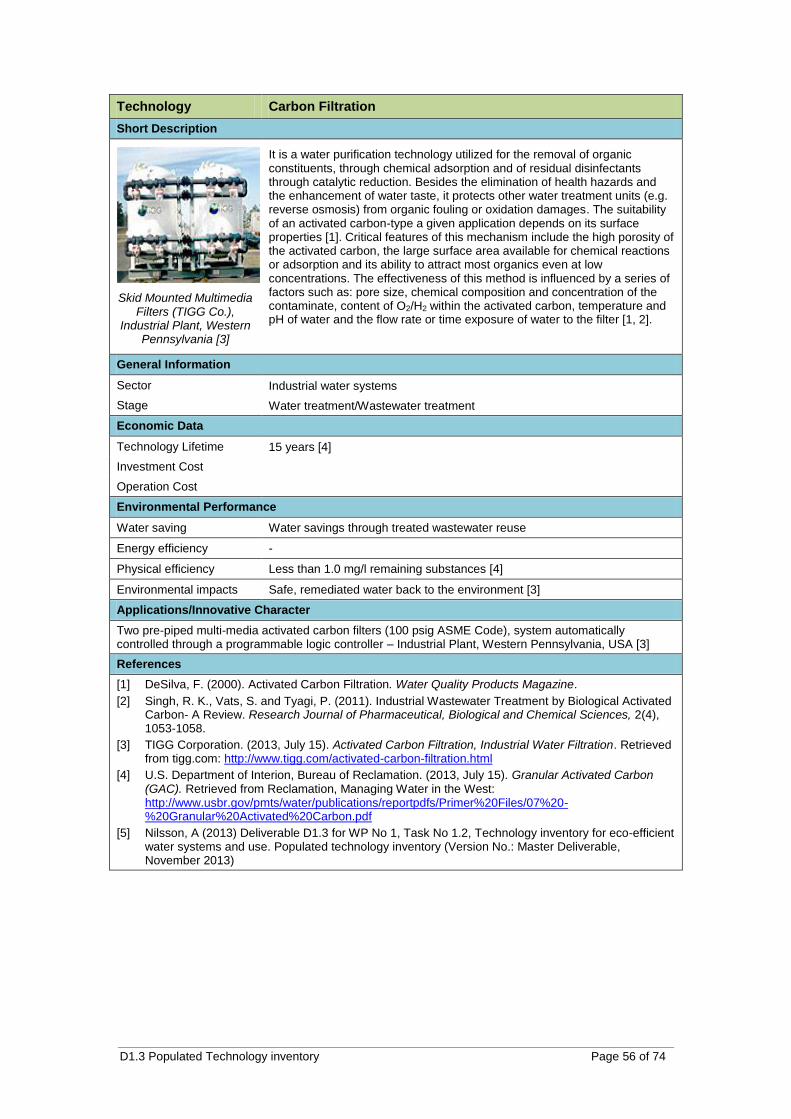
D1.3 Populated Technology inventory Page 56 of 74
Technology Carbon Filtration
Short Description
Skid Mounted Multimedia Filters (TIGG Co.),
Industrial Plant, Western Pennsylvania [3]
It is a water purification technology utilized for the removal of organic constituents, through chemical adsorption and of residual disinfectants through catalytic reduction. Besides the elimination of health hazards and the enhancement of water taste, it protects other water treatment units (e.g. reverse osmosis) from organic fouling or oxidation damages. The suitability of an activated carbon-type a given application depends on its surface properties [1]. Critical features of this mechanism include the high porosity of the activated carbon, the large surface area available for chemical reactions or adsorption and its ability to attract most organics even at low concentrations. The effectiveness of this method is influenced by a series of factors such as: pore size, chemical composition and concentration of the contaminate, content of O2/H2 within the activated carbon, temperature and pH of water and the flow rate or time exposure of water to the filter [1, 2].
General Information
Sector Industrial water systems
Stage Water treatment/Wastewater treatment
Economic Data
Technology Lifetime 15 years [4]
Investment Cost
Operation Cost
Environmental Performance
Water saving Water savings through treated wastewater reuse
Energy efficiency -
Physical efficiency Less than 1.0 mg/l remaining substances [4]
Environmental impacts Safe, remediated water back to the environment [3]
Applications/Innovative Character
Two pre-piped multi-media activated carbon filters (100 psig ASME Code), system automatically controlled through a programmable logic controller – Industrial Plant, Western Pennsylvania, USA [3]
References
[1] DeSilva, F. (2000). Activated Carbon Filtration. Water Quality Products Magazine.
[2] Singh, R. K., Vats, S. and Tyagi, P. (2011). Industrial Wastewater Treatment by Biological Activated Carbon- A Review. Research Journal of Pharmaceutical, Biological and Chemical Sciences, 2(4), 1053-1058.
[3] TIGG Corporation. (2013, July 15). Activated Carbon Filtration, Industrial Water Filtration. Retrieved from tigg.com: http://www.tigg.com/activated-carbon-filtration.html
[4] U.S. Department of Interion, Bureau of Reclamation. (2013, July 15). Granular Activated Carbon (GAC). Retrieved from Reclamation, Managing Water in the West: http://www.usbr.gov/pmts/water/publications/reportpdfs/Primer%20Files/07%20-%20Granular%20Activated%20Carbon.pdf
[5] Nilsson, A (2013) Deliverable D1.3 for WP No 1, Task No 1.2, Technology inventory for eco-efficient water systems and use. Populated technology inventory (Version No.: Master Deliverable, November 2013)
D1.3 Populated Technology inventory Page 57 of 74
Technology Variable tariffs of water supply - demand
Short Description
Definition of variable price ranges for water supplied according to the volume of water uses. There is enough available data and knowledge to deliver decision support information about crop water needs. With this information each farmer, for each crop, soil and irrigation technology could have access to the recommended amount of water to apply. If more water is requested, a higher cubic meter price should be charged [1].
General Information
Sector Agricultural
Stage Water Use
Economic Data
Technology Lifetime -
Investment Cost -
Operation Cost -
Environmental Performance
Water saving -
Energy efficiency -
Physical efficiency -
Environmental impacts -
Applications/Innovative Character
References
[1] Nilsson, A (2013) Deliverable D1.3 for WP No 1, Task No 1.2, Technology inventory for eco-efficient water systems and use. Populated technology inventory (Version No.: Master Deliverable, November 2013)
D1.3 Populated Technology inventory Page 58 of 74
Technology Variable tariffs of water supply - energy
Short Description
Definition of variable price ranges for water supplied, according to the correspondent schedule/ energy price of the time period of supply. The Monte Novo farmers association has the responsibility to deliver water at the conditions farmers contracted and that the supply system supports. Since farmers can request water at any time of the day or day of the year, it can represent variable levels of costs for farmers’ association operation. With a variable price of supplied water, could be promoted, when and wherever possible, a preferable water supply during low energy tariffs periods [1].
General Information
Sector Agricultural
Stage Water Use
Economic Data
Technology Lifetime -
Investment Cost -
Operation Cost -
Environmental Performance
Water saving -
Energy efficiency -
Physical efficiency -
Environmental impacts -
Applications/Innovative Character
References
[1] Nilsson, A (2013) Deliverable D1.3 for WP No 1, Task No 1.2, Technology inventory for eco-efficient water systems and use. Populated technology inventory (Version No.: Master Deliverable, November 2013)
D1.3 Populated Technology inventory Page 59 of 74
Technology Alter current pressure head delivery
Short Description
At this stage, the Monte Novo distribution irrigation network operates at different levels of pressure head in what regards water deliver to farmers. The distinction is made in high pressure levels (essentially for small to medium sized farms) enabling farmers to use this water volumes directly from distribution network, without any additional pumping station (but at higher water tariffs), and the low pressure levels (for larger farms) which implies that farmers invest and install their one pumping stations to ensure the pressure head levels required (compensated with lower water tariffs). At this stage is being discussed the possibility to change this distinction since the difference in water prices can be insufficient to compensate farmers from investing in their own pumping stations [1].
General Information
Sector Agricultural Sector
Stage Water Distribution
Economic Data
Technology Lifetime -
Investment Cost -
Operation Cost -
Environmental Performance
Water saving -
Energy efficiency -
Physical efficiency -
Environmental impacts -
Applications/Innovative Character
References
[1] Nilsson, A (2013) Deliverable D1.3 for WP No 1, Task No 1.2, Technology inventory for eco-efficient water systems and use. Populated technology inventory (Version No.: Master Deliverable, November 2013)
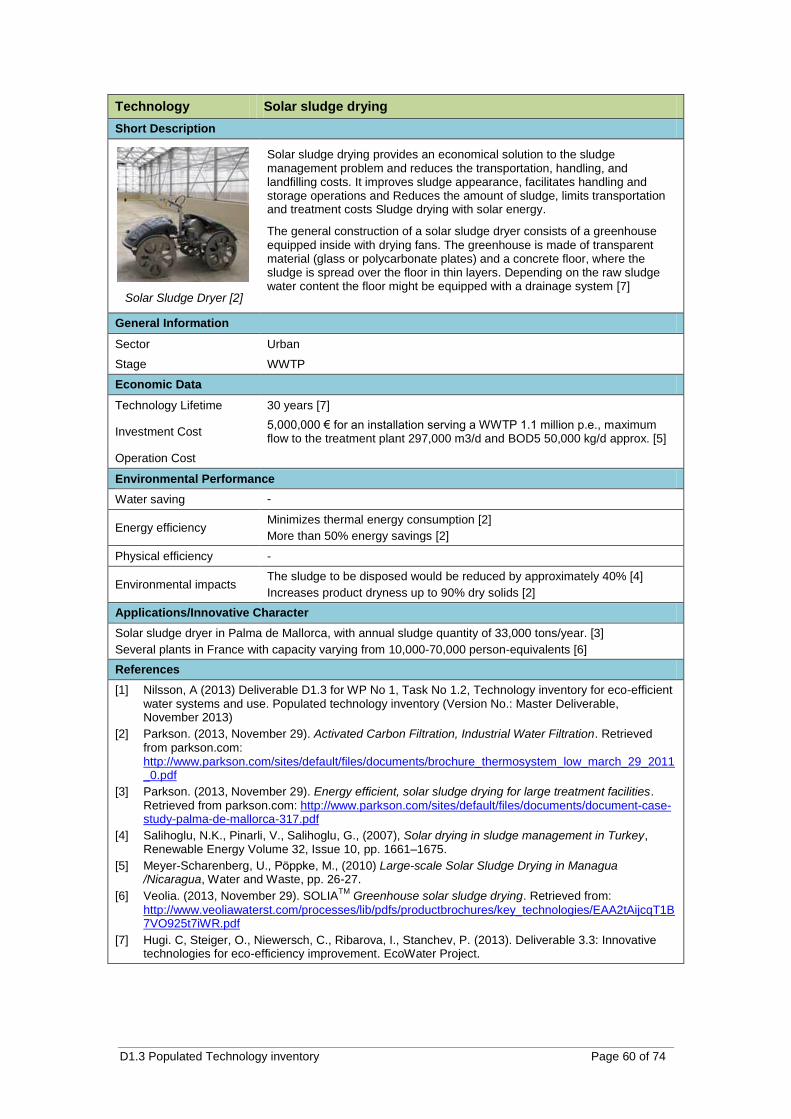
D1.3 Populated Technology inventory Page 60 of 74
Technology Solar sludge drying
Short Description
Solar Sludge Dryer [2]
Solar sludge drying provides an economical solution to the sludge management problem and reduces the transportation, handling, and landfilling costs. It improves sludge appearance, facilitates handling and storage operations and Reduces the amount of sludge, limits transportation and treatment costs Sludge drying with solar energy.
The general construction of a solar sludge dryer consists of a greenhouse equipped inside with drying fans. The greenhouse is made of transparent material (glass or polycarbonate plates) and a concrete floor, where the sludge is spread over the floor in thin layers. Depending on the raw sludge water content the floor might be equipped with a drainage system [7]
General Information
Sector Urban
Stage WWTP
Economic Data
Technology Lifetime 30 years [7]
Investment Cost 5,000,000 € for an installation serving a WWTP 1.1 million p.e., maximum flow to the treatment plant 297,000 m3/d and BOD5 50,000 kg/d approx. [5]
Operation Cost
Environmental Performance
Water saving -
Energy efficiency Minimizes thermal energy consumption [2]
More than 50% energy savings [2]
Physical efficiency -
Environmental impacts The sludge to be disposed would be reduced by approximately 40% [4]
Increases product dryness up to 90% dry solids [2]
Applications/Innovative Character
Solar sludge dryer in Palma de Mallorca, with annual sludge quantity of 33,000 tons/year. [3]
Several plants in France with capacity varying from 10,000-70,000 person-equivalents [6]
References
[1] Nilsson, A (2013) Deliverable D1.3 for WP No 1, Task No 1.2, Technology inventory for eco-efficient water systems and use. Populated technology inventory (Version No.: Master Deliverable, November 2013)
[2] Parkson. (2013, November 29). Activated Carbon Filtration, Industrial Water Filtration. Retrieved from parkson.com: http://www.parkson.com/sites/default/files/documents/brochure_thermosystem_low_march_29_2011_0.pdf
[3] Parkson. (2013, November 29). Energy efficient, solar sludge drying for large treatment facilities. Retrieved from parkson.com: http://www.parkson.com/sites/default/files/documents/document-case-study-palma-de-mallorca-317.pdf
[4] Salihoglu, N.K., Pinarli, V., Salihoglu, G., (2007), Solar drying in sludge management in Turkey, Renewable Energy Volume 32, Issue 10, pp. 1661–1675.
[5] Meyer-Scharenberg, U., Pöppke, M., (2010) Large-scale Solar Sludge Drying in Managua /Nicaragua, Water and Waste, pp. 26-27.
[6] Veolia. (2013, November 29). SOLIATM
Greenhouse solar sludge drying. Retrieved from:
http://www.veoliawaterst.com/processes/lib/pdfs/productbrochures/key_technologies/EAA2tAijcqT1B7VO925t7iWR.pdf
[7] Hugi. C, Steiger, O., Niewersch, C., Ribarova, I., Stanchev, P. (2013). Deliverable 3.3: Innovative technologies for eco-efficiency improvement. EcoWater Project.
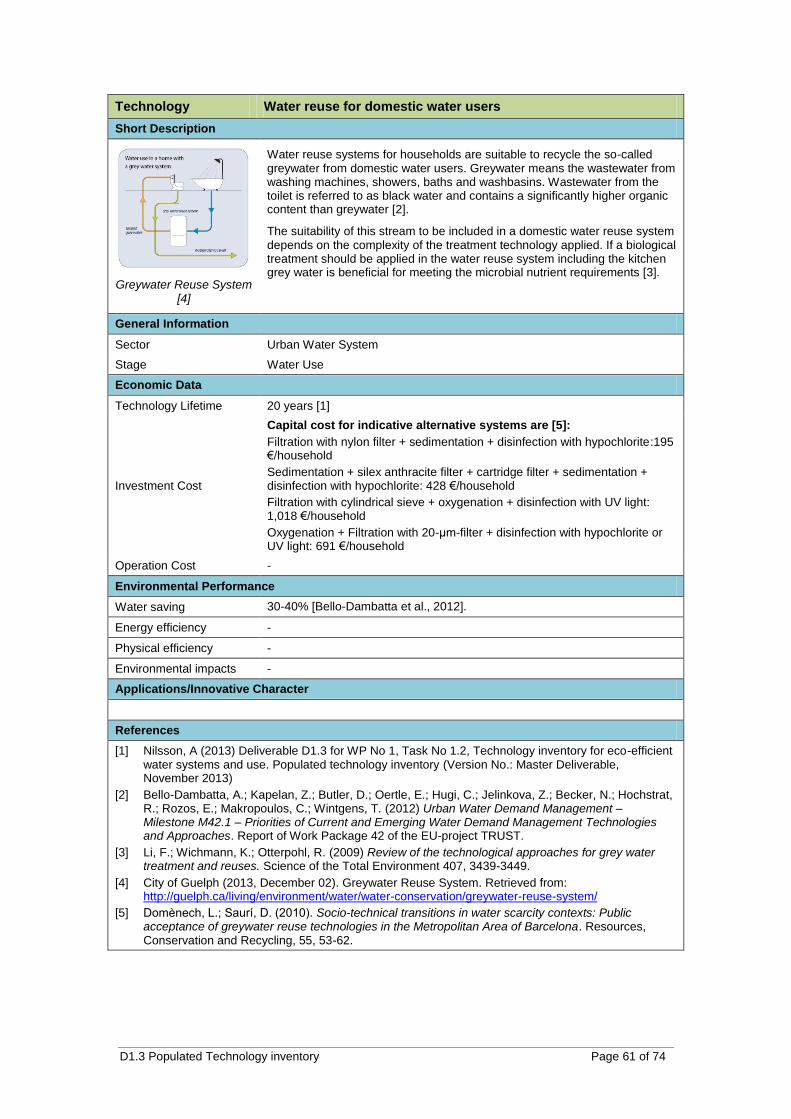
D1.3 Populated Technology inventory Page 61 of 74
Technology Water reuse for domestic water users
Short Description
Greywater Reuse System [4]
Water reuse systems for households are suitable to recycle the so-called greywater from domestic water users. Greywater means the wastewater from washing machines, showers, baths and washbasins. Wastewater from the toilet is referred to as black water and contains a significantly higher organic content than greywater [2].
The suitability of this stream to be included in a domestic water reuse system depends on the complexity of the treatment technology applied. If a biological treatment should be applied in the water reuse system including the kitchen grey water is beneficial for meeting the microbial nutrient requirements [3].
General Information
Sector Urban Water System
Stage Water Use
Economic Data
Technology Lifetime 20 years [1]
Investment Cost
Capital cost for indicative alternative systems are [5]:
Filtration with nylon filter + sedimentation + disinfection with hypochlorite :195 €/household
Sedimentation + silex anthracite filter + cartridge filter + sedimentation + disinfection with hypochlorite: 428 €/household
Filtration with cylindrical sieve + oxygenation + disinfection with UV light: 1,018 €/household
Oxygenation + Filtration with 20-µm-filter + disinfection with hypochlorite or UV light: 691 €/household
Operation Cost -
Environmental Performance
Water saving 30-40% [Bello-Dambatta et al., 2012].
Energy efficiency -
Physical efficiency -
Environmental impacts -
Applications/Innovative Character
References
[1] Nilsson, A (2013) Deliverable D1.3 for WP No 1, Task No 1.2, Technology inventory for eco-efficient water systems and use. Populated technology inventory (Version No.: Master Deliverable, November 2013)
[2] Bello-Dambatta, A.; Kapelan, Z.; Butler, D.; Oertle, E.; Hugi, C.; Jelinkova, Z.; Becker, N.; Hochstrat, R.; Rozos, E.; Makropoulos, C.; Wintgens, T. (2012) Urban Water Demand Management – Milestone M42.1 – Priorities of Current and Emerging Water Demand Management Technologies and Approaches. Report of Work Package 42 of the EU-project TRUST.
[3] Li, F.; Wichmann, K.; Otterpohl, R. (2009) Review of the technological approaches for grey water treatment and reuses. Science of the Total Environment 407, 3439-3449.
[4] City of Guelph (2013, December 02). Greywater Reuse System. Retrieved from: http://guelph.ca/living/environment/water/water-conservation/greywater-reuse-system/
[5] Domènech, L.; Saurí, D. (2010). Socio-technical transitions in water scarcity contexts: Public acceptance of greywater reuse technologies in the Metropolitan Area of Barcelona. Resources, Conservation and Recycling, 55, 53-62.
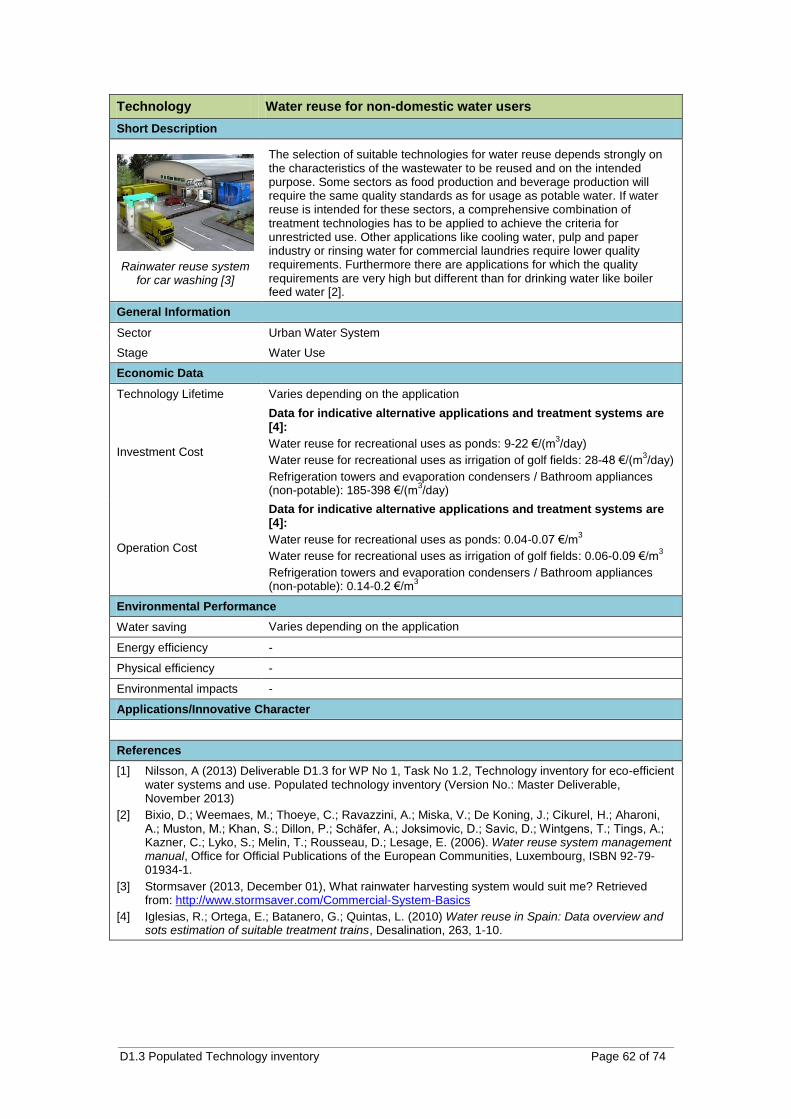
D1.3 Populated Technology inventory Page 62 of 74
Technology Water reuse for non-domestic water users
Short Description
Rainwater reuse system for car washing [3]
The selection of suitable technologies for water reuse depends strongly on the characteristics of the wastewater to be reused and on the intended purpose. Some sectors as food production and beverage production will require the same quality standards as for usage as potable water. If water reuse is intended for these sectors, a comprehensive combination of treatment technologies has to be applied to achieve the criteria for unrestricted use. Other applications like cooling water, pulp and paper industry or rinsing water for commercial laundries require lower quality requirements. Furthermore there are applications for which the quality requirements are very high but different than for drinking water like boiler feed water [2].
General Information
Sector Urban Water System
Stage Water Use
Economic Data
Technology Lifetime Varies depending on the application
Investment Cost
Data for indicative alternative applications and treatment systems are [4]:
Water reuse for recreational uses as ponds: 9-22 €/(m3/day)
Water reuse for recreational uses as irrigation of golf fields: 28-48 €/(m3/day)
Refrigeration towers and evaporation condensers / Bathroom appliances (non-potable): 185-398 €/(m
3/day)
Operation Cost
Data for indicative alternative applications and treatment systems are [4]:
Water reuse for recreational uses as ponds: 0.04-0.07 €/m3
Water reuse for recreational uses as irrigation of golf fields: 0.06-0.09 €/m3
Refrigeration towers and evaporation condensers / Bathroom appliances (non-potable): 0.14-0.2 €/m
3
Environmental Performance
Water saving Varies depending on the application
Energy efficiency -
Physical efficiency -
Environmental impacts -
Applications/Innovative Character
References
[1] Nilsson, A (2013) Deliverable D1.3 for WP No 1, Task No 1.2, Technology inventory for eco-efficient water systems and use. Populated technology inventory (Version No.: Master Deliverable, November 2013)
[2] Bixio, D.; Weemaes, M.; Thoeye, C.; Ravazzini, A.; Miska, V.; De Koning, J.; Cikurel, H.; Aharoni, A.; Muston, M.; Khan, S.; Dillon, P.; Schäfer, A.; Joksimovic, D.; Savic, D.; Wintgens, T.; Tings, A.; Kazner, C.; Lyko, S.; Melin, T.; Rousseau, D.; Lesage, E. (2006). Water reuse system management manual, Office for Official Publications of the European Communities, Luxembourg, ISBN 92-79-01934-1.
[3] Stormsaver (2013, December 01), What rainwater harvesting system would suit me? Retrieved from: http://www.stormsaver.com/Commercial-System-Basics
[4] Iglesias, R.; Ortega, E.; Batanero, G.; Quintas, L. (2010) Water reuse in Spain: Data overview and sots estimation of suitable treatment trains, Desalination, 263, 1-10.
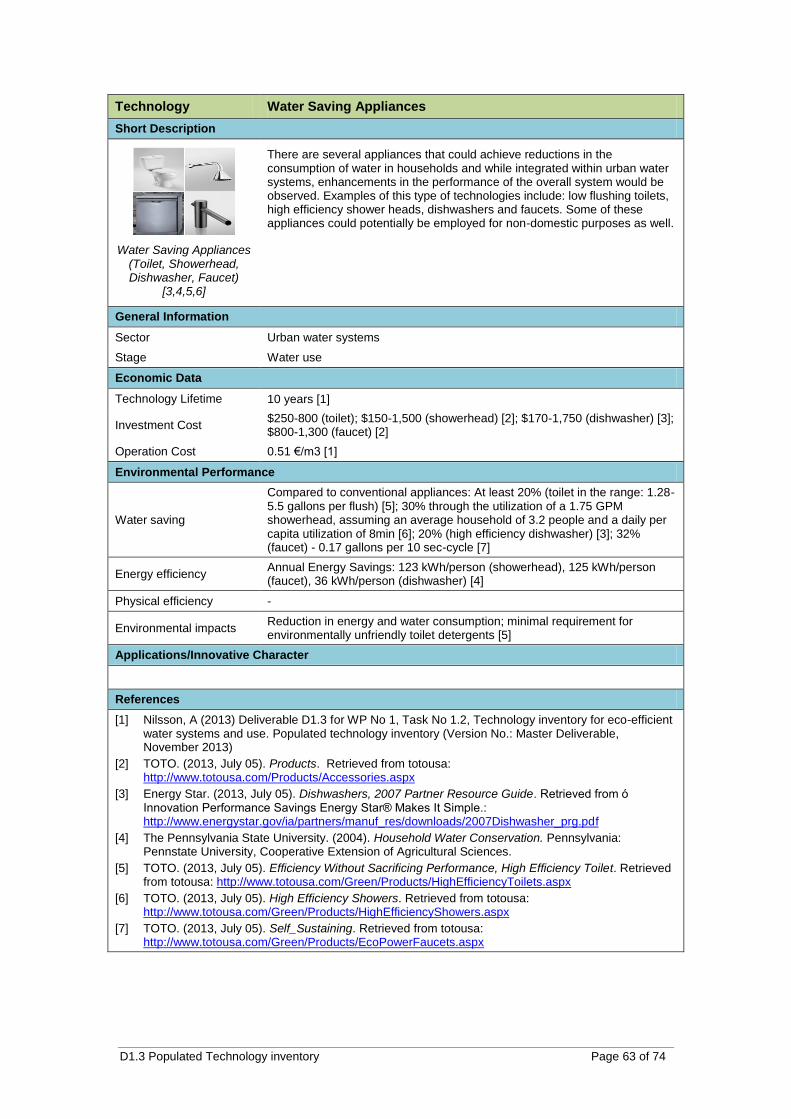
D1.3 Populated Technology inventory Page 63 of 74
Technology Water Saving Appliances
Short Description
Water Saving Appliances (Toilet, Showerhead, Dishwasher, Faucet)
[3,4,5,6]
There are several appliances that could achieve reductions in the consumption of water in households and while integrated within urban water systems, enhancements in the performance of the overall system would be observed. Examples of this type of technologies include: low flushing toilets, high efficiency shower heads, dishwashers and faucets. Some of these appliances could potentially be employed for non-domestic purposes as well.
General Information
Sector Urban water systems
Stage Water use
Economic Data
Technology Lifetime 10 years [1]
Investment Cost $250-800 (toilet); $150-1,500 (showerhead) [2]; $170-1,750 (dishwasher) [3]; $800-1,300 (faucet) [2]
Operation Cost 0.51 €/m3 [1]
Environmental Performance
Water saving
Compared to conventional appliances: At least 20% (toilet in the range: 1.28-5.5 gallons per flush) [5]; 30% through the utilization of a 1.75 GPM showerhead, assuming an average household of 3.2 people and a daily per capita utilization of 8min [6]; 20% (high efficiency dishwasher) [3]; 32% (faucet) - 0.17 gallons per 10 sec-cycle [7]
Energy efficiency Annual Energy Savings: 123 kWh/person (showerhead), 125 kWh/person (faucet), 36 kWh/person (dishwasher) [4]
Physical efficiency -
Environmental impacts Reduction in energy and water consumption; minimal requirement for environmentally unfriendly toilet detergents [5]
Applications/Innovative Character
References
[1] Nilsson, A (2013) Deliverable D1.3 for WP No 1, Task No 1.2, Technology inventory for eco-efficient water systems and use. Populated technology inventory (Version No.: Master Deliverable, November 2013)
[2] TOTO. (2013, July 05). Products. Retrieved from totousa: http://www.totousa.com/Products/Accessories.aspx
[3] Energy Star. (2013, July 05). Dishwashers, 2007 Partner Resource Guide. Retrieved from ό Innovation Performance Savings Energy Star® Makes It Simple.: http://www.energystar.gov/ia/partners/manuf_res/downloads/2007Dishwasher_prg.pdf
[4] The Pennsylvania State University. (2004). Household Water Conservation. Pennsylvania: Pennstate University, Cooperative Extension of Agricultural Sciences.
[5] TOTO. (2013, July 05). Efficiency Without Sacrificing Performance, High Efficiency Toilet. Retrieved from totousa: http://www.totousa.com/Green/Products/HighEfficiencyToilets.aspx
[6] TOTO. (2013, July 05). High Efficiency Showers. Retrieved from totousa: http://www.totousa.com/Green/Products/HighEfficiencyShowers.aspx
[7] TOTO. (2013, July 05). Self_Sustaining. Retrieved from totousa: http://www.totousa.com/Green/Products/EcoPowerFaucets.aspx

D1.3 Populated Technology inventory Page 64 of 74
Technology Low Flow Toilet
Short Description
4 litre flush toilet [2]
A low-flow toilet is a flush toilet that uses significantly less water than a full-flush toilet. Low-flow toilets use 4 to 6 liters (1 to 1.6 gallons) per flush as opposed to 13.2 liters that use the full-flush toilets. [2,3,4]
General Information
Sector Urban Water Systems
Stage Domestic water use
Economic Data
Technology Lifetime 20 years [1]
Investment Cost €200-800 approximately [2,3,4]
Operation Cost
Environmental Performance
Water saving 60-70% compared to full-flush toilets [2,3,4]
Energy efficiency
Physical efficiency
Environmental impacts
Applications/Innovative Character
References
[1] Nilsson, A (2013) Deliverable D1.3 for WP No 1, Task No 1.2, Technology inventory for eco-efficient water systems and use. Populated technology inventory (Version No.: Master Deliverable, November 2013)
[2] TOTO. (2013, July 05). Products. Retrieved from totousa: http://www.totousa.com/Products/Accessories.aspx
[3] American Standard (2013, November 29). Product Listing. Retrieved from: http://www.americanstandard-us.com/products/
[4] Kohler US (2013, November 29). Products. Retrieved from: http://www.us.kohler.com/us/Toilets-Styles-of-Toilets/category/429984/429204.htm?page=categoryLanding
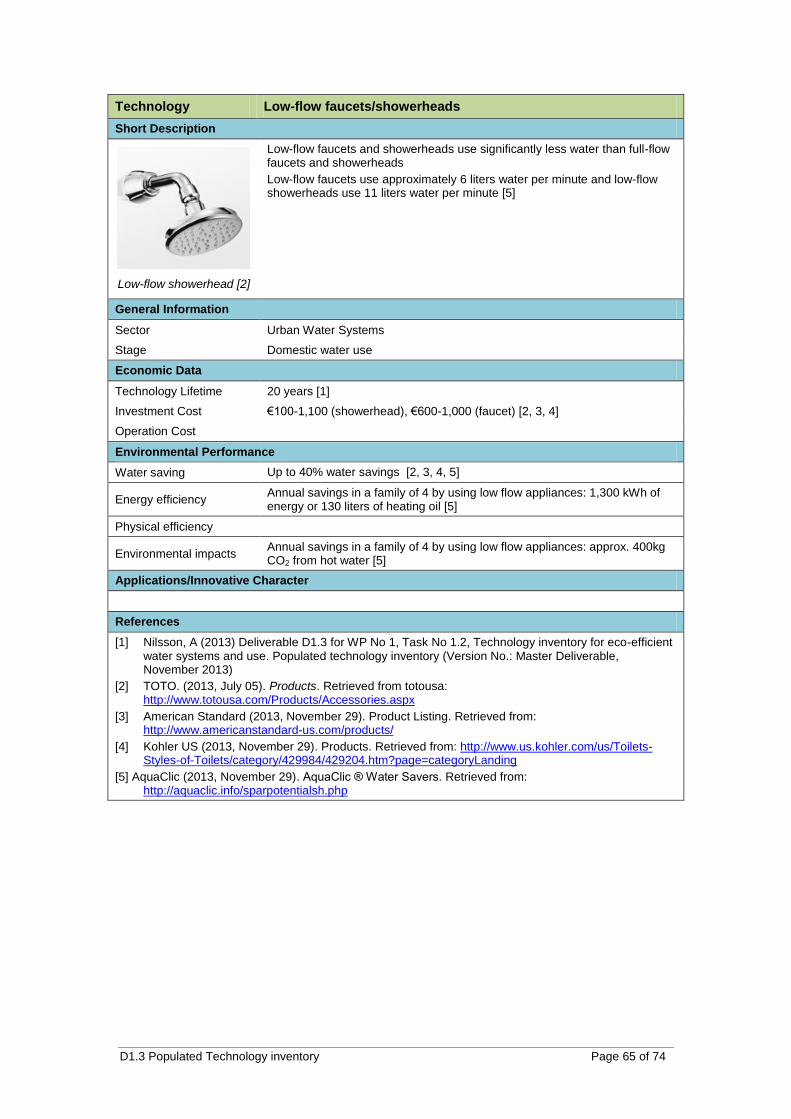
D1.3 Populated Technology inventory Page 65 of 74
Technology Low-flow faucets/showerheads
Short Description
Low-flow showerhead [2]
Low-flow faucets and showerheads use significantly less water than full-flow faucets and showerheads
Low-flow faucets use approximately 6 liters water per minute and low-flow showerheads use 11 liters water per minute [5]
General Information
Sector Urban Water Systems
Stage Domestic water use
Economic Data
Technology Lifetime 20 years [1]
Investment Cost €100-1,100 (showerhead), €600-1,000 (faucet) [2, 3, 4]
Operation Cost
Environmental Performance
Water saving Up to 40% water savings [2, 3, 4, 5]
Energy efficiency Annual savings in a family of 4 by using low flow appliances: 1,300 kWh of energy or 130 liters of heating oil [5]
Physical efficiency
Environmental impacts Annual savings in a family of 4 by using low flow appliances: approx. 400kg CO2 from hot water [5]
Applications/Innovative Character
References
[1] Nilsson, A (2013) Deliverable D1.3 for WP No 1, Task No 1.2, Technology inventory for eco-efficient water systems and use. Populated technology inventory (Version No.: Master Deliverable, November 2013)
[2] TOTO. (2013, July 05). Products. Retrieved from totousa: http://www.totousa.com/Products/Accessories.aspx
[3] American Standard (2013, November 29). Product Listing. Retrieved from: http://www.americanstandard-us.com/products/
[4] Kohler US (2013, November 29). Products. Retrieved from: http://www.us.kohler.com/us/Toilets-Styles-of-Toilets/category/429984/429204.htm?page=categoryLanding
[5] AquaClic (2013, November 29). AquaClic ® Water Savers. Retrieved from: http://aquaclic.info/sparpotentialsh.php
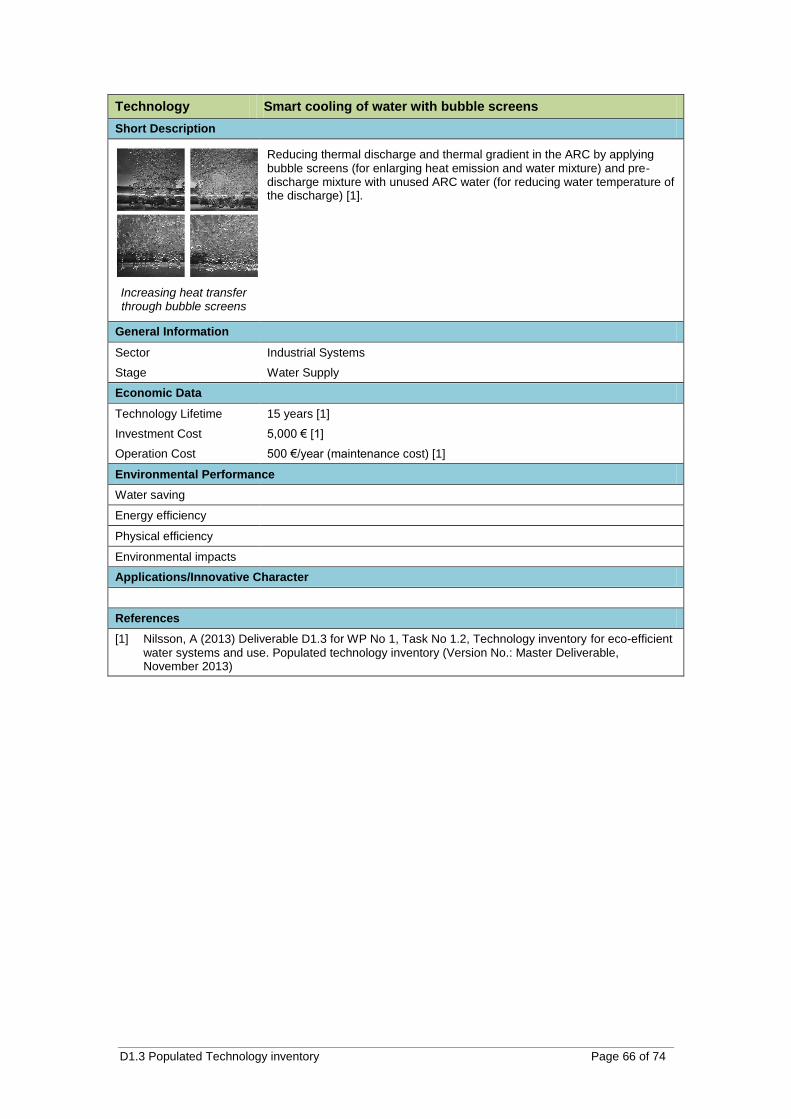
D1.3 Populated Technology inventory Page 66 of 74
Technology Smart cooling of water with bubble screens
Short Description
Increasing heat transfer through bubble screens
Reducing thermal discharge and thermal gradient in the ARC by applying bubble screens (for enlarging heat emission and water mixture) and pre-discharge mixture with unused ARC water (for reducing water temperature of the discharge) [1].
General Information
Sector Industrial Systems
Stage Water Supply
Economic Data
Technology Lifetime 15 years [1]
Investment Cost 5,000 € [1]
Operation Cost 500 €/year (maintenance cost) [1]
Environmental Performance
Water saving
Energy efficiency
Physical efficiency
Environmental impacts
Applications/Innovative Character
References
[1] Nilsson, A (2013) Deliverable D1.3 for WP No 1, Task No 1.2, Technology inventory for eco-efficient water systems and use. Populated technology inventory (Version No.: Master Deliverable, November 2013)
D1.3 Populated Technology inventory Page 67 of 74
Technology Adaptive ratio of electrical and thermal energy production
Short Description
Better matching energy demand and supply by adapting the ratio of Electrical and Thermal energy production [1].
General Information
Sector
Stage
Economic Data
Technology Lifetime 50 years [1]
Investment Cost 100,000 € [1]
Operation Cost
Environmental Performance
Water saving
Energy efficiency
Physical efficiency
Environmental impacts
Applications/Innovative Character
References
[1] Nilsson, A (2013) Deliverable D1.3 for WP No 1, Task No 1.2, Technology inventory for eco-efficient water systems and use. Populated technology inventory (Version No.: Master Deliverable, November 2013)

D1.3 Populated Technology inventory Page 68 of 74
Technology Condenser for recovery of water from spray tower exhaust air
Short Description
Recovery of water from spray towers and/or flue gas [1].
General Information
Sector Industrial Water Systems
Stage Water Use
Economic Data
Technology Lifetime
Investment Cost
Operation Cost
Environmental Performance
Water saving
Energy efficiency
Physical efficiency
Environmental impacts
Applications/Innovative Character
References
[1] Nilsson, A (2013) Deliverable D1.3 for WP No 1, Task No 1.2, Technology inventory for eco-efficient water systems and use. Populated technology inventory (Version No.: Master Deliverable, November 2013)
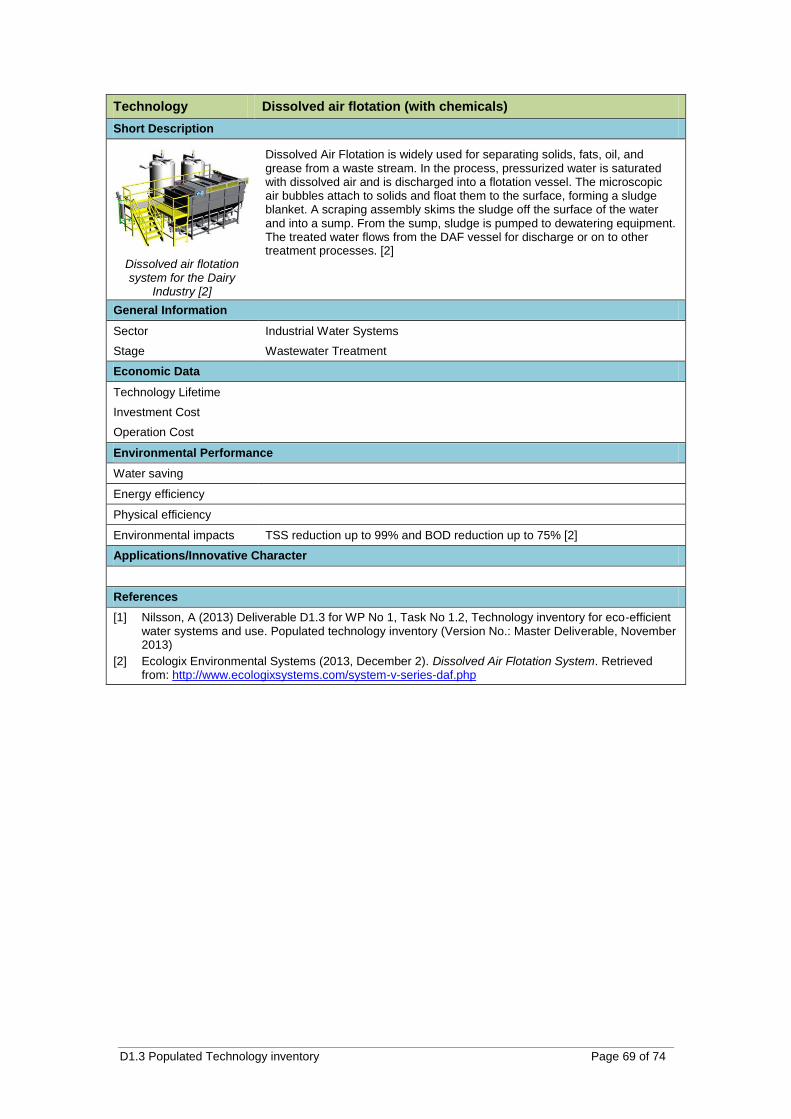
D1.3 Populated Technology inventory Page 69 of 74
Technology Dissolved air flotation (with chemicals)
Short Description
Dissolved air flotation system for the Dairy
Industry [2]
Dissolved Air Flotation is widely used for separating solids, fats, oil, and grease from a waste stream. In the process, pressurized water is saturated with dissolved air and is discharged into a flotation vessel. The microscopic air bubbles attach to solids and float them to the surface, forming a sludge blanket. A scraping assembly skims the sludge off the surface of the water and into a sump. From the sump, sludge is pumped to dewatering equipment. The treated water flows from the DAF vessel for discharge or on to other treatment processes. [2]
General Information
Sector Industrial Water Systems
Stage Wastewater Treatment
Economic Data
Technology Lifetime
Investment Cost
Operation Cost
Environmental Performance
Water saving
Energy efficiency
Physical efficiency
Environmental impacts TSS reduction up to 99% and BOD reduction up to 75% [2]
Applications/Innovative Character
References
[1] Nilsson, A (2013) Deliverable D1.3 for WP No 1, Task No 1.2, Technology inventory for eco-efficient water systems and use. Populated technology inventory (Version No.: Master Deliverable, November 2013)
[2] Ecologix Environmental Systems (2013, December 2). Dissolved Air Flotation System. Retrieved from: http://www.ecologixsystems.com/system-v-series-daf.php
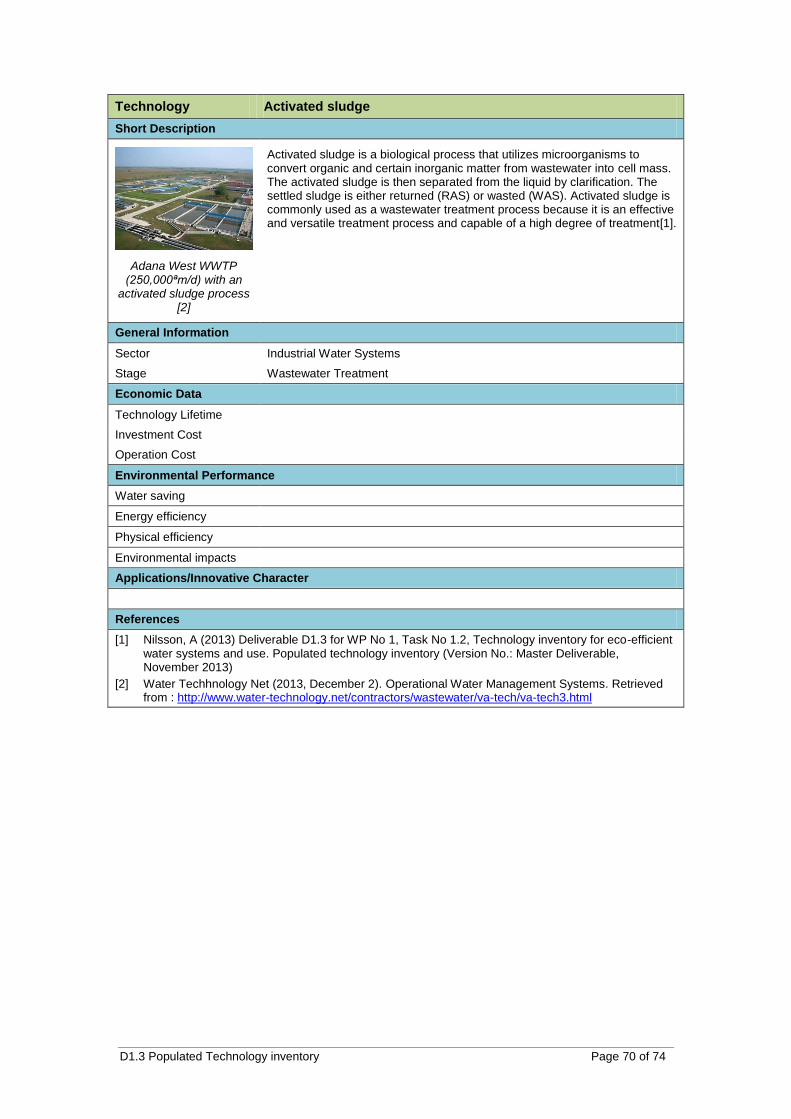
D1.3 Populated Technology inventory Page 70 of 74
Technology Activated sludge
Short Description
Adana West WWTP (250,000ªm/d) with an
activated sludge process [2]
Activated sludge is a biological process that utilizes microorganisms to convert organic and certain inorganic matter from wastewater into cell mass. The activated sludge is then separated from the liquid by clarification. The settled sludge is either returned (RAS) or wasted (WAS). Activated sludge is commonly used as a wastewater treatment process because it is an effective and versatile treatment process and capable of a high degree of treatment[1].
General Information
Sector Industrial Water Systems
Stage Wastewater Treatment
Economic Data
Technology Lifetime
Investment Cost
Operation Cost
Environmental Performance
Water saving
Energy efficiency
Physical efficiency
Environmental impacts
Applications/Innovative Character
References
[1] Nilsson, A (2013) Deliverable D1.3 for WP No 1, Task No 1.2, Technology inventory for eco-efficient water systems and use. Populated technology inventory (Version No.: Master Deliverable, November 2013)
[2] Water Techhnology Net (2013, December 2). Operational Water Management Systems. Retrieved from : http://www.water-technology.net/contractors/wastewater/va-tech/va-tech3.html
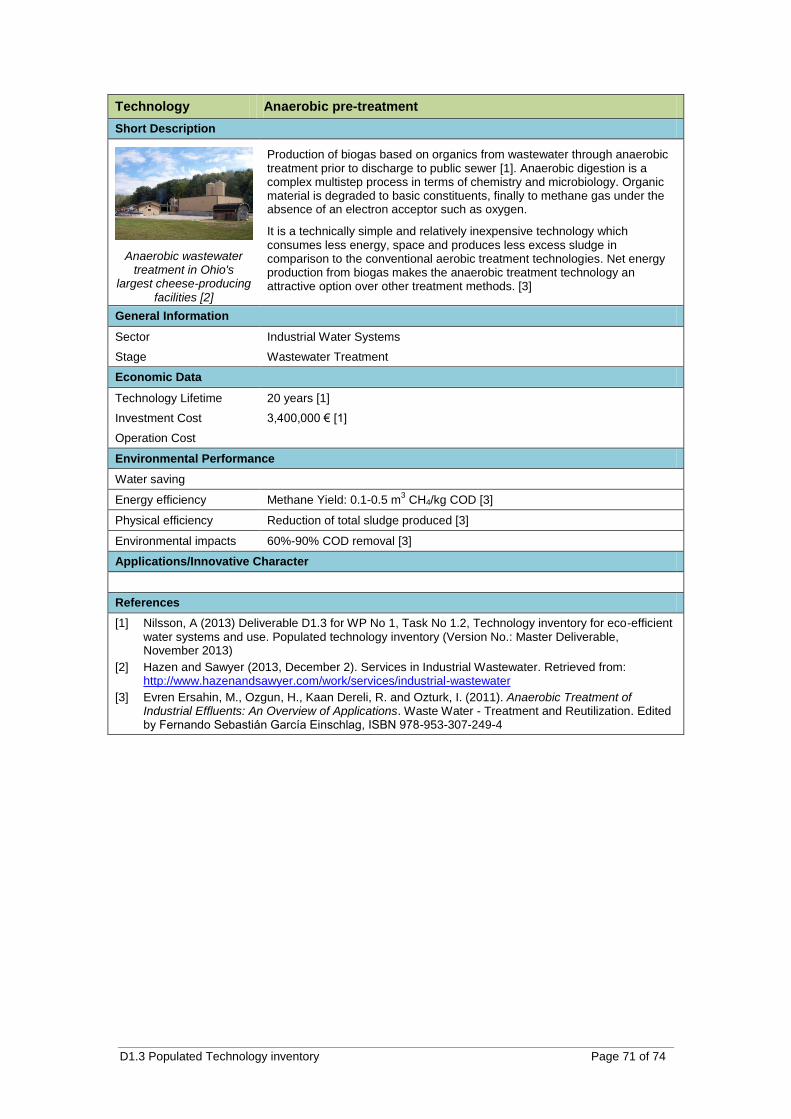
D1.3 Populated Technology inventory Page 71 of 74
Technology Anaerobic pre-treatment
Short Description
Anaerobic wastewater treatment in Ohio's
largest cheese-producing facilities [2]
Production of biogas based on organics from wastewater through anaerobic treatment prior to discharge to public sewer [1]. Anaerobic digestion is a complex multistep process in terms of chemistry and microbiology. Organic material is degraded to basic constituents, finally to methane gas under the absence of an electron acceptor such as oxygen.
It is a technically simple and relatively inexpensive technology which consumes less energy, space and produces less excess sludge in comparison to the conventional aerobic treatment technologies. Net energy production from biogas makes the anaerobic treatment technology an attractive option over other treatment methods. [3]
General Information
Sector Industrial Water Systems
Stage Wastewater Treatment
Economic Data
Technology Lifetime 20 years [1]
Investment Cost 3,400,000 € [1]
Operation Cost
Environmental Performance
Water saving
Energy efficiency Methane Yield: 0.1-0.5 m3 CH4/kg COD [3]
Physical efficiency Reduction of total sludge produced [3]
Environmental impacts 60%-90% COD removal [3]
Applications/Innovative Character
References
[1] Nilsson, A (2013) Deliverable D1.3 for WP No 1, Task No 1.2, Technology inventory for eco-efficient water systems and use. Populated technology inventory (Version No.: Master Deliverable, November 2013)
[2] Hazen and Sawyer (2013, December 2). Services in Industrial Wastewater. Retrieved from: http://www.hazenandsawyer.com/work/services/industrial-wastewater
[3] Evren Ersahin, M., Ozgun, H., Kaan Dereli, R. and Ozturk, I. (2011). Anaerobic Treatment of Industrial Effluents: An Overview of Applications. Waste Water - Treatment and Reutilization. Edited by Fernando Sebastián García Einschlag, ISBN 978-953-307-249-4

D1.3 Populated Technology inventory Page 72 of 74
Technology Membrane distillation for incoming water
Short Description
Membrane distillation system [2}
Membrane distillation (MD) is a process for production of very clean water [1]. It is a thermal, membrane-based separation process. The driving force for the MD processes is quite different from other membrane processes, being the vapor pressure difference across the membrane rather than an applied absolute pressure difference, a concentration gradient or an electrical potential gradient, which drives mass transfer through a membrane [3].
General Information
Sector Industrial Water Systems
Stage Water Treatment
Economic Data
Technology Lifetime
Investment Cost 180,000 € for 3,5m3/day (pilot equipment) [1]
Operation Cost
Environmental Performance
Water saving
Energy efficiency Increased energy consumption [3]
Physical efficiency High quality of water produced (particularly if purified water is required as boiler feed) [3]
Environmental impacts
Applications/Innovative Character
References
[1] Nilsson, A (2013) Deliverable D1.3 for WP No 1, Task No 1.2, Technology inventory for eco-efficient water systems and use. Populated technology inventory (Version No.: Master Deliverable, November 2013)
[2] KTH (2013, December 1). The membrane distillation technology at Hammarby Sjöstadsverket in Sweden. Retrieved from http://www.kth.se/en/aktuellt/nyheter/tekniken-som-renar-avloppsvatten-fran-lakemedel-1.370072
[3] Camacho, L.M., Dumée, L., Zhang, J., Li, J., Duke, M., Gomez, J., and Gray, S., (2013). Advances in Membrane Distillation for Water Desalination and Purification Applications. Water (5), pp. 94-196; doi:10.3390/w5010094
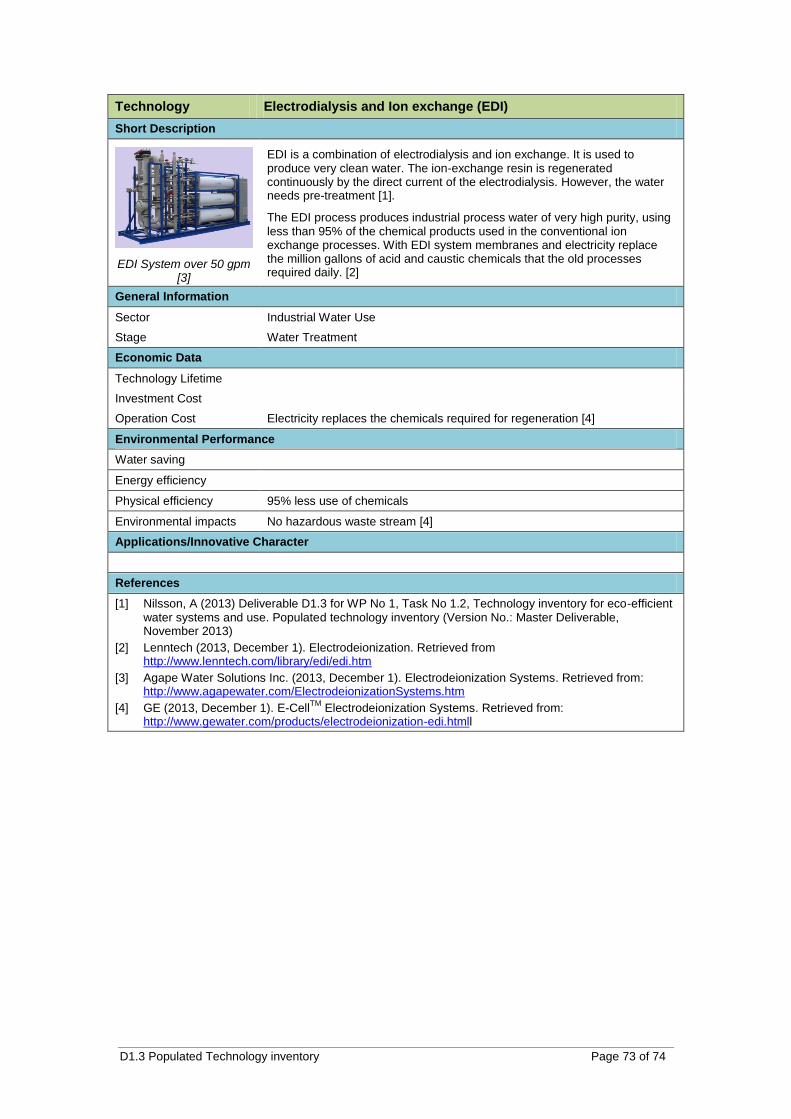
D1.3 Populated Technology inventory Page 73 of 74
Technology Electrodialysis and Ion exchange (EDI)
Short Description
EDI System over 50 gpm [3]
EDI is a combination of electrodialysis and ion exchange. It is used to produce very clean water. The ion-exchange resin is regenerated continuously by the direct current of the electrodialysis. However, the water needs pre-treatment [1].
The EDI process produces industrial process water of very high purity, using less than 95% of the chemical products used in the conventional ion exchange processes. With EDI system membranes and electricity replace the million gallons of acid and caustic chemicals that the old processes required daily. [2]
General Information
Sector Industrial Water Use
Stage Water Treatment
Economic Data
Technology Lifetime
Investment Cost
Operation Cost Electricity replaces the chemicals required for regeneration [4]
Environmental Performance
Water saving
Energy efficiency
Physical efficiency 95% less use of chemicals
Environmental impacts No hazardous waste stream [4]
Applications/Innovative Character
References
[1] Nilsson, A (2013) Deliverable D1.3 for WP No 1, Task No 1.2, Technology inventory for eco-efficient water systems and use. Populated technology inventory (Version No.: Master Deliverable, November 2013)
[2] Lenntech (2013, December 1). Electrodeionization. Retrieved from http://www.lenntech.com/library/edi/edi.htm
[3] Agape Water Solutions Inc. (2013, December 1). Electrodeionization Systems. Retrieved from: http://www.agapewater.com/ElectrodeionizationSystems.htm
[4] GE (2013, December 1). E-CellTM
Electrodeionization Systems. Retrieved from: http://www.gewater.com/products/electrodeionization-edi.htmll
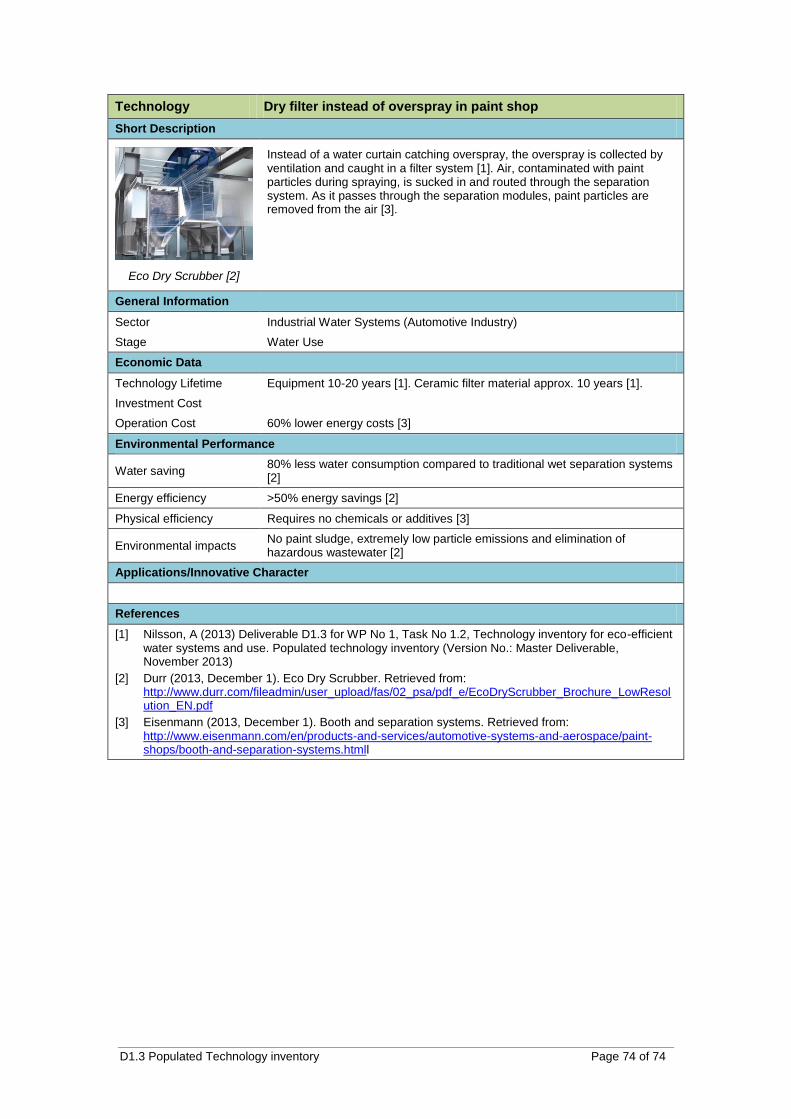
D1.3 Populated Technology inventory Page 74 of 74
Technology Dry filter instead of overspray in paint shop
Short Description
Eco Dry Scrubber [2]
Instead of a water curtain catching overspray, the overspray is collected by ventilation and caught in a filter system [1]. Air, contaminated with paint particles during spraying, is sucked in and routed through the separation system. As it passes through the separation modules, paint particles are removed from the air [3].
General Information
Sector Industrial Water Systems (Automotive Industry)
Stage Water Use
Economic Data
Technology Lifetime Equipment 10-20 years [1]. Ceramic filter material approx. 10 years [1].
Investment Cost
Operation Cost 60% lower energy costs [3]
Environmental Performance
Water saving 80% less water consumption compared to traditional wet separation systems [2]
Energy efficiency >50% energy savings [2]
Physical efficiency Requires no chemicals or additives [3]
Environmental impacts No paint sludge, extremely low particle emissions and elimination of hazardous wastewater [2]
Applications/Innovative Character
References
[1] Nilsson, A (2013) Deliverable D1.3 for WP No 1, Task No 1.2, Technology inventory for eco-efficient water systems and use. Populated technology inventory (Version No.: Master Deliverable, November 2013)
[2] Durr (2013, December 1). Eco Dry Scrubber. Retrieved from: http://www.durr.com/fileadmin/user_upload/fas/02_psa/pdf_e/EcoDryScrubber_Brochure_LowResolution_EN.pdf
[3] Eisenmann (2013, December 1). Booth and separation systems. Retrieved from: http://www.eisenmann.com/en/products-and-services/automotive-systems-and-aerospace/paint-shops/booth-and-separation-systems.htmll