
Cognitive Evaluation of Potential Approaches to Increase ...
151
Cognitive Evaluation of Potential Approaches to Increase the Efficiency of Air Traffic Controller Training and Staffing by Annie Cho A thesis presented to the University of Waterloo in fulfillment of the thesis requirement for the degree of Master of Applied Science in Systems Design Engineering Waterloo, Ontario, Canada, 2012 © Annie Cho 2012
Transcript of Cognitive Evaluation of Potential Approaches to Increase ...

Cognitive Evaluation of Potential
Approaches to Increase the Efficiency of
Air Traffic Controller Training and
Staffing
by
Annie Cho
A thesis
presented to the University of Waterloo
in fulfillment of the
thesis requirement for the degree of
Master of Applied Science
in
Systems Design Engineering
Waterloo, Ontario, Canada, 2012
© Annie Cho 2012

ii
AUTHOR'S DECLARATION
I hereby declare that I am the sole author of this thesis. This is a true copy of the thesis,
including any required final revisions, as accepted by my examiners.
I understand that my thesis may be made electronically available to the public.

iii
Abstract
Generic airspace, or air traffic control sectors with similar operational characteristics, is an
operational concept being proposed as a means of increasing staffing flexibility and reducing
training times as part of the Federal Aviation Administration’s (FAA’s) Next Generation
(NextGen) air traffic control (ATC) modernization efforts. A key need for implementing generic
airspace is identifying groups of similar sectors with respect to training required for controllers
to make transitions between those sectors. Through the development and validation process of
the studies performed in this thesis, a structure-based classification scheme was found to be an
effective way to classify sectors in order to support a minimal differences training approach to
generic airspace. The resulting classes of sectors are expected to have fewer transition barriers
and support increased staffing flexibility.
In order to assess similarities of airspace sectors, factors affecting how easily a controller
makes a transition from one sector to another were identified using semi-structured interviews
with experienced air traffic controllers. The most important factors appear to reflect familiarity
with types of operations and common traffic patterns, providing a basis for classifying groups of
sectors. The controllers identified some techniques that are easily transferable as well. Some
factors that are very specific to transitions were identified as well, such as “Knowing the
Neighbor Sectors” and “Coastal Area” factors.
Based on the most important factors, traffic patterns in 404 high-altitude National Airspace
System (NAS) sectors were examined for common traffic patterns. These traffic patterns were
used as the basis for two classification approaches, a holistic classification approach and a
decompositional classification approach. These approaches are used to classify current air
traffic control sectors into classes with common structural characteristics. The results identify

iv
existing sectors with near-term potential as being generic sectors that support a minimal
differences training approach to generic airspace. Further analysis with the sector classification
results identified that the number of factors incorporated in the classification methods are
directly associated with the method's effectiveness.
In order to examine the validity of the developed classification methods and to assess the
relative importance of the factors involving transitions identified by the interviews, an online
survey was conducted with 56 air traffic controllers. The results indicated that the classification
methods developed support controllers' perception of airspace similarities. Some qualitative
data gained from the survey provides an insightful aspect for future steps continuing this study
such as additional important factors to be considered. Some of these factors are considered as
part of the classification schemes developed in this thesis while some are yet to be incorporated.
Some of these additional factors were found to be more feasible to be incorporated into future
classification schemes than other factors.

v
Acknowledgements
I thank everyone who helped bringing this thesis to completion.
Professor Jonathan Histon, I offer my sincerest gratitude to you for always being
supportive and believing in me throughout my Masters research with your guidance and
knowledge. Your mentorship helped me to become a researcher I am today. I simply could not
have asked for a better supervisor. Thank you.
Anton Koros (FAA), Richard Mogford (NASA), Wayne Bridges (NASA), Paul Lee (NASA),
Steven Kennedy (MITRE), Peter Hruz (MITRE), and Emilio Albuquerque (MIT), thank you for
your intellectual feedback and collaboration on my research. Without your support and
guidance, this thesis could not have been completed.
Air traffic controllers who participated in my studies, I am sincerely grateful for your
generous support. Because of your participation and support, I was able to complete the studies
for this thesis.
Professor Rob Duimering and Professor Steven Waslander, thank you for being the readers
of my thesis. Your comments and guidance were essential in completing this thesis.
Professor Catherine Burns and Professor Stacey Scott, thank you for introducing me to the
Human Factors field and your encouragement throughout my Masters program.
My colleagues in the HCOM, CSL, and AIDL, thank you for your support, motivation, and
friendship throughout the process of completing this thesis.
I gratefully acknowledge the FAA for funding this research through FAA Grant 06-G-006.

vi
Dedication
To my dearest family Dad, Mom, Eura, Jona, and Jon:
I dedicate this thesis to you.
Without your love and support,
I would not be who I am today. Love you.

vii
Table of Contents
AUTHOR'S DECLARATION ........................................................................................................................................... ii
Abstract ............................................................................................................................................................................... iii
Acknowledgements .......................................................................................................................................................... v
Dedication .......................................................................................................................................................................... vi
Table of Contents ........................................................................................................................................................... vii
List of Figures ..................................................................................................................................................................... x
List of Tables ................................................................................................................................................................... xiii
List of Acronyms ........................................................................................................................................................... xiv
Chapter 1 Introduction .................................................................................................................................................. 1
1.1 The ATC Training Challenge ........................................................................................................................... 1
1.2 Generic Airspace .................................................................................................................................................. 4
1.3 Research Objectives ........................................................................................................................................... 7
1.4 Thesis Organization ............................................................................................................................................ 9
Chapter 2 Background ................................................................................................................................................. 12
2.1 ATC Training........................................................................................................................................................ 12
2.2 Generic Airspace Concept .............................................................................................................................. 16
2.3 ATC Complexity Factors and Metrics ........................................................................................................ 20
2.4 Chapter Summary ............................................................................................................................................. 24
Chapter 3 Controllers’ Identification of Factors Affecting Sector Transitions ..................................... 25
3.1 Method ................................................................................................................................................................... 26

viii
3.2 Results .................................................................................................................................................................... 28
3.3 Discussion ............................................................................................................................................................. 39
3.4 Chapter Summary ............................................................................................................................................. 41
Chapter 4 Classifying Sectors Based on Traffic Patterns............................................................................... 43
4.1 Traffic Patterns as the Basis of a Classification Approach ................................................................ 44
4.2 Commonly Occurring Traffic Patterns ...................................................................................................... 45
4.3 Holistic Classification ....................................................................................................................................... 52
4.4 Decompositional Classification .................................................................................................................... 61
4.5 Chapter Summary ............................................................................................................................................. 74
Chapter 5 Validating Perceptions of Airspace Similarity through Subject-Matter-Experts ........... 76
5.1 Survey Design ..................................................................................................................................................... 77
5.2 Survey Procedure .............................................................................................................................................. 86
5.3 Results .................................................................................................................................................................... 89
5.4 Discussion ............................................................................................................................................................. 98
5.5 Chapter Summary .......................................................................................................................................... 106
Chapter 6 Validating the Identified Factors Affecting Sector Transitions .......................................... 109
6.1 Survey Design .................................................................................................................................................. 109
6.2 Survey Procedure ........................................................................................................................................... 112
6.3 Results ................................................................................................................................................................. 112
6.4 Discussion .......................................................................................................................................................... 119
6.5 Chapter Summary .......................................................................................................................................... 122
Chapter 7 Conclusions .............................................................................................................................................. 123
7.1 Research Objectives and Key Findings .................................................................................................. 123
7.2 Summary ............................................................................................................................................................ 125

ix
7.3 Recommendations and Future Work ..................................................................................................... 126
References ..................................................................................................................................................................... 128
Appendix A Sector Grouping Results based on Holistic Classification ................................................. 132
Appendix B Sector Grouping Results based on Decompositional Classification .............................. 134
Appendix C Sector Selection for Survey in Chapter 5 .................................................................................. 136

x
List of Figures
Figure 1-1. Areas of Specialization (AOSs) with High Altitude Sectors in North-East Centers ....... 2
Figure 1-2. Four ARTCCs in North-East United States ..................................................................................... 2
Figure 1-3. Overview of current en route training process (Histon, 2008) ............................................ 3
Figure 1-4. Illustration of some interchangeable knowledge, skills, and abilities (KSA) between
two sectors (the red arrows indicate interchangeable KSA) ......................................................................... 6
Figure 1-5. Knowledge of items required for different altitude levels of airspaces (from Histon
and Bhagat, 2010, adapted from Levin, 2007) .................................................................................................... 7
Figure 1-6. The research goal narrowed down from the problem statement ........................................ 8
Figure 3-1. Identified common factors affecting sector transitions ......................................................... 29
Figure 3-2. Illustration of “knowing neighbor sectors” factor .................................................................... 33
Figure 3-3a. Critical point due to aircraft trajectory changes (Histon, 2008) ...................................... 34
Figure 4-1. Example of a radar track map used ................................................................................................ 46
Figure 4-2. Standard flow (with the red arrow indicating the directionality of the sector) .......... 47
Figure 4-3. Critical points identified by red circles ......................................................................................... 48
Figure 4-4. An example sector with a crossing flow ....................................................................................... 49
Figure 4-5. An example sector with a merging/splitting flow .................................................................... 49
Figure 4-6. An example sector with a star-crossing flow .............................................................................. 50
Figure 4-7. Flow trajectory change points .......................................................................................................... 50
Figure 4-8. Vertical handoffs ..................................................................................................................................... 51
Figure 4-9a. Race track maneuver pattern ......................................................................................................... 52
Figure 4-10. An example of flow concentration difference .......................................................................... 54
Figure 4-11. An example of background traffic difference ........................................................................... 54
Figure 4-12. Example radar traffic maps for two classes .............................................................................. 56

xi
Figure 4-13. The elemental structural features for the decompositional classification .................. 62
Figure 4-14. A sector with three structural features and the notional algebra for the sector ...... 63
Figure 4-15. The distribution of frequency of standard flows appearing in a sector ........................ 65
Figure 4-16. The distribution of frequencies of crosses, merges, and trajectory change points
appearing in a sector .................................................................................................................................................... 65
Figure 4-17. Frequency of sectors with either crosses or merges ............................................................ 66
Figure 4-18. The distribution of frequencies of vertical handoffs and holding patterns appearing
in a sector .......................................................................................................................................................................... 67
Figure 4-19. The distribution of two structural features in 75 sectors................................................... 69
Figure 4-20. A Possible Way of Combining Clusters into Classes .............................................................. 70
Figure 4-21. Frequency of Resulting Unique Classes Depending on the Number of Elements
Used (Dimension Level numbers indicates the number of elements)..................................................... 72
Figure 4-22. The Proportion of Classes with One Sector or More than One Sector ........................... 73
Figure 5-1. Two Chosen Classes (dotted boxes) for the Methodological Check .................................. 80
Figure 5-2. Classes (solid boxes) used for Flow Concentration comparison (dotted boxes) on left
and Background Traffic Level comparison on right ......................................................................................... 81
Figure 5-3. Testing factor Methodology – Sectors Selection........................................................................ 83
Figure 5-4. An Example of Pair-Wise Similarity Comparison ..................................................................... 84
Figure 5-5. A Sample Question for Survey - Part I ........................................................................................... 85
Figure 5-6. Distribution of Years of Experience ................................................................................................ 88
Figure 5-7. Response Rate with their Confidence Intervals ........................................................................ 92
Figure 5-8. The Response Rate Results for Survey .......................................................................................... 93
Figure 5-9. Sectors for Individual Case #121 ..................................................................................................... 95
Figure 5-10. Sectors for Individual Case #311 .................................................................................................. 96
Figure 5-11. Sectors for Individual Case #212 .................................................................................................. 97
Figure 5-12.Sectors for Individual Case #612 ................................................................................................... 98

xii
Figure 5-13. Non-significant Testing Factor #6 – Merge/Split flow class vs. Fanning flow class 99
Figure 5-14. The modified holistic classification method .......................................................................... 100
Figure 5-15. Examples of very “difficult” sectors .......................................................................................... 102
Figure 5-16. An example of two different locations of critical points ................................................... 103
Figure 5-17. An example sector with a holding pattern ............................................................................. 104
Figure 5-18. An example of two sectors with very different area and shape .................................... 106
Figure 6-1. The Process of Calculating Friedman Mean Ranks ................................................................ 114
Figure 6-2. Mean Ranks for 10 Key Factors (square brackets representing comparisons used in
follow up analysis, square bracket with an asterisk indicates significant difference) .................. 115
Figure 6-3. Friedman Mean Ranks for 10 Key Factors (shades indicate significantly distinct
classes) ............................................................................................................................................................................ 117
Figure 6-4a. Mean Ranks comparison between US controllers vs. Non-US controllers, ............... 118

xiii
List of Tables
Table 3-1: List of interview questions probing relevant operational factors in transitions .......... 26
Table 3-2. List of interview questions probing relevant cultural factors in transitions .................. 27
Table 3-3: List of factors identified by controllers .......................................................................................... 29
Table 4-1. Eight Identified Commonly Occurring Traffic Patterns ........................................................... 46
Table 4-2. Visual and Canonical Guide for the Holistic Classification Scheme ..................................... 55
Table 4-3. Example sectors with multiple structural features ................................................................... 57
Table 4-4. The frequency result of sectors in the Holistic Classification Scheme ............................... 59
Table 4-5. The List of Dimension Levels .............................................................................................................. 71
Table 5-1. The 15 classes tested (highlighted with red box) for their validity in the survey ........ 78
Table 5-2. Six Testing Factors Chosen for the Survey .................................................................................... 79
Table 5-3. Assumptions Statement for Questions for Survey – Part I ...................................................... 86
Table 5-4. Nationality of the Participants ............................................................................................................ 88
Table 5-5. Level of Experience of the Participants .......................................................................................... 88
Table 5-6. The Response Rate Results for Survey ............................................................................................ 90
Table 5-7. Statistical Significance Test Results ................................................................................................. 92
Table 5-8. Follow-up Observations ........................................................................................................................ 94
Table 6-1. List of 10 factors validated for their relative importance in survey – Part II ............... 110
Table 6-2. List of Questions Asked for Survey – Part II ............................................................................... 111
Table 6-3. The Likert Scale Used for Participants to Rate Questions in Survey – Part II .............. 112
Table 6-4. Basic Statistical Measures of the 10 Factors .............................................................................. 113

xiv
List of Acronyms
ARTCC – Air Route Traffic Control Center (“Center”)
ATC – Air Traffic Controller
CPC – Certified Professional Controller
FAA – Federal Aviation Administration
KSA – Knowledge, Skills, and Abilities
MOA – Military Operations Area
NAS – National Airspace System
OJT– On-the-Job Training
SUA – Special Use Area

1
Chapter 1
Introduction
Air traffic control is a challenging profession involving many complicated time-critical and life-
critical tasks and operations. Current training protocols require extensive amounts of training,
sometimes requiring up to or more than three years of training before a controller becomes
fully qualified. Lengthy retraining is also required when controllers move and control new
pieces of airspace. This causes significant staffing inflexibility and makes it challenging for the
air traffic control management to respond to staffing shortfalls due to spikes in retirement rates,
sickness, or changes in demand for ATC services.
Currently new operational concepts are being developed to address these challenges. The
generic airspace concept is an example of such concepts and is described further below in this
chapter and in Chapter 2. This thesis examines ways to support generic airspace concept by
identifying classes of existing airspaces that a controller can move with easier mobility than the
current ATC system.
1.1 The ATC Training Challenge
In order to understand the training challenge, the following section briefly describes the current
controller training qualification standards and the retraining process.
An airspace, or often referred to as a sector, is a three dimensional zone within controlled
airspace in which aircraft are under the control of a specific air traffic controller. Figure 1-1
shows a two-dimensional map of North-East airspaces and each sector is marked with thin
black borders. A few of these sectors, usually ranging from six to ten are administratively

2
grouped together into Areas of Specialization (AOS), or often referred to as “areas”. These areas
are indicated in Figure 1-1 marked with adjacent same colors (e.g., the three red sectors in the
top right corner belong in the same “area”).
Figure 1-1. Areas of Specialization (AOSs)
with High Altitude Sectors in North-East
Centers
(adapted from Histon, 2008)
Figure 1-2. Four ARTCCs in North-East
United States
Several areas are then further organized into a facility called an Area Control Center (ACC),
often referred to as a “center” or an Air Route Traffic Control Center (ARTCC) in the United
States. A map of four centers (ZOB – Cleveland, ZBW – Boston, ZNY – New York, and ZDC –
Washington) in the North-East United States is shown in both Figure 1-1 and Figure 1-2, where
each center is marked with thick black boundaries.
In the current National Airspace System (NAS) air traffic control (ATC) system, the typical
Certified Professional Controller (CPC) will maintain qualification on only within one area of
specialization that is composed of a limited number of sectors typically ranging from six to ten
sectors (Histon et al., 2008). A fully licensed controller can move between such sectors on a
shift without additional training. However, transferring a controller to a new area of
specialization (e.g. one color to another in Figure 1-1) requires significant retraining time and

3
effort, usually varying from a few months to a few years. The next paragraph explains why it
takes this much time for a controller to move from one area to another.
Figure 1-3. Overview of current en route training process (Histon, 2008)
Figure 1-3 shows the overview of current en route training process a student must go
through to become a Certified Professional Controller (CPC) in the Federal Aviation
Administration (FAA). While most knowledge learned in Stage I (as indicated in Figure 1-3), the
academic training part, is transferable between all airspaces within NAS, in contrast, Stages II,
III, and IV, the facility training part, vary across different areas of specialization. This is because
the facility training part requires significant amount of local-specific knowledge and a variety
controlling technique details specific to the particular volume of airspaces. For this reason,
when a certified controller, who already went through the standard en route training process,
moves to another area of specialization, the controller must go through additional facility
training specific to the new area. This process is usually called “retraining” or “cross-training”
and takes a few months to a few years.
Consequently, staffing flexibility is limited and it is difficult and costly for any air navigation
service provider that uses such a system of qualifications, such as the Federal Aviation

4
Administration (FAA), to respond to different variations in staffing demands. There are several
ways of dealing with this problem including operational changes such as increasing staffing
flexibility, reducing training times, lowering training costs, and/or more effectively utilizing
training resources. One of the operational concepts currently being developed by FAA to
address this challenge is the generic airspace concept. For purpose of this thesis, the generic
airspace concept was chosen for examination in addressing this problem.
1.2 Generic Airspace
Developing generic airspace, or sectors with standardized and common operational
characteristics, is a possible means to address the challenge stated above and one of the
methods being considered as part of efforts to modernize the ATC system (FAA, 2004). Generic
airspace, or sectors with standardized and common operational characteristics, will allow
controllers to work a sector with less training. This will allow flexible allocation of human
resources based on system need, less constrained by operator knowledge limitations (Mogford,
2010). The greater the standardization, or more similar the sectors, the greater the flexibility to
the air traffic control service provider; however, this comes at the cost of locally adapted sector-
specific procedures and operations that provide locally tailored and more efficient operations.
Other previous and on-going generic airspace projects include enhanced information
visualization such as the Controller Information Tool (CIT), new high-altitude airspace concepts
such as the Dynamic Airspace Super Sectors (DASSs). More information on these various
generic airspace approaches is further discussed in Chapter 2. While there are various
approaches to enable the generic airspace concept, this thesis focuses on one specific approach
to the generic airspace concept, the minimal differences training approach. This approach is
described further in the next section.

5
1.2.1 Minimal Differences Training Approach
In a minimal differences training approach, classes of sectors are identified that could be made
similar, but not necessarily identical. Controllers would receive short, targeted, training on the
relevant differences between the generic sectors in a particular class. In this approach, a
qualified controller would be able to easily move between the sectors within the class. Such a
system would provide greater flexibility and standardization in the ATC system. The classes
supporting this minimal differences approach to training would be composed of similar sectors
that maximize knowledge, skills, and abilities (KSA) transfer when retraining for the new sector
occurs. Maximum knowledge transfer occurs when the knowledge from the old sector can be
maximized when learning a new sector, which results in reduced retraining time and effort.
Each sector requires different amount and types of KSAs for a controller to be able to control.
This thesis supports identifying groups of sectors that share interchangeable KSAs to enable the
minimal differences training approach. Figure 1-4, illustrates an example scenario of two
sectors having some interchangeable knowledge, skills, and abilities (indicated by the arrows).

6
Figure 1-4. Illustration of some interchangeable knowledge, skills, and abilities (KSA)
between two sectors (the red arrows indicate interchangeable KSA)
In order to support in identifying such groups of sectors, this thesis focuses the analysis on
high altitude sectors of National Airspace System (NAS) as the initial step of the minimal
differences training approach.
1.2.2 High Altitude Sectors
The thesis focuses research on NAS-wide analysis of the similarity of existing high-altitude
sectors. MITRE has identified through analysis that high altitude airspace has the least number
of airspace knowledge items (Levin, 2007) as shown in Figure 1-5. The figure illustrates the
knowledge of items on the x-axis and different altitude level of airspaces in the y-axis.
Knowledge“K1”“K5”“K8”
Sector 1 Sector 2
Skills“S2”“S4”“S3”
Abilities“A3”“A7”“A9”
Knowledge“K4”“K1”“K6”
Skills“S1”“S5”“S3”
Abilities“A9”“A4”“A7”

7
Figure 1-5. Knowledge of items required for different altitude levels of airspaces (from
Histon and Bhagat, 2010, adapted from Levin, 2007)
The lack of symmetry and chaotic nature of airspaces tends to be maximum at the ground
level and as the higher the airspace is at, the effects of localized features begins to decline and
there is less variance in the characteristics of the airspaces. As a result, the “knowledge”
required to control higher level airspaces is more limited as shown by the knowledge pyramid
in Figure 1-5. As such, when attempting to classify these airspaces into classes with the goal of
minimal differences in training, high-altitude airspace are an attractive candidate for the initial
investigation.
1.3 Research Objectives
The theme of this thesis, can be described by the following research question:
How can we identify groups of airspace sectors that will have fewer barriers to the
transition of controllers between different sectors (in order to support minimal differences
training approach)?

8
As illustrated in Figure 1-6, the thesis goal is arrived from various levels of research
problem. First, there is the ATC operation challenge due to the lengthy retraining process in
ATC environment. Generic Airspace concept is one way to address this research problem. The
minimal differences training approach is one generic airspace concept that could be
implemented in both short and medium term time frames. The thesis goal, as stated above, is to
support the evaluation of the minimal differences training approach by identifying ways to
classify airspace sectors that are expected to have fewer transition barriers for controllers.
Figure 1-6. The research goal narrowed down from the problem statement
To answer the research question stated above, three specific objectives are identified and
described below. In order to identify groups of sectors that minimize transition times, first,
what it means for two or more sectors to be similar must be defined. To do this, key factors that
contribute to the similarities of sectors and are relevant in transition training must be identified.
Therefore, the first objective of this thesis is as follows:
The ATC Training Challenge –Lengthy Retraining
Generic Airspace Concept
Minimal Differences Training Approach
Classification Methods The thesis goal

9
Objective 1 – Identify key factors that affect the transferability of a controller’s existing
knowledge skills and abilities to a new airspace sector.
Based on a few of the most important factors identified through achieving Objective 1, a
method of identifying groups of sectors that support minimal differences training can be
developed. As such, the next objective of the thesis is as follows:
Objective 2 – Develop a method, based on a few of the most important factors identified from
Objective 1, for determining classes of sectors expected to have fewer transition barriers.
Sample groups of sectors hypothesized to support minimal differences training will be
suggested by the initial attempt of grouping sectors using the developed method. Then, the
developed method can be evaluated for its relevance in supporting minimal differences training
using an online survey through subject-matter-experts. In this validation process, the identified
factors from Objective 1 will be verified and measured of their relative importance across a
broader group of participants as well. Therefore, the final objective of this thesis is as stated
below:
Objective 3 – Evaluate the developed classification method and validate the key factors
identified in Objective 1 through subject-matter-experts.
According to the evaluation of the developed classification, appropriate next steps required
to refine the classification method will be suggested as part of future work.
1.4 Thesis Organization
The remainder of the thesis is organized as follows:

10
Chapter 2: Background contains a review of research related to generic airspace
concept and previous work on training and classification associated with ATC
operations.
Chapter 3: Controllers’ Identification of Factors Affecting Sector Transitions
presents the method and the result of interviews that were conducted with ten air
traffic controllers. The chapter reports the factors affecting the learnability of a
controller when making a transition from one sector to another. These factors are
reported by subject-matter-experts through the interviews. Objective 1 of this thesis
will be achieved through this chapter.
Chapter 4: Classifying Sectors Based on Traffic Patterns describes the analysis
process used to develop two airspace sector classification methods and discusses the
implications of these classification methods. Objective 2 of this thesis will be achieved
through this chapter.
Chapter 5: Validating Perceptions of Airspace Similarity through Subject-Matter-
Experts describes the online-survey study conducted to validate the classification
method developed. This chapter also examines the results of the evaluation process and
discusses some additional insights provided by these results. Part of Objective 3 of this
thesis will be achieved through this chapter.
Chapter 6: Validating the Identified Factors Affecting Sector Transitions describes
the online-survey study conducted to assess the relative importance of the factors
involving transitions identified from Chapter 3. This chapter discusses the results of the

11
process and discusses some additional insights provided by these results. The rest of
Objective 3 of this thesis will be achieved through this chapter.
Chapter 7: Conclusions summarizes the findings of this thesis and proposes areas for
further research.

12
Chapter 2
Background
This chapter provides a review of previous research work relevant in determining which
classes of sectors can be expected to have fewer transition barriers. Work was reviewed from
the research areas of air traffic controller training (2.1), generic airspace operational concepts
(2.2), and ATC complexity factors and metrics (2.3). Though these research areas are different,
they are closely interrelated to each other, such as some complexity factors being used for
research on advantages and challenges of the generic airspace concept, or some ATC training
research being applicable in generic airspace concept.
The following sub-sections of this chapter discuss the relevant research done in each area.
The literature review was conducted by reviewing relevant publications from various ATC and
Human Factors related sources from the past 20 years such as ATM Seminar, International
Symposium on Aviation Psychology (ISAP), Human Factors and Ergonomics Society (HFES),
Canadian Aeronautics and Space Institute (CASI), American Institute of Aeronautics and
Astronautics (AIAA), and FAA publications. The chapter discusses the limitations of the
previous work in approaching the research problem of this thesis and how some parts of the
previous work can be applied in this thesis.
2.1 ATC Training
As identified earlier in section 1.1, a Certified Professional Controller (CPC) maintains
qualification on only within one area of specialization that is composed of a few sectors. It takes
significant amount of re-training time ranging from a few months to a few years in order to

13
move a controller to another area of specialization. The main factor contributing to the lengthy
re-training process, as identified in Figure 1-3, is on-the-job training, also identified as “facility
training” in the figure. Motivated by the opportunity to shorten the lengthy on-the-job training
times, or to make the overall training process more efficient, various models, training methods,
and tools have been researched and introduced. The previous research, however, has focused
on the general aspect of ATC training rather than focusing on the problem of ATC transitions.
Reviews and Analyses of ATC Education and Training
Celio (2005) reviewed the current state of training science, training processes in related fields,
and processes used by the military and worldwide ATC service providers to train controllers.
Based on this review and analysis, some recommendations were developed for the introduction
of high fidelity simulation into the FAA training process to reduce time to train controllers. Key
suggestions included the introduction of high-fidelity simulation, incorporating voice
recognition and synthesis with their instrument tools.
Understanding Key Cognitive Components of Controller's Job
Redding et al. (1991) approaches the lengthy on-the-job training problem by gaining better
understanding of key cognitive components of controller’s job. Redding indicates that, during
the on-the-job training process, the knowledge transfer process between instructor and trainee
is an informal processes that varies with the individual instructor. In order to eliminate this
variability, standardization of teaching practices in which instructors explicitly teach cognitive
aspects of ATC is recommended, providing trainees with more consistent training program. The
Mental Model, developed by Redding et al. (1991), is suggested to provide a structure for expert

14
knowledge and teaching method to expedite the process of trainees’ learning and utilization of
that knowledge.
Setting Common Standards across Different Facilities
In efforts to reduce time spent on on-the-job training period, ways to strengthen the initial
training and to maximize harmonization of the training performance and the standards across
different facilities have been researched by Eurocontrol (2003). This research found out that,
under the current Eurocontrol Convention, a lot of hours are spent on on-the-job training due to
the difference in training programmes between different Member States. The suggestion of this
research is to develop clear and commonly adopted objectives to ensure full harmonization of
the knowledge required to obtain a candidate license. In addition, they suggested a kind of
complexity level based license to be developed and a further study to evaluate the advantages
or disadvantages of the establishment of a kind of complexity criteria, which should then justify
the necessary transition training period linked with each category (Eurocontrol, 2003).
Research on Improving Training Methods
Innovative methods of ATC training such as dynamic selection of learning tasks have been
investigated for its effectiveness by Salden et al. (2004). The effectiveness of the method is
investigated by looking into the effects of four different task selection methods on training
efficiency and transfer in computer-based training for ATC. A non-dynamic condition was
compared to three dynamic conditions, in which learning tasks were selected on the basis of
performance, mental effort, and a combination of both (i.e., mental efficiency). It was confirmed
through the study that the training efficiency of the conditions in which learning tasks were

15
dynamically selected was significantly higher than the efficiency of the fixed condition, which
training sequence is predetermined and not adjusted to the individual student.
Similarly, Cavcar, A and Cavcar, M, (2004) discussed the need for new directions for ATC
training. They state that ATC employer organizations are usually slow in catching up to the
changes in ATC environment because of economic reasons and recommends that knowledge
and skills acquired through a college education to promote better performance and flexibility
on the job. In the paper, they propose revised knowledge requirements and compare them with
United States and French practices. Based on findings of comparison, they propose that
professional education or training institutions such as colleges should provide air traffic control
specialist training rather than by the employer.
Some tools have been developed in efforts to bring improvements to the current training
system. Korneciki (1993) builds a solid foundation for Intelligent Tutoring Systems (ITS) by
suggesting its key design features and techniques to be implemented for an intelligent tutoring
system for ATC training. Since then, advanced training tools such as scenario based instruction,
voice recognition and synthesis, and ITS have been researched and discussed by other
researchers such as Camp (2001) and Bolczak et al. (2005). An innovative approach to
controller training such as a web-based airspace training system, the Terminal Trainer
Prototype, has been developed by the MITRE Corporation to improve efficiency, quality, and
standardization across facilities (Weiland, 2010). In contrast to the traditional activities of
drawing the airspaces on paper maps, this training system provides interactive training
technologies and techniques which enable students to learn and memorize their airspace
knowledge. These various technologies and techniques include multimedia tutorials, serious
games, simulations, and interactive discovery learning tools. These results in increases in

16
retention and a greater readiness for simulation and on-the-job training, thus reducing the time
it takes for the on-the-job training process.
Summary of ATC Training
As described above, various ways of improving ATC training system have been suggested
including developing and improving ATC training methods and tools. The generic airspace
concept is another way to reduce training time; previous work on it is described in the next sub-
chapter.
2.2 Generic Airspace Concept
Generic airspace, or sectors with standardized and common operational characteristics, is one
of the methods being considered as part of efforts to modernize the ATC system. The generic
airspace concept will allow easier mobility of controllers between airspaces than the current
system.
Various techniques and tools have been researched and developed by researchers to
enable generic airspace concept. Representative generic airspace research includes Trajectory
Based Airspace-generic (TBA-g) (Bearer et al., 2010), Airspace Redesigns to Accommodate
Generic Sector Operations (Kalbaugh et al., 2011), and generic airspace application tools such as
the Controller Information Tool (CIT) (Mogford, 2010). These research works as well as a few
more relevant works are discussed below.
Identifying Generic Sectors
Trajectory Based Airspace-generic (TBA-g) is one of the methods being researched to identify
generic sectors (Bearer et al., 2010). TBA-g is perhaps the approach that resembles this thesis’

17
approach most closely. Both TBA-g and this thesis work are motivated by the opportunity to
reduce controller training time resulting in greater workforce flexibility and focus on finding
groups of sectors that can be classified as generic sectors within the existing NAS. TBA-g is an
airspace that is characterized by aircraft operating in level cruise with infrequent climbs or
descents, sectors with low to moderate complexity, sectors with low to moderate traffic volume
and less difficult crossing and merging of traffic flows. Bearer et al., (2010) analyzed, defined,
and identified sectors within the NAS that might be suitable to become TBA-g. The main limiting
factor of this TBA-g approach in finding generic airspaces is that it is mainly applicable to the
sectors with low to medium traffic volume and complexity. For this reason, only limited amount
of sectors met the TBA-g criteria and further research is recommended for investigating how
non-TBA-g sectors can be redesigned to be TBA-generic sectors.
Redesigning Non-Generic Sectors to Meet Generic Airspace Criteria
The possibility of redesigning non-Generic en route sectors to meet generic airspace criteria
have been examined by Kalbaugh et al. (2011) at MITRE. They explored four redesign options in
the analysis; the options were rerouting traffic flows between sectors, redefining lateral sector
boundaries, redefining vertical limits of the sector, and dividing a sector into smaller parts. All
of these redesign methodologies experienced major challenges. Redesigned sectors had
increased flight miles (or less efficient operations) and possibly increased traffic volumes in the
neighbor sectors (creating higher potential workload for controllers in the neighboring sectors).
Despite these challenges, three out of ten sectors they applied the redesign analysis on could
meet a Generic Airspace criteria developed by Burkman (2010). They recommend that
additional research to be conducted to determine the feasibility of some of the sectors that
partially met Generic Airspace criteria.

18
Generic Airspace Application Tools
One of the main research projects currently being conducted to explore the concept of generic
airspace is the development of various NextGen automation tools such as the Controller
Information Tool (CIT), data link, and Conflict Detection and Resolution (CD&R) (Mogford,
2010). These tools are designed to focus on reducing the training and memorization required to
manage air traffic by helping controllers reduce the time required to learn and adapt to the
sector by facilitating familiarization. In order to facilitate this familiarization, the tools provided
the necessary sector and traffic flow information to enable a controller to manage an unfamiliar
sector. This study tested whether controllers can manage unfamiliar sectors with an acceptable
level of workload, efficiency, and safety, in a generic airspace environment that includes
NextGen automation tools and specific sector data. The results addressing workload, traffic
management, and safety, as well as controller and observer comments, supported the generic
sector concept. The effectiveness of these tools is still being validated through various Human-
in-the-Loop experiments (Mogford, 2010).
Other Techniques Enabling Generic Airspace Concept
The next two paragraphs discuss the techniques enabling generic airspace concept. The traffic
abstraction algorithm developed by Sabhnani et al. (2010) extract the traffic structure in terms
of standard flows and critical points (conflict and merge points), which can be used to identify
traffic structure in any piece of airspace. This is a useful technique in enabling generic airspace
concept and the paper proposes future steps to use these traffic abstraction results in
developing generic sector designs that allow ease of ATC transition to the new airspace.

19
Applicable Technique to Enable Generic Airspace Concept: Dynamic Airspace Super Sectors
(DASS)
A new concept of simplified high-altitude airspace called Dynamic Airspace Super Sectors
(DASS) was introduced by Alipio et al. (2003). This research work is not directly related to
generic airspace concept but takes a similar approach, motivated by the opportunity to
decrease controller workload and allow higher densities of aircraft to be safely monitored.
DASS is a network of one-directional, high density highways in the sky connecting major
airports in the United States. The study showed that specialized routing by itself may not be a
good option due to DASS increasing number of aircraft and increased workload in each center.
However, the study concludes that the DASS system may be a viable option for the future if
DASS aircraft can be separated from non-DASS aircraft, which may reduce workload (Alipio et
al., 2003). It could be challenging to adapt the DASS system as this system requires some
modification to the existing airspaces. However, if adapted properly, DASS would be excellent
candidates of generic airspace sectors.
Summary of Generic Airspace Concept Related Research
As discussed in section 2.1 and 2.2, there have been various approaches to make ATC training
more efficient or enable the generic airspace concept. However, the review also found that
there has been no research conducted in the approach of identifying multiple groups of, or
classifying, existing sectors that are hypothesized to share similar operational characteristics
that allows a controller to make transitions between them with minimal retraining. In order to
identify such classes of sectors that support minimal difference training approach, first, ATC
factors that impact a controller’s airspace transition must be identified. The next sub-chapter
explores the research that has been done in identifying and developing ATC complexity factors

20
and metrics, and examines whether any of these research have identified ATC factors specific to
controllers’ sector transitions.
2.3 ATC Complexity Factors and Metrics
Understanding ATC complexity factors, the factors that makes a sector “complex”, is a crucial
step in developing a sector classification system that support minimal differences training; this
is because most often the level of ATC complexity in a sector is what contributes to the length of
retraining. Various ATC complexity factors have been reported. Some efforts have been put into
developing a systematic model or a tool to determine ATC complexity of sectors. Another
researcher, such as Christien (2002) has extended the research further by applying ATC
complexity measurement into developing a model that classifies the current European sectors
into different classes based on their complexity. The identification of structure-based
abstractions, (Histon et al., 2001), is also crucial as the abstractions can be used as the
foundation of traffic pattern analysis used to classify sectors. In this sub-chapter, these various
research works done in the light of ATC complexity factors and metrics are reported.
Typical ATC Complexity Factors
Comprehensive complexity factors lists can be found in reviews by Hilburn (2004) and
Majumdar and Ochieng (2001). Typical complexity factors are aircraft density, the proportion
of aircraft changing altitudes, sector size, and sector shape. Mogford (1995) also collected many
ATC complexity factors through a review and synthesis of the literature in efforts to aid in
improving sector design techniques and managing controller workload. Some relevant ATC
complexity factors are traffic mixture of arriving/departing vs. overflying traffic (Davis, et al.
1963), the number of arrivals, special flights, traffic volume and weather condition (Kuhar, et al.

21
1976), sector geometry (Buckley, et al. 1983), background load (Arad, 1964), coordination with
other controllers (Schmidt, 1976), mixture of aircraft types (Grossberg, 1989). Another study
was conducted to identify factors that contribute to airspace complexity by Mogford et al.
(2009). A final list of 16 complexity factors was developed and is suggested as a reference for
future research in the area.
Frameworks or Models Evaluating ATC Complexity
Other than identifying multiple ATC complexity factors, a solid framework for developing and
evaluating a model of the perceived complexity of an air traffic situation was initially suggested
by Pawlak et al. (1996). Pawlak et al. focuses on measuring ATC complexity based on the traffic
characteristics that impact the cognitive abilities of the controller. Other various ways of
measuring air traffic control complexity include non-linear vector field model of air traffic
developed by Delahaye et al. (2004), dynamic density (DD) model by Kopardekar et al. (2007).
As one of the on-going complexity measures development and validation research, Kopardekar
et al. (2007) developed a quantifiable metric for air traffic complexity by combining the effect of
various factors that contribute to sector level air traffic control complexity.
Building in part on the Pawlak et al. (1996) framework, Histon et al. (2001) identified three
important structural abstractions, standard flows, groupings, and critical points and concluded
that the underlying structure of the airspace is relevant in many of the complexity factors. It is
suggested that these structural abstractions reduce the difficulty of maintaining situational
awareness, particularly the projection of future traffic situations. These structural abstractions
become the fundamental basis for the airspace classification methods that support minimal
differences training approach later presented in this thesis.

22
ATC Complexity Measurement or Visualization Tools
A tool that can measure and visualize such as the complexity map has been developed by Lee et
al. (2007). This complexity map displays the state of the sector by measuring the control
activity and provides detailed insight into the control activity required to handle an entering
aircraft as well as the impact of environmental changes. Some scalar measure of air traffic
complexity can be extracted from the complexity map. Similarly, Delahaye and Puechmorel
(2000) developed two interesting approaches of measuring air traffic complexity, an air traffic
complexity indicator based on the structure and the geometry of the traffic and a dynamic
system theory that uses the Kolmogorov-Entropy to measure the global disorder of the aircraft
system when it evolves with time. Through these approaches, Delahaye and Puechmorel made
observations such as the fully organized situation (parallel flow) does not generate complexity
at all either from the either from the geometrical or dynamical system point of view.
ATC Complexity Indicators and Sectors Classification
Christien (2002) put significant effort looking into ATC complexity and used the complexity
indicators as a basis to develop a model that classifies existing European sectors into clusters.
Christien combined ATC operational advice with statistical analysis to compile a list of relevant
complexity indicators. The validated six complexity indicators are number of flights, number of
conflicts, aircraft performance mix, flow entropy, amount of climbing/descending traffic and
size of sector (Christien, 2002). These indicators' influence and interaction vary amongst sector
types. Using these variances of sectors as a basis, two approaches to classify the sectors were
explored. The first method is based on a K-means classification and the second method is based
on hierarchical divisive method named DIVAF. As a result of performing the two classification

23
methods on 677 sectors, DIVAF method produced four clusters and K-means method produced
six clusters.
The comparison between the results from both methods showed that the homogeneity of
the clusters with the K-means method is better than the DIVAF method, but the DIVAF method
enabled more direct interpretation of resulting clusters (e.g., could immediately understand
why sectors belong to the same class). The results of classifying the European sectors showed
that the classification model developed produces a meaningful classification and understanding
of sectors' complexity. Christien suggests that the results from this study to be used to improve
future controller workload and sector capacity predictions at macroscopic level.
This research work is highly relevant to this thesis: both research works attempt to classify
existing airspace sectors depending on each sector's complexity without adding any alterations
to the ATC system. However, the major difference between two works is that Christien's work
attempts classification with a broader level of motivation (e.g., improve future controller
workload) whereas this thesis focuses classifying sectors specifically to reduce controllers'
transition times between sectors. Another difference is that Christien put much effort into
developing an automatic and non-subjective method to classify sectors, whereas this thesis
attempts classification with more qualitative approach, using controller interviews, surveys,
and visual traffic pattern analysis.
Summary of ATC Complexity Factors and Metrics
As listed, there has been significant effort exerted by various researchers looking into
complexity factors and developing complexity metric system. These complexity measurement
studies and metrics have been discussed for its application to developing ATC automation tools,

24
reducing air traffic controllers' cognitive workload, and to develop easier training material.
However, from the literature done as part of this research, there has been no work in
identifying complexity factors specific to transition training.
2.4 Chapter Summary
In summary, while opportunities for improvements in the current training system have been
identified including the generic airspace concept approach, and extensive research has been
previously conducted in identifying important air traffic control (ATC) complexity factors, none
of these approaches have focused on identifying ATC factors that are specific to transition
training nor any of the approaches explicitly examined the potential of identifying common
classes of sectors that would require reduced or minimal training for a controller to easily move
amongst them.
In order to identify such classes of airspaces, first, ATC factors relevant to a controller’s
sector transitions must be identified. Then, based on these factors, classes of airspaces that are
hypothesized to have fewer transition barriers can be identified. The next chapter, Controllers’
Identification of Factors Affecting Transition Time, identifies some of those important ATC
factors specifically related to sector transitions, self-reported by subject-matter-experts.

25
Chapter 3
Controllers’ Identification of Factors Affecting Sector Transitions
This chapter presents the key factors that affect transfer of knowledge and success in new
sectors; these factors were identified using semi-structured interviews with air traffic
controllers.
As discussed in Chapter 2, previous work identified important ATC complexity factors and
metrics. However, none of these approaches focused on identifying factors related to a
controller's sector transitions (learning a new sector as part of certifying in a new area of
specialization). Identifying factors affecting controller’s sector transitions is an essential step in
this research as it builds the basis for understanding what it means for two or more sectors to
be similar in the minimal differences training concept. The identified factors affecting transition
time can then be used as a basis for developing a method for determining classes of sectors
expected to have fewer transition barriers, supporting the minimal differences training
approach.
The result of the interviews described below is the identification of 10 important ATC
operational factors as well as some cultural factors affecting a controller’s sector transition. The
following sections describe the interview method, the factors reported by participants, how
these factors compare to other ATC complexity factors, and how they can be used in a
classification scheme to identify sectors supporting a minimal differences training approach to
generic airspace.
26
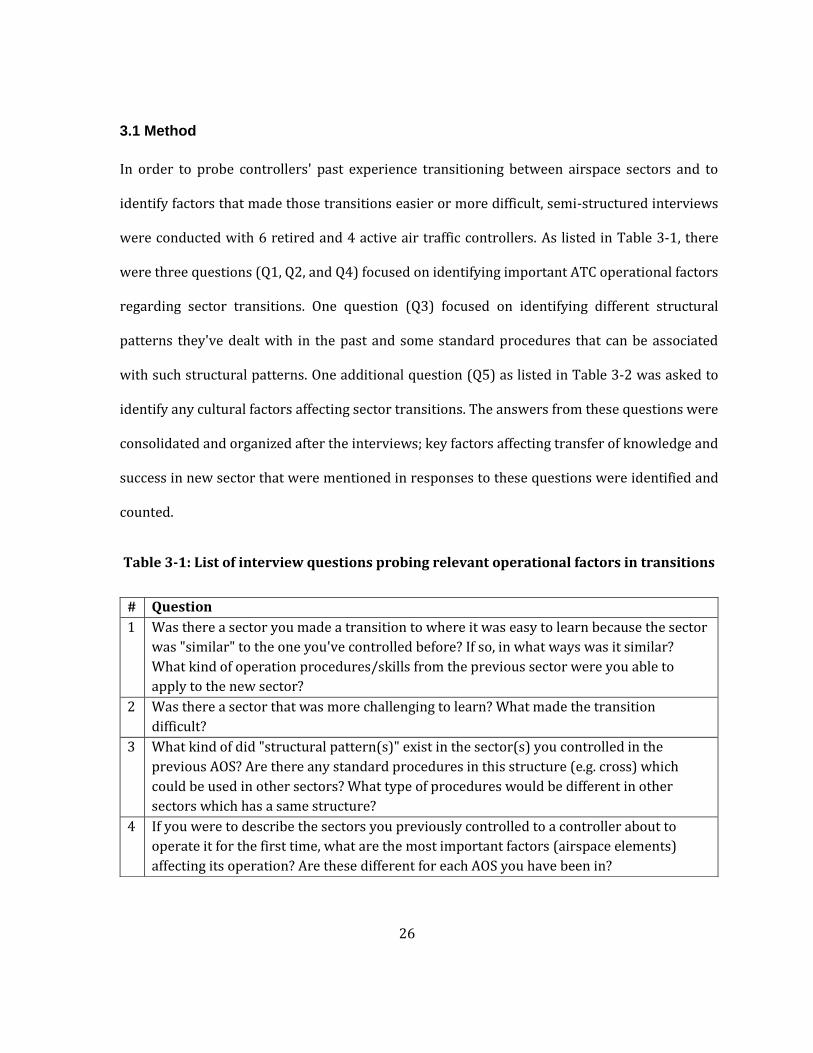
3.1 Method
In order to probe controllers' past experience transitioning between airspace sectors and to
identify factors that made those transitions easier or more difficult, semi-structured interviews
were conducted with 6 retired and 4 active air traffic controllers. As listed in Table 3-1, there
were three questions (Q1, Q2, and Q4) focused on identifying important ATC operational factors
regarding sector transitions. One question (Q3) focused on identifying different structural
patterns they've dealt with in the past and some standard procedures that can be associated
with such structural patterns. One additional question (Q5) as listed in Table 3-2 was asked to
identify any cultural factors affecting sector transitions. The answers from these questions were
consolidated and organized after the interviews; key factors affecting transfer of knowledge and
success in new sector that were mentioned in responses to these questions were identified and
counted.
Table 3-1: List of interview questions probing relevant operational factors in transitions
# Question
1 Was there a sector you made a transition to where it was easy to learn because the sector
was "similar" to the one you've controlled before? If so, in what ways was it similar?
What kind of operation procedures/skills from the previous sector were you able to
apply to the new sector?
2 Was there a sector that was more challenging to learn? What made the transition
difficult?
3 What kind of did "structural pattern(s)" exist in the sector(s) you controlled in the
previous AOS? Are there any standard procedures in this structure (e.g. cross) which
could be used in other sectors? What type of procedures would be different in other
sectors which has a same structure?
4 If you were to describe the sectors you previously controlled to a controller about to
operate it for the first time, what are the most important factors (airspace elements)
affecting its operation? Are these different for each AOS you have been in?

27
Table 3-2. List of interview questions probing relevant cultural factors in transitions
5 What kind of cultural differences can you say you could notice between different facilities
(AOS) when you made transitions (e.g. Air traffic control procedures, policies,
organizational structure/influence, motivating factors, etc.)? Did any of these differences
affect the transition process? If yes, how?
Procedure Details and Participants
The interviews were conducted over the phone and each interview took approximately one
hour. Hand-written notes were taken during the interviews. With the participant’s permission,
each interview session was recorded in order to clarify the written notes taken during the
interview later on. The study participation was voluntary, and the participants were informed
before the interview that they could decline to answer any questions if they wish and withdraw
from the participation at any time.
All participants were, or had been, a certified air traffic controller who had made at least
one transition from one area of specialization to another (which includes at least one sector
transition) in the past. Participants were recruited by extending invitations to a limited set of
active and retired controllers known through personal contacts. 6 retired controllers, and 4
active controllers participated. 9 participants were from the United States while 1 participant
was a controller from Canada. The average number of years of air traffic control experience of
the participants was 22 years. The average number of sectors one participant has controlled is
11. The average number of transitions participants made between different areas of
specialization is 3. All participants included some years of experience with en route low altitude

28
sectors as well as high altitude sectors. Some of these participants had experience of working
with some special use airspaces and/or at terminal airspaces.
3.2 Results
The written notes and the recordings of the interviews were reviewed to identify common
factors affecting sector transitions as reported by the participants. Ten distinct ATC operational
factors affecting sector transitions were identified by the participants and these factors are
discussed in section 3.2.1. Some cultural factors affecting sector transitions were also identified
by the participants and they are discussed in section 3.2.2.
3.2.1 Operational Factors Affecting Sector Transitions
The identified ATC operational factors affecting sector transitions by controllers are graphically
represented in Figure 3-1 and listed in Table 3-3. The factor that the most participants reported
to be important is Traffic Flow Pattern followed in order by Weather Condition, Knowing the
Neighbor Sectors, Hotspots, Aircraft Types, Traffic Complexity, Coastal Area (East vs. West Coast),
Arrival/Departure Flows, Sector Area Size, and Special Areas.

29
Figure 3-1. Identified common factors affecting sector transitions
Controller
Sector Transitions
Traffic Flow
Pattern Weather
Condition
Knowing the
Neighbor Sectors
Hotspots
Aircraft Types
Traffic Complexity
Coastal Area
Arrival / Departure
Flows
Sector Area Size
Special Areas
Table 3-3: List of factors identified by controllers
Factor % of participants reporting
Traffic Flow Pattern 50%
Weather Condition 40%
Knowing the Neighbor Sectors
30% Hotspots
Aircraft Types
Traffic Complexity
Coastal Area 20%
Arrival / Departure flows
10% Sector Area Size (allowed maneuvering space)
Special Areas e.g. Military zones (MOA)

30
The following text describes each identified factor and how controllers described its
importance in learning a new airspace.
Traffic Flow Pattern
This is the factor the largest number of participants identified to be an important factor
affecting transfer of knowledge and success in new sector. Five participants (50% of
participants) self-reported that having the experience of dealing with a similar traffic flow
pattern (e.g., moving from a sector with a dominant cross flow to another sector with a
dominant cross flow) helps significantly. The participants indicated that when a controller is
already familiar with the operations associated with a certain traffic pattern from previous
experience, moving to another sector with a similar traffic pattern would allow some
operational details to be transferable. Asking Q3 allowed participants to identify example traffic
patterns from their past that they were able to transfer some operation techniques from the old
sector to a new sector with a similar traffic flow pattern. Some example quotes from the
controller interviews supporting these assertions are reported and discussed below.
The three most frequently cited structural patterns participants reported as having easily
transferred standard operational techniques are a merging traffic pattern, a crossing traffic
pattern, and arrival/departure traffic pattern. Some participants reported more than one traffic
pattern.
Five participants reported they were able to transfer some techniques from an old merging
traffic pattern sector to a new merging traffic pattern sector. Some controllers stated, "very busy
merging traffic are important to have an experience of". Some ATC techniques used in a merging
traffic pattern that were transferable are flow control, sequencing technique, and speed control.

31
Three participants reported they were able to transfer some techniques from an old
crossing traffic pattern sector to a new crossing traffic pattern sector.
Four participants reported they were able to transfer some techniques from an old arrival
traffic pattern sector to a new arrival traffic pattern sector and/or from an old departure traffic
pattern sector to a new departure traffic pattern sector. A controller stated, “moving from an
arrival sector to another arrival can be easy”.
Some other transferable techniques not specific to a traffic pattern the participants
reported are the scan technique where the controller is trained to look at conflict points,
separation techniques, and developing the skill to “look for similar flows" so they can "relate to
previous sectors". One controller indicated that every sector has different points where traffic
comes together and conflicts occur, and knowing the degree of complexity of these merging or
crossing traffic and where these occur is critical. The controller also indicated that this kind of
"technique" can be transferable but only partially and some local-specific details will have to be
learned.
The participants noted that the location of these specific patterns with respect to the sector
boundary is important as well. Participants stated they "…might be able to do the same thing for
the new sector - just depends where the location of these specific patterns are", and "the way the
sectors are designed around traffic flows is important".
Another important identification made by some controllers was that even if two sectors
share similar traffic patterns, the difficulty of learning the new sector is dictated by the level of
complexity of that sector. One controller said "it was easy to learn the new sector because it did
not have as much merging traffic ".

32
In summary, for the Traffic Flow Pattern factor, participants indicated some specific
example traffic flow pattern such as a merging pattern, crossing pattern, or an
arrival/departure flow pattern as noticeable patterns important to be matched in transitions.
They identified some specific transferable techniques associated with traffic patterns, the
importance of location of these patterns, as well as the complexity associated with each pattern.
The traffic patterns identified through these interviews match the previous work on easily
transferable mental models and abstractions in ATC by Histon (2008).
Weather Condition
Four participants (40% of participants) indicated that having to deal with similar kind of
weather condition in the past could be helpful when learning a new sector. They indicated that
having the experience of some extreme weather such as thunderstorm seasons can be beneficial
if moving to another sector with similar extreme weather condition. This is because the
knowledge and skills required to deal with such situations has already been acquired through
past experience and therefore is not required to be taught as extensively as it would be for a
controller with no such experience. Some controllers indicated that having the knowledge and
experience of dealing with certain operation details that are associated with weather, such as
jetstream, tailwind, general wind pattern, is valuable if moving to a sector with similar weather
condition. As one participant stated “I learned to be mindful of what the wind is doing at all times
and this skill came useful when I moved to the sector xxx which had unusual wind pattern”.
Knowing the Neighbor Sectors
Three participants (30% of participants) emphasized that knowing operations, procedures, and
traffic patterns of neighbor sectors is crucial. As illustrated in Figure 3-2, having the experience

33
of controlling sector X in this figure would develop the familiarity of traffic patterns of its
neighbor sectors such as sector Z, a sector not in the same area of specialization.
Figure 3-2. Illustration of “knowing neighbor sectors” factor
Participants indicated that having the knowledge of the neighbor sectors is crucial because
many of the operation details are dictated by knowing what the traffic is doing around the
controlling sector, knowing what the controller can expect from the other sectors around them,
and knowing what they will be expecting the controller to deliver to them. Due to this
familiarity developed, the participants indicated that moving to a sector near the old sectors
would require significantly less effort to learn.
SECTOR “X” SECTOR “Z”
AREA “B”
AREA “A”

34
Hotspots
Three participants (30% of participants) indicated that knowing where the hotspots are is
critical when learning to operate a sector for the first time. “Hotspots”, sometimes referred to as
“choke points”, “traps”, or “critical points”, are specific locations in a sector where complications
are prone to occur. The identification of hotspots as an important factor in a controller’s sector
transition matches the previous work done by Histon (2008). Histon also identified critical
points as an important abstraction which allows a controller to reduce cognitive complexity
thus making it easier to learn and perform appropriate ATC activities.
Figure 3-3a and Figure 3-3b shows an example of a critical point. Figure 3-3a shows an
example of a critical point due to abrupt aircraft trajectory change pattern and Figure 3-3b is a
critical point due to a merging traffic pattern. It is worthwhile noting that these hotspots, or
critical points, are directly related to traffic patterns of a sector, as indicated in the figures.
Figure 3-3a. Critical point due to aircraft trajectory changes (Histon, 2008)
Figure 3-3b. Critical point (star) where a merging traffic pattern occurs (Histon,
2008)

35
Some controllers reported that locations of these hotspots can be important but it is
difficult to find two sectors that share similar hotspot locations. As one participant stated, “the
basics of ATC and trick spots of the sector is the key in learning a new sector”, where the
controller is referring the trick spots of the sector as “hotspots”. Some controllers referred these
tricky spots in a sector as “the secret spots of the sector” or “the traps”.
Aircraft Types
Three participants (30% of participants) indicated that having the experience of dealing with
certain aircraft types helps in learning a new sector with similar aircraft types. This is because
the controller would be familiar with the capability of these aircrafts and thus know what
operational procedures to take accordingly without having the effort to learn new details. A
controller said “you gotta know what the aircrafts in your sector can do or cannot do. If you don’t
know the aircraft types in the new sector, you gotta learn ‘em.” in supporting the identification of
this factor as an important factor in learning a sector.
Traffic Complexity
Three participants (30% of participants) indicated that the overall complexity of the sector is
important to be matched between the old and the new sectors when learning a new sector.
They reported that the reason is because moving to a similar level of complexity sector provides
the controller with the confidence that they “can do this”. Participants also indicated that
moving to a less complex sector would make it easy to learn the new sector as well. As reported
in the Traffic Flow Pattern section above in this chapter, some controllers identified that even if
two sectors share similar traffic patterns, the difficulty of learning the new sector depends on
the level of complexity of the sector. As one controller commented "it was easy to learn the new

36
sector because it did not have as much merging traffic." In addition, the results indicated that
controllers felt that in some cases the knowledge, skills, and abilities associated with certain
traffic patterns can only be transferred easily in one direction. This was generally from a more
complicated sector to a less complicated sector. The participants identified that usually the
traffic volume of a sector is a good indicator of the general complexity of a sector.
Coastal Area (East vs. West Coast)
Two participants (20% of participants) reported that the familiarity a controller develops of a
certain coastal area (East vs. West) is very significant. This factor is similar to Knowing the
Neighbor Sectors factor, but in a larger geographical scale. One participant stated “…by working
in one (coastal) area for years, you develop a significant familiarity of major flows that are
happening”. To illustrate, a controller with a lot of experience in the West (e.g., Oakland Center)
would have a much more thorough knowledge of the major flows on the West coast (e.g., North-
South flow from Seattle to Los Angeles) than would a controller from the East coast (e.g., Boston
Center). This type of knowledge helps controlling a sector significantly, and the knowledge is
transferable if the controller moves within the same coastal area.
Types of Flows, Sector Area Size, and Special Areas
One participant (10% of participants) indicated that knowing which arrival/departure flows
make up the “major” flows in the sector helps in grasping the key operational concepts when
learning a new sector. The participant indicated that it particularly helps to have the experience
of having to deal with similar types of flows (e.g., having to deal with high volume arrival flows
and moving to another sector with also high volume arrival flows).

37
One participant also indicated that having used to work with a certain sector size
sometimes dictates what controlling techniques the controller is familiar with. The technique
usually varies due to the variety of allowed maneuvering space depending on the sector. The
allowed maneuvering space dictates which techniques to use even for a same operational goal
(e.g., vectoring versus speed control). For this reason, moving to another sector with a similar
sector size sometimes allows some operation details to be transferred.
Another participant indicated that having the experience of dealing with special areas
(than none) help in learning another sector with special areas.
3.2.2 Cultural Factors Affecting Sector Transitions
In addition to the important ATC operational factors affecting a controller's sector transition, in
Q5 controllers were asked to identify any relevant cultural factors associated with ATC sector
transitions. The question as listed in Table 3-2 asks the participants, “What kind of cultural
differences can you say you could notice between different facilities (AOS) when you made
transitions? Did any of these differences affect the transition process? If yes, how?”. In order to
clarify the meaning of cultural differences in the question, example cultural factors such as
organizational structure/influence and motivating factors were used to explain to the
participants what an example cultural factor could be.
Asking this question resulted in 100 percent of the interview participants reporting that
they experienced cultural difference between different facilities. Nine participants (90% of
these participants) said that these cultural differences were significant and only one participant
(10% of the participants) indicated that they experienced a slight cultural difference between
facilities. Some quotes from the interviews include "there was a night and day cultural difference

38
between facilities", "Very difficult to break the culture/habit of the sector", and "Everybody does
things differently". The result of the percentage of participants reporting (100%) and the tone in
the participants’ quotes as stated above reflect the significance of cultural difference between
facilities.
Ten culturally different factors reported include the difference in management, teaching
style, teamwork and coordination, and level of expectations, published holding patterns, the
letters of agreement, the composition of traffic, interpretation of the manual, and the amount of
"freedom" in using specific control techniques.
One controller stated "some procedures which you must learn are not a written rule but
culturally learned" which illustrates how some ATC procedures can be culturally different
across different facilities. An example of a culturally learned experience identified by a
controller was a situation where a certain “legal” procedure is “culturally banned” from use
within the facility due to a certain situation specific to the facility. This culturally banned
procedure is "clear direct Modesto" which is a command mutually understood not to be used
within the facility because its neighbor center dislikes when the aircrafts passed to their sectors
had been cleared direct to Modesto. Controllers culturally have learned to take appropriate
alternatives although there are no such written rules. Some controllers indicated this type of
knowledge is "intangible" and needed to be gained in time. Some controllers emphasized the
fact that they had to learn "the new way of doing things" or "adjust and learn all the peculiar
techniques" to do "the same thing".

39
3.3 Discussion
As a result of the interviews with controllers, ten important ATC operational factors affecting a
controller's sector transitions as well as ten cultural factors were reported by the participants.
The results of the interviews provide insights into which ATC operational factors should be
considered in the development of identifying classes of sectors expected to have fewer
transition barriers in order to support a minimal differences training approach to generic
airspace. The following section reviews the insights provided by the factors as well as
challenges identified for the process of developing an effective sector classification scheme.
The Traffic Flow Pattern factor was identified to be significant not only due to its high
frequency of being cited in the interviews but also because other factors perceived to be
important in a controller’s transition can be encapsulated by the traffic flow pattern. Such
identified important factors that are highly correlated to the traffic flow pattern are Traffic
Complexity, Traffic Volume, Types of Flows (arrival, departure, or en route flows), and Sector
Area Size factors.
Other factors reflecting geographically specific knowledge and experiences, such as
Weather condition or Coastal Area, were also prominent. These additional identified factors
could be used as a basis for evaluating the appropriateness of previous classification schemes
for the purpose of identifying sectors that would have minimal training differences. Schemes
based solely on complexity or solely on traffic patterns can be limited and additional research is
needed to examine how many of the additional factors are relevant for establishing classes of
similar sectors. Combinations of factors will create more accurate classification scheme than a
classification work based on one factor. However, care must be taken because the

40
interpretability of the resulting classification scheme can be diluted by combining or adding
additional factors.
Many of the factors identified in this study can be also found in the ATC complexity factors
literature review done by Mogford et al. (1995), such as weather condition, arrival and
departure flows, and special areas. This is unsurprising given the strong correlation between
complexity and the challenge of learning. Although some of the factors identified in this study
and the ATC complexity factors previously identified overlap, the significance of this study is its
identification on important factors specifically related to a controller’s ATC sector transitions.
The interesting and new factors with respect to training that were identified through this
interview are the importance of Knowing the Neighbor Sectors and Coastal Area factor.
The results from the interviews also showed that there are factors beyond ATC operational
factors, the cultural factors, which would play an important role in the success of an
implementation of the minimal differences approach to generic airspace. The discovery of these
cultural differences affecting a controller's transferability is significant as no previous research
have yet identified such factors. Knowing that there are some significant cultural differences
between sectors that controllers experience in transitions and knowing what these cultural
factors are can provide insights into future research needs. One of the possible ways to address
these cultural differences between facilities is to identify ways to standardize ATC procedures
across the NAS. For example, Eurocontrol, in 2002, suggested a fully recognized license that can
be used throughout an air traffic management system. In addition, some research from
organizational behavior can be adopted as part of the classification methods in the future in
order to look for ways to deal with cultural difference in management, teamwork, coordination,
and level of expectations between different facilities.

41
As an initial step of this research, the mostly cited factor, the Traffic Flow Pattern factor, is
used as a basis for developing an effective classification scheme. This process is further
discussed in detail in Chapter 4. Then, the relative importance of these identified factors will be
assessed and the effectiveness of classification scheme generated based on traffic patterns will
be measured by expanding the reach to a larger number of subject-matter-experts through a
survey. The details on the methods and the results of the online survey are presented in
Chapter 5.
3.4 Chapter Summary
In summary, in order to assess similarities of airspace sectors that support minimal differences
training, factors affecting transfer of knowledge and success in new sector were identified using
semi-structured interviews with controllers. From the interviews, ten important ATC
operational factors and several significant cultural factors affecting a controller's sector
transitions were identified. Insights of which factors are to be considered and what cautions
should be taken into consideration while developing classification scheme that supports
minimal differences training approach were discussed in this chapter.
New ATC factors that were not identified from previous research works, such as Knowing
the Neighbor Sectors and Coastal Area factors were identified through the interviews. Some
specific ATC techniques that are easily transferable were identified from some controllers as
well.
The most significant factor reported, traffic pattern, is immediately being used as a basis
for developing classification methods as part of the thesis work. The development process and
the sample resulting classes of sectors expected to have fewer transition barriers are presented

42
in Chapter 4. The effectiveness of developed classification scheme as well as the relative
significance of identified factors in this chapter will be measured and assessed through an
online survey Chapter 5.

43
Chapter 4
Classifying Sectors Based on Traffic Patterns
In order to identify multiple classes of existing sectors that would allow a controller to make
transitions with minimal training time, this chapter presents two classification methods
developed based on traffic flow patterns.
Chapter 2 of this thesis indicated that there has been no previous work on identifying
important ATC factors directly related to a controller’s sector transitions. Identifying such
factors, however, is a key step in assessing similarities of airspace sectors that support minimal
differences training. Without understanding which factors affect sector transitions, it is
impossible to understand which factors need to be used as a basis to identify similar sectors
that would support shorter transition time. Accordingly, through semi-structured interviews
with controllers, Chapter 3 identified the key factors that affect the transferability of knowledge
and success in a new sector. The information gained through Chapter 2 and Chapter 3 builds a
solid foundation enabling the development of the classification methods.
The following section in this chapter reports the process in developing the two
classification methods, the holistic classification method and the decompositional classification
method. First, the motivation behind using traffic patterns factor as the basis for developing the
classification methods is explained. Next, several key traffic patterns that are hypothesized to
play a significant role in defining classes of similar sectors are presented. These key traffic
patterns were identified by observing commonly occurring traffic patterns across existing NAS
high-altitude sectors. Then, these commonly occurring significant traffic patterns are used as
the basis in developing the two classification methods. Finally, the developed classification

44
schemes are applied to the existing sectors and classes of sectors expected to consist of similar
sectors are identified. These classes are expected to be similar to each other, and hence, the
sectors within a group are hypothesized to have fewer transition barriers. The effectiveness of
one of the developed classification methods will then be evaluated for its effectiveness in
Chapter 5.
4.1 Traffic Patterns as the Basis of a Classification Approach
Traffic patterns, also referred as structural features, structural pattern, or structures, is used as
the base factor in developing the classification methods for determining classes of sectors
expected to have fewer transition barriers. This section explains the rationale behind choosing
the traffic pattern factor as the basis for the classification method.
According to the result from Chapter 3, the factor considered to be the most important in a
controller's transition is the Traffic Flow Pattern factor (Table 3-3). Moreover, Traffic Flow
Pattern factor also fits well with previous work on the importance of structural abstractions by
Histon (2008). Structure has been shown to play an important role in controller cognitive
complexity and has been suggested their importance of supporting easily transferable mental
models and abstractions in ATC (Histon, 2008). Histon (2008) defines structural features as
“the physical and information elements that organize and arrange the air traffic control
environment”. Structure appears to form the basis for abstractions that reduce the difficulty of
maintaining situational awareness (Histon et al., 2001) and air traffic controllers use airspace
structure to lower cognitive complexity and enable them to control increasing numbers of
flights at a time (Zelinski, 2008). Sectors with similar structural features support similar
simplifying abstractions, and have similar types of knowledge associated with them. These

45
structural similarities should thus support the minimal differences approach to generic airspace.
Therefore, structural features are a useful perspective from which to identify similar sectors.
For the reasons explained above, the key traffic patterns are used as a basis for the
classification method presented in this chapter. The next step, presented in the following
section 4.2, is to identify commonly occurring traffic patterns in the existing airspaces that are
expected to play a significant role in defining classes of similar sectors. These key traffic
patterns are identified by examining commonly reoccurring traffic patterns in the 404 NAS-
wide high altitude sectors.
4.2 Commonly Occurring Traffic Patterns
In order to identify key traffic patterns and common classes of sectors, radar track data,
collected through the Enhanced Traffic Management System (ETMS), were analyzed for two
seven day periods (07/13/2009-07/19/2009 and 9/21/2009-9/27/2009). Radar tracks were
plotted for flights that spent at least 10 minutes inside each high-altitude sector. High-altitude
airspaces were ideal candidate for an initial investigation of potential generic airspace as
MITRE has identified through analysis that high altitude airspace has the least number of
airspace knowledge items (see 1.2.2). As such, 404 high-altitude NAS-wide radar track maps
depicting current sector operations were reviewed for recurring common traffic patterns and
key structural features (Cho, et. al, 2011). An example of a high-altitude sector radar track map
used is shown in Figure 4-1.

46
Figure 4-1. Example of a radar track map used
From this review, several commonly occurring traffic patterns (Table 4-1) were identified
and were used as the basis in developing the two classification methods presented in this
chapter. These traffic patterns are listed below in no particular order. Patterns 1 and 2 are
consistent with previously reported structural patterns (e.g. Histon, 2008) and the rest of the
patterns show repeated aircraft behavior that have similar consequences for controller mental
models (Histon, 2008).
Table 4-1. Eight Identified Commonly Occurring Traffic Patterns
Pattern 1 Standard Flows
Pattern 2 Critical Points
Pattern 3 Crossing Flows
Pattern 4 Merging/Splitting Flows
Pattern 5 Star-crossing Flows
Pattern 6 Flow Trajectory Change Points
Pattern 7 Vertical Handoffs
Pattern 8 Common Maneuver Patterns

47
Pattern 1 - Standard Flows
In most sectors, there are one or more distinct concentrated standard flows across the sector.
These standard flows are indicated in distinct dark concentrated lines in radar maps as shown
in Figure 4-2. Figure 4-2 shows an example sector with three standard flows.
Figure 4-2. Standard flow
(with the red arrow indicating the directionality of the sector)
These flows usually represent the pathways controllers use to organize aircraft in an
airspace for easier management or the consequences of procedures, jet routes and filed flight
plans. Standard flows are the foundation for simplifying abstractions used by controllers to
reduce cognitive complexity (Histon, 2008). Hence, commonalities in the standard flows
between sectors are thought to be important factor for identifying similar sectors.
The standard flow pattern is the foundation for identifying other key traffic patterns as
they are observed to be organized in several different shapes such as a parallel flow, a cross
flow, a merge/split flow, and more. Some of these traffic patterns are discussed in more details
below.

48
Pattern 2 - Critical Points
Another key feature identified in multiple sectors was the presence of critical points, where
flows cross, merges, and/or split (Figure 4-3). Similar to standard flows, critical points also
serve as a basis for many other traffic patterns found in this review such as a cross flow,
merge/split flow, and a star-cross flow.
Figure 4-3. Critical points identified by red circles
The relative location of the critical points, especially with respect to each other and sector
boundaries, as well as the type (e.g., merge point vs. cross) can significantly impact cognitive
complexity (Histon, 2008; Hilburn, 2004). Critical points support simplifying abstractions and
are important considerations for identifying similar sectors.
Pattern 3 – Crossing Flows
One of the commonly occurring traffic patterns in a sector was a crossing flow traffic pattern.
Not only was this pattern a commonly occurring pattern, it also was observed to be one of the
most common dominating traffic patterns in a sector. As shown in Figure 4-4, the dominating
traffic pattern in this sector is a crossing factor.

49
Figure 4-4. An example sector with a crossing flow
Pattern 4 – Merging/Splitting Flows
Another commonly occurring dominating traffic pattern are merging or splitting flows. Due to
the limitation of the radar track maps not being able to provide the directionality information of
the flows, it could not be identified whether these patterns are merging flows or splitting flows.
As such, both merging and splitting flows were classified as one traffic pattern. An example
sector with this traffic pattern as a dominating traffic pattern is shown in Figure 4-5.
Figure 4-5. An example sector with a merging/splitting flow
Pattern 5 – Star-crossing Flows
Star-crossing flow traffic pattern was observed in many sectors as a sector’s dominating traffic
pattern as well. Any sector that has this pattern as a dominating pattern usually was observed

50
to be “busy” or “complex” due to the number of standard flows involved in the sector. An
example sector with a dominating star-crossing flow is shown in Figure 4-6.
Figure 4-6. An example sector with a star-crossing flow
Pattern 6 - Flow Trajectory Change Points
Trajectory change points associated with flows (Figure 4-7) typically occur due to special
conditions/restrictions such as keeping the flow within the lateral and/or vertical boundaries
of the sector. The location of trajectory change points relative to other flows and the sector
boundary is an important consideration for assessing sector similarity.
Figure 4-7. Flow trajectory change points
Pattern 7 - Vertical Handoffs
The radar track analysis also identified a key feature associated with aircraft being handed off
and transitioning into or out of sectors vertically. In Figure 4-8, two flows can be seen

51
terminating in the middle of the sector. The locations of the vertical handoffs, and their
relationship with other flows in the sector (e.g. climbing or descending below a crossing flow)
will likely affect how similar these characteristics need to be in order for two sectors to be
considered similar.
Figure 4-8. Vertical handoffs
Pattern 8 - Common Maneuver Patterns
Two common maneuver patterns were also identified: the race-track holding pattern illustrated
in Figure 4-9a, and the path stretching pattern illustrated in Figure 4-9b. Both of these features
require free maneuvering airspace to be present in the sector. The location in the sector, and
how it interacts with other elements such as military airspace, will likely affect how similar
these features need to be in order for two sectors to be considered similar.

52
Figure 4-9a. Race track maneuver pattern
Figure 4-9b. Path-stretching maneuver
pattern
Summary
The key traffic patterns, or the structural features, as identified above can now be used as the
basis for identifying operationally similar sectors. As recognized from the previous research
(Histon, 2008), when sectors with similar traffic patterns are grouped together, it is
hypothesized that they share similar operational characteristics and types of knowledge
necessary to operate the sector, thus such classes are expected to support the minimal
differences approach to generic airspace.
4.3 Holistic Classification
Using the commonly occurring traffic patterns identified above as the basis, the holistic
classification approach was developed. The details on the development process as well as the
results of classifying 404 NAS high-altitude sectors according to this method are presented in
this section.

53
4.3.1 Approach
The holistic classification method is developed based on the approach of identifying similar
sectors based on the overall, or the holistic, structural appearance of a sector, without explicit
accounting for individual structural features. For this reason, only the most dominating traffic
pattern in a sector was considered in this classification method.
Holistic Classification Component I – The Traffic Patterns
For the holistic classification approach, only the most dominating traffic pattern in a sector was
considered. The most dominating traffic patterns in a sector tend to be single flows, crossing
flows, merging/splitting flows, parallel flows, and star-crossing flows, and these five traffic
patterns are used as the basis for this classification method. The traffic patterns such as flow
trajectory change points, vertical handoffs, or maneuver patterns were rarely the dominating
features of a sector and are not used as the basis for this classification method.
Holistic Classification Component II – Concentration of Flows
In addition to the five traffic patterns being used as Component I for the holistic classification
method, different concentrations of flows were used as a second basis (Component II) for the
classification method. Some sectors’ standard flows that form the dominating traffic pattern of
that sector either were moderately concentrated or heavily concentrated. An example of the
density of flows difference is shown in Figure 4-10. The sector on the left shows an example
case of moderately concentrated flows whereas the sector on the right shows an example case
of heavily concentrated flows. As such, the first two categories of Component II of the holistic
classification method are “moderately concentrated standard flows” and “heavily concentrated
standard flows”.

54
Figure 4-10. An example of flow concentration difference
The third category of Component II of the holistic classification method is the existence of
background traffic. An example of background traffic difference is illustrated in Figure 4-11. The
sector on the left of this figure demonstrates a case with almost no or minor background traffic
whereas the sector on the right demonstrates a case with densely distributed background
traffic.
Figure 4-11. An example of background traffic difference
The Holistic Classification Scheme
The holistic classification scheme is developed based on the two components discussed above,
the five traffic patterns, different concentration of flows as well as the background traffic
difference of a sector. The holistic classification scheme is presented below in Table 4-2.

55
Table 4-2. Visual and Canonical Guide for the Holistic Classification Scheme
The main part of the holistic classification scheme (Table 4-2) is illustrated in the upper
part of the table and is comprised of 15 classes. The “Others” section, located bottom part of the
table, were created to accommodate sectors that simply do not have enough traffic to consist of
any standard flows or the sectors that are too complex that one dominant traffic pattern is
difficult to be identified.
The main part of the holistic classification scheme, the 15 classes, is composed of the two
main Components discussed earlier. The five rows organize the five different types of flows, or
ModeratelyConcentrated flows
Heavilyconcentrated flows
Heavily concentrated flows with densely distributed traffic in the background
Single flow
Crosses
Merges/splits
Parallel flows
Star-crosses
Almost no traffic Complex traffic
Others

56
traffic patterns, and three columns organize different concentration of flows and the level of
background traffic. In addition, some merges/splits flows seemed more dispersed than
standard merges/splits flows. Therefore, an additional sub-category, the fanning flows class
was added as part of the merges/splits flows category.
4.3.2 Classifying 404 sectors using Holistic Classification Method
The same radar traffic maps used to identify traffic patterns were used to categorize the 404
high-altitude sectors based on the developed holistic classification scheme. Each sector was
classified into only one class. To illustrate how each sector was categorized into different
classes, four example radar traffic maps mapped to each of its class are shown in Figure 4-12.
Figure 4-12. Example radar traffic maps for two classes
During the classification process, not all sectors had exactly one dominant structural
feature. Some sectors were more difficult, or less obvious, to be classified into one class due to

57
the existence of multiple structural features in the sector. To enforce a consistent classifying
process, certain minor rules were followed.
First, each sector was examined carefully to identify the most dominant feature in the
sector. For example, a star-cross flow can be observed in the sector “a” shown in Table 4-3.
However, it is evidently illustrated in the figure that one of the star-cross flows is significantly
more heavily concentrated than, and hence dominates, the other flows in this sector. For this
reason, this sector is classified to belong to the "Heavily Concentrated Flows – Single Flow" class.
Table 4-3. Example sectors with multiple structural features
Example Sector The sector’s class
a
Heavily concentrated flows – Single Flow
b
Heavily concentrated flows
with densely distributed traffic in the background – Crosses
c
Complex Traffic

58
In the cases when there was more than one equally dominant feature in a sector, the
number of the most dominant features in the sector dictated which class the sector belongs to.
If there were exactly two most dominant features in a sector, crosses, merges/splits, or star-
crosses features were prioritized over single flow or parallel flows classes. The reason for
prioritizing crosses, merges/splits, or star-crosses over single flows or parallel flows is that
operational characteristics are hypothesized to be more complex when the structural features
involve confliction points. Thus, choosing the more “complex” structural feature of the two
equally dominant structural features would be more accurately predicting the overall difficulty
of the sector. For example, if a sector consists of equally dominant cross flow and a single flow
in a separate part of the sector as shown in the example sector “b” in Table 4-3, the sector was
categorized to be in the crossing flow class. In addition, heavily distributed background traffic
can be observed in this sector. As such, this sector is categorized to belong in the "Crosses &
Heavily-concentrated flows with densely distributed traffic in the background" class.
In the cases where there were more than two dominant features in a sector, they were
categorized to be the Complex traffic class in the Others category. As shown in the example
sector c in Table 4-3, more than two dominant structural features are observed including
several crossing flows, merge/split flows, as well as parallel flows. With sectors like this
example sector, it is difficult to predict the main structural feature that dictates the key
operational characteristics in learning the sector. For that reason, they are categorized to be
"Complex traffic" sectors.

59
4.3.3 Results
A comprehensive list of sectors in each class can be found in Appendix A. Table 4-4 shows the
consolidated version of the results, the frequency of sectors in each class of the holistic
classification method.
Table 4-4. The frequency result of sectors in the Holistic Classification Scheme
The value in the centre of each classification cell in the table represents the percentage of
sectors categorized into that class. Approximately 64% of the 404 NAS-wide high-altitude
sectors were classified into the main part of this classification method, the 15 classes. Some
classes had no sectors (0% frequency count) such as the single flow with dense background

60
traffic class, moderately concentrated merge/split flow class, moderately concentrated or
heavily concentrated star-crosses classes. Sectors with a single flow usually had low traffic
volume, which might explain why there were no sectors with a single flow and densely
distributed traffic in the background. As discussed in section 4.2, Pattern 5 – Star-crossing
Flows, any sector with a dominant star-crossing flow pattern usually was observed to be “busy”
or “complex” due to the number of standard flows involved in the sector. This perhaps explains
why no sectors matched to the two star-crosses flow classes that do not have the densely
distributed traffic in the background.
3% of the sectors had extremely low traffic counts without any dominant structural
features (due to no obvious standard flows observed) and were categorized to be “almost no
traffic” class. 33% of sectors were categorized to be a “complex traffic” class due to its
possession of multiple dominant traffic patterns (e.g. two crosses with a merge and a parallel
flow).
4.3.4 Discussion
The result of the holistic classification approach in Table 4-4 represents an initial break-out of
the types of traffic patterns and preliminary estimates of the relative frequency that can be
found across sectors in the NAS. The classes that are identified provide a basis for identifying
classes of sectors that are expected to be similar enough to support a minimal differences
approach to training in order to support controller qualification across the sectors in the class.
Several challenges were identified in using the holistic approach to classification. No
attempt was made to account for altitude differences in aircraft trajectories. Including altitude
distinctions would lead to additional classes being identified; features such as crosses might

61
have different training implications if they are generated by traffic at varied and procedurally
segregated altitudes. Moreover, the representations used did not distinguish between
directions of flight, making it difficult to definitively distinguish between merges and splits;
other contextual cues can be used, but for the purpose of this preliminary analysis a single class
was identified.
4.4 Decompositional Classification
Two shortcomings with the holistic approach motivated consideration of an alternative
approach. First, the holistic classification approach does not explicitly include the effects of key
structural features such as the presence of standard maneuver patterns. In addition, 33% of
sectors were classified as “complex traffic” sectors due to their possession of multiple dominant
structural features. However, there may be important opportunities for generic airspace sectors
based on similarities between sectors within the “complex traffic” class.
Based on the commonly occurring traffic patterns identified in section 4.2, the
decompositional classification approach was developed. The details on the development
process as well as the results of applying it to the classification of 75 NAS high-altitude sectors
are presented in this section.
4.4.1 Approach
The decompositional classification method uses combinations of individual structural features
appearing in a sector. The decompositional classification method uses individual structural
features as building blocks and explicitly accounts for combinations of structural features to
classify sectors into common classes.

62
All of the traffic patterns identified in section 4.2 form the basis for identifying classes of
similar sectors in this method: standard flows, critical points (due to their distinct
characteristics, critical points are broken down into merge and crosses), distinct trajectory
points, vertical handoffs, and holding maneuvering patterns. These structural features form the
six main elemental features of this method and are illustrated in Figure 4-13.
Figure 4-13. The elemental structural features for the decompositional classification
Using these elemental structural features, similar sectors can be identified based on the
combinations of these elements in a sector. An example of the decomposition of a sector is
shown in Figure 4-14. There are three elemental features present in this sector: a crossing flow,
a merge/split, and a holding pattern. The order of elements is not considered in the method. For
example, in the example illustrated in Figure 4-14, the sector can be decomposed into the same
three elements, a cross, a merge/split, and a holding pattern, regardless of a particular order of
decomposition.

63
Figure 4-14. A sector with three structural features and the notional algebra for the sector
The method also does not distinguish a relatively importance, or “weight”, to each
elemental feature. In other words, in the current decompositional classification method, all the
elemental features are considered equally important and one element’s existence over the other
does not dictate the Traffic Complexity of a sector. However, from the preliminary analysis done
as part of this thesis, it can be predicted that some elements such as standard flows perhaps can
be considered more important as this structural pattern form the basis for crossing flows,
merging/splitting flows, and flow trajectory points elements. Similarly, it is predicted that the
relative importance of the rest of the elements can be determined with further analysis as well.
Based on the measurement and observation of the elements’ distribution in the sectors,
different methods were examined to group and identify how common classes of sectors could
be identified. Initial analysis was done across 75 high-altitude sectors using the same radar
track maps and the results are reported in the following section.
4.4.2 Identifying Elements Using Decompositional Classification Method
In order to explore the viability of using the decompositional approach to identify classes of
sectors with similar structural features, the number of elemental structural features in a
reduced class of high-altitude sectors was obtained. Radar-track maps for 75 sectors from 5

64
centers were examined to determine preliminary estimates of the number of structural features
(as identified in Figure 4-13) in each sector. The following criteria were used in developing a
preliminary evaluation of the frequency of each structural feature:
• Standard flows are concentrations of aircraft trajectory that follow similar along-track
paths and with a concentration which visually appears to be denser relative to other flows,
• When two or more standard flows merge within a sector, the number of standard flows
is determined by the number of input flows.
• The cross, merge, distinct trajectory change points, and vertical handoff elements were
only counted if associated with a standard flow.
• Maneuver patterns did not need to be part of standard flows in order to be counted.
Results – Frequency of Structural Features
The frequency of each of the six elements in the decompositional method was determined for
75 sectors in 5 centers. Appendix B lists the 75 sectors and the frequency of each structural
feature for all sectors.
Figure 4-15 shows that a significant range of standard flows was observed, with some
sectors having 8 or more standard flows. The broad distribution indicates one of the core
challenges in developing generic airspace: there is significant variability in the presence of
standard flows, a core element of structure, known to impact controller abstractions and
cognitive complexity.

65
Figure 4-15. The distribution of frequency of standard flows appearing in a sector
In contrast, Figure 4-16 shows that the distributions of cross, merge, and trajectory change
points share a common distribution. For these three elements, it was observed that
approximately 50% of the 75 sectors did not have each element and very few sectors (less than
10%) had four or more instances of a feature.
Figure 4-16. The distribution of frequencies of crosses, merges, and trajectory change
points appearing in a sector
Some structural features (e.g., standard flows) are integral parts of other structural
features (e.g., crosses). As a result, some of these distributions are dependent on others. For
example, a minimum number of standard flows required for a cross or a merge element to exist
is two, meaning that crosses or merges cannot exist in sectors with a single or no standard flow.
Figure 4-17 shows the distribution of sectors with zero or at least one cross or merge flow. It
0%
20%
40%
60%
80%
100%
0 1 2 3 4 5 6 7 More
Frequency of Standard Flows
0%
20%
40%
60%
80%
100%
0 1 2 3 4 5 6 7 More
Frequency of Crosses
0%
20%
40%
60%
80%
100%
0 1 2 3 4 5 6 7 More
Frequency of Merges
0%
20%
40%
60%
80%
100%
0 1 2 3 4 5 6 7 More
Frequency of Trajectory Change Points

66
can be observed in the graph that at least 70% of the sectors had at least one cross or merge
flow. This number is smaller than the frequency of two or more standard flows observed in
Figure 4-15, which is 80%. This confirms that crosses or merges cannot exist in sectors with a
single or no standard flow. This also predicts that 10% of the 75 sectors have parallel flows
since these sectors had two or more standard flows but did not have either cross or merge
flows.
Figure 4-17. Frequency of sectors with either crosses or merges
Finally, Figure 4-18 shows that many sectors do not have vertical handoffs or holding
patterns. The holding patterns was mostly found in sectors in one particular center suggesting
that center differences may play a significant role in determining the feasibility of the generic
airspace concept.
0%
20%
40%
60%
80%
100%
0 crosses or
merges
at least one
cross or merge

67
Figure 4-18. The distribution of frequencies of vertical handoffs and holding patterns
appearing in a sector
4.4.3 Classifying Sectors Using Common Patterns of Structural Features
The observations of the frequency of structural features in each sector can be used to identify
sectors with common combinations of structural features. These common combinations of
sectors are expected to provide similar cognitive characteristics. However, care must be taken
as the broad distribution observed in the frequency of elements distribution (as illustrated in
section 4.4.2) indicates a challenge in developing generic airspace. When there is significant
variability in the presence of each element, it can result in a dilution of the classification scheme:
the more variability of classes there are, the smaller number of sectors in each class, which
defeats the purpose of classifying sectors. To combat this challenge, a few different ways of
grouping and identifying common classes of sectors from the observed data are presented
below.
Grouping Method #1
One of the simpler ways, though not considered further in this thesis, is using a weighted
combination of features to determine the overall complexity of the sector, similar to the
complexity based classification described by Christien (2002). Weights for each elemental
0%
20%
40%
60%
80%
100%
0 1 2 3 4 5 6 7 More
Frequency of Vertical Handoffs
0%
20%
40%
60%
80%
100%
0 1 2 3 4 5 6 7 More
Frequency of Holding Patterns
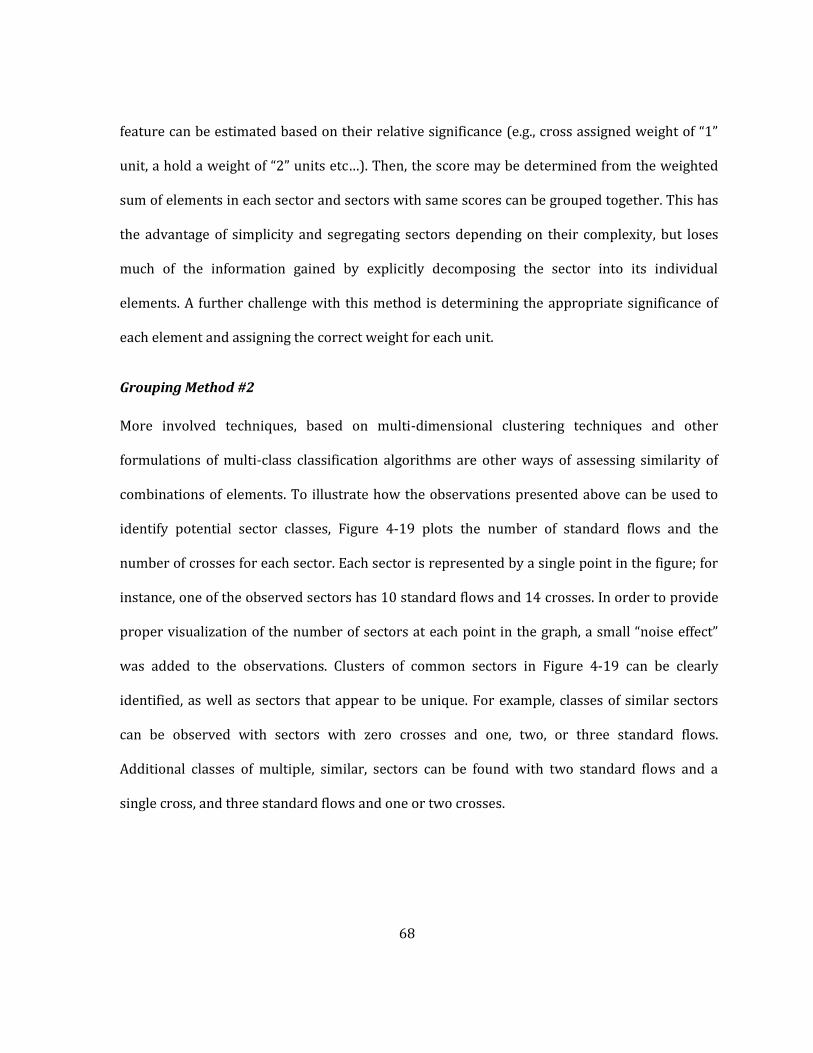
68
feature can be estimated based on their relative significance (e.g., cross assigned weight of “1”
unit, a hold a weight of “2” units etc…). Then, the score may be determined from the weighted
sum of elements in each sector and sectors with same scores can be grouped together. This has
the advantage of simplicity and segregating sectors depending on their complexity, but loses
much of the information gained by explicitly decomposing the sector into its individual
elements. A further challenge with this method is determining the appropriate significance of
each element and assigning the correct weight for each unit.
Grouping Method #2
More involved techniques, based on multi-dimensional clustering techniques and other
formulations of multi-class classification algorithms are other ways of assessing similarity of
combinations of elements. To illustrate how the observations presented above can be used to
identify potential sector classes, Figure 4-19 plots the number of standard flows and the
number of crosses for each sector. Each sector is represented by a single point in the figure; for
instance, one of the observed sectors has 10 standard flows and 14 crosses. In order to provide
proper visualization of the number of sectors at each point in the graph, a small “noise effect”
was added to the observations. Clusters of common sectors in Figure 4-19 can be clearly
identified, as well as sectors that appear to be unique. For example, classes of similar sectors
can be observed with sectors with zero crosses and one, two, or three standard flows.
Additional classes of multiple, similar, sectors can be found with two standard flows and a
single cross, and three standard flows and one or two crosses.

69
Figure 4-19. The distribution of two structural features in 75 sectors
In some other cases, such as the distribution observed in the upper right side of the graph
in Figure 4-19, a cluster of multiple sectors sharing the same combination of standard flow and
crosses cannot be observed. On the basis of this method, these sectors would not be considered
as candidates for generic sectors, as it is expected that the required abstractions would be too
cognitively different from other sectors for a minimal differences training approach to be
successful.
One possible way to combine clusters into different classes is illustrated in Figure 4-20.
Further effort is needed to assess cognitive aspects of combinations of these classes. In some
cases it is likely that the precise number of structural features is not as relevant as the relative
number of elements. For example, the standard flow abstraction suggests sectors with three
-2
0
2
4
6
8
10
12
14
16
-2 0 2 4 6 8 10 12
Nu
mb
er
of C
rossin
g P
oin
ts
Number of Standard Flows
Number of Crossing Points vs. Number of Standard Flows in Sectors

70
standard flows and no crosses will likely be very cognitively similar to sectors with four
standard flows and no crosses. In the absence of crosses, the flows can be considered
independently, and sector operations may be sufficiently similar that these sectors can be easily
transferred between.
Figure 4-20. A Possible Way of Combining Clusters into Classes
Effectiveness of Expanding the Number of Features in a Classification
There are a finite number of sectors, and developing schemes that incorporate an excessive
number of factors will limit the size (and therefore the value and the practicality) of a class of
generic sectors. Additional analysis was performed to examine the effectiveness of expanding
the number of features incorporated to identify classes of similar sectors. It was stated earlier
that the large number of classes can dilute the classification scheme and defeat the purpose of
-2
0
2
4
6
8
10
12
14
16
-2 0 2 4 6 8 10 12
Nu
mb
er
of C
ros
sin
g P
oin
ts
Number of Standard Flows
Number of Crossing Points vs. Number of Standard Flows in Sectors

71
classifying sectors. This is because the more classes there are, the smaller the number of sectors
results in each class.
In order to examine this problem, different combinations of elements (ranging from 1 to 6)
were created; each combination is considered a dimension level (Table 4-5). The combinations
represent successively adding an additional structural feature to the previous dimension level.
At each dimension level, sectors with the same values for each element are grouped together
into a class; the number of classes and the number of sectors in each class could then be
determined.
Table 4-5. The List of Dimension Levels
Dimension Level Element Combinations
Dimension 1 Standard Flows
Dimension 2 Dimension 1 + Crosses
Dimension 3 Dimension 2 + Merges
Dimension 4 Dimension 3 + Vertical Handoffs
Dimension 5 Dimension 4 + Trajectory Changes
Dimension 6 Dimension 5 + Holding Patterns
All 75 sectors are broken down into a unique "dimension" across all the dimensions
measured. For instance, for a sector that has 5 standard flows, 2 crosses, 0 merges, 0 vertical
handoffs, 0 trajectory changes, and 1 holding pattern, its signature for 6-dimension level would
be “5-2-0-0-0-1”. This is applied to all 75 sectors, each sector producing 6 different
"dimensions" for each 6 dimension levels (e.g., the signatures for six dimensions of the example
sector would be "5", "5-2", "5-2-0", 5-2-0-0", "5-2-0-0-0", "5-2-0-0-0-1").
After 6 dimension levels were identified for all 75 sectors, unique classes, or classes, were
identified for each dimension level. For instance, there were 11 unique classes identified for

72
dimension level 1 (e.g., when only one element, the number of standard flows, was involved to
create classes). In contrast, there were 45 unique classes identified for dimension level 6. As
observed in Figure 4-21, the number of unique classes increases as the number of elements
increases.
Figure 4-21. Frequency of Resulting Unique Classes
Depending on the Number of Elements Used
(Dimension Level numbers indicates the number of elements)
The following analysis examines how the size of the classes (the number of sectors
belonging to each class) changes as the number of elements involved to create classes increase.
As illustrated in Figure 4-22, the size of each class decreases as the number of elements
increases. Over 80% of the classes with 6 elements consisted of only one sector in each group
meaning less than 10% of the classes with 6 elements consisted of more than one sector in each
group.
0
10
20
30
40
50
60
70
1 2 3 4 5 6
Nu
mb
er
of
Un
iqu
e C
lass
es
Dimension Level

73
Figure 4-22. The Proportion of Classes with One Sector or More than One Sector
As shown, this analysis emphasizes the importance of narrowing down the features that
are most important for transitions in order to produce more effective classes.
4.4.4 Discussion
The decompositional classification method involves complicated combination analysis and
significant effort; therefore the initial analysis was limited to 75 sectors in 5 centers. In the
future, the analysis could be expanded to all 404 high-altitude sectors to obtain results
spanning the entire NAS. Similar to the holistic classification method, due to the limitations on
the data used for the analysis, the impact of aircraft being at different altitudes was not
considered. Similarly, direction of flight (important for distinguishing between merge and split
points), and the directionality of standard flows was not considered.
0%
20%
40%
60%
80%
100%
0 1 2 3 4 5 6
Number of Elements
Classes with onlyone sector
Classes with morethan one sector

74
A key advantage of the decompositional approach presented here is that other complexity
factors, including traffic density, peak traffic, presence of weather, and Standard Operating
Procedures (SOPs), can also be incorporated into the assessment of similarities between sectors.
However, as this was a preliminary effort at quantifying the relative frequency of the
structural features for the decompositional approach, several important characteristics were
not accounted for. As such, traffic patterns such as star-crossing patterns or parallel flows
which were used in the holistic classification method were not incorporated in this method to
be the elemental structural features. More investigation should be done in the future to look
into which factors should be included or excluded to be the elemental structural features for the
decompositional classification. In addition, these estimates were obtained using qualitative
analysis of the radar-track maps of each sector; additional work could determine more
systematic methods of assessing quantitative measures. Further work can take advantage of
efforts to develop a method for extracting critical points directly from flight trajectories
(Zelinski, 2008). Despite these limitations, the analysis results provide a basis for developing
techniques for identifying common combinations of structural features and classes of sectors.
In addition, the additional analysis was performed to examine the effectiveness of
increasing the number of elements in classifying sectors. The result of the analysis emphasized
the importance of narrowing down the features that are most important for transitions in order
to produce more effective classes.
4.5 Chapter Summary
Radar track data for 404 high-altitude sectors were used to identify several key traffic patterns
and similarities in these traffic patterns provide a basis for identifying classes of generic sectors.

75
Using these commonly occurring traffic patterns identified, two distinct methods to classify
sectors were presented. The holistic approach, based on assessing the overall structural
appearance of a sector, was used to identify 17 classes of high-altitude sectors. The second,
decompositional, approach was proposed as the basis for comparative analyses of structural
features of the sectors.
Through the classification process, a broad distribution of number of standard flows per
sector was observed. This indicates some challenges in developing generic airspace as standard
flows are a core element of structure known to impact controller abstractions and cognitive
complexity. Further analysis with the classification results identified that the number of
features involved with classification methods directly relate to the effectiveness of the classes.
This finding stresses the importance of finding the optimal number of features to be used in the
classification.
The identification of classes of sectors with similar structure provides a basis for assessing
the potential of near-term deployment of generic airspace. A successful classification scheme
would produce classes of similar sectors that controllers understand and agree that they are
similar in supporting minimal differences training. As such, the effectiveness of one of the
developed classification schemes, the holistic approach, will be measured through a survey
using the resulting classes. The holistic classification method is chosen to have its effectiveness
measured as this classification method was applied to all of the NAS high altitude sectors and
the resulting classes that are expected to consist of sectors that are similar to each other were
identified. This validation process is further described in Chapter 5.

76
Chapter 5
Validating Perceptions of Airspace Similarity through Subject-
Matter-Experts
The identification of classes of sectors with similar structure provides a basis for assessing the
potential of near-term deployment of generic airspace. The holistic classification method
developed in Chapter 4 produced 17 distinct classes of 404 high-altitude NAS sectors that are
expected to have fewer transition barriers. A valid classification scheme would generate classes
of similar sectors that controllers understand and agree that they are similar in supporting
minimal differences training. The objective of the work presented in this chapter is to:
Chapter Objective: Test the effectiveness of the holistic classification method against the
perceptions of a broad group of air traffic controllers.
To test the perceptions, a survey was developed and administered to a large group of air traffic
controllers. In the survey, the effectiveness of the holistic classification scheme was determined
by observing if participants agree that sectors from the same class (based on the classification
method) are similar and support easier transfer of knowledge, skills, and abilities. Five chosen
classes, based on the structure-based components of the classification scheme, were used to
measure how effective each component of the holistic classification scheme is. The results
showed that participants significantly agree with four of the five components of the
classification method, and the overall result identifies that the structure-based classification
technique is an effective way to determine similar sectors that support minimal differences

77
training approach. Based on the results, the holistic classification scheme is adjusted and a
revised scheme is presented.
The following sections describe how the survey was designed, report what the results of
the survey, and discuss the implications of the results.
5.1 Survey Design
This survey tested the effectiveness of structure-based classification through a series of sector
traffic pattern image comparisons. The goal of this survey is to validate the appropriateness of
the identified classes based on structure-based, or traffic pattern, components of the
classification scheme.
5.1.1 Setting up Comparisons
The holistic classification scheme previously identified 17 classes as shown in Table 4-2. The
survey was designed to focus on limited subset of these classes, five specific classes chosen
based on the main structure-based components of the classification scheme. This survey
focuses on the main part of the classification, the 15 main classes in the upper part of the
classification (highlighted in Table 5-1). The main part of the classification scheme, the upper
15 classes, is based on two key fundamental traffic pattern, or structure-based components:
different types of flows (organized in five rows) and different concentration of flows (organized
in three columns). The five rows represent five different types of flows and three columns
represent different concentration of flows and the level of background traffic (discussed in
more details in 4.3).

78
Table 5-1. The 15 classes tested (highlighted with red box) for their validity in the survey
The survey was designed around several testing factors, each designed to probe a distinct
part of Table 5-1. As there was some initial concern about the effectiveness of the question
design, the first testing factor was designed as methodological check. Two classes thought to be
dramatically different were selected for comparison; if differences were not found on this
testing factor, it would provide an indication that there was a problem with the survey
methodology. This is called testing factor #1 in Table 5-2. Secondly, in order to measure how
effective the holistic classification scheme is more systematically, the basis of the holistic
classification method, the structure-based components must be tested for their appropriateness.
ModeratelyConcentrated flows
Heavilyconcentrated flows
Heavily concentrated flows with densely distributed traffic in the background
Single flow
Crosses
Merges/splits
Parallel flows
Star-crosses
Almost no traffic Complex traffic
Others
1% 3% 0%
3% 5% 7%
0% 6%
2% 9% 2%
3%
10%
33%
7%3%
5%
0% 0%

79
As such, five additional testing factors (testing factor #2 ~ #6) based on these structure-based
components were chosen. Only a limited subset of classes was used (i.e., six testing factors) to
test the key dimensions of the classification method because participants were expected to have
only a limited amount of time to complete the survey (e.g., 30 minutes). Comparison questions
were developed for each of these testing factors, as presented in Table 5-2, to measure
controllers’ perception of airspace similarity. For each testing factor, a testing class and a
distractor class are chosen. A testing class is the class being tested for similarity against the
distractor class.
Table 5-2. Six Testing Factors Chosen for the Survey
Testing Factors Testing class Distractor class
#1 Methodological check, hypothesized large class difference
Single flows Star-cross flows
#2 Flow concentration Heavily concentrated cross flows
Moderately concentrated cross flows
#3 Background traffic Cross flows Cross flows with densely distributed traffic in the background
#4 Different types of flow #1 Cross flows Merge/Split flows
#5 Different types of flow #2 Cross flows Star-cross flows
#6 Different types of flow #3 (A sub-class: merge/split vs fan)
Merge/Split flows Fan-in/out flows
Testing Factor #1: The Methodological Check
The first testing factor is the hypothesized large class difference comparison for a
methodological check. For this testing factor, the single-flow class (the testing class) is tested if
it is significantly different from the star-cross class (the distractor class). These two classes are
in different rows and different columns in Figure 5-1, and would generally be expected to have

80
large differences in the knowledge, skills, and abilities. In other words, it is hypothesized that if
a controller is trained in a sector with a single-flow traffic pattern, it is much easier to make
transitions to another sector with a single-flow traffic pattern than it is to make transition to
sectors with star-cross traffic pattern. As this is a methodological check comparison, a
significant difference for this comparison is expected. If a significant difference between these
two classes is not achieved from the survey, the effectiveness of the survey design questions
would be uncertain.
Figure 5-1. Two Chosen Classes (dotted boxes) for the Methodological Check
Testing Factor #2 & #3: Flow Concentration and Background Traffic Difference
The second and third testing factors, flow concentration and background traffic difference, test
if the columns in the holistic classification method (Table 4-2) are an effective way of
determining similar sectors that have fewer transition barriers. Testing factor #2 (as
highlighted in dotted boxes in Figure 5-2) examines if flow concentration plays a significant
part in determining classes of "similar sectors" that support minimal differences training. In
other words, if knowledge, skills, and abilities transfer would be maximized when a controller
ModeratelyConcentrated flows
Heavilyconcentrated flows
Heavily concentrated flows with densely distributed traffic in the background
Single flow
Crosses
Merges/splits
Parallel flows
Star-crosses
Almost no traffic Complex traffic
Others

81
makes a transition to a similar level of concentration of flows rather than to a different level of
concentration flows. For this specific testing factor, a heavily-concentrated-cross class is chosen
as a testing class and moderately-concentrated-cross class is chosen as a distractor class, as
shown in solid boxes in the left table in Figure 5-2. Similarly, appropriate testing class and
distractor class are chosen to measure the effectiveness of Testing factor #3, the level of
background traffic difference, shown on the right table in Figure 5-2.
Figure 5-2. Classes (solid boxes) used for
Flow Concentration comparison (dotted boxes) on left
and Background Traffic Level comparison on right
Testing Factor #4, #5, & #6: Different Types of Flows
The fourth, fifth, and sixth testing factors test if the rows in the holistic classification method
(Table 4-2) are an effective way of determining similar sectors that have fewer transition
barriers. Testing factor #4 examines if the difference between cross flows and merge flows play
a significant role in determining classes of "similar sectors" that support minimal differences
training. In other words, this testing factor measures if knowledge, skills, and abilities transfer
ModeratelyConcentrated flows
Heavilyconcentrated flows
Heavily concentrated flows with densely distributed traffic in the background
Single flow
Crosses
Merges/splits
Parallel flows
Star-crosses
Almost no traffic Complex traffic
Others
ModeratelyConcentrated flows
Heavilyconcentrated flows
Heavily concentrated flows with densely distributed traffic in the background
Single flow
Crosses
Merges/splits
Parallel flows
Star-crosses
Almost no traffic Complex traffic
Others

82
would be maximized when a controller makes a transition from a cross-flow sector to another
cross-flow sector as opposed to a merge-flow sector.
Similarly, testing factor #5 measures the difference between crosses (two standard flows
involved) and star-crosses (more than two standard flows involved at a single cross), and
testing factor #6 measures the difference between merge and fan flows.
5.1.2 Sector Selection for Testing factor
For each testing factor (Table 5-2), 9 pair-wise similarity comparison questions were developed.
Each question presented the survey participant with one sector from the testing class, and
presented two choices. Each choice was a sector, one also belonging to the testing class and one
belonging to the distractor class. Figure 5-3 illustrates how these sectors were selected for the 9
pair-wise comparison questions for one testing factor. The three large ovals in Figure 5-3
represent classes (the testing class for the first two ovals and the distractor class for the third
oval) and the small circles in these ovals represent sectors in each class. In order to create each
comparison question, the following process was followed.
1. From the Testing Class, one sector is randomly chosen to be the “Test Sector” (Sector A)
and used repeatedly for three questions for the same testing factor. For each testing
factor, three “Test Sectors” (Sector A) are chosen.
2. Excluding the three “Test Sectors” chosen from Step 1, a “Similar Sector” (Sector B) is
chosen randomly from the Testing Class.
3. From the Distractor Class, a “Distractor Sector” (Sector C) is chosen randomly.

83
4. As long as there are no two questions with the same combination of Sector A, B, and C,
Sector B and Sector C can repeatedly be chosen again for different questions, if chosen
randomly.
Figure 5-3. Testing factor Methodology – Sectors Selection
Each question’s composition can be explained further using the diagram shown in Figure
5-4. As illustrated, each question is composed of three sectors, Sector A, Sector B, and Sector C.
Sectors A and B are selected from the same class, the “Testing Class”, and Sector C is selected
from the “Distractor class” (Figure 5-3). Figure 5-4 demonstrates an example of a pair-wise
“Test Sectors”in Testing class
“Similar Sectors”in Testing class
“Distractor Sectors”in Distractor class

84
similarity comparison for testing factor #2, the flow concentration difference. A full list of
sectors chosen using this method for the 54 questions in the survey can be found in Appendix C.
Figure 5-4. An Example of Pair-Wise Similarity Comparison
5.1.3 Survey Questions
Each comparison question produces a binary choice answer from participants – having to
choose between Sector B and Sector C. Each question asks, “Assume you are certified on and have
experience controlling this sector (Sector A - above). Consider the two sectors below. Which sector
do you feel has the most interchangeable knowledge, skills, and abilities with Sector A (above)?”.
As specific directionality of transferring skills is not supported in the current holistic
classification method, it was critical that participants do not choose an “easier” sector as this
can easily endorse the directionality of transferring skills (e.g., moving from A to B is easy but B
to A is not). As such, the wording for this question was chosen as above to reflect the concern.
The same radar track maps that were used for the developing the classification scheme
were used for the 54 survey comparison questions. In order to focus the testing factor on the
Sector A(chosen from the Testing Class)
Sector B(chosen from the Testing Class)
Sector C(chosen from the Distractor Class)

85
traffic pattern only, any additional information such as the name, location, altitude level, and
other information of the sector were excluded in the images shown in the survey. An example of
a comparison question used for the survey is illustrated in Figure 5-5.
Assume you are certified on and have experience controlling this sector (Sector A - above).
Consider the two sectors below. Which sector do you feel has the most interchangeable knowledge, skills, and abilities with Sector A (above)?
Figure 5-5. A Sample Question for Survey - Part I
The limited amount of information given in the images shown can lead participants to
assume variable factors necessary in order to make the judgement. To minimize this variability
and to ensure their choices are conditioned by the difference in traffic patterns of both sectors
only, several assumptions were stated. These assumptions were shown for all 54 comparison
questions and are shown in Table 5-3. These assumption statements were presented to
minimize any bias caused by assumptions such as ensuring they assume the same mix of
airliners and business jet traffic, or ensuring they assume same altitude range for all sectors as
assuming different conditions for these factors could easily affect their choices.

86
Table 5-3. Assumptions Statement for Questions for Survey – Part I
Assumptions are the same for all 54 radar track map comparison questions. 1. The maps in the following questions represent two weeks of radar track maps. 2. The following maps show only two-dimensional information and no information is provided on the direction of the travel for any of the traffic. 3. There is no information provided on the specific location of the sector. 4. There is no information provided on the locations of fixes and navigation aids. 5. Assume all sectors have an altitude range of FL290 to FL600. 6. Assume there are no particular letters of agreement. 7. Assume there is a mix of airliner and business jet traffic. 8. Assume there are no location specific weather phenomenon that affect sector operations.
5.2 Survey Procedure
The survey in Chapter 5 and Chapter 6 were conducted together, although each part has been
analyzed and is presented separately. The following survey procedure details are applicable for
both parts of the survey.
Survey questions were posted using www.surveygizmo.com site using an online survey
format. Participants filled the questionnaire either in their own personal computer or other
personal devices such as tablet or a smartphone that allows an Internet browser.
The question order was randomized across all 54 questions in Part I of the survey (Chapter
5) as well as across 10 questions in Part II (Chapter 6) to minimize any bias that might occur
due to a specific order of questions presented. The questions were randomized within each part
only and the two parts were presented as separate sections at all times. Part I was always
completed first before participants were allowed to move on to Part II of the survey. Each
question in Part I was asked one question at a time and participants were not allowed to go
back and change answers. The 10 questions in Part II were presented in one continuous screen
with the order of the questions randomized within Part II. All participants were encouraged to
answer all 54 comparison questions for Part I of the survey and 10 ranking questions for Part II

87
of the survey. Participants were free to leave any questions blank if they did not feel
comfortable answering them.
In addition, the position of the binary choices for all questions in Part I, Sector B and Sector
C, were randomized. Space was made available for comments on individual 54 comparison
questions in Part I to explain their choices and overall comment for Part II to identify any
additional relevant factors.
5.2.1 Participants
Recruitment Process
Retired or active air traffic controllers were recruited to participate in this study. Participants
were required to be a certified air traffic controller in order to participate in this study.
Participation was voluntary and participants were not remunerated for their involvement with
this study. Recruitment letter and flyers were distributed using common ATC website forums
and web ATC network groups such as www.liveatc.net, www.stuckmic.com,
www.avcanada.com, and www.linkedin.com. Controllers’ work emails from personal contacts
were also used to recruit participants.
Participants Demographics
There were a total of 56 retired or active air traffic controllers who responded to the survey. 38
(68%) of the participants were from the United States, 6 (11%) were from Canada, 2 (4%) were
from France, 10 (19%) were from other countries (Table 5-4). Participants’ years of experience
as a controller ranged from 2 years to 37 years with 41 (73%) participants having more than 5
years of experience (Table 5-5). The distribution of level of ATC experience of the participants is
shown in the graph in Figure 5-6.

88
Table 5-4. Nationality of the Participants
United States 38
Canada 6
France 2
Other countries with one participant for each country (Australia, Guam, United Kingdom, Germany, Israel, Sweden, Qatar, United Arab Emirates, Netherlands, Kenya)
10
Table 5-5. Level of Experience of the Participants
Years of experience more than 5 years 41
Years of experience equal to or less than 5 years 15
Figure 5-6. Distribution of Years of Experience
0
1
2
3
4
5
6
7
1 3 5 7 9 11 13 15 17 19 21 23 25 27 29 31 33 35 37
Nu
mb
er o
f P
arti
cip
ants
Years of Experience

89
Participant Response Quality Control
Several following steps were taken in order to ensure all 56 responses were from certified
controllers and were valid. Firstly, the survey was made available to a filtered audience (air
traffic control related professionals) through participant recruitment advertisements made
only on professional ATC-related networks and controllers’ work emails from personal contacts.
Secondly, before participants were allowed to answer any survey questions, they were asked to
make a pledge on the survey that they are certified controllers. Thirdly, the data collected was
checked using inter-rater reliability measures to ensure each individual's responses for both
Part I and Part II of the survey were significantly different from random guessing.
5.2.2 Data Analysis
The data was collected through the tool surveygizmo.com provides in the format of a .csv file.
The data was processed and analyzed using Microsoft Excel and IBM SPSS to find statistical
findings. The results for Part I of the survey are discussed in the following section of this
chapter and results for Part II of the survey are discussed in the next chapter.
5.3 Results
The survey questions were designed, as discussed in section 5.1, so that participants had to
make a binary choice for each comparison question. If the participants are selecting the sector
from the same test class rather than from the distractor class, this is taken as support for the
classification scheme. One of the binary choices is Sector B, the “correct answer” according to
the holistic classification method. The frequency count of participants choosing Sector B for
each testing factor was obtained in order to measure how much participants agreed with the
classes presented. There are 9 comparison questions for each testing factor, so the frequency

90
count across all 9 questions was obtained in order to calculate the percentage of responses
agreed with the class. For example, there were 504 observations for the methodological check;
of those 504 observations, in 415 the participants selected Sector B, yielding a correct response
rate of 82%. The observed correct response rate for each testing factor is shown in Table 5-6.
The likelihood of these observed response rates occurring by random chance were tested using
non-parametric statistical tests (described below).
Table 5-6. The Response Rate Results for Survey
Testing factor Percentage of responses consistent with
classification scheme
Methodological Check
Methodological check, hypothesized large class difference (Single flow vs Star Crosses)
82%
Testing factor #2 Flow concentration 84%
Testing factor #3 Background traffic 80%
Testing factor #4 Different types of flow #1 (Cross vs Merge/Split)
73%
Testing factor #5 Different types of flow #2 (Star vs Cross)
93%
Testing factor #6 Different types of flow #3 (Merge vs Fan)
50%
5.3.1 Statistical Significance Validation
A Binomial Exact Test was conducted using SPSS to measure statistical significance of the
survey results. The null hypothesis of a Binomial Exact Test, 50%, refers to the perfectly
random result meaning either the option A or B is not significantly different from one another.
The null hypothesis in this survey would mean that the testing class is not significantly different
to the class it is being compared to, the distractor class. In other words, it means there is no

91
significant difference between the two classes being compared. Binomial Exact Test was
conducted on each of the six testing factors to determine if the observed frequency of response
for each factor is statistically different from the expected frequency from the null hypothesis
(50%). A significant result indicates that the null hypothesis should be rejected, indicating that
controllers chose sectors from the “similar” class at a rate better than expected from pure
random chance.
The results indicate that there is a statistically significant difference for the methodological
check (testing factor #1), as shown in Table 5-7. The methodological test, testing factor #1, was
conducted as validation of technique and it is not surprising to see 82% of the time participants
agreed.
Statistical significance was obtained for testing factors #2, #3, and #4 (p < .01) as well, as
shown in Table 5-7. This means the proportion of participants agreeing with the classes for
each of the testing factors #2, #3, and #4 are significantly larger than the null hypothesis value,
50%. For these testing factors, the hypothesis that the population mean is 0.5 was rejected at
the .05 alpha level.
One factor, testing factor #6, was observed to be not statistically significant (p = 0.894).
This means participants did not agree that the knowledge skills and abilities associated with a
Merge flow class and the knowledge skills and abilities associated with a Fanning flow class
were different. Therefore the null hypothesis is retained, and it is concluded that these two
classes are not significantly different from one another.

92
Table 5-7. Statistical Significance Test Results
Testing factor Statistical Significance Confidence Interval Methodological Check p < .01 .789 ~ .855 Testing Factor #2 p < .01 .810 ~ .873 Testing Factor #3 p < .01 .763 ~ .833 Testing Factor #4 p < .01 .688 ~ .766 Testing Factor #5 p < .01 .911 ~ .954 Testing Factor #6 p = 0.894 .450 ~ .540
The response rates are illustrated in a graph with their confidence level in Figure 5-7. As
observed in this graph, while the confidence level for testing factor #5 is high, the confidence
levels for other testing factors seem low. In order to look into this further, the examination of
the response rate to individual questions is shown in Figure 5-8.
Figure 5-7. Response Rate with their Confidence Intervals
0%
10%
20%
30%
40%
50%
60%
70%
80%
90%
100%
Res
po
nse
Rat
e (%
of
Pa
rtic
ipa
nts
Ag
reei
ng
wit
h t
he
Gro
up
ing
)
Frequency
Lower CL
Upper CL

93
In Figure 5-8, large circles indicate the average response rate reported in Table 5-6. As
shown in Table 5-7, blue large circles indicate the significant response rates whereas the red
large circle indicates the non-significant response rate. The black small dots indicate the
distribution of each of the 9 comparison question results for each testing factor. As discussed in
the survey design section (Section 5.1 above), 9 different comparison questions were designed
for each testing factor. To determine each testing factor’s significance, the response from all 9
comparison were combined to obtain the overall response rate for each factor. The variation of
the individual black dots in the graph explains the variations caused by unique combinations of
radar maps used for each question.
Figure 5-8. The Response Rate Results for Survey
82% 84%80%
73%
93%
50%
0%
10%
20%
30%
40%
50%
60%
70%
80%
90%
100%
Re
spo
nse
Rat
e
(% o
f P
art
icip
an
ts A
gre
ein
g w
ith
th
e C
lass
ific
ati
on
)

94
The examination of the response rate to individual questions as shown in Figure 5-8
revealed further insights through follow-up analysis on individual comparison questions.
5.3.2 “Outlier” Individual Comparison Questions
As observed in Figure 5-8, several individual comparison questions yielded exceptional
response rates, some with exceptionally high response rates of agreement and some noticeably
lower response rates of agreement. Some of these individual results were selected for further
analysis to gain insights into what additional conditions may have affected controllers’
decisions. These selected cases are listed in Table 5-8 and analyzed further below.
Table 5-8. Follow-up Observations
Factors Interesting Case Test Numbers (See Appendix)
Sector A Sector B Sector C
Methodological Check #121 = 54% ZAU52 ZAU24 ZID91 Testing Factor #2 (Flow Concentration)
#212 = 100% ZDC52 ZID89 ZTL06
Testing Factor #3 (Background Traffic)
#311 = 36% ZFW98 ZOB64 ZAB70
Testing Factor #6 (Merge vs. Fan)
#612 = 13% ZBW33 ZHU65 ZNY49
For the individual case #121, 54% of the participants selected the sector from the same
test class and rejected the distractor sector. The traffic patterns of the sectors involved with this
case are shown in Figure 5-9. From examining the figure, it is hypothesized that while the faint
background traffic with star crossing pattern is being recognized by participants, the dominant
flow in sector A is being equated with the one in sector B. Further analysis is recommended in
the future in order to look into this case further.

95
Figure 5-9. Sectors for Individual Case #121
For the individual case #311, another case with non-statistically significant results, some
predictions can be made why participants chose Sector C to be more similar to Sector A by
examining the traffic patterns of these three sectors in Figure 5-10. As part of the classification
exercise performed according to the holistic classification scheme, Sector A in Figure 5-10 was
not categorized to be in the class with heavy background. This is because relative to other
sectors that were categorized to be in the class with heavy background, this sector's traffic
background (Sector A in Figure 5-10) was determined not to be as heavy. However, it is
predicted that participants considered Sector A and Sector C in this case to be more similar due
to their level of background similarity (i.e. Sector A and Sector C's traffic background level is
more similar than Sector A and Sector B's traffic background level). Another prediction is that
Sector A
Sector B Sector C

96
participants thought Sector B is not similar to Sector A because Sector B consists of vertical
handoffs.
Figure 5-10. Sectors for Individual Case #311
Another interesting individual case is the test (Case #212) case with 100% of the
participants agreeing with the class. The sectors of this question are shown in Figure 5-11. One
interesting observation from this question is that the two sectors from the same class (Sector A
and B) not only share very similar flow concentration but also that they both have crossing with
very similar angles (i.e., they both have very "narrow" type of crosses). Moreover, they both
share very similar location of crosses. This suggests that the reason the controllers agreed with
this class is perhaps not only due to the concentration flow similarity.
Sector A
Sector B Sector C

97
Figure 5-11. Sectors for Individual Case #212
Another interesting case is the individual case #612 as shown in Figure 5-12. For this case,
only 13% of the participants indicated that Sector B is similar to Sector A, which means 87% of
the participants indicated that Sector C is similar to Sector A. In order to determine if this result
is significant disagreement, a post-hoc analysis was conducted for this specific case. The same
Binomial Exact Test was run for this follow up analysis, except with different degrees of
freedom (now N = 56) and a Bonferroni correction applied, resulting in significance level set at
p < 0.01. The results showed that there was a significant disagreement for this individual case,
#612 (p < .01, with confidence interval from .056 to .228). The significant disagreement means
that the subject-matter-experts chose the distractor class to be the sector that belongs in the
same class as the Sector A (the testing class).
Sector A
Sector B Sector C

98
Figure 5-12.Sectors for Individual Case #612
When examining the traffic pattern of the sectors for this case (Figure 5-12), it can be
observed that Sector A and Sector C share very similar flow concentration. It is evident that
participants did not choose Sector B to be similar to Sector A due to the similarity of their merge
flow pattern. Another similarity observed between Sector B and Sector C is the existence of
race-track maneuvering pattern.
5.4 Discussion
Overall, the quantifiable results from the survey, as illustrated in Table 5-6 and Figure 5-8,
showed significant support for the structure-based classifying conditions used in the holistic
classification method. Controllers agreed that knowledge, skills, and abilities are more easily
transferable between structurally similar sectors, or sectors with similar traffic patterns, than
Sector A
Sector B Sector C

99
the ones with not structurally similar sectors. By testing specific components of the holistic
classification method individually, the five testing factors, it was possible to determine how
structurally similar sectors need to be in order to support minimal differences training. The
validated structural components as per the survey results are the concentration of flows, the
level of densely distributed traffic in the background, and some different types of flows. The
only factor that was not agreed to be effective for using to develop the classification was the
sub-class difference, the Merge flow class versus the Fanning flow class (as highlighted in Figure
5-13).
Figure 5-13. Non-significant Testing Factor #6 – Merge/Split flow class vs. Fanning flow
class
From the result, it can be concluded that controllers did not see significant difference
between knowledge, skills, and abilities associated with these two classes. As such, the holistic
classification method is adjusted accordingly and the new holistic classification method is
ModeratelyConcentrated flows
Heavilyconcentrated flows
Heavily concentrated flows with densely distributed traffic in the background
Single flow
Crosses
Merges/splits
Parallel flows
Star-crosses
Almost no traffic Complex traffic
Others

100
shown in Figure 5-14. In the modified classification method, the sub-classes, “fanning flows” are
removed as this testing factor was found not to be significant from the survey.
Figure 5-14. The modified holistic classification method
5.4.1 Decision Making Factors Identified through Comments
While the results from the quantifiable data of the survey for Part I indicates that most of the
classifying conditions such as the different concentration of flows and different types of flows
used in the holistic classification method is effective, this does not limit the classification
method to be bounded by these conditions only. The qualitative data from this survey from the
ModeratelyConcentrated flows
Heavilyconcentrated flows
Heavily concentrated flows with densely distributed traffic in the background
Single flow
Crosses
Merges/splits
Parallel flows
Star-crosses
Almost no traffic Complex traffic
Others

101
comments provides an insight to the next step of developing more effective classification
scheme that support minimal differences training approach.
Throughout the survey, participants occasionally left comments for some questions
explaining their choices. These comments were helpful providing useful insights into more
detailed controller's perception of similar airspaces are in terms of knowledge, skills, and
abilities transfer. Although not all participants left comments explaining their choice for all
questions, a variety of comments for each question provided insight to why participants were
making the selections they did. By examining these comments, some specific decision making
factors were identified by the controllers. The most frequently cited factors are overall
complexity/difficulty of a sector, the location of critical points, the holding patterns, area/size of
a sector. These factors are discussed further in section below.
Overall complexity/difficulty of a sector
Many participants indicated that they chose a “similar” sector based on the overall difficulty, or
the overall complexity, of the sectors. 25% of the comments addressed their decision being
affected by sectors’ overall complexity / difficulty. One participant commented, “the sector I
haven't chosen is much more difficult”, indicates that the participant did not think the other
sector shared interchangeable knowledge, skills, and abilities because the sector is simply much
more “difficult” sector than the other sector. The common characteristics of sectors controllers
tend to describe as “very difficult sector” consisted of many crosses or a sector with a very
narrow shape that significantly limits its maneuvering space as the example shown in Figure
5-15.

102
Figure 5-15. Examples of very “difficult” sectors
Multiple participants indicated that sectors with multiple crosses require "full attention"
watching all aircrafts throughout the sector, and exceptional scanning techniques that cannot
easily be developed. For this reason sectors with multiple critical points may be the most
difficult to learn and require significant amount of experience specific to that sector. An
example comment from a participant avoiding to choose the sector requiring very good
scanning techniques is “Sector A requires most of the attention to one location. This is also true
with the sector I chose. The sector I did not choose would require very good scanning
techniques”.
Creating a class based on the same location of critical points may be infeasible as the
locations of multiple critical points cannot be exactly the same in two sectors. However, the
numbers of critical points, the number of flows associated with a critical point, the angle of
crosses, or the closeness of critical points to the sector’s boundary are factors that can be
considered in order to develop more detailed classification scheme.
In general, narrow sectors and sectors with multiple critical points were identified as most
"complex/difficult" traffic to work with and the most difficult to learn. Considering the
complexity of a sector as the most important factor as identified in the survey, the sectors with
either condition may need to be grouped separately due to their more challenging requirement

103
on specific skills and techniques that take longer time to develop. Grouping these “difficult” or
“complex” sectors together also may mean that transferring within this class may be easier than
transferring to this class from another class.
The Location of Critical Points
10% of all comments explained that these controllers based their decision based on the location
of critical points in the sectors. Some controllers refused to choose sectors with critical points
near the boundary of the sector regardless of its similar traffic pattern to the Sector A. An
example pair of sectors (similar traffic pattern but with the location of critical point being
different) is shown in Figure 5-16.
Figure 5-16. An example of two different locations of critical points
A controller commented “Sector A has crossing traffic well within its sector. The sector I did
not choose has crossing traffic near the sector boundary requiring the trainee to learn to separate
traffic before it enters his sector”. Other comments indicating the significance of the locations of
critical points is “did not choose because of the merge near boundary” and “The sector I chose is
very similar to Sector A. There are two confliction points but they are almost in the same location
as Sector A.”.

104
From these comments, it can be observed that the amount of time given to resolve any
confliction in a sector can be a significant factor dictating the difficulty of the sector. Perhaps
having the experience of controlling confliction points near the boundary of a sector will allow
the controller to adapt to another sector with confliction points near the boundary. It can be
observed that having the confliction points well within the sector is easier to learn and control
than sectors with confliction points near the boundaries.
Future work should explicitly include the directionality of the flows in order to help classify
the sectors more accurately according to the location of critical points. For an example, knowing
the directionality of flows will identify whether the confliction point is at the entering position
or leaving position, which can change the level of difficulty of the left sector in Figure 5-16
dramatically.
Holding Pattern
12% of the comments indicated that controllers often based their decision on choosing similar
sectors depending on the existence of a holding pattern in a sector. For all questions that
involved a sector with a holding pattern, controllers commented on the holding pattern. An
example sector with a holding pattern is shown in Figure 5-17.
Figure 5-17. An example sector with a holding pattern

105
Controllers indicated that a sector with a holding pattern is more difficult, requiring longer
time to learn the sector. Example comments include “The sector I did not choose has a holding
pattern near the boundary which requires lots of attention” and “holding patterns and every day
usage of holding is extremely complex”.
Controllers also were able to figure out that a sector is an inbound sector when the sector
had a holding pattern. Some controllers commented “The sector on the left appears to be an
inbound sector as evidenced by the presence of a holding pattern” and “Sector A is an inbound
sector, shown by the holding pattern”.
These comments are insightful for refining the classification scheme further. Even though
the current holistic classification scheme does not include holding patterns, the comments from
this survey indicated that the experience of dealing with a holding pattern can be a very
transferrable skill to another sector with a holding pattern. It was identified that techniques
such as holding patterns or knowing how to put all aircrafts in trail to fly the specific narrow
airway (to accommodate for a narrow airspace) might be easily transferable techniques
transferable when moving to another sector with similar conditions (e.g., narrow space with
limited amount of "room/airspace"). Moreover, developing classes based on a traffic pattern
such as a holding pattern will also group inbound sectors together due to this specific traffic
pattern’s characteristic. This specific class would allow skills and techniques associated with
not only holding patterns but also with an inbound sector easily transferable.
Sector Area Size
Many controllers (15% of the 230 comments) based their decision on choosing a similar sector
based on the similarity of the shape and/or area of sectors. Controllers particularly commented

106
often that a long and thin sector permits only a limited amount of space for maneuvering any
aircrafts in the sector, making this sector exceptionally difficult sector to control requiring
special techniques to learn. An example of such sector is shown on the left side in Figure 5-18. A
controller commented “Sector A is very long and thin. This makes it more of a ""spacing"" sector
than anything else. The width of the sector would make it very difficult to use radar vectors for
separation.”.
Figure 5-18. An example of two sectors with very different area and shape
On the contrary, controllers commented that a sector with “extra room” is an easier sector
to learn. An example comment indicating that the sector with an “extra room” is easier is “Sector
A is skinny with crossing traffic, which would make training on a bigger sector with crossing
traffic easy” indicates that moving from the smaller and narrower sector to the larger sector
would be much easier than the other way.
5.5 Chapter Summary
In summary, the overall result of the survey indicates that the structure-based classification
technique is an effective way to determine classes that support minimal differences training
determined through the survey.
The objective stated earlier in the chapter was successfully achieved. The objective is re-
stated below:

107
Chapter Objective: Test the effectiveness of structure-based classification techniques against
perceptions of broader group of controllers.
The first part of the survey addressed the objective stated above by evaluating the
effectiveness of the current holistic classification scheme. The survey tested six structure-based
factors that were used as a basis for the holistic classification scheme. Overall, the statistical
result from the survey confirms that the holistic, structure-based classification, identified
similar classes of sectors. Five of the six components factors tested were agreed to be an
effective basis. Based on the factor that was found not to be significant, the holistic classification
scheme was adjusted accordingly. The survey results show that when sectors share similar
concentration of flows, share similar level of background traffic, or share similar types of flows
(crosses, star-crosses, merges/splits, and single flows), controllers feel that the ability to
interchange knowledge, skills, and abilities between sectors increases.
In addition, the follow-up analyses on the results of individual questions as well as the
comments left by the participants provided further insights into other factors relevant to
determining similar sectors. Some factors such as the location of critical points may be
infeasible to be incorporated into the classification scheme as the locations of multiple critical
points cannot be exactly the same in two sectors. However, it was identified through the study
that the number of critical points, the number of flows associated with a critical point, the angle
of crosses, or the closeness of critical points to the sector's boundary are the important factors
that can be considered for inclusion in future classification schemes. These factors are not yet
directly incorporated in the holistic classification method but should be researched further to
be incorporated into the current classification scheme to identify similar classes that support
minimal differences training. However, care must be taken that combining or adding additional

108
factors can dilute the interpretability of the resulting classification scheme. There are also a
finite number of sectors, and developing schemes that incorporate an excessive number of
factors will limit the size (and therefore the value and the practicality) of a class of generic
sectors.

109
Chapter 6
Validating the Identified Factors Affecting Sector Transitions
The literature review in Chapter 2 of this thesis identified that there appears to be little to no
previous work identifying the most important factors affecting a controller's ability to
transition between different sectors. As such, a list of factors that contribute to the similarities
of sectors affecting the amount of training in transitions was identified in Chapter 3 in order to
support identifying classes of sectors expected to have fewer transition barriers.
In this chapter through an online survey, the factors identified to be important in
determining airspace similarities are assessed again through a broader group of controllers to
verify the factors’ significance as well as to measure their relative importance. Therefore, the
objective of this chapter is as stated below.
Chapter Objective: Verify and assess the relative importance of the key factors relevant to
controller sector transitions as cited in controller interviews reported in Chapter 3.
Results show that there are significant groups of factors, some groups being deemed more
important than others.
6.1 Survey Design
The second part of the survey was designed to determine the relative importance of the factors
affecting the similarity of airspace sectors, as determined from the semi-structured interviews
reported in Chapter 3 through 6-point Likert scale rating questions. Each factor represents a
characteristic or property of a sector. Participants were asked to assess how important it was
for sectors to share the factor in order for controllers to be able to learn the new sector with

110
less effort than traditionally required. A key goal was to assess the perceived importance of the
factors across a larger number of subject matter experts. Based on each factor’s importance and
its applicable relevance to minimal difference training approach, the results will be used to
direct future efforts on enhancements to sector classification schemes.
The Factors Examined in the Survey
This survey was designed to validate the significance of the factors hypothesized to be
important in determining similarity of airspaces when it comes to transition training. Two new
factors, Traffic Volume and Altitude, were added to the list in the survey as these two factors
were repeatedly indicated as important ATC complexity factors in the previous research.
The importance of eight of the ten factors identified in Chapter 3 was determined in this
survey. Two of the factors, Hotspots and Special Areas were inadvertently not included in the
survey due to technical challenges experienced while setting up the survey. As such, the 10
factors validated for their relative importance in this survey are listed in alphabetical order in
Table 6-1; descriptions of these factors can be found in Section 3.2.1.
Table 6-1. List of 10 factors validated for their relative importance in survey – Part II
Factors 1 Aircraft Types 2 Altitude
3 Coastal Area
4 Traffic Complexity
5 Knowing the Neighbor Sectors
6 Sector Area Shape and Size
7 Traffic Pattern
8 Types of Flows
9 Traffic Volume
10 Weather Condition

111
Question Design
The survey questions are designed to probe participants’ perception on the importance of each
factor when learning a new sector. The ten questions are constructed as below in Table 6-2.
Each question was asked with a beginning sentence “When you make a transition to another
sector and are about to operate it for the first time...”.
Table 6-2. List of Questions Asked for Survey – Part II
Factor Question as Presented in the Survey Aircraft Types ... it helps to have the experience of controlling similar aircraft types in the
past. Altitude ... it helps to have controlled similar altitude range of the new sector in the
past. Coastal Area ... it helps to be transferred to within the same coastal area (e.g., from a
sector in the West coast to another sector in the West coast) Traffic Complexity
... it helps to have the experience of dealing with a similar level of traffic complexity of the new sector.
Knowing the Neighbor Sectors
... it helps to have the experience of controlling in the past, or having the extensive knowledge of the new sector's neighbor sectors?
Sector Area Shape and Size
... it helps that sector shape and area size (allowed maneuvering space) are similar to the one you've controlled before.
Traffic Pattern ... it helps to have the experience of controlling a similar traffic flow pattern in the past. (e.g. crossing traffic vs. merging traffic)
Types of Flows ... it helps to have controlled the same types of flows (arrival, departure, and/or over-flight) in the past. (e.g. if the new sector's primary flows consists of arrival flows, having the experience of controlling arrival flows in the past)
Traffic Volume ... it helps to have the experience of operating a sector with a similar traffic volume in the past.
Weather Condition
... it helps that the new sector's weather condition are similar to the one you've controlled in the past.
Participants responded using a 6-point Likert scale, ranging from “strongly disagree” to
“strongly agree” (Table 6-3). A six point scale excluding the neutral category was used in order

112
to encourage the indifferent respondents to make a choice. Participants who do not wish to
answer the question had a choice to leave any questions unanswered.
Table 6-3. The Likert Scale Used for Participants to Rate Questions in Survey – Part II
1 2 3 4 5 6 Strongly disagree
Mostly disagree
Somewhat disagree
Somewhat agree
Mostly agree
Strongly agree
6.2 Survey Procedure
The survey in Chapter 5 and Chapter 6 were conducted together, although each part was
presented and analyzed separately. As such, the survey procedure details are applicable for
both surveys and were explained in section 5.2 of this thesis.
6.3 Results
In order to verify and measure the relative importance of the ten factors, participants expressed
their opinion on how important each factor is through the Likert scale rating system. In order to
determine if there were statistically significant differences in the relative ranking of the factors,
the Friedman Rank Test (Friedman et. al., 2007), a non-parametric statistical test, was used.
This statistical method is further explained in the next sub-section.
While the values obtained in Table 6-4 cannot be used to verify the ranking order of the
factors, some observations still can be made from these values. It can be observed that the mean
values for all factors were above 3.5 and mode values for all factors equal to 4 or higher,
indicating that all factors had a mean and mode ranking value to be “(strongly) agree that the
factor is important to be similar between two sectors to minimize transition barriers”.

113
Another valuable observation is that the factors with higher average rankings such as
Traffic Complexity, Traffic Volume, and Traffic Pattern, their distribution was much tighter than
other factors (i.e., the smaller standard deviation values). This means more participants agreed
that these factors are important and there were very little variations in their answers. In
contrast, the factors with lower ranking values such as Size and Coastal Area had broader
distribution (i.e., the bigger standard deviation values) meaning that there were higher
variations in their answers and not all participants agreed that these factors are important or
not important.
Table 6-4. Basic Statistical Measures of the 10 Factors
Testing Factor Mean SD MODE
Traffic Complexity 5.46 0.60 6
Traffic Volume 5.25 0.69 5
Knowing the Neighbor Sectors
5.20 1.07 6
Traffic Pattern 5.18 0.72 5
Types of Flows 5.04 0.87 5
Altitude 4.86 0.86 5
Aircraft Types 4.50 0.93 5
Weather Condition 4.11 1.14 4
Sector Area Shape and Size
3.79 1.14 4
Coastal Area 3.79 1.41 4
6.3.1 Statistical Significance Validation
Participant Likert scale rankings for each of the ten factors were used to measure their relative
importance using the Friedman Rank Test. The Friedman Rank Test is a non-parametric test
used to test for differences between groups; it was used in place of parametric repeated
measures test such as ANOVA to avoid assuming equal measurement difference between the 6

114
ranking choices identified in Table 6-3. SPSS was used to conduct the analysis. Each
participant’s response was used to calculate each factor’s mean rank across participants. Figure
6-1 shows a detailed illustration of how mean rank across participants for each factor is
calculated. These ranked lists then formed the basis for subsequent analysis.
The left table of Figure 6-1 shows the list of Likert scale rating from participants, on a scale
of 1 to 6. The right table of Figure 6-1 illustrates the process of calculating Friedman mean
ranks. First, for each participant, each factor is ranked relative to each other (in this case, there
are 10 factors so each factor is ranked from 1 to 10) depending on participant’s Likert scale
response value. In the cases where more than one factor had the same response value (e.g. a tie),
the mean rank is averaged amongst these factors. After these rankings are established for all
participants, Friedman mean rank values are calculated by averaging relative ranking values
across all participants for each factor.
Figure 6-1. The Process of Calculating Friedman Mean Ranks
Likert Scale Rating from Participants (1~6)Participant #1
…
Participant #56
Traffic Complexity 6 5Traffic Volume 4 5
Knowing the Neighbor Sectors 6 5
Traffic Pattern 5 6Types of Flows 6 2
Altitude 6 4
Aircraft Types 4 3Weather Condition 4 2
Sector Area Shape and Size 3 2
Coastal Area 1 1
Relative Ranking (1~10)
…
Mean Rank across participants
Participant #1
Participant #56
Traffic Complexity 8.5 8 7.64Traffic Volume 4 8 6.91
Knowing the Neighbor Sectors 8.5 8 6.86
Traffic Pattern 6 10 6.70Types of Flows 8.5 3 6.26Altitude 8.5 6 5.79
Aircraft Types 4 5 4.55Weather Condition 4 3 3.76
Sector Area Shape and Size 1 1 3.49
Coastal Area 2 3 3.04

115
From the graph it is evident that some factors such as Complexity, Traffic Volume, Knowing
the Neighbor Sectors, Traffic Pattern, Types of Flows, and Altitude are considered more
important by the participants than other factors. Analysis showed that there was a statistically
significant difference in the perceived importance of different factors, χ2(9) = 181.014, p = 0.000.
This significance indicates that some factors were considered more important than other
factors and the result is statistically reliable and very unlikely the result due to random chance.
Figure 6-2. Mean Ranks for 10 Key Factors
(square brackets representing comparisons used in follow up analysis,
square bracket with an asterisk indicates significant difference)
In order to examine which factors specifically are considered more important than others,
some selected post-hoc analyses were performed. In order to avoid an excessive number of
post-hoc analyses (i.e., run post-hoc analysis for every combination of the factors), Figure 6-2
was used to determine which pairs of factors would be reviewed for further analysis. As a result
*
*
0
1
2
3
4
5
6
7
8
9
Frie
dm
an M
ean
Ran
ks

116
of reviewing which pairs of adjacent factors had the largest difference between them, the four
pairs from the graph were selected for further comparisons, as indicated with square brackets
in Figure 6-2. The selected four comparisons are Traffic Complexity and Traffic Volume, Types of
Flows and Altitude, Altitude and Aircraft Types, and Aircraft Types and Weather Condition.
Four post-hoc analyses with Wilcoxon Signed-Rank Tests were conducted with a
Bonefrroni correction applied, resulting in significance level set at p < 0.013. The results of the
follow up analyses showed that there was a significant increase in perceived importance in
Complexity compared against Traffic Volume (Z = -2.668, p = .008) as well as in Altitude
compared against Aircraft Types (Z = -2.545, p = -.011). The significant pairs are indicated with
an asterisk above its square bracket in Figure 6-2. However, there were no significant
differences between factors Types of Flows and Altitude (Z = -1.099, p = 0.272) or Aircraft Types
and Weather Condition (Z = -2.376, p = 0.017). As a result, three distinct groups of factors are
identified with decreasing relative importance for controller transitions. The three groups are
presented in different shades and patterns in Figure 6-3. The implications of these results are
discussed in the Discussion section of this chapter in 6.4.

117
Figure 6-3. Friedman Mean Ranks for 10 Key Factors
(shades indicate significantly distinct classes)
The relative perceived importance data was also examined for differences between
different groups of countries as well as in different groups of level of experience in ATC. The
results showed that there was some difference in mean ranking between U.S. controllers versus
Non-U.S. controllers (Figure 6-4a). However, there is hardly any difference in mean ranking
between controllers with more experience versus less experience (Figure 6-4b).
0
1
2
3
4
5
6
7
8
9
Frie
dm
an M
ean
Ran
ks

118
Figure 6-4a. Mean Ranks comparison
between US controllers vs. Non-US
controllers,
Figure 6-4b. Mean Ranks comparison
between controllers with over 5 years of
experience vs. controllers with less than 5
years of experience)
*error bars indicate 95% confidence intervals
The difference in nationality seemed to produce some difference in their perspective of
importance of factors. Overall, all controllers regardless of nationality agreed that Aircraft Types,
Coastal Area, Weather Condition, and Size of a Sector Area is relatively less important than other
factors tested in the survey. Interestingly, controllers from US indicated Traffic Complexity
factors as relatively the most important factor whereas controllers from other countries
indicated Traffic Pattern as relatively the most important factor. Often, the meaning of traffic
complexity can encompass other factors. This was discussed previously in section 3.2.1.
However, the difference in years of experience does not differentiate in their perspective of
importance of factors.
0
1
2
3
4
5
6
7
8
9Fr
ied
man
Mea
n R
anks
Mean Ranks (US and Non-US)
US
Non-US
0
1
2
3
4
5
6
7
8
9
Frie
dm
an
Me
an
Ra
nks
Mean Ranks (Years of Experience)
Experience > 5years
Experience <= 5years

119
6.4 Discussion
Overall, the quantifiable results from Part II of the survey indicated that there were three
significant groups of factors, as determined by controller perceptions of the relative importance
of the factors. The first significant grouping has one factor, the traffic complexity. This perhaps
means that in order for a controller to be able to easily transfer most knowledge, skills, and
abilities to another sector when transitioning, it is essential that the level of complexity be the
same between the old sector and the new sector. However, this is mostly directional, meaning
that having the experience of dealing with a very complex sector, such as a sector with many
critical points or a very narrow area, will most likely allow the controller to be able to easily
learn a broader range of sectors. Conversely, a controller with only the experience of an "easy"
sector, such as a large sector with minimal confliction points and low traffic level, will most
likely be able to easily move to only a very limited range of sectors. These controllers will
require significantly more time learning a new sector if the new sector is more “complex” than
the one they have controlled in the past.
The second significant grouping consists of Traffic Volume, Knowing the Neighbor Sectors,
Traffic Pattern, Types of Flows, as well as Altitude factors. Traffic Pattern, which was the factor
most frequently cited in the controller interviews in Chapter 3, was identified to be still very
important as identified in this survey, though not the most important.
The result of the ranking of these factors in this survey provides insight into the
effectiveness of the current holistic classification scheme. The holistic classification scheme
uses a structure-based classification technique which mainly relies on the traffic pattern of a
sector. The important factors identified however are highly interrelated to one another. For
example, the general complexity and volume of a sector can usually be determined by a sector’s

120
traffic pattern. This indicates that the current classification scheme is approaching the “right
direction” in developing an effective classification scheme to support minimal differences
training.
However, the classification scheme can be refined further to consider other important
factors identified through this survey, such as the Knowing the Neighbor Sectors and Types of
Flows. Knowing the Neighbor Sectors factor is somewhat already practiced in current FAA’s ATC
operations, as a controller is usually free to move within the area of specialization which is
composed of a few adjacent neighbor sectors. This can be investigated further to look for
opportunities to group larger number of sectors together that a controller can easily move to
within the neighbor area. Factors such as Knowing the Neighbor Sectors have an intuitive
common sense appeal that belies the difficulty in developing a repeatable, consistent metric.
There is also the challenge of determining which neighboring sectors (vertical, horizontal,
sharing a lengthy boundary) are relevant, and how different neighboring sectors are combined.
The Types of Flows factor can be addressed by examining traffic patterns that show
directionality and classifying further depending on this additional information. An additional
challenge requiring further research is assessing how each factor could be operationalized as
part of a classification scheme.
Observing some difference in controllers' perceived importance of factors when compared
between US and other countries indicates that controllers from different countries might
develop slightly different perceived importance of factors. The results from controllers from
other countries showing that traffic pattern is the most important factor indicates that a
structure-based classification scheme can be promising in some other countries as well.
However, overall, all countries regardless of their nationality agreed that Aircraft Types, Coastal

121
Area, Weather Condition, and Size of a Sector Area were factors relatively less important
compared to other factors. This perhaps indicates that these factors should be considered
secondary when developing an effective classification scheme supporting minimal differences
training approach. Observing no difference in controllers' perceived importance of factors when
compared by their years of experience indicates that the years of experience does not dictate
controller's perceived importance of factors relevant to airspace similarities.
Other Important Factors Identified through Comments
Participants were allowed to comment additional factors they think are important to be similar
between moving-from and moving-to sectors by responding to the question “Are there any
other factors that need to be similar to help learning a new sector easier/faster?” Eight of 56
participants indicated a few additional factors such as similar range of scope, similar equipment,
same rules, and individual differences as factors that would affect the transferability of a
controller. While the number of comments provided by the participants is of limited quantity,
the detailed description on these extra factors they think are important provided insight into
the factors that may be worthwhile considering in the future in order to enhance the current
classification scheme.
The additional factors participants indicated to be important are factors such as similar
range of scope (e.g. 50 mile range in low altitude sector vs. 200 mile range in high altitude
sector), equipment similarity, angle of conflictions, number of confliction points, direction of
traffic flow, quality of trainers, individual (controller’s) differences, and magnetic direction of
the flows. Several factors cited were judged to be already captured by existing factors.
Specifically, participants cited angle of conflictions, number of confliction points, as well as

122
direction of traffic flow are the factors that are judged to be encapsulated in the traffic pattern
factor.
6.5 Chapter Summary
In summary, the overall result of the survey indicates that the structure-based classification
technique is an effective way to determine classes that support minimal differences training
determined through the survey.
The objective stated earlier in the chapter was successfully achieved. The objective
statement is re-stated below.
Chapter Objective: Assess the relative importance of range of key factors relevant in
transitions cited in controller interviews.
The second part of the survey addressed the objective #1 by verifying that the ten factors
evaluated are important and three distinct groupings were identified depending on their
relative importance. The factors' relative importance and transferability as identified through
the survey results provide a useful insight into directing future efforts on enhancements to
sector classification schemes.

123
Chapter 7
Conclusions
Air traffic control is a challenging profession involving complicated time-critical and life-critical
tasks and operations. This results in significant time to train one individual to become a
certified controller. The lengthy training extends even for fully certified controllers if they are
relocated and must learn new pieces of airspaces. This causes significant staffing inflexibility
and inefficient air traffic management. Motivated by the opportunity to combat this challenge,
the thesis examined ways to support generic airspace concept by identifying classes of existing
airspaces that a controller can move with easier mobility than the current ATC system.
7.1 Research Objectives and Key Findings
The general research question of the thesis stated at the beginning of the thesis in Chapter 1
was “How can we identify groups of airspace sectors that will have fewer barriers to the transition
of controllers between different sectors (in order to support minimal differences training
approach)?”.
The resulting three objectives of the thesis to answer the general research question above are
restated and discussed how they were achieved below.
Objective 1 – Identify key factors that affect the transferability of a controller’s existing
knowledge skills and abilities to a new airspace sector.
The first research objective was addressed by reviewing the literature (as detailed in
Chapter 2) and conducting the semi-structured interviews with subject-matter-experts (as
described in Chapter 3). The literature review in Chapter 2 of this thesis identified that there

124
appears to be little to no previous work identifying the most important factors affecting a
controller's ability to transition between different sectors. A key contribution of this work is
identifying a list of factors that contribute to the similarities of sectors affecting the amount of
training in transitions (Chapter 3). This list supports the development of methods classifying
sectors expected to have fewer transition barriers. Through controller interviews, some
techniques that are easily transferable were identified as well. Such techniques are flow control,
sequencing technique, and speed control that are typically used in merging traffics.
Objective 2 – Develop a method, based on a few of the most important factors identified from
Objective 1, for determining classes of sectors expected to have fewer transition barriers.
The second objective was addressed by developing the two classification methods
presented in Chapter 4. From the literature review, as well as the interviews conducted for
Objective 1, traffic patterns were identified as a valuable and appropriate initial basis for
identifying classes of generic sectors. Consequently, commonly occurring traffic patterns were
identified and two distinct classification methods were developed and explored, the holistic
classification approach and the decompositional classification approach. The holistic
classification approach produced 17 classes of the current 404 high-altitude NAS sectors and
these classes were used later in Chapter 5 in order to measure the effectiveness of the
structure-based classification method. Analyses done as part of the decompositional
classification emphasized the importance of narrowing down the features that are most
important for transitions in order to produce more effective classes.
Objective 3 – Evaluate the developed classification method and validate the key factors
identified in Objective 1 through subject-matter-experts.

125
Finally, the third objective of thesis was addressed by conducting an online survey with 56
certified air traffic controllers. The effectiveness of structure-based classification techniques
was measured against perceptions of subject-matter-experts in Chapter 5 and the relative
importance of the key factors relevant to controller sector transitions were verified to be
indeed important and their relative importance was also assessed in Chapter 6. The findings
affirmed that structure-based classification is a valid step worth assessing for its effectiveness
more in the future. Additional factors were identified that are not yet incorporated into the
classification methods. Some of these factors, such as the location of critical points or hot spots,
may be infeasible to be incorporated, as the locations of multiple critical points cannot be
exactly the same in two sectors. Some factors, however, should be analyzed further in order to
assess their feasibility to be incorporated into classification schemes. Notable such factors are
the number of critical points, the number of flows associated with a critical point, the angle of
crosses, and the closeness of critical points to the sector's boundary.
7.2 Summary
The major finding of this thesis is that through the development and validation process of the
studies performed in this thesis, a structure-based classification scheme was found to be an
effective way to classify sectors in order to support minimal differences training. The resulting
classes of sectors are expected to have less transition barriers. This is because the traffic
patterns in a sector reflect various operations that require certain cognitive abilities of
controllers. The skills, abilities, and knowledge associated with these specific operation details,
can be transferred more efficiently amongst sectors with similar traffic patterns.
This finding is promising implication that there is a lot of potential for existing airspaces to
be categorized, without altering any physical properties of airspaces, so that air traffic

126
management and controllers can easily recognize which airspaces current controllers can
simply move to with less training.
However, this does not mean the classification scheme developed in this thesis captures
the most effective way of classifying current airspace system. The following section discusses
some recommendations and future work suggested to enhance the work done in this thesis.
7.3 Recommendations and Future Work
The identification of classes of sectors with similar structure provides a basis for assessing the
potential of near-term deployment of generic airspace. Having identified classes of sectors,
future work should further refine the classes, and use human-in-the-loop experiments to verify
the relevance of the identified differences. Through these exercises of refining the classes and
human-in-the-loop experiments, the classification scheme can be polished to the state it can be
applicable to the ATC system and yield effective results.
It is recommended that further research be performed to assess how each factor could be
operationalized as part of a classification scheme. However, care must be taken in determining
which factors to be incorporated into the classification scheme, as there are a finite number of
sectors and developing classification methods that integrate an excessive number of factors will
limit the size (and therefore the value and the practicality) of a class of generic sectors.
Moreover, the results from this study also discovered that there exist factors beyond ATC
operational factors, the cultural factors, which are important considerations in support of the
minimal differences approach to generic airspace. Factors such as individual differences and
motivational factors are a couple of representative cultural factors identified. Significant
amount of research has been done in the “Organizational Behavior” research area in order to

127
look into how cultural differences between different organizations affect employees’ and
companies’ performance.
In the future, various factors beyond ATC operational factors can be researched further in
order to develop more effective air traffic management system. Suggested factors to be
researched are decision support tool usage, procedures, collaboration requirements, and other
organizational and motivational factors that influence controllers’ transition barriers. These
factors can be investigated further to examine how they affect decision-making and learning
processes when controllers transition between different facilities. Based on these findings, the
current ATC training model can be extended in order to capture the impact of differences
between facilities. These models then can be used to develop methods to minimize these
differences in order to increase staffing flexibility.
Understanding how these organizational and operational differences and factors can be
addressed will have practical contribution to different air traffic control organizations by
providing ways to increase the efficiency of air traffic controller training and staffing. The
challenge of moving workforce around is not only specific to ATC organizations. The results will
also be of interest to other organizations that involve complex systems; knowledge of the
success (or failure) of ways to bridge cultural differences will help other related application
areas such as healthcare and military.

128
References
Alipio, J., Castro, P., Kaing, H., Shahd, N., Sheizai, O., Donohue G.L., and Grundmann K. (2003).
Dynamic Airspace Super Sectors(DASS) as High-Density Highways in the Sky For A New US
Air Traffic Management System. AIAA/IEEE Digital Avionics Systems Conference, 12-16
October 2003
Arad, B.A. (1964). The Control Load and Sector Design. Journal of Air Traffic Control, pp. 13-31.
Burkman, T., Ingram, D., McDonough, R.J., Wendling, V.S., Borowski, M., Glover, G.K., Kalbaugh Sr.,
S., St.George, R.J. (2010), High Altitude Trajectory-based Generic Airspace, MITRE product
# MP100232, The MITRE Corporation.
Bolczak, R., and Celio, J. (2005). Accommodating ATC System Evolution through Advanced
Training Techniques, Proceedings of American Institute of Aeronautics and Astronautics,
5th Annual Meeting.
Buckley, E. P., DeBaryshe, B.D., Hitchner, N., & Kohn, P. (1983). Methods and Measurements in
Real-Time Air Traffic Control System Simulation (DOT/FAA/CT-83/26). Atlantic City, NJ:
DOT/FAA Technical Center.
Burkman, T. (2010). High Altitude Generic Airspace Suitability Assessment, MP100232, The
MITRE Corporation, McLean, VA.
Camp, G., Paas, F., Rikers, R., and van Merri enboer, J. J. G. (2001). Dynamic Problem Selection in
Air Traffic Control Training: A Comparison between Performance, Mental Effort and
Mental Efficiency. Computers in Human Behavior 17: 575–595.
Cavcar, A. and Cavcar, M. (2004). New Directions for ATC Training: A Discussion, The
International Journal of Aviation Psychology, 14(2), 135–150
Celio, J. C. (2005). Review and Analysis of Air Traffic Controller Education and Training, The
MITRE Corporation, McLean, Virginia
Cho, A., Albuquerque, E., Histon, J. (2011), Radar Track Maps of NAS High Altitude Sectors,
University of Waterloo, Ontario, Canada, http://www.eng.uwaterloo.ca/~acho/
UW_SYDE_HCOM_NAS_Radar_Track_Maps.pdf
Cho, A., Histon, J. (2011). Identification of Air Traffic Control Sectors with Common Structural
Characteristics, 6th International Symposium on Aviation Psychology, Dayton OH.

129
Christien, R. (2002). Air Traffic Complexity Indicators & ATC Sectors Classification, The 21st
Digital Avionics Systems Conference.
Delahaye, D. and Puechmorel, S. (2000), Air Traffic Complexity towards Intrinsic Metrics, 3rd
USA/Europe Air Traffic Management R&D Seminar Napoli.
Delahaye, D., Puechmorel, S., Hansman, J., Histon, J. (2004), Air Traffic Complexity based on Non
Linear Dynamical Systems.
Davis, C. G., Danaher, J. W., & Fischl, M. A. (1963). The Influence of Selected Sector Characteristics
upon ARTCC Controller Activities, Contract No. FAA/BRD-301. Arlington, VA: The Matrix
Corporation.
Eurocontrol (2003). Review of Air Traffic Control Training Requirements, Final Report,
Eurocontrol.
Federal Aviation Administration (FAA) (2004). Joint Planning and Development Office, “Next
Generation Air Transportation System Integrated Plan”.
Friedman, D., Pisani, R., Purves, R. (2007). Statistics, 4th Edition, W. W. Norton & Company.
Grossberg, M. (1989). Relation of Sector Complexity to Operational Errors. In Quarterly Report of
the FAA Office of Air Traffic Evaluations and Analysis. Washington, DC: Federal Aviation
Administration
Hilburn, B.G. (2004). Cognitive Complexity in Air Traffic Control: A Literature Review, EEC Note
No.04/04: Eurocontrol.
Histon, J., Aigoin, G., Delahaye, D., Hansman, J., Puechmorel, S. (2001). Introducing Structural
Considerations into Complexity Metrics, 4th USA / Europe Air Traffic Management R&D
Seminar
Histon, J.M. and Hansman, R.J. (2008). Mitigating Complexity in Air Traffic Control: The Role of
Structure-based Abstractions. Massachusetts Institute of Technology: International
Center for Air Transportation.
Histon, J., Bhagat, R. (2010). A Cognitive Complexity Approach to Generic Airspaces, Presented
at Joint University Program in January 2010, Atlantic City, NJ.
Kalbaugh, S., Farrell, L., Ingram, D., McDonough, R.J., St.George, R.J., Wallace, K., Zittle, W. (2011).
Potential Airspace Redesigns to Accommodate Generic Sector Operations, MITRE
Technical Report # MTR110300, The MITRE Corporation.

130
Kopardekar, P., Schwartz, A., Magyarits, S., Rhodes, J. (2007). Airspace Complexity Measurement:
An Air Traffic Control Simulation Analysis, Ames Research Center, Moffett Field,
California: NASA.
Kuhar, W. T., Gavel, P., & Moreland, J. A. (1976). Impact of Automation Upon Air Traffic Control
System Productivity/Capacity, (ARTS-III) (Report No. FAA-RD-77-39). Washington, DC:
Federal Aviation Administration.
Lee, K., Feron, E., Pritchett, A. (2007), Air Traffic Complexity: An Input-Output Approach,
American Control Conference 2007 ACC07, pp. 474-479
Levin, K. M. (2007). Universal High Altitude Airspace (UHAA), Presentation at Dynamic
Resectorization Workshop, NASA Ames Research Center, San Jose, CA
Majumdar, A., Ochieng, W.Y. (2001). The Factors Affecting Air Traffic Controller Workload: A
Multivariate Analysis Based Upon Simulation Modeling of Controller Workload, 81st
Annual Meeting of the Transportation Research Board. Washington, DC: Transportation
Research Board
Mogford, R. H., Guttman, J. A., Morrow, S. L., & Kopardekar, P. (1995). The Complexity Construct
in Air Traffic Control: A Review and Synthesis of the Literature (DOT/FAA/CT-TN95/22).
Atlantic City International Airport: Federal Aviation Administration William J. Hughes
Technical Center.
Mogford, R., Murphy, E.D., Guttman, J.A. (2009). Using Knowledge Exploration Tools to Study
Airspace Complexity in Air Traffic Control, The International Journal of Aviation
Psychology Volume 4, Issue 1
Mogford, R. (2010). Generic Airspace Concepts and Research, NASA Ames Research Center,
Moffett Field, CA, 94035
Pawlak, W.S., Brinton, C.R., Crouch, K., Lancaster, K.M. (1996). A Framework for the Evaluation of
Air Traffic Control Complexity, American Institute of Aeronautics and Astronautics, Inc.
Redding, R. E., Cannon, J. R., Lierman, B. C., Ryder, J. M., Purcell, J. A. & Seamster, T. L. (1991). The
Analysis of Expert Performance in the Redesign of the en route Air Traffic Control
Curriculum, Proceedings of the Human Factors Society, 35th Annual Meeting.
Sabhnani, G.R., Yousefi, A., Kierstead, D.P., Kostitsyna, I., Mitchell, J.S.B., Polishchuck, V. (2010).
Algorithmic Traffic Abstraction and its Application to NextGen Generic Airspace, American
Institute of Aeronautics and Astronautics, Inc.

131
Salden, R., Paas, F., Broers, N., Van Merrienboer, J. (2004). Mental Effort and Performance as
Determinants for the Dynamic Selection of Learning Tasks in Air Traffic Control Training,
the Netherlands, Kluwer Academic Publishers, pp.153-172.
Schmidt, D. K. (1976). On Modeling ATC Workload and Sector Capacity. Journal of Aircraft. 11(7),
pp. 531-537.
Weiland, M. (2010). Field Evaluation of Advanced Training Technologies in Terminal Air Traffic
Control, Human Factors and Ergonomics Society 54th Annual Meeting.

132
Appendix A
Sector Grouping Results based on Holistic Classification
Legend: Moderately Concentrated flows = Column #(1) Heavily concentrated flows = Column #(2) Heavily concentrated flows with densely distributed traffic in the background = Column #(3)
Single Flow Cross Flow Merge Flow Fan Flow (1) (2) (2) (3) (2) (3) (2) (3)
ZAB37 ZAU36 ZDC42 ZAU95 ZBW24 ZLA26 ZHU46 ZLA38
ZFW92 ZAU24 ZAU94 ZAB50 ZAU25 ZAU23 ZAB91 ZAB78
ZNY27 ZAU35 ZDC52 ZAB70 ZAU89 ZBW48 ZBW19 ZAB89
ZNY83 ZAU45 ZFW26 ZAB72 ZBW09 ZDC12 ZBW31 ZBW46
ZOB74 ZAU52 ZFW49 ZAB87 ZBW33 ZDC19 ZBW38 ZDC39
ZFW28 ZFW50 ZAB96 ZDC07 ZDC58 ZBW49 ZDV24
ZFW71 ZFW52 ZAU33 ZDC18 ZDC59 ZBW59 ZDV35
ZJX87 ZFW98 ZAU71 ZDV28 ZDV04 ZDC10 ZFW47
ZMA19 ZID76 ZAU91 ZFW89 ZFW42 ZDC72 ZHU81
ZOB68 ZID77 ZBW10 ZHU65 ZLC34 ZDV64 ZJX34
ZID83 ZDC36 ZID96 ZFW39 ZLA36
ZID89 ZDC38 ZJX47 ZFW97 ZLA37
ZID94 ZDV05 ZJX75 ZHU63 ZMA65
ZMA17 ZDV23 ZJX95 ZJX58 ZOA13
ZOB37 ZDV46 ZLA34 ZJX78 ZOA32
ZOB64 ZFW43 ZLA53 ZJX86 ZOA36
ZOB77 ZFW51 ZME63 ZLA40 ZSE46
ZTL34 ZFW93 ZMP22 ZMA01 ZSE47
ZTL50 ZHU74 ZNY34 ZMA64
ZID99 ZNY56 ZMA68
ZJX11 ZNY73 ZMP16
ZJX51 ZOB29 ZNY39
ZJX65 ZTL36 ZNY49
ZKC06 ZNY55
ZKC07 ZOA34
ZKC20 ZTL10

133
Parallel Flow Star Cross Flow Almost no traffic Complex traffic (1) (2) (3) (3)
ZBW20 ZDC04 ZAB90 ZME28 ZAU34 ZBW01 ZHU59 ZLC42 ZSE13
ZAU88 ZAB79 ZAB80 ZAB58 ZAU41 ZAB65 ZID88 ZLC45 ZSE14
ZFW65 ZDC37 ZDV09 ZAB93 ZAU46 ZAB67 ZID93 ZMA40 ZSE15
ZHU68 ZFW24 ZHU70 ZAB98 ZFW86 ZAB68 ZID97 ZME19 ZSE16
ZID75 ZFW61 ZHU95 ZAU61 ZHU76 ZAB92 ZJX15 ZME22 ZSE42
ZJX14 ZFW82 ZHU97 ZAU84 ZHU82 ZAU90 ZJX44 ZME25 ZSE48
ZMP15 ZFW90 ZJX35 ZDV18 ZID14 ZBW02 ZJX48 ZME27 ZTL15
ZOB07 ZFW94 ZOA30 ZDV33 ZID80 ZBW39 ZJX49 ZME32 ZTL20
ZHU23
ZDV37 ZLA60 ZBW53 ZJX67 ZME33 ZTL28
ZHU26
ZDV38 ZLA72 ZDC09 ZJX68 ZME35 ZTL33
ZHU78
ZDV61 ZOA29 ZDC11 ZJX76 ZME43 ZTL42
ZID87
ZDV65 ZOB51 ZDC16 ZKC03 ZME45
ZJX33
ZID70
ZDC20 ZKC14 ZMP11
ZKC33
ZID78
ZDC32 ZKC27 ZMP12
ZMA25
ZID81
ZDC50 ZKC28 ZMP13
ZME26
ZID91
ZDC60 ZKC29 ZMP17
ZME30
ZID95
ZDV03 ZKC31 ZMP18
ZME31
ZID98
ZDV14 ZKC47 ZMP19
ZME44
ZKC21
ZDV34 ZKC90 ZMP20
ZNY07
ZKC41
ZDV67 ZKC92 ZMP30
ZNY08
ZME20
ZFW25 ZKC94 ZMP38
ZNY09
ZME34
ZFW46 ZKC97 ZMP40
ZNY72
ZME61
ZFW48 ZKC98 ZMP42
ZNY75
ZME62
ZHU24 ZLA27 ZMP43
ZNY82
ZMP28
ZHU37 ZLA30 ZNY42
ZOA46
ZMP29
ZHU42 ZLA31 ZOA14
ZOB26 ZOB19 ZLA32 ZOA15
ZOB36 ZOB39 ZLA33 ZOA31
ZOB38 ZOB49 ZLA35 ZOA33
ZOB47 ZTL02 ZLA39 ZOA43
ZOB57 ZTL03 ZLA99 ZOB45
ZOB59 ZTL08 ZLC20 ZOB67
ZTL11 ZTL27 ZLC29 ZOB79
ZTL23 ZTL39 ZLC33 ZSE07 ZTL40 ZLC41 ZSE11

134
Appendix B
Sector Grouping Results based on Decompositional Classification
Note: The decompositional classification method is applied only on 75 sectors
Center Sector Major flows Cross Merge Vertical Handoffs
Trajectory Changes
Holding
ZAB 37 5 6 1 0 0 0 ZAB 39 3 1 0 0 0 0 ZAB 38 6 9 0 0 2 0 ZAB 41 5 5 1 0 1 0 ZAB 45 4 0 1 0 1 0 ZAB 36 3 2 2 0 1 0 ZAB 46 2 0 1 0 0 0 ZAB 48 3 0 1 0 1 0 ZAB 51 2 1 0 0 0 0 ZAB 52 5 3 1 0 0 0 ZAB 53 3 0 1 0 2 0 ZAB 55 4 3 2 0 0 0 ZAB 57 3 1 1 0 1 0 ZAB 42 4 0 2 0 1 0 ZAB 43 1 0 0 0 0 0 ZAB 44 3 1 0 0 0 0 ZAB 14 2 1 1 0 1 0 ZAB 20 4 2 1 2 1 0 ZAB 22 0 0 0 0 0 0 ZAN 2 9 0 3 6 1 0 ZAN 4 5 0 0 5 1 0 ZAN 6 6 1 1 5 1 0 ZAN 8 6 2 0 4 0 0 ZAN 10 1 0 0 0 0 0 ZAU 53 5 5 1 0 1 0 ZAU 54 1 0 0 0 0 0 ZAU 56 3 2 0 0 0 0 ZAU 57 2 1 0 0 0 0 ZAU 59 2 1 0 0 0 0 ZAU 60 2 0 0 0 0 0 ZAU 61 2 1 1 0 0 0 ZAU 62 2 1 0 0 0 0 ZAU 3 2 0 1 0 0 0 ZAU 4 4 1 1 0 0 0 ZAU 11 1 0 0 0 0 0 ZAU 12 1 0 0 0 0 0 ZAU 24 1 0 0 0 1 0 ZAU 26 0 0 0 0 0 0 ZAU 36 7 1 2 0 1 0 ZAU 45 1 0 0 0 0 0 ZAU 46 4 1 1 0 0 0 ZBW 1 10 14 3 0 0 0

135
ZBW 2 5 6 3 0 1 0 ZBW 6 2 0 0 0 1 0 ZBW 8 2 0 1 0 1 0 ZBW 9 4 1 0 0 1 0 ZBW 15 2 0 0 0 0 1 ZBW 20 2 1 0 0 1 0 ZBW 26 2 0 0 1 0 0 ZBW 27 1 0 0 1 1 0 ZBW 28 6 2 4 0 5 0 ZBW 32 2 1 0 0 1 0 ZDC 3 3 2 0 0 1 0 ZDC 4 4 1 1 0 3 0 ZDC 9 6 2 2 0 3 1 ZDC 11 3 1 1 0 0 1 ZDC 12 3 0 2 0 3 1 ZDC 15 5 3 2 0 3 2 ZDC 17 3 0 2 0 2 1 ZDC 18 6 2 4 0 4 2 ZDC 36 4 3 0 0 0 0 ZDC 37 0 0 0 0 0 0 ZDC 39 3 1 0 0 1 0 ZDC 42 4 1 2 0 3 0 ZDC 43 8 4 1 0 2 1 ZDC 48 2 0 1 0 2 0 ZDC 49 3 0 1 0 2 1 ZDC 51 3 0 2 1 2 0 ZDC 52 0 0 0 0 0 0 ZDC 53 2 1 1 0 0 0 ZDC 66 0 0 0 0 0 0 ZDC 88 0 0 0 0 0 0 ZDC 89 0 0 0 0 0 1 ZDC 90 0 0 0 0 0 0 ZDC 91 0 0 0 0 0 0

136
Appendix C
Sector Selection for Survey in Chapter 5
Test Number Sector A Sector B Sector C
111 ZAU36 ZJX87 ZME34
112 ZAU36 ZMA19 ZTL02
113 ZAU36 ZAU45 ZMP28 121 ZAU52 ZAU24 ZID91
122 ZAU52 ZAU45 ZDV33
123 ZAU52 ZAU36 ZDV18
131 ZFW71 ZFW28 ZTL27 132 ZFW71 ZAU52 ZDV38
133 ZFW71 ZJX87 ZME61
211 ZDC52 ZAU94 ZNY68
212 ZDC52 ZID89 ZTL06 213 ZDC52 ZFW49 ZAU47
221 ZFW52 ZID76 ZID66
222 ZFW52 ZID83 ZDV47
223 ZFW52 ZOB77 ZLC18 231 ZID76 ZFW50 ZAU47
232 ZID76 ZTL34 ZFW20
233 ZID76 ZID77 ZID92
311 ZFW98 ZOB64 ZAB70 312 ZFW98 ZOB37 ZDC36
313 ZFW98 ZID83 ZDC38
321 ZID89 ZID76 ZAB72
322 ZID89 ZID77 ZDV23 323 ZID89 ZFW52 ZKC06
331 ZID83 ZOB77 ZID99
332 ZID83 ZID76 ZFW43
333 ZID83 ZFW98 ZDC36 411 ZID89 ZDC42 ZBW33
412 ZID89 ZDC52 ZOB29
413 ZID89 ZID83 ZNY73
421 ZID94 ZID77 ZDC07 422 ZID94 ZFW98 ZNY34
423 ZID94 ZID98 ZJX75
431 ZFW49 ZAU94 ZOB29
432 ZFW49 ZOB77 ZJX85 433 ZFW49 ZOB37 ZID96
511 ZME34 ZID98 ZFW52
512 ZME34 ZID81 ZAU94
513 ZME34 ZTL40 ZTL50 521 ZAB98 ZAU84 ZTL34
522 ZAB98 ZME62 ZMA17
523 ZAB98 ZDV18 ZID77
531 ZID91 ZME28 ZOB77 532 ZID91 ZAU61 ZDC52
533 ZID91 ZOB19 ZFW98

137
611 ZBW33 ZNY34 ZHU46 612 ZBW33 ZHU65 ZNY49
613 ZBW33 ZOB29 ZNY55
621 ZME63 ZLA34 ZDV64
622 ZME63 ZBW33 ZBW38 623 ZME63 ZNY56 ZNY39
631 ZJX75 ZAU25 ZFW97
632 ZJX75 ZDC07 ZLA40
633 ZJX75 ZOB29 ZBW31