Coevolutionary analysis of the transposon Galileo in the genus Drosophila · 2015-02-16 ·...
219
0 Coevolutionary analysis of the transposon Galileo in the genus Drosophila Andrea E. Acurio Armas Departament de Genètica i de Microbiologia Universitat Autònoma de Barcelona Advisor: Dr. Alfredo Ruiz
Transcript of Coevolutionary analysis of the transposon Galileo in the genus Drosophila · 2015-02-16 ·...

0
Coevolutionary
analysis of the
transposon Galileo
in the genus
Drosophila
Andrea E. Acurio Armas
Departament de Genètica i de Microbiologia
Universitat Autònoma de Barcelona
Advisor: Dr. Alfredo Ruiz

Coevolutionary analysis of the transposon Galileo in the genus Drosophila
Análisis coevolutivo del transposon Galileo en el género Drosophila
─TESIS DOCTORAL─
Andrea E. Acurio Armas
Bellaterra, Diciembre del 2014
Facultat de Biociències
Memoria presentada para optar al grado de doctor por la Universidad Autónoma de Barcelona, Programa de
Doctorado en Genética.


El Doc tor Alfredo R uiz, C atedràtic del De partament
de Ge nètica i de Mi crobiologia de la Facultat de
Biociències de la Universitat Autònoma de Barcelona,
CERTIFICA: que Andrea E. Acurio Armas ha d ut a
terme sota la se va dirección el treball de recerca
realizat a l De partament de Genètica i de
Microbiologia de l a F acultat de B iociències d e la
Universitat Autònoma de Barcelona que h a po rtat a
l’elaboració d’aquesta Tesi Doctoral, titulada
“Coevolutionary analysis of the transposon Galileo in
the genus Drosophila”.
I per què consti als efectes oportuns, signa el present
certificat a Bellaterra, 1 de de sembre Noviembre de l
2014.
Dr. Alfredo Ruiz.

DEDICATORIA
Esta disertación está dedicada a:
Mi familia por que su apoyo y cariño meacompañan siempre.
Los amigos que se han convertido en mi segunda familia.
Gloria Luo R.I.P

ACKNOWLEGMENTS
This dissertation encompasses several fields in Evolutionary Biology ranging from Alpha-Taxonomy to Cophylogenetics. I feel very lucky because I have had the advice and support from several specialist and institutions. Here, I am including some of the wonderful people that helped me during the last years.
I would like to express my very great appreciation to my advisor Dr. Alfredo Ruiz. I thank him for his guidance through the development of this work. Many thanks to the committee members for generously offering their time to review this dissertation. My sincere appreciation is extended to Dr. Alexis Matamoro-Vidal for the encouragement, advices and inspiring discussions. My special thanks to Dr. Patrick O`Grady for his invaluable help and for receive me as visitor student in his lab at UC, Berkeley. I am also grateful with Dr. Violeta Rafael for her suggestions and the facilities provided to perform the field trips in Ecuador.
I would like to offer my special thanks to: Dr. Deodoro Oliveira, Dr. Mar Marzo and Dr. Alejandra Delprat, for their guidance at the beginning of this project; to Dr. Carlos Vilela Sensei for his help in taxonomic identifications; to Dr. Kari Goodman, for her help in the Biogeographical analysis; to Dr. David Houle for his helpful comments and kind hospitality at FSU; to Dr. Amir Yassin for his comments to the D. machalilla manuscript; to Dr. Michael Lang, for his comments to the inca manuscript; to Dr. Virginie Orgogozo for inspiring me to continue working with Drosophila; to Dr. Kasey Creasey for giving me the opportunity to attend the CSHL meeting and Dr. Tandy Warnow for making possible my trip to Washington DC.
I am also grateful to the administrative personnel of the Department de Genètica I de Microbiologia de la UAB: Maite Navarro, Elena García, and Maria Josep Mas. The technical assistance provided by Montse Sales and Raquel Ferraz, was greatly appreciated through this research. Many thanks to the people from the Drosophila, Bioinformatics and Evolution Group and my labmates: Nuria Rius, and Yolanda Guillen. Special thanks to Charles J. Simmons for his corrections on English writing.
I would like to thank the following institutions: Agència de Gestió d´Ajuts Universitaris i de Recerca (AGAUR), and the European Commission - European Social Found (EC-ESF) by the Pre-Doctorate Grant (FI-DGR 2011). Secretary of Education, Science and Technology from Ecuador (SENESCYT), by the Master Grant (Talento Humano 2009). Many thanks to the Ministry of Environment from Ecuador for the scientific research permissions to collect in Ecuador. I am also very grateful to: the Willi Henning Society (WHS) by the Mary Stopes Travel Award 2013; University of Texas, at Arlington and Smithsonian Museum by the Travel Grant Frontiers in Phylogenetics 2012. Finally, many thanks to Cold Spring Harbor Laboratory (CSHL) by the help on registration at the Mobile Genetic Elements Meeting 2013.


CONTENTS
I. INTRODUCTION ......................................................................................................... 1
I.1 The genus Drosophila
I.1.1 Phylogenetic taxonomy ...................................................................... 2
I.1.2 Evolutionary relationships .................................................................. 3
I.1.3 The Drosophila repleta species group............................................... 7
I.2 Transposable elements
I.2.1 Abundance and impact on host genomes ........................................... 8
I.2.2 Classification ...................................................................................... 9
I.2.3 DNA transposons .............................................................................. 11
I.2.4 Dynamics of DNA transposons ........................................................ 11
I.2.5 The transposon Galileo ..................................................................... 13
I.3 Reconstructing the history of Galileo-Drosophila association
I.3.1 Coevolution, Codivergence and Cospeciation .................................. 16
II. OBJECTIVES ............................................................................................................ 19
II.1. Chapter 1 .................................................................................................. ...20
II.2. Chapter 2 .................................................................................................. ...20
II.3. Chapter 3 .................................................................................................. ...21
III. MATERIAL AND METHODS ................................................................................ 22
III.1. Drosophilid collections .............................................................................. 23
III.2. Molecular techniques .............................................................................. ...23
III.3. Sequence analysis.................................................................................... ...23
III.4. Dataset analysis ....................................................................................... ...24
III.5. Phylogenetic analysis ................................................................................. 24
III.6. Biogeographical analysis ........................................................................ ...24
III.7. Cophylogenetic analysis.......................................................................... ...24
IV. RESULTS AND DISCUSION ................................................................................. 25
Chapter 1.-Description of a New Spotted-Thorax Drosophila (Diptera: Drosophilidae) Species and Its Evolutionary Relationships Inferred by a Cladistic Analysis of Morphological Traits ........................................................ 26
Chapter 2.-Evidence of a South American origin for the Drosophila repleta lineage. ............................................................................................................. ...38
CONTENTS
CONTENTS .............................................................................................. 40
Chapter 3.-Long-term evolutionary dynamic of a DNA transposon, the case of Galileo in Drosophilidae ..................................................................................... 67
CONTENTS ......................................................................................... ...70
V. CONCLUSIONS ...................................................................................................... 166
VI. APPENDICES ........................................................................................................ 170
Appendix 1. .................................................................................................... ...171
Appendix 2. .................................................................................................... ...177
Appendix 3. .................................................................................................... ...188
Appendix 4. .................................................................................................... ...189
Appendix 5. .................................................................................................... ...191
Appendix 6. .................................................................................................... ...193
VII.REFERENCES ....................................................................................................... 196
LIST OF TABLES
Table I-1. Examples of the hierarchical classification for TEs ....................................... 10
LIST OF FIGURES
Figure I-1. Taxonomic ranks used in the nomenclature of Drosophilidae. ...................... 3
Figure I-2. Latest phylogenetic hypotheses inferred for Drosophilidae.. ....................... 66
Figure I-3. Tree embedded in its host phylogenetic tree ................................................ 18

ABBREVIATIONS
aa amino acid AIC Akaike Information Criterion BI Bayesian Inference bp base pairs COI Cytochrome oxidase subunit I gene COII Cytochrome oxidase subunit II gene CPT Cherry-picking test DNA Deoxyribonucleic acid dS Average number of nucleotide differences between sequences per
synonymous site GTR General Time Reversible model GTR+I GTR + invariable sites HRR Historical Range Reconstruction HT Horizontal Transfer ICZN International Committee of Zoological Nomenclature LTR Long Terminal Repeat Marf Mitochondrial assembly regulatory factor gene ML Maximum Likelihood MLAR ML Ancestral Reconstruction MLE Mariner Like Element MRCA Most Recent Common Ancestor Mya Million years ago ND2 Dehydrogenase subunit 2 gene p Probability (p-value) P Parsimony PAR P Ancestral Reconstruction PCR Polymerase chain reaction SinA Seven in Absentia gene TE Transposable Element TIR Terminal Inverted Repeat TPase Transposase TSD Target Site Duplication


1
I. INTRODUCTION

I. INTRODUCTION
2
I.1 The genus Drosophila
I.1.1 Phylogenetic taxonomy
The family Drosophilidae encompasses over 3600 valid binomial Latin names
and includes about 2000 species1 belonging to the genus Drosophila (Powell 1997;
O’Grady & Markow 2009). Because of both, its great diversity, increasing every year
with the description of new species, and controversy on their evolutionary
relationships, the systematics of Drosophila is complicated. Initially, the tradition to
systematize this large amount of taxa started with Sturtevant (1942) and Patterson &
Stone (1952), who set forth several taxonomical ranks (Figure I-1), in addition to
those formally recognized (family, genus and species) by the International Committee
of Zoological Nomenclature (ICZN).
For decades, the species group and subgenus ranks were conveniently accepted
by a wide community of Drosophila workers in several study fields. One of the first
assessments to evolutionary relationships across species groups was performed by
Lynn Throckmorton (1962; 1975), who, using morphological, behavioral and
biogeographical data, produced genealogical trees consisting in nested groups of
species or genera named “radiations” (Figure I-1). Currently, most of Throckmorton’s
findings have been corroborated by molecular phylogenetic approaches; althought the
term radiation started a long controversy in the systematics of the Drosophilidae.
Main reason of this controversy was that Throckmorton’s radiations were
taxonomical ranks instead of monophyletic2 groups, for example Chymomyza inside
1 The biological species concept defined as groups of interbreeding natural populations that are
reproductively isolated from other such groups has been used in this study (Mayr 1996). 2 Monophyletic: A group composed of a collection of organisms, including the most recent common ancestor of all those organisms and all the descendants of that most recent common ancestor.

I. INTRODUCTION
3
the genus Drosophila. Thus, the Drosophila radiation was clearly a paraphyletic3
group (Brake & Bächli 2008; Powell 1997).
Figure I-1. Taxonomic ranks used in the nomenclature of Drosophilidae. (A) Throckmorthon’s radiations [modified from Throckmorthon, 1975]. (B) Classification of Drosophila malerkotliana is shown as an example [modified from Powell, 1997].
I.1.2 Evolutionary relationships
Subsequent advances in the field of Phylogenetics, first using morphological
traits (Grimaldi 1990; Okada 1989), and then analyzing molecular data (Russo et al.
1995; Pélandakis et al. 1991; DeSalle 1992; Da Lage et al. 2007; Remsen & O’Grady
2002; Robe et al. 2002; O’Grady & Kidwell 2002) helped to define better the
relationships between species groups, rather than resolve the paraphyletic status of the
genus Drosophila.
3 Paraphyletic: A group composed of a collection of organisms, including the most recent common ancestor of all those organisms. Unlike a monophyletic group, a paraphyletic taxon does not include all the descendants of the most recent common ancestor.

I. INTRODUCTION
4
Thereby, the taxonomic structure of Drosophila, one of the best-studied model
systems in modern biology, does not reflect its evolutionary relationships. The release
of 12 whole Drosophila genome sequences on 2007, and the promise of several more
in the future─currently 23 sequenced genomes are available (St Pierre et al. 2014)─
stimulated even more comparative studies in this genus. Such studies can only be
sustained by clear, stable taxonomy and well resolved evolutionary relationships of
this group. On this scenario, emerged the proposal of Van Der Linde et al. (2007) to
the ICZN to splits this genus on three or more separate genera, the proposal included
an exemption to the nomenclature rules asking for the change of the genus type (D.
funebris) to D. melanogaster to preserve its name.
This proposal was highly debated by the whole community of Drosophila
researchers. Some of them supported the proposition (van der Linde & Houle 2008;
Roisin 2008; Polaszek 2008; van der Linde et al. 2010), whereas many other opposed
it (O’Grady & Markow 2009; McEvey et al. 2008; O’Grady 2010; O’Grady et al.
2008; Yassin 2008). After three years of deliberations, the ICZN rejected the proposal
based on three main arguments (1) Exceptions can destabilize names across animal
taxa. (2) The proposal was a debate dealing with Systematics and Taxonomy instead
to be a nomenclatural issue. (3) The relationships within and between many lineages
from the genus Drosophila, as currently defined, are poorly understood (ICZN 2010).
In addition, many of the putative genera within Drosophila lacked of phylogenetic
support, taxonomic revisions, morphological synapomorphies, or all three (O’Grady
2010).
Recently, two studies (Yassin 2013; Russo et al. 2013) tried to address this
problem and gave important steps in the understanding of the evolutionary
relationships of Drosophilidae (Figure I-2). The study from Yassin (2013) analyzed

I. INTRODUCTION
5
seven partial coding-regions from 126 taxa and defined morphological
synapomorphies for each molecular clade. The resulting monophyly grouping was
similar to the one suggested by Throckmorton (1975), based on this and to preserve
the binomina of model species (e.g., Drosophila melanogaster), Yassin advocates that
nomenclatural changes be restricted to the subgeneric level by means of the division
of the genus Drosophila into five subgenera: Dorsilopha, Drosophila, Dudaica,
Siphlodora and Sophophora.
Almost simultaneously, Russo et al. (2013) analyzed nine partial coding-regions
from 358 taxa including biogeographic data in their approach. They obtained a
relatively well supported phylogeny and were able to give estimates of the time of
divergence for major clades in the family. Russo et al. (2013) determined that the
Drosophilidae diversification began during the Palaeocene in Eurasia and that the
most recent common ancestor (MRCA) from subgenera Sophophora and Drosophila
lived approximately 56 million years ago (Mya). Despite using different taxa, there is
some consistency with Yassin’s phylogenetic hypothesis. Russo et al. (Figure 1)
recovered the family Drosophilidae as a monophyletic clade althought comparatively
less support was found in internal nodes, the Drosophila radiation is recovered
encompassing other genera such as Hawaiian Drosophila (Idiomyia, Scaptopmyza) or
Zaprionus.
The Siphlodora subgenus (sensu Yassin 2013) was recovered by Russo et al.
2013 study that named clade A. Interestingly, most of the radiations proposed by
Throckmorton (1975) were recovered by both studies, one of them was the virilis-
repleta radiation.


I. INTRODUCTION
7
I.1.3 The Drosophila repleta species group
For almost a century the repleta species group has been used as a model system
for studies of ecological adaptation, evolution and speciation (Sturtevant 1915;
Wharton 1942; Wasserman 1982; Ruiz et al. 1997; Vilela 1983; Oliveira et al. 2005).
This lineage includes ca. 100 species and it is considered one of the most successful
radiations among Drosophila (Powell 1997). Mainly based on cytological evidence,
five subgroups have been traditionally recognized within the repleta lineage: fasciola,
hydei, mercatorum, repleta and mulleri (Wasserman 1982, 1992). A sixth subgroup,
inca, encompassing three species endemic to Ecuador and Peru, has been the latest to
be defined using morphological characters (Rafael and Arcos 1989).
A revised molecular phylogeny including representative taxa from the five
traditionally recognized subgroups, which also included divergence time estimates for
such species, has suggested a South American origin of this group (Oliveira et al.
2012). Several repleta species have adaptations to live on cactus, thus it was
postulated that this radiation occurred when cacti from the genus Opuntia moved to
other localities and Drosophila species associated with the cacti, spread with them.
The fact that South America is the region where the Opuntia genus originated leads to
propose the same origin for the repleta lineage.
This hypothesis brought some debate because the trans-volcanic region from
Mexico had been considered for decades the center of diversification of the group
(Patterson & Stone 1952, Throckmorton 1975). A subsequent biogeographical
assessment of several Drosophila species groups performed by Morales-Hojas and
Vieira (2012) neither was able to accept or reject the South American origin
suggested by Oliverira et al- (2012). Despite the significant contribution of these two

I. INTRODUCTION
8
recent studies, neither of them has been able to resolve the origin of the repleta
radiation. Perhaps the most critical point is that none of the previous studies has
included representatives of the inca lineage. The inca subgroup (Rafael and Arcos
1989; Mafla and Romero 2009) comprises three cactophilic species (D. inca, D.
huancavilcae and D. yangana) with an endemic narrow distribution and that live in
sympatry with other members of the repleta radiation such as the hydei subgroup, a
clade considered basal in the repleta lineage (Oliveira, Almeida, O’Grady, Armella,
Desalle, et al. 2012). Inclusion of inca species could potentially help to resolve issues
such as, low statistical support in phylogenetic trees from previous studies, or the
geographical origin of the repleta lineage.
I.2 Transposable elements
I.2.1 Abundance and impact on host genomes
Transposable elements (TEs) are short DNA fragments competent to integrate
into new positions in the genome, increase their copy number over time and that rely
on the enzymatic function provided by an autonomous element4 (Lisch 2013). TEs
were discovered by Barbara McClintock, who was awarded the Nobel Prize in 1983
for her work with instability factors at maize chromosomes, what is currently known
as the Ac/Ds system (McClintock 1950; McClintock 1984). Regardless of TEs were
initially discovered in plants, it is currently known that TEs are broadly distributed
across the eukaryotic tree of life (Feschotte & Pritham 2007) and majority of
eukariots and represent a dynamic component on their genomes (Hua-Van et al.
2011).
4 Definition used in this study.

I. INTRODUCTION
9
The possible role that TEs might play in their host genomes has been a matter of
discussion since they were discovered. A theory emphasizing the parasitic nature of
TEs ─the selfish DNA theory of TEs─ was proposed and theoretically demonstrated
during the 80’s (Doolittle & Sapienza 1980; Orgel & Crick 1980; Hickey 1982). This
idea implies that the emergence and spread of TEs could be explained solely by their
ability to replicate themselves in the genome. The underlying logic and coherence of
this theory led to a drastic stance on the evolutionary significance of TEs. Subsequent
accumulation of molecular evidence demonstrated that, while TEs are by and large
genomic parasites, they have been co-opted many times and in a number of different
ways to serve the interests of their hosts (Bowen 2002; Kazazian 2004; Feschotte &
Pritham 2007; Capy et al. 1998). TEs can be involved in changes that include
knockout of gene function, introduction of new functions, changes in the structure of
genes, epigenetic silencing of genes and mobilization/rearrangement of gene
fragments (Lisch 2013).
I.2.2 Classification
Based on their mechanism of transposition, TEs can be categorized on two
major groups (Kapitonov & Jurka 2008; Wicker et al. 2007): (1) Retrotransposons,
mobilized by a replicative mechanism that requires the reverse transcription of RNA
intermediate also named “copy-and-paste” mechanism5. (2) DNA transposons, which
usually consist of a transposase (TPase) gene flanked by a terminal inverted repeat
(TIR) of variable length. Inside this group, TEs can be divided into: rolling-circle
(Helitrons), self-synthesizing (Polintons) and cut-and-paste transposon (Bao et al.
2009). 5 in which mRNA transcribed from the element by RNA polymerase II (RNA Pol II) is converted into a cDNA by reverse transcription and then integrated by an integrase enzyme at a new position in the genome (Lisch 2013)

I. INTRODUCTION
10
In the cut-and-paste transposon reaction, the element is excised from the donor
site, causing a double strand break, and inserted elsewhere in the genome. The TE
sequence can be restored to the empty donor site by the host repair machinery, leading
to an increase in copy number. The integration of the elements into a new genomic
location usually generates a short (2-10 bp) target site duplication (TSD) from host
sequences (Yuan & Wessler 2011).
The system of classification applied in this study is that proposed by Wicker et
al. (2007). This classification includes hierarchical levels (Table I.1). The superfamily
level is characterized by a superfamily-specific TPase. Families are defined as a set of
phylogenetically close TE copies that share >80% sequence identity (Wicker et al.
2007). Subsequently families can be divided in subfamilies, which are groups of
sequences that share specific insertions, deletions or substitutions (Venner et al.
2009). Autonomus elements encode all the necessary proteins for transposition. Non-
autonomus elements carry the minimum sequences necessary for transposition but do
not encode functional proteins; therefore they require the presence of proteins
encoded by autonomous elements.
Table I-1.Examples of the hierarchical classification for Barbara, Talos and Galileo TEs (modified from Wicker et al. 2007).
Barbara Thalos Galileo
Class: Subclass: Order: Superfamily: Family: Subfamily:
Retrotransposon N/A LTR
retrotransposon Copta
Barbara
DNA transposon 1
TIR Mariner
Stowaway Thalos
DNA transposon 1
TIR
Galileo Newton

I. INTRODUCTION
11
I.2.3 DNA transposons
DNA transposons are characterized by a TPase encoded by autonomus copies
and with a few exceptions, by the presence of TIRs. The TPases encoded by cut-and-
paste DNA transposons are also called DDE/DDD TPases (Bao et al. 2009), due to
the universal occurrence of three conserved acidic catalytic residues: two aspartates
(D) and one glutamate (E), or three aspartates (DDD). To-date, 17 superfamilies of
cut-and-paste DNA transposons are recognized (Yuan & Wessler 2011).
Traditionally, monophyletic ancestry of TPase superfamilies is determined by the
phylogenetic analysis of their core catalytic region. In some cases (e.g., Tc1/mariner)
the superfamily can be further divided into monophyletic groups that have diverged
across eukaryotic phyla (Feschotte & Pritham 2007).
I.2.4 Dynamics of DNA transposons
Presence of TEs in a new host genome may have two origins (1) Horizontal
Transfer (HT), the transmission of DNA between different genomes in a manner other
than traditional reproduction, in which an active copy of the element enter into the
germ line, and (2) de novo emergence or re-emergence of autonomous sequences as a
results of recombination between inactive copies (Hua-Van et al. 2011; Kidwell
2002).
Once arrived in the host genome, the new element has to face the challenge of
spreading at levels of the individual and the population. Theoretical approaches of
long-term dynamics have suggested at least two possible scenarios: a transposition-
selection equilibrium or succession of burst and decay stages. Modelizations have
suggested that TEs experience bursts of amplification by which its number of copies

I. INTRODUCTION
12
increase (Le Rouzic & Capy 2005). This high rate of transposition is opposed by
several other restraining factors such as deletion, selection and regulation, the latest
restraint attributed to both, element self-regulation or host genome regulation
(Charlesworth et al. 1994; Rouzic & Deceliere 2005; Capy et al. 1998). Although it is
widely accepted that transposition is balanced by selection or self-regulation, the
persistence of TEs on host genomes over very long periods of time does not
necessarily imply a stable copy number equilibrium (Le Rouzic et al. 2007).
As is established by Daniels et al. (1990), to fully understand the evolutionary
history of a particular TE within a phylogenetic lineage, it is necessary to determine:
(a) its initial point of entry, (b) its subsequent distribution and (c) its mode of
transmission between species. When TE transmission has been strictly vertical, the
descendants of an ancestral species bearing the element should also possess
homologues of the element, if during evolution the element has been lost from one
species, then all of its descendants should be element-free. This mode of transmission
results in a distribution pattern that is virtually discontinuous.
Alternatively, if transmission has occurred horizontally between reproductively
isolated species, the distribution patterns may not follow phylogenetic groupings, for
instance, they may be discontinuous. Inconsistences between phylogenies of TEs and
host species generally are interpreted as resulting from HT of TEs across species
boundaries (Capy et al. 1998). However, other processes that can lead to
incongruences between phylogenetic trees include stochastic losses, variation in
evolutionary rates and ancestral polymorphism (Capy et al. 1994; Clark et al. 1994).
It has been proposed that HT is an essential step in the TE “life cycle” because it
is thought that in this way transposons can escape from the host-defense mechanisms

I. INTRODUCTION
13
that lead to its eminent deletion of the genome (Schaack et al. 2010). According to
Loreto et al. (2008) from 98 putative cases of HT reported on Drosophila, 51%
belong to DNA transposons and 49% are from retrotransposons.
Several studies evaluating the impact of TEs on host genomes (Lee & Langley
2012; Lisch 2013) conclude that genomes are quite flexible entities and that TEs can
affect gene regulation, composition and structure. Nevertheless only a few studies
have looked at the impact of the genomic environment have on TE evolution. TE
dynamics is usually inferred from population genetics and the use of simulation
models (Rouzic & Deceliere 2005), but there are few experimental studies or
biological data (Hua-Van et al. 2011). An emerging approach is exploring this issue
from an ecological point of view, using the analogy of TEs as individuals living in the
genome.
The term “ecology of the genome” was for first time used by Kidwell & Lisch
(1997) to illustrate the complexity of interactions between TEs and their host from an
evolutionary perspective. This concept implies an analogy between community
ecology and population genetic of TEs. A list of the terms to which the genome is
compared with an ecosystem is detailed in the review of Venner et al. (2009). In
such analogy, a copy of TE is considered as an individual, one TE species comprises
closely genetically related TE copies sharing same interactions with their
environment. Genomes could be seen as ecosystems in which TEs families are co-
evolving species (Brookfield 2005; Le Rouzic et al. 2007; Venner et al. 2009).
I.2.5 The transposon Galileo
The transposon Galileo was discovered in the breakpoints of the chromosomal
inversion 2j on Drosophila buzzatii (Cáceres et al 1999). Subsequent analyses of the

I. INTRODUCTION
14
same inversion breakpoints in a large set of chromosomal lines discovered another
two elements, Kepler and Newton. Because of their structural similarities, these three
elements were tentatively classified as Foldback-like elements (Cáceres et al. 2001).
Further investigation determined that Galileo was also involved in the generation of
another two D. buzzatii chromosomal inversions: 2q7 and 2z3 (Casals et al. 2003;
Delprat et al. 2009).
A Galileo screening by both Sothern blot and in situ hybridization methods on
23 lines of D. buzzatii and 12 lines of closely related species, detected this element in
another five species of the buzzatii cluster (D. antonietae, D. gouveai, D. koepferae,
D. serido and D. seriema), three species of the martensis cluster (D. martensis, D.
venezolama and D. uniseta) and D. stalkeri, from the stalkeri cluster. Galileo was not
detected in species of more distantly related species such as those of the mulleri and
repleta subgroups (Casals et al. 2005).
A subsequent experimental approach of this element in the genome of D.
buzzatii, (Marzo et al. 2008), characterized an almost complete copy of Galileo with a
length of 5406 bp that had TIRs of 1229 bp and an intronless 2738 bp ORF encoding
a 912 aminoacids protein (after fixing two stop codons and 1 bp deletion that causes a
frameshift mutation).
The fact that Galileo encode a TPase similar to those encoded by other
elements of the P superfamily (P and 1360) led to the reclassification of this element
inside the P superfamily of cut and paste transposons. In addition, Marzo et al. (2008)
performed a in silico search of Galileo and the element 1360 (previously named
Hoppel element) on the genomes of the 12 Drosophila species sequenced. The results
showed that Galileo is present in six species (D. ananassae, D. willistoni, D.

I. INTRODUCTION
15
psedoobscura, D. persimilis, D. virilis and D. mojavensis) from the two main
subgenera, Sophophora and Drosophila. The most complete copies characterized had
a length ranging from ca. 4.3 to 5.9 kb and TIRs from ca. 0.6 to 0.8 kb. All of them
are flanked by 7 bp TSD. However, none of them contains a full ORF encoding a
potentially functional TPase because all bear stop codons, deletions or frame shift
mutations.
The analysis of the Galileo TPases determined the presence of a THAP
domain, a 22 aa long coiled motif and the closely relationship with the 1360 element.
In addition, the analysis of TIRs from non-autonomous copies revealed that, in some
cases, inside each host genome, Galileo copies clustered in different groups. For
instance, D. mojavensis harbor four groups C, D, E and F, two of them (C and D)
including copies with nearly-complete TPase coding-regions. A fifth Galileo
subfamily has subsequently characterized in D. mojavensis (Marzo et al. 2013a). A
similar subfamily pattern of diversification also has been found in the genome of D.
willistoni, which harbor V and W subfamilies (Gonçalves et al. 2014).
Based in the comparison of homologous regions of the TIRs (that include the
almost identical terminal 40 bp), and that Galileo, Kepler and Newton generate a 7 bp
TSD with the same consensus sequence, Marzo et al. (2008) proposed that Galileo is
a family of transposons comprising three subfamilies denoted with the letters G, N
and K. In fact, this classification was already taken into account by Delprat et al.
(2009), who demonstrated that a copy of GalileoN (Newton) has a primary role in the
generation of a chromosomal rearrangement through the mechanism of ectopic
recombination.

I. INTRODUCTION
16
The transposition activity of Galileo was later tested using the THAP DNA-
binding domain, which was expressed and purified to test its binding activity towards
the respective TIR. In spite that no transposition events were detected, their results
revealed an existing ability of the THAP domain to bind different Galileo TIR
subfamilies (cross-reactivity), despite to be significantly weaker than binding to their
cognate TIR (Marzo et al. 2013b).
I.3 Reconstructing the history of Galileo-Drosophila association
I.3.1 Coevolution, Codivergence and Cospeciation
Since Darwin’s attempts to show how animal and plants are bound together by a
complex web of relations (Darwin 1859; Darwin 1877), coevolution is a fundamental
part of the evolutionary theory. The conceptual framework of coevolution appeared in
several previous studies (Fahrenholz 1913; Hennig 1966; Ehrlich & Raven 1964), but
it is formally defined in the 80’s. According Thompson (1982), coevolution is the
reciprocal evolutionary change between interactive species driven by natural.
Coevolution is used to explain a great variety of coevolutionary process that can
occur between two interacting entities, for instance: prey-predator, plant-herbivore
and host-pathogen systems (Woolhouse et al. 2002).
Codivergence is the parallel divergence of two associated lineages within two
distinct phylogenies and it is considered as one of the strongest available evidences
for coevolution (Page 2003).
Cospeciation is inferred when exist topological congruence between host and
associates phylogenetic histories (Page 2003). Cospeciation confirm a long and
intimate association between organisms that may be biologically very distinct (Page

I. INTRODUCTION
17
& Hafner 1996). The terms coevolution, codivergence and cospeciation are adopted
from here on.
Associations between two organisms, for instance viruses in their host, can have
a long evolutionary history, which can be reflected in similarities between their
evolutionary trees, in this kind of interactions one entity (associate) tracks the other
(host) with a degree of fidelity that depends of the evolutionary dynamic of the two
organisms associated (Page & Charleston 1998), thus cospeciation can be determined
whether matching of phylogenies is greater than that expected by random associations
on two clades of interacting species.
The primary goal of comparing associate and host phylogenies (cophylogenetic
analysis) is to document the history of their association (Page 2003). Four
prerequistes, according Page & Hafner (1996), are necessary to perform a
cophylogenetic analysis of two associated entities: (i) well stablished taxonomy (ii)
robust phylogenies (iii) wide taxon sampling and (iv) phylogenetic comparison by
means of explicit statistical test. In addition, concordance of the two phylogenies
could only be expected if sufficient time elapsed between successive host speciation
events for lineage sorting to have occurred. (Figure 1-3).
Natural processes such as: gene duplication, lineage sorting, ancestral
polymorphism and HT can explain incongruences between host-associate phylogenies
(Page 2003; Page & Charleston 1998; Fontdevila 2011).

I. INTRODUCTION
18
Figure I-3. Virus embedded in its host phylogenetic tree (taken from Sharp & Simmonds 2011). The descendants of two viruses present in the ancestor are shown in red and blue. Polymorphism persisted during the period (time t) between (i) the initial split of species c and (ii) the later split between a and b. so that a phylogeny for his virus differs from the true phylogeny for the three host species.
To determine the timescale of the origin, emergence and evolution of a TE is
pivotal to understanding the long-term association with its host. To-date there is no
record about comparisons of a DNA transposon and host phylogenies. However, the
remarkable similarity between this and other natural associations like retrotransposons
in their host (Sacristán et al. 2009), virus in their host (Jackson & Charleston 2004;
Switzer et al. 2005; Arnaud et al. 2007) and bacterial endosymbiont in their host
(Clark et al. 2000), that have been investigated using the cophylogenetic perspective,
have led us to tackle this problem using the same strategy.

19
II. OBJECTIVES

II. OBJECTIVES
20
The main goal of this thesis is to determine the long-term evolutionary paths
that Galileo transposon has taken with respect to Drosophila species at macro-
evolutionary level. Given that this goal only could be addressed with robust
phylogenetic inferences on both, the transposon and the Drosophila host species, a
considerable effort was made to recover the most accurate evolutionary relationships
on each one of these entities. Robust phylogenetic inference is the result of adequate
assessing on: taxon sampling, characters selection and phylogenetic methods. Thus,
this thesis has been divided in three subcategories corresponding to three chapters.
II.1. Species level─ Chapter 1
To perform the formal description of a new species of Drosophila collected in
Ecuador.
To determine the features of paratypes, larvae, pupae and ecology of the new
species.
To select the methods and traits that enable to place the new species in the
phylogeny of Drosophilidae.
II.2. Species group level─Chapter 2
To determine the phylogenetic position of the inca species subgroup within the
repleta radiation.
To estimate the divergence time in subgroups of the repleta, nannoptera groups
and the new species.
To analyze the repleta radiation in a biogeographical context.

II. OBJECTIVES
21
II.3. Genus level-Chapter 3
To obtain a representative sample of Drosophilidae.
To analyze the phylogenetic relationships of the Drosophila genus.
To determine the presence of Galileo in Drosophilidae.
To obtain the TPase sequences of Galileo in detected species.
To infer a robust phylogenetic tree of Galileo.
To analyze the sequences of Galileo in a biogeographical context.
To compare the Galileo and host species phylogenies to determine its historical
association.

22
III. MATERIAL AND METHODS

III. MATERIAL AND METHODS
23
III.1. Drosophilid collections
Field trips were carried out from December 2010 to February 2011 in 12
localities of Ecuador, South America. The sampling localities were selected according
to previous taxonomical reports of drosophilid diversity distribution in Ecuador
(Acurio & Rafael 2009). On each locality daily collections were made over 3 days at
each site. Drosophilid traps 25 x 5 cm were filled with ca. 110 ml of a 3:1 of fruit and
Baker’s yeast and were hung in vegetation. Baits were replaced daily after collection
of trapped insects.
Trapped male drosophilids were identified by their terminalia and other
morphological characters using own criteria and literature. Single inseminated
females collected from the wild were allowed to oviposit and the larvae were reared to
adults in order to analyze the terminalia of offspring males for species determination.
Specimens collected and samples from other sources were stored using a code for
each sample.
III.2. Molecular techniques
Procedure followed for DNA extraction, PCR and cloning, in order to generate
the sequences used in phylogenetic analysis is detailed in Chapter 3 (Material and
Methods). Laboratory protocols followed in this study are detailed in Appendix 1.
III.3. Sequence analysis
Sequence chromatograms were assembled using Geneious (Drummond et al.
2011). Multi sequence alignments were performed using MAFFT (Katoh et al. 2009),
SATe (Liu et al. 2012), PRANK (Fletcher & Yang 2010) and CLUSTAL W (Larkin
et al. 2007)

III. MATERIAL AND METHODS
24
III.4. Dataset analysis
Recombination detection was approached with RDP software (Martin et al. 2010).
Number of informative sites was calculated using MEGA 4. Model of nucleotide
substitutions was selected using jModelTest (Posada 2008).
III.5. Phylogenetic analysis
Cladistic analysis of morphological characters were performed using TNT
(Goloboff et al. 2006). Maximum Likelihood analysis were perfomed on SATe (Liu
et al. 2012) and PhyML (Guindon et al. 2010). Bayesian Inference analysis using
BEAST (Drummond & Rambaut 2007) and BEAUti (Drummond et al. 2012a).
Several tools of phylogenetic analysis available on CIPRES (Miller et al. 2010) were
used in this study.
III.6. Biogeographical analysis
Ancestral Reconstructions were performed on MESQUITE (Maddison &
Maddison 2010). The historical biogeographic ranges of the Drosophila repleta group
were reconstructed using BioGeoBEARS (Matzke, 2013) in R (R Core Team 2013).
III.7. Cophylogenetic analysis
Congruence between phylogenetic trees of Galileo and host species was
assesed with TreeMap 3.0 (Charleston & Robertson 2002; Charleston & Page 2002).

25
IV. RESULTS AND DISCUSION
During the specimen collection performed in this study, a new species of
Drosophila was discovered. The taxonomical description of D. machalilla is
performed in Chapter 1. The evolutionary relationship of the closest related species
group is assessed in the article “Radiation of the Drosophila nannoptera species
group in Mexico” from Lang M, Polihronakis M, Acurio A, Markow T and Orgogozo
V (Appendix 2). Also results of Chapter 1 are: a short popular scientific article
(Appendix 3) and the scientific poster exhibit in the XXXII meeting of the Willi
Henning Society (Appendix 4).
The phylogenetic and biogeographical analysis of the repleta species group
that include for the first time the inca subgroup─collected in the specimen collection
of this study─ is approached in Chapter 2 (submitted). Also result of Chapter 2 is the
scientific poster exhibit in the Annual meeting of the Society for Molecular Biology
and Evolution 2012 (Apendix 5).
The long-term evolutionary dynamics of the transposon Galileo transposon in
the Drosophilidae is approached in Chapter 3. A partial result of this chapter is the
scientific poster exhibit in the 2013 CSHL Meeting on Mobile Genetic Elements
(Apendix 6).

IV. RESULTS AND DISCUSION
26
Chapter 1.-Description of a New Spotted-Thorax Drosophila (Diptera: Drosophilidae) Species and Its Evolutionary Relationships Inferred by a Cladistic Analysis of Morphological Traits
Andrea Acurio1, Violeta Rafael2, Diego Céspedes2 & Alfredo Ruiz1
1 Departament de Genètica i de Microbiologia, Universitat Autònoma de Barcelona, Bellaterra 08193 Barcelona, Spain
2Laboratorio de Genética Evolutiva, Escuela de Ciencias Biológicas, Pontifícia Universidad Católica del Ecuador, Quito 17012184 Pichincha, Ecuador.
Corresponding author email: [email protected]
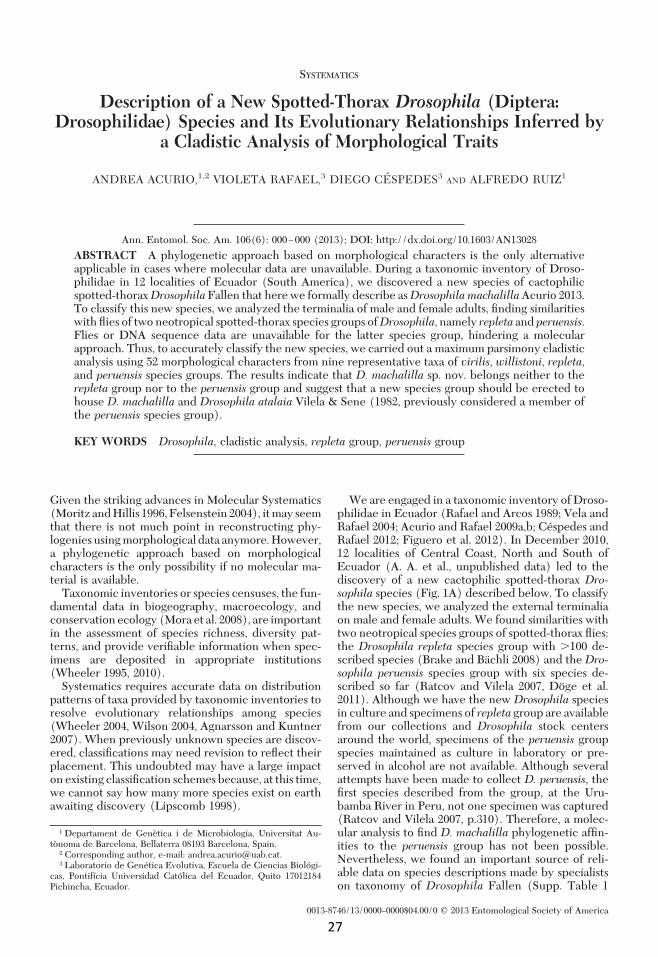
SYSTEMATICS
Description of a New Spotted-Thorax Drosophila (Diptera:Drosophilidae) Species and Its Evolutionary Relationships Inferred by
a Cladistic Analysis of Morphological Traits
ANDREA ACURIO,1,2 VIOLETA RAFAEL,3 DIEGO CESPEDES3 AND ALFREDO RUIZ1
Ann. Entomol. Soc. Am. 106(6): 000Ð000 (2013); DOI: http://dx.doi.org/10.1603/AN13028
ABSTRACT A phylogenetic approach based on morphological characters is the only alternativeapplicable in cases where molecular data are unavailable. During a taxonomic inventory of Droso-philidae in 12 localities of Ecuador (South America), we discovered a new species of cactophilicspotted-thoraxDrosophilaFallen that here we formally describe asDrosophilamachalillaAcurio 2013.To classify this new species, we analyzed the terminalia of male and female adults, Þnding similaritieswith ßies of two neotropical spotted-thorax species groups ofDrosophila, namely repleta and peruensis.Flies or DNA sequence data are unavailable for the latter species group, hindering a molecularapproach. Thus, to accurately classify the new species, we carried out a maximum parsimony cladisticanalysis using 52 morphological characters from nine representative taxa of virilis, willistoni, repleta,and peruensis species groups. The results indicate that D. machalilla sp. nov. belongs neither to therepleta group nor to the peruensis group and suggest that a new species group should be erected tohouse D. machalilla and Drosophila atalaia Vilela & Sene (1982, previously considered a member ofthe peruensis species group).
KEY WORDS Drosophila, cladistic analysis, repleta group, peruensis group
Given the striking advances in Molecular Systematics(Moritz and Hillis 1996, Felsenstein 2004), it may seemthat there is not much point in reconstructing phy-logenies using morphological data anymore. However,a phylogenetic approach based on morphologicalcharacters is the only possibility if no molecular ma-terial is available.
Taxonomic inventories or species censuses, the fun-damental data in biogeography, macroecology, andconservation ecology (Mora et al. 2008), are importantin the assessment of species richness, diversity pat-terns, and provide veriÞable information when spec-imens are deposited in appropriate institutions(Wheeler 1995, 2010).
Systematics requires accurate data on distributionpatterns of taxa provided by taxonomic inventories toresolve evolutionary relationships among species(Wheeler 2004, Wilson 2004, Agnarsson and Kuntner2007). When previously unknown species are discov-ered, classiÞcations may need revision to reßect theirplacement. This undoubted may have a large impacton existing classiÞcation schemes because, at this time,we cannot say how many more species exist on earthawaiting discovery (Lipscomb 1998).
We are engaged in a taxonomic inventory of Droso-philidae in Ecuador (Rafael and Arcos 1989; Vela andRafael 2004; Acurio and Rafael 2009a,b; Cespedes andRafael 2012; Figuero et al. 2012). In December 2010,12 localities of Central Coast, North and South ofEcuador (A. A. et al., unpublished data) led to thediscovery of a new cactophilic spotted-thorax Dro-sophila species (Fig. 1A) described below. To classifythe new species, we analyzed the external terminaliaon male and female adults. We found similarities withtwo neotropical species groups of spotted-thorax ßies:the Drosophila repleta species group with �100 de-scribed species (Brake and Bachli 2008) and theDro-sophila peruensis species group with six species de-scribed so far (Ratcov and Vilela 2007, Doge et al.2011). Although we have the new Drosophila speciesin culture and specimens of repleta group are availablefrom our collections and Drosophila stock centersaround the world, specimens of the peruensis groupspecies maintained as culture in laboratory or pre-served in alcohol are not available. Although severalattempts have been made to collect D. peruensis, theÞrst species described from the group, at the Uru-bamba River in Peru, not one specimen was captured(Ratcov and Vilela 2007, p.310). Therefore, a molec-ular analysis to Þnd D. machalilla phylogenetic afÞn-ities to the peruensis group has not been possible.Nevertheless, we found an important source of reli-able data on species descriptions made by specialistson taxonomy of Drosophila Fallen (Supp. Table 1
1 Departament de Genetica i de Microbiologia, Universitat Au-tonoma de Barcelona, Bellaterra 08193 Barcelona, Spain.
2 Corresponding author, e-mail: [email protected] Laboratorio de Genetica Evolutiva, Escuela de Ciencias Biologi-
cas, Pontifõcia Universidad Catolica del Ecuador, Quito 17012184Pichincha, Ecuador.
0013-8746/13/0000Ð0000$04.00/0 � 2013 Entomological Society of America
27

[online only]); this information provides not onlydescription, illustration, and data on biological as-pects, but also provides the standardized measures anddiagnostic characters. This data source containsenough information to create a matrix and perform acladistic analysis including species with no moleculardata available, as those of the peruensis group. A cla-distic analysis provides us with a solid framework toreconstruct phylogenetic relationships among taxa bylooking for shared derived characters (Hennig 1966).
Here, we describe Drosophila machalilla Acurio2013, and place it in the phylogeny of the genus Dro-sophila by performing a cladistic analysis using 52morphological characters of male and female adultsand immature stages with selected representatives offour species groups (willistoni, virilis, peruensis, andrepleta) of subgenera Sophophora andDrosophila.Thecladograms generated are the basis to propose a newspecies group (atalaia) and formulate a hypothesis ofthe evolutionary relationships between the spotted-thorax Drosophila species groups repleta, peruensis,and atalaia.
Materials and Methods
Taxon Sampling. D. machalilla sp. nov. was re-corded only at 1 of 12 localities sampled in Ecuador inDecember 2010. Twenty individuals were collected inSan Jose Beach (01� 13�46.4� S, 80 � 49�14.6� W), locatedon the Central Coast of Ecuador, in Manabõ Province.The site of collection is a coastal dry forest with a highdensity of cacti, particularly the giant columnar cactusArmatocereus cartwrightianus (Britton & Rose)
Backeb. ex A.W. Hill (Fig. 1B). The sampling area islimiting with the northern border of the MachalillaNational Park, one of the megadiverse areas of theworld (Mast et al. 1997). This park was established in1979 as World Biosphere Reserve because it harborshigh levels of species richness and species endemism.
The method of collection has been described inprevious works (Acurio et al. 2010). For terminaliapreparation, we followed the method proposed byBachli et al. (2005) with minor modiÞcations. Oncedissected, terminalia were mounted on glass slidesusing glycerine. The wings were mounted on glassslides using natural Canada balsam to obtain wingindices and measures. Morphological measurementsand counts were taken on a Carl Zeiss DiscoveryV8stereomicroscope equipped with a Zeiss AxioCamMRc (AFX Services, Quito, Ecuador). Genitalia indi-ces were calculated on Zeiss ImagerA2 microscopeusing Zeiss AxioVision software release 4.8.2. Imagesof male and female genitalia, pupae, and eggs wereprocessed using Adobe Illustrator CS to produce theÞgures.Analyzed Taxa. Eight taxa of the Drosophila subge-
nus were selected because: 1) they are representativesof species groups that share morphological characterswithD.machalilla sp. nov.; 2) they are representativesof monophyletic groups; their evolutionary relation-ships have been inferred by morphological or molec-ular data; and 3) they have a complete taxonomicdescription that contains standardized indices and ra-tios.DrosophilawillistoniSturtevant 1916 of subgenusSophophora, was selected as outgroup. The eight taxafrom the Drosophila subgenus include two represen-
Fig. 1. D. machalilla sp. nov. and the substrate where it was collected. (A) Female specimen of D. machalilla sp. nov.(B) Columnar cactus A. cartwrightianus.
2 ANNALS OF THE ENTOMOLOGICAL SOCIETY OF AMERICA Vol. 106, no. 6
28
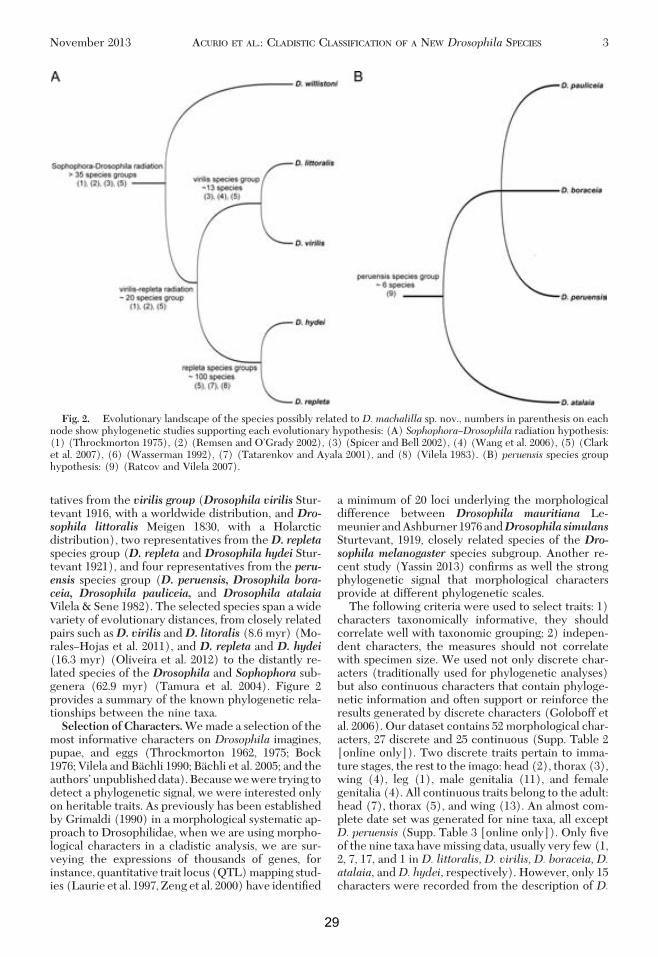
tatives from the virilis group (Drosophila virilis Stur-tevant 1916, with a worldwide distribution, and Dro-sophila littoralis Meigen 1830, with a Holarcticdistribution), two representatives from theD. repletaspecies group (D. repleta and Drosophila hydei Stur-tevant 1921), and four representatives from the peru-ensis species group (D. peruensis, Drosophila bora-ceia, Drosophila pauliceia, and Drosophila atalaiaVilela & Sene 1982). The selected species span a widevariety of evolutionary distances, from closely relatedpairs such asD. virilis andD. litoralis (8.6 myr) (Mo-ralesÐHojas et al. 2011), and D. repleta and D. hydei(16.3 myr) (Oliveira et al. 2012) to the distantly re-lated species of the Drosophila and Sophophora sub-genera (62.9 myr) (Tamura et al. 2004). Figure 2provides a summary of the known phylogenetic rela-tionships between the nine taxa.Selection of Characters.We made a selection of the
most informative characters on Drosophila imagines,pupae, and eggs (Throckmorton 1962, 1975; Bock1976; Vilela and Bachli 1990; Bachli et al. 2005; and theauthorsÕ unpublished data). Because we were trying todetect a phylogenetic signal, we were interested onlyon heritable traits. As previously has been establishedby Grimaldi (1990) in a morphological systematic ap-proach to Drosophilidae, when we are using morpho-logical characters in a cladistic analysis, we are sur-veying the expressions of thousands of genes, forinstance, quantitative trait locus (QTL) mapping stud-ies (Laurie et al. 1997, Zeng et al. 2000) have identiÞed
a minimum of 20 loci underlying the morphologicaldifference between Drosophila mauritiana Le-meunier and Ashburner 1976 andDrosophila simulansSturtevant, 1919, closely related species of the Dro-sophila melanogaster species subgroup. Another re-cent study (Yassin 2013) conÞrms as well the strongphylogenetic signal that morphological charactersprovide at different phylogenetic scales.
The following criteria were used to select traits: 1)characters taxonomically informative, they shouldcorrelate well with taxonomic grouping; 2) indepen-dent characters, the measures should not correlatewith specimen size. We used not only discrete char-acters (traditionally used for phylogenetic analyses)but also continuous characters that contain phyloge-netic information and often support or reinforce theresults generated by discrete characters (Goloboff etal. 2006). Our dataset contains 52 morphological char-acters, 27 discrete and 25 continuous (Supp. Table 2[online only]). Two discrete traits pertain to imma-ture stages, the rest to the imago: head (2), thorax (3),wing (4), leg (1), male genitalia (11), and femalegenitalia (4). All continuous traits belong to the adult:head (7), thorax (5), and wing (13). An almost com-plete date set was generated for nine taxa, all exceptD. peruensis (Supp. Table 3 [online only]). Only Þveof the nine taxa have missing data, usually very few (1,2, 7, 17, and 1 in D. littoralis, D. virilis, D. boraceia, D.atalaia, andD. hydei, respectively). However, only 15characters were recorded from the description of D.
Fig. 2. Evolutionary landscape of the species possibly related to D. machalilla sp. nov., numbers in parenthesis on eachnode show phylogenetic studies supporting each evolutionary hypothesis: (A) SophophoraÐDrosophila radiation hypothesis:(1) (Throckmorton 1975), (2) (Remsen and OÕGrady 2002), (3) (Spicer and Bell 2002), (4) (Wang et al. 2006), (5) (Clarket al. 2007), (6) (Wasserman 1992), (7) (Tatarenkov and Ayala 2001), and (8) (Vilela 1983). (B) peruensis species grouphypothesis: (9) (Ratcov and Vilela 2007).
November 2013 ACURIO ET AL.: CLADISTIC CLASSIFICATION OF A NEW Drosophila SPECIES 3
29

peruensis.Because specimens of this species have beenmisidentiÞed frequently (Ratcov and Vilela 2007), thetaxon was omitted from analyses.
Cladistic Analysis
A maximum parsimony cladistic analysis was per-formed with the program TNT (Goloboff et al. 2008).Continuous characters were analyzed as such to avoidad hoc methods for discretization. The analysis wascarried out using the implied weighting method ofGoloboff (1993), with k � 15. Continuous characterswere optimized as additive by TNT, and discrete char-acters were considered as unordered, so an evolution-ary change could hypothetically transform freely be-tween any of the described states.
To measure concordance between datasets, twomeasures of group supportÑJackkniÞng (P � 0.36)and Symmetric Resampling (P � 0.33)Ñwere calcu-lated under implied weighting, with 500 replications.Measures of raw frequency groups were calculated forboth, the strict consensus tree obtained by discretedata set and the optimal tree obtained by the completedata set. Similarity on trees was estimated using sub-tree pruning and regrafting (SPR) distances imple-mented in TNT. The most parsimonious tree was ob-tained by implicit enumeration search using thebranch-and-bound algorithm. Polarity on the charac-ters was deÞned by using D. willistoni from Sopho-phora subgenus as outgroup. Character mapping andbest tree diagnosis was produced in TNT with theoption of common synapomorphies on the optimaltree obtained.Taxonomic Description. We used the traditional
morphological terms applied in taxonomic studies ofDrosophilidae (Wheeler 1981, Grimaldi 1990, Vilelaand Bachli 1990). Abbreviations are as follows: or1 �proclinate orbital seta; or2 � anterior reclined orbitalseta; or3 � posterior reclinate orbital seta; vtm �medial vertical seta; vtl � lateral vertical seta; vi �vibrissa; h � postpronotal seta; dc � dorsocentral seta;C � costa; ac � acrostical setae; hb � wing heavybristles. The indices and measures calculated arebased mainly in Bachli et al. (2005).
Drosophila machalilla sp. nov.
Type Material.HOLOTYPE: � QCAZ2519. PARA-TYPE: � QCAZ2534. Remain in the Invertebrate Mu-seum Collection of the PontiÞcia Universidad Catolicadel Ecuador (QCAZ). Labeled: “Ecuador: Manabõ:San Jose Beach, 10ÐXIIÐ2010, (01� 13�46.4� S, 80�49�14.6� W). Acurio A. coll.” Both specimens havemicrovials with terminalia preserved in glycerol.PARATYPES: � QCAZ2520, � QCAZ2535. Same dataas holotype. Additional PARATYPES: 2 �� and 2 ��have been deposited in the American Museum ofNatural History (AMNH).Diagnosis. D. machalilla can be differentiated from
closely related taxa by having a scutellum light brown,medially darker with brownish spots around scutellarsetae, without prescutellar setae. Wing indices 4V �
1.83, 5x � 1.79. Aedeagus apically with one pair ofshort pointed spurs in the ventral margin, hypandriumwith spurious disto-dorsal arms.Male. Head (from live material). Frons yellowish
with brownish patches, frontal length 0.43 mm; frontalindex � 0.79, top to bottom width ratio 1.44. Frontaltriangle narrow, pale brown, as long as frons, ocellartriangle almost completely yellow with dark brownspots around yellow ocellus, �45Ð48% of frontallength. Frontal vittae pale brown. Orbital plates nar-row, pale brown with dark brown spots around or1,or2, or3, vtm, and vtl, �78Ð90% length. Orbital setaeblack, or2 slightly outside of or1, distance of or3 toor1 � 74Ð80% of or3 to vtm, or1/or3 ratio � 0.8,or2/or1 ratio � 0.5. Postocellar setae 44%, ocellarsetae � 70% of frontal length; vibrissal index � 0.55.Face yellowish. Carina yellowish, prominent, noselike, broadened downward, dorsally slightly groovedlongitudinally. Gena and postgena light brown. Cheekindex �6Ð7. Eyes red bright, eye index 1.2. Occiputdark brown narrowly yellow along eye margins. Pedi-cel yellowish. Flagellomere one pale brown. Aristawith 3Ð4 dorsal, 2 ventral, and �3 small innerbranches, plus terminal fork. Proboscis light brown.Clypeus brown, palpus light brown with �3 setae andseveral setulae.Thorax. Length 1.06 mm. Scutum yellowish with a
pattern of dark brown spots around bases of most setaeand setulae, eight rows of acrostical setulae. H index1.6. Transverse distance of dorsocentral setae 170Ð200% of longitudinal distance; dc index � 0.77. Noprescutellars. Scutellum light brown medially darkerwith brown spots around scutellar setae, distance be-tween apical scutellar setae �75Ð80% of that betweenapical and basal one, basal setae convergent; scut in-dex � 0.83. Pleura predominantly brown with a yel-lowish central area, subshining, sterno index 0.72, me-dian katepisternal setae �36% of anterior one. Halterebrownish-yellow. Legs yellowish brown, preapicalsetae on all tibiae, apical seta on mesotibia.Wings. Hyaline all veins yellowish with a yellowish
shadow in the dorsal part of marginal and submarginalcells, costal section with heavy bristles, R1 � 2 andR3 � 4 slightly darker in older individuals, length 2.16mm. Length to width radio � 1.92. Indices: C � 2.43,ac � 2.22, hb � 0.38, 4C � 0.98, 4v � 1.64, 5x � 1.72,M � 0.62, prox. x � 0.68.Abdomen. Yellowish, with a narrow brown mar-
ginal band, reaching posterior margin of each tergite,subshining.Terminalia (Fig. 3). Epandrium (Fig. 3A) mostly
microtrichose, with seven lower setae and no uppersetae; ventral lobe roundish at the tip, dorsally broadand ventrally narrow, microtrichose. Cercus anteri-orly fused to epandrium, microtrichose and withoutventral lobe. Surstylus microtrichose, with a slightlyconcave row of ca. 14 peg-like prensisetae, ca. fourinner and seven outer setae. Hypandrium (Fig. 3B)slightly shorter than epandrium, anterior margin con-vex; posterior hypandrial process and hypandriumwith spurious disto-dorsal arms; gonopod linked toparaphysis by membranous tissue, with one seta an-
4 ANNALS OF THE ENTOMOLOGICAL SOCIETY OF AMERICA Vol. 106, no. 6
30

teriorly near inner margin. Aedeagus (Fig. 3CÐE) api-cally pointed, ventrally expanded with a pair of sub-apical pointed spurs and one pair of short pointedspurs in the center of the ventral margin. Aedeagalapodeme shorter than aedeagus anteriorly expandeddorsoventrally, laterally ßattened. Ventral rod as longas gonopod, dorsoventrally ßattened. Paraphysislinked both to ventrodistal margin of aedeagalapodeme and to gonopod by membranous tissue, me-dially with one setula near to dorsal margin.Female. Measurements. Frontal length 0.44; frontal
index � 0.79, top to bottom width radio � 1.43. Ocellartriangle �43Ð44% of frontal length. Orbital plates�80Ð90% of frontal length. Distance of or3 to or1 �78Ð80% of or3 to vtm, postocellar setae � 45%, ocellarsetae � 64% of frontal lenght; vibrissal index � 0.58.Cheek index �6.5. Eye index � 1.27. Thorax length1.11 mm. H index � 1.4. Transverse distance of dor-socentral setae 180Ð206% of longitudinal distance; dcindex � 0.6. Distance between apical scutelar setae�82% of that between apical and basal one; scut in-dex � 0.71, sterno index � 0.69, median katerpisternalsetae �34% of anterior one. Wing length 2.26 mm,
length to width radio � 1.97. Indices: C � 2.37, ac �2.48, hb � 0.46, 4C � 1.1, 4v � 1.83, 5x � 1.79, M � 0.64,prox. x � 0.77.Terminalia (Fig. 4). Valve of oviscapt (Fig. 4A)
brownish, distally rounded, ventrally slightly convex,with ca. two distal and ca. 11Ð12 marginal, peg-likeouter ovisencilla, Þrst ones roundish and latter onessharp at tip; trichoid-like outer ovisencilla: three thin,distally positioned and one long curved subterminal.
Fig. 3. Male terminalia ofD.machalilla sp. nov.; (A) Epandrium, cerci and surstyli, and decasternum posterior view; (B)Hypandrium; (CÐE) aedeagus, aedeagal apodeme, and paraphyses, several views dorsal, ventral, and right lateral, respectively.
Fig. 4. Female terminalia of D. machalilla sp. nov.; (A)Left oviscapt valve, lateral view; (B) Spermathecae.
November 2013 ACURIO ET AL.: CLADISTIC CLASSIFICATION OF A NEW Drosophila SPECIES 5
31

Spermatecae (Fig. 4B) Þngertip-shaped slightly invag-inated, heavily sclerotized.Biology. Puparia (Fig. 5A) yellowish; horn index
�1.56; each anterior spiracle with �12 branches.Lifespan. At 24�C and 33% humidity: larvae hatches 3 dafter the egg is fertilized. First, second, and third instarlarvae take � 6 d and pupae � 6.5 d. The imaginesreachmaturity ca.15.5d.Eggswith fourÞlaments(Fig.5B).Etymology. Named to honor the Machalilla culture;
one of the most important early societies from Ecua-dorian Coast and region where this new species wasfound. This culture inhabited southern Manabõ andSanta Elena Peninsula in a period ranging between:1400Ð850 B.C. The Machalilla culture is known by acharacteristic pottery style and the practice of skulldeformation (Meggers and Evans 1962).
Results
The implicit enumeration analysis of the 27 discretecharacters alone, yielded two most parsimonioustrees with six nodes, a total adjusted homoplasy of 0.56and a length of 51 steps (Fig. 6A and B), the strictconsensus cladogram of which is shown in Fig. 6C. Theconsensus tree has Þve nodes, a total adjusted ho-moplasy of 0.61, and 52 steps of length. The phyloge-netic signal recovered with the discrete data aloneis good enough to recover the evolutionary relation-ships from taxa of the same species group as the cladesvirilis and repleta.The addition of 25 continuous char-acters to the data matrix and an implicit enumerationsearch under the same parameters yielded the optimaltree of Fig. 6D; this tree has seven nodes, a length of129 steps. Autapomorphic features distinguishing D.machalilla sp.nov. fromother spotted-thoraxDrosoph-ila species (Table 1) are differences in the sternoindex, wing indices 4V and 5X.
The minimum number of SPR moves from strictconsensus tree obtained by discrete data set (Fig. 6C)to transforming in the best tree obtained analyzing
discrete and continuous data set (Fig. 6D) is 0; nomovements are necessary because both trees recoveridentical relationships. We Þnd no pattern of increaseor decrease of group support (JackkniÞng or Symmet-ric Resampling) by addition of continuous characters.However, the additions of continuous characters in-crease the resolution of the phylogeny, as several sy-napomorphies belong to the class of continuous traits(Fig. 6C and D).
As is depicted in Fig. 6, D. machalilla sp. nov. is asister taxon of D. atalaia, and together conform aseparate clade of peruensis and repleta clades. Theatalaia clade is recovered using both discrete aloneand complete data set; this clade is supported by twosynapomorphies (Table 2), character 32, presence ofa dark costal lappet on the wing, and character 43,presence of disto-dorsal arms of the hypandrium; thisstructure and differences between taxa is easily dis-tinguished in a graphical comparison of the male gen-italia, the most used morphological structure in Dro-sophila taxonomy (Fig. 7).
One of the synapomorphies found in the repletaÐperuensisÐatalaia clade is the character 27, presence ofspots at base of setae on mesonotum. Figure 7 showsthis trait, shared by species of the peruensis group,repleta group, and D. machalilla sp. nov., mapped onthe optimal tree obtained by implicit enumeration.
Discussion
The phylogenetic relationships retrieved in our re-analysis of the peruensis group mostly corroboratedthe previous work by Ratcov and Vilela (2007), whichwas based on a taxonomic analysis. The previous hy-pothesis and the results obtained in our cladistic anal-ysis of 52 morphological characters are congruent inthe respect that D. pauliceia is a sister species of D.boraceia, and both species conform a monophyleticgroup separate from repleta species group, despite thedifferent taxa analyzed and methods applied on eachstudy. However, our analysis is discordant with RatcovandVilelaÕs (2007) in thephylogenetic relationshipsofD. atalaia because, according to our cladistic analysis,this species belongs to a separate clade outside theperuensis group. Ratcov and Vilela (2007) pointed outthat D. atalaia was the only species from peruensisgroup that: 1) has no prescutellar setae on thorax; 2)has not both main crossveins darker on wing; 3) has aspurious dorsal arch on hypandrium; and 4) has adifferent disposition of sensilla in the oviscapt. How-ever, they classiÞed D. atalaia in the peruensis groupbased on morphological similarities on male and fe-male terminalia, because at the time, those were theclosely related species known. Also noteworthy is thedifference in habitat and geographical distributionbetween the other three species that belong to theperuensis group and D. atalaia as reported by Ratcovand Vilela (2007 p. 310): “The triad of forest-dwellingspecies, namely D. boraceia, D. pauliceia, sp. nov, andD. peruensis, are more closely related to each otherthan they are to the xerophilous and probably cacto-philicD. atalaia.” It is interesting that both species D.
Fig. 5. Immature stages ofD.machalilla sp. nov. (A) Egg;(B) Pupae.
6 ANNALS OF THE ENTOMOLOGICAL SOCIETY OF AMERICA Vol. 106, no. 6
32

atalaia andD. machalilla sp. nov. occur on coastal dryforest with predominance of Cactaceae. Although weonly can speculate about the area of distribution of
both species because more collections are necessary,we know that the type locality ofD. atalaiawas Arraialdo Cabo located at Brazilian coast of South Atlantic
Fig. 6. Results of the cladistic analysis of 52 morphological traits in nine Drosophila species. (A and B) Two equallyparsimonious trees found by implicit enumeration of the discrete data set (27 discrete morphological traits). (C) Strictconsensus tree of two most parsimonious trees A and B found in the analysis of 27 discrete morphological traits. (D) Optimaltree obtained by implicit enumeration of the complete data set (27 discrete � 25 continuous morphological traits). In (C)and (D) synapomorphies (black rectangles) are mapped on trees; the numbers above rectangles refer to character numbers(Supp. Table 2 [online only]); the numbers beneath branchings indicate group support JackniÞng (P� 36) and SymmetricResampling (P� 33). Colors denoteDrosophila clades: repleta clade (green), peruensis clade (blue), atalaia clade (red), andvirilis clade (yellow). Asterisks denote new species here described.
November 2013 ACURIO ET AL.: CLADISTIC CLASSIFICATION OF A NEW Drosophila SPECIES 7
33

Ocean and type locality ofD.machalilla sp. nov. is SanJose beach located at Ecuadorian PaciÞc Coast. Ananalysis of male and female terminalia of both speciesalso conÞrmed the evolutionary relationship recov-ered in our cladistic analysis (see above). Besides, theresults found here are congruent with a molecularphylogenetic analysis of D. machalilla and represen-tatives of six subgroups (mulleri, fasciola, hydei, mer-catorum, repleta, and inca) of the repleta group andnannoptera group using sequences of Þve molecularmarkers: three mitochondrial and two nuclear genes(Acurio, Oliveira, Rafael, and Ruiz, unpublisheddata).
Classification
Drosophila peruensis Species Group. As lineage ofthe subgenusDrosophilaPattersonandMainland, 1944(or Siphlodora in Yassin 2013, classiÞcation schemeproposed). In the absence of a male specimen of D.peruensis, the phylogenetic position of this group isbased on the female specimen.Diagnosis. sensu lato Ratcov and Vilela (2007)
Small ßies, with most setae and setulae of the thoraxand head arising from dark brown spots, which may besomewhat fused; wings with both main crossveinsdarker, hypandrium somewhat square-shaped, mostlyfused to gonopods and devoid of dorsal arch.Discussion. Previously, both the peruensis and
repleta species groups were included in theDrosophilasubgenus (Ratcov and Vilela 2007, OÕGrady andMarkow 2009). In the classiÞcation scheme proposedrecently by Yassin (2013 p. 11), the peruensis groupwas placed in the reorganized Drosophila subgenusalong with Phloridosa, Chusqueophila, and Palmophila,whereas the repleta group was transferred to the newSubgenus Siphlodora. However, this seems to be in-correct because there are no available molecular se-quences for peruensis group and male genitalia of thisgroup should place it in the subgenus Siphlodora (A.Yassin, personal communication). In addition, the bib-liographic reference cited in the study of Yassin(2013) to classify the peruensis group is Vilela andPereira (1985), which has been reported as a misiden-tiÞcation (Ratcov and Vilela 2007 p. 310). Our cladisticanalysis corroborates that the peruensis species groupis closely related to the repleta species group andtherefore both should belong to the same subgenus.Taxon content. Five extant speciesÑD. peruensis, D.boraceia, D. pauliceia, D. itacorubi, and D. paraita-corubi.Drosophila atalaia new Species Group. As lineage
of the subgenus Drosophila Patterson and Mainland(or Siphlodora in Yassin 2013 scheme classiÞcation).Inside the virilis–repleta radiation, one of the threemajor radiations inside the subgenus Drosophila ac-cording to Throckmorton hypothesis (OÕGrady andMarkow, 2009).Taxon content. Two extant species:D.atalaiaandD.
machalilla sp. nov.Diagnosis. Small yellowish ßies with dark brown
spots on mesonotum, hypandrium with disto-dorsal
Tab
le1
.A
utap
omor
phie
sof
each
taxa
obta
ined
inth
ecl
adis
tic
anal
ysis
ofdi
scre
tean
dco
ntin
uous
char
acte
rs
littoralis
virilis
boraceia
pauliceia
atalaia
hydei
repleta
machalilla
1:0.
843
0.78
5:0.
853
0.92
0:1.
343
1.5
2:�7
.40Ð
103
514:2
.163
1.8
0:1.
331.
231:
�0.8
6Ð0.
923
0.99
10:0
.703
0.69
2:4.
033.
56:
0.543
0.58
1:0.
923
1.0
3:0.
630.
7515:2
.263
1.9
2:6.
034.
53:
0.563
0.52
21:1
.693
1.89
3:�0
.56Ð
0.85
30.
5510:0
.833
0.87
4:1.
193
�1.2
Ð1.4
5:
0.853
1.0
19:2
.433
2.2
6:0.
543
0.63
4:1.
173
1.16
24:1
.63
1.72
4:1.
203
1.14
23:�
0.61
Ð0.6
83
0.72
5:0.
853
0.80
8:1.
443
1.55
20:0
.983
1.2
9:1.
323
1.41
5:0.
853
0.93
48:33
25:
0.853
0.71
24:1
.303
1.0
6:�0
.53Ð
0.54
30.
7014:2
.63
3.0
21:�
1.69
Ð1.8
93
2.0
10:0
.813
0.82
7:0.
830.
727:
0.963
1.08
7:�0
.80Ð
0.83
30.
9016:2
.13
2.13
22:0
.623
0.70
11:�
33.0
Ð34.
03
29.5
11:�
33.0
Ð34.
03
37.5
9:1.
223
1.29
11:3
3.003
27.0
019:3
.43
3.79
47:33
218:�
0.40
Ð0.4
13
0.48
14:2
.63
2.81
12:0
.673
0.68
12:0
.633
0.60
20:0
.803
0.65
22:�
0.50
Ð0.5
13
0.46
17:�
2.04
Ð2.2
23
2.24
13:1
.153
1.16
13:0
.883
0.80
21:1
.63
1.47
23:0
.793
0.80
36:13
015:2
.643
2.83
16:2
.13
2.0
22:0
.503
0.43
24:�
1.18
Ð1.2
73
1.11
41:23
416:2
.223
2.25
17:1
.943
1.90
32:03
133:13
017:2
.133
2.08
23:0
.603
0.40
18:0
.593
0.61
24:1
.183
1.10
19:2.
883
2.96
41:23
920:0
.943
0.77
42:43
521:�
1.69
Ð1.8
93
1.57
44:13
022:0
.563
0.46
23:�
0.61
Ð0.6
83
0.51
38:23
15
Num
bers
inbold
den
ote
the
char
acte
rslist
ed
in(S
upp.T
able
2�o
nlin
eon
ly)
,in
bra
ckets
ran
ges
of
char
acte
rvar
iati
on
.
8 ANNALS OF THE ENTOMOLOGICAL SOCIETY OF AMERICA Vol. 106, no. 6
34
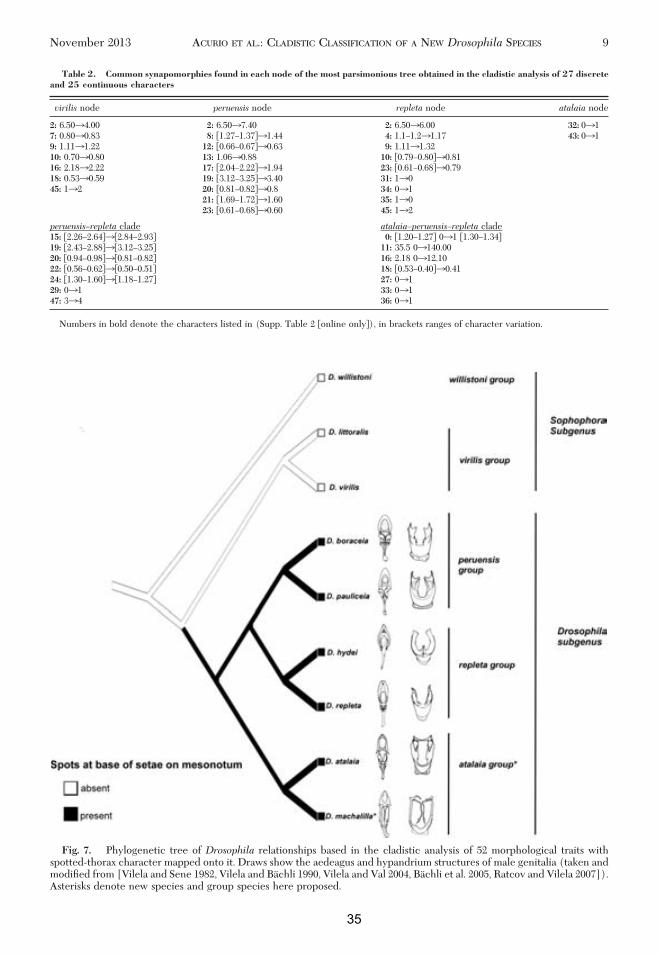
Fig. 7. Phylogenetic tree of Drosophila relationships based in the cladistic analysis of 52 morphological traits withspotted-thorax character mapped onto it. Draws show the aedeagus and hypandrium structures of male genitalia (taken andmodiÞed from [Vilela and Sene 1982, Vilela and Bachli 1990, Vilela and Val 2004, Bachli et al. 2005, Ratcov and Vilela 2007]).Asterisks denote new species and group species here proposed.
Table 2. Common synapomorphies found in each node of the most parsimonious tree obtained in the cladistic analysis of 27 discreteand 25 continuous characters
virilis node peruensis node repleta node atalaia node
2: 6.5034.00 2: 6.5037.40 2: 6.5036.00 32: 0317: 0.8030.83 8: �1.27Ð1.3731.44 4: 1.1Ð1.231.17 43: 0319: 1.1131.22 12: �0.66Ð0.6730.63 9: 1.1131.3210: 0.7030.80 13: 1.0630.88 10: �0.79Ð0.8030.8116: 2.1832.22 17: �2.04Ð2.2231.94 23: �0.61Ð0.6830.7918: 0.5330.59 19: �3.12Ð3.2533.40 31: 13045: 132 20: �0.81Ð0.8230.8 34: 031
21: �1.69Ð1.7231.60 35: 13023: �0.61Ð0.6830.60 45: 132
peruensis–repleta clade atalaiaÐperuensisÐrepleta clade15: �2.26Ð2.643�2.84Ð2.93 0: �1.20Ð1.27 031 �1.30Ð1.3419: �2.43Ð2.883�3.12Ð3.25 11: 35.5 03140.0020: �0.94Ð0.983�0.81Ð0.82 16: 2.18 0312.1022: �0.56Ð0.623�0.50Ð0.51 18: �0.53Ð0.4030.4124: �1.30Ð1.603�1.18Ð1.27 27: 03129: 031 33: 03147: 334 36: 031
Numbers in bold denote the characters listed in (Supp. Table 2 �online only), in brackets ranges of character variation.
November 2013 ACURIO ET AL.: CLADISTIC CLASSIFICATION OF A NEW Drosophila SPECIES 9
35

arms, females with a lower most-distal ovisensilla onoviscapt, and habitat preference for coastal dry forestwith predominance of Cactaceae.Discussion. D. atalaia, previously belonging to theperuensis species group (Ratcov and Vilela 2007), andD. machalilla sp. nov. are now grouped in the newspecies group atalaia on the basis of male and femalegenitalia, monophyly on a cladistic analysis, prefer-ence of substrate, and habitat ecology.
The Spotted-Thorax Character
Neotropical species of Drosophila with each hairand bristle arising from black or dark brown spot onmesonotum and a substrate preference for Cactaceaeplants were, until few years ago, identiÞed as belong-ing to the repleta species group. Species in this grouphave been studied in morphological and cytologicaldetail (Wasserman 1982, Vilela 1983) and have servedas a model system for evolutionary (Ewing and Miyan1986; Wasserman 1992; Ruiz et al. 1997; Oliveira et al.,2008, 2012) and ecological studies (Markow 1981, Ruizand Heed 1988, Krebs 1991, Etges 1993). In the lightof our results, we recommend caution in the use of thismorphological trait for identiÞcation at lower taxo-nomical levels such as species groups.
Currently it is unclear whether the virilisÐrepletaradiation can be deÞned as monophyletic (Grimaldi1990, Tatarenkov and Ayala 2001, Remsen andOÕGrady 2002, OÕGrady and Markow 2009, Yassin2013) in this context; high quality systematic researchincluding both alpha-taxonomy and phylogeneticallysupported hypotheses becomes critical to better re-solve the evolutionary relationships of a prime modelsystem as Drosophila.
References Cited
Acurio, A., and V. Rafael. 2009a. Diversity and geographicaldistribution of Drosophila (Diptera, Drosophilidae) inEcuador. Dros. Inf. Serv. 92: 20Ð25.
Acurio, A., and V. Rafael. 2009b. Taxonomic survey ofDrosophilidae (Diptera) in the Yasuni National Park,Ecuadorian amazon. Acta Amazonica 39: 713Ð718.
Acurio, A., V. Rafael, and O. Dangles. 2010. Biological in-vasions in the amazonian tropical rain forest: the case ofDrosophilidae (Insecta, Diptera) in Ecuador, SouthAmerica. Biotropica 42: 717Ð723.
Agnarsson, I., andM. Kuntner. 2007. Taxonomy in a chang-ing world: seeking solutions for a science in crisis. Syst.Biol. 56: 531Ð539.
Bachli, G., C. R. Vilela, S. S. Escher, and A. Saura. 2005. TheDrosophilidae (Diptera) of Fennoscandia and Denmark.Brill Academic Publishers, Leiden, The Netherlands.
Bock, I. R. 1976. Drosophilidae of Australia. I. Drosophila(Insecta: Diptera). Aust. J. Zool. Suppl. Ser. 24: 1Ð105.
Brake, I., and G. Bachli. 2008. Drosophilidae (Diptera)world catalogue of insects. Apollo Books, Stenstrup, Den-mark.
Cespedes, D., and V. Rafael. 2012. Cuatro especies nuevasdel grupo de especiesDrosophila mesophragmatica (Dip-tera, Drosophilidae) de los andes ecuatorianos. IheringiaSer. Zool. 102: 71Ð79.
Clark, A. G., M. B. Eisen, N. Smith, R. B. Douglas, M.O.B.Casey, T. A. Markow, and T. C. Kaufman. 2007. Evolu-tion of genes and genomes on theDrosophila phylogeny.Nature 450: 203Ð218.
Doge, J. S., M. S. Gottschalk, and V.L.S. Valente. 2011. Twonew neotropical species of Drosophila peruensis speciesgroup (Diptera, Drosophilidae). Iheringia Ser. Zool. 101:310Ð316.
Etges, W. 1993. Genetics of host-cactus response and life-history evolution among ancestral and derived popula-tions of cactophilic Drosophila-mojavensis. Evolution 47:750Ð767.
Ewing, A.W., and J. A.Miyan. 1986. Sexual selection, sexualisolation and the evolution of song in the Drosophila-repleta group of species. Anim. Behav. 34: 421Ð429.
Felsenstein, J. 2004. Inferring phylogenies. Sinauer Associ-ates, Sunderland, MA.
Figuero, M. L., V. Rafael, and D. Cespedes. 2012. GrupoDrosophila asiri (Diptera, Drosophilidae), un nuevogrupo de especies andinas con la descripcion de dosnuevas especies y la redescripcion de Drosophila asiri.Iheringia Ser. Zool. 102: 33Ð42.
Goloboff, P. A. 1993. Estimating character weights duringtree search. Cladistics 9: 83Ð91.
Goloboff, P. A., C. I. Mattoni, and A. S. Quinteros. 2006.Continuous characters analyzed as such. Cladistics 22:589Ð601.
Goloboff, P. A., J. S. Farris, and K. C. Nixon. 2008. TNT, afree program for phylogenetic analysis. Cladistics 24:774Ð786.
Grimaldi, D. A. 1990. A phylogenetic, revised classiÞcationof genera in the Drosophilidae (Diptera). Bull. Am. Mus.Nat. Hist. 197: 1Ð39.
Hennig, W. 1966. Phylogenetic systematics. University Illi-nois Press. Urbana-Champaign, IL.
Krebs, R. 1991. The mating behavior ofDrosophilamojaven-sis on organ pipe and agria cactus. Psyche 98: 101Ð109.
Laurie, C. C., J. R. True, J. Liu, and J. M. Mercer. 1997. Anintrogression analysis of quantitative trait loci that con-tribute to a morphological difference betweenDrosophilasimulans and D. mauritiana. Genetics 145: 339Ð348.
Lipscomb, D. L. 1998. Basics of cladistic analysis. GeorgeWashington University Washington, DC.
Markow, T. 1981. Courtship behavior and control of repro-ductive isolation between Drosophila mojavensis andDrosophila arizonensis. Evolution 35: 1022Ð1026.
Mast, R. B., C. G. Mittermeier, R. A. Mittermeier, J. V.Rodrıguez-Mahecha, and A. H. Hemphill. 1997. Ecua-dor, pp. 314Ð324. In R. A. Mittermeier, P. Robles Gil, andC. G. Mittermeier (eds.), Megadiversity: EarthÕs Biolog-ically Wealthiest Nations. Cemex, Monterrey, Mexico.
Meggers, B. J., and C. Evans. 1962. The machalilla culture:an early formative complex on the ecuadorian coast. Am.Antiq. 28: 186Ð192.
Mora, C., D. P. Tittensor, and R. A. Myers. 2008. The com-pleteness of taxonomic inventories for describing theglobal diversity and distribution of marine Þshes. Proc. R.Soc. B 275. 149Ð155.
Morales–Hojas, R., M. Reis, C. P. Vieira, and J. Vieira. 2011.Resolving the phylogenetic relationships and evolution-ary history of theDrosophilavirilisgroup using multilocusdata. Mol. Phy. Evol. 60: 249Ð258.
Moritz, C., and D. M. Hillis. 1996. Context and controver-sies, pp. 1Ð10. In D. W. Hillis and C. Moritz (eds.), Mo-lecular Systematics, Sinauer, Sunderland, MA.
O’Grady, P., and T. Markow. 2009. Phylogenetic taxonomyin Drosophila. Fly (Austin) 3: 10Ð14.
10 ANNALS OF THE ENTOMOLOGICAL SOCIETY OF AMERICA Vol. 106, no. 6
36

Oliveira, D.C.S.G., M. Leonidas, W. J. Etges, P. M. O’Grady,and R. De Salle. 2008. Species delimitation in the Dro-sophila aldrichi subcluster (Diptera: Drosophilidae) us-ing DNA sequences. Zootaxa 1725: 37Ð47.
Oliveira, D.C.S.G., F. C. Almeida, P. M. O’Grady, M. A.Armella, R. De Salle, and W. J. Etges. 2012. Monophyly,divergence times, and evolution of host plant use inferredfrom a revised phylogeny of the Drosophila repleta spe-cies group. Mol. Phy. Evol. 64: 533Ð544.
Rafael, V., and G. Arcos. 1989. Subgrupo inca, un nuevosubgrupo del grupo repleta, con desacripcion de Dro-sophila huancavilcaen. sp (Diptera, Drosophilidae). Evol.Biol. 3: 233Ð243.
Ratcov,V., andC.R.Vilela. 2007. A new neotropical speciesof spot-thoraxed Drosophila (Diptera, Drosophilidae).Rev. Bras. Entomol. 51: 305Ð311.
Remsen, J. and P. O’Grady. 2002. Phylogeny of Drosophili-nae (Diptera: Drosophilidae), with comments on com-bined analysis and character support. Mol. Phy. Evol. 24:248Ð263.
Ruiz, A., J. Ranz, M. Caceres, C. Segarra, and A. Navarro.1997. Chromosomal evolution and comparative genemapping in the Drosophila repleta species group. Rev.Bras. Gen. 20: 553Ð565.
Ruiz, A., andW. B.Heed. 1988. Host-plant speciÞcity in thecactophilic Drosophila mulleri species complex. J. Anim.Ecol. 57: 237Ð249.
Spicer, G. S., and C. D. Bell. 2002. Molecular phylogeny ofthe Drosophila virilis species group (Diptera: Drosophi-lidae) inferred from mitochondrial 12S and 16S ribosomalRNA genes. Syst. Biol. 95: 156Ð161.
Tamura, K., S. Subramanian, and S. Kumar. 2004. Temporalpatterns of fruit ßy (Drosophila) evolution revealed bymutation clocks. Mol. Biol. Evol. 21: 36Ð44.
Tatarenkov, A., and F. J. Ayala. 2001. Phylogenetic relation-ships among species groups of the virilisÐrepleta radiationof Drosophila. Mol. Phyl. Evol. 21: 327Ð331.
Throckmorton, L. H. 1962. The problem of phylogeny inthe genus Drosophila. Univ. Tex. Publ. 6205: 207Ð343.
Throckmorton, L.H. 1975. The phylogeny, ecology and ge-ography of Drosophila, pp. 421Ð469. In R. C. King (ed.),Handbook of Genetics, Plenum, New York, NY.
Vela, D., and V. Rafael. 2004. Three new andean species ofDrosophila (Diptera, Drosophilidae) of the mesophrag-matica group. Iheringia Ser. Zool. 94: 295Ð299.
Vilela, C. R. 1983. A revision of the Drosophila repleta spe-cies group (Diptera, Drosophilidae). Rev. Bras. Entomol.27: 1Ð114.
Vilela, C. R. and G. Bachli. 1990. Taxonomic studies onneotropical species of seven genera of Drosophilidae(Diptera). Mitt. Schweiz. Entomol. Ges. 63: 1Ð332.
Vilela, C. R., and F. M. Sene. 1982. A new spotted thoraxspecies of the genus Drosophila (Diptera, Drosophili-dae). Rev. Bras. Entomol. 26: 343Ð347.
Vilela, C. R., and F. C. Val. 2004. A new spot-thoraxed spe-cies ofDrosophila from the Atlantic forest of southeasternBrazil (Diptera, Drosophilidae). Rev. Bras. Entomol. 48:45Ð48.
Wang, B., J. Park, H. Watabe, J. Gao, J. Xiangyu, T. Aotsuka,H. Chen, and Y. Zhang. 2006. Molecular phylogeny ofthe Drosophila virilis section (Diptera: Drosophilidae)based on mitochondrial and nuclear sequences. Mol.Phyl. Evol. 40: 484Ð500.
Wasserman,M. 1982. The repleta species group, pp. 61Ð140.In M. Ashburner, J. N. Thompson, and H. L. Carson(eds.), The Genetics and Biology of Drosophila. Aca-demic Press, New York, NY.
Wasserman,M. 1992. Cytological evolution of theDrosoph-ila repleta species group, pp. 455Ð541. In J. R. Powell andC. B. Krimbas (eds.), Inversion Polymorphism in Dro-sophila. CRC, Inc., Boca Raton, FL.
Wheeler,M. R. 1981. The Drosophilidae: a taxonomic over-view, pp. 1Ð97. InM. Ashburner, H. L. Carson, and J. N.Thompson (eds.), The Genetics and Biology ofDrosoph-ila. Academic Press, London, United Kingdom.
Wheeler, Q. 1995. Systematics, the scientiÞc basis for in-ventories of biodiversity. Biodivers. Conserv. 4. 476Ð489.
Wheeler,Q. 2004. Taxonomic triageand thepovertyofphy-logeny. Phil. Trans. R. Soc. Lond. B 359: 571Ð583.
Wheeler, Q. 2010. What would NASA do? Mission-criticalinfrastructure for species exploration. Syst. Biodiovers. 8:11Ð15.
Wilson, E. O. 2004. Taxonomy as a fundamental discipline.Phil. Trans. R. Soc. Lond. B 359: 739Ð739.
Yassin, A. 2013. Phylogenetic classiÞcation of the Drosophi-lidae rondani (Diptera): the role of morphology in thepostgenomic era. Syst. Entomol. 32: 349Ð364.
Zeng, Z., J. Liu, L. F. Stam, C. Kao, J. M. Mercer, and C. C.Laurie. 2000. Genetic architecture of a morphologicalshape difference between two Drosophila species. Ge-netics 154: 299Ð310.
Received 8 March 2013; accepted 8 July 2013.
November 2013 ACURIO ET AL.: CLADISTIC CLASSIFICATION OF A NEW Drosophila SPECIES 11
37

IV. RESULTS AND DISCUSION
38
Chapter 2.-Evidence of a South American origin for the Drosophila repleta lineage.
Andrea Acurio1, Kari Roesch Goodman2, Deodoro CSG Oliveira1, Violeta Rafael3 & Alfredo Ruiz1
1 Departament de Genètica i de Microbiologia, Universitat Autònoma de Barcelona, Bellaterra 08193 Barcelona, Spain
2 Department of Environmental Science, Policy, and Management, University of California, Berkeley, California, 94720 USA
3 Laboratorio de Genética Evolutiva, Escuela de Ciencias Biológicas, Pontifícia Universidad Católica del Ecuador, Quito 17012184 Pichincha, Ecuador.
Short running head: South American origin for the Drosophila repleta lineage
Corresponding author email: [email protected]
CHAPTER 2
39
CHAPTER 2 CONTENTS
ABSTRACT .................................................................................................................... 40
INTRODUCTION .......................................................................................................... 41
MATERIAL AND METHODS ...................................................................................... 43
RESULTS AND DISCUSSION ..................................................................................... 47
CONCLUSION ............................................................................................................... 50
REFERENCES ............................................................................................................... 51
BIOSKETCH .................................................................................................................. 57
AUTHOR CONTRIBUTIONS ....................................................................................... 57
TABLES ......................................................................................................................... 58
Table 1. ........................................................................................................................... 58
FIGURE LEGENDS ....................................................................................................... 59
Figure 1. ...................................................................................................................... 60
Figure 2. ...................................................................................................................... 61
APPENDICES ................................................................................................................ 62
Appendix S1. Complete list of Drosophila species used in this study ....................... 62
Appendix S2. repleta group phylogeny: Phylogenetic trees showing topology
based on the concatenated dataset of 54 Drosophila species analyzed in this study. . 63
Appendix S3. Chronogram of the Drosophila species analyzed in this study............ 64

CHAPTER 2
40
ABSTRACT Aim
The Drosophila repleta lineage is one of the most widely used model systems
for studies of ecological adaptation and speciation. Five subgroups have been
traditionally recognized: fasciola, hydei, mercatorum, repleta and mulleri. A sixth
subgroup, inca, has recently been described. The inca species group includes three
species, Drosophila inca, Drosophila huancavilcae and Drosophila yangana, all of
them endemic to Ecuador and Peru. Previous molecular phylogenetic studies have
been inconclusive regarding the geographic location, time and mode of diversification
of lineages within the repleta group. We aim to: (1) determine the relationship of inca
to the other five species groups within repleta, (2) improve unresolved branching and
low support within the basal portion of the repleta phylogeny and (3) estimate the
geographic and temporal context of the early divergence within the repleta group.
Location
North, Central and South America.
Methods
We collected and identified five endemic species from South America and
conducted phylogenetic and biogeographical analyses of all six repleta species
subgroups based on two nuclear and three mitochondrial gene regions.
Results
Our results confirm the inca subgroup’s position as the most basal within the
repleta group and indicate that early diversification occurred within South
America.
Main conclusion
Based on the results of our analysis, we suggest that diversification of the
repleta lineage is associated with the uplift of the Central Andes.
Keywords: Andes, Drosophila inca species subgroup, Drosophila repleta species
group, Ecuador, Peru.

CHAPTER 2
41
INTRODUCTION
The repleta species group of the genus Drosophila Fallen 1823, has been used
as a model system for studies of ecological adaptation, evolution and speciation for
more than ninety years (Sturtevant, 1915; Wharton, 1942; Wasserman, 1982; Markow
& O' Grady, 2006). It includes ca.100 species, many of which are cactophilic and live
in the deserts and arid zones of North and South America. Six subgroups are
recognized within the repleta species group: fasciola, hydei, mercatorum, repleta,
mulleri, and the most recently defined, inca (Rafael & Arcos, 1989).
Recently, a revised phylogeny of the repleta group was proposed by Oliveira
et al., (2012). In this study they provided support for a monophyletic origin of the
repleta group and presented the first global dating of species divergence times,
estimating that the diversification of the crown group began ca. 16 Million years ago
(Mya). Historically, the Mexican Trans-Volcanic Region had been considered the
center of diversification for the repleta group (Patterson & Stone, 1952,
Throckmorton, 1975). Oliveira et al., (2012) suggested that the origin of the repleta
group is in South America and is associated with the radiation of its cactus hosts, but
could not provide statistical support for the hypothesis. A later study from Morales-
Hojas & Vieira, (2012) analyzing the patterns of diversification across the subgenus
Drosophila also supported the monophyly of the repleta lineage but also was not able
to resolve the ancestral distribution of the repleta species group. Despite the
significant contribution of these two recent studies, neither has been able to resolve
the origin of this group as being either North America or South America.
One major problem in understanding the origin of diversity in the repleta
group is that there is a significant bias in the geography of Drosophila collections. For
decades, sampling effort to collect Drosophila specimens has been directed within

CHAPTER 2
42
North and Central America with an emphasis on arid zones of Mexico (Sturtevant,
1921; Patterson & Mainland, 1944; Oliveira et al., 2005). In contrast, relatively little
collecting has occurred within South America (Oliveira et al., 2012). As a result, the
Drosophila fauna of North America is very well known while new species and new
records are still being described from South America (Acurio & Rafael 2009; Acurio
et al., 2013). Inclusion of new species from South America has the potential to change
the results of biogeographic analyses – particularly if the new species are from basal
lineages.
The relatively newly described inca species subgroup and several endemic
South American species have never previously been included in phylogenetic or
biogeographic analyses. Morphological and cytological evidence suggests that the
inca subgroup occupies a basal position within the repleta group (Rafael & Arcos,
1989; Mafla & Romero, 2009), and is comprised of three species known only from
northwestern South America. Drosophila huancavilcae Rafael & Arcos 1989 and
Drosophila yangana Rafael & Vela 2003 are endemic from isolated valleys from
Ecuadorian Andes. Drosophila inca Dobzhansky & Pavan 1943 has the least
restricted distribution of the three, being found in Inter-Andean desertic valleys from
Perú and Ecuador (Dobzhansky & Pavan 1943, Acurio & Rafael 2009a). Other
members of the repleta lineage also have endemic representatives within South
America, for example D. huaylasi Pla & Fontdevila 1990 from the mulleri subgroup,
endemic from Ecuador and Peru. Drosophila guayllabambae Rafael & Arcos 1988,
from hydei subgroup (Morán & Fontdevila 2005) and the newly discovered D.
machalilla Acurio 2013 from atalaia species group are also endemic only from

CHAPTER 2
43
Ecuador. We include all of these South American species for the first time in a
phylogenetic and biogeographic analysis of the repleta species subgroup.
In this study we present an analysis including divergence time estimates for 54
Drosophila species using two nuclear (sinA, marf) and three mitochondrial gene
regions (COI, COII, ND2). Maximum Likelihood, Maximum Parsimony and
Bayesian approaches all infer a well-supported inca clade. Furthermore, these
analyses show that the inca clade is sister to the remainder of the repleta group,
indicating that it is the earliest diverging lineage in this radiation. Based on the
evidence that we present here and the estimated divergence time from ours and
previous studies, we propose that the radiation of the repleta lineage is associated
with the formation of the Central Andes.
MATERIAL AND METHODS
Taxonomic sampling
We included representatives of all six subgroups within the repleta group
along with four outgroup taxa (D. virilis Sturtevant 1919 and three nannoptera group
species). Adult samples for five Drosophila species, D. inca, D. huancavilcae, D.
yangana, D. huaylasi and D. machalilla were collected from the dry habitats of
Northern, Central and Southern Ecuador. Within the cactophilic inca subgroup we
included all three known members. The collecting method described in Acurio et al.
(2010) was used, but rotting prickly pear (Opuntia ficus-indica) cladodes were
substituted for banana in the baits. Once specimens were identified, isofemale strains
were established adding a piece of fresh Opuntia cladode to the culture medium.

CHAPTER 2
44
Individuals from isofemale strains sacrificed and stored in ethanol -20ºC. For details
about taxa analyzed, refer Appendix S1.
DNA sequences and alignment
We studied three mitochondrial and two nuclear gene regions (Table 1). These
markers were selected because they provide a good phylogenetic signal at the deepest
taxonomic levels within the Drosophila (see references Table 1). Template DNA was
extracted from three flies per isofemale strain using a modified Cetyl trimethyl
Ammonium Bromide (CTAB) protocol (Wagner et al., 1987). Gene regions of
interest were amplified using standard PCR protocols, DNA Taq polymerase (Roche).
PCR products were purified using Nucleo Spin Extract II (Clontech Laboratories) and
sent to Macrogen Inc. (Seoul, Korea) for Sanger sequencing. Chromatograms were
compiled using Geneious version 5.0.4 (Biomatters). The sequences generated in this
study were deposited in GenBank under accession numbers KC011819-KC011843.
Identifiers for all sequences used in this study are given in Appendix S1.
To explore the variability within estimated alignments, we compared the
alignment quality scores obtained with the programs PRANK (Fletcher & Yang 2010),
MAFFT (Katoh et al. 2009) and CLUSTAL W (Larkin et al. 2007). The three
programs produced nearly the same high scores for four of the five genes analyzed.
To determine positional homology of introns or intergenic regions, we used the visual
interface implemented on Suite MSA (Anderson et al., 2011). Columns with low
quality scores were removed prior to phylogenetic analysis. The concatenated
alignment comprised 2,462 aligned sites, including 147 constant characters, 468
parsimony-uninformative characters, and 1847 parsimony informative (75%) sites.

CHAPTER 2
45
Phylogenetic analysis
Maximum Parsimony (MP) analysis was performed in MESQUITE 2.74
(Maddison & Maddison, 2010). A search of the most parsimonious tree was
conducted based on tree-length criterion, using SPR (Subtree Pruning and Regrafting).
A consensus tree was obtained from the trees using a Majority Rule Consensus,
considering tree weights with a frequency of clades of 0.5 in unrooted trees.
Maximum Likelihood (ML) analysis was performed on Saté software (Liu et
al., 2012), set as a multi-locus analysis. The model of nucleotide evolution chosen to
best fit our data set was General Time Reversible (GTR). The alignment and merger
steps were done separately for each locus and tree inference was made on a single tree
for all loci.
The Bayesian Inference (BS) analysis was performed in BEAST (Drummond
et al., 2012). We set locus specific substitution models and molecular clocks for a
nuclear and a mitochondrial partition, using the best-fit models calculated in
jModelTest 2.1.3. The nucleotide substitution model for the mitochondrial partition
(including ND2, COI, COII) was (GTR), with empirical base frequencies plus Gamma
model of site heterogeneity (four categories). The nuclear partition (SinA, Marf) had
the same settings but without codon partition. The same concatenated dataset was
used in all three (MP, ML, BS) analyses described here.
Divergence time and diversification analysis
There have been a variety of divergence time estimates proposed for the time
to the most recent common ancestor (TMRCA) of the virilis-repleta radiation in
previous work, which vary according the model used and number of points chosen to
calibrate the molecular clock. Obbard at al., (2012) estimated the ancestor of the
repleta group and related species groups split at approximately 12±3 Mya. However,

CHAPTER 2
46
most estimates are significantly older and are in general agreement: Oliveira et al.,
(2012) proposed a date of 26± 6 million years ago (Mya), Morales-Hojas & Vieira
(2012) provided two estimates based on different calibration strategies of 23±4 and
31±4 Mya, and Russo et al. (2013) estimated the split to be 27± 5 Mya.
To estimate the divergence time of the inca clade, calibration points were
chosen from Oliveira et al., 2012: the TMRCA of the split between D. mojavensis and
D. arizonae (1.83 Mya) and the TMRCA of the repleta group (16.3 Mya). Priors were
assumed to follow a normal distribution with the mean and a standard deviation
according to Oliveira et al. (2012). Due to differences in rate variation between
mitochondrial and nuclear genes (Moriyama & Powell, 1997), the analysis was run on
a concatenated data set with two partitions, nuclear and mitochondrial. Clock models
were linked, and a common strict clock rate was assumed for all partitions. A starting
tree was randomly generated under the Yule process. Four independent runs, using
Markov Chain Monte Carlo (MCMC) chains with 10 million generations were
performed and sampled every 1000 generations. The resulting output file was
processed by using Tree Annotator 1.5 with a burn-in parameter setting of 1000.
Effective sample sizes were reviewed with Tracer v. 1.4 to ensure that they were
greater than 500 for each parameter. Independent runs were compared to ensure they
converged on the same posterior distributions and reached stationarity.
Biogeography
The historical biogeographic ranges of the Drosophila repleta group were
reconstructed using BioGeoBEARS (Matzke, 2013) in R (R Core Team 2013). First, a
three-state presence-absence matrix was constructed that represented the known
distribution of each species in North, Central and/or South America. Then, the

CHAPTER 2
47
historical ranges were estimated under two different unconstrained models (1)
Dispersal-Extinction-Cladogenesis (DEC) (first implemented in Ree and Smith, 2008)
and (2) Dispersal-Extinction-Cladogenesis-Jump (DEC+j) (Matzke, 2013) using
maximum likelihood. Comparison of these two models allowed an assessment of the
relative roles of range expansion, range extinction and founder events (defined in this
model as the acquisition of a new range without the parent lineage having already
expanded into it) in the evolution of ranges in this group (Matzke, 2013). Model
performance was assessed using a likelihood ratio test. Reconstructions were
conditioned in absolute time with the chronogram from BEAST.
RESULTS AND DISCUSSION
Evolutionary relationships of the inca species subgroup
The topology of the phylogenetic trees generated using MP, ML and BS
analyses are quite similar. The inca subgroup is monophyletic and well-supported
(Appendix S2) in all of them, as suggested by previous morphological and cytological
analyses (Rafael & Arcos, 1989; Rafael & Vela, 2003; Mafla & Romero, 2009).
Within the inca species subgroup, Drosophila huancavilcae is a sister taxon of D.
inca and both species are closely related to D. yangana (Fig. 1).The inca clade is the
first diverging lineage inside the repleta species group. Other early-divergent clades
within the repleta radiation are eremophila, fasciola, and hydei, and all are well-
supported across analyses (Fig. 1, Appendix S2).
Drosophila machalilla from the atalaia species group is closely related to the
nannoptera species group. Lang et al., 2014 estimate that the nannoptera group
diverged from D. machalilla around 16.9 - 7.4 Mya. This time period corresponds to

CHAPTER 2
48
the closure of the Panama isthmus (Montes et al., 2012) which suggests that the
ancestor of the nannoptera species group may have migrated over the isthmus from
South America (Lang et al., 2014).
Biogeography of the repleta lineage
Overall likelihood scores, d, e and j parameters for the two biogeographic
models were as follows: (1) DEC= LnL=-87.8, d=0.02, e=0, j=0 and (2)
DEC+j=LnL=-81, d=0.014, e=0, j=0.076. The DEC+j model performed significantly
better than the DEC (LRT pval=0.0002). The difference between the two
biogeographic models tested is that in addition to allowing range expansions and
range extinctions (d & e), the DEC+j model also allows for founding events (j). Both
models support zero role for range extinction, but the addition of the j parameter in
the DEC+j model appears to create a better fit to these data.
Our analyses indicate that the repleta group formed 17 (95% HPD 16.35-
17.85) million years ago in South America (prob=0.66; Fig. 2, Appendix S3). There is
relatively only a very small amount of support for the origin of the group in North
America (prob=0.17) or both North and South America (prob =0.17; Fig. 2). We place
the divergence of the inca species subgroup at 13.11 (95% HPD 11.53-14.63) Mya,
also in South America (prob=1.0; Fig. 2, Appendix S3). Oliveira et al., (2012) earlier
hypothesized that switches among major cactus host lineages promoted the radiation
of the repleta species group. Host plant switches likely did play a role in the
diversification of this group, but based on our timing, biogeographic reconstructions
and distribution data, we suggest that the larger context for diversification of the basal
lineages was the uplift of the Andes.

CHAPTER 2
49
Geological changes can result in barriers and filters affecting biotic migration.
Andean uplift dated in the mid-Miocene (Gregory-Wodzicki, 2000; Capitanio et al.,
2011) has been proposed to play a major role in species distributions of a variety of
animal species groups, for example: rodents (Reig, 1986), butterflies (Descimon,
1986), and amphibians (Duellman & Wild, 1993). The distribution of the inca clade,
as well on the repleta lineage (Fig. 2) is restricted to isolated desertic Inter-Andean
Valleys of Northwestern South America. The range distribution of D. inca and D.
yangana is the Huancabamba region, which has been identified as an Andean center
of endemism and species richness (Young & Reynel, 1997). In studies of birds and
amphibians, Vuilleumier (1969) and Duellman & Wild (1993), respectively, proposed
that the high level of endemism and species richness observed corresponded to the
dynamic and changing environment presented by the growing Andes as they rose to
their current elevation.
The orogenic sequence of the Andes proceeded in a south-to-north fashion
(Gregory-Wodzicki, 2000) allowing dispersion of southern species to the north
through Central America. Patterns in the endemic bird species to the trans-Andean
region (Weir & Momoko 2011) suggest that Andean uplift promoted the build-up of
biodiversity in lowland Neotropical faunas both through vicariance-based speciation
during uplift and through dispersal-based speciation following uplift. This pattern
may hold for the Drosophila repleta group as well, as there are several species within
this group endemic to the lowland tropics east of the Andes (for example, Drosophila
vicentinae, Drosophila peninsularis and members in the fasciola species subgroup).
More collecting within South America is necessary to address questions about how
the colonization of the trans-Andean region occurred and the impact of the Andean
uplift on speciation and diversification of the repleta species group.

CHAPTER 2
50
Our findings are consistent with the pattern of diversification of drosophilids
proposed by Russo et al., (2013). According to the authors, the radiation of the family
Drosophilidae began during the Palaeogene, peaked during the Miocene and was
fuelled by the flies’ exploitation of the newly diversified fleshy fruits of Angiosperms.
Members of the repleta group are known to occupy a great diversity of habitats
ranging from wet, tropical forests to temperate environments (Vilela, 1983, Acurio &
Rafael, 2009b), but the majority of the species are specialized on cacti. The
biogeography of cacti also appears to have been influenced by Andean uplift.
According to Arakaki et al., (2011), most of the extant diversity in cacti was
generated throughout the mid to late Miocene and into Pliocene, resulting in three
main centers of cactus diversity and endemism: Mexico, the central Andes, and Brazil.
The temporal concordance between major diversification events within cacti and the
crown diversification of the repleta lineage are dated to the same period as Andean
uplift in the middle Miocene (Oliveira et al., 2012; Morales-Hojas & Vieira, 2012,
and results from this study).
CONCLUSION
For the first time we included several endemic South American species,
including the inca species subgroup, in a phylogenetic analysis of the Drosophila
repleta group. Our results support the hypothesis that inca is the most basal lineage
within the repleta group. Our phylogenetic analyses, combined with divergence time
estimates and biogeographic analysis indicate that the oldest diversification events in
the Drosophila repleta lineage occurred in the mid-late Miocene in South America.
ACKNOWLEDGMENTS

CHAPTER 2
51
Our thanks to Vila, R.; Lang, M. and O`Grady, P., that greatly helped to
improve an earlier version of this manuscript. The authors declare no conflicts of
interest. This work was supported by a grant (BFU2011-30476) to AR, and both, the
SENESCYT fellowship from Ecuador and FI-DGR doctoral fellowship (2012 FI-
B100197) from Spain to AA. The collections were made with the Scientific Research
Permission 0016-07IC-FAU-DNBAPVS/MA facilitated for the Ministerio de Medio
Ambiente del Ecuador.
REFERENCES
Acurio, A. & Rafael, V. (2009a) Diversity and geographical distribution of
Drosophila (Diptera, Drosophilidae) in Ecuador. Drosophila Information Service,
92, 20–25.
Acurio, A. & Rafael, V. (2009b) Inventario taxonómico de drosophilidae (Diptera) en
el Parque Nacional Yasuni, Amazonia Ecuatoriana. Acta Amazonica, 39, 13–718.
Acurio, A., Rafael, V. & Dangles, O. (2010) Biological Invasions in the Amazonian
Tropical Rain Forest: The Case of Drosophilidae (Insecta, Diptera) in Ecuador,
South America. Biotropica, 42, 717–723.
Acurio, A., Rafael, V., Céspedes, D & Ruiz, A. (2013) Description of a new spotted-
thorax Drosophila (Diptera, Drosophilidae) species and its evolutionary
relationships inferred by a cladistic analysis of morphological traits. Annals of
Entomological Society of America, 106(6), 695–705.
Anderson, C.L., Strope, C.L. & Moriyama, E.N. (2011) SuiteMSA: visual tools for
multiple sequence alignment comparison and molecular sequence
simulation. BMC Bioinformatics,12 (1),184.

CHAPTER 2
52
Arakaki, M., Christin, P.A., Nyffeler, R., Lendel, A., Eggli, U., Ogburn, R. M., ... &
Edwards, E. J. (2011). Proceedings of the National Academy of Sciences, 108
(20), 8379–8384.
Beckenbach, A.T., Wei, Y.W. & Liu, H. (1993) Relationships in the Drosophila
obscura species group, inferred from mitochondrial cytochrome oxidase II
sequences. Molecular Biology and Evolution, 10 (3),619–34.
Bonacum, J., De Salle, R., O’Grady, P., Oliveira, D., Wintermute, J., & Zilversmit, M.
(2001) New nuclear and mitochondrial primers for systematics and comparative
genomics in Drosophilidae. Drosophila Information Service, 84, 201–204.
Capitanio, F. A., Faccenna, C., Zlotnik, S. & Stegman, D.R. (2011) Subduction
dynamics and the origin of Andean orogeny and the Bolivian orocline. Nature,
480, 83–86.
Descimon, H. (1986) Origins of lepidopteran faunas in the high tropical Andes, pp.
500-532. In F. Vuilleumier and M. Monasterio (eds.), High altitude tropical
biogeography. Oxford University Press, New York.
Dobzhansky, T.& Pavan, C. (1943) Studies on Brazilian species of Drosophila.
Faculdade de Filosofia Ciencias e Letras da Universidades de São Paulo, 36(4),
7–72.
Drummond, A. J., Suchard, M. A., Xie, D. & Rambaut, A. (2012) Bayesian
Phylogenetics with BEAUti and the BEAST 1.7. Molecular Biology and
Evolution, 29(8), 1969–1973.
Duellman, W. E. & Wild, E.R. (1993) Anuran amphibians from the Cordillera de
Huancabamba, northern Peru: systematics, ecology, and biogeography.
Occasional Papers of the Museum of Natural History University of Kansas,
157,1–53.

CHAPTER 2
53
Gregory-Wodzicki, K.M. (2000).Uplift history of the central and northern Andes: A
review. Geological Society of America Bulletin, 112,1091–1105.
Lang M., Polihronakis M., Acurio, A., Markow, T. & Orgogozo, V. (2014). Radiation
of the Drosophila nannoptera species group in Mexico. Journal of Evolutionary
Biology. In press.
Liu, K., Warnow, J.T., Holder, M.T., Nelesen, S.M., Yu, J., Stamatakis, A.P. &Linder,
R. (2012) SATé-II: Very Fast and Accurate Simultaneous Estimation of Multiple
Sequence Alignments and Phylogenetic Trees. Systematic Biology, 61, 90–106.
Maddison, W. P. & Maddison, D.R. (2011) Mesquite: a modular system for
evolutionary analysis. Version 2.75 http://mesquiteproject.org.
Mafla, A. B. & Romero, G. (2009) The heterocromatin of Drosophila inca,
Drosophila yangana and Drosophila huancavilcae of the inca subgroup, repleta
group. Drosophila Information Service, 92,10-15.
Markow, T. & O’Grady, P. (2006) Drosophila, A guide to species identification and
use. Academic Press, Elsevier. Amsterdam.
Matzke, N.J. (2013) Probabilistic Historical Biogeography: New Models for Founder-
Event Speciation, Imperfect Detection, and Fossils Allow Improved Accuracy
and Model-Testing. Department Integrative Biology and Designated Emphasis in
Computational and Genomic Biology, University of California, Berkeley.
University of California at Berkeley, Berkeley, CA, pp. 240. Available at:
http://phylo.wikidot.com/localfiles/biogeobears/Matzke_PhD_FINAL_v245_w_r
efs.pdf.
Montes, C., Cardona, A., McFadden, R., Morón, S.E., Silva, C.A., Restrepo-Moreno,
S. Ramírez, D.A., Hoyos, N., Wilson, J., Farris, D….& Flores, J.A. (2012)
Evidence for middle Eocene and younger land emergence in central Panama:

CHAPTER 2
54
Implications for Isthmus closure. Geological Society of America Bulletin,
124, 780–799.
Morales-Hojas, R. & Vieira, J., 2012. Phylogenetic patterns of geographical and
ecological diversification in the subgenus Drosophila. PLoS One 7: e49552.
Morán, T. & Fontdevila, A., 2005. Phylogeny and molecular evolution of the
Drosophila hydei subgroup, Drosophila repleta group) inferred from the
Xanthine dehydrogenase gene. Molecular phylogenetics and evolution, 36 (3),
pp.695–705.
Moriyama E.N., Powell J.R., 1997.Synonymous substitution rates in Drosophila:
mitochondrial versus nuclear genes. Journal of Molecular Evolution, 45(4),378–
91.
Obbard, D. J., J. Maclennan, K., Kim K-W., Rambaut, O’ Grady, P.M. & Jiggins M.
(2012) Estimating Divergence Dates and Substitution Rates in the Drosophila
Phylogeny. Molecular Biology and Evolution, 29(11), 3459–73.
Oliveira, D. C. S. G., Almeida, F. C., O’ Grady, P.M., Armella, M.A., De Salle, R.,
Etges, W.J. (2012) Monophyly, divergence times, and evolution of host plant use
inferred from a revised phylogeny of the Drosophila repleta species group.
Molecular Phylogenetics and Evolution. 64,533–544.
Oliveira, D. C. S. G., O’Grady P. M. Etges, W., Heed, W.B., & DeSalle, R. (2005)
Molecular systematics and geographical distribution of the Drosophila
longicornis species complex (Diptera: Drosophilidae). Zootaxa 1069,1–32.
Patterson, J.T. & Mainland, C.B. (1944) The Drosophilidae of Mexico. University of
Texas Publications, 4445,9–101.

CHAPTER 2
55
Patterson, J.T & Stone, W.S. (1952) Evolution in the genus Drosophila. Macmillan,
New York.
R Core Team, 2013. R: A language and environment for statistical computing. R
Foundation for Statistical Computing. ISBN 3-9000-51-07-0, URL
http://www.R-project.org, Accessed October 2013, Vienna, Austria.
Rafael, V., & Vela, D. (2003) Drosophila yangana sp.nov un nuevo miembro del
grupo repleta, subgrupo inca (Diptera:Drosophilidae). Revista de la Pontificia
Universidad Catolica del Ecuador, 71,129–139.
Rafael, V. & Arcos, G. (1989) Subgrupo inca, un nuevo subgrupo del grupo repleta,
con desacripción de Drosophila huancavilcae n. sp (Diptera, Drosophilidae).
Evolucion Biologica, 3,233-243.
Rambaut, A. & Drummond, A. (2009) Tracer v1.5.
http://tree.bio.ed.ac.uk/software/tracer/.
Ree, R.H. & Smith, S.A. (2008) Maximum likelihood inference of geographic range
evolution by dispersal, local extinction, and cladogenesis. Systematic Biology, 57,
4-14.
Reig, O. A. (1986) Diversity patterns and differentiation of high Andean rodents, pp.
404-439. In F. Vuilleumier and M. Monasterio (eds.), High altitude tropical
biogeography. Oxford University Press, New York.
Russo, C., Mello, B., Frazão, A. & Voloch, C. M. (2013) Phylogenetic analysis and a
time tree for a large drosophilid data set (Diptera: Drosophilidae). Zoological
Journal of the Linnean Society, 169, 4:765-775.
Sturtevant, A. H. (1915) A Sex-Linked Character in Drosophila repleta. The
American Naturalist, 49 (579), 189-192.

CHAPTER 2
56
Sturtevant, A. H. (1921) The North American species of Drosophila. The Carnegie
institution of Washington, 301:1-150.
Throckmorton, L. H. (1975) The Phylogeny, Ecology and Geography of Drosophila,
pp. 421-469. In R. C. King (ed.), Handbook of Genetics, Plenum, New York, NY.
Vilela, C. R. (1983) A revision of the Drosophila repleta species group (Diptera,
Drosophilidae). Revista Brasileira de Entomologia, 27:1-114.
Vuilleumier, F. (1969) Pleistocene Speciation in Birds living in the High Andes.
Nature 223:1179-1180.
Wasserman, M., (1982) Evolution of the repleta group, pp.62-139. In.The genetics
and Biology of Drosophila, M. Ashburner, HL. Carson and J.N. Thompson Jr.
(Eds) Vol.3b Academic Press, New York.
Weir, J.T. & Momoko, P. (2011) Andean uplift promotes lowland speciation through
vicariance and dispersal in Dendrocincla woodcreepers. Molecular Ecology, 20,
4550-4563.
Wharton, L. T. (1942) Analysis of the repleta group of Drosophila. University of
Texas Publications, 4228, 25-52.
Young, K. R. & Reynel, C. (1997) Huancabamba Region, Peru and Ecuador, pp. 465-
469. In S. D. Davis, V. H. Heywood, O. Herrera-MacBryde, J. Villa-Lobos and A.
C. Hamilton (eds.), Centres of plant diversity: A guide and strategy for their
conservation, 3: North America, Middle America, South America, Caribbean
Islands. IUCN, Gland.

CHAPTER 2
57
BIOSKETCH
Andrea Acurio is an evolutionary biologist who has a long-term interest in
understanding the underlying mechanisms that promote biodiversity in nature. Her
research interest includes alpha-taxonomy, systematics, ecology and biogeography
using Drosophila as a model organism. The interdisciplinary research group involved
in this study has different fields of expertise ranging from systematics, comparative
genomics and phylogeography of Drosophila, a premier model system.
AUTHOR CONTRIBUTIONS
A.A. performed the specimens collections and molecular analysis; A.A. and V.R.,
identified the specimens; A.A. and D.C.S.G.O., performed the phylogenetic analysis;
A.A and K.G., performed the biogeographical analysis; A.A., K.G. and A.R. wrote
the manuscript and conceived the ideas.

CHAPTER 2
58
TABLES Table 1. Summary of the different gene regions used in this study and reference of
each primer.
Abbreviation Length Primer design reference
Mitochondrial genes Cytochrome C oxidase subunit I COI 367 (Oliveira et al. 2005) Cytochrome C oxdase subunit II COII 706 (Beckenbach et al. 1992 ) Mitochondrial-ubiquinone oxidoreductase chain
NADH 782 (Oliveira et al. 2005)
Nuclear genes Mitochondrial assembly regulatory factor
Marf 552 (Bonacum et al. 2001)
Seven in Absentia SinA 397 (Bonacum et al. 2001) Table 2 . Estimates (with 95% Credibility Interval, CI) of divergence times (MY) for
the main nodes recovered in our phylogenetic analysis of the repleta lineage on
BEAST.
Clade Mean node age (My)
+95%CI inca crown 13.11(11.53-14.63) fasciola crown 10.73 (9.28-12.29) eremophila crown 7.8 (6.87-8.99) hydei crown 10.61(9.32-11.93) anceps crown 12.82(11.7-13.95) repleta crown 12.12(11.07-10.10) mulleri crown 11.38(12.32-14.08) repleta group radiation crown 17.00(16.35-17.85)

CHAPTER 2
59
FIGURE LEGENDS
Figure 1. repleta group phylogeny: Chronogram showing divergence dates for 54
Drosophila species analyzed in this study, in red the inca species subgroup. The
relationships depicted among taxa, and the divergence dates on the chronogram were
estimated using BEAST by analysis of 5 loci.
Figure 2. Divergence time estimation and historical range reconstructions for the
Drosophila repleta subgroup. Reconstructions were performed using the DEC+j
model in BioGeoBears (Matzke in revision), conditioned on a cladogram generated in
BEAST (Drummond et al. 2012). N=North America, C=Central America, S=South
America. “*” indicates the species is endemic to Northwestern South America.


Chapter 2
62
APPENDICES Appendix S1. Complete list of Drosophila species used in this study and corresponding GenBank entries. Accession numbers for newly generated sequencing data are highlighted in boldface type.
Drosophila species ND2 COII COI Marf SinA acanthoptera DQ202090 DQ202010 DQ202050 EU3416293 EU341611 anceps JF736133 JF736093 JF736059 JF736208 JF736324 arizonae EU341707 JF736122 EU341676 EU341636 EU341620 bifurca JF736166 JF736130 JF736090 JF736256 JF736378 borborema JF736157 JF736121 JF736081 JF736241 JF736362 buzzatii DQ202091 DQ202011 DQ202051 EU341631 EU341621 canapalpa JF736162 JF736126 JF736086 JF736248 JF736369 ellisoni DQ202092 DQ202012 DQ202052 JF736235 JF736356 eohydei JF736159 JF736124 JF736083 JF736245 JF736366 eremophila DQ202093 DQ202013 DQ202053 JF736249 JF736370 fulvimacula JF736156 JF736120 JF736080 JF736240 JF736361 fulvimaculoides JF736134 JF736094 JF736060 JF736209 JF736325 guayllabambae JF736167 JF736131 JF736091 JF736258 JF736380 huancavilcae KC011834 KC011824 KC011819 KC011829 KC011839 huaylasi KC011835 KC011825 KC011820 KC011830 KC011840 huichole DQ202098 DQ202018 DQ202058 JF736257 JF736379 hydei DQ202100 DQ202020 DQ202060 JF736212 JF736328 inca KC011836 KC011826 KC011821 KC011831 KC011841 leonis JF736136 JF736096 JF736062 JF736214 JF736330 longicornis DQ202101 DQ202021 DQ202061 JF736232 JF736353 machalilla KC011837 KC011827 KC011822 KC011832 KC011842 martensis JF736160 JF736125 JF736084 JF736247 JF736368 mayaguana DQ202107 DQ202027 DQ202067 EU341634 EU341623 mercatorum JF736155 EU493737 EU493607 JF736239 JF736360 meridiana JF736153 JF736118 JF736078 JF736236 JF736357 meridionalis DQ202110 DQ202030 DQ202070 JF736250 JF736372 mettleri JF736137 JF736097 JF736063 JF736215 JF736331 micromettleri JF736138 JF736098 JF736064 JF736216 JF736332 nannoptera JF736140 JF736100 JF736066 JF736218 JF736334 navojoa EU341709 EU493739 EU341678 EU341635 EU341626 neorepleta DQ202113 DQ202033 DQ202073 JF736219 JF736335 nigricruria JF736141 JF736101 JF736067 JF736220 JF736336 nigrodumosa EU341710 JF736102 EU341679 EU341633 EU341627 nigrospiracula DQ202114 DQ202034 DQ202074 JF736221 JF736337 pachuca DQ202118 DQ202038 DQ202078 JF736251 JF736373 paranaensis JF736164 JF736128 JF736088 JF736252 JF736374 parisiena JF736142 JF736103 JF736068 JF736222 JF736338 pavani EU493474 JF736115 EU4935832 JF736231 JF736350 repleta EU341711 JF736105 EU341680 EU341630 EU341628 richardsoni JF736144 JF736106 JF736070 JF736224 JF736340 ritae DQ202122 DQ202042 DQ202082 JF736233 JF736354 serido JF736165 JF736129 JF736089 JF736254 JF736376 sonorae DQ202124 DQ202044 DQ202084 JF736225 JF736341 spenceri DQ202127 DQ202047 DQ202087 JF736255 JF736377 stalkeri DQ202128 DQ202048 DQ202088 JF736226 JF736342 starmeri JF736145 JF736107 JF736071 JF736227 JF736343 straubae JF736146 JF736108 JF736072 JF736228 JF736344 venezolana DQ202129 DQ202049 DQ202089 JF736243 JF736364 virilis EU493510 EU493751 EU493622 JF736234 JF736355 wassermani JF736147 JF736109 JF736073 JF736229 JF736345 wheeleri EU341705 JF736110 EU341685 EU341656 EU341616 yangana KC011838 KC011828 KC011823 KC011833 KC011843

Chapter 2
63
Appendix S2. repleta group phylogeny: Phylogenetic trees showing topology based on the concatenated dataset of 54 Drosophila species analyzed in this study. (A) MP analysis performed on MESQUITE; (B) ML analysis performed on SATé; (C) BS analysis performed on BEAST. Colors denote nodes with: Bootstrap values ˃0.75 on ML, Shimodaira-Hasegawa values ˃0.90 on MP and Posterior Probabilities = 1 on BS.

Chapter 2
64
Appendix S3. Chronogram of the Drosophila species analyzed in this study, bars denote 95% HPD bars for divergence times. Square in the inferior left corner shows the results of BEAST analysis summarized on TRACER.

Chapter 2
65

66
Chapter 3.-Long-term evolutionary dynamic of a DNA transposon, the case of Galileo in Drosophilidae
Acurio A1, O’ Grady P2, Oliveira CSG1, Etges WJ3, Cariou ML4, Rafael V5, ValenteVLS6 & Ruiz A1
1Departament de Genètica i Microbiologia, Universitat Autònoma de Barcelona, 08193
Bellaterra, Barcelona, Spain.
2University of California, Department of Environmental Science, Policy and Management, 137 Mulford Hall, Berkeley, CA 94720, United States.
3Program in Ecology and Evolutionary Biology, Department of Biological Sciences, University of Arkansas, Fayetteville, Arkansas 72701. United States.
4 Laboratoire Evolution, Génomes et Spéciation, UPR 9034 CNRS, Gif sur Yvette, France, Université Paris-Sud, Orsay, France.
5Laboratorio de Genética Evolutiva, Escuela de Ciencias Biológicas, Pontifícia Universidad Católica del Ecuador, Quito 17012184 Pichincha, Ecuador.
6Laboratório de Drosophila, Departamento de Genética, Instituto de Biociências, Universidade Federal do Rio Grande do Sul (UFRGS), Porto Alegre, RS, Brazil.

CHAPTER 3
68
CHAPTER 3 CONTENTS
ABSTRACT .................................................................................................................... 70
RESUMEN ..................................................................................................................... 71
INTRODUCTION .......................................................................................................... 72
MATERIAL AND METHODS ...................................................................................... 74
Drosophilidae phylogeny
Taxon sampling ......................................................................................... 74
Phylogenetic inference .............................................................................. 74
Galileo phylogeny
Taxon sampling ......................................................................................... 75
DNA extraction ......................................................................................... 75
Detection and amplification ...................................................................... 75
Galileo cloning .......................................................................................... 80
Galileo in silico searches .......................................................................... 81
Multi-sequence analysis ............................................................................ 81
Phylogenetic inference .............................................................................. 83
Ancestral reconstructions of Galileo in the Drosophilidae ................................. 84
Cophylogenetic analysis of Galileo in its host Drosophila species. ................... 84
Horizontal Transfer Test ..................................................................................... 85
RESULTS
Drosophilidae phylogeny .......................................................................... 86
Galileo transposon .................................................................................... 91
Detection ................................................................................................. 91
Galileo phylogeny ................................................................................... 94
Galileo Ancestral Range Reconstruction ............................................. ...99
Galileo in Drosophilidae ................................................................................ ...101
Cophylogenetic analysis.................................................................................... 105
DISCUSSION
Drosophilidae phylogeny ........................................................................ 111
Pattern of distribution of Galileo in Drosophilidae................................. 112
Galileo subfamilies ................................................................................. 116
Base composition of nuclear, mitochondrial and TPase genes ............... 119
Ancient cospeciation of Galileo and Drosophila species ........................ 120
CHAPTER 3
69
Horizontal transfer in the evolutionary dynamics of Galileo.................. 121
CONCLUSION ............................................................................................................. 124
REFERENCES ............................................................................................................. 126
SUPPLEMENTARY MATERIAL ............................................................................... 137
Table S1. Source and GenBank accession numbers for COI, COII, ND2 and SinA sequences of 174 taxa analyzed in this study. ...................................... ...137
Table S2. Source of 234 samples used in the search of Galileo. Numbers on brackets denote stocks from Drosophila Stock Center. .................................... 144
Table S3. Results obtained in the search of Galileo TE in 234 samples from 110 drosophilid species. ................................................................................. ..152
Table S4. Significant hits retrieved from the in silico search of Galileo in the newly released Drosophila genomes. ............................................................... 160
Table S5. Estimates of dS values for Galileo and 1360 element data set.. ..... ..161
Table S6. Estimates of dS values for COI data set. ....................................... 162
Table S7. Estimates of dS values for COII data set. ..................................... ..163
Table S8. Estimates of ds values for ND2 data set. . .................................... ..164
Table S9. Estimates of ds values for SinA data set. ......................................... 165
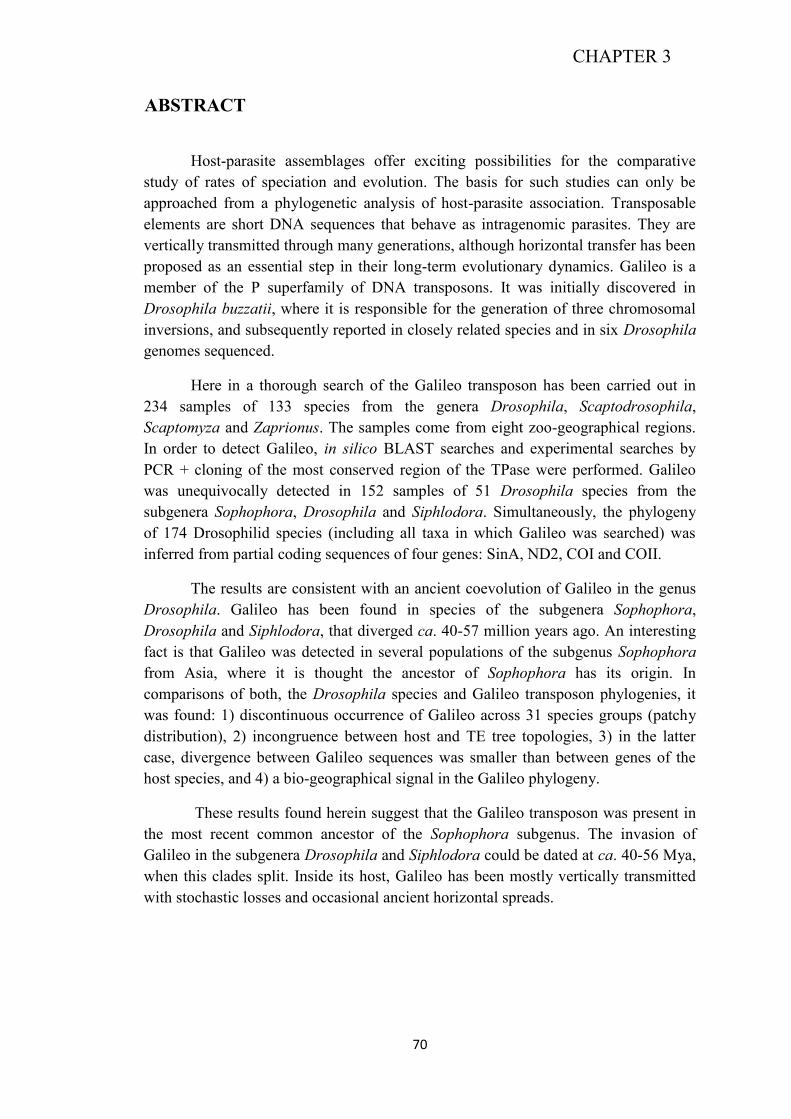
CHAPTER 3
70
ABSTRACT
Host-parasite assemblages offer exciting possibilities for the comparative study of rates of speciation and evolution. The basis for such studies can only be approached from a phylogenetic analysis of host-parasite association. Transposable elements are short DNA sequences that behave as intragenomic parasites. They are vertically transmitted through many generations, although horizontal transfer has been proposed as an essential step in their long-term evolutionary dynamics. Galileo is a member of the P superfamily of DNA transposons. It was initially discovered in Drosophila buzzatii, where it is responsible for the generation of three chromosomal inversions, and subsequently reported in closely related species and in six Drosophila genomes sequenced.
Here in a thorough search of the Galileo transposon has been carried out in 234 samples of 133 species from the genera Drosophila, Scaptodrosophila, Scaptomyza and Zaprionus. The samples come from eight zoo-geographical regions. In order to detect Galileo, in silico BLAST searches and experimental searches by PCR + cloning of the most conserved region of the TPase were performed. Galileo was unequivocally detected in 152 samples of 51 Drosophila species from the subgenera Sophophora, Drosophila and Siphlodora. Simultaneously, the phylogeny of 174 Drosophilid species (including all taxa in which Galileo was searched) was inferred from partial coding sequences of four genes: SinA, ND2, COI and COII.
The results are consistent with an ancient coevolution of Galileo in the genus Drosophila. Galileo has been found in species of the subgenera Sophophora, Drosophila and Siphlodora, that diverged ca. 40-57 million years ago. An interesting fact is that Galileo was detected in several populations of the subgenus Sophophora from Asia, where it is thought the ancestor of Sophophora has its origin. In comparisons of both, the Drosophila species and Galileo transposon phylogenies, it was found: 1) discontinuous occurrence of Galileo across 31 species groups (patchy distribution), 2) incongruence between host and TE tree topologies, 3) in the latter case, divergence between Galileo sequences was smaller than between genes of the host species, and 4) a bio-geographical signal in the Galileo phylogeny.
These results found herein suggest that the Galileo transposon was present in the most recent common ancestor of the Sophophora subgenus. The invasion of Galileo in the subgenera Drosophila and Siphlodora could be dated at ca. 40-56 Mya, when this clades split. Inside its host, Galileo has been mostly vertically transmitted with stochastic losses and occasional ancient horizontal spreads.

CHAPTER 3
71
RESUMEN
La asociación entre un parásito y un hospedador ofrece una excelente oportunidad para el estudio de tazas de especiación y evolución. La base para dichos estudios sólo puede ser enfocada mediante el análisis de filogenético de la asociación parásito-hospedador. Los elementos transponibles son secuencias cortas de ADN que se comportan como parásitos intragenómicos. Ellos son transmitidos verticalmente a través de las generaciones, aunque la transferencia horizontal ha sido propuesta como un paso esencial en su dinámica evolutiva a largo plazo. Galileo es un miembro de la Superfamilia P de transposones de ADN. Galileo fue inicialmente descubierto en Drosophila buzzatii, en donde es responsable de la generación de tres inversiones cromosómicas y subsecuentemente reportado en especies cercanas y en seis genomas secuenciados de Drosophila.
En este estudio se ha ejecutado una búsqueda exhaustiva del transposon Galileo en 234 muestras de 133 especies de los géneros Drosophila, Scaptodrosophila, Scaptomyza and Zaprionus con muestras provenientes de ocho regiones zoo-geográficas. Para detectar Galileo se realizaron búsquedas bioinformáticas y experimentales mediante PCR + clonación de la región más conservada de la transposasa. Galileo fue detectado en 152 muestras de 51 especies de Drosophila de los subgéneros Sophophora, Drosophila y Siphlodora. Simultáneamente, la filogenia de 174 especies de Drosophilidae (que incluye todas las especies en las que se realizó la búsqueda de Galileo) se construyó con secuencias parciales de cuatro genes: SinA, ND2, COI y COII.
Los resultados son consistentes con una antigua coevolución de Galileo en el género Drosophila. Galileo ha sido encontrado en especies de los subgéneros Sophophora, Drosophila and Siphlodora, que divergieron hace ca. 40-57 millones de años. Un hecho interesante es que Galileo fue detectado en varias poblaciones del subgénero Sophophora de Asia, en donde se piensa ha tenido su origen el ancestro de dicho subgénero. En comparaciones de ambas filogenias, de las especies y Galileo se han encontrado: 1) ocurrencia discontinua (distribución parcheada) entre 31 grupos de especies, 2) incongruencias entre las topologías de los árboles filogenéticos de las especies hospedadoras y Galileo, 3) en el último caso, la divergencia las secuencias de Galileo fue más pequeña entre los genes de las especies hospedadoras, y 4) una señal biogeográfica en la filogenia de Galileo.
Los resultados encontrados en este estudio sugieren que el transposon Galileo estuvo presente en el ancestro común más reciente del subgénero Sophophora. La invasión de Galileo en el subgénero Drosophila y Siphlodora puede ser datada en ca. 40-56 Ma, cuando estos clados se separaron. Dentro de su hospedador, Galileo ha sido mayoritariamente transmitido verticalmente con pérdidas estocásticas y propagaciones horizontales antiguas.
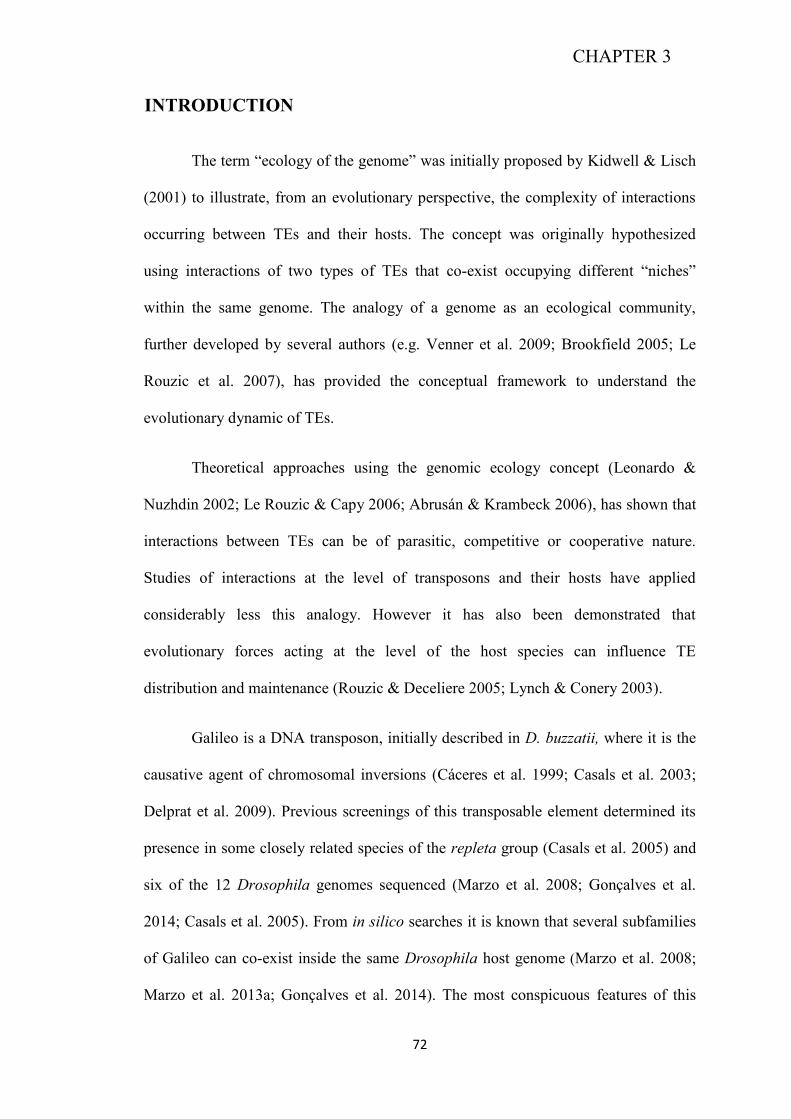
CHAPTER 3
72
INTRODUCTION
The term “ecology of the genome” was initially proposed by Kidwell & Lisch
(2001) to illustrate, from an evolutionary perspective, the complexity of interactions
occurring between TEs and their hosts. The concept was originally hypothesized
using interactions of two types of TEs that co-exist occupying different “niches”
within the same genome. The analogy of a genome as an ecological community,
further developed by several authors (e.g. Venner et al. 2009; Brookfield 2005; Le
Rouzic et al. 2007), has provided the conceptual framework to understand the
evolutionary dynamic of TEs.
Theoretical approaches using the genomic ecology concept (Leonardo &
Nuzhdin 2002; Le Rouzic & Capy 2006; Abrusán & Krambeck 2006), has shown that
interactions between TEs can be of parasitic, competitive or cooperative nature.
Studies of interactions at the level of transposons and their hosts have applied
considerably less this analogy. However it has also been demonstrated that
evolutionary forces acting at the level of the host species can influence TE
distribution and maintenance (Rouzic & Deceliere 2005; Lynch & Conery 2003).
Galileo is a DNA transposon, initially described in D. buzzatii, where it is the
causative agent of chromosomal inversions (Cáceres et al. 1999; Casals et al. 2003;
Delprat et al. 2009). Previous screenings of this transposable element determined its
presence in some closely related species of the repleta group (Casals et al. 2005) and
six of the 12 Drosophila genomes sequenced (Marzo et al. 2008; Gonçalves et al.
2014; Casals et al. 2005). From in silico searches it is known that several subfamilies
of Galileo can co-exist inside the same Drosophila host genome (Marzo et al. 2008;
Marzo et al. 2013a; Gonçalves et al. 2014). The most conspicuous features of this

CHAPTER 3
73
element are its TIRs that have variable length/structure and its transposase (TPase)
that is similar to those of P and 1360 elements (Marzo et al. 2008). All Galileo copies
described so far carry premature codon stops or/or frameshift mutations and thus do
not encode a full length TPase.
In this study a thorough screening of the DNA transposon Galileo has been
performed in 234 samples from 133 species of Drosophilidae, using the most
conserved region of Galileo TPase. A phylogeny of the element was built with the
Galileo sequences generated. Simultaneously, the evolutionary relationships of 174
species of Drosophilidae were inferred using four molecular markers (COI, COII,
ND2, SinA). Both phylogenies have been compared. The results of this study give
insights about the long-term evolutionary dynamics of a DNA transposon.

CHAPTER 3
74
MATERIAL AND METHODS
Drosophilidae phylogeny
Taxon sampling
In order to build the species phylogeny, taxa were selected based on two main
criteria, species where Galileo was screened (133 species) and sister taxa for those
species (41 species). In total 174 taxa from Drosophila, Scaptodrosophila, Zaprionus
and Hawaiian Drosophila were analyzed.
Sequence data from partial genomic regions of the mitochondrial cytochrome
oxidase subunit I (COI), cytochrome oxidase subunit II (COII), NADH ubiquinone
oxidoreductase chan 2 (ND2) and the nuclear seven in absentia (SinA) genes were
retrieved from the sources detailed on Table S1 (Supplementary Material). The
generated data set contained the homologous genomic regions in 174 species. Multi-
sequence alignment was performed using MAFFT software (Katoh et al. 2009).
Phylogenetic inference
Two methods of phylogenetic inference were employed to retrieve
phylogenetic trees: Neighbor-Joining (NJ) and Bayesian Inference (BI).
NJ phylogenetic tree was inferred using CIPRES (Miller et al. 2010). The best
fit model of nucleotide substitution was selected according to the Akaike information
criterion (AIC). Statistical support for the tree inferred was evaluated using the
Bootstrap test (Felsenstein 2004) with 500 replicates.
BI phylogenetic tree was obtained using BEAST 1.7.5 (Drummond et al.
2012b). Markov Chain Monte Carlo (MCMC) sampling was conducted in the dataset.

CHAPTER 3
75
Best fit model to the dataset was selected according AIC. One cold chain and tree
heated chains were run simultaneously for one million generations, and one tree per
100 generations was sampled. The first 100 trees were discarded as burn-in, and
Bayesian posterior probabilities were estimated on the 70% majority rule consensus
of the remaining 9900 trees.
Galileo phylogeny
Taxon sampling
The species used to test for Galileo presence and to buid the Galileo
phylogeny were chosen to maximize phylogenetic representation across
Drosophilidae. Therefore, in addition to laboratory strains, specimen collections were
carried out using the methods detailed in Acurio et al. (2010). Taxonomic
identification was made as is described in Acurio et al. (2013). Isofemale strains were
established for each taxon and preserved in pure ethanol to be stored at -20ºC.
DNA extraction
The source of each sample used to test for Galileo presence and to build the
Galileo phylogeny is shown in Table S2 (Supplementary Material). A total of 234
samples from 110 species were analyzed. Template DNA was extracted using 3 flies
per isofemale strain using a modified Cetyl trimethyl Ammonium Bromide (CTAB)
protocol (Appendix 1). Quality of DNA samples were later checked using a 0.7%
agarose gels using Agarose D1 EEO (Conda Laboratory). Template DNA was labeled
using an ID code and distributed on DNA plates.
Detection and amplification

CHAPTER 3
76
Six pairs of primers were designed in the most conserved region of the gene
encoding the TPase of Galileo (Figure 1). Primer 3 Plus web interfase was used for
primer design; details of each primer pair used in this study are shown in Table 1.
Template DNA was transferred to a multiwell PCR plate: a master plate of
DNA on which 92 samples and 4 negative controls were arrayed in a 12 x 8 format,
columns on plate were labeled with numbers 1-12 and rows with letters A-H. Thus,
each sample had a coordinate in the plate for the subsequent confirmation by PCR
using the primers designed to amplify Galileo TPase. PCR master mix was prepared
by combining 2442 µl water, 330 µl 10x Taq buffer (Roche), 66 µl 20mM dNTP's,
110 µl primer forward "F", 110 µl primer reverse “R” and 22.5 µl Taq DNA
Polymerase (Roche) in a tray on ice. Initial and final concentrations used on PCR mix
are shown in Table 2.
PCR master mix was distributed into the wells using a multi-channel pipette
(Eppendorf). Two microliters of DNA template were added to the PCR plate using a
12-channel pipette (Eppendorf). The 96-well plate was centrifuged during 5 seconds
on a Centrifuge 5810R (Eppendorf). PCR cycling conditions were settled in a Peltier
Thermal Cycler PTC-100 (Bio-Rad) as follows: initial denaturation 3 min at 94°C; 35
cycles of : 45 seconds at 94°C, 30 seconds at 50°C and a final elongation of 30
seconds at 72°C. Five microliters of 10x loading buffer (30% glycerol, 50mM EDTA,
0.25% bromo-phenol blue) were added to the 10 µl PCR reactions.
Fifteen microliters of the mix obtained in the previous step was charged on a
0.7% agarose gel. The agarose gel was electrophoresed at 70V for 1hr and then
transferred into a plastic dish. 500 ml of Ethidium Bromide staining solution (500 ml
water, 43 µl EtBr) was added to cover the gel. Finally, the gel was kept in the dark for

CHAPTER 3
77
30-40 minutes. The banding pattern of DNA was recorded through the gel by
photography using a camera and a transilluminators with 300-nm UV light. Software
from AlphaDigidoc (Alpha Innotech. Corp, USA) was used in this step.

CHAPTER 3
78
Figure 1. Sequence alignment of the most complete copies of Galileo reported on six Drosophila genomes using MAFFT software. On top consensus sequence, genbank accession numbers on the left side. Graph height (in pixels) denote most conserved region on alignment. Numbered green triangles show primers designed in this study; light blue arrows denote TIRs on Galileo TE. Species source is shown on blue arrows.

CHAPTER 3
79
Table 1. Primer pairs designed to search for Galileo transposon in the Drosophila genus.
Sequence Genebank ID Primers pair
Amplicon
length Sense Sequence
Primer
length
Dbuz/GALILEO EU334685 1-3 ~ 1 kb forward TTATAATAGTGCTGAAAGGGT 21 bp
reverse GAAAATARTCTCTCATTTCCT 21 bp
Dmoj/GALILEO BK006357 5-6
~ 0.5 kb
forward TGCACCGCATCTWGTWAAATCC 22 bp
reverse AAATAATCACGCATTTCCWGAAG 23 bp
Dana/GALILEO BK006363 7-8
~ 0.6 kb
forward ATGCCCCACATCTCATAAAATY 22 bp
reverse AGGTTTTCTAAGGGATCTTGATTY 24 pb
Dvir/GALILEO BK006359
9-10
~ 0.5 kb
forward GACTTAATCAAATGAGGAACATCR 24 bp
reverse GTTTTGGGATAACGACATTTCAY 23 bp
Dwil/GALILEO BK006360
11-12
~ 0.6 kb
forward ATGTCCCCCACCTCATAAAATY 22 bp
reverse ACCTTCTCCTTGACTCCAAATATY 24 bp
Dpse/GALILEO BK006362
13-14
~ 0.5 kb
forward GCGATTTAATCAAATGTGGAACR 23 bp
reverse GGCCAATGAAAGTATGGAGTTR 22 p

CHAPTER 3
80
Table 2. PCR mix concentrations used for 96-well plates and single reactions performed in this study.
volume initial concentration final concentration
DNA 2 µl --- ----
Water 22,2 µl --- ---
Taq buffer 3 µl 10 x 10X
dNTP's 0,6 µl 20mM
0.2 mM
primer "F" 1 µl 10 mM
1µM
Primer “R” 1 µl 10 mM
1 µM
Taq Polymerase 0.2 µl 2.5 U/µl
1.25 U
Total 30 µl
Galileo cloning
Positive detection of Galileo was determined based on the signal intensity and
length of the fragment amplified. Samples with positive detection were later cleaned
using the PCR Clean-up kit (NucleoSpin), and then cloned using the PCR Cloning kit
from Stratagene (Agilent Technologies, CA, USA) (Appendix 1). Under sterile
conditions, four clones of Galileo where selected from each cloning plate using plastic
tips, each clone was later isolated in a Eppendorf tube containing 50 µl of sterile water
and kept for 10 minutes. After that, tubes were placed at 100°C on a heater block SB-
200D (Stuart) for five minutes. Finally, the samples where centrifuged for 10 seconds.
To recover the Galileo insert cloned, a second PCR was carried out using the
universal primers T3 and T7, same concentrations and volumes per reactions than in the

CHAPTER 3
81
96-well plate PCR were used. The PCR cycling conditions in the Personal Thermal
Cycler MJ-Mini (Bio-Rad Laboratories, CA, USA) were settled as follows: initial
denaturation 2 minutes at 94°C; 35 cycles of: 30 seconds at 94°C, 45 seconds at 49°C and
a final elongation of 45 seconds at 72°C. Same procedure than Agarose gel
electrophoresis for 96-well plate PCR was then performed. From gel results one clone
was selected according to their intensity of signal and length. The Galileo clone selected
was then cleaned to eliminate primer dimers using the PCR Clean-up kit (Machery Nagel,
Düren, Germany) and sent for sequencing to Macrogen, Korea. Chromatograms were
compiled using the Geneious software (Drummond et al. 2011). Identity of the sequences
obtained was corroborated through BLASTN searches against NCBI database using E-
value ≤ 10-20 as significance threshold.
Galileo in silico searches
Nucleotide BLAST searches were performed against ten newly released genomes
of Drosophila available on NCBI and Flybase (Table 3). The significance threshold used
for searches was E-value ≤10-3.
Multi-sequence analysis
Sequences obtained through PCR and retrieved by in silico searches were aligned
using MAFFT software (Katoh et al. 2009). Patterns of nucleotide substitution,
transition/transversion rate ratios k1 (purines), k2 (pyrimidines) and overall
transition/transversion bias were calculated with MEGA 4 (Tamura et al. 2007). The
complete data set was scanned in the search of recombinant events using the software
RDP4 (Martin et al. 2010).

CHAPTER 3
82
Table 3. Taxa and queries used in the BLAST searches of Galileo TE.
Species (Genbank ID)
Species group Sequence used as query
1. D. bipectinata (42026) ananassae* Dana\Galileo
2. D. kikkawai (30023) montium* Dana\Galileo
3. D. rhopaloa (1041025) melanogaster Dana\Galileo
4. D. elegans (30023) melanogaster Dana\Galileo
5. D. biarmipes (125945) melanogaster Dana\Galileo
6. D. takahashii (29030) melanogaster Dana\Galileo
7. D. ficusphila (30025)
melanogaster Dana\Galileo
8. D. eugracilis(29029)
melanogaster Dana\Galileo
9. D. americana (40366) ■ virilis Dvir\Galileo
10. D. miranda (7229) obscura Dper\Galileo
* Taxonomic classification based on phylogenetic analysis from Da Lage et al. (2007); Russo et al.( 2013) and Yassin (2013).
■ The Drosophila americana genome is not available on NCBI database. Thus for the Galileo screening, the BLAST tool implemented in the D. americana genome webpage (Schlötterer et al. 2013) was used.

CHAPTER 3
83
Phylogenetic inference
The NJ phylogenetic tree was inferred using CIPRES (Miller et al. 2010). Model
of nucleotide evolution was selected according to AIC using JModelTest 2.1.5 (Posada
2008; Darriba et al. 2012). Statistical support for tree inferred was evaluated using the
Bootstrap test (Felsenstein 2004) with 500 replicates.
The maximum likelihood (ML) phylogenetic tree was performed on PhyML 3.0
(Guindon et al. 2010). The Bio NJ algorithm was used to compute a full initial tree. The
model of nucleotide substitution was selected according to the AIC. Both,
transition/transversion ratio and proportion of invariable sites were estimated with
PhyML. Tree topology and branch length were optimized using the NNI algorithm
(Guindon et al. 2010). Node support on the inferred tree was calculated using the
approximate likelihood ratio Shimodaira-Hasegawa test (a-LTR SH) (Anisimova &
Gascuel 2006).
BI phylogenetic tree was inferred using BEAST 1.7.5 (Drummond et al. 2012b).
The graphical user interface (BEAUti) was used to generate the XML input file.
Coalescence was assumed as a prior in the phylogenetic reconstruction. The length of the
MCMC chain was determinate using TRACER and Effective sample sizes (ESS) of each
parameter generated by BEAUti were analyzed using TRACER. A target tree was
selected using TreeAnotator with a burn in of 1000 trees on each run, a posterior
probability limit of 0.80 and using the Maximum Clade credibility option. Target tree
was visualized using Fig Tree v1.4.0.

CHAPTER 3
84
Ancestral reconstructions of Galileo in the Drosophilidae
To examine the presence of Galileo in the Drosophilidae, Maximum Likelihood
Ancestral Reconstruction (MLAR) and Parsimony Ancestral Reconstruction (PAR) both
implemented on MESQUITE (Maddison & Maddison 2010) were undertaken using the
BI phylogenetic tree previously recovered with four molecular markers and 174 species
of Drosophilidae. Presence/ absence data obtained from PCR and in silico screening of
Galileo was treated as a qualitative trait. The model of evolution assumed was Markov k-
state 1 parameter model (Mk1), where the single parameter is the rate of change (Lewis
2001).
The world-wide distribution of Galileo was examined using the Ancestral Range
Reconstructio (ARR) analysis also performed in MESQUITE. Data of Drosophila
samples where Galileo was detected, shown on Table S3 (Supplementary Material), has
been treated as categorical characters. The locality of each Drosophila sample was
assigned to a zoo-geographical realm as reported by Holt et al. (2013). Thus, each sample
was ascribed to one of the following regions: Nearctic, Neotropic, Paleartic, Oriental,
Australia, Afrotropic and Madagascar.
Cophylogenetic analysis of Galileo in its host Drosophila species
In order to determine the historical association of Galileo with its host Drosophila
species, the BI tree recovered from a highly conserved region of Galileo TPase and the BI
tree of Drosophila inferred from four molecular markers were compared. The

CHAPTER 3
85
MESQUITE software was used to prune the branches of the host phylogeny were Galileo
was not detected and to prune the outgroup clade of Galileo (1360 element).
Cophylogenetic analysis were performed on TreeMap version 3 (Charleston &
Robertson 2002). Congruence between trees was evaluated through Z statistic value
calculated for each node in the Galileo tree to find the corresponding subtree from the
Drosophila phylogeny. Because in most of the cases several copies of Galileo are
harbored in one genome of Drosophila (this is not a branch to branch association), the
“cherry-picking” test (CPT) (Jackson & Charleston 2004) was used to evaluate changes
in phylogenetic significance.
Horizontal Transfer test
In order to test putative HT events, the average number of synonymous nucleotide
differences per synonymous site (dS) was calculated using MEGA 4 (Tamura et al. 2007)
on each dataset analyzed (host species and Galileo). The transition/transversion bias
assumed in the modified Nei-Gojobori method was estimated using the same software,
gaps and missing data were eliminated by pairwise deletion option. Standard errors on dS
values were obtained by bootstrap procedure with 500 replicates.

CHAPTER 3
86
RESULTS
Drosophilidae phylogeny
The dataset built with the sequences of partial coding-regions of COI, COII, ND2
and SinA genes from 174 drosophilid species comprised 1901 aligned positions, of them,
929 are conserved positions, 972 are single variable positions, and 844 are parsimony-
informative positions (Table 4). No recombination events were detected using the
software RDP4. Across 174 taxa, differences in nucleotide composition between
mitochondrial and nuclear loci were found. The first are A+T rich with an overall average
ranging from 72.9% to 78.7%. Third codon position has AT content of 90% on COI,
91.7% on COII and 91.5% on ND2. The SinA locus has most equally nucleotide
composition with GC content of 57.1%.
Table 4. Number of sites that are invariable, polymorphic, parsimony informative (parsimony inf.) and singletons in the data set.
Locus (lengths on base-pairs) Concatenated Dataset
Sites COI COII ND2 SinA COI-COII-ND2-SinA
Length (bp) 367 658 479 397 1901
Invariable 166 326 183 254 929
Polymorphic 201 332 296 143 972
Parsimony-inf. 165 275 271 133 844
Singletons 36 57 25 10 128
The best fit model of nucleotide evolution estimated for mitochondrial and nuclear loci
according to the AIC is GTR (Table 5).

CHAPTER 3
87
Table 5. Best model selected according the AIC for each data set analyzed. Abbreviation are as follows: -lnL: negative log likelihood, K: number of estimated parameters, p-inv= proportion of invariable sites, α=Gamma distribution shape parameter.
Mitochondrial loci Nuclear Loci ND2 COI COII SinA
-lnL = 22879.6465 -lnL = 10952.4581 -lnL = 20588.1025 -lnL = 11175.0896 K = 324 K =330 K =356 K = 319
Model-averaged estimates GTR+I+G GTR+G
freqA = 0.3831 freqA = 0.3782 freqA = 0.2691 freqA = 0.2137 freqC = 0.1183 freqC = 0.0832 freqC = 0.1387 freqC = 0.3064 freqG = 0.0836 freqG = 0.0301 freqG = 0.0348 freqG = 0.2682 freqT = 0.4150 freqT = 0.5085 freqT = 0.5574 freqT = 0.2117 R(a) [AC] = 0.8001 R(a) [AC] = 0.1972 R(a) [AC] = 1.0351 R(a) [AC] = 2.4706 R(b) [AG] = 8.0507 R(b) [AG] = 7.9241 R(b) [AG] = 22.6578 R(b) [AG] = 6.0678 R(c) [AT] = 2.0521 R(c) [AT] = 0.3575 R(c) [AT] = 2.5042 R(c) [AT] = 1.3367 R(d) [CG] = 2.3124 R(d) [CG] = 0.8248 R(d) [CG] = 2.4391 R(d) [CG] = 1.7499 R(e) [CT] = 9.2937 R(e) [CT] = 6.2099 R(e) [CT] = 14.2411 R(e) [CT] = 7.3433 R(f) [GT] = 1.0000 R(f) [GT] = 1.0000 R(f) [GT] = 1.0000 R(f) [GT] = 1.0000 p-inv = 0.08 p-inv = 0.2960 p-inv = 0.4350 p-inv=0.0000 α= 0.6670 α = 0.2770 α = 0.5530 α = 0.6850

CHAPTER 3
88
The phylogenetic analysis of the combined dataset from three mitochondrial
(COI, COII, ND2) and one nuclear (SinA) genes using Neighbor-Joining (NJ) (Figure 2)
and Bayesian Inference (BI) (Figure 3) approaches resulted in highly congruent tree
topologies. In the phylogenetic analysis six main clades were retrieved:
Clade I encompasses Scaptomyza genus (BI: 1, NJ: 100).
Clade II encompasses five species groups: ananassae, melanogaster, montium,
willistoni and saltans (BI: 1, NJ: 100).
Clade III encompasses eleven species groups: immigrans, guttifera, quinaria,
putrida, funebris, macroptera, cardini, calloptera, tripunctata, guarani and
polychaeta (BI: 1, NJ: 54).
Clade IV encompasses the genus Scaptomyza and five species groups:
antopocerus, modified tarsus, ciliated tarsus, halekalae and modified mouthpart
(BI: 1, NJ: 56).
Clade V encompasses the genus Zaprionus and polychaeta species group (BI: 1,
NJ: 20).
Clade VI encompasses eight species groups: virilis, robusta, melanica,
annulimana, atalaia, nannoptera, canalinea and repleta (BI: 0.97, NJ: 39).

CHAPTER 3
89
Figure 2. Neighbor-Joining phylogenetic tree based on the combined analysis of three mitochondrial (COI, COII, ND2) and one nuclear (SinA) genes (1901 bp) of 174 taxa from Drosophila, Hawaiian Drosophila, Scaptodrosophila, Scaptomyza and Zaprionus. Numbers at nodes indicates bootstrap value. The scale bar represents substitutions per site. Color tones denote different species groups within each subgenus.

CHAPTER 3
90
Figure 3. Bayesian Inference phylogenetic tree based on the combined analysis of three mitochondrial (COI, COII, ND2) and one nuclear genes (1901 bp) of 174 taxa from Drosophila, Hawaiian Drosophila, Scaptodrosophila, Scaptomyza and Zaprionus. Best tree using mitochondrial and nuclear partitions with the GTR+I+G model of nucleotide substitutions. Statistical support is shown on nodes (Posterior Probabilities). Clades labeled with colors according to their genera taxonomic classification. Branch lengths in the tree are in substitutions per site. Color tones denote different species groups within each subgenus.

CHAPTER 3
91
Galileo transposon
Detection
The results of the Galileo search in 234 samples from 110 drosophilid species
are given in Table S3 (Supplementary Material). Galileo was unequivocally detected
on 51 taxa from ten species groups: ananassae, montium, melanogaster, willistoni,
tripunctata, guarani, saltans, obscura, virilis and repleta. Significant hits retrieved in
the BLASTN searches carried out in the recently sequenced Drosophila genomes are
show in Table S4 (Supplementary Material). Through in silico screening, Galileo was
detected in six species: D. bipectinata, D. kikkawai, D. elegans, D. rhopaloa, D.
miranda and D. americana. The homologous region of Galileo TPase retrieved from
these species was included in the data set to infer the phylogenetic tree. In the case of
D. elegans, non-autonomous copies of Galileo were only found. Thus this species was
labeled as positive in the detection test and mapped in the host phylogeny but not used
to build the Galileo phylogeny.
The data set analyzed include 152 sequences, of them 125 were obtained by
PCR and cloning, 14 sequences have been obtained through in silico searches and 13
are GenBank sequences reported by Marzo et al. (2008). The transposable element
1360 from the P superfamily, was selected as outgroup. Galileo dataset comprised 426
aligned positions, between them 316 are parsimony-informative. In the dataset 33
sites are conserved, 364 sites are variable and 52 sites are singletons. No
recombination events were detected using RDP4 software.
From a dataset of 426 sites, 62 sites (14.55%) are without variation. According
to the AIC, the best fit model to Galileo data set is GTR+I+G (-lnL = 10076.9552).
Table 6 shows the parameter estimates that characterize the molecular evolution of

CHAPTER 3
92
Galileo. The proportion of invariable sites, p-inv, is 0.1595, the most frequent
nucleotide is A (0.3826), the most common substitution is between C and T (3.6484),
around 6% of the sites have not changed (p-inv=0.056), and moderate rate variation
among residues (α=1.4644).
Table 6. Parameter importance and model averaged estimates for 152 sequences of Galileo. Abbreviations are as follows: f = frequencies, r = ratio, I = proportion of invariable sites, G = shape parameter of the gamma distribution. Values are averaged for: I (considers only +I models), G (considers only +G models), IG (considers only +I+G models).
Parameter Importance Model averaged estimates fA 1.0000 0.3826 fC 1.0000 0.1541 fG 1.0000 0.1723 fT 1.0000 0.2910
kappa 0.1378 3.0809 Titv 0.1378 1.3743 rAC 0.8622 0.9384 rAG 0.8622 2.7237 rAT 0.8622 0.9690 rCG 0.8622 1.2416 rCT 0.8622 3.6486 rGT 0.8622 1.0000
pinv(I) 0.0000 0.0560 alpha(G) 0.0133 1.4804 pinv(IG) 0.9867 -- alpha(IG) 0.9867 1.4644
The segment of Galileo TPase analyzed is A+T rich with an overall average of
65.6 %. First codon position has an AT content of 68.6 %, second codon position
65.5% and third codon position 62.7 %. Pairwise identity between Galileo copies in
the same species is ≥ 93% while copies from same species groups are ≥ 83%
identical.

CHAPTER 3
93
The estimated instantaneous substitution rate matrix (Q matrix) from the
general time-reversible model (GTR) is shown in Table 7. This matrix provides the
description of the substitution process assumed to build the ML phylogeny of Galileo,
The optimal tree inferred is depicted on Figure 5 (logL -10164.0777).
Table 7. PhyML estimated instantaneous rate matrix Q for GTR model. Each entry in the matrix represents the instantaneous substitution rate from nucleotide to nucleotide (rows and columns follow the order A, C, G, T).
A C G T
-0.80644 0.13230 0.41701 0.25713
0.30913 -134.035 0.17541 0.85580
0.81619 0.14693 -118.851 0.22540
0.32674 0.46541 0.14634 -0.93849
In the Bayesian Inference analysis, the two models tested (GTR and Yang 96)
were congruent regarding tree topology and ESS values for posterior probabilities
(Table 8). Using Bayes factor criteria (1000 bootstrap replicates), Yang 96 model (ln-
10321.0220) better fits the data than GTR model (ln-10591.672).
Table 8. Posterior Statistics of GTR and Yang 96 models tested in the Bayesian phylogenetic reconstruction.
Posterior Statistics GTR model Yang 96 model Mean -10705.0033 -10485.4557 Standard error of mean 0.3059 0.3454 Median -10704.5811 -10485.1124 95% HPD lower -10726.2221 -10511.4379 95% HPD upper -10683.3468 -10461.6693 Auto-correlation time (ACT) 6992.7199 6534.5783 Effective sample size (ESS) 1287.1958 1377.4416
Q =

CHAPTER 3
94
Galileo phylogeny
The phylogenetic analysis of 152 sequences of Galileo TPase from 51
Drosophila species using Neighbor Joining (NJ) (Figure 4), Maximum Likelihood
(Figure 5) (ML) and Bayesian Inference (BI) (Figure 6) approaches resulted in highly
congruent tree topologies (Figure 7). In the phylogenetic analysis five main clades
were retrieved:
Clade I (NJ: 97, ML: 1, BI: 1) encompasses element 1360 sequences (outgroup).
Clade II (NJ: 96, ML: 1, BI: 1) encompasses Galileo copies from species that belong
to three different subgenera: from Sophophora subgenus, the willistoni and saltans
species groups; from Drosophila subgenus, the tripunctata and guarani species
groups and from Siphlodora subgenus, the virilis species group.
Clade III (NJ: 97, ML: 1, BI: 1) encompasses Galileo copies from the ananassae,
montium and melanogaster species groups. The three species groups belong to the
Sophophora subgenus.
Clade IV (NJ: 100, ML: 1, BI: 1) encompasses Galileo sequences from obscura
species group that belongs to the Sophophora subgenus.
Clade V (NJ: 100, ML: 1, BI: 1) encompasses sequences from repleta species group
in Siphlodora subgenus.

CHAPTER 3
95
Figure 4. Neighbor-Joining phylogenetic tree inferred for 152 sequences of Galileo and 1360 element TPases in 51 Drosophila species. Bootstrap values are shown on nodes. Colors denote subgenera of the host as follows: yellow=Siphlodora, green=Sophophora, blue=Drosophila.

CHAPTER 3
96
Figure 5. Maximum Likelihood phylogenetic tree inferred for 152 sequences from Galileo and 1360 element TPases in 51 Drosophila species. The aLTR-SH statistical support is shown on each node. Colors denote subgenera of the host as follows: yellow=Siphlodora, green=Sophophora, blue=Drosophila.

CHAPTER 3
97
Figure 6. Bayesian Inference phylogenetic tree for 152 sequences of Galileo and 1360 element TPases in 51 Drosophila species. Posterior probability values are shown on each node. Colors denote subgenera of the host as follows: yellow=Siphlodora, green=Sophophora, blue=Drosophila.

CHAPTER 3
98
Figure 7. Graphical comparison of radial trees inferred for 152 sequences of the transposon Galileo and element 1360 TPases in 51 Drosophila species. Unrooted phylograms on scale, black dots denote statistical support for each phylogenetic method, maximum size of black dots is show high statistical support on each method on A: Bayesian posterior probabilities = 1, on B: aLRT non-parametric Shimodaira-Hasegawa values = 1, on C=Bootstrap values =100.

CHAPTER 3
99
Galileo Ancestral Range Reconstruction
The current observed distributional pattern of Galileo has been used to
reconstruct its ancestral distribution under the Mk1 model using a Maximum
Likelihood approach. The results of this analysis are shown in Figure 8. The Ancestral
Range Recolnstruction (ARR) of 152 sequences of Galileo in 51 Drosophila species
has an overall likelihood score of -lnL=154.19.
The ARR shows that Galileo sequences from willistoni-tripunctata-guarani
species groups more probably were originated in the Neotropics (prob=0.87 p < 0.05).
The clade encompassing virilis-tripunctata-guarani and willistoni species groups
from Sophophora-Drosophila-Siphlodora subgenus is more probably originated in the
Neotropic (prob= 0.43) than in the Neartic (prob = 0.23). Galileo sequences from
ananassae, montium, melanogaster and obscura species groups likely have an
Oriental origin (prob=0.95 p < 0.05).
Galileo sequences from the repleta species group have a strong
biogeographical signal. Clades can perfectly be distinguished at the level of species
complexes. For instance, the buzzatii complex (D. starmeri, D. uniseta, D.
borborema, D. koepferae, D. buzzatii, D. martensis and D. borborema) species has a
Neotropical origin (prob=0.99 p < 0.05) and the mulleri complex (D. arizonae, D.
mojavensis and D. wheeleri) has a Neartic origin (prob=0.98 p < 0.05).
Based on ecological, molecular and biogeographical evidence it has been
proposed that the ancestor of the Sophophora subgenus has a Eurasian origin (Russo
et al. 2013; Lachaise et al. 1988; Throckmorton 1975).

CHAPTER 3
100
Figure 8. Ancestral Range Reconstruction of 152 sequences of Galileo in 51 Drosophila species. Zoo-geographical map modified from Holt et al. (2013). ML ancestral reconstruction mapped on the BI tree using the MK1 model. Proportional likelihoods are shown on nodes.

CHAPTER 3
101
Galileo in Drosophilidae
Presence of Galileo detected through PCR and in silico screening is mapped in
the phylogenetic tree of Drosophilidae (Figure 9). It is remarkable a discontinuous
pattern of distribution across 31 species groups of the genera Drosophila,
Scaptodrosophila, Zaprionus and Hawaiian Drosophila.
A patchy distribution of Galileo is also observed at the taxonomic level of
subgenus. For example, in the Drosophila subgenus, Galileo was detected in the
guarani and tripunctata species groups, sister taxa of the cardini species group, in
which Galileo was not detected. Likewise, in the Siphlodora subgenus, Galileo was
detected by in silico searches in the virilis group, but its sister clades calloptera,
annulimana, atalaia and nannoptera groups, screened using PCR, seem devoid of
Galileo in their genomes. In the repleta species group, a special sampling effort was
made since this clade encompasses D. buzzatti, the taxon where Galileo was initially
described, however this element was no detected in basal clades such as inca, fasciola
and hydei subgroups.
The ancestral reconstruction analysis carried out with the data of Galileo
presence/ absence in 133 species of Drosophilidae mapped in the BI phylogeny gave
similar results with the two approaches used. Maximum Likelihood (MLAR) (Figure
10) and Parsimony (PAR) (Figure 11) show three more likely points of Galileo
introduction in Drosophilidae. (i) the Sophophora subgenus, (ii) the Drosophila
subgenus and (iii) the Siphlodora subgenus.
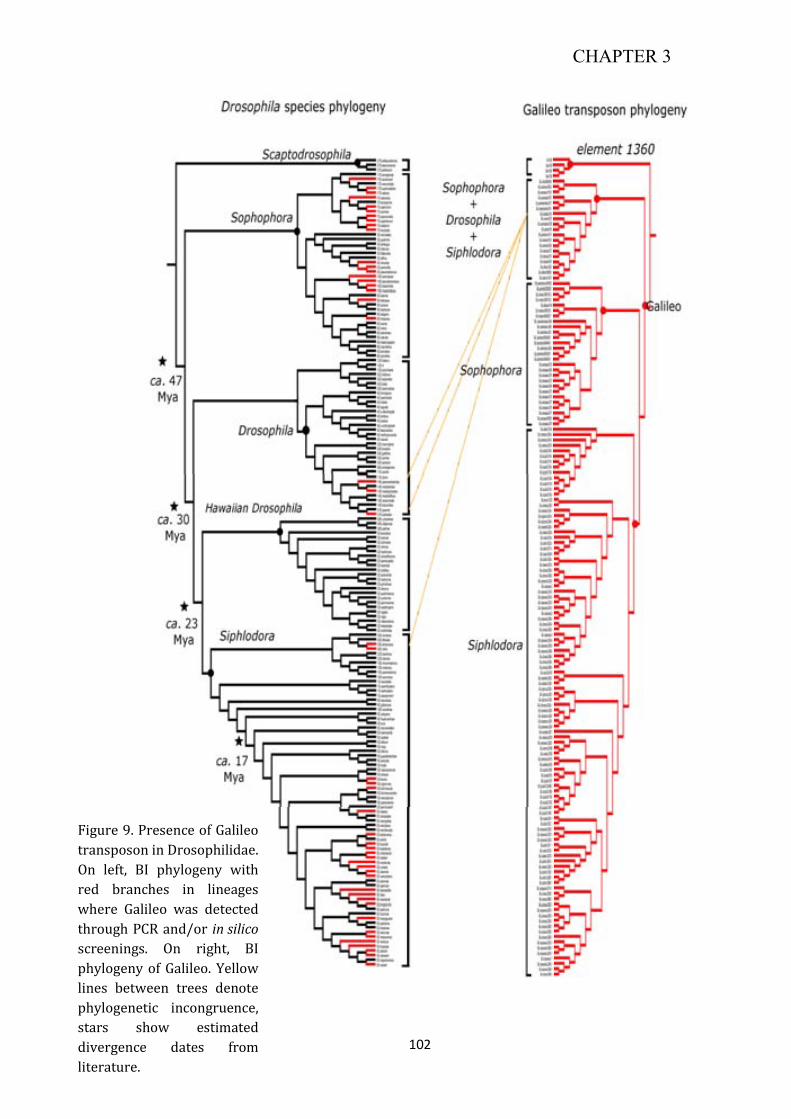
CHAPTER 3
102
Figure 9. Presence of Galileo
transposon in Drosophilidae.
On left, BI phylogeny with
red branches in lineages
where Galileo was detected
through PCR and/or in silico
screenings. On right, BI
phylogeny of Galileo. Yellow
lines between trees denote
phylogenetic incongruence,
stars show estimated
divergence dates from
literature.

CHAPTER 3
103
Figure 10. MLAR inferred for Galileo across 174 species of Drosophilidae. Terminal nodes are shown in: black (Galileo detected), gray (presence inferred) and white (undetected). Internal nodes denote proportional likelihoods of ancestral reconstructions.Stars denote statistical singnificance (p < 0.05).

CHAPTER 3
104
Figure 11. PAR inferred for Galileo transposon mapped in the BI phylogeny of 174 species of Drosophilidae. Red branches denote inferred presence of Galileo. Squares above taxa are in red when Galileo was detected, in white when Galileo was not detected Branches through PCR and in silico methods. Estimated divergence dates from Russo et al. (2013); Clark et al. (2007); Oliveira et al. (2012) and Acurio et al in preparation.

CHAPTER 3
105
Cophylogenetic analysis
The graphical comparison of the ultrametric trees (tanglegram) for Galileo and its
host species is shown in Figure 12. The phylogenetic tree inferred from four molecular
markers (COI, COII, ND2 and SinA) and the phylogenetic tree inferred from 152
sequences of Galileo TPases in 51 Drosophila species were compared. The Galileo
phylogeny resembles that of its host species with three exceptions:
1. D. virilis and D. americana that belong to the virilis species group, from Siphlodora
subgenus.
2. D. subbadia from the guarani species groups from the Drosophila subgenus.
3. D. mediopictoides and D. paramediostriata from tripunctata species group of
Drosophila subgenus.
These five lineages are nested within the Galileo clade from the Sophophora subgenus.
Specifically, these lineages intermingle in the same clade than willistoni and saltans
species groups.
The number of synonymous substitutions per synonymous site (ds ) from averaging
over all sequence pairs across species groups estimated on each dataset analyzed (COI,
COII, ND2, SinA and Galileo are shown in Tables S5-S9 (Supplementary Material).
When the lineages involved in phylogenetic incongruences are compared, significant
differences in ds values from host genes and Galileo were found in guarani, tripunctata
and virilis species groups (Figure 13).

CHAPTER 3
106
Figure 12. Drosophila-Galileo transposon tanglegram. Ultrametic trees inferred using BI methods for 51 host Drosophila species (left) and Galileo copies (right) found in their genomes. Line colors denote subgeneric level on both phylogenies, green for Sophophora, blue for Drosophila, yellow for Siphlodora. Taxa where Galileo was not detected have been trimmed using MESQUITE in the host phylogeny and clades collapsed using FigTree in the transposon phylogeny.

CHAPTER 3
107
Figure 13. Number of synonymous substitutions per synonymous site (ds) from averaging over all sequence pairs across 10 species groups of Drosophila. Values estimated using MEGA 4. Asterisks denote significant differences on dS values from host species genes (COI, COII, ND2, SinA) and Galileo transposon (TPase).
* * *

CHAPTER 3
108
Cophylogenetic analysis of the ultrametric tree of Galileo, inferred from TPase
and the ultrametric tree of Drosophila host species, inferred from four molecular markers,
carried out in TreeMap V.3.0, is show in Figure 14. The high level of congruence
between the phylogenies of Galileo and its host Drosophila species is evident and
denoted by the z statistic value from the randomized subtrees. According z statistic test,
the incongruent clades of the host species phylogeny were:
The willistoni clade that encompass seven lineages: D. nebulosa, D. capricorni,
D. sucinea, D. paulistorum, D. equinoxialis, D. tropicalis and D. willistoni.
The clade of the Drosophila subgenus that encompass tree lineages: D. subbadia,
D. paramediostriata and D. mediopictoides.
The obscura clade that encompass three lineages: D. miranda, D. persimilis and
D. pseudoobscura.
The virilis clade that encompass two lineages: D. virilis and D. americana.
In the repleta species group: two lineages of the mercatorum subgroup (D.
mercatorum and D. paranaensis), six lineages of the buzzatii complex (D.
martensis, D. uniseta, D. starmeri, D. venezolana, D richarsoni and D. stalkeri),
four lineages of the mulleri complex (D. arizonae, D. mojavensis, D. mayaguana
and D. navojoa) and five lineages of the longicornis complex (D. hamatofila, D.
ritae, D. meridiana, D. mainland and D. longicornis).
The overall result that these two phylogenetic trees are significant similar remained
even when associated terminal taxa was eliminated through the “cherry picking” test
(CPT) (Figure 15).

CHAPTER 3
109
Figure 14. Cophylogenetic analysis of the ultrametric tree of Galileo (on yellow, inferred from TPase) and the phylogenetic tree of 51 Drosophila host species (in blue, inferred from COI, COII, ND2, SinA genes). Red dots denote congruence between transposon and host genome tested through z statistic value from the randomized subtrees.

CHAPTER 3
110
Figure 15. Cophylogenetic analysis of the ultrametric tree of Galileo (on yellow, inferred from TPase) and the phylogenetic tree of 51 Drosophila host species (in blue, inferred from COI, COII, ND2, SinA genes) after the removal of associated terminal taxa by CPT.
Drosophila host species Galileo transposon

CHAPTER 3
111
DISCUSSION
Drosophilidae phylogeny
The phylogenetic analysis carried out using four molecular markers (COI,
COII, ND2, SinA) from 174 taxa of Drosophilidae classified in 31 species groups
recovered well resolved phylogenies under BI and NJ methods (Figures 2 and 3). The
results obtained in this analysis is in good agreement with two recent phylogenetic
analyses of Drosophilidae by Yassin (2013) and Russo et al. (2013), which encompass
most of the currently known Drosophila diversity. In spite of using different
molecular markers and taxa, the same evolutionary relationships have been recovered
here and in by previous phylogenetic approaches in the following clades:
Clade I (in this study) belongs to Scaptodrosophila Duda 1923. Monophyly of
this clade has been previously reported by Bock & Parsons (1978).
Clade II (in this study) belongs to Sophophora Sturtevant 1939. Previous
phylogenetic analyses in agreement with the monophyly of Sophophora are: Yassin
(2013); Russo et al. (2013); Remsen & O’Grady (2002); Clark et al. (2007).
Clade III (in this study) is the newly diagnosed subgenus Drosophila sensu
stricto Yassin 2013 or tripunctata-immigrans radiation according to Throckmorton
(1975).
Clade IV (in this study) encompasses Scaptomyza genus Hardy 1849 and the
Hawaiian Drosophila sensu stricto O’Grady 2011, which encompass five species
groups: antopocerus, modified tarsus, ciliated tarsus, halekalae and modified
mouthpart. Previous phylogenetic analyses supporting monophyly of Hawaiian
Drosophila are: O’Grady & Desalle (2008); O’Grady & Markow (2009).

CHAPTER 3
112
Clade V (in this study) encompasses Zaprionus Coquillett 1901 and
polychaeta as its sister taxa. Monophyly of Zaprionus has been previously supported
by several studies (Yassin et al. 2008; Russo et al. 2013). In this study however,
Zaprionus is the sister clade of the polychaeta species group. The phylogenetic
positions of Clade V was recovered with very low support in NJ method.
Clade VI (in this study) encompasses the newly diagnosed Siphlodora
subgenus sensu stricto Yassin 2013 or virilis-repleta radiation according to
Throckmorton (1962). This clade is also recovered by Russo et al. (2013)
phylogenetic approach.
Pattern of distribution of Galileo in Drosophilidae
The most used experimental methods for DNA transposons detection are PCR
and Southern/Dot blot techniques. PCR method allows the gathering of sequences of
TEs homologous regions while Southern/Dot Blot techniques are preferred to estimate
the copy number of TEs. Although there is no perfect experimental method for TEs
detection, it is known that PCR amplification using degenerate primers from highly
conserved regions may detect elements in species that are apparently devoid of them
according Southern/Dot Blot techniques (Capy et al. 1998).
Efficiency of the PCR approach for screening of TEs in distantly related taxa
has been demonstrated with other DNA transposons like mariner, which was
originally described in D. mauritania (Drosophilidae), and has been detected using
the homology PCR approach on distantly related species from different orders of
Arthropods (Robertson 1993; Robertson & Lampe 1995). Efficiency of PCR method

CHAPTER 3
113
also has been confirmed in this study because it was able to detect Galileo in distantly
related species such as the Sophophora subgenus and different subgroups within the
repleta lineage. For example, Galileo detections in the mulleri and repleta subgroups,
where no previous signal of Galileo was detected using the Southern Blot method
(Casals et al. 2005).
Similar discontinuous pattern or patchy distribution has been previously
reported in Drosophilidae when a broad spectrum of species is screened. For example
mariner-like elements (Brunet et al. 1994; Maruyama & Hartl 1991) and hobo-like
elements (Daniels et al. 1990). It is difficult to prove that an element is not present in
a species, no matter what technique of TEs detection has been used. The possibility
that a lineage contains homologous sequences with strong divergence from the
primers or probes used in the screening may cause that the element is undetected.
Uncertainty regarding presence of Galileo in Drosophilidae was examined with
MLAR (Figure 10) and PAR (Figure 11). Both methods inferred same discontinuous
pattern of distribution when presence/absence of Galileo is mapped in the species
phylogeny (Figure 9).
Galileo is detected on specific points of the host phylogeny and after such
point of entrance presence or absence of the element is related to cladogenesis of host
lineages. Exemplifications of these are the patterns of distribution of Galileo in the
montium-ananassae-melanogaster clade and in the repleta species group.
The montium-ananassae-melanogaster clade
The presence of Galileo through PCR and in silico (when genomes were
available) screening was determined for several species within the montium and
ananassae species groups. However their closely related melanogaster group gave
CHAPTER 3
114
negative results for Galileo presence with two exceptions: Drosophila elegans and
Drosophila rhopaloa, species from the elegans and rhopaloa subgroups, respectively.
According to several studies (Da Lage et al. 2007; Russo et al. 2013; Yassin
2013), and the species phylogeny recovered here, the melanogaster group includes the
melanogaster subgroup with an Afrotropical origin and other species subgroups with
an Oriental origin. The elegans and rhopaloa lineages seem to have diverged first
from other Oriental subgroups (Kopp 2006; Goto & Kimura 2001; Da Lage et al.
2007).
The fact that Galileo is present on several taxa from ananassae and montium
groups, that are considered early diverging lineages within the ananassae-montium-
melanogaster clade (Kopp 2006; Goto & Kimura 2001), strongly suggest that the
most recent common ancestor (MRCA) harbored an autonomous copy of Galileo in
its genome. The presence of Galileo in the MRCA of the ananassae-montium-
melanogaster clade was inferred by MLAR and PAR. Interestingly, the ARR of
Galileo (Figure 8) recovers the same geographical range proposed to the MRCA of
Old World Sophophora.
With the data analyzed in this study we are not able to determinate if the splits
of the melanogaster subgroup from its sibling taxa had an important effect on the
Galileo, but it seems that cladogenesis in the melanogaster subgroups could have an
effect in the element causing either, divergence in the TPase that avoid detection or
loss of autonomous Galileo copies.

CHAPTER 3
115
The repleta clade
Since Galileo was originally described in D. buzzatii, a taxon of the repleta
species group, special sampling effort was made in this lineage. Six subgroups were
sampled (inca, mercatorum, fasciola, hydei, mulleri and repleta). Galileo was
detected in three of the six subgroups (repleta, mercatorum and mulleri) only.
The inca, fasciola and hydei subgroups represent basal lineages within the
repleta radiation (Acurio et al. in preparation). At least two possible reasons could
explain the absence of the element in repleta basal clades; one reason might be that
there is a high degree of divergence in the element, whereby it is not detectable with
the methods employed in this study, the second reason might be that the introduction
of Galileo in repleta took place after the split of repleta, mercatorum and mulleri
subgroups, divergence time for the split of these subgroups has been estimated in ca.
14 Mya (Acurio et al. in preparation, Oliveira et al.2012). The fact that Galileo has
been detected in other nine species groups of the Drosophila radiation, but also that
the phylogeny of the element mirrors that of host species, are evidences of the long-
term association of Galileo in Drosophila. Therefore, the second reason looks
unrealistic. Two scenarios can be proposed to explain the extant discontinuous
distribution of Galileo in the repleta, mercatorum and mulleri subgroups (Figure 9).
The first scenario implies stochastic losses in several lineages. The second
scenario implies reactivation of autonomous copies. It has been proposed (Venner et
al. 2009) that during their evolution, non-autonomous copies of TEs can be dormant
entities that persist in the genome as long as the environment remains unfavorable for
its development, for example copies inactivated by methylation or epigenetic
processes that can be reactivated when methylation is removed. TEs dynamic that

CHAPTER 3
116
experience different periods of grow rate and periods of dormancy has been reported
in Drosophila (Vieira et al. 1999).
Galileo subfamilies
It is important distinguish different levels of diversification of TEs. One level
of diversification could be considered a genome (Venner et al. 2009). Cut-and-paste
TEs, such as Galileo, may have transcriptional active copies (autonomous) and
defective copies (non-autonomous) unable to encode a functional protein. Non-
autonomous copies are presumably derived from autonomous copies by mutation
and/or deletion (Feschotte & Pritham 2007). A second level of diversification on TEs
could be considered the macro-evolutionary level, in which, factors affecting host
species divergence may also affect divergence of TEs.
Several studies have tackled the intraspecific variation of Galileo using
bioinformatics screenings of Drosophila genomes (Marzo et al. 2008; Marzo et al.
2013; Gonçalves et al. 2014). From these approaches it is currently known that D.
buzzatii harbor three Galileo subfamilies (G, K, N), D. virilis harbor two subfamilies
(A, B), D. willistoni harbor two subfamilies (V, W) and D. mojavensis harbor five
subfamilies (F, C, D, X and E). Some of the subfamilies harbor only non-autonomous
copies without significant TPase encoding segments. Most of such studies have
analyzed the homologous TIR region from Galileo copies. The comparison of
phylogenies build with TIR segments and TPase sequences led in some cases to
congruent results (Gonçalves et al. 2014). However, in other cases (Marzo et al.
2013a), discrepancies were noticed that can be due to different evolutionary histories
but also to phylogenetic uncertainty.

CHAPTER 3
117
The results of the phylogenetic analysis performed here across 51 Drosophila
species using a segment of the Galileo TPase support most of the classification at
subfamily level proposed so far, although some subfamilies appear to be the result of
intraspecific diversification (Figure 13). For instance, the F subfamily of Galileo,
initially detected in D. mojavensis is recovered with high statistical support (BI: 1,
ML: 0.99, NJ: 1) in other seven species from the mulleri complex such as: D.
arizonae, D. navojoa, D. huaylasi, D. mayaguana, D. aldrichi, D. wheeleri and D.
mulleri. Hence, it is highly probable that the MRCA of this species complex harbored
active copies from the F subfamily.
On the other hand, the C, D and X subfamilies, initially characterized in D.
mojavensis, were found in samples of D. arizonae (D. mojavensis close relative). This
subfamilies were recovered as a single clade with quite good statistical support (BI: 1,
ML: 0.95, NJ: 0. 90). Thus, it is apparent that autonomous copies of these three
subfamilies were in the genome of D. mojavensis and D. arizona ancestor. The same
could be applied to the E subfamily which is has been characterized only in non-
autonomous copies of Galileo.
Two distantly related groups with high statistical support were found in the
buzzatii species complex. The first clade (BI: 1, ML: 1, NJ: 1) encompass Galileo
copies from 5 species, D. buzzatii, D. martensis, D. borborema, D. richarsoni and D.
stalkeri. The second clade (BI: 1, ML: 1, NJ: 1) enclose Galileo copies from seven
species: D. buzzatii, D. martensis, D. borborema, D. starmeri, D. uniseta D.
koepferae and D. venezolana.
It is noteworthy that previous screenings of Galileo in D. buzzatii have
reported three different subfamilies, namely Galileo, Kepler and Newton or G, K and

CHAPTER 3
118
N subfamilies (Cáceres et al. 2001). All copies found so far in the latter two
subfamilies (K and N) are non-autonomous copies lacking significant TPase-encoding
segments. The TIRs of the tree subfamilies have the most terminal 40 bp almost
identical and generate upon insertion a TSD of a palindromic 7 bp sequence (Casals et
al. 2005; Casals et al. 2003). However, K and N subfamilies seem more clasely
related than each of them is to the third subfamily G (Casals et al. 2005). The fact that
described copies in N and K subfamilies lack the TPase-encoding segment precludes
comparison with the results of this work. It could be that the two Galileo lineages
detected here in the buzzatii species complex correspond to the G subfamily or that
one of them represents the undescribed TPase of the K or N subfamilies. Further work
is needed to clarify this issue.
From a previous study testing the ability of the TIRs of copies of N and K
subfamilies to bind the THAP domain of Galileo TPase (Marzo et al. 2013b) it is
known that cross-reactivity exist between Galileo TPase and K subfamily TIRs.
Taking all this into account, it is possible speculate that one of the two subfamilies
recovered in the phylogenetic analysis of the TPase motif correspond to autonomous
copies from Newton subfamily in the Drosophila buzzatii complex.
The general pattern found in subfamilies of Galileo across Drosophila species
is that subfamilies classified using the TIRs are shared at level of species complex and
subgroups, which have short periods of time divergence ranging from 9 to 0 Mya as is
illustrated in Acurio et al. in preparation. TPase motifs are good features in
classification of TEs at level of superfamilies because of their conservation across
different phyla (Capy et al. 1998; Yuan & Wessler 2011) while TIRs, highly variable
on structure and length in Galileo (Marzo et al. 2013), are the only feature useful to
classify non-autonomous copies.

CHAPTER 3
119
Base composition of nuclear, mitochondrial and TPase genes
The strong bias toward A + T content (ca. 90%) at third codon position on
mitochondrial genes of Drosophila, previously reported in several studies (Satta et al.
1987; DeSalle et al. 1987; Tamura 1992; Montooth et al. 2009), also found here in the
analysis of three mitochondrial loci of 174 species, is hypothesized to be generated by
mutation pressures that would oppose weak selection for codon-anticodon matching
(Montooth et al. 2009). The nuclear locus analyzed on this study has a GC content of
57.1%. Biases toward G + C content on nuclear genes of Drosophila has been
proposed to be due to C-ending codon preference (Moriyama & Hartl 1993).
Differences in synonymous substitutions rates between nuclear and mitochondrial
genes of Drosophila are attributed to elevated transition rates in mitochondrial genes
and selective constrains associated with codon usage bias in nuclear genes (Moriyama
& Powell 1997).
The analysis of 152 sequences from 51 Drosophila species revealed an
average A + T content of 65.6 % on Galileo TPase. Tendency for TEs to be AT-rich
has been previously reported on both, GC-rich genomes such as D. melanogaster and
H. sapiens and AT-rich genomes like A. thaliana, S. cerevisae and C. elegans (Lerat
et al. 2000; Lerat et al. 2002), suggesting that AT content is a specific characteristic of
all TEs and independent from host genomes. In fact, Lerat et al. (2002) distinguished
between two groups of TEs according the nucleotide composition at the third codon
position, the rich-A and the rich-T-ending codons. The sequence comparison of
Galileo showed that A (37%) is the more frequent nucleotide at third codon position;
high AT values at this position is thought to be due to selective constraints acting on
this third codon base (Grantham et al. 1980).

CHAPTER 3
120
In spite that only a motif of Galileo TPase was analyzed in this study, a similar
A+T biased composition has also been reported for other mobile elements including
retrotransposons and retroviruses from different hosts (Jia & Xue 2009; Moriyama et
al. 1991; Zsiros et al. 1999; Turelli et al. 1997). As is pointed out by Lerat et al.
(2002) some hypothesis proposed to explain the AT bias on TEs include a) mutational
bias or natural selection acting on silent changes, b) influence of the site of insertion,
since some TEs have shown preferences for specific DNA configuration, for instance
low recombination regions, and c) inactivation of host genomes to limit TE invasion
with processes like methylation or co-suppression. The underlying mechanism by
which mobile elements have higher AT content still remains unknown.
Ancient cospeciation of Galileo and Drosophila species
In this study we tested the cospeciation hypothesis in Galileo and its host
Drosophila species by comparing the phylogeny inferred for Galileo and the
phylogeny inferred for host species. The results (Figures 14 and 15) are highly
consistent with a long-term historical association of transposons and their hosts. This
was corroborated with detection of the element in several populations of the
Sophophora subgenus from Asia, where the ancestor of the subgenus had its origin
ca. 40-56 Mya. The fact that Galileo TPases were amplified by PCR on samples of
Old world and New world Sophophora species strongly suggests that the element is
still active on these species. In addition ARR analysis of Galileo (Figure 8) also
determined that the MRCA of Sophophora subgenus harbored Galileo in its genome.
This is consistent with the hypothesis that TEs are ancient components of eukaryotic
genomes (Kidwell 2002). It is notable that Galileo mirrored the phylogeny of its host,
which is indicative of the cospeciation events between Galileo and its host. The
results found here are not in agreement with genome wide-screenings that have

CHAPTER 3
121
postulated a young origin of TEs families in Drosophila, in which the origin of TEs
families is dated to be much more younger than for host species (Bowen & McDonald
2001; Bartolomé et al. 2009).
Horizontal transfer in the evolutionary dynamics of Galileo
Three kinds of evidence are generally used to infer HT of TEs: (i)
discontinuous occurrence or patchy distribution, (ii) incongruence between host and
TE phylogenies (iii) high sequence similarity between very distantly related species.
All these three evidences have been found in this study. Alternative explanations for
evidences (i) and (ii) such as ancestral polymorphism, inequality of substitutions rates
in TE from different species are hard to dismiss conclusively (Loreto et al. 2008;
Capy et al. 1998).
However a conclusive evidence of HT event can be inferred whenever the
divergence among TE sequences is significantly lower than that observed for host
genes under similar or higher selective constraints than those operating on the TEs
themselves (Silva & Kidwell 2000). The cophylogenetic analysis of Galileo-
Drosophila host species and the comparison of dS values are consistent with punctual
HT events during the long-term evolutionary history of Galileo.
The dS values plotted for ten host species groups (Figure 13) shows that there
are three cases in which Galileo divergence is significantly lower than the divergence
of mitochondrial and nuclear genes in their host species. There are clearly many
assumptions behind these estimates (e.g. G+C content or codon bias), and divergence
rates can vary across lineages. Nevertheless, the dS estimates found here are
comparable with those obtained from Silva & Kidwell (2000) in the analysis of

CHAPTER 3
122
divergence values from P element and three nuclear genes. In their study, the average
value for dS observed for the element was 5 to 10 times smaller than that for host
genes. Here, the dS value for Galileo is ca. 8 times smaller than the dS value for the
nuclear gene SinA and ca. 4 times smaller compared with the mitochondrial genes
COI, COII and ND2.
Besides the evidences of HT found in the long-term evolutionary dynamics of
Galileo; geographical, temporal and ecological overlapping between donor and
recipient species must have happened so that HT events have been possible. Three
events were detected in species from subgenera Siphlodora and Drosophila that
intermingled in the willistoni-saltans clade belonging to the Sophophora subgenus. It
has been estimated that these three subgenera split ca. 56 Mya (Russo et al. 2013).
The taxa involved in HT events from different subgenera were: Drosophila virilis,
Drosophila americana (virilis group); Drosophila mediopictoides, Drosophila
paramediostriata (tripunctata group) and D. subbadia (guarani group).
According to the results obtained in the cophylogenetic analysis (Figures 14
and 15), Drosophila equinoxialis is the more likely donor species for HT events.
Remarkably, the willistoni species group, particularly the willistoni subgroup (to
which D. equinoxialis belong), has been proposed as a source of donor species in HT
events of P elements within the genus Drosophila (Daniels et al. 1990).
Regarding the distribution and ecology of host species groups involved in HT
events, the virilis lineage is one of the 30 species groups within the virilis-repleta
radiation (Throckmorton 1975). Thirteen species are currently recognized in the virilis
species group. Drosophila virilis and D. americana are closely related species (Spicer
& Bell 2002; Powell 1997; Morales-Hojas et al. 2011). Southeastern Asia has been

CHAPTER 3
123
postulated as the original geographical region for the virilis group (Throckmorton
1982). Drosophila virilis is one of the most ancestral lineages within the group
(Caletka & McAllister 2004), originated in Asia and subsequently expanded to other
regions of the world (Mirol et al. 2008). Nowadays, D. virilis is a widespread
cosmopolitan species. Drosophila americana is widely distributed across Central and
Eastern regions from North America (Fonseca et al. 2013). The time of divergence
between D. virilis and D. americana has been estimated in ca. 4.1 Mya (Morales-
Hojas et al. 2011).
The tripunctata species group encompasses ca. 78 species (Brake & Bächli
2008) and is considered one the most prolific forest dwelling groups of the
Neotropical Region (Bächli et al. 2005; Vilela 1992). It was proposed that tripunctata
and the calloptera, guarani, pallidipennis and cardini species groups diversified in
the Neotropics during the so called tripunctata radiation (Throckmorton 1975; Da
Lage et al. 2007). With the only exception of D. tripunctata, that is also found in
North America (Jaenike 1987), this group is ubiquitous in tropical (Vilela 1992) and
Andean forests (Acurio & Rafael 2009) of South America. Drosophila mediopictoides
and D. paramediostriata are sibling species (Robe et al. 2010). The monophyly of the
tripunctata radiation as a whole has been questioned because usually sister species
groups such as guarani, appear intermingled in phylogenetic analyses (Remsen &
O’Grady 2002; Robe et al. 2005; Hatadani et al. 2009; Robe et al. 2010).
The guarani species group encompasses around 12 species and is widely
distributed in the Neotropical region (Ratcov & Vilela 2007; Vilela & Bächli 1990).
Drosophila subbadia belongs to the guarani subgroup, one of the two subgroups
recognized in the guarani group (King 1947; Robe et al. 2002). Drosophila subbadia

CHAPTER 3
124
is a forest-dwelling species distributed in South America and Central Mexico (King
1947; Bächli 2013).
The willistoni species group encompasses ca. 23 species and saltans species
group has ca. 21 species (Bächli 2013). According several authors (Throckmorton
1975; Russo et al. 2013; Powell 1997) , the tropical split of the subgenus Sophophora
gave rise to the present Old World clade and the New World clade that include the
willistoni and saltans groups. These two groups are endemic from Central and South
America with a few lineages dispersed to Southern Mexico (Bächli 2013; Russo et al.
2013; Spassky et al. 1971).
The fact that the species from the willistoni, saltans, tripunctata and guarani
species groups are endemic from South America suggests two possible places in the
Neotropics where HT events could have happened: (i) Forested areas from South
America, where the donor species from willistoni subgroup and recipient species from
tripunctata and guarani species group are endemic and live in sympatry. (ii) Central
America, the Northern limit distribution of the willistoni subgroup according to
Spassky et al. (1971) and the Southern limit distribution of D. americana.
CONCLUSION
In this study the comprehensive search for the transposon Galileo has been
performed in 113 species of Drosophilidae. The element was unequivocally detected
in 51 Drosophila species using the most conserved region of its TPase. A total of 152
samples with a worldwide distribution in which Galileo was detected were cloned and
sequenced to build a phylogenetic tree of the element. Simultaneously, the phylogeny
of 174 from 31 species groups of Drosophilidae was inferred from partial coding
sequences of genes COI, COII, ND2, SinA. The comparison of Galileo-Drosophila

CHAPTER 3
125
host species phylogenies undercover the long-term historical association of this
transposon with its host Drosophila species. This was corroborated with detection of
the element in several populations of the Sophophora from Asia, where it is thought
the ancestor of the subgenus has its origin ca. 40-56 Mya. The significant match
found between host-and transposon phylogenies reveal cospeciation of Galileo in
Drosophila and ancestral horizontal transfer events that involve the willistoni,
tripunctata, guarani and virilis species groups.

CHAPTER 3
126
REFERENCES
Abrusán, G. & Krambeck, H.-J., 2006. Competition may determine the diversity of transposable elements. Theoretical population biology, 70(3), pp.364–375.
Acurio, A. et al., 2013. Description of a New Spotted-Thorax Drosophila (Diptera: Drosophilidae) Species and its Evolutionary Relationships Inferred by a Cladistic Analysis of Morphological Traits. Annals of the Entomological Society of America, 106(6), pp.695–705.
Acurio, A. & Rafael, V., 2009. Diversity and geographical distribution of Drosophila (Diptera, Drosophilidae) in Ecuador. Drosophila Information Service, 92, pp.20–25.
Acurio, A., Rafael, V. & Dangles, O., 2010. Biological Invasions in the Amazonian Tropical Rain Forest: The Case of Drosophilidae (Insecta, Diptera) in Ecuador, South America. Biotropica, 42(6), pp.717–723.
Anisimova, M. & Gascuel, O., 2006. Approximate Likelihood-Ratio Test for Branches: A Fast, Accurate, and Powerful Alternative. Systematic Biology , 55 (4 ), pp.539–552.
Arnaud, F. et al., 2007. A paradigm for virus–host coevolution: sequential counter-adaptations between endogenous and exogenous retroviruses. PLoS pathogens, 3(11), p.e170.
Bächli, G., 2013. TaxoDros:The database on Taxonomy of Drosophilidae. Available at: http://taxodrosunizh.ch/.
Bächli, G. et al., 2005. The Drosophilidae (Diptera) of Fennoscandia and Denmark, Brill.
Bao, W. et al., 2009. New Superfamilies of Eukaryotic DNA Transposons and Their Internal Divisions. Molecular Biology and Evolution , 26 (5 ), pp.983–993.
Bartolomé, C., Bello, X. & Maside, X., 2009. Widespread evidence for horizontal transfer of transposable elements across Drosophila genomes. Genome biology, 10(2), p.R22.
Bock, I.R. & Parsons, P.A., 1978. The subgenus Scaptodrosophila (Diptera: Drosophilidae). Systematic Entomology, 3(2), pp.91–102.
Bowen, N.J. & McDonald, J.F., 2001. Drosophila Euchromatic LTR Retrotransposons are Much Younger Than the Host Species in Which They Reside. Genome Research , 11 (9 ), pp.1527–1540.
Brake, I. & Bächli, G., 2008. Drosophilidae (Diptera) World Catalogue of Insects, Stenstrup: Apollo Books.
Brookfield, J.F.Y., 2005. The ecology of the genome [mdash] mobile DNA elements and their hosts. Nat Rev Genet, 6(2), pp.128–136.
Brunet, F. et al., 1994. The mariner transposable element in the Drosophilidae family. Heredity, 73(4), pp.377–385.
Cáceres, M. et al., 1999. Generation of a Widespread Drosophila Inversion by a Transposable Element. Science , 285 (5426 ), pp.415–418.

CHAPTER 3
127
Cáceres, M., Puig, M. & Ruiz, A., 2001. Molecular Characterization of Two Natural Hotspots in the Drosophila buzzatii Genome Induced by Transposon Insertions. Genome Research , 11 (8 ), pp.1353–1364.
Caletka, B.C. & McAllister, B.F., 2004. A genealogical view of chromosomal evolution and species delimitation in the Drosophila virilis species subgroup. Mol Phyl Evol, 33(3), pp.664–670.
Capy, P. et al., 1998. Dynamics and Evolution of Transposable Elements, Austin: Thompson Learning.
Capy, P., Anxolabéhère, D. & Langin, T., 1994. The strange phylogenies of transposable elements: are horizontal transfers the only explanation? Trends in Genetics, 10(1), pp.7–12.
Casals, F. et al., 2005. Molecular Characterization and Chromosomal Distribution of Galileo, Kepler and Newton, Three Foldback Transposable Elements of the Drosophila buzzatii Species Complex. Genetics , 169 (4 ), pp.2047–2059.
Casals, F., Cáceres, M. & Ruiz, A., 2003. The Foldback-like Transposon Galileo Is Involved in the Generation of Two Different Natural Chromosomal Inversions of Drosophila buzzatii. Molecular Biology and Evolution , 20 (5 ), pp.674–685.
Charleston, M.A. & Page, R.D.M., 2002. TreeMap. v. 2.0. 2. Software distributed by authors.
Charleston, M.A. & Robertson, D.L., 2002. Preferential Host Switching by Primate Lentiviruses Can Account for Phylogenetic Similarity with the Primate Phylogeny. Systematic Biology , 51 (3 ), pp.528–535.
Charlesworth, B., Sniegowski, P. & Stephan, W., 1994. The evolutionary dynamics of repetitive DNA in eukaryotes. Nature, 371(6494), pp.215–220.
Clark, A.G. et al., 2007. Evolution of genes and genomes on the Drosophila phylogeny. Nature, 450(7167), pp.203–218.
Clark, J.B., Maddison, W.P. & Kidwell, M.G., 1994. Phylogenetic analysis supports horizontal transfer of P transposable elements. Molecular Biology and Evolution , 11 (1 ), pp.40–50.
Clark, M.A. et al., 2000. Cospeciation between bacterial endosymbionts (Buchnera) and a recent radiation of Aphids (Uroleucon) and pitfalls of testing for phylogenetic congruence. Evolution, 54(2), pp.517–525.
Daniels, S.B., Peterson, K.R., et al., 1990. Evidence for horizontal transmission of the P transposable element between Drosophila species. Genetics , 124 (2 ), pp.339–355.
Daniels, S.B., Chovnick, A. & Boussy, I.A., 1990. Distribution of hobo transposable elements in the genus Drosophila. Molecular Biology and Evolution , 7 (6 ), pp.589–606.
Darriba, D. et al., 2012. jModelTest 2: more models, new heuristics and parallel computing. Nat Meth, 9(8), p.772.
CHAPTER 3
128
Darwin, C., 1859. On the origin of species by means of natural selection, or the preservation of favoured races in the struggle for life 1st editio. J. Murray, ed., London.
Darwin, C., 1877. The various contrivances by which orchids are fertilised by insects 2nd ed. J. Murray, ed., London.
Delprat, A. et al., 2009. The Transposon Galileo Generates Natural Chromosomal Inversions in Drosophila by Ectopic Recombination. PLoS ONE, 4(11), p.e7883.
DeSalle, R. et al., 1987. Tempo and mode of sequence evolution in mitochondrial DNA of HawaiianDrosophila. Journal of Molecular Evolution, 26(1-2), pp.157–164.
DeSalle, R., 1992. The phylogenetic relationships of flies in the family Drosophilidae deduced from mtDNA sequences. Molecular Phylogenetics and Evolution, 1(1), pp.31–40.
Doolittle, W.F. & Sapienza, C., 1980. Selfish genes, the phenotype paradigm and genome evolution. Nature, 284(5757), pp.601–603.
Drummond, A.J. et al., 2012a. Bayesian Phylogenetics with BEAUti and the BEAST 1.7. Molecular Biology and Evolution, 29, pp.1969–1973.
Drummond, A.J. et al., 2012b. Bayesian Phylogenetics with BEAUti and the BEAST 1.7. Molecular biology and evolution, 29(8).
Drummond, A.J. et al., 2011. Geneious. , 5.4.
Drummond, A.J. & Rambaut, A., 2007. BEAST: Bayesian evolutionary analysis by sampling trees. BMC Evol Biol, 7.
Ehrlich, R. & Raven, H., 1964. Butterflies and Plants: A study in Coevolution. Evolution, 18(4), pp.586–608.
Fahrenholz, H., 1913. Ectoparasiten und Abstammungslehre. Zoologischer Anzeiger, (41), pp.371–374.
Feschotte, C. & Pritham, E.J., 2007. DNA Transposons and the Evolution of Eukaryotic Genomes. Annual Review of Genetics, 41(1), pp.331–368.
Fletcher, W. & Yang, Z., 2010. The Effect of Insertions, Deletions, and Alignment Errors on the Branch-Site Test of Positive Selection. Molecular biology and evolution, 27(10), pp.2257–2267.
Fonseca, N.A. et al., 2013. Drosophila americana as a Model Species for Comparative Studies on the Molecular Basis of Phenotypic Variation. Genome Biology and Evolution , 5 (4 ), pp.661–679.
Fontdevila, A., 2011. The dynamic genome: a Darwinian approach, Oxford University Press.
Giribet, G., 2005. TNT: Tree Analysis Using New Technology. Systematic Biology , 54 (1 ), pp.176–178.

CHAPTER 3
129
Goloboff, P.A., Mattoni, C.I. & Quinteros, A.S., 2006. Continuous characters analyzed as such. Cladistics, 22(6), pp.589–601.
Gonçalves, J. et al., 2014. Structural and sequence diversity of the transposon Galileo in the Drosophila willistoni genome. BMC Genomics, 15(792).
Goto, S.G. & Kimura, M.T., 2001. Phylogenetic utility of mitochondrial COI and nuclear Gpdh genes in Drosophila. Molecular phylogenetics and evolution, 18(3), pp.404–22.
Grantham, R. et al., 1980. Codon catalog usage and the genome hypothesis. Nucleic acids research, 8(1), p.197.
Grimaldi, D.A., 1990. A phylogenetic, revised classification of genera in the Drosophilidae (Diptera) L. H. Throckmorton & T. Okada, eds. Bulletin of the American Museum of Natural History, (197), pp.1–139.
Guindon, S. et al., 2010. New algorithms and methods to estimate maximum-likelihood phylogenies: assessing the performance of PhyML 3.0. Systematic biology, 59(3), pp.307–21.
Hatadani, L.M. et al., 2009. Molecular phylogeny of the Drosophila tripunctata and closely related species groups (Diptera: Drosophilidae). Molecular phylogenetics and evolution, 51(3), pp.595–600.
Hennig, W., 1966. Phylogenetic Systematics, Urbana, USA.: Univ. Illinois Press.
Hickey, D.A., 1982. SELFISH DNA: A SEXUALLY-TRANSMITTED NUCLEAR PARASITE. Genetics , 101 (3-4 ), pp.519–531.
Holt, B.G. et al., 2013. An Update of Wallace’s Zoogeographic Regions of the World. Science , 339 (6115 ), pp.74–78.
Hua-Van, A. et al., 2011. The struggle for life of the genome’s selfish architects. Biology direct, 6(1), p.19.
ICZN, 2010. OPINION 2245 (Case 3407) Drosophila Fallén, 1823 (Insecta, Diptera): Drosophila funebris Fabricius, 1787 is maintained as the type species. Bulletin of Zoological Nomenclature, 67(1).
Jackson, A.P. & Charleston, M.A., 2004. A Cophylogenetic Perspective of RNA–Virus Evolution. Molecular Biology and Evolution , 21 (1 ), pp.45–57.
Jaenike, J., 1987. Genetics of oviposition-site preference in Drosophila tripunctata. Heredity, 59(Pt 3), pp.363–369.
Jia, J. & Xue, Q., 2009. Codon usage biases of transposable elements and host nuclear genes in Arabidopsis thaliana and Oryza sativa. Genomics, proteomics & bioinformatics, 7(4), pp.175–84.
Kapitonov, V. V & Jurka, J., 2008. A universal classification of eukaryotic transposable elements implemented in Repbase. Nat Rev Genet, 9(5), pp.411–412.

CHAPTER 3
130
Katoh, K., Asimenos, G. & Toh, H., 2009. Multiple Alignment of DNA Sequences with MAFFT. In D. Posada, ed. Bioinformatics for DNA Sequence Analysis. Methods in Molecular Biology. Humana Press, pp. 39–64.
Kidwell, M.G., 2002. Transposable elements and the evolution of genome size in eukaryotes. Genetica, 115(1), pp.49–63.
Kidwell, M.G. & Lisch, D., 1997. Transposable elements as sources of variation in animals and plants. Proceedings of the National Academy of Sciences, 94(15), pp.7704–7711.
Kidwell, M.G. & Lisch, D.R., 2001. Perspective: transposable elements, parasitic DNA, and genome evolution. Evolution, 55(1), pp.1–24.
King, J.C., 1947. A comparative analysis of the chromosomes of the guarani group of Drosophila. Evolution, pp.48–62.
Kopp, A., 2006. Basal relationships in the Drosophila melanogaster species group. Molecular phylogenetics and evolution, 39(3), pp.787–98.
Lachaise, D. et al., 1988. Historical Biogeography of the Drosophila melanogaster Species Subgroup. In M. Hecht, B. Wallace, & G. Prance, eds. Evolutionary Biology SE - 4. Evolutionary Biology. Springer US, pp. 159–225.
Da Lage, J.-L. et al., 2007. A phylogeny of Drosophilidae using the Amyrel gene: questioning the Drosophila melanogaster species group boundaries. Journal of Zoological Systematics and Evolutionary Research, 45(1), pp.47–63.
Larkin, M.A. et al., 2007. Clustal W and Clustal X version 2.0. Bioinformatics, 23(21), pp.2947–2948.
Lee, Y.C.G. & Langley, C.H., 2012. Long-Term and Short-Term Evolutionary Impacts of Transposable Elements on Drosophila. Genetics , 192 (4 ), pp.1411–1432.
Leonardo, T.E. & Nuzhdin, S. V, 2002. Intracellular battlegrounds: conflict and cooperation between transposable elements. Genetics Research, 80(03), pp.155–161.
Lerat, E., Biémont, C. & Capy, P., 2000. Codon Usage and the Origin of P Elements. Molecular Biology and Evolution , 17 (3 ), pp.467–468.
Lerat, E., Capy, P. & Biémont, C., 2002. Codon Usage by Transposable Elements and Their Host Genes in Five Species. Journal of Molecular Evolution, 54(5), pp.625–637.
Lewis, P.O., 2001. A Likelihood Approach to Estimating Phylogeny from Discrete Morphological Character Data. Systematic Biology , 50 (6 ), pp.913–925.
Van Der Linde, K. et al., 2010. A supermatrix-based molecular phylogeny of the family Drosophilidae. Genetics Research, 92(01), pp.25–38.
Van Der Linde, K. et al., 2007. Case 3407: Drosophila Fallen, 1832 (Insecta, Diptera): proposed conservation of usage. Bulletin of Zoological Nomenclature, 64(4), pp.238–242.
CHAPTER 3
131
Van der Linde, K. & Houle, D., 2008. A supertree analysis and literature review of the genus Drosophila and closely related genera (Diptera, Drosophilidae). Insect Systematics and Evolution, 39(3), pp.241–267.
Lisch, D., 2013. How important are transposons for plant evolution? Nat Rev Genet, 14(1), pp.49–61.
Liu, K. et al., 2012. SATé-II: Very Fast and Accurate Simultaneous Estimation of Multiple Sequence Alignments and Phylogenetic Trees. Systematic Biology, 61(1), pp.90–106.
Loreto, E.L.S., Carareto, C.M.A. & Capy, P., 2008. Revisiting horizontal transfer of transposable elements in Drosophila. Heredity, 100(6), pp.545–554.
Lynch, M. & Conery, J.S., 2003. The Origins of Genome Complexity. Science , 302 (5649 ), pp.1401–1404.
Maddison, W.P. & Maddison, D.R., 2010. Mesquite: a modular system for evolutionary analysis, version 2.74.
Martin, D.P. et al., 2010. RDP3: a flexible and fast computer program for analyzing recombination. Bioinformatics (Oxford, England), 26(19), pp.2462–3.
Maruyama, K. & Hartl, D.L., 1991. Evolution of the transposable element mariner in Drosophila species. Genetics , 128 (2 ), pp.319–329.
Marzo, M., Liu, D., et al., 2013. Identification of multiple binding sites for the THAP domain of the< i> Galileo</i> transposase in the long terminal inverted-repeats. Gene, 525(1), pp.84–91.
Marzo, M., Bello, X., et al., 2013. Striking structural dynamism and nucleotide sequence variation of the transposon Galileo in the genome of Drosophila mojavensis. Mobile DNA, 4(6).
Marzo, M. et al., 2008. The Foldback-like element Galileo belongs to the P superfamily of DNA transposons and is widespread within the Drosophila genus. Proceedings of the National Academy of Sciences of the United States of America, 105(8), pp.2957–2962.
Mayr, E., 1996. What Is a Species, and What Is Not? Philosophy of Science, 63(2), pp.262–277.
McClintock, B., 1950. The origin and behavior of mutable loci in maize. Proceedings of the National Academy of Sciences , 36 (6 ), pp.344–355.
McClintock, B., 1984. The significance of responses of the genome to challenge. Science , 226 (4676 ), pp.792–801.
McEvey, S.F. et al., 2008. Comments on the proposed conservation of usage of Drosophila Fallén, 1823 (Insecta, Diptera) 6 (Case 3407). Bulletin of Zoological Nomenclature, 65(2), pp.147–150.
Miller, M.A., Pfeiffer, W. & Schwartz, T., 2010. Creating the CIPRES Science Gateway for inference of large phylogenetic trees. In Proceedings of the Gateway Computing Environments Workshop (GCE). pp. 1–8.

CHAPTER 3
132
Mirol, P.M. et al., 2008. Signals of demographic expansion in Drosophila virilis. BMC evolutionary biology, 8(59), pp.doi:10.1186/1471–2148–8–59.
Montooth, K.L. et al., 2009. Comparative genomics of Drosophila mtDNA: novel features of conservation and change across functional domains and lineages. Journal of molecular evolution, 69(1), pp.94–114.
Morales-Hojas, R. et al., 2011. Resolving the phylogenetic relationships and evolutionary history of the Drosophila virilis group using multilocus data. Molecular phylogenetics and evolution, 60(2), pp.249–258.
Morán, T. & Fontdevila, A., 2005. Phylogeny and molecular evolution of the< i> Drosophila hydei</i> subgroup (< i> Drosophila repleta</i> group) inferred from the< i> Xanthine dehydrogenase</i> gene. Molecular phylogenetics and evolution, 36(3), pp.695–705.
Moriyama, E. et al., 1991. Mutation pattern of human immunodeficiency virus genes. Journal of Molecular Evolution, 32(5), pp.360–363.
Moriyama, E. & Powell, J., 1997. Synonymous substitution rates in Drosophila: Mitochondrial versus nuclear genes. Journal of Molecular Evolution, 45(4), pp.378–391.
Moriyama, E.N. & Hartl, D.L., 1993. Codon usage bias and base composition of nuclear genes in Drosophila. Genetics, 134(3), pp.847–858.
O’Grady, P.M. et al., 2008. Comments on the proposed conservation of usage of Drosophila Fallén, 1823 (Insecta, Diptera) 3 (Case 3407). Bulletin of Zoological Nomenclature, 65(2), pp.141–144.
O’Grady, P.M., 2010. Whither Drosophila? Genetics , 185 (2 ), pp.703–705.
O’Grady, P.M. & Kidwell, M.G., 2002. Phylogeny of the subgenus sophophora (Diptera: drosophilidae) based on combined analysis of nuclear and mitochondrial sequences. Molecular phylogenetics and evolution, 22(3), pp.442–53.
O’Grady, P.M. & Markow, T.A., 2009. Phylogenetic taxonomy in Drosophila: Problems and prospects. fly, 3(1), pp.10–14.
Okada, T., 1989. A proposal of establishing tribes for the family Drosophilidae with key to tribes and genera (Diptera). Zoological Science, (6), pp.391–399.
Oliveira, D.C.S.G. et al., 2005. Molecular systematics and geographical distribution of the Drosophila longicornis species complex (Diptera : Drosophilidae). Zootaxa, (1069), pp.1–32.
Oliveira, D.C.S.G., Almeida, F.C., O’Grady, P.M., Armella, M.A., DeSalle, R., et al., 2012. Monophyly, divergence times, and evolution of host plant use inferred from a revised phylogeny of the Drosophila repleta species group. Molecular phylogenetics and evolution, 64(3), pp.533–544.
Oliveira, D.C.S.G., Almeida, F.C., O’Grady, P.M., Armella, M.A., Desalle, R., et al., 2012. Monophyly, divergence times, and evolution of host plant use inferred from a revised

CHAPTER 3
133
phylogeny of the Drosophila repleta species group. Molecular phylogenetics and evolution, 64(3).
Orgel, L.E. & Crick, F.H.C., 1980. Selfish DNA: the ultimate parasite. Nature, 284(5757), pp.604–607.
Page, R. & Hafner, M., 1996. Molecular phylogenies and host-parasite cospeciation: Gophers and lice as a model system. In Harvey P.H. et al., eds. Oxford: Oxford University Press, pp. 255–270.
Page, R.D.M., 2003. Tangled Trees: Phylogeny, Cospeciation, and Coevolution, University of Chicago Press.
Page, R.D.M. & Charleston, M.A., 1998. Trees within trees: phylogeny and historical associations. Trends in Ecology & Evolution, 13(9), pp.356–359.
Patterson, J.T. & Stone, W.S., 1952. Evolution in the genus Drosophila, New York: The Macmillan Company.
Pélandakis, M., Higgins, D.G. & Solignac, M., 1991. Molecular phylogeny of the subgenus Sophophora of Drosophila derived from large subunit of ribosomal RNA sequences. Genetica, 84(2), pp.87–94.
Polaszek, A., 2008. Comments on the proposed conservation of the usage of the generic name of Drosophila Fallén, 1823 (Insecta, Diptera) 1 (Case 3407). Bulletin of Zoological Nomenclature, 65, p.55.
Posada, D., 2008. jModelTest: Phylogenetic model averaging. Mol Biol Evol, 25, pp.1253–1256.
Powell, J.R., 1997. Progress and prospects in evolutionary biology: the {D}rosophila model, New York: Oxford University Press.
Ratcov, V. & Vilela, C.R., 2007. A new Neotropical species of spot-thoraxed Drosophila (Diptera, Drosophilidae). Revista Brasileira de Entomologia, 51(3), pp.305–311.
Remsen, J. & O’Grady, P., 2002. Phylogeny of Drosophilinae (Diptera: Drosophilidae), with comments on combined analysis and character support. Molecular phylogenetics and evolution, (24(2)), pp.249–264.
Robe, L.J. et al., 2005. Molecular phylogeny of the subgenus< i> Drosophila</i>(Diptera, Drosophilidae) with an emphasis on Neotropical species and groups: A nuclear versus mitochondrial gene approach. Molecular phylogenetics and evolution, 36(3), pp.623–640.
Robe, L.J., Loreto, E.L.S. & Valente, V.L.S., 2010. Radiation of the ,,Drosophila“ subgenus (Drosophilidae, Diptera) in the Neotropics. Journal of Zoological Systematics and Evolutionary Research, 48(4), pp.310–321.
Robe, L.J., Silva, L.B. da & Loreto, E.L. da S., 2002. Phylogenetic relationships among four species of the guarani group of Drosophila (Diptera, Drosophilidae) as inferred by molecular and morphological analyses . Revista Brasileira de Entomologia , 46 , pp.515–519.

CHAPTER 3
134
Robertson, H.M., 1993. The mariner transposable element is widespread in insects. Nature, 362(6417), pp.241–245.
Robertson, H.M. & Lampe, D.J., 1995. Distribution of Transposable Elements in Arthropods. Annual Review of Entomology, 40(1), pp.333–357.
Roisin, Y., 2008. Comments on the proposed conservation of the usage of the generic name of Drosophila Fallén, 1823 (Insecta, Diptera) 1 (Case 3407). Bulletin of Zoological Nomenclature, 65, p.215.
Le Rouzic, A., Boutin, T.S. & Capy, P., 2007. Long-term evolution of transposable elements. Proceedings of the National Academy of Sciences , 104 (49 ), pp.19375–19380.
Le Rouzic, A. & Capy, P., 2006. Population genetics models of competition between transposable element subfamilies. Genetics, 174(2), pp.785–793.
Le Rouzic, A. & Capy, P., 2005. The First Steps of Transposable Elements Invasion Parasitic Strategy vs. Genetic Drift. Genetics, 169(2), pp.1033–1043.
Le Rouzic, A. & Deceliere, G., 2005. Models of the population genetics of transposable elements. Genetics Research, 85(03), pp.171–181.
Le Rouzic, A., Dupas, S. & Capy, P., 2007. Genome ecosystem and transposable elements species. Gene, 390(1-2), pp.214–20.
Ruiz, A. et al., 1997. Chromosomal evolution and comparative gene mapping in the Drosophila repleta species group. Revista brasileira de genética, 20(4), pp.553–565.
Russo, C. a. M. et al., 2013. Phylogenetic analysis and a time tree for a large drosophilid data set (Diptera: Drosophilidae). Zoological Journal of the Linnean Society, 169(4), pp.765–775.
Russo, C.A.M., Takezaki, N. & Nei, M., 1995. Molecular Phylogeny and Divergence Times of Drosophilid Species. Molecular biology and evolution, 12(3).
Sacristán, S. et al., 2009. Coevolution between a family of parasite virulence effectors and a class of LINE-1 retrotransposons. PLoS One, 4(10), p.e7463.
Satta, Y., Ishiwa, H. & Chigusa, S.I., 1987. Analysis of nucleotide substitutions of mitochondrial DNAs in Drosophila melanogaster and its sibling species. Molecular biology and evolution, 4(6), pp.638–650.
Schlötterer, C., Vieira, J. & Fonseca, N.A., 2013. The Drosophila americana genome Blast tool. Available at: http://cracs.fc.up.pt/~nf/dame/dame_blast.html.
Sharp, P.M. & Simmonds, P., 2011. Evaluating the evidence for virus/host co-evolution. Current opinion in virology, 1(5), pp.436–441.
Spassky, B. et al., 1971. Geography of the sibling species related to Drosophila willistoni, and of the semispecies of the Drosophila paulistorum complex. Evolution, pp.129–143.

CHAPTER 3
135
Spicer, G.S. & Bell, C.D., 2002. Molecular Phylogeny of the Drosophila virilis Species Group (Diptera: Drosophilidae) Inferred from Mitochondrial 12S and 16S Ribosomal RNA Genes. Annals of the Entomological Society of America, 95(2), pp.156–161.
St Pierre, S.E. et al., 2014. FlyBase 102--advanced approaches to interrogating FlyBase. Nucleic Acids Research, 42(1), pp.780–788.
Sturtevant, A.H., 1915. A Sex-Linked Character in Drosophila repleta. The American Naturalist, 49(579), pp.189–192.
Sturtevant, A.H., 1942. The classification of the genus Drosophila, with description of nine new species. In University of Texas Publications, pp. 5–51.
Switzer, W.M. et al., 2005. Ancient co-speciation of simian foamy viruses and primates. Nature, 434(7031), pp.376–380.
Tamura, K. et al., 2007. MEGA4: Molecular Evolutionary Genetics Analysis (MEGA) Software Version 4.0. Molecular Biology and Evolution , 24 (8 ), pp.1596–1599.
Tamura, K., 1992. The rate and pattern of nucleotide substitution in Drosophila mitochondrial DNA. Molecular Biology and Evolution, 9(5), pp.814–825.
Thompson, J.N., 1982. Interaction and Coevolution, University of Chicago Press.
Throckmorton, L.H., 1982. Pathways of evolution in the genus Drosophila and the founding of the repleta group. In Ecological Genetics and Evolution. Australia: Academic Press, pp. 33–47.
Throckmorton, L.H., 1975. The phylogeny, ecology and geography of Drosophila . In R. C. King, ed. Handbook of Genetics. New York: Plenum, pp. 421–469.
Throckmorton, L.H., 1962. The problem of phylogeny in the genus Drosophila. University of Texas Publications, (6205), pp.207–344.
Turelli, P. et al., 1997. dUTPase-minus caprine arthritis-encephalitis virus is attenuated for pathogenesis and accumulates G-to-A substitutions. Journal of Virology , 71 (6 ), pp.4522–4530.
Venner, S., Feschotte, C. & Biémont, C., 2009. Dynamics of transposable elements: towards a community ecology of the genome. Trends in genetics : TIG, 25(7), pp.317–23.
Vieira, C. et al., 1999. Wake up of transposable elements following Drosophila simulans worldwide colonization. Molecular biology and evolution, 16(9), pp.1251–1255.
Vilela, C.R., 1983. A revision of the Drosophila repleta species group (Diptera, Drosophilidae). Revista Brasileira de Entomologia, 27, pp.1–114.
Vilela, C.R., 1992. On the Drosophila tripunctata species group (Diptera, Drosophilidae). Revista Brasileira de Entomologia, 36, pp.197–221.
Vilela, C.R. & Bächli, G., 1990. Taxonomic studies on neotropical species of seven genera of Drosophilidae (Diptera), Zurich: Mitteilungen der Schweizerischen Entomologischen Gesellschaft.
CHAPTER 3
136
Wasserman, M., 1982. The repleta species group. In M. Ashburner, J. N. Thompson, & H. L. Carson, eds. The Genetics and Biology of Drosophila. New York: Academic Press, pp. 61–140.
Wharton, L.H., 1942. Analysis of the repleta group of Drosophila. University of Texas Publications, 4228, pp.23–52.
Wicker, T. et al., 2007. A unified classification system for eukaryotic transposable elements. Nat Rev Genet, 8(12), pp.973–982.
Woolhouse, M.E.J. et al., 2002. Biological and biomedical implications of the co-evolution of pathogens and their hosts. Nat Genet, 32(4), pp.569–577.
Yassin, A., 2008. Comments on the proposed conservation of the usage of the generic name of Drosophila Fallén, 1823 (Insecta, Diptera) 2 (Case 3407). Bulletin of Zoological Nomenclature, 65(1).
Yassin, A., 2013. Phylogenetic classification of the Drosophilidae Rondani (Diptera): the role of morphology in the postgenomic era. Systematic Entomology, 38(2), pp.349–369.
Yuan, Y.-W. & Wessler, S.R., 2011. The catalytic domain of all eukaryotic cut-and-paste transposase superfamilies. Proceedings of the National Academy of Sciences, 108(19), pp.7884–7889.
Zsiros, J. et al., 1999. Biased nucleotide composition of the genome of HERV-K related endogenous retroviruses and its evolutionary implications. Journal of molecular evolution, 48(1), pp.102–111.

SUPPLEMENTARY MATERIAL CHAPTER 3
137
SUPPLEMENTARY MATERIAL
Table S1. Source and GenBank accession numbers for COI, COII, ND2 and SinA sequences of 174 taxa analyzed in this study.
Genus Taxon Voucher ID COI Voucher ID COII Voucher ID ND2 Voucher ID SinA 1 Drosophila acanthoptera 105622 EU493598 105622 EU493728 105622 EU494332 101823 EU341611 2 Drosophila adunca 105818 EU493644 105818 EU493773 105818 EU493520 105818 O' Grady, P. 3 Drosophila affinis 107540 EU493629 107540 EU493758 Unspecified EF216219 107540 O' Grady, P. 4 Drosophila aldrichi 119140 EU341603 Unspecified JF736117 119140 EU341702 101824 EU341603 5 Drosophila ambigua 107547 EU493630 107547 EU493889 107547 EU493513 107547 O' Grady, P. 6 Drosophila ambochila ---- ---- 109433 EU493776 109433 EU493522 109433 O' Grady, P. 7 Drosophila americana Unspecified DQ471597 Unspecified AY646735 Unspecified DQ471524 G9648 AY851033 8 Drosophila ananassae Unspecified BK006336 Unspecified BK006336 Unspecified BK006336 7217 whole genome 9 Drosophila anceps Unspecified JF736059 Unspecified JF736093 Unspecified JF736133 Unspecified JF736324
10 Drosophila aracataca Unspecified JF736077 Unspecified JF736116 Unspecified DQ471526 103962 O' Grady, P. 11 Drosophila arizonae 106307 EU341676 106307 JF736122 106307 EU341707 106307 EU341620 12 Drosophila auraria 109389 EU493624 109389 EU493753 109389 EU493511 109389 O' Grady, P. 13 Drosophila austrosaltans 106314 EU493634 106314 EU493763 106314 EU493634 106314 O' Grady, P. 14 Drosophila baimaii 109387 EU493625 109387 EU493754 ---- ---- 109387 O' Grady, P. 15 Drosophila barbarae 109391 EU493626 109391 EU493885 109391 EU493626 109391 O' Grady, P. 16 Drosophila bifasciata 109382 EU493631 109382 EU493760 109382 EU493631 109382 O' Grady, P. 17 Drosophila bifurca Unspecified JF736090 Unspecified JF736130 Unspecified JF736166 Unspecified JF736378 18 Drosophila bipectinata Unspecified AY757287 Unspecified AY757275.1 ---- ---- 42026 whole genome 19 Drosophila biseriata 200201 HQ170757 200201 HQ170641 200201 HQ170868 unspecified JQ413093 20 Drosophila borborema Unspecified JF736081 Unspecified JF736121 Unspecified JF736157 Unspecified JF736362 21 Drosophila bostrycha 109445 EU493649 109445 EU493778 109445 EU493525 109445 O' Grady, P.

SUPPLEMENTARY MATERIAL CHAPTER 3
138
22 Drosophila buzzatii 102049 DQ202051 102049 DQ202011 102049 DQ202091 102049 EU341621 23 Drosophila canalinea 103953 EU493575 103953 EU493706 ---- ---- 103953 JF736349 24 Drosophila canapalpa Unspecified JF736086 Unspecified JF736126 Unspecified JF736162 Unspecified JF736369 25 Drosophila capricorni 108512 EU493637 108512 EU493766 108512 EU493637 108512 EU493518 26 Drosophila cardini 103963 EU493576 103963 EU493707 ---- ---- 103963 O' Grady, P. 27 Drosophila comatifemora 106342 EU493650 106342 EU493779 106342 EU493526 106342 O' Grady, P. 28 Drosophila conformis 105686 EU493652 105686 EU493781 105686 EU493528 105686 O' Grady, P. 29 Drosophila dunni 103969 EU493577 103969 EU493708 103969 EU493470 103969 O' Grady, P. 30 Drosophila elegans Unspecified AB032130 Unspecified AF461307 ---- ---- 30023 whole genome 31 Drosophila ellisoni 105625 DQ202052 105625 DQ202012 105625 DQ202092 105625 JF736356 32 Drosophila emarginata 107544 EU493635 107544 EU493764 107544 EU493517 ---- ---- 33 Drosophila eohydei Unspecified JF736083 Unspecified JF736124 unspecified JF736159 Unspecified JF736366 34 Drosophila equinoxialis 107548 EU493638 107548 EU493767 107548 EU493519 107548 O' Grady, P. 35 Drosophila erecta Unspecified JQ679121 Unspecified GQ244453 Unspecified BK006335 Unspecified XM001972967 36 Drosophila eremophila 109208 DQ202053 109208 DQ202013 109208 DQ202093 Unspecified JF736370 37 Drosophila euronotus ---- ---- 15030 GU597484.1 ---- ---- ---- ---- 38 Drosophila eurypeza 109442 EU493653 109442 EU493782 109442 EU493529 ---- ---- 39 Drosophila fraburu 109373 EU493602 109373 EU493732 109373 EU493492 109373 O' Grady, P. 40 Drosophila fulvimacula Unspecified JF736080 Unspecified JF736120 Unspecified JF736156 Unspecified JF736361 41 Drosophila fulvimaculoides Unspecified JF736060 Unspecified JF736094 Unspecified JF736134 Unspecified JF736325 42 Drosophila fumipennis 108511 EU493639 108511 EU493768 ---- ---- 108511 O' Grady, P. 43 Drosophila funebris 103952 EU493579 103952 EU493710 103952 EU493579 103952 O' Grady, P. 44 Drosophila gibberosa ---- ---- 30029 EF468105 103960 EU493572 103960 O' Grady, P. 45 Drosophila grimshawi Unspecified GU597459 Unspecified GU597491 Unspecified BK006341 Unspecified O' Grady, P. 46 Drosophila guanche ---- ---- Unspecified AF081354 Unspecified EF216223 ---- ---- 47 Drosophila guarani 103966 EU493582 103966 EU493712 103966 EU493473 103966 O' Grady, P. 48 Drosophila guayllabambae Unspecified JF736091 Unspecified JF736131 Unspecified JF736167 Unspecified JF736380

SUPPLEMENTARY MATERIAL CHAPTER 3
139
49 Drosophila guttifera 103968 EU493604 103968 EU493734 103968 EU493494 103968 O' Grady, P. 50 Drosophila haleakalae 109330 EU493656 109330 EU493785 109330 EU493532 109330 AY348256 51 Drosophila hamatofila Unspecified KC011819 Unspecified KC011824 Unspecified KC011834 Unspecified KC011839 52 Drosophila huancavilcae Unspecified KC011819 Unspecified KC011824 Unspecified KC011834 Unspecified KC011839 53 Drosophila huaylasi Unspecified KC011820 Unspecified KC011825 Unspecified KC011835 Unspecified KC011840 54 Drosophila huichole 109219 DQ202058 109219 DQ202018 109219 DQ202098 109219 JF736379 55 Drosophila hydei 102059 DQ202060 102059 DQ202020 102059 DQ202100 102059 JF736328 56 Drosophila hystricosa 109444 EU493659 109444 EU493916 109444 EU493534 504584 JQ413097 57 Drosophila immigrans 103956 EU493586 103956 EU493716 103956 EU493477 103956 O' Grady, P. 58 Drosophila inca Unspecified KC011821 Unspecified KC011826 Unspecified KC011836 Unspecified KC011841 59 Drosophila iri 109374 EU493601 109374 EU493731 109374 EU493491 109374 O' Grady, P. 60 Drosophila kambysellisi 105683 EU493661 105683 EU493790 105683 EU493535 105683 O' Grady, P. 61 Drosophila kepulauana 109407 EU493587 109407 EU493717 109407 EU493478 109407 O' Grady, P. 62 Drosophila kikkawai Unspecified AF050746 OGS4 AY737608 OGS4 AY739953 unspecified whole genome 63 Drosophila koepferae Unspecified JF736061 Unspecified JF736095 Unspecified JF736135 Unspecified whole genome 64 Drosophila kohkoa 109399 EU493588 109399 EU493718 109399 EU493479 109399 O' Grady, P. 65 Drosophila lacertosa 109370 EU493610 109370 EU493740 109370 EU493499 109370 O' Grady, P. 66 Drosophila leonis Unspecified JF736062 Unspecified JF736096 Unspecified JF736136 Unspecified JF736330 67 Drosophila littoralis Unspecified NC011596 Unspecified NC011596 Unspecified NC011596 kemi96 EF635102 68 Drosophila longicornis Unspecified DQ202061 Unspecified DQ202021 Unspecified DQ202101 Unspecified JF736353 69 Drosophila machalilla E0035 KC011822 E0035 KC011827 E0035 KC011837 E0035 KC011842 70 Drosophila macroptera 109393 EU493597 109393 EU493727 109393 EU493488 109393 O' Grady, P. 71 Drosophila mainlandi Unspecified JX489217 102275 DQ202106 unspecified AY739953 102275 EU341622 72 Drosophila malerkotliana 105504 EU493627 105504 EU493756 105504 EU493512 105504 O' Grady, P. 73 Drosophila martensis Unspecified JF736084 Unspecified JF736125 unspecified JF736160 Unspecified JF736368 74 Drosophila mauritiana Unspecified M57912 Unspecified AF474081 unspecified M57912 ---- ---- 75 Drosophila mayaguana 102279 DQ202067 102279 DQ202027 102279 DQ202107 102279 EU341623

SUPPLEMENTARY MATERIAL CHAPTER 3
140
76 Drosophila mediodiffusa 109396 EU493616 109396 EU493745 109396 EU493505 109396 O' Grady, P. 77 Drosophila mediopictoides 109395 EU493617 109395 EU493746 109395 EU493506 109395 O' Grady, P. 78 Drosophila mediostriata 109394 EU493618 7269 AY847767 109394 EU493507 109394 O' Grady, P. 79 Drosophila melanica 105499 EU493611 15030 EU390749 105499 EU493500 105499 O' Grady, P. 80 Drosophila melanogaster 105503 EU493628 105503 EU493757 105503 EU493628 105503 O' Grady, P. 81 Drosophila melanoloma ---- ---- 105708 EU493791 105708 EU493536 105708 O' Grady, P. 82 Drosophila mercatorum 106304 EU493607 106304 EU493737 106304 EU493607 106304 JF736360 83 Drosophila meridiana Unspecified JF736078 Unspecified JF736118 Unspecified JF736153 Unspecified JF736357 84 Drosophila meridionalis 109211 DQ202070 109211 DQ202030 109211 DQ202110 Unspecified JF736372 85 Drosophila mettleri Unspecified JF736063 Unspecified JF736097 Unspecified JF736137 Unspecified JF736331 86 Drosophila microlabis ---- ---- Unspecified EF216258 Unspecified EF216231 ---- ---- 87 Drosophila micromelanica 109371 EU493612 109371 EU493741 109371 EU493501 109371 O' Grady, P. 88 Drosophila micromettleri Unspecified JF736064 Unspecified JF736098 Unspecified JF736138 Unspecified JF736332 89 Drosophila mimica 205066 HQ170780 109331 EU493793 109331 EU493537 7270 AY348239 90 Drosophila miranda Unspecified U51608 Unspecified M95148 Unspecified HQ110578 unspecified whole genome 91 Drosophila mojavensis 106302 EU493608 106302 EU493738 106302 EU493497 106302 EU341624 92 Drosophila moju Unspecified JF736075 Unspecified JF736112 Unspecified JF736149 Unspecified JF736347 93 Drosophila montana 103959 EU493750 103959 EU493750 40370 DQ471461 40370 EF635103 94 Drosophila mulleri 102305 EU341625 102305 DQ202032 102305 DQ202112 102305 EU341625 95 Drosophila multiciliata ---- ---- 109439 EU493794 109439 EU493538 251469 AY348258 96 Drosophila nannoptera 105440 EU493599 105440 EU493729 105440 EU493489 103845 JF736334 97 Drosophila nasuta 103957 EU493589 103957 EU493719 103957 EU493589 NO NO 98 Drosophila navojoa 105433 EU493609 105433 EU493739 105433 EU493498 7232 EU341626 99 Drosophila nebulosa 107549 EU493640 107549 EU532083 107549 EU493640 NO NO 100 Drosophila neocordata 107545 EU493636 107545 EU493765 30039 HQ110580 NO NO 101 Drosophila neohypocausta 109402 EU493590 109402 EU493720 109402 EU493481 NO NO 102 Drosophila neorepleta 102317 DQ202073 102317 DQ202033 102317 DQ202113 102317 JF736335

SUPPLEMENTARY MATERIAL CHAPTER 3
141
103 Drosophila nigella 105820 EU493666 105820 EU493795 105820 EU493539 252916 AY348244 104 Drosophila nigra 105821 EU493667 105821 EU493796 105821 EU493540 7272 AY348243 105 Drosophila nigricruria Unspecified JF736067 Unspecified JF736101 Unspecified JF736141 Unspecified JF736336 106 Drosophila nigrodumosa 102319 EU341679 102319 JF736102 102319 EU341710 102319 EU341627 107 Drosophila nigrospiracula 102321 DQ202074 102321 DQ202034 102321 DQ202114 102321 JF736337 108 Drosophila obscura Unspecified GU220027 Unspecified AF081356 Unspecified EF216233 ---- ---- 109 Drosophila ochracea ---- ---- 109447 EU493797 109447 EU493668 ---- ---- 110 Drosophila orena Unspecified AY757281 Unspecified AY757269 ---- ---- ---- ---- 111 Drosophila ornatipennis 103965 EU493573 103965 EU493704 103965 EU493467 103965 O' Grady, P. 112 Drosophila pachuca 109212 DQ202078 109212 DQ202038 109212 DQ202118 109212 JF736373 113 Drosophila paramediostriata Unspecified EF570013 Unspecified AY162995 ---- ---- ---- ---- 115 Drosophila paramelanica 109372 EU493613 109372 EU493742 109372 EU493502 109372 O' Grady, P. 116 Drosophila paranaensis Unspecified JF736088 Unspecified JF736128 Unspecified JF736164 Unspecified JF736374 117 Drosophila pararubida 109401 EU493591 109401 EU493721 109401 EU493482 109401 O' Grady, P. 118 Drosophila parisiena Unspecified JF736068 Unspecified JF736103 Unspecified JF736142 Unspecified JF736338 119 Drosophila paulistorum 107546 EU493641 107546 EU493770 46793 HQ110581 107546 O' Grady, P. 120 Drosophila pectinitarsus ---- ---- 109438 EU493798 109438 EU493542 109438 O' Grady, P. 121 Drosophila peninsularis Unspecified JF736069 Unspecified JF736104 Unspecified JF736143 Unspecified JF736339 122 Drosophila percnosoma 200125 HQ170819 200125 HQ170715 200125 HQ170929 105685 O' Grady, P. 123 Drosophila persimilis MSH7 AF451101 Unspecified M95143 Unspecified EF216234 unspecified O' Grady, P. 124 Drosophila polychaeta 103958 EU493603 103958 EU493733 103958 EU493493 103958 O' Grady, P. 125 Drosophila pseudoananassae Unspecified AY757280 Unspecified AY757280 ---- ---- ---- ---- 126 Drosophila pseudoobscura 105505 EU493633 105505 EU493762 105505 EU493633 105505 O' Grady, P. 127 Drosophila pulaua 109406 EU493592 109406 EU493722 109406 EU493483 109406 O' Grady, P. 128 Drosophila putrida 103964 EU493615 103964 EU493744 103964 EU493504 103964 O' Grady, P. 129 Drosophila quinaria 107542 EU493605 107542 EU493735 107542 EU493495 107542 O' Grady, P. 130 Drosophila repleta 102340 EU341680 102340 JF736105 102340 EU341711 102340 EU341628

SUPPLEMENTARY MATERIAL CHAPTER 3
142
131 Drosophila rhopaloa unspecified CONT8856 Unspecified CONT23969 unspecified CONT6279 Unspecified whole genome 132 Drosophila richardsoni Unspecified JF736070 Unspecified JF736106 Unspecified JF736144 Unspecified JF736340 133 Drosophila ritae 105431 DQ202082 105431 DQ202042 105431 DQ202122 105431 JF736354 134 Drosophila robusta 103967 EU493614 Unspecified GQ244457 103967 EU493503 103967 O' Grady, P. 135 Drosophila rubida 109400 EU493593 109400 EU493723 109400 EU493484 109400 O' Grady, P. 136 Drosophila s.albostrigata 109404 EU493595 109404 EU493725 109404 EU493486 109404 O' Grady, P. 137 Drosophila s.sulfurigaster 109403 EU493596 109403 EU493726 109403 EU493487 109403 O' Grady, P. 138 Drosophila saltans Unspecified AF045097 Unspecified AF050741 Unspecified HQ110585 ---- ---- 139 Drosophila santomea Unspecified JQ679120 156615 DQ382822 ---- ---- ---- ---- 140 Drosophila sechelia Unspecified M57908 Unspecified GQ244459 Unspecified M57908 GM25664 XM002030796 141 Drosophila serido Unspecified JF736089 Unspecified JF736129 Unspecified JF736165 Unspecified JF736376 142 Drosophila signata 109405 EU493594 109405 EU493724 109405 EU493485 109405 O' Grady, P. 143 Drosophila simulans Unspecified AF200844 Unspecified AF200844 Unspecified AF200844 105634 O' Grady, P. 144 Drosophila sonorae 102346 DQ202084 102346 DQ202044 102346 DQ202124 102346 JF736341 145 Drosophila soonae 109458 EU493672 109458 EU493801 109458 EU493544 ---- ---- 146 Drosophila spenceri 109217 DQ202087 109217 DQ202047 109217 DQ202127 109217 JF736377 147 Drosophila stalkeri 102349 DQ202088 102349 DQ202048 102349 DQ202128 102349 JF736342 148 Drosophila starmeri Unspecified JF736071 Unspecified JF736107 Unspecified JF736145 Unspecified JF736343 149 Drosophila straubae Unspecified JF736072 Unspecified JF736108 Unspecified JF736146 Unspecified JF736344 150 Drosophila sturtevanti Unspecified AY335205 14045 AF045082 Unspecified HQ110595 ---- ---- 151 Drosophila subbadia ---- ---- Unspecified AY847772 ---- ---- ---- ---- 152 Drosophila sucinea 108510 EU493642 108510 EU532094 ---- ---- 108510 O' Grady, P. 153 Drosophila tripunctata 107541 EU493619 107541 EU493748 107541 EU493508 107541 O' Grady, P. 154 Drosophila tropicalis ---- ---- Unspecified AF474103 ---- ---- ---- ---- 155 Drosophila unipunctata 109397 EU493620 109397 EU493749 109397 EU493509 109397 O' Grady, P. 156 Drosophila uniseta Unspecified JF736074 Unspecified JF736111 Unspecified JF736148 Unspecified JF736346 157 Drosophila venezolana 106309 DQ202089 106309 DQ202049 106309 DQ202129 106309 JF736364

SUPPLEMENTARY MATERIAL CHAPTER 3
143
158 Drosophila virilis 105500 EU493622 105500 EU493751 105500 EU493510 105500 JF736355 159 Drosophila wheeleri 102367 EU341685 Unspecified JF736110 102367 EU341705 102367 EU341616 160 Drosophila willistoni 106322 EU493643 106322 EU493772 106322 EU493643 106322 O' Grady, P. 161 Drosophila yakuba Unspecified NC001322 Unspecified NC001322 Unspecified NC001322 Unspecified CM000159 162 Drosophila yangana Unspecified KC011823 Unspecified KC011828 Unspecified KC011838 Unspecified KC011843 163 Drosophila waddingtoni 105687 HQ170825 105687 HQ170721 105687 HQ170935 105687 O' Grady, P. 164 Scaptodrosophila latifasciaformis 105638 EU493684 105638 EU493813 105638 EU493553 105638 O' Grady, P. 165 Scaptodrosophila lebanonensis 105639 EU493686 105639 EU493815 105639 EU493555 105639 O' Grady, P. 165 Scaptodrosophila pattersoni 105497 EU493687 105497 EU493816 105497 EU493556 105497 O' Grady, P. 166 Scaptomyza hirtitibia 109429 EU493658 109429 EU493915 109429 EU493533 109429 O' Grady, P. 167 Scaptomyza caliginosa 105680 EU493676 105680 EU493805 ---- ---- 105680 O' Grady, P. 168 Scaptomyza cyrtandrae 109430 EU493678 109430 EU493807 109430 EU493548 109430 O' Grady, P. 169 Scaptomyza palmae 106323 EU493550 106323 EU493809 106323 EU493680 106323 O' Grady, P. 170 Zaprionus badyi 105640 EU493688 105640 EU493817 105640 EU493557 105640 O' Grady, P. 171 Zaprionus sepsoides 105642 EU493690 105642 EU493819 105642 EU493559 105642 O' Grady, P. 172 Zaprionus tuberculatus 105498 EU493691 105498 EU493820 105498 EU493560 105498 O' Grady, P. 173 Zaprionus indianus ---- ---- Unspecified EF632396 ---- ---- ---- ----

SUPPLEMENTARY MATERIAL CHAPTER 3
144
Table S2. Source of 234 samples used in the search of Galileo. Numbers on brackets denote stocks from Drosophila Stock Center.
Taxon ID Locatity Country Source 1 D. acanthoptera G128 Huatulco Mexico Ruiz A. 2 D. aldrichi G001 Zuata Venezuela Fontdevila A. 3 D. aldrichi G032 Hatulco Mexico Etges W. 4 D. aldrichi G036 Zapilote Mexico Etges W. 5 D. aldrichi G099 Las Bocas Mexico Ruiz A. 6 D. aldrichi G135 Punta Onah Mexico Ruiz A. 7 D. aldrichi E011 Izhcayluma Ecuador Acurio A. 8 D. aldrichi E022 San Jose Ecuador Acurio A. 9 D. americana H5E34 Hurricane L. USA cracs.fc.up.pt 10 D. americana W11E54 Wappapelo L. USA cracs.fc.up.pt 11 D. ananassae BK006363 unknown unknown GenBank 12 D. ananassae G048 unknown unknown [14024-0371.13] 13 D. ananassae G071 Port-Louis Mauritius Cariou ML. 14 D. ananassae G072 Tai 13-1610 unspecified Cariou ML. 15 D. ananassae G073 Borneo Indonesia Cariou ML. 16 D. ananassae G074 Nago 181 Japan Cariou ML. 17 D. ananassae G075 Tahiti France Cariou ML. 18 D. ananassae G076 Kirindy Forest Madagascar Cariou ML. 19 D. ananassae G077 Kirindy Forest Madagascar Cariou ML. 20 D. ananassae G078 Kirindy Forest Madagascar Cariou ML. 21 D. ananassae G079 Monompana Madagascar Cariou ML. 22 D. ananassae G080 Monompana Madagascar Cariou ML. 23 D. ananassae G081 Monompana Madagascar Cariou ML. 24 D. ananassae B129 unspecified unspecified Valente V. 25 D. anceps G040 Michoacan Mexico [15081-1261.10] 26 D. aracataca E037 Salango Ecuador Acurio A. 27 D. arizonae G002 Tomatlan Mexico Heed C.

SUPPLEMENTARY MATERIAL CHAPTER 3
145
28 D. arizonae G003 Punta Onah Mexico Etges W. 29 D. arizonae G024 Punta Onah Mexico Etges W. 30 D. arizonae G026 San Quintin Mexico Etges W. 31 D. arizonae G028 Tomatlan Mexico Etges W. 32 D. arizonae G029 Vaquerias Mexico Etges W. 33 D. arizonae G095 Las Bocas Mexico Ruiz A. 34 D. arizonae G096 El Choyudo Mexico Ruiz A. 35 D. arizonae G098 Punta Onah Mexico Etges W. 36 D. austrosaltans E024 San Antonio Ecuador Acurio A. 37 D. austrosaltans E026 El Aromo Ecuador Acurio A. 38 D. bifurca G122 El Tecolote Mexico Oliveira D. 39 D. bipectinata KB463926 Chia Taiwan GenBank 40 D. bipectinata G068 Katmandou Nepal Cariou ML. 41 D. bipectinata G069 Myanmar Myanmar Cariou ML. 42 D. bipectinata KB464248 Chia Taiwan GenBank 43 D. bipectinata KB464408 Chia Taiwan GenBank 44 D. bipectinata KB464390 Chia Taiwan GenBank 45 D. borborema G041 Bahia Brazil [15081-1281.04] 46 D. buzzatii B106 unspecified unspecified Valente V. 47 D. buzzatii EU334685 unspecified unspecified GenBank 48 D. buzzatii G012 Carboneras Spain Oliveira D. 49 D. buzzatii G100 Guaritas Brazil Oliveira D. 50 D. buzzatii G101 Trinkey Australia Oliveira D. 51 D. buzzatii G102 Mazán Argentina Oliveira D. 52 D. buzzatii G103 Wari Peru Oliveira D. 53 D. buzzatii G104 Quilmes Argentina Oliveira D. 54 D. buzzatii G105 Tichuco Argentina Oliveira D. 55 D. buzzatii G106 Otamendi Argentina Oliveira D. 56 D. buzzatii G107 Carboneras Spain Oliveira D. 57 D. buzzatii G108 Carboneras Spain Oliveira D. 58 D. buzzatii G109 Sardinia Italy Oliveira D. 59 D. buzzatii G110 Carboneras Spain Oliveira D.

SUPPLEMENTARY MATERIAL CHAPTER 3
146
60 D. buzzatii G111 Carboneras Spain Oliveira D. 61 D. capricorni E003 Yangana Ecuador Acurio A. 62 D. capricorni B130 Florianópolis Brazil Valente V. 63 D. cardini E014 Islamar Ecuador Acurio A. 64 D. cardini E016 Islamar Ecuador Acurio A. 65 D. cardini B121 Itaqui Brazil Valente V. 66 D. desertorum G119 Big Bend N.P. USA Oliveira D. 67 D. emarginata E027 Mindo Ecuador Acurio A. 68 D. equinoxialis B105 Mexico D.C. Mexico Valente V. 69 D. erecta B125 unspecified unspecified Valente V. 70 D. erecta G137 unspecified unspecified [14021-0224.01] 71 D. eremophila G085 Las Bocas Mexico Ruiz A. 72 D. eremophila G116 El Tecolote Mexico Oliveira D. 73 D. euronotus S057 Tallahasee USA [15030-1131.01] 74 D. eurypeza S055 Hawaii USA [15290-2581.00] 75 D. fulvimacula G042 Veracruz Mexico Oliveira D. 76 D. fulvimacula G118 los Tuxtlas B.S. Mexico Oliveira D. 77 D. funebris B131 unspecified unspecified Valente V. 78 D. grimshawi G138 Maui USA 15287-2541.00] 79 D. guanche G062 Mt Elgon Kenya Oliveira D. 80 D. guayllambae E007 Islamar Ecuador Acurio A. 81 D. guayllambae E018 Islamar Ecuador Acurio A. 82 D. guayllambae E029 Guayllabamba Ecuador Acurio A. 83 D. hamatofila G052 Superstition USA [15081-1301.07] 84 D. huancavilcae E038 Manabi Ecuador Acurio A. 85 D. huaylasi G004 Caraz Peru Oliveira D. 86 D. huaylasi E040 Yangana Ecuador Acurio A. 87 D. huichole G121 Zapotitlan Mexico Oliveira D. 88 D. hydei G006 Pl. del Mercado Cuba Oliveira D. 89 D. hydei G044 Sonora Mexico [15085-1641.67] 90 D. hydei G092 Las Bocas Mexico Ruiz A. 91 D. hydei G093 Punta Onah Mexico Ruiz A.

SUPPLEMENTARY MATERIAL CHAPTER 3
147
92 D. hydei G094 El Choyudo Mexico Ruiz A.. 93 D. hydei B141 Florianópolis Brazil Valente V. 94 D. immigrans E021 Izhcayluma Ecuador Acurio A. 95 D. inca E012 Yangana Ecuador Acurio A. 96 D. inca E017 Izhcayluma Ecuador Acurio A. 97 D. inca E034 Yangana Ecuador Acurio A. 98 D. kikkawai B144 unspecified unspecified Valente V. 99 D. koepferae G005 Cébila Argentina Oliveira D. 100 D. leonis G123 Ixtlan del Rio Mexico Oliveira D. 101 D. longicornis G043 Tucson USA [15081-1311.20] 102 D. longicornis E041 Guayllabamba Ecuador Acurio A. 103 D. machalilla E035 San Jose Ecuador Acurio A. 104 D. mainlandi G124 Catalina Is. USA Oliveira D. 105 D. malerkotliana G065 unspecified unspecified Cariou ML. 106 D. malerkotliana G066 318 A7 unspecified Cariou ML. 107 D. malerkotliana E009 Isla mar Ecuador Acurio A. 108 D. malerkotliana E031 Mindo Ecuador Acurio A. 109 D. martensis G007 Guaca Venezuela Oliveira D. 110 D. mauritiana B100 unspecified Mauritious Valente V. 111 D. mayaguana G011 Henderson P. Jamaica Oliveira D. 112 D. mediodiffusa B123 Maricão Puerto Rico Valente V. 113 D. mediopictoides B119 Boquete Panama Valente V. 114 D. mediopictoides B145 Boquete Panama Valente V. 115 D. melanica S050 Austin USA [15030-1141.03] 116 D. melanogaster G112 Los Alamos Mexico Oliveira D. 117 D. melanogaster G114 Las Bocas Mexico Oliveira D. 118 D. melanogaster B113 Porto Alegre Brazil Valente V. 119 D. melanogaster G139 unspecified unspecified [14021-0231.36] 120 D. mercatorum G008 Comarada Bolivia Oliveira D. 121 D. mercatorum G039 Tucson USA Oliveira D. 122 D. mercatorum B111 Florianópolis Brazil Valente V. 123 D. mercatorum G058 Palmira Colombia Oliveira D.

SUPPLEMENTARY MATERIAL CHAPTER 3
148
124 D. mercatorum G059 Campo Grande Brazil Oliveira D. 125 D. meridiana G056 Canal Zone Panama Oliveira D. 126 D. merina G070 Reunion Island France Cariou ML. 127 D. mettleri G038 Sonora Mexico Oliveira D. 128 D. mettleri G127 El Choyudos Mexico Ruiz A. 129 D. microlabis G061 unspecified unspecified Oliveira D. 130 D. micromelanica S051 Smithville USA [15030-1151.01] 131 D. mimica S056 Hawaii USA [15292-2561.08] 132 D. miranda CM001516 Mt St. Helena USA GenBank 133 D. miranda CM001519 Mt St. Helena USA GenBank 134 D. mojavensis C Catalina Island USA GenBank 135 D. mojavensis D Catalina Island USA GenBank 136 D. mojavensis F Catalina Island USA GenBank 137 D. mojavensis X Catalina Island USA GenBank 138 D. mojavensis G009 Punta Onah Mexico Oliveira D. 139 D. mojavensis G023 Catalina Island USA [15081-1352.22] 140 D. mojavensis G031 Santiago Mexico Oliveira D. 141 D. mojavensis G033 Punta Onah Mexico Oliveira D. 142 D. mojavensis G034 Punta Onah Mexico Armella C. 143 D. mojavensis G035 San Quintin Mexico Oliveira D. 144 D. mojavensis G037 Providence USA Oliveira D. 145 D. mojavensis G090 Punta Onah Mexico Ruiz A. 146 D. mojavensis G091 El Choyudo Mexico Ruiz A. 147 D. mojavensis G097 Las Bocas Mexico Ruiz A. 148 D. moju E023 Yangana Ecuador Acurio A. 149 D. mulleri G010 Panuco Mexico Richardson 150 D. nannoptera G130 Joluxtla Mexico Oliveira D. 151 D. navojoa G030 Chamela Mexico Oliveira D. 152 D. navojoa G086 Las Bocas Mexico Ruiz A. 153 D. nebulosa E008 Isla mar Ecuador Acurio A. 154 D. nebulosa E010 San Jose Ecuador Acurio A. 155 D. nebulosa B127 Porto Alegre Brazil Valente V.

SUPPLEMENTARY MATERIAL CHAPTER 3
149
156 D. neocardini E025 Mindo Ecuador Acurio A. 157 D. neocardini E036 San Antonio Ecuador Acurio A. 158 D. neocardini B112 Ilha Campeche Brazil Valente V. 159 D. neoelliptica B116 Joinville Brazil Valente V. 160 D. neorepleta G057 Jalisco Mexico [15084-1601.07] 161 D. nigricruria G126 Las Bocas Mexico Oliveira D. 162 D. nigricruria E005 Yangana Ecuador Acurio A. 163 D. nigricruria E020 Izhcayluma Ecuador Acurio A. 164 D. nigrospiracula G084 Punta Onah Mexico Ruiz A. 165 D. obscura G063 Canary Islands Spain Oliveira D. 166 D. orena B139 unspecified unspecified Valente V. 167 D. pallidipennis E015 San Antonio Ecuador Acurio A. 168 D. pallidipennis B115 Joinville Brazil Valente V. 169 D. paramediostriata B137 Porto Alegre Brazil Valente V. 170 D. paranaensis G054 Chiapas Mexico [15082-1541.10] 171 D. paranaensis E006 Ayampe Ecuador Acurio A. 172 D. paulistorum B114 Ribeirão Preto Brazil Valente V. 173 D. peninsularis G055 Bath Jamaica [15081-1401.05] 174 D. persimilis G050 Mt St. Helena USA [14011-0111.49] 175 D. persimilis BK0063 Mt St. Helena USA GenBank 176 D. polychaeta S052 Hawaii USA [15100-1711.04] 177 D. polymorpha B126 Florianópolis Brazil Valente V. 178 D. promeridiana G014 Dagua Colombia Oliveira D. 179 D. promeridiana E039 San Antonio Ecuador Acurio A. 180 D. pseudoananassae G064 unspecified unspecified Cariou ML. 181 D. pseudoobscura BK0063 Mesa Verde USA GenBank 182 D. pseudoobscura G049 Mesa Verde USA [14011-0121.94] 183 D. pseudoobscura G087 Punta Onah Mexico Oliveira D. 184 D. pseudoobscura B138 Mesa Verde USA Valente V. 185 D. putrida S054 Chadron USA [15150-2101.00] 186 D. repleta G022 unspecified unspecified Oliveira D. 187 D. rhopaloa KB450190 unspecified Vietnam GenBank

SUPPLEMENTARY MATERIAL CHAPTER 3
150
188 D. rhopaloa KB452607 unspecified Vietnam GenBank 189 D. richardsoni G045 Tortola Islands U.K. Oliveira D. 190 D. ritae G047 Puebla Mexico Oliveira D. 191 D. robusta G134 Chadron USA Oliveira D. 192 D. robusta B107 unspecified unspecified Valente V. 193 D. saltans B142 unspecified unspecified Valente V. 194 D. santomea B103 unspecified São Tomé & Príncipe Valente V. 195 D. sechellia G140 Cousin Island Seychelles [14021-0248.25] 196 D. simulans G113 Los Alamos Mexico Oliveira D. 197 D. simulans G115 Las Bocas Mexico Oliveira D. 198 D. simulans E004 Isla mar Ecuador Acurio A. 199 D. simulans B118 Solis Uruguay Valente V. 200 D. simulans G141 unspecified unspecified [14021-0251.195] 201 D. spenceri G089 Las Bocas Mexico Oliveira D. 202 D. spenceri G120 Infiernillo Mexico Oliveira D. 203 D. stalkeri G015 St. Petersburg USA Oliveira D. 204 D. starmeri G016 Rio Hacha Colombia Oliveira D. 205 D. straubae G017 Port Henderson Jamaica Oliveira D. 206 D. straubae G046 Sigus Beach Cuba Oliveira D. 207 D. sturtevanti E042 San Antonio Ecuador Acurio A. 208 D. sturtevanti B101 Florianópolis Brazil Valente V. 209 D. subbadia B140 El Naranjo Mexico Valente V. 210 D. sucinea E033 Mindo Ecuador Acurio A. 211 D. sucinea B102 Mexico DC Mexico Valente V. 212 D. teissieri B124 unspecified unspecified Valente V. 213 D. tripunctata E013 Madison USA Acurio A. 214 D. tropicalis B108 unspecified El Salvador Valente V. 215 D. uniseta G018 Salamanca Colombia Oliveira D. 216 D. venezolana G020 Los Roques Venezuela Cerda 217 D. virilis G019 unspecified unspecified [15010-1015.87] 218 D. virilis B117 Bowling Green USA Valente V. 219 D. virilis BK6359 unspecified unspecified GenBank

SUPPLEMENTARY MATERIAL CHAPTER 3
151
220 D. wassermani G129 Infiernillo Mexico Heed W. 221 D. wheeleri G021 Ejido Mexico Oliveira D. 222 D. wheeleri G025 Punta Onah Mexico Oliveira D. 223 D. wheeleri G027 Catalina Is. USA Oliveira D. 224 D. willistoni G051 Guadaloupe Is. France [14030-0811.24] 225 D. willistoni E028 Islamar Ecuador Acurio A. 226 D. willistoni E032 Mindo Ecuador Acurio A. 227 D. willistoni B109 unspecified unspecified Valente V. 228 D. willistoni BK6360 Guadaloupe Is. France GenBank 229 D. yakuba G143 unspecified Ivory Coast [14021-0261.01] 230 D. yangana E030 Yangana Ecuador Acurio A. 231 S. latiefasciaeformis B135 unspecified unspecified Valente V. 232 Z. indianus E019 Yangana Ecuador Acurio A. 233 Z. indianus E043 Izhcayluma Ecuador Acurio A. 234 Z. tuberculatus B122 unspecified unspecified Valente V.

SUPPLEMENTARY MATERIAL CHAPTER 3
152
Table S3. Results obtained in the search of Galileo TE in 234 samples from 110 drosophilid species.
Taxon ID detection sequence functional observations (primers/contig) length (bp) TPase 1 D. acanthoptera G128 no detected NA NA NA 2 D. aldrichi G001 PCR (1-3) 975 yes 325 aa 3 D. aldrichi G032 PCR (5-6) 356 No same as G036
4 D. aldrichi G036 PCR (5-6) PCR (1-3)
356 953 No same as G099
5 D. aldrichi G099 PCR (5-6, 1-3) 356,974 No deletion, mutation 6 D. aldrichi G135 PCR (1-3) 974 mutation 7 D. aldrichi E011 PCR (5-6, 1-3) 381,944 yes, no 127 aa, mutation 8 D. aldrichi E022 PCR (5-6,1-3) 380,867 No deletion 9 D. americana H5E34 in silico (3485) 409 No mutation 10 D. americana W11E54 in silico (5443) 409 No mutation 11 D. ananassae BK006363 in silico (15556)* 531 yes 176 aa 12 D. ananassae G048 PCR (7-8) 484 No sequenced stock 13 D. ananassae G071 PCR (7-8) 531 yes 176 aa 14 D. ananassae G072 PCR (7-8) 387 yes 125 aa, intron 15 D. ananassae G073 PCR (7-8) 387 yes 125 aa, intron 16 D. ananassae G074 PCR (7-8) 531 yes 176 aa 17 D. ananassae G075 PCR (7-8) 531 yes 176 aa 18 D. ananassae G076 PCR (7-8) 531 yes 176 aa 19 D. ananassae G077 PCR (7-8) 531 yes 176 aa 20 D. ananassae G078 PCR (7-8) 531 yes same as BK006363 21 D. ananassae G079 PCR (7-8) 531 yes 176 aa 22 D. ananassae G080 PCR (7-8) 531 yes 176 aa 23 D. ananassae G081 PCR (7-8) 531 yes same than G080 24 D. ananassae B129 PCR (7-8) 531 yes 176 aa 25 D. anceps G040 No detected NA NA NA
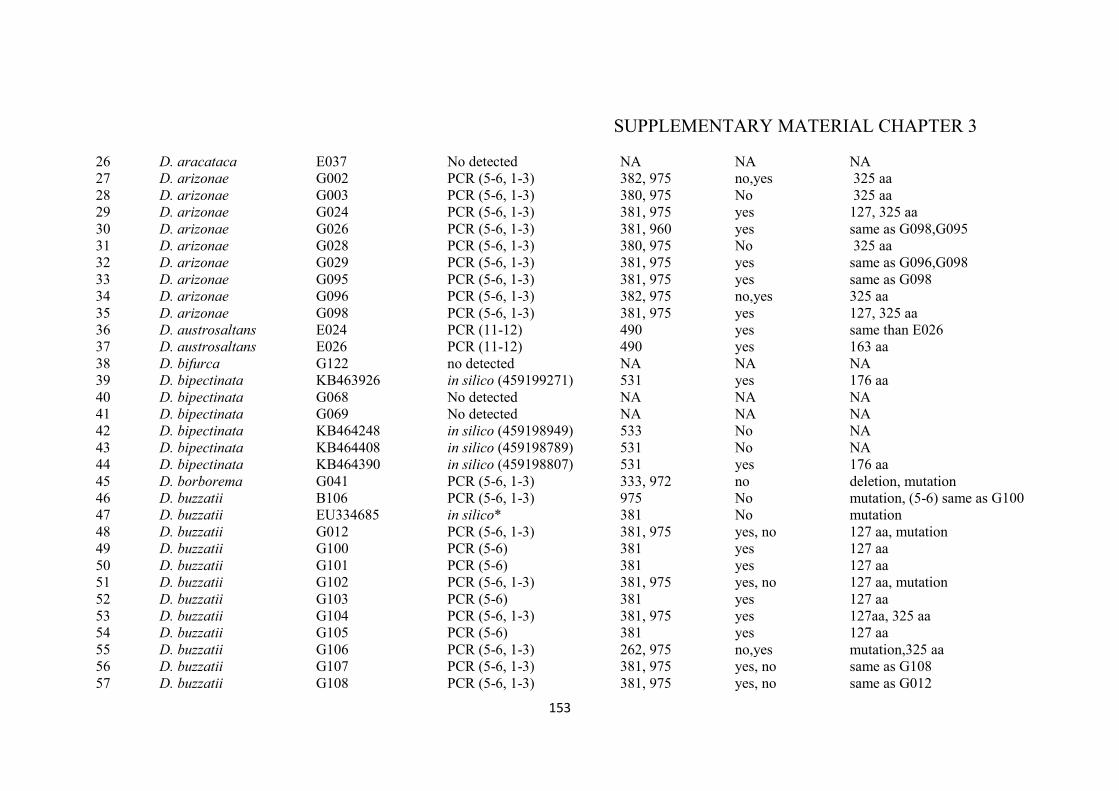
SUPPLEMENTARY MATERIAL CHAPTER 3
153
26 D. aracataca E037 No detected NA NA NA 27 D. arizonae G002 PCR (5-6, 1-3) 382, 975 no,yes 325 aa 28 D. arizonae G003 PCR (5-6, 1-3) 380, 975 No 325 aa 29 D. arizonae G024 PCR (5-6, 1-3) 381, 975 yes 127, 325 aa 30 D. arizonae G026 PCR (5-6, 1-3) 381, 960 yes same as G098,G095 31 D. arizonae G028 PCR (5-6, 1-3) 380, 975 No 325 aa 32 D. arizonae G029 PCR (5-6, 1-3) 381, 975 yes same as G096,G098 33 D. arizonae G095 PCR (5-6, 1-3) 381, 975 yes same as G098 34 D. arizonae G096 PCR (5-6, 1-3) 382, 975 no,yes 325 aa 35 D. arizonae G098 PCR (5-6, 1-3) 381, 975 yes 127, 325 aa 36 D. austrosaltans E024 PCR (11-12) 490 yes same than E026 37 D. austrosaltans E026 PCR (11-12) 490 yes 163 aa 38 D. bifurca G122 no detected NA NA NA 39 D. bipectinata KB463926 in silico (459199271) 531 yes 176 aa 40 D. bipectinata G068 No detected NA NA NA 41 D. bipectinata G069 No detected NA NA NA 42 D. bipectinata KB464248 in silico (459198949) 533 No NA 43 D. bipectinata KB464408 in silico (459198789) 531 No NA 44 D. bipectinata KB464390 in silico (459198807) 531 yes 176 aa 45 D. borborema G041 PCR (5-6, 1-3) 333, 972 no deletion, mutation 46 D. buzzatii B106 PCR (5-6, 1-3) 975 No mutation, (5-6) same as G100 47 D. buzzatii EU334685 in silico* 381 No mutation 48 D. buzzatii G012 PCR (5-6, 1-3) 381, 975 yes, no 127 aa, mutation 49 D. buzzatii G100 PCR (5-6) 381 yes 127 aa 50 D. buzzatii G101 PCR (5-6) 381 yes 127 aa 51 D. buzzatii G102 PCR (5-6, 1-3) 381, 975 yes, no 127 aa, mutation 52 D. buzzatii G103 PCR (5-6) 381 yes 127 aa 53 D. buzzatii G104 PCR (5-6, 1-3) 381, 975 yes 127aa, 325 aa 54 D. buzzatii G105 PCR (5-6) 381 yes 127 aa 55 D. buzzatii G106 PCR (5-6, 1-3) 262, 975 no,yes mutation,325 aa 56 D. buzzatii G107 PCR (5-6, 1-3) 381, 975 yes, no same as G108 57 D. buzzatii G108 PCR (5-6, 1-3) 381, 975 yes, no same as G012

SUPPLEMENTARY MATERIAL CHAPTER 3
154
58 D. buzzatii G109 PCR (5-6, 1-3) 381, 975 no,yes mutation,325 aa 59 D. buzzatii G110 PCR (5-6, 1-3) 381, 975 no,yes mutation,325 aa 60 D. buzzatii G111 PCR (5-6, 1-3) 381, 975 yes, no same as G012 61 D. capricorni E003 PCR (11-12) 490 yes same as B130 62 D. capricorni B130 PCR (11-12) 490 yes 163 aa 63 D. cardini E014 No detected NA NA NA 64 D. cardini E016 No detected NA NA NA 65 D. cardini B121 No detected NA NA NA 66 D. desertorum G119 No detected NA NA NA 67 D. emarginata E027 No detected NA NA NA 68 D. equinoxialis B105 PCR (11-12) 490 no deletion 69 D. erecta B125 No detected NA NA NA 70 D. erecta G137 No detected NA NA sequenced stock 71 D. eremophila G085 No detected NA NA NA 72 D. eremophila G116 No detected NA NA NA 73 D. euronotus S057 No detected NA NA NA 74 D. eurypeza S055 No detected NA NA NA 75 D. fulvimacula G042 PCR (5-6) 381 No mutation 76 D. fulvimacula G118 PCR (5-6) 381 No same as G042 77 D. funebris B131 No detected NA NA NA 78 D. grimshawi G138 No detected NA NA sequenced stock 79 D. guanche G062 no detected NA NA NA 80 D. guayllambae E007 no detected NA NA NA 81 D. guayllambae E018 no detected NA NA NA 82 D. guayllambae E029 no detected NA NA NA 83 D. hamatofila G052 PCR (5-6, 1-3) 381, 975 yes 127,325 aa 84 D. huancavilcae E038 no detected NA NA NA 85 D. huaylasi G004 PCR (5-6) 381 yes same as E040 86 D. huaylasi E040 PCR (5-6, 1-3) 381, 944 yes,no 127 aa, mutation 87 D. huichole G121 no detected NA NA NA 88 D. hydei G006 No detected NA NA NA 89 D. hydei G044 No detected NA NA NA

SUPPLEMENTARY MATERIAL CHAPTER 3
155
90 D. hydei G092 No detected NA NA NA 91 D. hydei G093 No detected NA NA NA 92 D. hydei G094 No detected NA NA NA 93 D. hydei B141 No detected NA NA NA 94 D. immigrans E021 No detected NA NA NA 95 D. inca E012 No detected NA NA NA 96 D. inca E017 No detected NA NA NA 97 D. inca E034 No detected NA NA NA 98 D. kikkawai B144 PCR (7-8) 531 No deletion 99 D. koepferae G005 PCR (5-6) 381 yes 127 aa 100 D. leonis G123 PCR (1-3) 975 yes 325 aa 101 D. longicornis G043 PCR (5-6) 381 yes 127 aa 102 D. longicornis E041 PCR (5-6) 381 yes 128 aa 103 D. machalilla E035 No detected NA NA NA 104 D. mainlandi G124 PCR (5-6, 1-3) 378, 963 no insertion, deletion 105 D. malerkotliana G065 PCR (7-8) 522 yes 173 aa 106 D. malerkotliana G066 PCR (7-8) 522 No mutation 107 D. malerkotliana E009 PCR (7-8) 531 No same as E031 108 D. malerkotliana E031 PCR (7-8) 531 No mutation 109 D. martensis G007 PCR (5-6, 1-3) 380 No deletion 110 D. mauritiana B100 No detected NA NA NA 111 D. mayaguana G011 PCR (1-3) 975 yes 325 aa 112 D. mediodiffusa B123 No detected NA NA NA 113 D. mediopictoides B119 PCR (11-12) 490 yes 163 aa 114 D. mediopictoides B145 PCR (11-12) 490 yes 163 aa 115 D. melanica S050 No detected NA NA NA 116 D. melanogaster G112 No detected NA NA NA 117 D. melanogaster G114 No detected NA NA NA 118 D. melanogaster B113 No detected NA NA NA 119 D. melanogaster G139 No detected NA NA sequenced stock 120 D. mercatorum G008 PCR (5-6) 381 yes 127 aa 121 D. mercatorum G039 PCR (5-6) 381 yes 127 aa

SUPPLEMENTARY MATERIAL CHAPTER 3
156
122 D. mercatorum B111 PCR (5-6) 381 yes same as G059 123 D. mercatorum G058 PCR (5-6) 381 yes same as G008, G058 124 D. mercatorum G059 PCR (5-6) 381 yes 128 aa 125 D. meridiana G056 PCR (5-6) 361 no deletion 126 D. merina G070 No detected NA NA NA 127 D. mettleri G038 No detected NA NA NA 128 D. mettleri G127 No detected NA NA NA 129 D. microlabis G061 No detected NA NA NA 130 D. micromelanica S051 No detected NA NA NA 131 D. mimica S056 No detected NA NA NA 132 D. miranda CM001516 in silico (480995225) 511 No deletion 133 D. miranda CM001519 in silico (480995219) 509 No deletion 134 D. mojavensis C in silico (10758)* 381 yes 127 aa 135 D. mojavensis D in silico (9930)* 381 yes 127 aa 136 D. mojavensis F in silico (10369)* 381 yes 127 aa 137 D. mojavensis X in silico (10924)* 381 yes 128 aa 138 D. mojavensis G009 PCR (5-6, 1-3) 381, 975 yes 127,325 aa 139 D. mojavensis G023 PCR (5-6, 1-3) 381, 975 yes sequenced stock 140 D. mojavensis G031 PCR (5-6, 1-3) 381, 975 yes 127,325 aa 141 D. mojavensis G033 PCR (5-6, 1-3) 381, 975 yes 127,325 aa 142 D. mojavensis G034 PCR (5-6, 1-3) 381, 975 yes 127,325 aa 143 D. mojavensis G035 PCR (5-6, 1-3) 381, 971 yes,no 127 aa 144 D. mojavensis G037 PCR (5-6, 1-3) 381, 971 yes,no 127 aa 145 D. mojavensis G090 PCR (5-6, 1-3) 381, 975 yes 127,325 aa 146 D. mojavensis G091 PCR (5-6, 1-3) 381, 975 yes 127,325 aa 147 D. mojavensis G097 PCR (5-6, 1-3) 381, 975 yes 127,325 aa 148 D. moju E023 No detected NA NA NA 149 D. mulleri G010 PCR (5-6, 1-3) 381, 955 No mutation, deletion 150 D. nannoptera G130 No detected NA NA NA 151 D. navojoa G030 PCR (1-3) 975 yes 325 aa 152 D. navojoa G086 PCR (1-3) 873 no deletion 153 D. nebulosa E008 PCR (11-12) 483 no same as E010

SUPPLEMENTARY MATERIAL CHAPTER 3
157
154 D. nebulosa E010 PCR (11-12) 483 no deletion 155 D. nebulosa B127 PCR (11-12) 485 no deletion 156 D. neocardini E025 No detected NA NA NA 157 D. neocardini E036 No detected NA NA NA 158 D. neocardini B112 No detected NA NA NA 159 D. neoelliptica B116 No detected NA NA NA 160 D. neorepleta G057 PCR (5-6) 381 yes 127 aa 161 D. nigricruria G126 PCR (1-3) 948 yes 316 aa 162 D. nigricruria E005 PCR (5-6) 381 yes 128 aa 163 D. nigricruria E020 PCR (1-3) 833 no deletion 164 D. nigrospiracula G084 No detected NA NA NA 165 D. obscura G063 No detected NA NA NA 166 D. orena B139 No detected NA NA NA 167 D. pallidipennis E015 No detected NA NA NA 168 D. pallidipennis B115 No detected NA NA NA 169 D. paramediostriata B137 PCR (11-12) 490 yes 163 aa 170 D. paranaensis G054 PCR 5-6 381 yes 127 aa 171 D. paranaensis E006 PCR 5-6 381 yes same as G054 172 D. paulistorum B114 PCR (11-12) 476 no deletion 173 D. peninsularis G055 No detected NA NA NA 174 D. persimilis G050 no detected NA NA sequenced stock 175 D. persimilis BK0063 in silico (7729)* 502 yes 168 aa 176 D. polychaeta S052 No detected NA NA NA 177 D. polymorpha B126 No detected NA NA NA 178 D. promeridiana G014 No detected NA NA NA 179 D. promeridiana E039 No detected NA NA NA 180 D. pseudoananassae G064 PCR (7-8) 537 no deletion 181 D. pseudoobscura BK0063 in silico (3151)* 511 no mutation 182 D. pseudoobscura G049 no detected no no sequenced stock 183 D. pseudoobscura G087 no detected NA NA NA 184 D. pseudoobscura B138 no detected NA NA NA 185 D. putrida S054 No detected NA NA NA

SUPPLEMENTARY MATERIAL CHAPTER 3
158
186 D. repleta G022 No detected NA NA NA 187 D. rhopaloa KB450190 in silico (452190070) 509 no deletion 188 D. rhopaloa KB452607 in silico (452187653) 488 no deletion 189 D. richardsoni G045 PCR (5-6) 381 yes 127 aa 190 D. ritae G047 PCR (1-3) 870 no deletion 191 D. robusta G134 No detected NA NA NA 192 D. robusta B107 No detected NA NA NA 193 D. saltans B142 PCR (11-12) 472 no deletion 194 D. santomea B103 No detected NA NA NA 195 D. sechellia G140 No detected NA NA sequenced stock 196 D. simulans G113 No detected NA NA NA 197 D. simulans G115 No detected NA NA NA 198 D. simulans E004 No detected NA NA NA 199 D. simulans B118 No detected NA NA NA 200 D. simulans G141 No detected NA NA sequenced stock 201 D. spenceri G089 No detected NA NA NA 202 D. spenceri G120 No detected NA NA NA 203 D. stalkeri G015 PCR (5-6) 375 no deletion 204 D. starmeri G016 PCR (1-3) 975 yes 325 aa 205 D. straubae G017 No detected NA NA NA 206 D. straubae G046 No detected NA NA NA 207 D. sturtevanti E042 PCR (11-12) 492 no insertion 208 D. sturtevanti B101 PCR (11-12) 472 no deletion 209 D. subbadia B140 PCR (11-12) 490 yes 163 aa 210 D. sucinea E033 PCR (11-12) 488 no same as B102 211 D. sucinea B102 PCR (11-12) 488 no deletion 212 D. teissieri B124 No detected NA NA NA 213 D. tripunctata E013 No detected NA NA NA 214 D. tropicalis B108 PCR (11-12) 490 yes 163 aa 215 D. uniseta G018 PCR (1-3) 967 no mutation 216 D. venezolana G020 PCR (1-3) 975 yes 325 aa 217 D. virilis G019 no detected NA NA sequenced stock

SUPPLEMENTARY MATERIAL CHAPTER 3
159
218 D. virilis B117 no detected NA NA NA 219 D. virilis BK6359 in silico (16409)* 413 no mutation 220 D. wassermani G129 No detected NA NA NA 221 D. wheeleri G021 PCR (5-6, 1-3) 317, 974 yes, no same as G025 222 D. wheeleri G025 PCR (5-6, 1-3) 317, 974 yes,no 105 aa, mutation 223 D. wheeleri G027 PCR (5-6, 1-3) 370, 975 yes deletion, 325 aa 224 D. willistoni G051 PCR (11-12) 490 yes sequenced stock 225 D. willistoni E028 PCR (11-12) 488 no deletion 226 D. willistoni E032 PCR (11-12) 490 yes 163 aa, same as BK006360 227 D. willistoni B109 PCR (11-12) 490 yes same as E032 228 D. willistoni BK6360 In silico (10048)* 490 yes 163 aa 229 D. yakuba G143 No detected NA NA sequenced stock 230 D. yangana E030 No detected NA NA NA 231 S. latiefasciaeformis B135 No detected NA NA NA 232 Z. indianus E019 No detected NA NA NA 233 Z. indianus E043 No detected NA NA NA 234 Z. tuberculatus B122 No detected NA NA NA

SUPPLEMENTARY MATERIAL CHAPTER 3
160
Table S4. Significant hits retrieved from the in silico search of Galileo in the newly released Drosophila genomes. Searches were performed with a significance threshold of E-value = ≤10-3 for nucleotides.
Genome (Taxon ID) Query GenBank ID Scaffold location Identity BLAST Score E-value
1. D. bipectinata (42026) Motif TPase GAL/ananassae
KB463974.1 7180000395832 376 / 395 (95.2%) 319 1 E-186
2. D. elegans (30023) TIR GAL/ananassae
KB458613.1 7180000491255 337 / 373 (90.3%) 229 9 E-191
3. D. kikkawai (30033) Motif TPase GAL/ananassae
KB459701.1 7180000302486 337 / 391 (86.2%) 175 1 E-99
4. D. rhopaloa (1041015) Motif TPase GAL/ananassae
KB452318.1 7180000779902 380 / 396 (96%) 332 0
5. D. miranda (7229) Motif TPase GAL/obscura
CM001517.2 chromosome XR 396 / 397 (99.7%) 393 0
6. D. americana (40366) Motif TPase GAL/obscura
W11E_5443 ND 389/413 (94%) 316 0

SUPPLEMENTARY MATERIAL CHAPTER 3
161
Table S5. Estimates of dS values for Galileo and 1360 element data set. Average values between 10 species groups of 51 Drosophila species. Values calculated on MEGA V4 based in the pairwise analysis of 152 sequences in a dataset of 426 positions, gaps and missing data were eliminated by pairwise deletion.Values above the diagonal show standard errors obtained by bootstrap procedure (500 replicates).
1 2 3 4 5 6 7 8 9 10 11
[ 1] 1360
[0.120 ] [0.097 ] [0.127 ] [0.159 ] [0.108 ] [0.112 ] [0.112 ] [0.106 ] [0.108 ] [0.134 ]
[ 2] repleta 0.577
[0.098 ] [0.096 ] [0.089 ] [0.104 ] [0.108 ] [0.098 ] [0.103 ] [0.107 ] [0.116 ]
[ 3] ananassae 0.448 0.448
[0.062 ] [0.041 ] [0.100 ] [0.105 ] [0.106 ] [0.106 ] [0.111 ] [0.110 ]
[ 4] montium 0.509 0.448 0.188
[0.051 ] [0.105 ] [0.109 ] [0.128 ] [0.113 ] [0.145 ] [0.161 ]
[ 5] melanogaster 0.608 0.412 0.132 0.105
[0.123 ] [0.109 ] [0.114 ] [0.117 ] [0.113 ] [0.125 ]
[ 6] obscura 0.514 0.499 0.412 0.414 0.479
[0.108 ] [0.089 ] [0.088 ] [0.091 ] [0.086 ]
[ 7] virilis 0.452 0.498 0.419 0.382 0.388 0.465
[0.076 ] [0.073 ] [0.080 ] [0.094 ]
[ 8] saltans 0.561 0.501 0.484 0.529 0.494 0.408 0.315
[0.035 ] [0.045 ] [0.056 ]
[ 9] willistoni 0.520 0.501 0.459 0.459 0.505 0.405 0.301 0.123
[0.045 ] [0.059 ]
[10] guarani 0.508 0.490 0.455 0.547 0.457 0.360 0.299 0.138 0.148
[0.065 ]
[11] tripunctata 0.587 0.523 0.455 0.618 0.491 0.369 0.338 0.176 0.194 0.181

SUPPLEMENTARY MATERIAL CHAPTER 3
162
Table S6. Estimates of dS values for COI data set. Average values between 28 species groups of Drosophilidae. Values calculated on MEGA V4 based in the pairwise analysis of 157 sequences in a dataset of 367 positions, gaps and missing data were eliminated by pairwise deletion. Values above the diagonal show standard errors obtained by bootstrap procedure (500 replicates).
1 2 3 4 5 6 7 8 9 10 11 12 13 14 15 16 17 18 19 20 21 22 23 24 25 26 27 28 ]
[ 1] Hawaiians
0.08 0.05 0.06 0.07 0.10 0.06 0.06 0.07 0.06 0.08 0.06 0.06 0.05 0.06 0.08 0.05 0.06 0.06 0.08 0.06 0.04 0.06 0.06 0.07 0.05 0.06 0.06 [ 2] Scaptodrosophila 0.63
0.08 0.07 0.06 0.11 0.09 0.07 0.11 0.09 0.11 0.08 0.07 0.08 0.07 0.07 0.08 0.07 0.07 0.10 0.10 0.06 0.09 0.08 0.08 0.06 0.09 0.07
[ 3] Scaptomyza 0.45 0.59
0.07 0.08 0.09 0.08 0.07 0.07 0.06 0.08 0.07 0.06 0.07 0.07 0.09 0.06 0.06 0.05 0.09 0.07 0.05 0.08 0.07 0.08 0.05 0.08 0.06 [ 4] Zaprionus 0.46 0.51 0.46
0.08 0.13 0.07 0.08 0.09 0.07 0.09 0.07 0.07 0.07 0.06 0.08 0.06 0.06 0.06 0.09 0.09 0.05 0.08 0.06 0.08 0.07 0.09 0.06
[ 5] ananassae 0.56 0.46 0.55 0.48
0.12 0.08 0.08 0.09 0.09 0.09 0.10 0.07 0.09 0.06 0.06 0.08 0.06 0.07 0.10 0.08 0.05 0.08 0.08 0.07 0.06 0.07 0.06 [ 6] annulimana 0.70 0.74 0.58 0.71 0.64
0.12 0.09 0.13 0.10 0.15 0.09 0.09 0.09 0.12 0.11 0.09 0.09 0.10 0.12 0.10 0.08 0.10 0.09 0.10 0.09 0.10 0.09
[ 7] atalaia 0.45 0.56 0.51 0.34 0.43 0.64
0.07 0.10 0.08 0.10 0.08 0.08 0.08 0.09 0.09 0.09 0.07 0.07 0.10 0.08 0.06 0.08 0.07 0.10 0.07 0.08 0.09 [ 8] calloptera 0.44 0.50 0.41 0.40 0.42 0.48 0.36
0.10 0.06 0.09 0.08 0.06 0.07 0.09 0.10 0.07 0.08 0.08 0.08 0.09 0.06 0.08 0.07 0.08 0.07 0.07 0.07
[ 9] canalinea 0.52 0.65 0.41 0.44 0.49 0.69 0.50 0.51
0.09 0.11 0.09 0.08 0.09 0.06 0.09 0.08 0.06 0.08 0.11 0.11 0.07 0.09 0.08 0.07 0.07 0.10 0.07 [10] cardini 0.48 0.60 0.44 0.40 0.54 0.55 0.44 0.31 0.50
0.09 0.08 0.06 0.07 0.07 0.09 0.06 0.07 0.07 0.09 0.07 0.06 0.08 0.07 0.07 0.06 0.07 0.08
[11] funebris 0.57 0.67 0.50 0.49 0.51 0.74 0.52 0.48 0.57 0.53
0.10 0.09 0.08 0.08 0.11 0.09 0.08 0.10 0.12 0.10 0.08 0.11 0.10 0.09 0.10 0.12 0.09 [12] guarani 0.46 0.53 0.45 0.37 0.53 0.50 0.39 0.37 0.45 0.44 0.55
0.07 0.06 0.08 0.09 0.07 0.06 0.06 0.07 0.08 0.05 0.09 0.06 0.09 0.07 0.08 0.07
[13] immigrans 0.59 0.60 0.52 0.47 0.49 0.61 0.53 0.41 0.54 0.43 0.63 0.50
0.08 0.07 0.08 0.06 0.07 0.06 0.08 0.09 0.05 0.08 0.07 0.07 0.05 0.07 0.07 [14] melanica 0.52 0.65 0.49 0.45 0.57 0.54 0.50 0.47 0.56 0.49 0.51 0.38 0.64
0.06 0.07 0.06 0.06 0.06 0.10 0.08 0.05 0.08 0.06 0.07 0.06 0.08 0.06
[15] melanogaster 0.60 0.54 0.56 0.41 0.43 0.76 0.57 0.56 0.38 0.51 0.52 0.50 0.58 0.51
0.05 0.06 0.06 0.07 0.09 0.08 0.05 0.08 0.06 0.06 0.06 0.08 0.06 [16] montium 0.65 0.51 0.62 0.51 0.38 0.67 0.53 0.58 0.51 0.53 0.65 0.52 0.59 0.54 0.44
0.07 0.06 0.07 0.09 0.11 0.06 0.10 0.09 0.07 0.07 0.09 0.06
[17] nanoptera 0.52 0.59 0.47 0.44 0.55 0.57 0.54 0.41 0.52 0.41 0.58 0.42 0.53 0.49 0.51 0.53
0.06 0.06 0.10 0.08 0.05 0.07 0.07 0.07 0.06 0.06 0.07 [18] obscura 0.58 0.58 0.49 0.46 0.50 0.62 0.48 0.52 0.44 0.53 0.61 0.46 0.58 0.51 0.49 0.51 0.53
0.05 0.09 0.07 0.05 0.08 0.06 0.06 0.06 0.08 0.05
[19] polychaeta 0.50 0.54 0.43 0.43 0.51 0.60 0.44 0.49 0.49 0.47 0.59 0.38 0.48 0.53 0.55 0.53 0.50 0.48
0.08 0.07 0.04 0.07 0.06 0.08 0.05 0.07 0.06 [20] putrida 0.54 0.62 0.53 0.44 0.52 0.57 0.44 0.39 0.51 0.43 0.58 0.34 0.53 0.55 0.55 0.48 0.55 0.54 0.44
0.08 0.07 0.10 0.08 0.09 0.08 0.10 0.10
[21] quinaria 0.43 0.59 0.43 0.44 0.45 0.53 0.36 0.40 0.50 0.37 0.49 0.40 0.55 0.45 0.51 0.60 0.50 0.46 0.44 0.36
0.07 0.08 0.07 0.09 0.07 0.08 0.09 [22] repleta 0.53 0.63 0.51 0.45 0.53 0.61 0.53 0.47 0.52 0.52 0.59 0.46 0.55 0.50 0.55 0.59 0.52 0.56 0.49 0.52 0.52
0.06 0.05 0.06 0.05 0.05 0.04
[23] robusta 0.48 0.62 0.55 0.46 0.49 0.57 0.41 0.42 0.51 0.48 0.61 0.46 0.58 0.51 0.59 0.62 0.53 0.61 0.49 0.51 0.44 0.51
0.07 0.08 0.07 0.07 0.07 [24] rubrifrons 0.45 0.55 0.45 0.31 0.48 0.45 0.35 0.38 0.39 0.40 0.54 0.27 0.48 0.41 0.43 0.58 0.43 0.46 0.38 0.37 0.34 0.48 0.36
0.08 0.06 0.08 0.07
[25] saltans 0.56 0.63 0.58 0.54 0.50 0.65 0.61 0.49 0.47 0.51 0.56 0.54 0.58 0.53 0.52 0.54 0.58 0.53 0.59 0.53 0.53 0.56 0.60 0.57
0.06 0.09 0.06 [26] tripunctata 0.67 0.62 0.57 0.58 0.56 0.69 0.59 0.55 0.55 0.57 0.74 0.54 0.59 0.61 0.59 0.58 0.57 0.61 0.56 0.58 0.57 0.60 0.65 0.55 0.65
0.06 0.05
[27] virilis 0.53 0.69 0.54 0.57 0.54 0.63 0.49 0.45 0.62 0.52 0.70 0.53 0.63 0.57 0.66 0.61 0.50 0.70 0.55 0.60 0.49 0.55 0.46 0.50 0.72 0.63
0.07 [28] willistoni 0.53 0.54 0.48 0.44 0.42 0.60 0.58 0.42 0.47 0.55 0.55 0.43 0.56 0.49 0.49 0.48 0.52 0.45 0.46 0.59 0.56 0.48 0.51 0.47 0.48 0.57 0.59

SUPPLEMENTARY MATERIAL CHAPTER 3
163
Table S7. Estimates of dS values for COII data set. Average values between 29 species groups of Drosophilidae. Distances calculated on MEGA V4 based in the pairwise analysis of 174 sequences in a dataset of 658 positions, gaps and missing data were eliminated by pairwise deletion. Values above the diagonal show standard errors obtained by bootstrap procedure (500 replicates).
1 2 3 4 5 6 7 8 9 10 11 12 13 14 15 16 17 18 19 20 21 22 23 24 25 26 27 28 29 ]
[ 1] Hawaiians
0.06 0.05 0.04 0.05 0.08 0.07 0.06 0.07 0.05 0.06 0.05 0.06 0.04 0.06 0.04 0.04 0.05 0.04 0.05 0.06 0.05 0.04 0.05 0.06 0.04 0.05 0.05 0.05 [ 2] Scaptodrosophila 0.69
0.07 0.06 0.06 0.11 0.09 0.08 0.07 0.06 0.10 0.08 0.07 0.05 0.07 0.06 0.07 0.06 0.05 0.07 0.09 0.06 0.05 0.07 0.08 0.06 0.06 0.06 0.05
[ 3] Scaptomyza 0.64 0.71
0.06 0.07 0.12 0.08 0.09 0.08 0.07 0.07 0.07 0.08 0.06 0.07 0.06 0.07 0.07 0.06 0.07 0.08 0.07 0.05 0.07 0.08 0.06 0.06 0.06 0.06 [ 4] Zaprionus 0.46 0.61 0.57
0.06 0.09 0.07 0.07 0.08 0.05 0.08 0.05 0.06 0.05 0.06 0.04 0.04 0.05 0.05 0.05 0.06 0.05 0.04 0.05 0.06 0.04 0.05 0.05 0.05
[ 5] ananassae 0.55 0.53 0.67 0.49
0.12 0.09 0.06 0.08 0.05 0.09 0.06 0.08 0.04 0.07 0.04 0.05 0.06 0.05 0.05 0.07 0.07 0.05 0.07 0.08 0.05 0.05 0.06 0.05 [ 6] annulimana 0.68 0.77 0.85 0.66 0.74
0.12 0.12 0.13 0.10 0.10 0.11 0.10 0.10 0.10 0.09 0.09 0.09 0.10 0.12 0.10 0.12 0.07 0.11 0.14 0.09 0.10 0.10 0.09
[ 7] atalaia 0.63 0.72 0.68 0.56 0.65 0.73
0.11 0.09 0.07 0.08 0.09 0.12 0.07 0.08 0.08 0.09 0.07 0.08 0.09 0.10 0.09 0.06 0.06 0.09 0.07 0.08 0.09 0.08 [ 8] calloptera 0.59 0.60 0.73 0.53 0.47 0.71 0.76
0.08 0.07 0.08 0.07 0.07 0.06 0.07 0.07 0.06 0.07 0.06 0.07 0.09 0.07 0.06 0.08 0.09 0.07 0.07 0.08 0.07
[ 9] canalinea 0.62 0.64 0.72 0.58 0.57 0.72 0.58 0.55
0.08 0.10 0.09 0.09 0.07 0.07 0.07 0.07 0.08 0.07 0.08 0.09 0.08 0.06 0.08 0.11 0.07 0.08 0.08 0.08 [10] cardini 0.50 0.60 0.67 0.45 0.48 0.67 0.55 0.58 0.58
0.07 0.05 0.07 0.05 0.06 0.06 0.06 0.06 0.05 0.06 0.06 0.06 0.05 0.07 0.06 0.05 0.05 0.07 0.05
[11] funebris 0.53 0.74 0.62 0.53 0.58 0.61 0.52 0.59 0.67 0.46
0.09 0.11 0.07 0.09 0.09 0.09 0.09 0.08 0.08 0.08 0.08 0.06 0.07 0.07 0.07 0.06 0.08 0.08 [12] guarani 0.53 0.62 0.66 0.42 0.41 0.71 0.63 0.45 0.60 0.43 0.53
0.07 0.05 0.07 0.06 0.05 0.06 0.05 0.05 0.06 0.07 0.05 0.06 0.07 0.05 0.04 0.07 0.06
[13] guttifera 0.56 0.57 0.65 0.41 0.56 0.64 0.78 0.45 0.58 0.54 0.66 0.52
0.05 0.07 0.06 0.06 0.07 0.06 0.07 0.07 0.06 0.06 0.08 0.09 0.07 0.06 0.06 0.06 [14] immigrans 0.57 0.59 0.64 0.49 0.45 0.76 0.60 0.54 0.59 0.51 0.59 0.49 0.45
0.05 0.04 0.05 0.05 0.05 0.05 0.06 0.05 0.04 0.05 0.06 0.04 0.05 0.05 0.05
[15] melanica 0.57 0.62 0.69 0.54 0.58 0.73 0.58 0.60 0.58 0.57 0.63 0.55 0.52 0.53
0.06 0.05 0.07 0.05 0.07 0.07 0.06 0.05 0.06 0.08 0.05 0.06 0.06 0.06 [16] melanogaster 0.56 0.59 0.68 0.44 0.41 0.70 0.65 0.59 0.57 0.58 0.71 0.51 0.52 0.52 0.57
0.04 0.06 0.04 0.05 0.07 0.05 0.04 0.05 0.07 0.05 0.05 0.05 0.05
[17] montium 0.56 0.65 0.70 0.44 0.40 0.70 0.72 0.49 0.53 0.57 0.70 0.46 0.48 0.53 0.51 0.44
0.06 0.04 0.05 0.06 0.05 0.04 0.06 0.08 0.05 0.05 0.06 0.05 [18] nannoptera 0.58 0.65 0.70 0.49 0.54 0.66 0.56 0.59 0.63 0.55 0.63 0.52 0.58 0.52 0.69 0.57 0.57
0.05 0.06 0.08 0.06 0.05 0.06 0.08 0.05 0.06 0.06 0.05
[19] obscura 0.60 0.62 0.70 0.50 0.47 0.83 0.65 0.57 0.58 0.57 0.63 0.52 0.60 0.57 0.58 0.49 0.49 0.59
0.06 0.06 0.05 0.04 0.05 0.08 0.04 0.05 0.05 0.05 [20] polychaeta 0.62 0.67 0.71 0.48 0.48 0.83 0.73 0.60 0.68 0.55 0.64 0.49 0.57 0.54 0.63 0.57 0.55 0.62 0.63
0.07 0.06 0.05 0.07 0.06 0.05 0.05 0.07 0.05
[21] putrida 0.57 0.70 0.68 0.46 0.49 0.67 0.69 0.62 0.65 0.46 0.48 0.44 0.46 0.55 0.52 0.55 0.50 0.63 0.57 0.58
0.07 0.06 0.08 0.09 0.07 0.06 0.07 0.07 [22] quinaria 0.47 0.50 0.60 0.42 0.50 0.73 0.60 0.43 0.58 0.44 0.53 0.47 0.38 0.49 0.50 0.48 0.45 0.48 0.49 0.53 0.43
0.05 0.07 0.08 0.06 0.05 0.06 0.06
[23] repleta 0.57 0.61 0.65 0.50 0.55 0.66 0.59 0.64 0.57 0.57 0.59 0.53 0.56 0.57 0.57 0.54 0.54 0.58 0.59 0.63 0.65 0.54
0.05 0.06 0.03 0.05 0.04 0.04 [24] robusta 0.58 0.64 0.70 0.49 0.58 0.77 0.48 0.63 0.60 0.60 0.53 0.51 0.62 0.55 0.53 0.53 0.58 0.53 0.57 0.69 0.66 0.52 0.58
0.07 0.05 0.06 0.07 0.06
[25] rubifrons 0.55 0.68 0.66 0.48 0.59 0.77 0.61 0.62 0.69 0.48 0.44 0.48 0.57 0.53 0.58 0.56 0.63 0.60 0.71 0.55 0.58 0.51 0.58 0.57
0.06 0.06 0.08 0.06 [26] saltans 0.51 0.57 0.65 0.40 0.41 0.68 0.53 0.55 0.56 0.49 0.55 0.45 0.54 0.49 0.51 0.45 0.48 0.46 0.49 0.53 0.55 0.45 0.49 0.49 0.44
0.05 0.06 0.04
[27] tripunctata 0.56 0.59 0.66 0.48 0.49 0.75 0.63 0.57 0.65 0.49 0.50 0.41 0.49 0.51 0.60 0.52 0.53 0.56 0.56 0.59 0.47 0.46 0.58 0.57 0.52 0.51
0.06 0.05 [28] virilis 0.57 0.61 0.61 0.48 0.53 0.69 0.66 0.59 0.57 0.56 0.60 0.56 0.50 0.53 0.57 0.51 0.52 0.56 0.61 0.65 0.55 0.52 0.54 0.60 0.62 0.52 0.60
0.05
[29] willistoni 0.55 0.59 0.65 0.45 0.45 0.68 0.64 0.56 0.59 0.50 0.60 0.50 0.46 0.52 0.57 0.48 0.52 0.53 0.55 0.58 0.58 0.50 0.52 0.58 0.51 0.38 0.57 0.52

SUPPLEMENTARY MATERIAL CHAPTER 3
164
Table S8. Estimates of ds values for ND2 data set. Average values between 28 species groups of Drosophilidae. Distances calculated on MEGA V4 based in the pairwise analysis of 157 sequences in a dataset of 479 positions, gaps and missing data were eliminated by pairwise deletion. Values above the diagonal show standard errors obtained by bootstrap procedure (500 replicates).
1 2 3 4 5 6 7 8 9 10 11 12 13 14 15 16 17 18 19 20 21 22 23 24 25 26 27 28 ]
[ 1] Hawaiians
0.08 0.08 0.07 0.06 0.06 0.08 0.12 0.08 0.10 0.07 0.07 0.07 0.06 0.05 0.07 0.06 0.06 0.06 0.08 0.06 0.05 0.06 0.06 0.05 0.06 0.06 0.05 [ 2] Scaptodrosophila 0.68
0.11 0.10 0.09 0.08 0.12 0.11 0.10 0.12 0.09 0.10 0.09 0.08 0.10 0.10 0.09 0.07 0.09 0.10 0.10 0.08 0.08 0.11 0.09 0.08 0.11 0.11
[ 3] Scaptomyza 0.55 0.80
0.10 0.09 0.08 0.12 0.10 0.09 0.11 0.07 0.12 0.09 0.08 0.08 0.09 0.08 0.07 0.08 0.14 0.10 0.07 0.08 0.09 0.07 0.08 0.09 0.08 [ 4] Zaprionus 0.48 0.69 0.56
0.08 0.08 0.12 0.13 0.08 0.12 0.08 0.09 0.08 0.06 0.08 0.09 0.07 0.08 0.07 0.11 0.09 0.07 0.08 0.07 0.07 0.07 0.08 0.08
[ 5] ananassae 0.46 0.65 0.58 0.41
0.07 0.09 0.09 0.07 0.12 0.07 0.07 0.08 0.06 0.05 0.07 0.07 0.07 0.08 0.07 0.05 0.05 0.06 0.07 0.06 0.05 0.07 0.06 [ 6] annulimana 0.54 0.64 0.56 0.51 0.49
0.11 0.09 0.08 0.11 0.06 0.07 0.07 0.06 0.06 0.07 0.06 0.06 0.07 0.11 0.07 0.05 0.07 0.08 0.05 0.06 0.07 0.06
[ 7] atalaia 0.52 0.78 0.66 0.61 0.48 0.61
0.13 0.08 0.18 0.08 0.10 0.10 0.10 0.09 0.12 0.09 0.10 0.09 0.11 0.09 0.08 0.09 0.10 0.08 0.09 0.12 0.08 [ 8] calloptera 0.69 0.66 0.53 0.64 0.50 0.54 0.66
0.09 0.17 0.09 0.11 0.09 0.10 0.11 0.13 0.08 0.08 0.10 0.14 0.09 0.08 0.09 0.10 0.10 0.08 0.11 0.11
[ 9] cardini 0.52 0.63 0.50 0.41 0.36 0.48 0.41 0.43
0.18 0.07 0.08 0.09 0.07 0.06 0.10 0.06 0.06 0.07 0.09 0.08 0.06 0.06 0.10 0.08 0.07 0.09 0.08 [10] funebrs 0.64 0.75 0.62 0.63 0.67 0.68 0.79 0.74 0.85
0.13 0.18 0.09 0.11 0.10 0.10 0.10 0.10 0.12 0.17 0.10 0.10 0.10 0.13 0.11 0.11 0.10 0.12
[11] guarani 0.48 0.59 0.42 0.43 0.38 0.40 0.38 0.42 0.32 0.65
0.08 0.07 0.08 0.06 0.08 0.06 0.06 0.07 0.09 0.07 0.05 0.07 0.08 0.06 0.06 0.07 0.08 [12] guttifera 0.47 0.66 0.64 0.41 0.37 0.41 0.50 0.54 0.38 0.78 0.37
0.11 0.07 0.07 0.10 0.07 0.07 0.07 0.09 0.08 0.07 0.08 0.07 0.07 0.08 0.07 0.08
[13] immigrans 0.65 0.73 0.68 0.58 0.62 0.60 0.67 0.62 0.59 0.65 0.52 0.65
0.08 0.07 0.07 0.07 0.07 0.07 0.10 0.07 0.06 0.07 0.07 0.08 0.07 0.08 0.08 [14] melanica 0.45 0.58 0.51 0.37 0.39 0.45 0.56 0.52 0.39 0.59 0.44 0.38 0.62
0.07 0.08 0.06 0.06 0.07 0.09 0.07 0.05 0.06 0.08 0.06 0.05 0.07 0.08
[15] melanogaster 0.43 0.70 0.55 0.46 0.34 0.44 0.52 0.63 0.36 0.58 0.36 0.38 0.61 0.43
0.07 0.06 0.07 0.07 0.08 0.06 0.05 0.06 0.07 0.05 0.06 0.07 0.05 [16] montium 0.50 0.77 0.59 0.56 0.47 0.50 0.64 0.72 0.55 0.63 0.47 0.54 0.62 0.57 0.47
0.07 0.07 0.09 0.12 0.08 0.07 0.07 0.08 0.06 0.07 0.09 0.07
[17] nannoptera 0.50 0.68 0.56 0.40 0.44 0.47 0.53 0.49 0.38 0.59 0.37 0.37 0.55 0.42 0.41 0.54
0.05 0.07 0.10 0.07 0.05 0.06 0.08 0.05 0.06 0.07 0.06 [18] obscura 0.56 0.63 0.55 0.53 0.47 0.50 0.62 0.51 0.42 0.64 0.38 0.47 0.61 0.47 0.49 0.57 0.46
0.07 0.09 0.07 0.05 0.06 0.07 0.05 0.06 0.07 0.07
[19] polychaeta 0.58 0.74 0.57 0.45 0.56 0.57 0.62 0.57 0.45 0.73 0.47 0.48 0.65 0.55 0.57 0.67 0.52 0.61
0.12 0.08 0.05 0.07 0.07 0.06 0.06 0.08 0.07 [20] putrida 0.58 0.69 0.74 0.57 0.42 0.66 0.59 0.69 0.47 0.81 0.44 0.45 0.73 0.53 0.48 0.69 0.67 0.58 0.78
0.09 0.09 0.09 0.09 0.09 0.07 0.09 0.09
[21] quinaria 0.45 0.68 0.54 0.49 0.31 0.47 0.51 0.50 0.40 0.52 0.35 0.36 0.51 0.44 0.40 0.45 0.43 0.49 0.54 0.47
0.06 0.08 0.07 0.06 0.06 0.07 0.07 [22] repleta 0.50 0.71 0.54 0.47 0.44 0.50 0.61 0.55 0.47 0.66 0.42 0.51 0.61 0.44 0.45 0.56 0.47 0.55 0.53 0.61 0.44
0.05 0.06 0.05 0.05 0.07 0.05
[23] robusta 0.45 0.59 0.53 0.48 0.41 0.47 0.55 0.48 0.33 0.61 0.42 0.46 0.55 0.37 0.39 0.46 0.42 0.46 0.52 0.54 0.49 0.45
0.06 0.06 0.05 0.07 0.07 [24] rubrifrons 0.46 0.70 0.53 0.37 0.41 0.50 0.54 0.54 0.45 0.67 0.40 0.33 0.55 0.43 0.42 0.47 0.47 0.48 0.49 0.50 0.40 0.48 0.33
0.07 0.06 0.08 0.07
[25] saltans 0.40 0.67 0.45 0.45 0.39 0.46 0.48 0.58 0.43 0.61 0.36 0.39 0.62 0.42 0.33 0.44 0.38 0.46 0.51 0.50 0.39 0.45 0.42 0.45
0.06 0.06 0.04 [26] tripunctata 0.53 0.64 0.58 0.45 0.37 0.51 0.57 0.52 0.43 0.69 0.40 0.46 0.64 0.45 0.45 0.56 0.53 0.50 0.55 0.47 0.40 0.50 0.44 0.43 0.49
0.06 0.06
[27] virilis 0.52 0.82 0.59 0.52 0.49 0.54 0.71 0.61 0.52 0.60 0.44 0.42 0.67 0.52 0.53 0.58 0.53 0.55 0.63 0.54 0.46 0.57 0.54 0.51 0.45 0.52
0.08 [28] willistoni 0.44 0.77 0.50 0.49 0.41 0.50 0.48 0.58 0.41 0.66 0.45 0.45 0.66 0.51 0.34 0.47 0.46 0.54 0.56 0.51 0.44 0.43 0.43 0.42 0.31 0.51 0.54

SUPPLEMENTARY MATERIAL CHAPTER 3
165
Table S9. Estimates of ds values for SinA data set. Average values between 29 species groups of Drosophilidae. Distances calculated on MEGA V4 based in the pairwise analysis of 154 sequences in a dataset of 132 positions, gaps and missing data were eliminated by pairwise deletion. Values above the diagonal show standard errors obtained by bootstrap procedure (500 replicates).
1 2 3 4 5 6 7 8 9 10 11 12 13 14 15 16 17 18 19 20 21 22 23 24 25 26 27 28 29 ]
[ 1] Hawaiian
0.10 0.03 0.08 0.13 0.05 0.06 0.07 0.06 0.08 0.05 0.07 0.05 0.06 0.06 0.14 0.11 0.06 0.08 0.05 0.07 0.05 0.05 0.06 0.05 0.15 0.07 0.06 0.13 [ 2] Scaptodrosophila 0.71
0.13 0.15 0.13 0.10 0.13 0.11 0.12 0.11 0.11 0.09 0.11 0.09 0.11 0.15 0.11 0.13 0.09 0.12 0.11 0.11 0.08 0.10 0.11 0.15 0.09 0.09 0.10
[ 3] Scaptomyza 0.15 0.82
0.09 0.12 0.05 0.06 0.08 0.07 0.09 0.06 0.09 0.06 0.08 0.06 0.13 0.11 0.07 0.09 0.05 0.07 0.06 0.05 0.06 0.07 0.18 0.08 0.06 0.15 [ 4] Zaprionus 0.45 0.95 0.53
0.16 0.09 0.08 0.10 0.09 0.08 0.08 0.09 0.07 0.09 0.09 0.15 0.12 0.09 0.11 0.09 0.09 0.07 0.08 0.11 0.08 0.16 0.08 0.09 0.13
[ 5] ananassae 0.79 0.85 0.75 0.94
0.15 0.15 0.13 0.16 0.20 0.14 0.12 0.14 0.13 0.12 0.07 0.07 0.16 0.10 0.14 0.16 0.16 0.13 0.12 0.19 0.30 0.13 0.13 0.22 [ 6] annulimana 0.29 0.72 0.32 0.58 0.86
0.05 0.07 0.06 0.08 0.06 0.09 0.06 0.08 0.05 0.14 0.12 0.05 0.10 0.06 0.07 0.05 0.04 0.06 0.07 0.20 0.07 0.04 0.16
[ 7] atalaia 0.26 0.80 0.29 0.45 0.85 0.24
0.09 0.07 0.09 0.07 0.10 0.06 0.08 0.06 0.17 0.15 0.04 0.09 0.06 0.08 0.07 0.05 0.07 0.06 0.17 0.08 0.06 0.15 [ 8] callopera 0.39 0.70 0.46 0.53 0.83 0.44 0.50
0.08 0.06 0.08 0.09 0.08 0.09 0.08 0.16 0.11 0.10 0.12 0.07 0.08 0.06 0.07 0.09 0.07 0.19 0.05 0.08 0.17
[ 9] canalinea 0.34 0.79 0.39 0.54 0.88 0.29 0.32 0.48
0.08 0.06 0.10 0.07 0.08 0.07 0.19 0.15 0.07 0.10 0.08 0.08 0.06 0.04 0.07 0.07 0.14 0.08 0.07 0.14 [10] cardini 0.47 0.80 0.54 0.48 1.04 0.52 0.48 0.32 0.51
0.07 0.08 0.08 0.08 0.10 0.23 0.17 0.09 0.14 0.08 0.09 0.06 0.08 0.11 0.06 0.19 0.06 0.10 0.15
[11] funebris 0.24 0.79 0.34 0.43 0.79 0.32 0.35 0.41 0.31 0.41
0.08 0.06 0.08 0.06 0.15 0.11 0.07 0.09 0.06 0.05 0.04 0.05 0.07 0.04 0.23 0.06 0.06 0.17 [12] guarani 0.39 0.62 0.47 0.54 0.75 0.47 0.54 0.50 0.51 0.51 0.44
0.08 0.05 0.08 0.12 0.10 0.11 0.08 0.08 0.10 0.07 0.07 0.08 0.08 0.18 0.07 0.09 0.14
[13] guttifera 0.25 0.76 0.30 0.41 0.83 0.37 0.31 0.46 0.35 0.43 0.26 0.41
0.07 0.06 0.13 0.11 0.07 0.08 0.06 0.07 0.05 0.05 0.07 0.06 0.17 0.06 0.06 0.13 [14] immigrans 0.45 0.71 0.54 0.62 0.87 0.51 0.52 0.55 0.50 0.58 0.50 0.36 0.47
0.07 0.12 0.09 0.08 0.09 0.08 0.09 0.07 0.06 0.07 0.07 0.18 0.06 0.06 0.13
[15] melanica 0.30 0.74 0.34 0.56 0.73 0.32 0.34 0.47 0.38 0.58 0.36 0.42 0.36 0.49
0.13 0.10 0.07 0.10 0.06 0.08 0.06 0.04 0.03 0.07 0.20 0.08 0.05 0.14 [16] melanogaster 0.80 0.91 0.77 0.86 0.44 0.82 0.91 0.88 0.97 1.07 0.84 0.69 0.78 0.75 0.76
0.04 0.16 0.08 0.14 0.17 0.15 0.15 0.12 0.20 0.40 0.12 0.11 0.25
[17] montium 0.71 0.81 0.70 0.75 0.48 0.74 0.84 0.68 0.87 0.95 0.70 0.61 0.69 0.68 0.65 0.28
0.14 0.07 0.11 0.15 0.12 0.11 0.11 0.15 0.37 0.09 0.10 0.20 [18] nannoptera 0.34 0.83 0.38 0.50 0.89 0.31 0.20 0.60 0.38 0.54 0.41 0.61 0.38 0.57 0.43 0.89 0.84
0.09 0.08 0.08 0.07 0.06 0.08 0.07 0.16 0.08 0.06 0.17
[19] obscura 0.49 0.64 0.53 0.68 0.63 0.56 0.48 0.71 0.59 0.76 0.54 0.46 0.49 0.56 0.57 0.47 0.48 0.51
0.09 0.09 0.09 0.08 0.09 0.09 0.20 0.08 0.09 0.15 [20] polychaeta 0.26 0.81 0.29 0.53 0.85 0.34 0.35 0.36 0.43 0.46 0.33 0.43 0.32 0.52 0.35 0.81 0.68 0.45 0.55
0.07 0.05 0.06 0.07 0.06 0.15 0.06 0.06 0.12
[21] putrida 0.36 0.82 0.43 0.49 0.92 0.40 0.40 0.48 0.43 0.49 0.23 0.60 0.35 0.57 0.45 0.99 0.90 0.47 0.59 0.40
0.05 0.07 0.09 0.05 0.23 0.08 0.07 0.18 [22] quinaria 0.23 0.75 0.34 0.39 0.86 0.29 0.30 0.34 0.31 0.33 0.13 0.40 0.24 0.47 0.34 0.83 0.70 0.41 0.52 0.28 0.20
0.05 0.07 0.04 0.20 0.06 0.06 0.16
[23] repleta 0.30 0.66 0.36 0.52 0.82 0.32 0.31 0.48 0.23 0.55 0.33 0.44 0.34 0.44 0.32 0.91 0.78 0.40 0.55 0.38 0.46 0.33
0.05 0.06 0.17 0.07 0.05 0.13 [24] robusta 0.33 0.69 0.37 0.65 0.75 0.35 0.40 0.53 0.43 0.66 0.42 0.43 0.42 0.48 0.12 0.73 0.68 0.50 0.56 0.40 0.53 0.42 0.35
0.08 0.24 0.08 0.05 0.19
[25] rubifrons 0.27 0.80 0.38 0.45 0.94 0.39 0.32 0.37 0.35 0.35 0.16 0.48 0.31 0.49 0.38 1.02 0.87 0.38 0.52 0.35 0.19 0.14 0.36 0.45
0.20 0.06 0.06 0.16 [26] saltans 0.82 0.94 0.92 0.90 1.28 1.07 0.93 0.98 0.79 0.98 1.03 0.97 0.91 1.02 1.01 1.70 1.45 0.90 1.05 0.86 1.07 0.97 0.92 1.14 0.98
0.19 0.21 0.04
[27] tripunctata 0.50 0.73 0.57 0.52 0.83 0.53 0.50 0.32 0.51 0.40 0.40 0.51 0.42 0.52 0.54 0.77 0.66 0.59 0.57 0.43 0.50 0.38 0.52 0.58 0.37 1.04
0.07 0.15 [28] virilis 0.31 0.64 0.36 0.56 0.84 0.26 0.29 0.48 0.35 0.61 0.35 0.52 0.32 0.44 0.25 0.67 0.65 0.32 0.52 0.35 0.38 0.34 0.32 0.27 0.36 1.09 0.54
0.16
[29] willistoni 0.76 0.72 0.84 0.78 1.14 0.93 0.84 0.95 0.84 0.91 0.91 0.87 0.80 0.93 0.84 1.23 1.07 0.94 0.91 0.79 0.94 0.86 0.82 1.01 0.90 0.22 0.93 0.96

166
V. CONCLUSIONS

V. CONCLUSIONS
167
In this study, a cophylogenetic analysis of a DNA transposon and its host has been
performed. The long-term evolutionary dynamic of Galileo is studied in the context of
the phylogeny of 174 species of Drosophilidae. In order to obtain a robust host
species phylogeny, the evolutionary relationships at different taxonomic levels were
revised with the addition of new taxa and using different phylogenetic methodologies.
The following conclusions can be drawn from this work:
1. In a taxonomic inventory of Drosophilidae a new species of cactophilic
spotted-thorax diptera was discovered and has been formally described as
Drosophila machalilla.
2. Based in a cladistics analysis of 52 morphological traits of males, females and
inmatures stages of the new species and representative taxa of four species
groups, the new species group atalaia is erected.
3. The molecular phylogenetic analysis uncovered that the nannoptera species
group is closely related to D. machalilla. The dating analysis estimates that
these lineages diverged around 16.9 Mya.
4. For the first time the inca subgroup has been included in a phylogenetic and
biogeographical analysis. The inca clade, endemic from Ecuador and Peru is
the first diverging lineage within the repleta radiation. This support the
hypothesis of a South American origin of this lineage.
5. The results obtained in the biogeographical analysis of 51 taxa of the repleta,
nannoptera and atalaia species groups are the bases to propose that
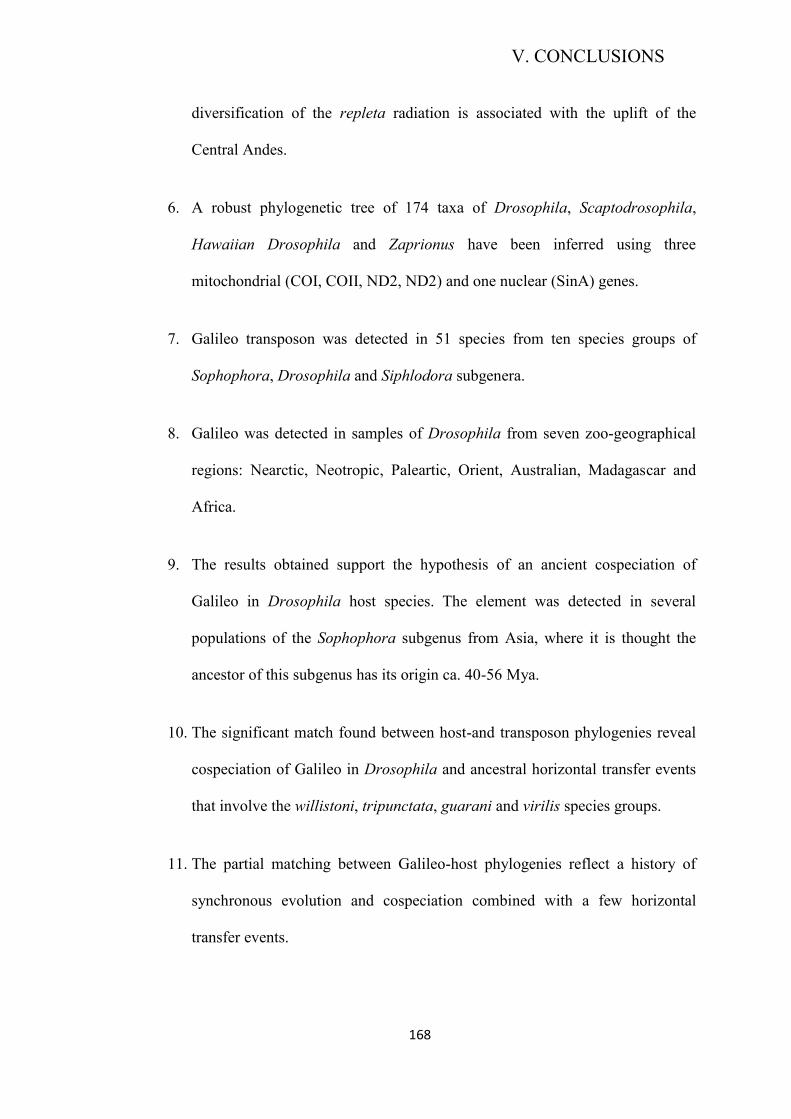
V. CONCLUSIONS
168
diversification of the repleta radiation is associated with the uplift of the
Central Andes.
6. A robust phylogenetic tree of 174 taxa of Drosophila, Scaptodrosophila,
Hawaiian Drosophila and Zaprionus have been inferred using three
mitochondrial (COI, COII, ND2, ND2) and one nuclear (SinA) genes.
7. Galileo transposon was detected in 51 species from ten species groups of
Sophophora, Drosophila and Siphlodora subgenera.
8. Galileo was detected in samples of Drosophila from seven zoo-geographical
regions: Nearctic, Neotropic, Paleartic, Orient, Australian, Madagascar and
Africa.
9. The results obtained support the hypothesis of an ancient cospeciation of
Galileo in Drosophila host species. The element was detected in several
populations of the Sophophora subgenus from Asia, where it is thought the
ancestor of this subgenus has its origin ca. 40-56 Mya.
10. The significant match found between host-and transposon phylogenies reveal
cospeciation of Galileo in Drosophila and ancestral horizontal transfer events
that involve the willistoni, tripunctata, guarani and virilis species groups.
11. The partial matching between Galileo-host phylogenies reflect a history of
synchronous evolution and cospeciation combined with a few horizontal
transfer events.

V. CONCLUSIONS
169
12. The fact that Galileo and its host species recover highly congruent trees inplies
that these entities diversified over the same period of time, therefore
codiversification on transposon and host species has been linked through
ecological and geographical associations.

170
VI. APPENDICES
Appendix 1
171
Appendix 1.
LABORATORY PROTOCOLS
Cetyl-Trimethyl-Ammonium-Bromide (CTAB) DNA extraction protocol.
Protocol used for DNA extraction on the project: Evolutionary Dynamic of Galileo TE in the genus Drosophila. Adapted from the original protocol Doyle & Doyle, 1987. Prepare CTAB buffer at 60ºC.
2. Put 1 to 3 frozen flies into a 1.5 Eppendorf tube and grind in liquid nitrogenwith pestles, keeping tissue frozen the entire time. Use a new pestle for every sample. Soak pestles in bleach water for at least ½ hour before rinsing and autoclaving.
3. Add 500 uL of CTAB buffer and mix the tubes. Make sure the tissue is insolution and not in a clump at the bottom of the tube. Incubate at 55°C for at least one hour, mixing once after 30 minutes. They can stay in the water bath for a few hours if necessary.
4. Add add 500 uL of chloroform and mix by gently shaking tubes. Changegloves immediately if you spill chloroform on them. Be careful not to drip chloroform onto the tubes, it has a low viscosity and drips out of the tip
5. Centrifuge for 7 minutes at 16000 rcf.
6. Transfer the aqueous phase (top layer) into the new labeled tube. Be careful toavoid transferring any chloroform.
7. Estimate the volume of the aqueous phase and add the same volume of coldisopropanol. Mix by inverting tubes 20-30 times.Incubate on ice for 30-40 minutes.
8. Centrifuge for 3 minutes at 16000 rcf.
9. Discard supernatant into isopropanol chemical waste jar. Be careful not todislodge pellet.
10. Add 700 uL 70% EtOH, invert tubes 5-10 times.
11. Centrifuge for 1 minute at 16000 rcf.
12. Discard supernatant; be careful not to dislodge pellet.
13. Use small pieces of Whatman paper to dry the walls of the tube and the usedesiccator of propylene (Kartell) for 15 minutes or until pellet looks dry.
Hydrate pellets with 20 uL of water. Allow to resuspend overnight at room temperature. Store the DNA in the refrigerator the next day.
CTAB Buffer (Sigma)
100 ml 1 M Tris HCl pH 8.0

Appendix 1
172
280 ml 5 M NaCl
40 ml of 0.5 M EDTA
20 g of CTAB (cetyltrimethyl ammonium bromide)
Bring total volume to 1 L with ddH2O.
TE Buffer
10 ml 1 M Tris HCl pH 8.0
2 ml 0.5 M EDTA
Bring total volume to 1 L with ddH2O.
1 M Tris HCl pH 8.0
121.1 g Tris
Dissolve in about 700 ml of H2O.
Bring pH down to 8.0 by adding concentrated HCl (you’ll need about 50 ml).
Bring total volume to 1 L with ddH2O.
0.5 M EDTA
186.12 g EDTA
Add about 700 ml H2O
16-18 g of NaOH pellets
Adjust pH to 8.0 by with a few more pellets, EDTA won’t dissolve until the pH is near 8.0
Bring total volume to 1 L with ddH2O.
5 M NaCl
292.2 g of NaCl
700 ml H2O
Dissolve (don’t add NaCl all at once, it will never go into solution) and bring to 1 L.

Appendix 1
173
Agarose gel procedure
Procedure for agarose gel used on the project: Evolutionary Dynamic of Galileo TE in the genus Drosophila, modified from protocol to running agarose gels by St. Olaf College.
1. Assemble the gel casting tray and comb. The comb should not touch thebottom of the tray.
2. Add agarose to 100 mL of TAE (Tris-Acetate-Edta) Buffer, 1X. Using amicrowave, melt the agarose solution.
3. When the agarose solution has cooled to about 50°C, pour solution directlyinto the casting tray, ensuring that no bubbles get into the gel.
4. Allow the gel to cool. It will solidify and become slightly opaque within 20 to30 minutes. Remove black end pieces.
5. Submerge the gel by adding approximately 1L of TAE 1X running buffer tocover the gel by about a half a centimeter.
6. Carefully remove the comb by lifting it gently at one end, tilting the comb as itcomes out. Ensure that the wells are submerged and filled with buffer.
7. Prepare the DNA samples for loading using gel loading buffer 6X (0.25%bromophenol blue and 0.25% xylene cyanol plus 30% glycerol).
8. Once all the samples are loaded place the cover on the gel apparatus. Connectthe leads so that the red (positive) lead is at the end of the gel to which the DNA will migrate and the black (negative) lead is at the end of the gel containing the wells.
9. Run at a constant voltage of 50-70 volts. When the blue tracking dye (whichruns in these gels along with a DNA fragment of about 200-400 bp) has migrated about 75% of the distance to the end of the gel (usually within 60-90 minutes), turn off the power supply and disconnect the power leads.
10. Transfer the gel into a plastic dish and add enough Ethidium Bromide stainingsolution to cover the gel. Set in a dark drawer for 30 minutes. Visualize the DNA with UV light. Dispose of the gel into the trash. Rinse the light box and tray with water and dry it with paper towels.

Appendix 1
174
PCR clean-up protocol
Protocol used for PCR clean- up of Galileo fragments performed previous the Cloning
protocol and the sample sequencing. Modified from NucleoSpin PCR Clean-up
Manual.
1. Adjust DNA binding condition
For very small sample volumes < 30 μL adjust the volume of the reaction mixture to
50–100 μL with water. Mix 1 volume of sample with 2 volumes of Buffer NTI (e.g.,
mix 100 μL PCR reaction and 200 μL Buffer NTI). Note: For removal of small
fragments like primer dimers dilutions of Buffer NTI can be used instead of 100 %
Buffer NTI.
2. Bind DNA
Place a NucleoSpin® Gel and PCR Clean-up Column into a Collection Tube (2 mL)
and load up to 700 μL sample.
Centrifuge for 30 s at 11,000 x g. Discard flow-through and place the column back
into the collection tube.
Load remaining sample if necessary and repeat the centrifugation step.
3. Wash silica membrane
Add 700 μL Buffer NT3 to the NucleoSpin® Gel and PCR Clean-up Column.
Centrifuge for 30 s at 11,000 x g. Discard flow-through and place the column back
into the collection tube.
4. Dry silica membrane
Centrifuge for 1 min at 11,000 x g to remove Buffer NT3 completely. Make sure the
spin column does not come in contact with the flow-through while removing it from
the centrifuge and the collection tube.
5. Elute DNA
Place the NucleoSpin® Gel and PCR Clean-up Column into a new 1.5 mL
microcentrifuge tube. Add 15–30 μL Buffer NE and incubate at room temperature
(18–25 °C) for 1 min. Centrifuge for 1 min at 11,000 x g.

Appendix 1
175
Cloning protocol.
Protocol used for Cloning of Galileo TE sequences. Adapted from the StrataClone PCR Cloning Manual.
Ligating the insert
Mixture by combining the following components. Add the components in the order given below and mix gently by repeated pipetting.
3 μl StrataClone Cloning Buffer
2 μl of PCR product (5–50 ng, typically a 1:10 dilution of a robust PCR reaction)
1 μl StrataClone Vector Mix amp/kan. Incubate at room temperature for 5 minutes, then place the reaction on ice.
Transforming the competent cells
Add 1 μl of the cloning reaction mixture to a tube of thawed StrataClone SoloPack competent cells. Mix gently (do not mix by repeated pipetting). Incubate the transformation mixture on ice for 20 minutes. Then the transformation mixture must be exposed to heat-shock at 42°C for 45 seconds. Incubate the transformation mixture on ice for 2 minutes. Add 250 μl of LB medium (pre-warmed to 42°C). Allow the cells to recover at 37°C with agitation for at least 1 hour. Plate 5 μl and 100 μl of the transformation mixture on LB–ampicillin plates that have been spread with 40 μl of 2% X-gal.Incubate the plates overnight at 37°C.
Analyzing the Transformants: Pick white or light blue colonies for plasmid DNA analysis. Do not pick dark blue colonies. Positive clones may be identified by PCR analysis of plasmid DNA using the T3/T7 primer pair.
LB–Ampicillin Agar (per Liter)
1 liter of LB agar, autoclaved
Cool to 55°C, Add 10 ml of 10-mg/ml filter-sterilized Ampicillin
Pour into petri dishes
(~25 ml/100-mm plate)
2% X-Gal (per 10 ml)
0.2 g of 5-bromo-4-chloro-3-inodlyl-β-Dgalactopyranoside
(X-Gal)
10 ml of dimethylformamide (DMF)
Store at –20°C, spread 40 μl per LB-agar plate.

176
Appendix 2.

Radiation of the Drosophila nannoptera species group in Mexico
M. LANG*, M. POLIHRONAKIS RICHMOND† , A . E . ACURIO‡ , T . A . MARKOW†§& V. ORGOGOZO*
*CNRS UMR7592, Institut Jacques Monod, Universit�e Paris Diderot, Paris, France
†Section of Cell and Developmental Biology, Division of Biological Sciences, University of California, La Jolla, CA, USA
‡Departament de Gen�etica i de Microbiologia, Universitat Aut�onoma de Barcelona, Bellaterra, Spain
§Laboratorio Nacional de Gen�omica de la Biodiversidad, CINVESTAV, Irapuato, Mexico
Keywords:
asymmetric male genitalia;
molecular phylogeny;
multilocus analysis;
nannoptera species group;
reproductive characters;
species divergence estimates.
Abstract
The Drosophila nannoptera species group, a taxon of Mexican cactophilic flies,
is an excellent model system to study the influence of abiotic and biotic
factors on speciation, the genetic causes of ecological specialization and the
evolution of unusual reproductive characters. However, the phylogenetic
relationships in the nannoptera species group and its position within the
virilis-repleta phylogeny have not been thoroughly investigated. Using a
multilocus data set of gene coding regions of eight nuclear and three mito-
chondrial genes, we found that the four described nannoptera group species
diverged rapidly, with very short internodes between divergence events.
Phylogenetic analysis of repleta group lineages revealed that D. inca and
D. canalinea are sister to all other repleta group species, whereas the annuli-
mana species D. aracataca and D. pseudotalamancana are sister to the nannop-
tera and bromeliae species groups. Our divergence time estimates suggest
that the nannoptera species group radiated following important geological
events in Central America. Our results indicate that a single evolutionary
transition to asymmetric genitalia and to unusual sperm storage may have
occurred during evolution of the nannoptera group.
Introduction
Species of the genus Drosophila, because of their well-
defined phylogenetic relationships and diverse ecologies
and life histories, provide an attractive group of model
organisms for the study of evolution (Markow & O’Gra-
dy, 2007). A few taxa in Drosophilidae have evolved
the ability to feed and breed in necrotic cactus, predom-
inantly in the repleta and nannoptera species groups
(Markow & O’Grady, 2007). The nannoptera species
group consists of only four described species: Drosophila
nannoptera (Wheeler, 1949), D. acanthoptera (Wheeler,
1949),D. wassermani (Pitnick &Heed, 1994) andD. pachea
(Patterson & Wheeler, 1942). Even though all species of
the nannoptera group live on columnar cacti, they exhibit
diverse degrees of ecological specialization. Whereas
D. nannoptera can live on a variety of host plants of the
genera Stenocereus, Pachycereus, Escontria and Myrtillocactus
(Heed, 1982), D. acanthoptera and D. wassermani are
restricted to species in the genus Stenocereus (Heed, 1982).
An even more tight ecological specialization links
D. pachea to a single host plant, the senita cactus Lophocere-
us schottii (Engelmann, 1852), which is toxic to the other
three species of the nannoptera group (Heed & Kircher,
1965; Etges et al., 1999) and which provides a particular
sterol (lathosterol) absolutely required for D. pachea
survival (Heed &Kircher, 1965; Lang et al., 2012).
The geographic distribution of D. pachea coincides
with the distribution of senita cactus, which is restricted
to the Sonoran desert in north-west mainland Mexico
and to the Baja California peninsula (Fig. 1; Lindsay,
1963; Hastings et al., 1972). The Gulf of California and
the Sierra Madre Occidental mountain range on the
mainland separate the distribution of D. pachea from
D. wassermani (Fig. 1b). The other nannoptera species
are found in an overlapping region in southern Mexico
(Heed, 1982; Markow & O’Grady, 2005). Drosophila
nannoptera generally localizes in highlands, whereas
D. wassermani is primarily found in lowlands (Heed,
Correspondence: Michael Lang, CNRS UMR7592, Institut Jacques Monod,
Universit�e Paris Diderot, Batiment Buffon 416B, 15 rue H�el�ene Brion,
75205 Paris Cedex 13, France. Tel.: +33 157278099;
fax: +33 157278087; e-mail: [email protected]
ª 2 01 4 THE AUTHORS . J . E VOL . B I OL .
1JOURNAL OF EVOLUT IONARY B IO LOGY ª 20 1 4 EUROPEAN SOC I E TY FOR EVOLUT IONARY B IO LOGY
doi: 10.1111/jeb.12325
17 7

1982). Specimens of D. acanthoptera were also reported
from Venezuela (Hunter, 1970), but this single sam-
pling record, based on morphological characterization,
remains dubious.
The nannoptera species group inhabits a zone of
important geological history. About 15 million years ago
(Ma), seismic activity along a volcanic arc formed the
Isthmus of Panama that connected Central and South
America (Montes et al., 2012a,b). The formation of the
isthmus had a huge biological and climatic impact and
provided a means for terrestrial fauna to move between
the two continents (Webb, 1976; Leigh et al., 2014).
More recently, about 6–3 Ma, the Baja California penin-
sula formed as a result of a series of complex geological
events that caused the successive separation of landmas-
ses from mainland Mexico (Lizarralde et al., 2007; Um-
hoefer, 2011). Increased desertification of North and
South America in the past 10 Ma due to a global climate
change and an uplift period of the Andes during the late
Miocene-Pliocene (Gregory-Wodzicki, 2000; Capitanio
et al., 2011) was accompanied by radiations of major suc-
culent plant lineages (Arakaki et al., 2011). Whether
these geological events might have influenced speciation
within the nannoptera species group is unknown.
In addition to the ability to utilize cactus tissue as a
resource, some unusual reproductive characters have
evolved in the nannoptera species group. For instance,
sperm gigantism was observed in D. pachea and D. nan-
noptera, but not in the other two members of the group,
D. acanthoptera and D. wassermani (Pitnick et al., 1995).
Two additional very curious reproductive characters,
genital asymmetry (Vilela & Baechli, 1990; Pitnick &
Heed, 1994; Lang & Orgogozo, 2012) and site of sperm
storage in females (Pitnick et al., 1999), have also been
reported in a few species of the nannoptera group.
Whereas D. nannoptera, like most other Drosophilidae,
has fully symmetric genitalia (Vilela & Baechli, 1990;
Huber et al., 2007), the other three species of the nan-
noptera group possess diverse genital organs with con-
spicuous left-right asymmetric morphologies. Drosophila
pachea displays an epandrial lobe size asymmetry
(Pitnick & Heed, 1994; Lang & Orgogozo, 2012),
(a) (b)
Fig. 1 Phylogenetic relationships of the nannoptera group and related species. (a) Phylogenetic tree generated in BEAST based on the
concatenated data set with nine partitions. Bootstrap support from maximum likelihood (PhyML) analysis is presented on the left side of
each node. Bayesian posterior probabilities are presented on the right side of each node for the BEAST analysis/and *BEAST analysis,
respectively. The time scale was calculated according to estimates B in Table 1. (b) Distributions of the species of the nannoptera group and
of Drosophila machalilla and D. bromeliae, reproduced from Heed (1982) and Markow & O’Grady (2005).
ª 2 01 4 THE AUTHORS . J . E VOL . B I OL . do i : 1 0 . 1 11 1 / j e b . 1 2 32 5
JOURNAL OF EVOLUT IONARY B IOLOGY ª 2014 EUROPEAN SOC I E TY FOR EVOLUT IONARY B IO LOGY
2 M. LANG ET AL.
Appendix 2.
178

D. acanthoptera possesses an asymmetric phallus (Vilela &
Baechli, 1990), and D. wassermani has a left–rightconcave–convex-shaped cercus (Pitnick & Heed, 1994;
Fig. 2). Furthermore, D. nannoptera, like most other Dro-
sophila species, uses two types of organs for
post-copulatory storage of sperm in females: the paired
spermathecae and the single seminal receptacle. How-
ever, D. acanthoptera, D. wassermani and D. pachea use
only the spermathecae (Pitnick et al., 1999). Therefore,
with regard to the evolution of asymmetric genitalia and
unusual sperm storage, the most parsimonious scenario
would be that D. nannoptera is an out group relative to
the other three species of the nannoptera group.
For the reasons mentioned previously, the nannop-
tera group thus represents an interesting model system
to tackle a variety of important questions in evolution-
ary biology, such as the influence of abiotic and biotic
factors on speciation, the genetic causes of ecological
specialization and the evolution of reproductive charac-
ters. To address these questions and to trace back the
evolution of different characters across the nannoptera
species group, a reliable phylogeny of the four species
and related taxa is required. Whereas relationships
within the repleta group have been characterized to a
great extent (Van der Linde et al., 2010; Oliveira et al.,
2012), previous phylogenetic studies of the nannoptera
group have led to equivocal and conflicting results
(Pitnick et al., 1995, 1997, 1999; Van der Linde et al.,
2010; Oliveira et al., 2012; Yassin, 2013). Some of these
analyses were based on relatively few genetic loci
(Pitnick et al., 1995, 1997, 1999) and others that
included more loci either lacked appropriate out groups
(Oliveira et al., 2012) or did not examine all members
of the nannoptera species group (Van der Linde et al.,
2010; Yassin, 2013). In a morphological analysis based
on internal reproductive organ morphology, Heed
(1982) proposed a phylogeny of the nannoptera group,
with D. wassermani and D. pachea forming two sister
species, which are in turn sister to D. acanthoptera, and
with D. nannoptera being out group relative to the other
Fig. 2 Hypothetical character evolution of asymmetric male genitalia in the nannoptera species group. The red dot indicates the putative
origin of both left–right asymmetric male genitalia and spermathecae-restricted sperm storage. Images below each species names illustrate
male external genitalia of each species. Asymmetric parts were artificially coloured in red. Sperm storage organs are indicated below each
species name. The scale bar is 100 lm.
ª 2 01 4 THE AUTHORS . J . E VOL . B I OL . do i : 1 0 . 1 11 1 / j e b . 1 2 32 5
JOURNAL OF EVOLUT IONARY B IO LOGY ª 20 1 4 EUROPEAN SOC I E TY FOR EVOLUT IONARY B IO LOGY
Radiation of the Drosophila nannoptera group 3
Appendix 2.
179

three species. According to this topology, the evolution
of asymmetric genitalia and the evolutionary change in
sperm storage would have occurred only once, whereas
sperm gigantism would have evolved twice within the
nannoptera group.
The closest relatives of the nannoptera group are
thought to be the bromeliae species group (Van der Linde
et al., 2010; Yassin, 2013) and a newly described species,
D. machalilla (Acurio et al., 2013; A. Acurio, K. Good-
man, D.C. Oliveira, V. Rafael & A. Ruiz, unpublished)
that was proposed to belong to a new species group, the
atalaia group (Acurio et al., 2013). Whereas the nannop-
tera and bromeliae species groups are part of the virilis-
repleta group radiation (Throckmorton, 1975), the
particular branching order of lineages leading to the
nannoptera group has never been fully resolved (Van
der Linde et al., 2010; Oliveira et al., 2012; Yassin, 2013).
Here, we address the phylogenetic relationships of
the four species of the nannoptera group and related
taxa. Using a multilocus data set of gene coding regions
of eight nuclear and three mitochondrial genes, we
found that the four described nannoptera group species
diverged rapidly. We discuss the nannoptera group
radiation with respect to important geological events in
Central America. Furthermore, our results allow us to
propose a scenario for the evolution of reproductive
traits in the nannoptera group.
Materials and methods
Taxon sampling
In addition to the four described species of the nannop-
tera group, we sequenced two species, D. bromeliae and
D. machalilla, that are hypothesized to be close relatives
of the nannoptera group based on morphology and
previous phylogenetic analyses (Van der Linde et al.,
2010; Oliveira et al., 2012; Yassin, 2013; A. Acurio,
K. Goodman, D.C. Oliveira, V. Rafael & A. Ruiz,
unpublished). We also included the annulimana group
species D. aracataca and D. pseudotalamancana, and
D. canalinea of the canalinea group to represent sister
lineages of the repleta group. From the repleta group,
we included four representative species, D. inca (inca
subgroup), D. mettleri (mulleri subgroup), D. buzzatii
(mulleri subgroup, buzzatii species complex) and D.
mojavensis (mulleri subgroup, mojavensis species com-
plex). Drosophila virilis and D. robusta were chosen as
distant lineages of the repleta-virilis radiation (Van der
Linde et al., 2010; Yassin, 2013) and D. funebris and
D. grimshawi were used to root the phylogeny. The lat-
ter two species belong to different species radiations of
the Drosophila subgenus (Throckmorton, 1975; Van der
Linde et al., 2010; Yassin, 2013). Flies were obtained
from the Drosophila Species Stock Center (Table S1),
except for D. machalilla and D. inca (both collected by
A. Acurio) and D. buzzatii (provided by Jean David).
DNA sequencing
Genomic DNA was obtained in a single extraction per
species including 2–5 adults using the DNeasy blood and
tissue kit (QIAGEN, Hilden, Germany). Partial genomic
regions of eight nuclear genes (amy, amyrel, boss, fkh,
marf, sinA, snf, wee) and three mitochondrial genes
(ND2, COI, COII) were amplified by PCR with gene-spe-
cific or degenerate primers (Liu & Beckenbach, 1992;
Bonacum et al., 2001; Wang et al., 2006; Da Lage et al.,
2007; Table S2). Degenerate oligonucleotides optionally
contained T7 or SP6 universal primer sequences at their
5′ end (Table S2), following Bonacum et al. (2001). For
PCR amplifications, we used 0,4 lM oligonucleotides,
1 u GoTaq� DNA Polymerase (Promega, Fitchburg, WI,
USA) per 35 lL reaction volume, 2 mM MgCl2 and
200 lM dNTP, and reactions were carried out using stan-
dard thermocycle conditions. PCR products were puri-
fied and Sanger-sequenced with gene-specific primers
or with T7, SP6 universal primers at Cogenics (www.co
genics.com, Beckman Coulter, Brea, California, USA).
Sequence data (GenBank accession numbers KF632591-
KF632711; Table S3) were examined and aligned with
Geneious 6.1.3 (Biomatters, Auckland, New Zealand).
Additional sequence data were retrieved from GenBank
(Table S3). We generated a data set that contained all
the selected homologous genomic regions of all species.
DNA sequences were aligned using MAFFT (Katoh et al.
2002). Nuclear loci were tested for recombination with
the pairwise homoplasy index (Φw) statistics using Phi-
Pack (Bruen et al., 2006). No evidence of recombination
was detected (Table S4). A total of 121 polymorphic
sites were detected within single sequences based on
the presence of double peaks in sequencing chromato-
grams. Thirty-eight of these polymorphic sites were
found in the nannoptera species group sequences. All
polymorphic sites were excluded from the analysis.
Furthermore, noncoding DNA sequences were removed
from the data set, as well as a short region of the wee
locus (sequences homologous to positions 267–306 in
D. pachea wee, accession number KF632622), which was
difficult to align and that did not contain any parsimony
informative sites in the nannoptera species group. The
extremities of each locus-specific alignment were also
trimmed to be in codon frame. Alignments were re-
aligned with the Geneious translation alignment
program and either used separately or concatenated in
the following order: amy-amyrel-boss-fkh-marf-sinA-
snf-wee-ND2-COI-COII. The number of informative
sites was calculated using MEGA4 (Tamura et al., 2007).
Phylogenetic analysis
Phylogenetic analysis was performed using both maxi-
mum likelihood and Bayesian approaches. For all
analyses, models of nucleotide substitution were
selected using the Akaike Information Criterion as cal-
ª 2 01 4 THE AUTHORS . J . E VOL . B I OL . do i : 1 0 . 1 11 1 / j e b . 1 2 32 5
JOURNAL OF EVOLUT IONARY B IOLOGY ª 2014 EUROPEAN SOC I E TY FOR EVOLUT IONARY B IO LOGY
4 M. LANG ET AL.
Appendix 2.
180

culated in jModelTest 2.1.3 (Posada, 2008; Darriba
et al., 2012). Maximum likelihood inference was carried
out on the concatenated data set in PhyML (Guindon &
Gascuel, 2003) using a GTR+I+G model of nucleotide
substitution. Node support was determined by perform-
ing 100 bootstrap replicates.
Two types of Bayesian analyses were carried out in
BEAST v1.7.5 (Drummond et al., 2012). The first analy-
sis was carried out on the concatenated data set using
nine partitions with individual and unlinked models of
nucleotide substitution (Table S5). The partitions corre-
sponded to the eight nuclear loci (amy, amyrel, boss, fkh,
marf, sinA, snf and wee) plus a ninth partition for mito-
chondrial sequences (ND2, COI, COII). Mitochondrial
genes were combined into one partition because they
are located in the same order and orientation in the
mitochondrial genome, and largely evolve as a single
unit with little to no recombination (Ballard, 2000).
Clock models were linked, and a common strict clock
rate was assumed for all partitions using the Yule birth
process tree prior. We also estimated a species tree
using *BEAST (Heled & Drummond, 2010). For the
*BEAST analysis, tree and clock models were unlinked
for each partition and a relaxed exponential clock
model was assumed.
For species divergence time estimates, we set priors
for most recent common ancestors (MRCA) using
estimates from Obbard et al. (2012) for the splits
D. grimshawi – D. virilis: 13 � 2.5 Ma and D. mojavensis
– D. virilis: 10 � 2.5 Ma (estimates A). Alternatively,
calibration dates for the divergence of D. grimshawi –D. virilis: 42.9 Ma � 8.7 (Tamura et al., 2004), D. mojav-
ensis – D. virilis: 26 � 6 Ma (Russo et al., 1995; Spicer &
Bell, 2002; Oliveira et al., 2012), D. mojavensis – D. buzz-
atii: 11.3 � 2 Ma and D. mojavensis – D. mettleri:
16.3 � 2 Ma (Oliveira et al., 2012) were used
(estimates B). Priors were assumed to follow a normal
distribution with the mean and a standard deviation
according to the literature estimates. Markov-Chain
Monte-Carlo (MCMC) runs were performed with a
chain length of 108 generations and were recorded
every 1000 generations. Estimates were computed with
Tracer version 1.5 (Rambaut & Drummond, 2009), and
MCMC output analysis was carried out using Tre-
eAnnotator (Drummond et al., 2012). The first 2000
sampled trees were discarded as the burn-in. Phyloge-
nies were visualized and annotated with Figtree version
1.4 (Rambaut & Drummond, 2012).
Results
Phylogenetic analysis
To analyse the phylogenetic relationships of the nan-
noptera group, we gathered DNA sequences of partial
coding gene regions of eight nuclear genes (amy, amyrel,
boss, fkh, marf, sinA, snf, wee) and three mitochondrial
genes (ND2, COI, COII) from 17 species. The entire data
set comprised 6810 aligned positions, including 4208
constant positions, 695 single variable positions and
1907 parsimony informative (28%) positions (Table
S3).
Phylogenetic analysis of the concatenated, nine-
partition data set was performed using a maximum
likelihood approach in PhyML (Guindon & Gascuel,
2003) and by Bayesian inference in BEAST (Drum-
mond et al., 2012). Phylogenetic relationships inferred
from these analyses resulted in identical tree topologies,
but with varying node support values (Fig. 1). The
resulting phylogeny supports Acurio et al.’s findings
(A. Acurio, K. Goodman, D.C. Oliveira, V. Rafael &
A. Ruiz, unpublished) that the nannoptera species
group is a sister clade of the atalaia species group, with
D. machalilla being more closely related to the nannop-
tera clade than to D. bromeliae (bromeliae group). In
our phylogeny, D. inca and D. canalinea form a lineage
sister to the repleta group. Furthermore, both the Bayes-
ian and the maximum likelihood phylogeny provided,
for the first time, strong support for the monophyly of
annulimana species, D. aracataca and D. pseudotalaman-
cana, which we found to be more closely related to the
nannoptera group than to the repleta group. Phyloge-
netic relationships within the nannoptera group were
relatively well-resolved in the Bayesian analysis, but not
in the maximum likelihood analysis. Our results from
the Bayesian analysis were congruent with the phylo-
genetic relationships previously suggested based on
morphological data (Heed, 1982) (Fig. 1a).
Analysis of concatenated multilocus data has recently
been criticized as it poorly integrates locus-specific phy-
logenetic signals and can lead to false phylogenetic
inferences with high statistical support (Song et al.,
2012). Therefore, we also analysed our data set with
*BEAST (Heled & Drummond, 2010), an extension of
the BEAST package that incorporates coalescence mod-
els to estimate a species tree from multiple gene-spe-
cific phylogenies. The topology of the species tree
inferred in *BEAST was similar to the phylogeny
obtained with the concatenated data set (Fig. 1a, Fig.
S1), except that relationships within the nannoptera
group differed, with D. pachea being sister to the clade
containing D. acanthoptera and the sister species pair
D. nannoptera and D. wassermani (Fig. S1). However, the
posterior probability for the corresponding nodes were
low, suggesting that our data set might not contain
enough information for species tree estimation using
*BEAST. Within the nannoptera group, we observed
only 120 parsimony informative sites across all genes
in the data set (Table S3). The mean length of DNA
sequence per nuclear locus was 477 � 178 bp (SD),
which, on average, included only 5 � 3 (SD) parsi-
mony informative sites among the nannoptera species
group (Table S3). We wondered whether the number
of informative sites per locus was too low for a
ª 2 01 4 THE AUTHORS . J . E VOL . B I OL . do i : 1 0 . 1 11 1 / j e b . 1 2 32 5
JOURNAL OF EVOLUT IONARY B IO LOGY ª 20 1 4 EUROPEAN SOC I E TY FOR EVOLUT IONARY B IO LOGY
Radiation of the Drosophila nannoptera group 5
Appendix 2.
181

coalescent multilocus phylogenetic approach to produce
a well-resolved species tree. To estimate the number of
loci that would be necessary to reliably establish nan-
noptera group relationships using *BEAST, we pro-
duced partial data sets containing 2, 4, 6 or 8 loci and
inferred the phylogeny of each data set. The average
node support was calculated and the number of neces-
sary loci was approximated by a logarithmic regression
(Fig. S2). Whereas we are aware that the number of
parsimony informative sites per locus is low and that
the data sets are partially redundant, this analysis
showed that for the entire phylogeny, the average pos-
terior probability was 0.90 when six and eight loci
were used. Support for the nodes within the nannop-
tera group also increased with the number of loci, but
at a much lower rate. We estimated that approximately
60 loci would be required to obtain a posterior proba-
bility of 0.90 for the internal nodes within the nannop-
tera group.
Divergence time estimates
We estimated the divergence times of the nannoptera
group radiation and the splits of D. machalilla and
D. bromelia from the branch leading to the nannoptera
species group. There is conflicting information about spe-
cies divergence times in Drosophila. Most estimates are
based on the phylogeny of Hawaiian Drosophilidae
where species divergence times can be approximated
based on the ages of the islands they inhabit (Price & Cla-
gue, 2002). Recently, Obbard et al. (2012) proposed a
refinement of this approach to take lineage-specific vari-
ation of mutation rates into account (Obbard et al.,
2012). This new approach suggested a younger age for
the virilis-repleta radiation, of about 10 Ma compared to
the previous estimates of 20 Ma (see Material and meth-
ods). We computed species divergence times either based
on Obbard et al. (2012) (dates A) or based on previous
species divergence estimates (dates B) (Table 1).
As the calibration estimates in A were about half the
ages in B, divergence time estimates of dates A were
expectedly also half the age compared to estimates B.
We estimated that the nannoptera group lineage
diverged about 3.7 Ma (dates A) or 8.3 Ma (dates B).
Furthermore, the most recent split of D. pachea and
D. wassermani was estimated to have occurred shortly
thereafter, about 3.0 Ma (dates A) or 6.7 Ma (dates B).
The D. machalilla lineage separated from the nannopter-
a group about 7.5 Ma (dates A) or 16.9 Ma (dates B)
and the bromeliae group separated from the nannopter-
a group lineage about 8.4 Ma (dates A) or 17.9 Ma
(dates B). Based on the conflicting calibration, these
dates do not precisely estimate speciation events, but
they put the nannoptera group radiation into an
approximate time frame.
Discussion
Origin of the nannoptera group
The four species of the nannoptera group are endemic
to distinct regions of Mexico (Fig. 1b). Our phy-
logenetic analysis uncovered three closely related out
groups to the nannoptera group: D. machalilla, the
bromeliae species group (comprising five species includ-
ing D. bromeliae) and the members of the annulimana
group. Members of these species groups are primarily
found in South America but also in Central America
(Fig. 1b) (Sturtevant, 1916; Duda, 1927; Pavan & da
Cunha, 1947; Do Val & Marques, 1996; Da Silva et al.,
2004; Markow & O’Grady, 2005; Acurio et al., 2013).
These species distributions thus suggest that the ances-
tor of the four nannoptera group species may have
originated from South America. Interestingly, our
dating analysis estimates that the nannoptera group
diverged from D. machalilla around 16.9 Ma (B) –7.5 Ma (A). This time period corresponds to the closure
of the Isthmus of Panama, about 15–9 Ma (Montes
et al., 2012b), suggesting that the ancestor of the nan-
noptera group may have migrated over the newly
formed isthmus from South America. Most species were
found to migrate across the isthmus much later, at
about 3–2 Ma (Leigh et al., 2014). However, exceptions
are known such as the extinct carnivora Cyonasua and
ground sloths, which migrated about 9 Ma from north
to south and south to north, respectively (Webb, 1976).
Furthermore, recent data suggest that the isthmus was
already passable for stingless bees at late Eocene and
early Miocene times (20–15 Ma), which migrated from
South to Central America (Roubik & de Camargo,
2012). The isthmus might have faced multiple events of
temporary land bridge formations and disconnections,
allowing a few species to cross continents before a
permanent land bridge formed about 4–3 Ma (Webb,
1976; Roubik & de Camargo, 2012; Stone, 2013).
Drosophila species have been extensively sampled in
Mexico and Central America (Patterson & Stone, 1952),
but multiple areas known as biodiversity hotspots in
South America are still unexplored. An origin of the
Table 1 Divergence time estimates.
Dated nodes
Divergence time estimates*
A B
D. mojavensis – D. buzzatii 5.5 Ma (3.5–7.5) 12.2 Ma (10.0–14.5)
D. mojavensis – D. mettleri 7.5 Ma (4.8–10.1) 16.7 Ma (13.7–19.6)
D. pachea – D. wassermani 3.0 Ma (1.9–4.1) 6.7 Ma (5.3–8.1)
D. pachea – D. nannoptera 3.7 Ma (2.4–5.0) 8.3 Ma (6.7–10.0)
D. pachea – D. machalilla 7.5 Ma (4.9–10.2) 16.9 Ma (13.7–20.1)
D. pachea – D. bromeliae 8.4 Ma (5.4–11.3) 17.9 Ma (15.8–20.0)
D. virilis – D. mojavensis 10.6 Ma (7.0–14.3) 18.9 Ma (15.3–22.4)
*Estimates are the posterior means with 95% highest posterior
density intervals.
ª 2 01 4 THE AUTHORS . J . E VOL . B I OL . do i : 1 0 . 1 11 1 / j e b . 1 2 32 5
JOURNAL OF EVOLUT IONARY B IOLOGY ª 2014 EUROPEAN SOC I E TY FOR EVOLUT IONARY B IO LOGY
6 M. LANG ET AL.
182

nannoptera group in South America would suggest that
yet undescribed close out group species of the nannop-
tera group might be present in these geographic areas.
Radiation of the nannoptera species group
Within the nannoptera species group, we observed only
120 parsimony informative sites in our entire data set
(Table S6), whereas 850 nucleotide changes were line-
age-specific. The distribution of mutations indicates that
the four species of the nannoptera group diverged
within a relatively short time period. Phylogenetic
inference can be particularly difficult in these cases
especially if node support remains low with increasing
data. One interpretation of the current data is that the
ancestral lineage diverged nearly simultaneously into
the four described extant lineages (Walsh et al., 1999;
Humphries & Winker, 2010). Such scenario might be
expected from species with a large geographic range
where peripatric speciation can occur in different
regions. One well-studied example is the D. simulans
species complex, where D. mauritiana and D. sechellia
diverged independently on islands that were geographi-
cally separated from the cosmopolitan species D. simu-
lans (Garrigan et al., 2012).
Alternatively, very short internode distances could
result from a rapid succession of divergence events that
could be inferred with increasing amounts of data (soft
polytomy). Our current sequence data are insufficient
to distinguish between a soft and a hard polytomy in
the nannoptera species group. The rapid and ongoing
decrease in high-throughput sequencing costs now
makes it more practical to sequence and to compare
whole genomes for future studies aiming at a better
resolution of the nannoptera group phylogeny.
Phylogenetic relationships and evolution ofreproductive traits within the nannoptera group
Under the hypothesis of a soft polytomy in the nannop-
tera species group, the phylogeny of the nannoptera
group that we inferred using the concatenated data
(Fig. 1a) appears to propose the most plausible sce-
nario, despite a low node support in one of our analy-
ses (PhyML maximum likelihood analysis). Indeed,
several lines of evidence corroborate this topology.
First, compared to the previous molecular phylogenetic
analysis of Oliveira et al. (2012), which hypothesized
different relationships for the nannoptera group, our
phylogeny is based on a higher number of loci and on
an increased number of relevant out group species close
to the nannoptera group.
Second, our inferred topology recapitulates the
species relationships presented by Heed (1982) based
on internal reproductive organ anatomy and by Pitnick
et al. (1999) independently based on cytochrome
oxidase data. Third, it is congruent with chromosome
inversions. Comparisons of polytene chromosome
banding patterns revealed that D. nannoptera and
D. wassermani have a homosequential ‘ancestral-like’
chromosomal organization, whereas D. acanthoptera and
D. pachea are derived with three and one inversion,
respectively (Ward & Heed, 1970). A fourth, polymor-
phic, inversion is also found in D. pachea and is not
detected in the other species of the nannoptera group
(Etges et al., 1999).
Fourth, our inferred topology is consistent with a
parsimonious scenario of the evolution of the unusual
reproductive characters within the nannoptera group.
Genital asymmetry is found in D. acanthoptera (Vilela &
Baechli, 1990), D. wassermani (Pitnick & Heed, 1994)
and D. pachea (Pitnick & Heed, 1994; Lang & Orgogozo,
2012) (Fig. 2), whereas D. nannoptera (Vilela & Baechli,
1990), as well as the species D. bromeliae, D. speciosa and
D. aguape of the bromeliae group and D. machalilla
(atalaia group) have symmetric genitalia (Do Val &
Marques, 1996; Da Silva et al., 2004; Acurio et al.,
2013). Therefore, a single evolutionary transition to
asymmetric genitalia might have occurred in the nan-
noptera group. Even though the asymmetry involves
different male genitalia organs in each species, a com-
mon genetic and developmental process may underlie
these distinct morphological asymmetries. We currently
are trying to unravel the genetic factors that determine
the asymmetric development of male genitalia in the
three nannoptera species. In particular, we are testing
whether genitalia clockwise rotation (Feuerborn, 1922;
Suzanne et al., 2010) during pupal development could
be the signal that triggers differential growth between
the left and right parts of various organs in distinct
species. Furthermore, our inferred topology is consis-
tent with a single evolutionary change in sperm storage
in the nannoptera group. After copulation, females of
D. acanthoptera, D. wassermani and D. pachea exception-
ally use only the spermathecae to store the sperm and
not the seminal receptacle as is typical for Dros-
ophilidae, including D. nannoptera (Pitnick et al., 1999).
Future efforts are required to examine how copulation
position might affect sperm transfer in the nannoptera
species group and to determine whether asymmetric
male genitalia and unusual sperm storage are func-
tionally linked. Finally, according to our inferred
phylogeny, sperm gigantism would have evolved twice
independently in the nannoptera group, which is consis-
tent with other reported instances of rapid evolution of
sperm size in Drosophila (Pitnick et al., 1995).
Evolutionary history of the nannoptera speciesgroup
Species divergence estimates for the virilis-repleta radia-
tion vary greatly, from 30–20 Ma (Russo et al., 1995;
Spicer & Bell, 2002; Tamura et al., 2004; Oliveira et al.,
2012) to 10 Ma (Obbard et al., 2012) when adjusting
ª 2 01 4 THE AUTHORS . J . E VOL . B I OL . do i : 1 0 . 1 11 1 / j e b . 1 2 32 5
JOURNAL OF EVOLUT IONARY B IO LOGY ª 20 1 4 EUROPEAN SOC I E TY FOR EVOLUT IONARY B IO LOGY
Radiation of the Drosophila nannoptera group 7
Appendix 2.
183

for lineage-specific mutation rates. We performed two
separate estimations (Table 1) to account for two
incompatible calibrations of species divergence esti-
mates. The two sets of estimates (A and B) for the radi-
ation of the nannoptera group approximate the lower
and upper bounds of the geological time approximation
of sea floor spreading of the southern Gulf of California.
Formation of the Baja California peninsula started
approximately 12 Ma due to changes in continental
plate tectonics (Umhoefer, 2011). The peninsula itself
formed along an almost north-south-directed rift, now
partially covered by the Gulf of California. Landmasses
separated from the continent as a result of complex
geological events about 6–2.5 Ma and successively
formed the peninsula (Lizarralde et al., 2007; Umhoefer,
2011). Thus, the divergence of D. wassermani and D. pa-
chea might have been influenced by the formation of
the Baja California peninsula and by the separation of
these landmasses from the continent (Heed, 1982).
Whether senita cacti were already present in the
forming Baja peninsula and whether D. pachea or its
predecessors were already feeding on senita cactus
when landmasses disconnected from the continent is
unknown. A phylogenetic analysis of the senita cactus
and its closely related species, together with estimations
of divergence times, would be helpful to try to infer the
evolutionary history of the close ecological relationship
between D. pachea and its host cactus. The distribution
area of D. wassermani is limited to the north by the
Trans-Mexican Volcanic Belt and by the Sierra
Madre Occidental mountain range (Fig. S3), which
originated about 17–7 and 38–25 Ma, respectively
(Ferrari et al., 1999). A plausible scenario is that these
mountains formed an obstacle for the ancestor of
D. wassermani and D. pachea, which colonized further
northern regions through the coastal lowlands of
north-west Mexico (Heed, 1982). As this region succes-
sively re-arranged into the Baja California peninsula,
the Gulf of California created a natural barrier and
could have led to the isolation of D. pachea in the north
and D. wassermani in the south (Fig. S3).
Drosophila machalilla, the most closely related out-
group of the nannoptera group, is a recently described
species that was collected in traps containing Opuntia
cactus, and the columnar cactus Armatocereus cartwrighti-
anus (Britton & Rose, 1920) was proposed to be their
native host plant (Acurio et al., 2013). As all nannop-
tera group species also feed on columnar cacti, the
MRCA of D. machalilla and the nannoptera species
group was likely to be already cactophilic. Our results
suggest that the major radiation of succulent plants,
which occurred in the past 10 million years in North
and South America (Arakaki et al., 2011), could have
then contributed to shifts in cactus hosts and to specia-
tion in the nannoptera group.
In summary, our results indicate that the four spe-
cies of the nannoptera group originated within a short
time period. Our approximations of species divergence
times suggest that the emergence of the southern Gulf
of California might have been involved in the split
between D. pachea and D. wassermani. The branching
order of basal repleta lineages reveals that the annuli-
mana species D. aracataca and D. pseudotalamancana are
the most closely related taxa to the nannoptera and
bromeliae species groups. Our phylogenetic analysis
suggests that evolution of asymmetric genital and
unusual sperm storage have evolved only once within
the nannoptera group, and that the ancestor of the
nannoptera group was already feeding on columnar
cacti.
Acknowledgments
We are especially grateful to Amir Yassin for helpful
discussions on the experimental design and on the
manuscript. In addition, we thank Jean David for
D. buzzatii specimen. ML is supported by the Fondation
pour la Recherche M�edicale (FRM) postdoctoral fellow-
ship SPF20121226328. This work was also supported by
a CNRS ATIP-AVENIR grant, given to VO. Sampling of
Ecuadorian Drosophila specimen was carried out by
AEA with the Scientific Research Permission 0016-
07IC-FAU-DNBAPVS/MA.
References
Acurio, A., Rafael, V., Cespedes, D. & Ruiz, A. 2013. Descrip-
tion of a New Spotted-Thorax Drosophila (Diptera: Drosophil-
idae) species and its evolutionary relationships inferred by a
cladistic analysis of morphological traits. Ann. Entomol. Soc.
Am. 106: 695–705.Arakaki, M., Christin, P.-A., Nyffeler, R., Lendel, A., Eggli, U.,
Ogburn, R.M. et al. 2011. Contemporaneous and recent radi-
ations of the world’s major succulent plant lineages. Proc.
Natl. Acad. Sci. 108: 8379–8384.Ballard, J.W.O. 2000. Comparative genomics of mitochondrial
DNA in members of the Drosophila melanogaster Subgroup. J.
Mol. Evol. 51: 48–63.Bonacum, J., DeSalle, R., O’Grady, P., Olivera, D., Winter-
mute, J. & Zilversmit, M. 2001. New nuclear and mitochon-
drial primers for systematics and comparative genomics in
Drosophilidae. Drosoph. Inf. Serv. 84: 201–204.Britton, N. & Rose, J. 1920. The Cactaceae: Descriptions and Illus-
trations of Plants in the Cactus Family. Vol. 2, pp. 100. The Car-
negie Institution of Washington, Washington.
Bruen, T.C., Philippe, H. & Bryant, D. 2006. A simple and
robust statistical test for detecting the presence of recombi-
nation. Genetics 172: 2665–2681.Capitanio, F.A., Faccenna, C., Zlotnik, S. & Stegman, D.R.
2011. Subduction dynamics and the origin of Andean orog-
eny and the Bolivian orocline. Nature 480: 83–86.Da Lage, J.-L., Kergoat, G.J., Maczkowiak, F., Silvain, J.-F.,
Cariou, M.-L. & Lachaise, D. 2007. A phylogeny of Droso-
philidae using the Amyrel gene: questioning the Drosophila
melanogaster species group boundaries. J. Zool. Syst. Evol. Res.
45: 47–63.
ª 2 01 4 THE AUTHORS . J . E VOL . B I OL . do i : 1 0 . 1 11 1 / j e b . 1 2 32 5
JOURNAL OF EVOLUT IONARY B IOLOGY ª 2014 EUROPEAN SOC I E TY FOR EVOLUT IONARY B IO LOGY
8 M. LANG ET AL.
Appendix 2.
184

Da Silva, A., De, A.R. & Martins, M.B. 2004. A new anthophil-
ic species of Drosophila Fallen belonging to the bromeliae
group of species (Diptera, Drosophilidae). Rev. Bras. Zool. Soc.
Bras. Zool. 21: 435–437.Darriba, D., Taboada, G.L., Doallo, R. & Posada, D. 2012.
jModelTest 2: more models, new heuristics and parallel com-
puting. Nat. Methods 9: 772.
Do Val, F.C. & Marques, M.D. 1996. Drosophilidae (Diptera)
from the Pantanal of Mato Grosso (Brazil), with the descrip-
tion of a new species belonging to the bromeliae group of the
genus Drosophila. Pap. Avulsos Zool. 39: 223–230.Drummond, A.J., Suchard, M.A., Xie, D. & Rambaut, A. 2012.
Bayesian phylogenetics with BEAUti and the BEAST 1.7.
Mol. Biol. Evol. 29: 1969–1973.Duda, O. 1927. Die sudamerikanischen Drosophiliden (Dipter-
en) unter Berucksichtigung auch der anderen neotropischen
sowie der nearktischen Arten. Arch. F€ur Naturgeschichte 91:
1–228.Engelmann, G. 1852. Four hundred and twenty-eight meeting.
May 27, 1856. Annual Meeting; Synopsis of the Cactaceæ of
the Territory of the United States and Adjacent Regions.
Proc. Am. Acad. Arts Sci. 3: 256–314.Etges, W.J., Johnson, W.R., Duncan, G.A., Huckins, G. &
Heed, W.B. 1999. Ecological genetics of cactophilic Drosoph-
ila. In: Ecology of Sonoran Desert Plants and Plant Communities
(R. Robichaux, ed.), pp. 164–214. University of Arizona
Press, Tucson, Arizona.
Ferrari, L., L�opez-Mart�ınez, M., Aguirre-D�ıaz, G. & Carras-
co-N�u~nez, G. 1999. Space-time patterns of Cenozoic arc vol-
canism in central Mexico: from the Sierra Madre Occidental
to the Mexican Volcanic Belt. Geology 27: 303–306.Feuerborn, H.J. 1922. Das Hypopygium “inversum” und “cir-
cumversum” der Dipteren. Zool. Anz. 55: 89–213.Garrigan, D., Kingan, S.B., Geneva, A.J., Andolfatto, P., Clark,
A.G., Thornton, K.R. et al. 2012. Genome sequencing reveals
complex speciation in the Drosophila simulans clade. Genome
Res. 22: 1499–1511.Gregory-Wodzicki, K.M. 2000. Uplift history of the Central
and Northern Andes: a review. Geol. Soc. Am. Bull. 112:
1091–1105.Guindon, S. & Gascuel, O. 2003. A simple, fast, and accurate
algorithm to estimate large phylogenies by maximum likeli-
hood. Syst. Biol. 52: 696–704.Hastings, J.R., Turner, R.M. & Warren, D.K. 1972. An atlas of
some plant distributions in the Sonoran Desert. University of
Arizona, Institute of Atmospheric Physics.
Heed, W.B. 1982. The origin of Drosophila in the Sonoran Des-
ert. In: Ecological Genetics and Evolution: The Cactus-Yeast- Dro-
sophila Model System (J.S.F. Barker & W.T. Starmer, eds),
pp. 65–80. Academic Press, Sydney, Australia.
Heed, W.B. & Kircher, H.W. 1965. Unique sterol in the ecol-
ogy and Nutrition of Drosophila pachea. Science 149: 758–761.
Heled, J. & Drummond, A.J. 2010. Bayesian inference of spe-
cies trees from Multilocus data. Mol. Biol. Evol. 27: 570–580.Huber, B.A., Sinclair, B.J. & Schmitt, M. 2007. The evolution
of asymmetric genitalia in spiders and insects. Biol. Rev. 82:
647–698.Humphries, E.M. & Winker, K. 2010. Working through polyto-
mies: Auklets revisited. Mol. Phylogenet. Evol. 54: 88–96.Hunter, A.S. 1970. Drosophila of Venezuela. Drosoph. Inf. Serv.
45: 124.
Katoh, K., Misawa, K., Kuma, K. & Miyata, T. 2002. MAFFT:
a novel method for rapid multiple sequence alignment
based on fast Fourier transform. Nucleic Acids Res. 30: 3059–3066.
Lang, M. & Orgogozo, V. 2012. Distinct copulation positions in
Drosophila pachea males with symmetric or asymmetric exter-
nal genitalia. Contr. Zool. 81: 87–94.Lang, M., Murat, S., Clark, A.G., Gouppil, G., Blais, C., Matz-
kin, L.M. et al. 2012. Mutations in the neverland gene
turned Drosophila pachea into an obligate specialist species.
Science 337: 1658–1661.Leigh, E.G., O’Dea, A. & Vermeij, G.J. 2014. Historical bioge-
ography of the Isthmus of Panama. Biol. Rev. 89: 148–172.Lindsay, G. 1963. The genus Lophocereus. Cactus Succul. J. 35:
176–192.Liu, H. & Beckenbach, A.T. 1992. Evolution of the mitochon-
drial cytochrome oxidase II gene among 10 orders of insects.
Mol. Phylogenet. Evol. 1: 41–52.Lizarralde, D., Axen, G.J., Brown, H.E., Fletcher, J.M., Gonz-
alez-Fernandez, A., Harding, A.J. et al. 2007. Variation in
styles of rifting in the Gulf of California. Nature 448: 466–469.Markow, T. & O’Grady, P. 2005. Drosophila, A Guide to Species
Identification and Use. Academic Press, Elsevier, Amsterdam.
Markow, T.A. & O’Grady, P.M. 2007. Drosophila biology in the
genomic age. Genetics 177: 1269–1276.Montes, C., Bayona, G., Cardona, A., Buchs, D.M., Silva, C.A.,
Mor�on, S. et al. 2012a. Arc-continent collision and orocline
formation: closing of the Central American seaway. J. Geo-
phys. Res. 117: 1–25.Montes, C., Cardona, A., McFadden, R., Mor�on, S.E., Silva,
C.A., Restrepo-Moreno, S. et al. 2012b. Evidence for middle
Eocene and younger land emergence in central Panama:
implications for isthmus closure. Geol. Soc. Am. Bull. 124:
780–799.Obbard, D.J., Maclennan, J., Kim, K.-W., Rambaut, A., O’Gra-
dy, P.M. & Jiggins, F.M. 2012. Estimating divergence dates
and substitution rates in the Drosophila phylogeny. Mol. Biol.
Evol. 29: 3459–3473.Oliveira, D.C.S.G., Almeida, F.C., O’Grady, P.M., Armella,
M.A., DeSalle, R. & Etges, W.J. 2012. Monophyly, diver-
gence times, and evolution of host plant use inferred from a
revised phylogeny of the Drosophila repleta species group.
Mol. Phylogenet. Evol. 64: 533–544.Patterson, J.T. & Stone, W.S. 1952. Evolution in the Genus
Drosophila. Macmillan, New York.
Patterson, J. & Wheeler, M. 1942. Description of new species
of the subgenera Hirtodrosophila and Drosophila. Univ Tex
Publ. Austin.
Pavan, C. & da Cunha, A.B. 1947. Esp�ecies Brasileiras de Dro-
sophila. Universidade de S~ao Paulo, S~ao Paulo.
Pitnick, S. & Heed, W. 1994. New Species of Cactus-Breeding
Drosophila (Diptera: Drosophilidae) in the Nannoptera Species
Group. Ann. Entomol. Soc. Am. 87: 307–310.Pitnick, S., Markow, T.A. & Spicer, G.S. 1995. Delayed male
maturity is a cost of producing large sperm in Drosophila.
Proc. Natl Acad. Sci. 92: 10614–10618.Pitnick, S., Spicer, G.S. & Markow, T. 1997. Phylogenetic
examination of female incorporation of ejaculate in Drosoph-
ila. Evolution 51: 833–845.Pitnick, S., Markow, T. & Spicer, G.S. 1999. Evolution of mul-
tiple kinds of female sperm-storage organs in Drosophila.
Evolution 53: 1804–1822.
ª 2 01 4 THE AUTHORS . J . E VOL . B I OL . do i : 1 0 . 1 11 1 / j e b . 1 2 32 5
JOURNAL OF EVOLUT IONARY B IO LOGY ª 20 1 4 EUROPEAN SOC I E TY FOR EVOLUT IONARY B IO LOGY
Radiation of the Drosophila nannoptera group 9
185

Posada, D. 2008. jModelTest: Phylogenetic Model Averaging.
Mol. Biol. Evol. 25: 1253–1256.Price, J.P. & Clague, D.A. 2002. How old is the Hawaiian
biota? Geology and phylogeny suggest recent divergence.
Proc. R. Soc. Lond. B Biol. Sci. 269: 2429–2435.Rambaut, A. & Drummond, A. 2009. Tracer v1.5.
Rambaut, A. & Drummond, A. 2012. Figtree v1.4.
Roubik, D.W. & de Camargo, J.M.F. 2012. The Panama micro-
plate, island studies and relictual species of Melipona (Meli-
kerria) (Hymenoptera: Apidae: Meliponini). Syst. Entomol.
37: 189–199.Russo, C.A., Takezaki, N. & Nei, M. 1995. Molecular phylog-
eny and divergence times of drosophilid species. Mol. Biol.
Evol. 12: 391–404.Song, S., Liu, L., Edwards, S.V. & Wu, S. 2012. Resolving con-
flict in eutherian mammal phylogeny using phylogenomics
and the multispecies coalescent model. Proc. Natl. Acad. Sci.
109: 14942–14947.Spicer, G.S. & Bell, C.D. 2002. Molecular phylogeny of the
Drosophila virilis species group (Diptera: Drosophilidae)
inferred from mitochondrial 12S and 16S ribosomal RNA
genes. Ann. Entomol. Soc. Am. 95: 156–161.Stone, R. 2013. Battle for the Americas. Science 341: 230–233.Sturtevant, A.H. 1916. Notes on North American Drosophilidae
with descriptions of twenty-three new species. Ann. Entomol.
Soc. Am. 9: 323–343.Suzanne, M., Petzoldt, A.G., Sp�eder, P., Coutelis, J.-B., Steller,H. & Noselli, S. 2010. Coupling of apoptosis and l/r patterning
controls stepwise organ looping. Curr. Biol. 20: 1773–1778.Tamura, K., Subramanian, S. & Kumar, S. 2004. Temporal pat-
terns of fruit fly (Drosophila) evolution revealed by mutation
clocks. Mol. Biol. Evol. 21: 36–44.Tamura, K., Dudley, J., Nei, M. & Kumar, S. 2007. MEGA4:
Molecular Evolutionary Genetics Analysis (MEGA) Software
Version 4.0. Mol. Biol. Evol. 24: 1596–1599.Throckmorton, L.H. 1975. The phylogeny, ecology, and geog-
raphy of Drosophila. In: Handbook of Genetics (R.C. King, ed.),
pp. 421–469. Plenum Publishing Corporation, New York.
Umhoefer, P.J. 2011. Why did the Southern Gulf of California
rupture so rapidly? – Oblique divergence across hot, weak
lithosphere along a tectonically active margin. GSA Today 21:
4–10.Van der Linde, K., Houle, D., Spicer, G.S. & Steppan, S.J.
2010. A supermatrix-based molecular phylogeny of the fam-
ily Drosophilidae. Genet. Res. 92: 25–38.
Vilela, C. & Baechli, G. 1990. Taxonomic studies on Neotropi-
cal species of seven genera of Drosophilidae (Diptera). Mitt.
Schweiz Ent. Ges. 63: 1–332.Walsh, H.E., Kidd, M.G., Moum, T. & Friesen, V.L. 1999. Poly-
tomies and the Power of Phylogenetic Inference. Evolution
53: 932–937.Wang, B., Park, J., Watabe, H., Gao, J., Xiangyu, J., Aotsuka,
T. et al. 2006. Molecular phylogeny of the Drosophila virilis
section (Diptera: Drosophilidae) based on mitochondrial and
nuclear sequences. Mol. Phylogenet. Evol. 40: 484–500.Ward, B.L. & Heed, W.B. 1970. Chromosome phylogeny of
Drosophila pachea and related species. J. Hered. 61: 248–258.Webb, S.D. 1976. Mammalian faunal dynamics of the great
American interchange. Paleobiology 2: 220–234.Wheeler, M. 1949. Taxonomic studies on the Drosophilidae.
In: Studies in the Genetics of Drosophila (J.T. Patterson, ed.),
pp. 157–195. University of Texas Publications No 4920,
Austin.
Yassin, A. 2013. Phylogenetic classification of the Drosophili-
dae Rondani (Diptera): the role of morphology in the post-
genomic era. Syst. Entomol. 38: 349–364.
Supporting information
Additional Supporting Information may be found in the
online version of this article:
Table S1 Species resources.
Table S2 Oligonucleotides used in this study.
Table S3 GenBank accession numbers of the data set.
Table S4 Partition specific models of nucleotide evolu-
tion and parameters.
Table S5 Test of recombination.
Table S6 Parsimony informative sites.
Figure S1 *BEAST analysis and gene-specific tree
topologies.
Figure S2 Approximation of the number of loci
required for a *BEAST multilocus analysis of the nan-
noptera group with reliable node support.
Figure S3 Hypothetical speciation scenario of Drosophila
wassermani and D. pachea.
Received 12 November 2013; revised 20 December 2013; accepted 24
December 2013
ª 2 01 4 THE AUTHORS . J . E VOL . B I OL . do i : 1 0 . 1 11 1 / j e b . 1 2 32 5
JOURNAL OF EVOLUT IONARY B IOLOGY ª 2014 EUROPEAN SOC I E TY FOR EVOLUT IONARY B IO LOGY
10 M. LANG ET AL.
Appendix 2.
186

187
Appendix 3.

Nueva especie cactofílica de Drosophila descubierta en Ecuador
© 2011 Universitat Autònoma de Barcelona - Tots els drets reservats
Nueva especie cactofílica de Drosophila descubierta en Ecuador02/2014 - Biología. Ha sido descubierta en Ecuador una nueva especie de mosca endémica con manchas en el tórax,Drosophila machalilla, cuyo nombre específico hace referencia a una cultura prehispánica que habitó la región. Estaespecie habita en cactus columnares y tiene una alta tolerancia a alcaloides tóxicos para otras especies. La futurasecuenciación de su genoma permitiría buscar los genes implicados en la depuración de alcaloides tóxicos, así comola evolución de caracteres sexuales en dípteros.
[]
La nueva especie D. machalilla y el cactus columnar Armatocereus cartwrightianus, en donde ha sido colectada.
[]
Un equipo conformado por investigadores de la UAB y la PUCE de Ecuador han descrito una nueva especie de mosca conmanchas en el tórax que pertenece al género Drosophila, el organismo modelo más utilizado en investigación biológica,particularmente en Genética y Biomedicina.
El nombre de la nueva especie, D. machalilla, hace referencia a una cultura prehispánica (850-1400 d. C.) que habitó la regiónen la que fue descubierta y es endémica. El estudio publicado en la revista Annals of Entomological Society of America, fuerealizado en el Departamento de Genética y Microbiología de la UAB e incluye una descripción morfológica completa de laespecie en diferentes fases de su desarrollo, lo que ha servido para su clasificación.
Los especímenes tipo de D. machalilla se encuentran depositados en el Museo de Historia Natural de Nueva York. El análisisde su DNA ha determinado que las especies filogenéticamente más cercanas pertenecen al grupo nannoptera, moscasconocidas por habitar en cactus columnares y que tienen una alta tolerancia a alcaloides que son tóxicos para otras especies.Utilizando el reloj molecular se ha estimado que D. machalilla divergió del grupo nannoptera hace 7-17 millones de años.
El hallazgo de D. machalilla en Sudamérica abre interrogantes sobre cómo pudo haberse producido la separación de estoslinajes, debido a que las especies más cercanas del grupo nannoptera habían sido registradas únicamente en zonas desérticasde Norteamérica. Según otro artículo publicado en Journal of Evolutionay Biology, realizado por investigadores de Francia,Estados Unidos y la UAB, el tiempo de divergencia estimado entre estas especies coincide con el período de formación delistmo de Panamá, sugiriendo que el ancestro del grupo nannoptera pudo haber migrado desde Sudamérica cuando se formó elitsmo.
Un futuro proyecto de investigación planea secuenciar el genoma de Drosophila machalilla y utilizar esta información en labúsqueda de genes implicados en la depuración de alcaloides tóxicos y la evolución de caracteres sexuales en dípteros.
Andrea E. Acurio Armas
Departament de Genètica i de Microbiologia
Grup Genòmica, Bioinformàtica i Evolució
Acurio, A.; Rafael, V.; Céspedes, D.; Ruiz, A. Description of a new spotted-thorax Drosophila (Diptera, Drosophilidae) speciesand its evolutionary relationships inferred by a cladistic analysis of morphological traits. Annals of Entomological Society ofAmerica 106(6):695-705. 2013.Lang, M.; Polihronakis, M.; Acurio, A.; Markow, T.; Orgogozo, V. Radiation of the Drosophila nannoptera species group inMexico. Journal of Evolutionary Biology. 2014.

189
Appendix 4.


191
Appendix 5.

The Drosophila repleta species group is one of the largest in the subgenus Drosophila. This group has been used as a model system for genetic, ecological
1 2and evolutionary studies . The inca subgroup is the less well-known of six species subgroups of the repleta group. It was defined in 1989, to include three cactophilic species endemics to Ecuador (South America): D. inca, D. huancavilcae and D. yangana. The inclusion of these three species in the same subgroup was based on shared morphological traits, accordingly the evolutionary relationships of the inca subgroup in the repleta lineage is unclear. Here we include for the first time the inca subgroup in a molecular phylogenetic study in order to determinate its evolutionary relationships within the Drosophila repleta lineage.
Collections of Drosophila adults were carried out in xerophytic habitats of North Coast, Central and South of Ecuador (Acurio et al. in preparation). DNA was extracted from isofemale strains, amplified by PCR with specific primers and sequenced. Our dataset includes sequences of two mitochondrial (COI, COII) and two nuclear genes (Marf, SinA) generated by our collections and sequences of selected representatives from others five repleta species subgroups (mulleri,
3fasciola, hydei, mercatorum, repleta) drawn from a previous study . D. virilis from the virilis group was used as outgroup. Two different phylogenetic approaches were used: (1) Bayesian Inference: sequences were aligned with Clustal W, and analysed with
4BEAST setting two partitions for mitochondrial and nuclear genes.(2) Maximum Likelihood: sequences were aligned and a phylogenetic tree was
5simultaneously estimated using SATé .
The Mexican Trans-Volcanic Region has been considered the center of 6,7diversification of the repleta group because many years of collection efforts
focused on this area. However, nowadays the diversity of D. repleta group 7species and other members of the virilis-repleta radiation has become
3apparent in South America. A recent phylogenetic study suggests a South American origin for the repleta lineage associated with their cactus host. The basal position in the phylogeny (Figures 1 and 2) of the three inca subgroup species that are seemingly endemics to Ecuador corroborates the hypothesis of the early South American diversification of the Drosophila repleta lineage.
(1) Markow, T.A., O’Grady, P. 2006. Drosophila: A Guide to Species Identification and Use. Academic Press, New York. (2) Rafael, V., Arcos, G., 1989. Subgrupo inca, un nuevo subgrupo del grupo repleta, con descripción de Drosophila huancavilcae n. sp (Diptera, Drosophilidae) Evol. Biol. 3, 233–243. (3) Oliveira, D.C.S.G., et al. 2012. Monophyly, divergence times, and evolution of host plant use inferred from a revised phylogeny of the Drosophila repleta species group. Mol. Phylogenet. Evol. 2012 May 24. [Epub ahead of print] (4)Drummond et al. Bayesian phylogenetics with BEAUti and the BEAST 1.7. Mol. Biol. Evol. 2012 Mar 21. [Epub ahead of print]. (5) Liu, K., S. et al., 2009. Rapid and accurate large scale coestimation of sequence alignments and phylogenetic trees. Science, 324(5934), pp. 1561-1564. (6) Patterson, J.T., Stone, W.S., 1952. Evolution in the Genus Drosophila. MacMillan, New York. (7)Throckmorton, L., 1975. The phylogeny, ecology, and geography of Drosophila. In: King, R. (Ed.), Handbook of Genetics. Plenum, New York, pp. 421–469.
Background
Methods
Results
Discussion
Andrea Acurio*, Deodoro C. S. G. Oliveira*, Violeta Rafael▲ Alfredo Ruiz**Departament de Genètica i de Microbiologia, Universitat Autónoma de Barcelona, Bellaterra (Barcelona), 08193, Spain.Ù! Laboratorio de Genética Evolutiva, Pontificia Universidad Católica del Ecuador, Quito (Pichincha), 17012184, Ecuador.
Literature cited
We thank Andres Acurio and Margarita Armas for assistance in collecting Drosophila at Ecuador. This work was supported by a grant (BFU2011-30476) from the Ministerio de Ciencia e Innovación (Spain) to AR and a FI-DGR doctoral fellowship from Generalitat de Catalunya to AA.
Acknowledgments
Both ML and partitioned Bayesian analyses produce single tress with the same well-supported topology (Figures 1 and 2). Both phylogenetic trees recover a monophyletic inca subgroup. On the inca clade, D. inca is most closely related to D. huancavilcae than D. yangana, which is the most ancestral from the three species. From the six species subgroups on the Drosophila repleta species group, the inca subgroup shows the most basal phylogenetic position.
Figure 1. Molecular Phylogenetic tree obtained by Maximum Likehood with SATé setting MAFFT as aligner, RAXML as tree estimator and GTR GAMMA substitution model. Numbers denote support on each clade.
Figure 2. Molecular Phylogenetic tree obtained by Bayesian Inference with BEAST setting mitochondrial and nuclear partitions. Numbers denote BI posterior probability.
Monophyly and placement of the Drosophila inca species subgroup corroborate the early South American diversification of the Drosophila repleta lineage
repleta subgroup mulleri subgroup mercatorum subgroup
inca subgroup fasciola subgroup hydei subgroup
repleta subgroup mulleri subgroup mercatorum subgroup
inca subgroup fasciola subgroup hydei subgroup
For further information please contact to [email protected]

193
Appendix 6.
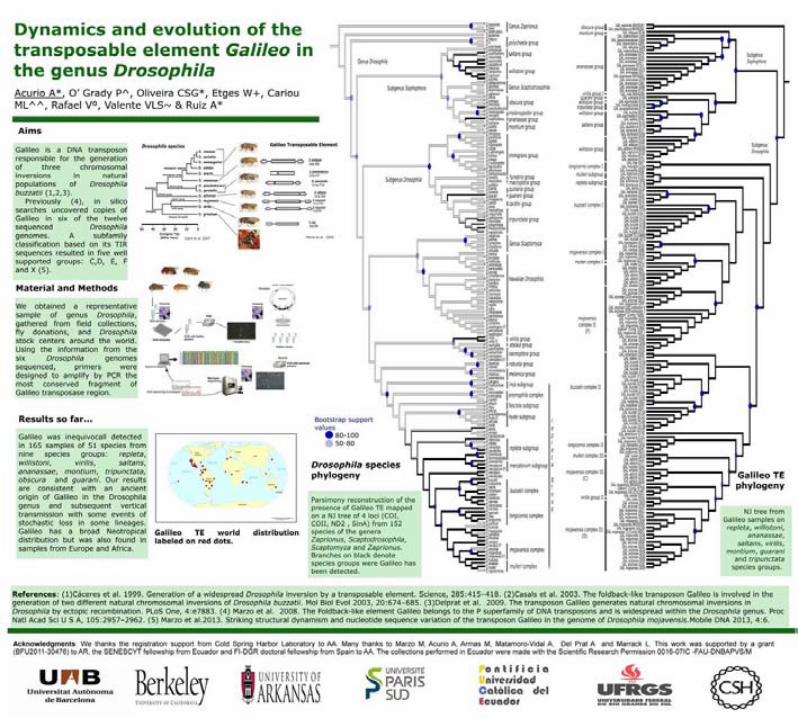

196
VII. REFERENCES
VII. REFERENCES
197
Abrusán, G. & Krambeck, H.-J., 2006. Competition may determine the diversity of transposable elements. Theoretical population biology, 70(3), pp.364–375.
Acurio, A. et al., 2013. Description of a New Spotted-Thorax Drosophila (Diptera: Drosophilidae) Species and its Evolutionary Relationships Inferred by a Cladistic Analysis of Morphological Traits. Annals of the Entomological Society of America, 106(6), pp.695–705.
Acurio, A. & Rafael, V., 2009. Diversity and geographical distribution of Drosophila (Diptera, Drosophilidae) in Ecuador. Drosophila Information Service, 92, pp.20–25.
Acurio, A., Rafael, V. & Dangles, O., 2010. Biological Invasions in the Amazonian Tropical Rain Forest: The Case of Drosophilidae (Insecta, Diptera) in Ecuador, South America. Biotropica, 42(6), pp.717–723.
Anisimova, M. & Gascuel, O., 2006. Approximate Likelihood-Ratio Test for Branches: A Fast, Accurate, and Powerful Alternative. Systematic Biology , 55 (4 ), pp.539–552.
Arnaud, F. et al., 2007. A paradigm for virus–host coevolution: sequential counter-adaptations between endogenous and exogenous retroviruses. PLoS pathogens, 3(11), p.e170.
Bächli, G., 2013. TaxoDros:The database on Taxonomy of Drosophilidae. Available at: http://taxodrosunizh.ch/.
Bächli, G. et al., 2005. The Drosophilidae (Diptera) of Fennoscandia and Denmark, Brill.
Bao, W. et al., 2009. New Superfamilies of Eukaryotic DNA Transposons and Their Internal Divisions. Molecular Biology and Evolution , 26 (5 ), pp.983–993.
Bartolomé, C., Bello, X. & Maside, X., 2009. Widespread evidence for horizontal transfer of transposable elements across Drosophila genomes. Genome biology, 10(2), p.R22.
Bock, I.R. & Parsons, P.A., 1978. The subgenus Scaptodrosophila (Diptera: Drosophilidae). Systematic Entomology, 3(2), pp.91–102.
Bowen, N.J. & McDonald, J.F., 2001. Drosophila Euchromatic LTR Retrotransposons are Much Younger Than the Host Species in Which They Reside. Genome Research , 11 (9 ), pp.1527–1540.
Brake, I. & Bächli, G., 2008. Drosophilidae (Diptera) World Catalogue of Insects, Stenstrup: Apollo Books.
Brookfield, J.F.Y., 2005. The ecology of the genome [mdash] mobile DNA elements and their hosts. Nat Rev Genet, 6(2), pp.128–136.
Brunet, F. et al., 1994. The mariner transposable element in the Drosophilidae family. Heredity, 73(4), pp.377–385.
Cáceres, M. et al., 1999. Generation of a Widespread Drosophila Inversion by a Transposable Element. Science , 285 (5426 ), pp.415–418.

VII. REFERENCES
198
Cáceres, M., Puig, M. & Ruiz, A., 2001. Molecular Characterization of Two Natural Hotspots in the Drosophila buzzatii Genome Induced by Transposon Insertions. Genome Research , 11 (8 ), pp.1353–1364.
Caletka, B.C. & McAllister, B.F., 2004. A genealogical view of chromosomal evolution and species delimitation in the Drosophila virilis species subgroup. Mol Phyl Evol, 33(3), pp.664–670.
Capy, P. et al., 1998. Dynamics and Evolution of Transposable Elements, Austin: Thompson Learning.
Capy, P., Anxolabéhère, D. & Langin, T., 1994. The strange phylogenies of transposable elements: are horizontal transfers the only explanation? Trends in Genetics, 10(1), pp.7–12.
Casals, F. et al., 2005. Molecular Characterization and Chromosomal Distribution of Galileo, Kepler and Newton, Three Foldback Transposable Elements of the Drosophila buzzatii Species Complex. Genetics , 169 (4 ), pp.2047–2059.
Casals, F., Cáceres, M. & Ruiz, A., 2003. The Foldback-like Transposon Galileo Is Involved in the Generation of Two Different Natural Chromosomal Inversions of Drosophila buzzatii. Molecular Biology and Evolution , 20 (5 ), pp.674–685.
Charleston, M.A. & Page, R.D.M., 2002. TreeMap. v. 2.0. 2. Software distributed by authors.
Charleston, M.A. & Robertson, D.L., 2002. Preferential Host Switching by Primate Lentiviruses Can Account for Phylogenetic Similarity with the Primate Phylogeny. Systematic Biology , 51 (3 ), pp.528–535.
Charlesworth, B., Sniegowski, P. & Stephan, W., 1994. The evolutionary dynamics of repetitive DNA in eukaryotes. Nature, 371(6494), pp.215–220.
Clark, A.G. et al., 2007. Evolution of genes and genomes on the Drosophila phylogeny. Nature, 450(7167), pp.203–218.
Clark, J.B., Maddison, W.P. & Kidwell, M.G., 1994. Phylogenetic analysis supports horizontal transfer of P transposable elements. Molecular Biology and Evolution , 11 (1 ), pp.40–50.
Clark, M.A. et al., 2000. Cospeciation between bacterial endosymbionts (Buchnera) and a recent radiation of Aphids (Uroleucon) and pitfalls of testing for phylogenetic congruence. Evolution, 54(2), pp.517–525.
Daniels, S.B., Peterson, K.R., et al., 1990. Evidence for horizontal transmission of the P transposable element between Drosophila species. Genetics , 124 (2 ), pp.339–355.
Daniels, S.B., Chovnick, A. & Boussy, I.A., 1990. Distribution of hobo transposable elements in the genus Drosophila. Molecular Biology and Evolution , 7 (6 ), pp.589–606.
Darriba, D. et al., 2012. jModelTest 2: more models, new heuristics and parallel computing. Nat Meth, 9(8), p.772.

VII. REFERENCES
199
Darwin, C., 1859. On the origin of species by means of natural selection, or the preservation of favoured races in the struggle for life 1st editio. J. Murray, ed., London.
Darwin, C., 1877. The various contrivances by which orchids are fertilised by insects 2nd ed. J. Murray, ed., London.
Delprat, A. et al., 2009. The Transposon Galileo Generates Natural Chromosomal Inversions in Drosophila by Ectopic Recombination. PLoS ONE, 4(11), p.e7883.
DeSalle, R. et al., 1987. Tempo and mode of sequence evolution in mitochondrial DNA of HawaiianDrosophila. Journal of Molecular Evolution, 26(1-2), pp.157–164.
DeSalle, R., 1992. The phylogenetic relationships of flies in the family Drosophilidae deduced from mtDNA sequences. Molecular Phylogenetics and Evolution, 1(1), pp.31–40.
Doolittle, W.F. & Sapienza, C., 1980. Selfish genes, the phenotype paradigm and genome evolution. Nature, 284(5757), pp.601–603.
Drummond, A.J. et al., 2012a. Bayesian Phylogenetics with BEAUti and the BEAST 1.7. Molecular Biology and Evolution, 29, pp.1969–1973.
Drummond, A.J. et al., 2012b. Bayesian Phylogenetics with BEAUti and the BEAST 1.7. Molecular biology and evolution, 29(8).
Drummond, A.J. et al., 2011. Geneious. , 5.4.
Drummond, A.J. & Rambaut, A., 2007. BEAST: Bayesian evolutionary analysis by sampling trees. BMC Evol Biol, 7.
Ehrlich, R. & Raven, H., 1964. Butterflies and Plants: A study in Coevolution. Evolution, 18(4), pp.586–608.
Fahrenholz, H., 1913. Ectoparasiten und Abstammungslehre. Zoologischer Anzeiger, (41), pp.371–374.
Feschotte, C. & Pritham, E.J., 2007. DNA Transposons and the Evolution of Eukaryotic Genomes. Annual Review of Genetics, 41(1), pp.331–368.
Fletcher, W. & Yang, Z., 2010. The Effect of Insertions, Deletions, and Alignment Errors on the Branch-Site Test of Positive Selection. Molecular biology and evolution, 27(10), pp.2257–2267.
Fonseca, N.A. et al., 2013. Drosophila americana as a Model Species for Comparative Studies on the Molecular Basis of Phenotypic Variation. Genome Biology and Evolution , 5 (4 ), pp.661–679.
Fontdevila, A., 2011. The dynamic genome: a Darwinian approach, Oxford University Press.
Giribet, G., 2005. TNT: Tree Analysis Using New Technology. Systematic Biology , 54 (1 ), pp.176–178.

VII. REFERENCES
200
Goloboff, P.A., Mattoni, C.I. & Quinteros, A.S., 2006. Continuous characters analyzed as such. Cladistics, 22(6), pp.589–601.
Gonçalves, J. et al., 2014. Structural and sequence diversity of the transposon Galileo in the Drosophila willistoni genome. BMC Genomics, 15(792).
Goto, S.G. & Kimura, M.T., 2001. Phylogenetic utility of mitochondrial COI and nuclear Gpdh genes in Drosophila. Molecular phylogenetics and evolution, 18(3), pp.404–22.
Grantham, R. et al., 1980. Codon catalog usage and the genome hypothesis. Nucleic acids research, 8(1), p.197.
Grimaldi, D.A., 1990. A phylogenetic, revised classification of genera in the Drosophilidae (Diptera) L. H. Throckmorton & T. Okada, eds. Bulletin of the American Museum of Natural History, (197), pp.1–139.
Guindon, S. et al., 2010. New algorithms and methods to estimate maximum-likelihood phylogenies: assessing the performance of PhyML 3.0. Systematic biology, 59(3), pp.307–21.
Hatadani, L.M. et al., 2009. Molecular phylogeny of the Drosophila tripunctata and closely related species groups (Diptera: Drosophilidae). Molecular phylogenetics and evolution, 51(3), pp.595–600.
Hennig, W., 1966. Phylogenetic Systematics, Urbana, USA.: Univ. Illinois Press.
Hickey, D.A., 1982. SELFISH DNA: A SEXUALLY-TRANSMITTED NUCLEAR PARASITE. Genetics , 101 (3-4 ), pp.519–531.
Holt, B.G. et al., 2013. An Update of Wallace’s Zoogeographic Regions of the World. Science , 339 (6115 ), pp.74–78.
Hua-Van, A. et al., 2011. The struggle for life of the genome’s selfish architects. Biology direct, 6(1), p.19.
ICZN, 2010. OPINION 2245 (Case 3407) Drosophila Fallén, 1823 (Insecta, Diptera): Drosophila funebris Fabricius, 1787 is maintained as the type species. Bulletin of Zoological Nomenclature, 67(1).
Jackson, A.P. & Charleston, M.A., 2004. A Cophylogenetic Perspective of RNA–Virus Evolution. Molecular Biology and Evolution , 21 (1 ), pp.45–57.
Jaenike, J., 1987. Genetics of oviposition-site preference in Drosophila tripunctata. Heredity, 59(Pt 3), pp.363–369.
Jia, J. & Xue, Q., 2009. Codon usage biases of transposable elements and host nuclear genes in Arabidopsis thaliana and Oryza sativa. Genomics, proteomics & bioinformatics, 7(4), pp.175–84.
Kapitonov, V. V & Jurka, J., 2008. A universal classification of eukaryotic transposable elements implemented in Repbase. Nat Rev Genet, 9(5), pp.411–412.

VII. REFERENCES
201
Katoh, K., Asimenos, G. & Toh, H., 2009. Multiple Alignment of DNA Sequences with MAFFT. In D. Posada, ed. Bioinformatics for DNA Sequence Analysis. Methods in Molecular Biology. Humana Press, pp. 39–64.
Kidwell, M.G., 2002. Transposable elements and the evolution of genome size in eukaryotes. Genetica, 115(1), pp.49–63.
Kidwell, M.G. & Lisch, D., 1997. Transposable elements as sources of variation in animals and plants. Proceedings of the National Academy of Sciences, 94(15), pp.7704–7711.
Kidwell, M.G. & Lisch, D.R., 2001. Perspective: transposable elements, parasitic DNA, and genome evolution. Evolution, 55(1), pp.1–24.
King, J.C., 1947. A comparative analysis of the chromosomes of the guarani group of Drosophila. Evolution, pp.48–62.
Kopp, A., 2006. Basal relationships in the Drosophila melanogaster species group. Molecular phylogenetics and evolution, 39(3), pp.787–98.
Lachaise, D. et al., 1988. Historical Biogeography of the Drosophila melanogaster Species Subgroup. In M. Hecht, B. Wallace, & G. Prance, eds. Evolutionary Biology SE - 4. Evolutionary Biology. Springer US, pp. 159–225.
Da Lage, J.-L. et al., 2007. A phylogeny of Drosophilidae using the Amyrel gene: questioning the Drosophila melanogaster species group boundaries. Journal of Zoological Systematics and Evolutionary Research, 45(1), pp.47–63.
Larkin, M.A. et al., 2007. Clustal W and Clustal X version 2.0. Bioinformatics, 23(21), pp.2947–2948.
Lee, Y.C.G. & Langley, C.H., 2012. Long-Term and Short-Term Evolutionary Impacts of Transposable Elements on Drosophila. Genetics , 192 (4 ), pp.1411–1432.
Leonardo, T.E. & Nuzhdin, S. V, 2002. Intracellular battlegrounds: conflict and cooperation between transposable elements. Genetics Research, 80(03), pp.155–161.
Lerat, E., Biémont, C. & Capy, P., 2000. Codon Usage and the Origin of P Elements. Molecular Biology and Evolution , 17 (3 ), pp.467–468.
Lerat, E., Capy, P. & Biémont, C., 2002. Codon Usage by Transposable Elements and Their Host Genes in Five Species. Journal of Molecular Evolution, 54(5), pp.625–637.
Lewis, P.O., 2001. A Likelihood Approach to Estimating Phylogeny from Discrete Morphological Character Data. Systematic Biology , 50 (6 ), pp.913–925.
Van Der Linde, K. et al., 2010. A supermatrix-based molecular phylogeny of the family Drosophilidae. Genetics Research, 92(01), pp.25–38.
Van Der Linde, K. et al., 2007. Case 3407: Drosophila Fallen, 1832 (Insecta, Diptera): proposed conservation of usage. Bulletin of Zoological Nomenclature, 64(4), pp.238–242.

VII. REFERENCES
202
Van der Linde, K. & Houle, D., 2008. A supertree analysis and literature review of the genus Drosophila and closely related genera (Diptera, Drosophilidae). Insect Systematics and Evolution, 39(3), pp.241–267.
Lisch, D., 2013. How important are transposons for plant evolution? Nat Rev Genet, 14(1), pp.49–61.
Liu, K. et al., 2012. SATé-II: Very Fast and Accurate Simultaneous Estimation of Multiple Sequence Alignments and Phylogenetic Trees. Systematic Biology, 61(1), pp.90–106.
Loreto, E.L.S., Carareto, C.M.A. & Capy, P., 2008. Revisiting horizontal transfer of transposable elements in Drosophila. Heredity, 100(6), pp.545–554.
Lynch, M. & Conery, J.S., 2003. The Origins of Genome Complexity. Science , 302 (5649 ), pp.1401–1404.
Maddison, W.P. & Maddison, D.R., 2010. Mesquite: a modular system for evolutionary analysis, version 2.74.
Martin, D.P. et al., 2010. RDP3: a flexible and fast computer program for analyzing recombination. Bioinformatics (Oxford, England), 26(19), pp.2462–3.
Maruyama, K. & Hartl, D.L., 1991. Evolution of the transposable element mariner in Drosophila species. Genetics , 128 (2 ), pp.319–329.
Marzo, M., Liu, D., et al., 2013. Identification of multiple binding sites for the THAP domain of the< i> Galileo</i> transposase in the long terminal inverted-repeats. Gene, 525(1), pp.84–91.
Marzo, M., Bello, X., et al., 2013. Striking structural dynamism and nucleotide sequence variation of the transposon Galileo in the genome of Drosophila mojavensis. Mobile DNA, 4(6).
Marzo, M. et al., 2008. The Foldback-like element Galileo belongs to the P superfamily of DNA transposons and is widespread within the Drosophila genus. Proceedings of the National Academy of Sciences of the United States of America, 105(8), pp.2957–2962.
Mayr, E., 1996. What Is a Species, and What Is Not? Philosophy of Science, 63(2), pp.262–277.
McClintock, B., 1950. The origin and behavior of mutable loci in maize. Proceedings of the National Academy of Sciences , 36 (6 ), pp.344–355.
McClintock, B., 1984. The significance of responses of the genome to challenge. Science , 226 (4676 ), pp.792–801.
McEvey, S.F. et al., 2008. Comments on the proposed conservation of usage of Drosophila Fallén, 1823 (Insecta, Diptera) 6 (Case 3407). Bulletin of Zoological Nomenclature, 65(2), pp.147–150.
Miller, M.A., Pfeiffer, W. & Schwartz, T., 2010. Creating the CIPRES Science Gateway for inference of large phylogenetic trees. In Proceedings of the Gateway Computing Environments Workshop (GCE). pp. 1–8.

VII. REFERENCES
203
Mirol, P.M. et al., 2008. Signals of demographic expansion in Drosophila virilis. BMC evolutionary biology, 8(59), pp.doi:10.1186/1471–2148–8–59.
Montooth, K.L. et al., 2009. Comparative genomics of Drosophila mtDNA: novel features of conservation and change across functional domains and lineages. Journal of molecular evolution, 69(1), pp.94–114.
Morales-Hojas, R. et al., 2011. Resolving the phylogenetic relationships and evolutionary history of the Drosophila virilis group using multilocus data. Molecular phylogenetics and evolution, 60(2), pp.249–258.
Morán, T. & Fontdevila, A., 2005. Phylogeny and molecular evolution of the< i> Drosophila hydei</i> subgroup (< i> Drosophila repleta</i> group) inferred from the< i> Xanthine dehydrogenase</i> gene. Molecular phylogenetics and evolution, 36(3), pp.695–705.
Moriyama, E. et al., 1991. Mutation pattern of human immunodeficiency virus genes. Journal of Molecular Evolution, 32(5), pp.360–363.
Moriyama, E. & Powell, J., 1997. Synonymous substitution rates in Drosophila: Mitochondrial versus nuclear genes. Journal of Molecular Evolution, 45(4), pp.378–391.
Moriyama, E.N. & Hartl, D.L., 1993. Codon usage bias and base composition of nuclear genes in Drosophila. Genetics, 134(3), pp.847–858.
O’Grady, P.M. et al., 2008. Comments on the proposed conservation of usage of Drosophila Fallén, 1823 (Insecta, Diptera) 3 (Case 3407). Bulletin of Zoological Nomenclature, 65(2), pp.141–144.
O’Grady, P.M., 2010. Whither Drosophila? Genetics , 185 (2 ), pp.703–705.
O’Grady, P.M. & Kidwell, M.G., 2002. Phylogeny of the subgenus sophophora (Diptera: drosophilidae) based on combined analysis of nuclear and mitochondrial sequences. Molecular phylogenetics and evolution, 22(3), pp.442–53.
O’Grady, P.M. & Markow, T.A., 2009. Phylogenetic taxonomy in Drosophila: Problems and prospects. fly, 3(1), pp.10–14.
Okada, T., 1989. A proposal of establishing tribes for the family Drosophilidae with key to tribes and genera (Diptera). Zoological Science, (6), pp.391–399.
Oliveira, D.C.S.G. et al., 2005. Molecular systematics and geographical distribution of the Drosophila longicornis species complex (Diptera : Drosophilidae). Zootaxa, (1069), pp.1–32.
Oliveira, D.C.S.G., Almeida, F.C., O’Grady, P.M., Armella, M.A., DeSalle, R., et al., 2012. Monophyly, divergence times, and evolution of host plant use inferred from a revised phylogeny of the Drosophila repleta species group. Molecular phylogenetics and evolution, 64(3), pp.533–544.
Oliveira, D.C.S.G., Almeida, F.C., O’Grady, P.M., Armella, M.A., Desalle, R., et al., 2012. Monophyly, divergence times, and evolution of host plant use inferred from a revised

VII. REFERENCES
204
phylogeny of the Drosophila repleta species group. Molecular phylogenetics and evolution, 64(3).
Orgel, L.E. & Crick, F.H.C., 1980. Selfish DNA: the ultimate parasite. Nature, 284(5757), pp.604–607.
Page, R. & Hafner, M., 1996. Molecular phylogenies and host-parasite cospeciation: Gophers and lice as a model system. In Harvey P.H. et al., eds. Oxford: Oxford University Press, pp. 255–270.
Page, R.D.M., 2003. Tangled Trees: Phylogeny, Cospeciation, and Coevolution, University of Chicago Press.
Page, R.D.M. & Charleston, M.A., 1998. Trees within trees: phylogeny and historical associations. Trends in Ecology & Evolution, 13(9), pp.356–359.
Patterson, J.T. & Stone, W.S., 1952. Evolution in the genus Drosophila, New York: The Macmillan Company.
Pélandakis, M., Higgins, D.G. & Solignac, M., 1991. Molecular phylogeny of the subgenus Sophophora of Drosophila derived from large subunit of ribosomal RNA sequences. Genetica, 84(2), pp.87–94.
Polaszek, A., 2008. Comments on the proposed conservation of the usage of the generic name of Drosophila Fallén, 1823 (Insecta, Diptera) 1 (Case 3407). Bulletin of Zoological Nomenclature, 65, p.55.
Posada, D., 2008. jModelTest: Phylogenetic model averaging. Mol Biol Evol, 25, pp.1253–1256.
Powell, J.R., 1997. Progress and prospects in evolutionary biology: the {D}rosophila model, New York: Oxford University Press.
Ratcov, V. & Vilela, C.R., 2007. A new Neotropical species of spot-thoraxed Drosophila (Diptera, Drosophilidae). Revista Brasileira de Entomologia, 51(3), pp.305–311.
Remsen, J. & O’Grady, P., 2002. Phylogeny of Drosophilinae (Diptera: Drosophilidae), with comments on combined analysis and character support. Molecular phylogenetics and evolution, (24(2)), pp.249–264.
Robe, L.J. et al., 2005. Molecular phylogeny of the subgenus< i> Drosophila</i>(Diptera, Drosophilidae) with an emphasis on Neotropical species and groups: A nuclear versus mitochondrial gene approach. Molecular phylogenetics and evolution, 36(3), pp.623–640.
Robe, L.J., Loreto, E.L.S. & Valente, V.L.S., 2010. Radiation of the ,,Drosophila“ subgenus (Drosophilidae, Diptera) in the Neotropics. Journal of Zoological Systematics and Evolutionary Research, 48(4), pp.310–321.
Robe, L.J., Silva, L.B. da & Loreto, E.L. da S., 2002. Phylogenetic relationships among four species of the guarani group of Drosophila (Diptera, Drosophilidae) as inferred by molecular and morphological analyses . Revista Brasileira de Entomologia , 46 , pp.515–519.
VII. REFERENCES
205
Robertson, H.M., 1993. The mariner transposable element is widespread in insects. Nature, 362(6417), pp.241–245.
Robertson, H.M. & Lampe, D.J., 1995. Distribution of Transposable Elements in Arthropods. Annual Review of Entomology, 40(1), pp.333–357.
Roisin, Y., 2008. Comments on the proposed conservation of the usage of the generic name of Drosophila Fallén, 1823 (Insecta, Diptera) 1 (Case 3407). Bulletin of Zoological Nomenclature, 65, p.215.
Le Rouzic, A., Boutin, T.S. & Capy, P., 2007. Long-term evolution of transposable elements. Proceedings of the National Academy of Sciences , 104 (49 ), pp.19375–19380.
Le Rouzic, A. & Capy, P., 2006. Population genetics models of competition between transposable element subfamilies. Genetics, 174(2), pp.785–793.
Le Rouzic, A. & Capy, P., 2005. The First Steps of Transposable Elements Invasion Parasitic Strategy vs. Genetic Drift. Genetics, 169(2), pp.1033–1043.
Le Rouzic, A. & Deceliere, G., 2005. Models of the population genetics of transposable elements. Genetics Research, 85(03), pp.171–181.
Le Rouzic, A., Dupas, S. & Capy, P., 2007. Genome ecosystem and transposable elements species. Gene, 390(1-2), pp.214–20.
Ruiz, A. et al., 1997. Chromosomal evolution and comparative gene mapping in the Drosophila repleta species group. Revista brasileira de genética, 20(4), pp.553–565.
Russo, C. a. M. et al., 2013. Phylogenetic analysis and a time tree for a large drosophilid data set (Diptera: Drosophilidae). Zoological Journal of the Linnean Society, 169(4), pp.765–775.
Russo, C.A.M., Takezaki, N. & Nei, M., 1995. Molecular Phylogeny and Divergence Times of Drosophilid Species. Molecular biology and evolution, 12(3).
Sacristán, S. et al., 2009. Coevolution between a family of parasite virulence effectors and a class of LINE-1 retrotransposons. PLoS One, 4(10), p.e7463.
Satta, Y., Ishiwa, H. & Chigusa, S.I., 1987. Analysis of nucleotide substitutions of mitochondrial DNAs in Drosophila melanogaster and its sibling species. Molecular biology and evolution, 4(6), pp.638–650.
Schlötterer, C., Vieira, J. & Fonseca, N.A., 2013. The Drosophila americana genome Blast tool. Available at: http://cracs.fc.up.pt/~nf/dame/dame_blast.html.
Sharp, P.M. & Simmonds, P., 2011. Evaluating the evidence for virus/host co-evolution. Current opinion in virology, 1(5), pp.436–441.
Spassky, B. et al., 1971. Geography of the sibling species related to Drosophila willistoni, and of the semispecies of the Drosophila paulistorum complex. Evolution, pp.129–143.

VII. REFERENCES
206
Spicer, G.S. & Bell, C.D., 2002. Molecular Phylogeny of the Drosophila virilis Species Group (Diptera: Drosophilidae) Inferred from Mitochondrial 12S and 16S Ribosomal RNA Genes. Annals of the Entomological Society of America, 95(2), pp.156–161.
St Pierre, S.E. et al., 2014. FlyBase 102--advanced approaches to interrogating FlyBase. Nucleic Acids Research, 42(1), pp.780–788.
Sturtevant, A.H., 1915. A Sex-Linked Character in Drosophila repleta. The American Naturalist, 49(579), pp.189–192.
Sturtevant, A.H., 1942. The classification of the genus Drosophila, with description of nine new species. In University of Texas Publications, pp. 5–51.
Switzer, W.M. et al., 2005. Ancient co-speciation of simian foamy viruses and primates. Nature, 434(7031), pp.376–380.
Tamura, K. et al., 2007. MEGA4: Molecular Evolutionary Genetics Analysis (MEGA) Software Version 4.0. Molecular Biology and Evolution , 24 (8 ), pp.1596–1599.
Tamura, K., 1992. The rate and pattern of nucleotide substitution in Drosophila mitochondrial DNA. Molecular Biology and Evolution, 9(5), pp.814–825.
Thompson, J.N., 1982. Interaction and Coevolution, University of Chicago Press.
Throckmorton, L.H., 1982. Pathways of evolution in the genus Drosophila and the founding of the repleta group. In Ecological Genetics and Evolution. Australia: Academic Press, pp. 33–47.
Throckmorton, L.H., 1975. The phylogeny, ecology and geography of Drosophila . In R. C. King, ed. Handbook of Genetics. New York: Plenum, pp. 421–469.
Throckmorton, L.H., 1962. The problem of phylogeny in the genus Drosophila. University of Texas Publications, (6205), pp.207–344.
Turelli, P. et al., 1997. dUTPase-minus caprine arthritis-encephalitis virus is attenuated for pathogenesis and accumulates G-to-A substitutions. Journal of Virology , 71 (6 ), pp.4522–4530.
Venner, S., Feschotte, C. & Biémont, C., 2009. Dynamics of transposable elements: towards a community ecology of the genome. Trends in genetics : TIG, 25(7), pp.317–23.
Vieira, C. et al., 1999. Wake up of transposable elements following Drosophila simulans worldwide colonization. Molecular biology and evolution, 16(9), pp.1251–1255.
Vilela, C.R., 1983. A revision of the Drosophila repleta species group (Diptera, Drosophilidae). Revista Brasileira de Entomologia, 27, pp.1–114.
Vilela, C.R., 1992. On the Drosophila tripunctata species group (Diptera, Drosophilidae). Revista Brasileira de Entomologia, 36, pp.197–221.
Vilela, C.R. & Bächli, G., 1990. Taxonomic studies on neotropical species of seven genera of Drosophilidae (Diptera), Zurich: Mitteilungen der Schweizerischen Entomologischen Gesellschaft.

VII. REFERENCES
207
Wasserman, M., 1982. The repleta species group. In M. Ashburner, J. N. Thompson, & H. L. Carson, eds. The Genetics and Biology of Drosophila. New York: Academic Press, pp. 61–140.
Wharton, L.H., 1942. Analysis of the repleta group of Drosophila. University of Texas Publications, 4228, pp.23–52.
Wicker, T. et al., 2007. A unified classification system for eukaryotic transposable elements. Nat Rev Genet, 8(12), pp.973–982.
Woolhouse, M.E.J. et al., 2002. Biological and biomedical implications of the co-evolution of pathogens and their hosts. Nat Genet, 32(4), pp.569–577.
Yassin, A., 2008. Comments on the proposed conservation of the usage of the generic name of Drosophila Fallén, 1823 (Insecta, Diptera) 2 (Case 3407). Bulletin of Zoological Nomenclature, 65(1).
Yassin, A., 2013. Phylogenetic classification of the Drosophilidae Rondani (Diptera): the role of morphology in the postgenomic era. Systematic Entomology, 38(2), pp.349–369.
Yuan, Y.-W. & Wessler, S.R., 2011. The catalytic domain of all eukaryotic cut-and-paste transposase superfamilies. Proceedings of the National Academy of Sciences, 108(19), pp.7884–7889.
Zsiros, J. et al., 1999. Biased nucleotide composition of the genome of HERV-K related endogenous retroviruses and its evolutionary implications. Journal of molecular evolution, 48(1), pp.102–111.