Cocoa Statistics Report 2017 DRAFT 1 · 2.4 Market uptake The uptake of UTZ cocoa by market...
19
UTZ Cocoa Statistics Report 2017
Transcript of Cocoa Statistics Report 2017 DRAFT 1 · 2.4 Market uptake The uptake of UTZ cocoa by market...
UTZ Cocoa Statistics Report
2017
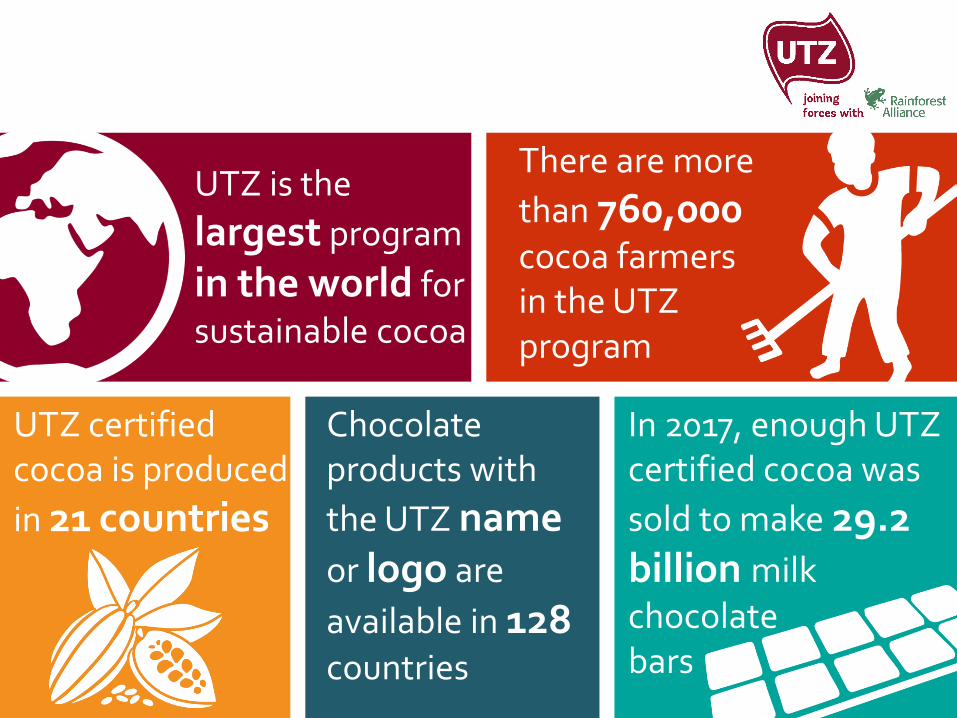
UTZ is the
largest program
in the world for sustainable cocoa
There are more
than 760,000cocoa farmers in the UTZ program
UTZ certified cocoa is produced
in 21 countries
In 2017, enough UTZ certified cocoa was
sold to make 29.2 billion milk chocolate bars
Chocolate products with
the UTZ nameor logo are
available in 128countries
Introduction
The main goal of this report is to present the scope and scale of the UTZ cocoa program in 2017. The statistics report is written in order to inform our stakeholders and is part of our commitment to transparency.
The statistics report focuses on the key indicators related to:
• Market uptake: sales of UTZ certified cocoa
• Program reach: UTZ certified cocoa production, premiums being paid
and multi-certification of this production
This report is part of the UTZ monitoring and evaluation system. Most of the data in this report is collected via our online traceability system, the Good Inside Portal.
We recognize that there may be shortcomings with the reliability of the data. We look forward to receiving your feedback. For more information, please contact the Monitoring & Evaluation Department at [email protected]
©2018 UTZInformation presented here is for informative purposes only. UTZ grants permission to use information for personal, non-commercial use, without any right to resell or redistribute information or to compile or create derivative works therefrom.
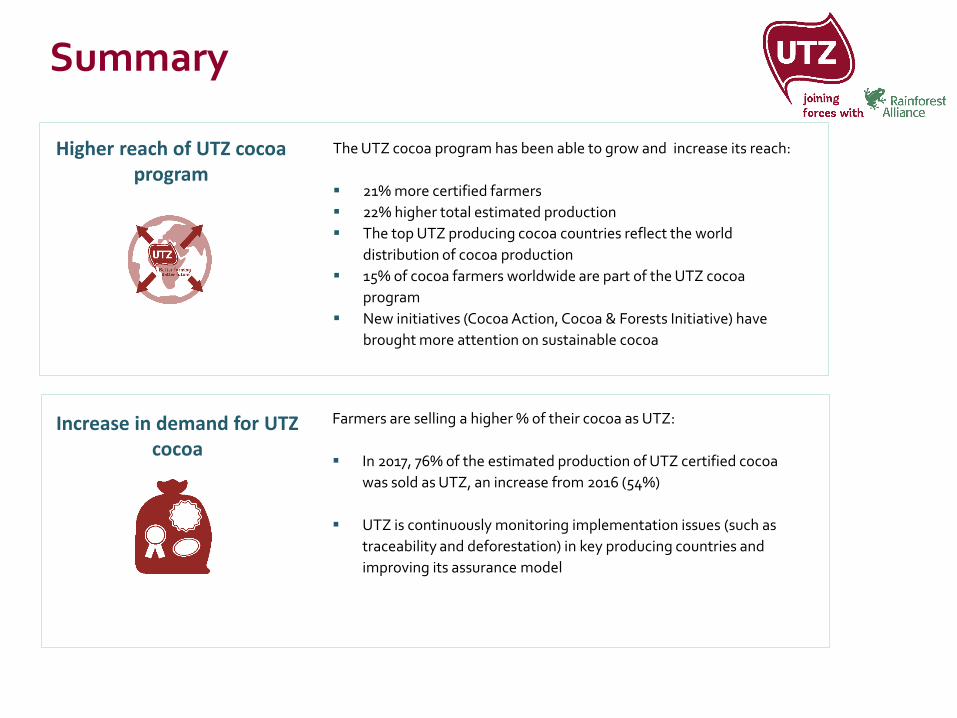
Summary
Higher reach of UTZ cocoa program
The UTZ cocoa program has been able to grow and increase its reach:
21% more certified farmers
22% higher total estimated production
The top UTZ producing cocoa countries reflect the world
distribution of cocoa production
15% of cocoa farmers worldwide are part of the UTZ cocoa
program
New initiatives (Cocoa Action, Cocoa & Forests Initiative) have
brought more attention on sustainable cocoa
Increase in demand for UTZ cocoa
Farmers are selling a higher % of their cocoa as UTZ:
In 2017, 76% of the estimated production of UTZ certified cocoa
was sold as UTZ, an increase from 2016 (54%)
UTZ is continuously monitoring implementation issues (such as
traceability and deforestation) in key producing countries and
improving its assurance model
Content
1. Reach
2. Global sales
3. Premium
4. Estimated production
5. Supply-demand trend
6. Multi-certification
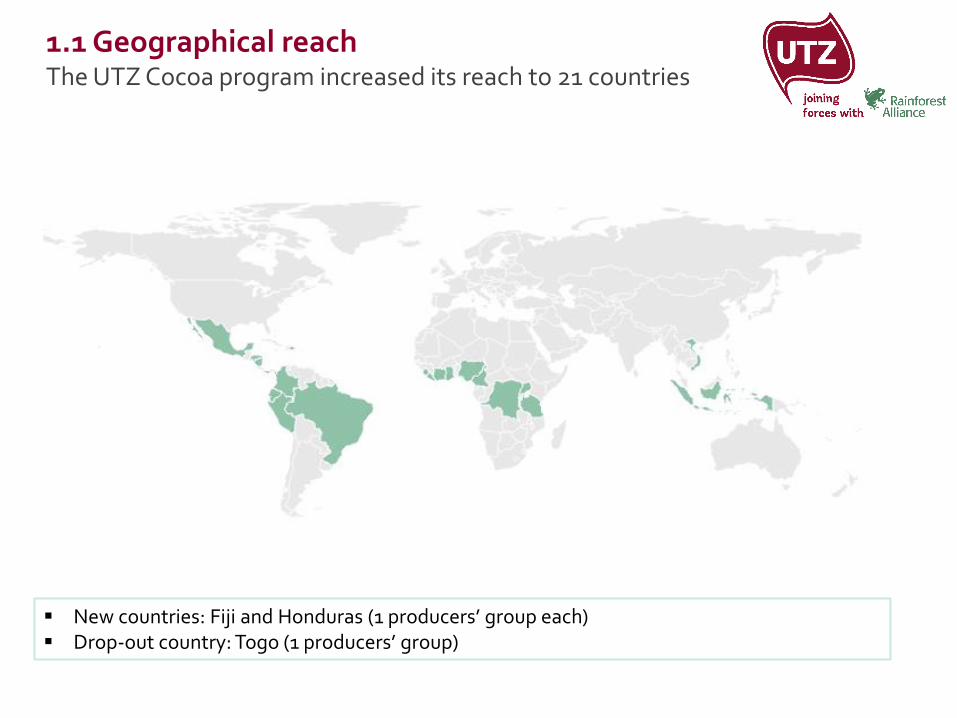
1.1 Geographical reachThe UTZ Cocoa program increased its reach to 21 countries
New countries: Fiji and Honduras (1 producers’ group each) Drop-out country: Togo (1 producers’ group)

1.2 Program reachThe UTZ Cocoa program reached more than 700,000 farmers
Estimated 15% of the cocoa farmers worldwide are UTZ* Largest absolute increase is seen in Côte d’Ivoire Largest relative growth is seen in Cameroon
The certified area increased by 29% and the number of workers increased by 8%
Relative growth ‘16 – ‘17 21% 29% 8%
Number of workers in 2016 has been reviewed due to higher data quality and is lower than reported in 2016* Based on World Cocoa Foundation 2016 estimate: http://www.worldcocoafoundation.org/about-cocoa/cocoa-value-chain/
2,706,596
2013 2014 2015 2016 2017
Certified area (ha)744,778
2013 2014 2015 2016 2017
# of farmers
21,781
2013 2014 2015 2016 2017
# of workers (permanent and seasonal)
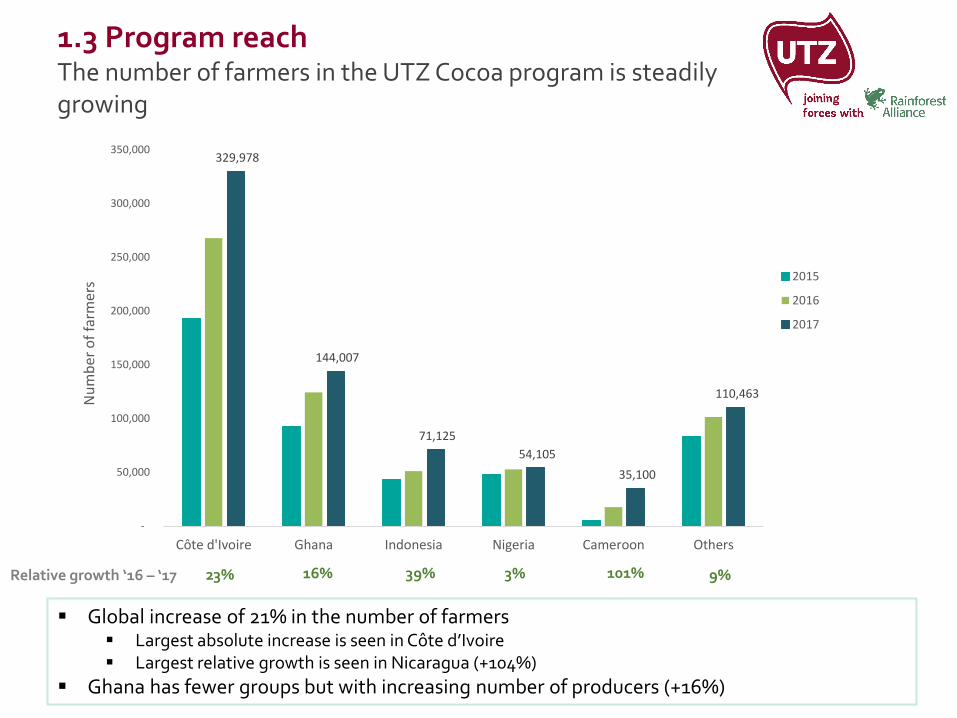
1.3 Program reachThe number of farmers in the UTZ Cocoa program is steadilygrowing
329,978
144,007
71,125
54,105
35,100
110,463
-
50,000
100,000
150,000
200,000
250,000
300,000
350,000
Côte d'Ivoire Ghana Indonesia Nigeria Cameroon Others
Nu
mb
er o
f fa
rme
rs
2015
2016
2017
Global increase of 21% in the number of farmers Largest absolute increase is seen in Côte d’Ivoire Largest relative growth is seen in Nicaragua (+104%)
Ghana has fewer groups but with increasing number of producers (+16%)
Relative growth ‘16 – ‘17 23% 16% 39% 3% 101% 9%
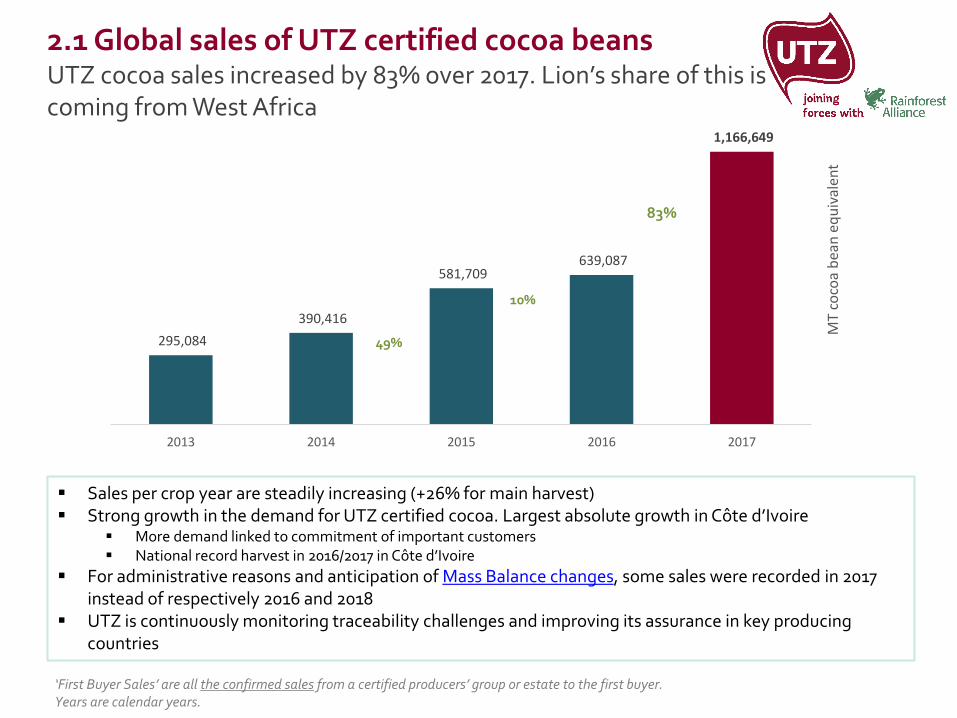
2.1 Global sales of UTZ certified cocoa beansUTZ cocoa sales increased by 83% over 2017. Lion’s share of this is coming from West Africa
‘First Buyer Sales’ are all the confirmed sales from a certified producers’ group or estate to the first buyer. Years are calendar years.
Sales per crop year are steadily increasing (+26% for main harvest) Strong growth in the demand for UTZ certified cocoa. Largest absolute growth in Côte d’Ivoire
More demand linked to commitment of important customers National record harvest in 2016/2017 in Côte d’Ivoire
For administrative reasons and anticipation of Mass Balance changes, some sales were recorded in 2017 instead of respectively 2016 and 2018
UTZ is continuously monitoring traceability challenges and improving its assurance in key producingcountries
295,084
390,416
581,709 639,087
1,166,649
2013 2014 2015 2016 2017
MT
coco
a b
ean
eq
uiv
alen
t
83%
10%
49%
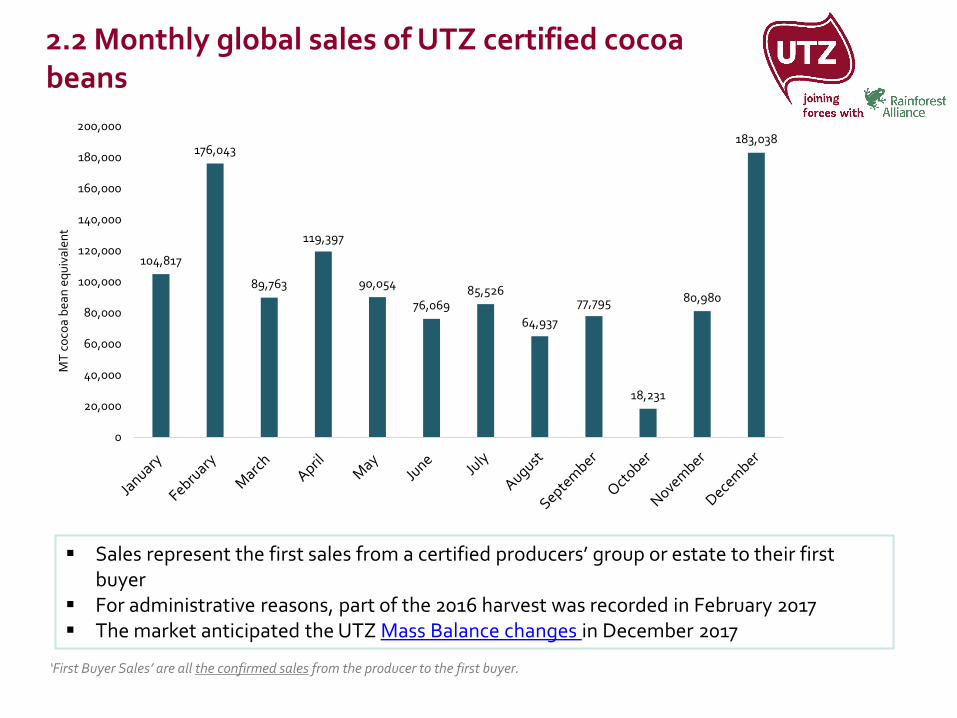
2.2 Monthly global sales of UTZ certified cocoa beans
Sales represent the first sales from a certified producers’ group or estate to their first buyer
For administrative reasons, part of the 2016 harvest was recorded in February 2017 The market anticipated the UTZ Mass Balance changes in December 2017
‘First Buyer Sales’ are all the confirmed sales from the producer to the first buyer.
104,817
176,043
89,763
119,397
90,054
76,06985,526
64,937
77,795
18,231
80,980
183,038
0
20,000
40,000
60,000
80,000
100,000
120,000
140,000
160,000
180,000
200,000
MT
co
coa
bea
n e
qu
ival
ent
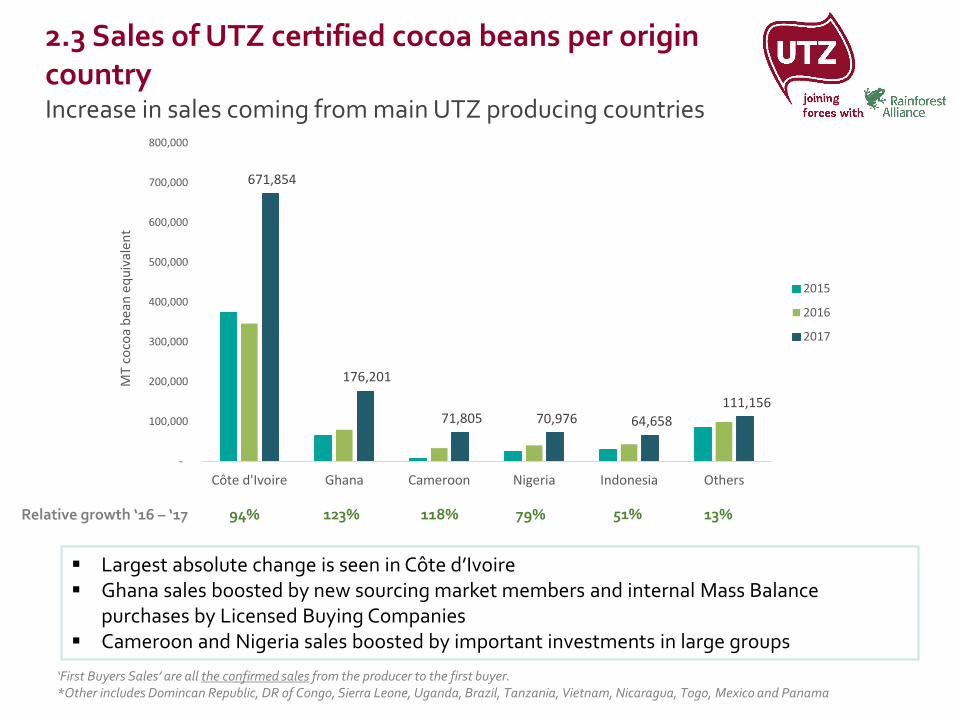
2.3 Sales of UTZ certified cocoa beans per origincountry Increase in sales coming from main UTZ producing countries
‘First Buyers Sales’ are all the confirmed sales from the producer to the first buyer.*Other includes Domincan Republic, DR of Congo, Sierra Leone, Uganda, Brazil, Tanzania, Vietnam, Nicaragua, Togo, Mexico and Panama
Largest absolute change is seen in Côte d’Ivoire Ghana sales boosted by new sourcing market members and internal Mass Balance
purchases by Licensed Buying Companies Cameroon and Nigeria sales boosted by important investments in large groups
Relative growth ‘16 – ‘17
671,854
176,201
71,805 70,976 64,658
111,156
-
100,000
200,000
300,000
400,000
500,000
600,000
700,000
800,000
Côte d'Ivoire Ghana Cameroon Nigeria Indonesia Others
MT
coco
a b
ean
eq
uiv
alen
t
2015
2016
2017
94% 123% 118% 79% 51% 13%
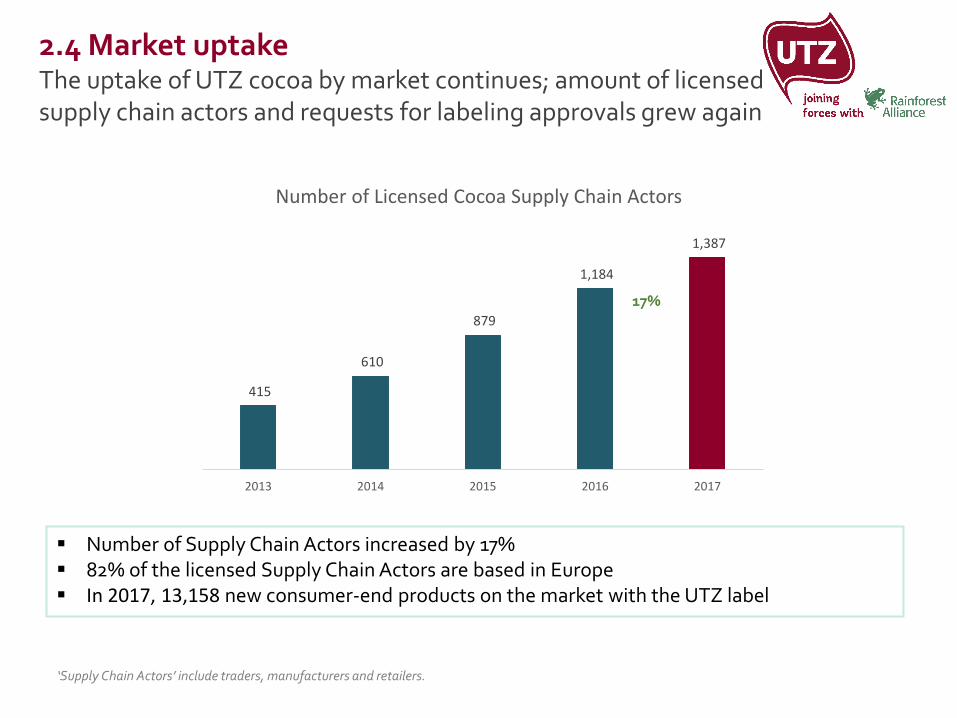
2.4 Market uptake The uptake of UTZ cocoa by market continues; amount of licensedsupply chain actors and requests for labeling approvals grew again
Number of Supply Chain Actors increased by 17% 82% of the licensed Supply Chain Actors are based in Europe In 2017, 13,158 new consumer-end products on the market with the UTZ label
415
610
879
1,184
1,387
2013 2014 2015 2016 2017
Number of Licensed Cocoa Supply Chain Actors
‘Supply Chain Actors’ include traders, manufacturers and retailers.
17%
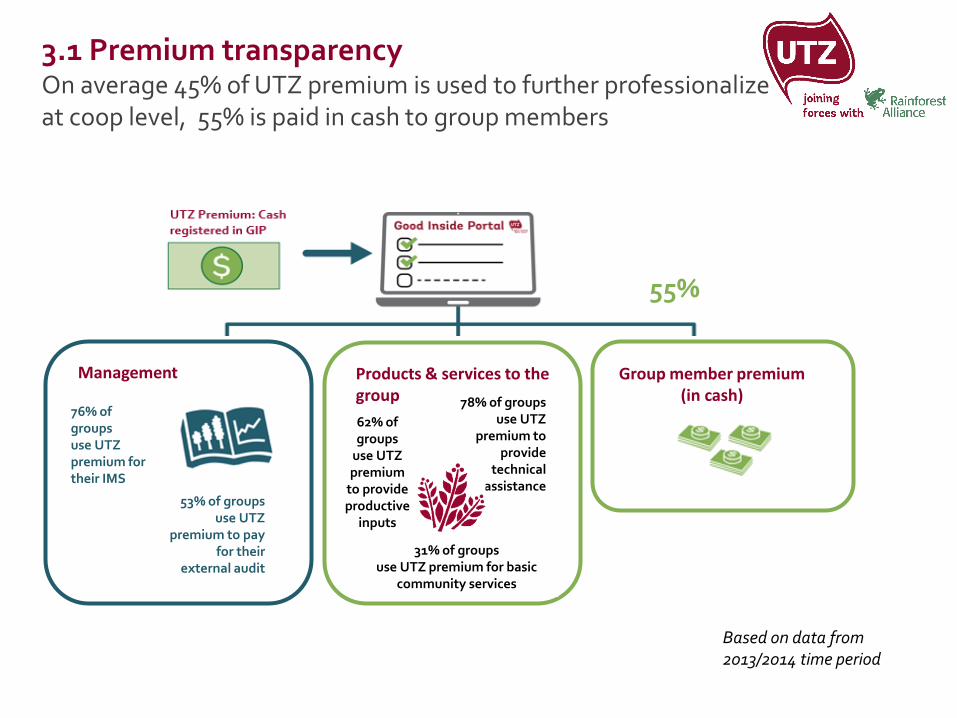
Group member premium (in cash)
Management
76% of groups use UTZ premium for their IMS
53% of groups use UTZ
premium to pay for their
external audit
Products & services to the group 78% of groups
use UTZ premium to
provide technical
assistance
62% of groups
use UTZ premium
to provide productive
inputs
31% of groups use UTZ premium for basic
community services
55%
Based on data from 2013/2014 time period
3.1 Premium transparencyOn average 45% of UTZ premium is used to further professionalize at coop level, 55% is paid in cash to group members
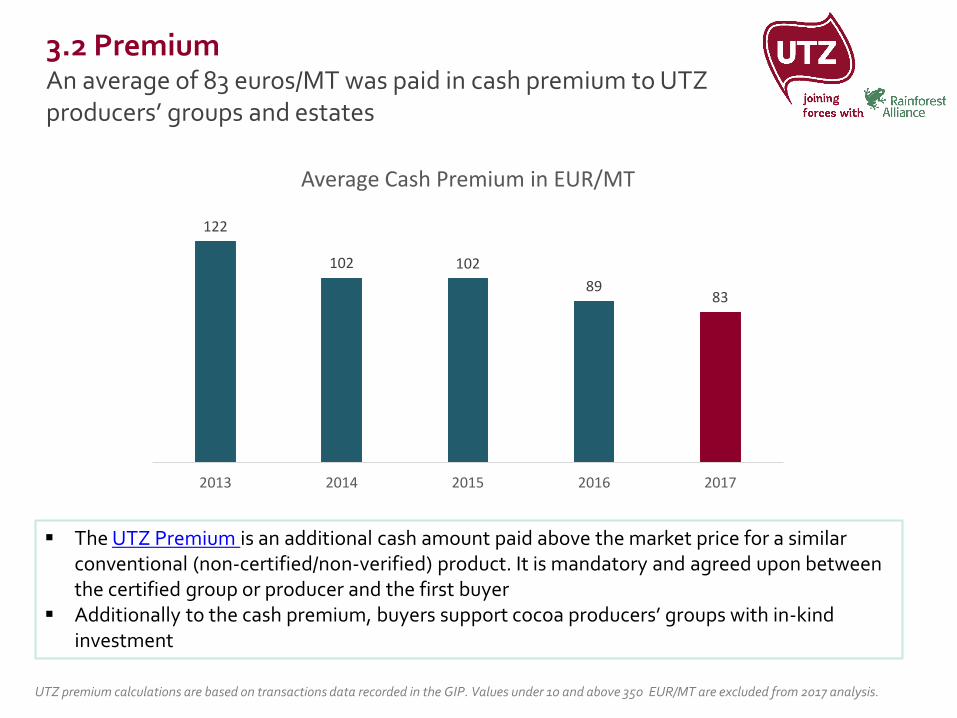
3.2 Premium An average of 83 euros/MT was paid in cash premium to UTZ producers’ groups and estates
UTZ premium calculations are based on transactions data recorded in the GIP. Values under 10 and above 350 EUR/MT are excluded from 2017 analysis.
The UTZ Premium is an additional cash amount paid above the market price for a similar conventional (non-certified/non-verified) product. It is mandatory and agreed upon between the certified group or producer and the first buyer
Additionally to the cash premium, buyers support cocoa producers’ groups with in-kind investment
122
102 102
8983
2013 2014 2015 2016 2017
Average Cash Premium in EUR/MT
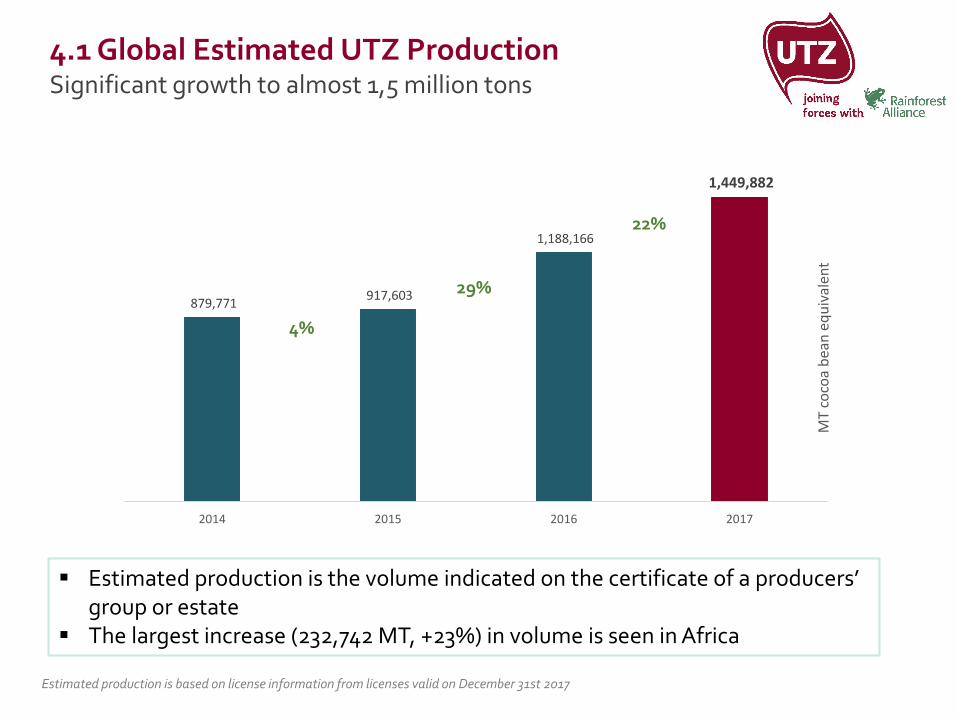
4.1 Global Estimated UTZ ProductionSignificant growth to almost 1,5 million tons
Estimated production is based on license information from licenses valid on December 31st 2017
Estimated production is the volume indicated on the certificate of a producers’ group or estate
The largest increase (232,742 MT, +23%) in volume is seen in Africa
879,771 917,603
1,188,166
1,449,882
2014 2015 2016 2017
MT
coco
a b
ean
eq
uiv
alen
t
4%
29%
22%
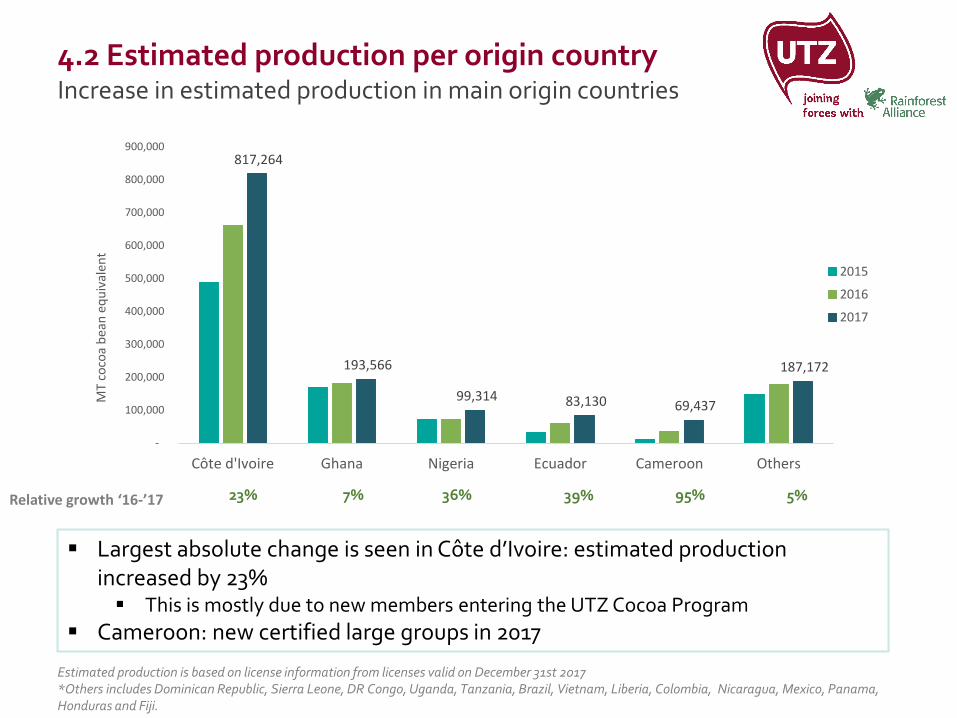
4.2 Estimated production per origin countryIncrease in estimated production in main origin countries
Estimated production is based on license information from licenses valid on December 31st 2017*Others includes Dominican Republic, Sierra Leone, DR Congo, Uganda, Tanzania, Brazil, Vietnam, Liberia, Colombia, Nicaragua, Mexico, Panama, Honduras and Fiji.
Largest absolute change is seen in Côte d’Ivoire: estimated productionincreased by 23% This is mostly due to new members entering the UTZ Cocoa Program
Cameroon: new certified large groups in 2017
817,264
193,566
99,314 83,130 69,437
187,172
-
100,000
200,000
300,000
400,000
500,000
600,000
700,000
800,000
900,000
Côte d'Ivoire Ghana Nigeria Ecuador Cameroon Others
MT
coco
a b
ean
eq
uiv
alen
t
2015
2016
2017
Relative growth ‘16-’17 23% 7% 36% 39% 95% 5%
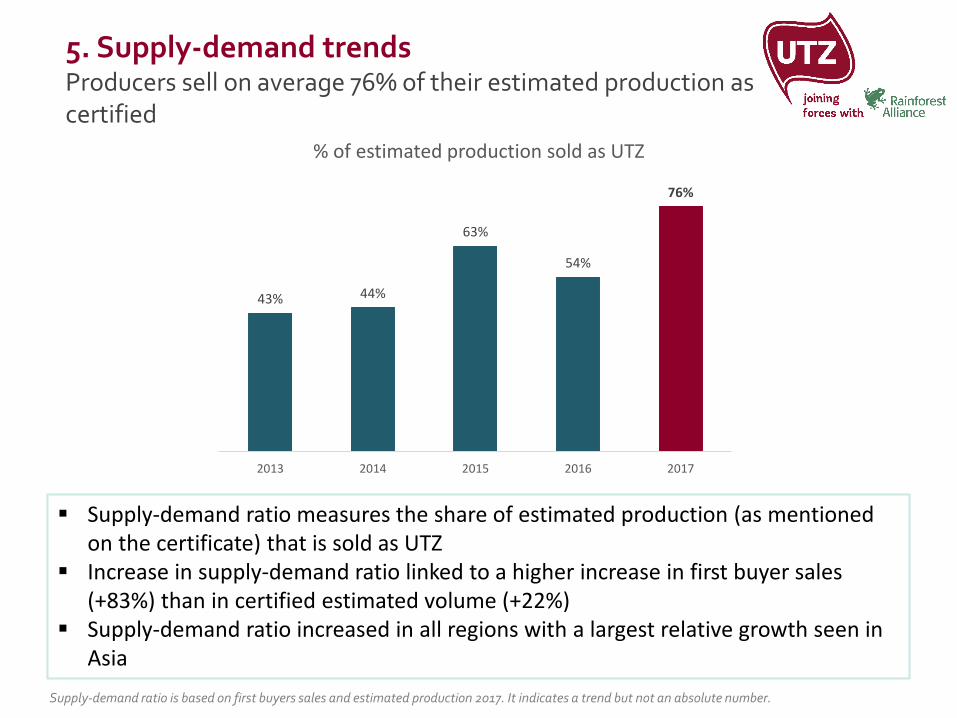
5. Supply-demand trendsProducers sell on average 76% of their estimated production as certified
Supply-demand ratio is based on first buyers sales and estimated production 2017. It indicates a trend but not an absolute number.
Supply-demand ratio measures the share of estimated production (as mentionedon the certificate) that is sold as UTZ
Increase in supply-demand ratio linked to a higher increase in first buyer sales (+83%) than in certified estimated volume (+22%)
Supply-demand ratio increased in all regions with a largest relative growth seen in Asia
43% 44%
63%
54%
76%
2013 2014 2015 2016 2017
% of estimated production sold as UTZ
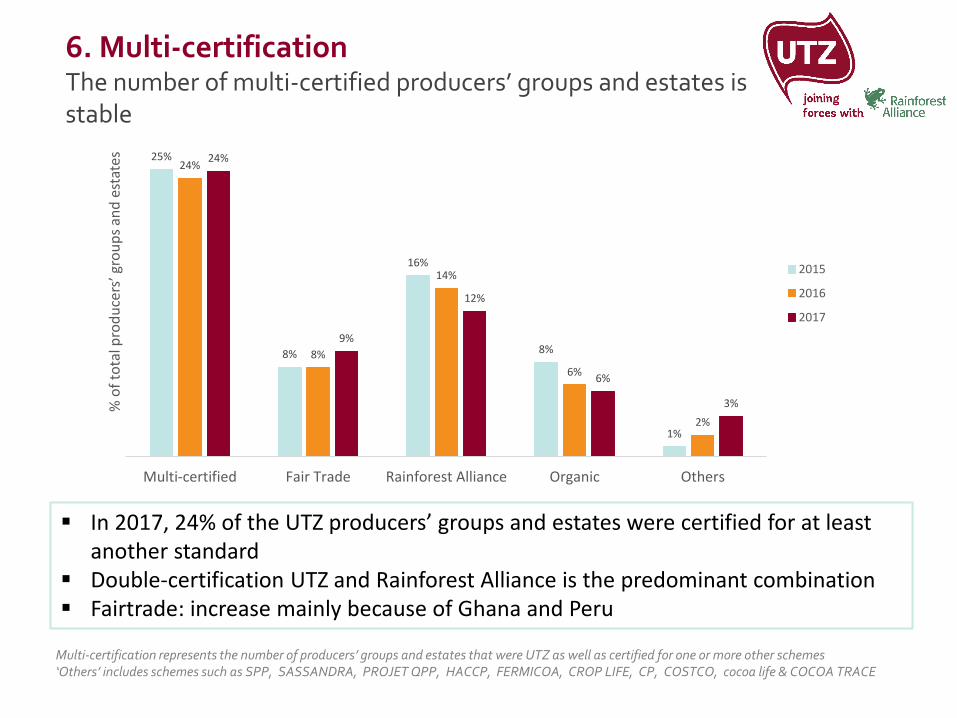
6. Multi-certificationThe number of multi-certified producers’ groups and estates is stable
Multi-certification represents the number of producers’ groups and estates that were UTZ as well as certified for one or more other schemes ‘Others’ includes schemes such as SPP, SASSANDRA, PROJET QPP, HACCP, FERMICOA, CROP LIFE, CP, COSTCO, cocoa life & COCOA TRACE
In 2017, 24% of the UTZ producers’ groups and estates were certified for at leastanother standard
Double-certification UTZ and Rainforest Alliance is the predominant combination Fairtrade: increase mainly because of Ghana and Peru
25%
8%
16%
8%
1%
24%
8%
14%
6%
2%
24%
9%
12%
6%
3%
Multi-certified Fair Trade Rainforest Alliance Organic Others
% o
f to
tal p
rod
uce
rs’ g
rou
ps
and
est
ates
2015
2016
2017