Coarsening of nanoporous gold
31
Atomic-scale Analysis of the Mechanical Behavior of Gold Nanofoams K. Kolluri 1 and M. J. Demkowicz Materials Science and Engineering, MIT, Cambridge, MA 1 Present address, MST-8, Los Alamos National Lab, NM Acknowledgments: Amit Misra, Antonia Antoniou, A. S. Argon, W. C. Carter, L. J. Gibson, K. J. Van Vliet, M. Kabir, R. E. Baumer Acknowledgments: User Project at Center for Integrated Nanotechnologies (CINT) at Los Alamos National Lab (LANL)
-
Upload
kedarnath-kolluri -
Category
Technology
-
view
283 -
download
3
description
Coarsening of nanoporous gold by dislocations and ligament collapse
Transcript of Coarsening of nanoporous gold

Atomic-scale Analysis of the Mechanical Behavior of Gold Nanofoams
K. Kolluri1 and M. J. Demkowicz
Materials Science and Engineering, MIT, Cambridge, MA
1Present address, MST-8, Los Alamos National Lab, NM
Acknowledgments: Amit Misra, Antonia Antoniou, A. S. Argon, W. C. Carter, L. J. Gibson, K. J. Van Vliet, M. Kabir, R. E. Baumer
Acknowledgments: User Project at Center for Integrated Nanotechnologies (CINT) at Los Alamos National Lab (LANL)

Nanoporous gold
Single crystal nanoporous gold with voids H. Rosner et al., Adv. Mat., 9, 535, (2007)
per area of the as-received foils their average thickness wasestimated to be 120 nm. Energy-dispersive x-ray (EDX) fluo-rescence data indicates a composition of Ag80Au20. TEM sam-ples were prepared from 1 cm2 sample pieces which wereelectrochemically dealloyed in perchloric acid (1 L) at ambi-ent temperature and at a controlled potential of 600 mV ver-sus a Ag/AgCl/HClO4 reference electrode. The dealloyingpotential was applied until the current fell to below 1 lA/cm2. As described in Ref.,[8] the comparatively low dealloyingpotential results in a very slow dissolution – here, the processtook about 90 min. – and in a comparatively large structuresize. Investigations of structure size by electron microscopyor of specific surface area by capacitance measurements typi-cally show that significant coarsening occurs during synthe-sis. Thus, the structure observed here is most likely the prod-uct of two processes, corrosion and coarsening.
HAADF-STEM tomography has been carried out in a FEITecnai F20ST field-emission gun (FEG)-TEM operated at200 kV, fitted with a Fischione HAADF detector (modelFP-5360/20). Single-axis tilt series were acquired automati-cally using the Xplore3D 2.0 Tomography suite operated inthe HAADF-STEM mode with a nominal spot size of 1 nm. Acamera length of 70 mm (corresponding to a minimum scat-tering angle of 50 mrad) was used for the signal collection inorder to minimise diffraction effects. Images were scannedwith 1024 ! 1024 pixels using a frame time of 12.5 s. 73 elec-tron micrographs have been collected over a tilt range of± 66° in 1.8° steps. Re-centering and refocusing were doneautomatically. The alignment of the individual stacks and thereconstruction of the acquired tilt series was done off-lineusing FEI’s software package Inspect 3D Version 2.1. The tiltseries alignment was made by iterative cross-correlations tosub-pixel accuracy. The aligned tilt series was reconstructed
using the iterative back-projection process SIRT[23] which isimplemented in the Inspect 3D Code. 25 iterations were per-formed for the SIRT reconstruction. Each three-dimensionalpixel (‘voxel’) of the reconstruction represents a cube with anedge-length of 0.73 nm. The software package Amira 3.1 hasbeen used for the visualization of the reconstructed struc-tures.
For stereological analysis, the reconstruction was binarizedand then cropped in all spatial directions (to 340 nm !300 nm ! 70 nm) in order to remove the macroscopic samplesurfaces, to avoid artefacts at the borders of the reconstruc-tion, and to ensure that the volume used for analysis is repre-sentative of the bulk sample structure. The analysis was per-formed using the program MAVI.[21] MAVI affords acharacterization of 3-D structures by analysis of their repre-sentations as binary and spatially discrete images, using thealgorithms described in reference [22].
Results of Electron Microscopy
Conventional TEM micrographs, such as the bright-fieldmicrographs of Figure 1, are 2-D projections which revealinformation about the average density along the beam direc-tion. Here, the micrographs illustrate the typical microstruc-ture of nanoporous gold, which is composed of nanometersize ligaments and pores. Energy dispersive analysis of X-rayfluorescence of the sample volume shown in Figure 1(a) indi-cates that the average composition is Au96Ag4. Details of indi-vidual gold ligaments are shown in Figure 1(b).
A selected area electron diffraction (SAED) pattern (theaperture corresponds to a circular area of about 800 nm indiameter) from the same volume as shown in Figure 1(a) (seeinset) reveals a preferred <100> out-of-plane orientation, con-
Rösner et al./Reconstructing a Nanoporous Metal in Three Dimensions: An Electron Tomography Study
CO
MM
UN
ICATI
ON
S
536 http://www.aem-journal.com © 2007 WILEY-VCH Verlag GmbH & Co. KGaA, Weinheim ADVANCED ENGINEERING MATERIALS 2007, 9, No. 7
(a) (b)Fig. 1. a) Bright-Field micrograph showing a fully connected network structure composed of single-crystalline gold ligamentsand pores. Darker regions are related to a higher density of gold ligaments due to the overlap in the 2-D projection. The corre-sponding diffraction pattern (SAED) in the inset indicates a preferred <100> out-of-plane orientation with considerablemosaic spread. b) Bright-Field micrograph: detail revealing individual gold ligaments. Examples of encased voids are markedby arrow heads.
Single crystal nanoporous goldJ. Erlebacher et al., Nature, 410, 450, (2001)
The porous samples were then placed in an Instron4400R universal testing machine (Instron Corporation,Canton, MA) and compressed in air at room temperature.The compaction process was as follows: the nanoporoussample is placed on the bottom plate of the Instron ma-chine without any constraints. Since it is known thatfoams, in general, have a very high energy absorptionand can undergo large compressive strains, we proceededwith a series of steps to ensure complete compaction.14
First, a small load of approximately 600 N was applied;this load was calculated based on the strength of thematerial and using Ashby/Gibson scaling laws;14 the testwas then stopped and the sample thickness was meas-ured. This process was repeated with increasing loadsuntil the sample approached the calculated thickness of afully compressed sample. Currently, more studies are un-derway to further improve the compression and to con-trol the compaction by using the applied pressure ratherthan changes in sample dimension. Compressed sam-ples were then tested by XRD to identify the grainsize and finally indented using both a Triboindenter (Hy-sitron, Inc., Minneapolis, MN) with a Berkovich tip anda standard Vickers microindenter to check hardnessvalues.
The development of a nanocrystalline grain structurewas observed during dealloying and maintained duringthe compaction process described above. Two effectscontribute to the development of a nanocrystalline grainstructure in the compacted sample. First, compression ofa nanostructured (i.e., nano-ligaments) material is analo-gous to methods which produce nanocrystalline mono-lithic structures by compacting nanocrystalline pow-ders.15,16 Since our ligaments are on the nanometer scale,as the material is compacted at room temperature, it isexpected that the nano-ligaments would be compacted tobecome nanocrystalline grains. Second, the foam liga-ments themselves are nanocrystalline. This is illustratedby Fig. 1, which shows the typical ligament structure by(a) scanning electron microscope (SEM) images of theoriginal nanoporous structure and (b) a TEM micrographfrom a typical ligament from sample A. Indeed, multiplegrain boundaries are observed per ligament. Further-more, the acquired selective area diffraction (SAD)pattern shown in the inset of Fig. 1(b) is typical for apolycrystalline material, thus further proving that the in-dividual ligaments are nanocrystalline. XRD data ob-tained from the porous samples showed grain size valuesof approximately 30 nm.
FIG. 1. SEM micrograph obtained from (a) synthesized Au porous samples and (b) dark-field and bright-field TEM micrographs of sample Ashowing four distinct grains <50 nm. The corresponding selected area diffraction pattern is shown in the inset.
Rapid Communications
J. Mater. Res., Vol. 20, No. 3, Mar 2005 555
Polycrstalline crystal nanoporous gold A. M. Hodge et al., J. Mater. Res., 20, 3, (2005)
• Dealloyed nanofoams come in a wide variety
• They are all open cell with ligaments and pores

Nanoporous gold: promising but controllable?
as prepared Annealed for 2h at 400C Annealed for 6h at 400C
• High surface area per unit volume promising for applications
• However, high surface area driving force for coarsening
A. M. Hodge et al., Acta Mater., 55, 1343, (2007)

Nanoporous gold
Single crystal nanoporous gold with voids H. Rosner et al., Adv. Mat., 9, 535, (2007)
per area of the as-received foils their average thickness wasestimated to be 120 nm. Energy-dispersive x-ray (EDX) fluo-rescence data indicates a composition of Ag80Au20. TEM sam-ples were prepared from 1 cm2 sample pieces which wereelectrochemically dealloyed in perchloric acid (1 L) at ambi-ent temperature and at a controlled potential of 600 mV ver-sus a Ag/AgCl/HClO4 reference electrode. The dealloyingpotential was applied until the current fell to below 1 lA/cm2. As described in Ref.,[8] the comparatively low dealloyingpotential results in a very slow dissolution – here, the processtook about 90 min. – and in a comparatively large structuresize. Investigations of structure size by electron microscopyor of specific surface area by capacitance measurements typi-cally show that significant coarsening occurs during synthe-sis. Thus, the structure observed here is most likely the prod-uct of two processes, corrosion and coarsening.
HAADF-STEM tomography has been carried out in a FEITecnai F20ST field-emission gun (FEG)-TEM operated at200 kV, fitted with a Fischione HAADF detector (modelFP-5360/20). Single-axis tilt series were acquired automati-cally using the Xplore3D 2.0 Tomography suite operated inthe HAADF-STEM mode with a nominal spot size of 1 nm. Acamera length of 70 mm (corresponding to a minimum scat-tering angle of 50 mrad) was used for the signal collection inorder to minimise diffraction effects. Images were scannedwith 1024 ! 1024 pixels using a frame time of 12.5 s. 73 elec-tron micrographs have been collected over a tilt range of± 66° in 1.8° steps. Re-centering and refocusing were doneautomatically. The alignment of the individual stacks and thereconstruction of the acquired tilt series was done off-lineusing FEI’s software package Inspect 3D Version 2.1. The tiltseries alignment was made by iterative cross-correlations tosub-pixel accuracy. The aligned tilt series was reconstructed
using the iterative back-projection process SIRT[23] which isimplemented in the Inspect 3D Code. 25 iterations were per-formed for the SIRT reconstruction. Each three-dimensionalpixel (‘voxel’) of the reconstruction represents a cube with anedge-length of 0.73 nm. The software package Amira 3.1 hasbeen used for the visualization of the reconstructed struc-tures.
For stereological analysis, the reconstruction was binarizedand then cropped in all spatial directions (to 340 nm !300 nm ! 70 nm) in order to remove the macroscopic samplesurfaces, to avoid artefacts at the borders of the reconstruc-tion, and to ensure that the volume used for analysis is repre-sentative of the bulk sample structure. The analysis was per-formed using the program MAVI.[21] MAVI affords acharacterization of 3-D structures by analysis of their repre-sentations as binary and spatially discrete images, using thealgorithms described in reference [22].
Results of Electron Microscopy
Conventional TEM micrographs, such as the bright-fieldmicrographs of Figure 1, are 2-D projections which revealinformation about the average density along the beam direc-tion. Here, the micrographs illustrate the typical microstruc-ture of nanoporous gold, which is composed of nanometersize ligaments and pores. Energy dispersive analysis of X-rayfluorescence of the sample volume shown in Figure 1(a) indi-cates that the average composition is Au96Ag4. Details of indi-vidual gold ligaments are shown in Figure 1(b).
A selected area electron diffraction (SAED) pattern (theaperture corresponds to a circular area of about 800 nm indiameter) from the same volume as shown in Figure 1(a) (seeinset) reveals a preferred <100> out-of-plane orientation, con-
Rösner et al./Reconstructing a Nanoporous Metal in Three Dimensions: An Electron Tomography Study
CO
MM
UN
ICATI
ON
S
536 http://www.aem-journal.com © 2007 WILEY-VCH Verlag GmbH & Co. KGaA, Weinheim ADVANCED ENGINEERING MATERIALS 2007, 9, No. 7
(a) (b)Fig. 1. a) Bright-Field micrograph showing a fully connected network structure composed of single-crystalline gold ligamentsand pores. Darker regions are related to a higher density of gold ligaments due to the overlap in the 2-D projection. The corre-sponding diffraction pattern (SAED) in the inset indicates a preferred <100> out-of-plane orientation with considerablemosaic spread. b) Bright-Field micrograph: detail revealing individual gold ligaments. Examples of encased voids are markedby arrow heads.
Single crystal nanoporous goldJ. Erlebacher et al., Nature, 410, 450, (2001)
The porous samples were then placed in an Instron4400R universal testing machine (Instron Corporation,Canton, MA) and compressed in air at room temperature.The compaction process was as follows: the nanoporoussample is placed on the bottom plate of the Instron ma-chine without any constraints. Since it is known thatfoams, in general, have a very high energy absorptionand can undergo large compressive strains, we proceededwith a series of steps to ensure complete compaction.14
First, a small load of approximately 600 N was applied;this load was calculated based on the strength of thematerial and using Ashby/Gibson scaling laws;14 the testwas then stopped and the sample thickness was meas-ured. This process was repeated with increasing loadsuntil the sample approached the calculated thickness of afully compressed sample. Currently, more studies are un-derway to further improve the compression and to con-trol the compaction by using the applied pressure ratherthan changes in sample dimension. Compressed sam-ples were then tested by XRD to identify the grainsize and finally indented using both a Triboindenter (Hy-sitron, Inc., Minneapolis, MN) with a Berkovich tip anda standard Vickers microindenter to check hardnessvalues.
The development of a nanocrystalline grain structurewas observed during dealloying and maintained duringthe compaction process described above. Two effectscontribute to the development of a nanocrystalline grainstructure in the compacted sample. First, compression ofa nanostructured (i.e., nano-ligaments) material is analo-gous to methods which produce nanocrystalline mono-lithic structures by compacting nanocrystalline pow-ders.15,16 Since our ligaments are on the nanometer scale,as the material is compacted at room temperature, it isexpected that the nano-ligaments would be compacted tobecome nanocrystalline grains. Second, the foam liga-ments themselves are nanocrystalline. This is illustratedby Fig. 1, which shows the typical ligament structure by(a) scanning electron microscope (SEM) images of theoriginal nanoporous structure and (b) a TEM micrographfrom a typical ligament from sample A. Indeed, multiplegrain boundaries are observed per ligament. Further-more, the acquired selective area diffraction (SAD)pattern shown in the inset of Fig. 1(b) is typical for apolycrystalline material, thus further proving that the in-dividual ligaments are nanocrystalline. XRD data ob-tained from the porous samples showed grain size valuesof approximately 30 nm.
FIG. 1. SEM micrograph obtained from (a) synthesized Au porous samples and (b) dark-field and bright-field TEM micrographs of sample Ashowing four distinct grains <50 nm. The corresponding selected area diffraction pattern is shown in the inset.
Rapid Communications
J. Mater. Res., Vol. 20, No. 3, Mar 2005 555
Polycrstalline crystal nanoporous gold A. M. Hodge et al., J. Mater. Res., 20, 3, (2005)
• Dealloyed nanofoams come in a wide variety
• They are all open cell with ligaments and pores
• Their formation, coarsening, and deformation
mechanisms are of interest

the thickness of the ribbons and alloy compositions. The Al-Curibbons, rods, and slices were also dealloyed in a 20 wt % NaOHaqueous solution first at room temperature and then at 90 ( 5°C. After rinsing with distilled water, the samples werecontinuously treated in the 5 wt % HCl solution at 90 ( 5 °C(designated as two-step dealloying, condition II). The totaldealloying duration was 1-2 h for the melt-spun ribbons andmore than 10 h for the as-cast rods and slices. All reactionswere carried out until no obvious bubbles emerged. Afterdealloying, the samples were rinsed with distilled water anddehydrated alcohol. The as-dealloyed samples were kept in avacuum chamber to avoid oxidation. Microstructural charac-terization and analysis of the Al-Cu alloys and as-dealloyedsamples were made using X-ray diffraction (XRD, RigakuD/max-rB) with Cu KR radiation, scanning electron microscopy(SEM, LEO 1530VP) with an energy dispersive X-ray analyzer(EDX), and transmission electron microscopy (TEM, PhilipsCM 20). Nanoindentation experiments were carried out todetermine yield strength of NPC using a MTS NanoindenterXP.
Results and Discussion
Figure 1A shows the XRD patterns of the starting melt-spunAl-Cu alloy ribbons. The filled circles and squares in Figure1A stand for Al2Cu and AlCu, respectively. The melt-spun Al33 at % Cu alloy consists of a single Al2Cu phase (part a ofFigure 1A). The melt-spun Al 35, 40, and 50 at % Cu alloysare composed of two phases: Al2Cu and AlCu (parts b-d ofFigure 1A). The Al2Cu phase is dominated in the Al 35 at %Cu alloy, but a minor amount of Al2Cu is detected in the Al 50at % Cu alloy. In addition, the amount of Al2Cu is comparableto that of AlCu in the Al 40 at % Cu alloy. After dealloying(condition I), only a face-centered cubic (fcc) Cu phase can beidentified in the as-delloyed samples (Figure 1B). Moreover,
the two-step dealloying (condition II) of the Al-Cu alloys alsoresults in the formation of the single fcc Cu phase.
Figure 2 shows the porous structure of as-dealloyed samplesafter delloying in the 5 wt % HCl solution (condition I). Forthe melt-spun Al 33 at % Cu alloy, the as-dealloyed ribbonsare porous and contain nanoparticles with sizes ranging fromone to several hundred nanometers (Figure 2a). Moreover, largeparticles with a size up to one micron can be observed (one ishighlighted by an arrow in Figure 2a). Despite the monolithiccharacteristic, the NPC ribbons are brittle and soft, and theirshape cannot be well preserved. Figure 2b shows the porousstructure of NPC by dealloying of the melt-spun Al 35 at %Cu alloy. The NPC ribbons consist of nanoparticles and someligaments (100-300 nm in size, Figure 2c). Furthermore, theshape of the ribbons can be well kept, and no microcracks canbe observed in the NPC ribbons as shown in the insert of Figure2b. For the melt-spun Al 40 and 50 at % Cu alloys, the as-dealloyed ribbons exhibit an open, three-dimensional bicon-tinuous interpenetrating ligament-channel structure with lengthscales of 100-300 nm (for Al 40 at % Cu) and 300-500 nm(for Al 50 at % Cu), as shown in parts d-f of Figure 2. Figure2d shows the plane-view microstructure of the NPC ribbons bydealloying of the melt-spun Al 40 at % Cu alloy, and the section-view microstructure of the NPC ribbons is presented in Figure2e. It is clear that a uniform porous structure can be obtainedin the NPC ribbons through dealloying of the melt-spun Al 40and 50 at % Cu alloys. In addition, TEM observation furtherverifies the porous structure of the NPC ribbons and one typicalTEM bright-field image is shown in Figure 3a. The selected-area electron diffraction (SAED) pattern consists of polycrys-talline rings, corresponding to fcc Cu (111), (200), (220), and(311) reflections (Figure 3b). Moreover, the pattern from asmaller selected area (1 µm) demonstrates that the ligaments inthe NPC ribbons comprise fcc Cu nanocrystals (Figure 3c).
Figure 1. XRD patterns of melt-spun Al-Cu alloy ribbons (A) beforeand (B) after dealloying (condition I). (a-d) Al 33, 35, 40, and 50 at% Cu, respectively.
Figure 2. SEM images showing the microstructure of NPC bydealloying of (a) Al 33 at % Cu, (b and c) Al 35 at % Cu, (d and e) Al40 at % Cu, and (f) Al 50 at % Cu alloys in the 5 wt % HCl solution(condition I). Parts a, c, e, and f are the section view; insert in (b) andpart d show the plane view.
Monolithic Nanoporous Copper J. Phys. Chem. C, Vol. 113, No. 16, 2009 6695
Nanoporous metals not limited to gold
Pt
J. C. Thorp et al.,Appl. Phys. Lett., 88, 033110 (2006)
Cu
Z. Qi et al., J. Phys. Chem. C, 113, 6694 (2009)
M. Hakamada et al.,Appl. Phys. Lett., 94, 153105 (2009)
Ni

Model for formation of nanoporous metal during dealloying
Passivation at a fixed potential below Ec.—If the applied potential issufficiently small (! ! Ec), no porosity evolves, and the surfacebecomes passivated with MN atoms that serve to block dissolutionfrom bulk alloy sites. Figure 7 shows the representative time evolu-tion of the dissolution flux in this passivation regime, specifically forthe alloy C0 " 0.25, ! " 0.85 eV. Figure 8 shows the correspond-ing morphologies at representative points, and Fig. 9 shows the timeevolution of the root-mean-square "rms# roughness, $(z# $z%)2%1/2.At early times, surface evolution during passivation and during
porosity evolution are very similar. LN atoms are quickly strippedfrom the uppermost alloy layers, leaving behind MN-rich clustersthat agglomerate on the surface and coarsen until the second layer ofalloy is attacked. This behavior is reflected in the initial dissolutionflux peak in Fig. 7. Corresponding to the rise in dissolution flux is arise in the roughness of the surface. At point "B#, for instance in Fig.7-9, the rms roughness has risen to over 0.5, and by the time a fewmore layers of alloy are attacked, roughness rises up to a maximumnear 1 lattice unit.The initial rise in dissolution flux and roughness are characteris-
tics shared in both porosity and passivation. This is an importantobservation for developing an analytical model to predict the criticalpotential. The point is that one cannot use stability analysis thatbegins with a surface that is flat. All alloy surfaces should be ini-tially unstable to porosity evolution until a certain amount of mate-rial has been dissolved. The differences between porosity evolutionand passivation is that during passivation, capillary action eventu-ally wins and the surface smoothens up again "as reflected in the rmsroughness#. However, the crossover time at which such victory oc-curs is itself nonzero, and likely a function of alloy composition andapplied potential.Once capillarity wins, there is significant smoothening of the
surface morphology, and the dissolution flux drops off. Eventually"see Fig. 8d#, the surface is nearly as completely smooth as it wasinitially, only it is densely covered with MN atoms.
Figure 5. Porous morphologies at differ-ent applied potentials and times, C0" 0.25. Plan views. Left column: Afterstripping 2 equivalent monolayers of theLN component; central column: mor-phologies after 21 s of dissolution; right-most columns: Morphologies duringsteady-state dissolution. Dimensions arein units of near-neighbor spacing, a, andalso equivalent Au/Ag alloy near-neighborspacings "nm#. As in Fig. 4, light-huedstep edges in the later stages of the simu-lation give the impression that steps arepassivated by LN atoms, but this is an il-lusion due to the glancing incidence light-ing used for rendering to optimize topo-graphic contrast.
Figure 6. Schematic illustrating porosity evolution during selective dissolu-tion: "a# lateral stripping of LN species "uncolored# from the alloy surfaceexposed to electrolyte; concentration of noble atoms species "shaded# inregions of positive step curvature "e.g., kink sites#; "b# formation and coars-ening of islands comprised of noble species atoms remaining from dissolu-tion at the alloy electrolyte interface; coarsening proceeds until next layer ofalloy is attacked, at which point a characteristic average island spacing $&%has developed; "c# stripping of LN atoms from second layer of alloy andformation of noble atom-capped hills; average spacing between hills remainsequal to $&%; "d# reduced accumulation of noble atoms at base of hills be-cause their perimeters are widening and alloy area between them is shrink-ing; again, average spacing between hills remains equal to $&%; "e# undercut-ting of hills "illustrated in cross section; dotted lines indicate morphologybefore undercutting#; increase of average distance between hills as measuredalong alloy/electrolyte interface; "f# nucleation of new noble atom clusterswhen hill-hill distance measured along alloy/electrolyte interface becomesapproximately 2$&% "illustrated in cross section#; bifurcation of pore. Furthercoarsening of porous structure occurs as electrolyte continues to penetratealloy.
Journal of The Electrochemical Society, 151 "10# C614-C626 "2004#C620
Downloaded 31 Jan 2011 to 18.53.6.241. Redistribution subject to ECS license or copyright; see http://www.ecsdl.org/terms_use.jsp
J. Erlebacher,J. Electrochem. Soc. 151 (10), C614-C626 (2004)J. Erlebacher et al., Nature, 410, 450, (2001)
Surface diffusion of atoms from high-curvature regions to low-
curvature regions leads to formation of nanoporous metal assuming
no role of vacancies

Deficiencies of the model
per area of the as-received foils their average thickness wasestimated to be 120 nm. Energy-dispersive x-ray (EDX) fluo-rescence data indicates a composition of Ag80Au20. TEM sam-ples were prepared from 1 cm2 sample pieces which wereelectrochemically dealloyed in perchloric acid (1 L) at ambi-ent temperature and at a controlled potential of 600 mV ver-sus a Ag/AgCl/HClO4 reference electrode. The dealloyingpotential was applied until the current fell to below 1 lA/cm2. As described in Ref.,[8] the comparatively low dealloyingpotential results in a very slow dissolution – here, the processtook about 90 min. – and in a comparatively large structuresize. Investigations of structure size by electron microscopyor of specific surface area by capacitance measurements typi-cally show that significant coarsening occurs during synthe-sis. Thus, the structure observed here is most likely the prod-uct of two processes, corrosion and coarsening.
HAADF-STEM tomography has been carried out in a FEITecnai F20ST field-emission gun (FEG)-TEM operated at200 kV, fitted with a Fischione HAADF detector (modelFP-5360/20). Single-axis tilt series were acquired automati-cally using the Xplore3D 2.0 Tomography suite operated inthe HAADF-STEM mode with a nominal spot size of 1 nm. Acamera length of 70 mm (corresponding to a minimum scat-tering angle of 50 mrad) was used for the signal collection inorder to minimise diffraction effects. Images were scannedwith 1024 ! 1024 pixels using a frame time of 12.5 s. 73 elec-tron micrographs have been collected over a tilt range of± 66° in 1.8° steps. Re-centering and refocusing were doneautomatically. The alignment of the individual stacks and thereconstruction of the acquired tilt series was done off-lineusing FEI’s software package Inspect 3D Version 2.1. The tiltseries alignment was made by iterative cross-correlations tosub-pixel accuracy. The aligned tilt series was reconstructed
using the iterative back-projection process SIRT[23] which isimplemented in the Inspect 3D Code. 25 iterations were per-formed for the SIRT reconstruction. Each three-dimensionalpixel (‘voxel’) of the reconstruction represents a cube with anedge-length of 0.73 nm. The software package Amira 3.1 hasbeen used for the visualization of the reconstructed struc-tures.
For stereological analysis, the reconstruction was binarizedand then cropped in all spatial directions (to 340 nm !300 nm ! 70 nm) in order to remove the macroscopic samplesurfaces, to avoid artefacts at the borders of the reconstruc-tion, and to ensure that the volume used for analysis is repre-sentative of the bulk sample structure. The analysis was per-formed using the program MAVI.[21] MAVI affords acharacterization of 3-D structures by analysis of their repre-sentations as binary and spatially discrete images, using thealgorithms described in reference [22].
Results of Electron Microscopy
Conventional TEM micrographs, such as the bright-fieldmicrographs of Figure 1, are 2-D projections which revealinformation about the average density along the beam direc-tion. Here, the micrographs illustrate the typical microstruc-ture of nanoporous gold, which is composed of nanometersize ligaments and pores. Energy dispersive analysis of X-rayfluorescence of the sample volume shown in Figure 1(a) indi-cates that the average composition is Au96Ag4. Details of indi-vidual gold ligaments are shown in Figure 1(b).
A selected area electron diffraction (SAED) pattern (theaperture corresponds to a circular area of about 800 nm indiameter) from the same volume as shown in Figure 1(a) (seeinset) reveals a preferred <100> out-of-plane orientation, con-
Rösner et al./Reconstructing a Nanoporous Metal in Three Dimensions: An Electron Tomography Study
CO
MM
UN
ICATI
ON
S
536 http://www.aem-journal.com © 2007 WILEY-VCH Verlag GmbH & Co. KGaA, Weinheim ADVANCED ENGINEERING MATERIALS 2007, 9, No. 7
(a) (b)Fig. 1. a) Bright-Field micrograph showing a fully connected network structure composed of single-crystalline gold ligamentsand pores. Darker regions are related to a higher density of gold ligaments due to the overlap in the 2-D projection. The corre-sponding diffraction pattern (SAED) in the inset indicates a preferred <100> out-of-plane orientation with considerablemosaic spread. b) Bright-Field micrograph: detail revealing individual gold ligaments. Examples of encased voids are markedby arrow heads.
and the dealloying rate are seen to be correlated, with moreshrinkage and faster dealloying at higher ED. This is con-sistent with the apparent density differences seen in TEM[Figs. 1(a) and 1(b)]. In view of the higher Au fraction inthe 11 carat leaf, it is not unexpected that its amount ofshrinkage in Fig. 3(c) is less than for the bulk material. Yet,!l remains significant here.
At first sight, our observation of a reduction in the outersample dimension may not be surprising in view of the factthat dealloying removes more than half the atoms from thesolid solution. Yet, the finding is actually not immediatelycompatible with models of dealloying, such as that ofRefs. [9,10], which work with a rigid lattice: It is compat-ible with such models to consider a coherent lattice ex-tending throughout both the solid phase and the pore spaceof NPG, pores being viewed as clusters of lattice sitesoccupied by vacancies, and we stress that only two ele-mentary steps are considered, (i) dissolution—that is,switching the occupancy of a single lattice site from‘‘Ag‘‘ to ‘‘vacancy‘‘ and (ii) diffusion—that is, interchang-ing components (Au and vacancy) on neighboring latticesites. On a rigid lattice, these are local processes whichleave the external dimensions of the body invariant, astatement which holds even if one of the componentsconsists of vacancies.
As a notable exception to the above statement, theexternal surface will recede by one interplanar spacingevery time the outermost lattice plane is removed by
transport of Au atoms from that surface into the interiorof the porous layer. In view of the unusually large surfacediffusion coefficient of Au at the metal-electrolyte inter-face (see references in Ref. [10]), this might appear to bethe most obvious shrinkage mechanism in the very firststages of dealloying, when the dissolution occurs near themacroscopic sample surface. However, as the dissolutionfront propagates into the bulk, the diffusion distance to thesurface increases, so that the rate of transport shoulddiminish and shrinkage eventually come to a halt forsufficiently deep dealloying. The observation of very simi-lar amounts of shrinkage in leaf and bulk samples, in spiteof almost 4 orders of magnitude difference in thickness, aswell as the continued shrinkage in the bulk sample even atthe very end of the dissolution, when the dealloying fronthas moved hundreds of microns below the sample surface,argue against this explanation. Furthermore, the large lat-eral shrinkage observed in the Au leaf cannot be explainedby the condensation of vacancies at its surface, whichwould only reduce the thickness.
In addition to the above concerns is the problem ofidentifying a driving force for long-range transport ofmatter between the surface and an underlying porous layer.Curvature-driven coarsening is based on transport of mat-ter from positively curved regions on the surface to nega-tively curved ones. Since the ligaments exhibit saddle-point-like features with highly nonuniform values of themean curvature, coarsening is expected to proceed pre-dominately by local transport on the scale of the ligamentlength (order of 10 nm) rather than by long-range transportto the outer surface (up to hundreds of microns). Thus,curvature-driven surface diffusion is likely not the mecha-nism leading to shrinkage. By a similar argument, grainboundaries can be ruled out as sinks for vacancies: Due tothe large grain size, the transport distance is too large.
We shall now speculate on additional processes thatcould rationalize the experimental finding. As diffusionand elastic distortion can be ruled out (cf. the insignificantchange in lattice parameter), it appears that plastic defor-mation needs to be taken into consideration. While thisnotion is supported by our observation of an increasingdefect density at higher ED, correlating with the increasingshrinkage, none of the processes below has beenconfirmed.
FIG. 3. (a): In situ dilatometry traces for bulk (0.9 mm edge-length cubes) Ag75Au25 showing the time evolution of relativelength change !l=l0 and of transferred charge Q at dealloyingpotential 850 mV versus Ag=AgCl. (b) !l=l0 versus Q for thedata in (a). (c) Net length change after completion of dealloyingversus the half-time of dealloying for bulk (!) and leaf (";11 carat) samples. Data points are labeled according to appliedpotential.
FIG. 2 (color). Photographs of Ag-Au samples. 6 carat leaf sample (a) before and (b) after dealloying, showing an area reduction byabout 23%. The leaf is floating on an electrolyte; a ring-shaped counter electrode is located outside the image area. (c) Two bulksamples of about 1 mm3 volume, master alloy and NPG.
PRL 97, 035504 (2006) P H Y S I C A L R E V I E W L E T T E R S week ending21 JULY 2006
035504-3
23% reduction in volume after dealloying
S. Parida et al., Phys. Rev. Lett., 97, 035504, (2005)
Voids inside the ligaments
H. Rosner et al., Adv. Mat., 9, 535, (2007)
In the surface-diffusion dominated model
• lattice sites conserved: volume shrinkage can not be explained
• voids inside the ligament can not form with only surface diffusion

Methods: Molecular dynamics
• An initial random atomic structure was constructed from an FCC lattice corresponding to 20% - 42% density of Au
• The resulting structure relaxed using conjugate gradient minimization followed by annealing at 300K and constant volume
• EAM potential to model interatomic interactions [SM Foiles et al, Phys. Rev. B, 33, 7983 (1986)]
• Simulations conducted using LAMMPS, an open source MD software

Talk outlineIs there a different mechanism of coarsening of np-metals?
• Creating a model np-Au atomic structure
• Coarsening during annealing of np-Au
• Coarsening during deformation of np-Au
• Critical ligament radius below which coarsening is spontaneous

Spontaneous np-Au-like from Au gas
t = 0.812ns!Initial! ρ = 0.19ρAu!
Many previous investigation of similar phenomena
F. F. Abraham et al., Phys. Rev. Lett. 261 (1976)

Microstructure of Model Au Nanofoam
0
1
2
3
4
5
2 4 6 8 10 12r (Å)
g(r
)
〈110〉
〈100〉
〈112〉
〈110〉
Surface atomsAll atoms
Microstructure of the annealed np-Au:
• Annealed structure is crystalline and FCC
• Surfaces normal to crystallographic〈111〉• Annealed structure is polycrystalline
〈123〉
ρ = 0.19ρAu
Atoms colored according to local deviation from crystallographic [100] orientation

Microstructure of Model Au Nanofoam
Five-fold twins where several ligaments meet
Twinned ligament
hcpfcc unknownρ = 0.19ρAu
Surface atoms not shown for clarityAtoms classified using CNA
• Twin boundaries in ligaments and nodes are common
• Total twin boundary area greater than stacking fault area

Talk outlineIs there a different mechanism of coarsening of np-metals?
• Creating a model np-Au atomic structure
• Coarsening during annealing of np-Au
• Coarsening during deformation of np-Au
• Critical ligament radius below which coarsening is spontaneous
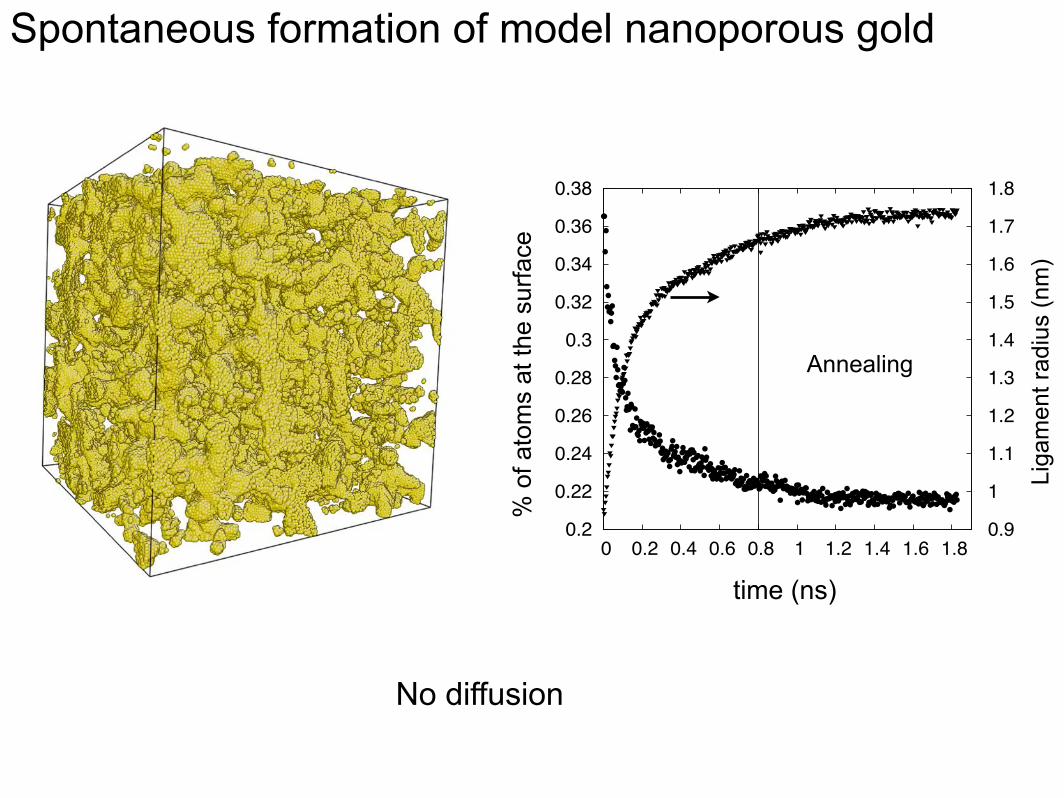
Spontaneous formation of model nanoporous gold
Annealing
% o
f ato
ms
at th
e su
rface
time (ns)
0.2
0.22
0.24
0.26
0.28
0.3
0.32
0.34
0.36
0.38
0 0.2 0.4 0.6 0.8 1 1.2 1.4 1.6 1.8
0.9
1
1.1
1.2
1.3
1.4
1.5
1.6
1.7
1.8
Liga
men
t rad
ius
(nm
)
No diffusion

Coarsening of np-Au during annealing
Annealing
% o
f ato
ms
at th
e su
rface
time (ns)
0.2
0.22
0.24
0.26
0.28
0.3
0.32
0.34
0.36
0.38
0 0.2 0.4 0.6 0.8 1 1.2 1.4 1.6 1.8
0.9
1
1.1
1.2
1.3
1.4
1.5
1.6
1.7
1.8
Liga
men
t rad
ius
(nm
)
No diffusion

Coarsening during annealing by collapse of ligaments
3 nm
• Shear at the bases of adjacent ligaments due to dislocation motion
• Subsequently, shear at the ligaments themselves
• Shear leads to “displacive” motion of ligaments towards each other
and eventual collapse
ρ = 0.19ρAu

5 nm
• Ligament pinch-off assisted by plastic deformation
• collapse of other nearby ligaments
• Pinch-off of a ligament creates additional surface
• Surface area lost by ligament collapse more than compensates the
surface area created by pinchoff
Coarsening during annealing by collapse of ligaments

Void formation during ligament collapse
4 nmIf ligament collapse is not contiguous, voids form

Talk outlineIs there a different mechanism of coarsening of np-metals?
Network restructuring enabled by localized plasticity
• Creating a model np-Au atomic structure
• Coarsening during annealing of np-Au
• Coarsening during deformation of np-Au
• Critical ligament radius below which coarsening is spontaneous

Volume conserving uniaxial compression
• Volume-conserving strain increments (εzz < 0, εxx = εyy > 0)
• Strain increments of 0.0099 (0.99%) up to a deviatoric strain of ~0.65
• Each Strain increment is followed by conjugated gradient minimization (0 K)

Mechanical response to volume conserving uniaxial compressionσ e
q (M
Pa)
εdev
19%
30%
42%
0
50
100
150
200
250
300
350
0 0.1 0.2 0.3 0.4 0.5 0.6 0.7
compare stress
0
50
100
150
200
250
300
350
0.2 0.25 0.3 0.35 0.4 0.45
0
50
100
150
200
250
300
350
ρ/ρAu
σ eq (
MP
a)
σσ s
= Cρrel3/2
• Elastic-perfect plastic stress-strain response reminiscent of the
compaction plateau of conventional foams
• Critical yield strength backed out from Gibson-Ashby equation is in
excellent agreement with those obtained directly for the model Au used.
• When deformed under zero pressure the foams would densify; under
constant volume, however, they begin to break up after εdev ~ 0.3

Coarsening during deformation
0.19
0.195
0.2
0.205
0.21
0.215
0.22
0.225
0.23
0.235
0 0.1 0.2 0.3 0.4 0.5 0.6 0.7
1.65
1.7
1.75
1.8
1.85
1.9
1.95
Liga
men
t rad
ius
(nm
)
εdev
% o
f ato
ms
at th
e su
rface
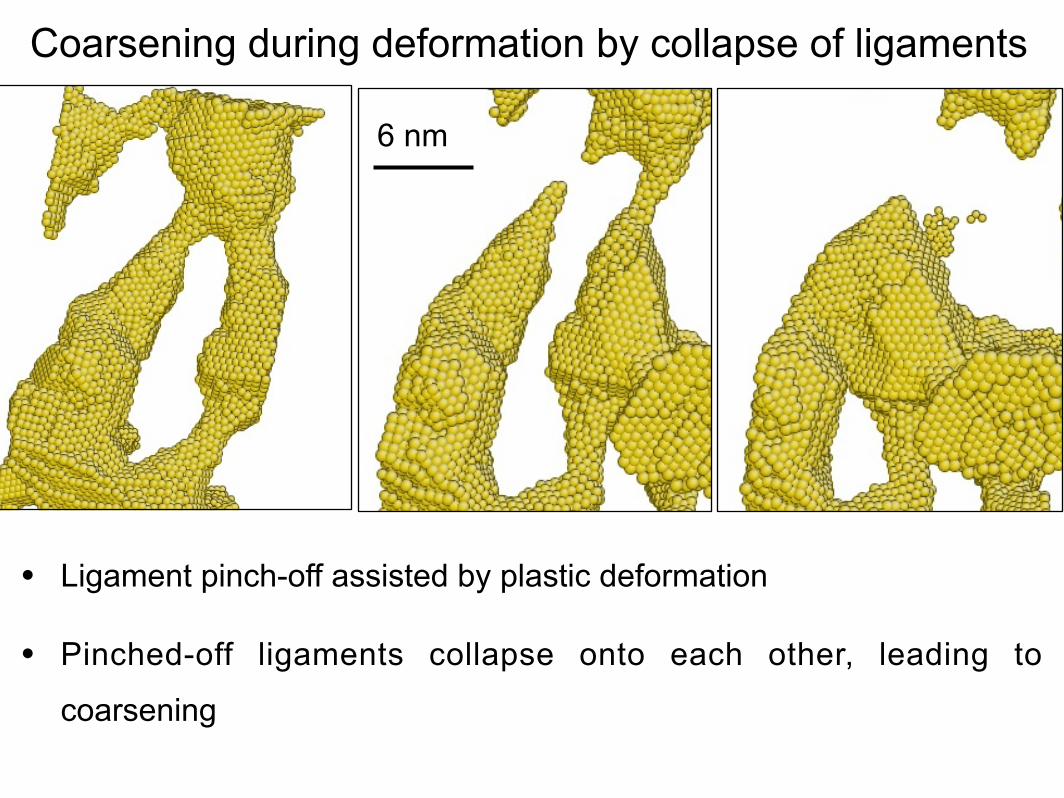
6 nm
Coarsening during deformation by collapse of ligaments
• Ligament pinch-off assisted by plastic deformation
• Pinched-off ligaments collapse onto each other, leading to
coarsening

Talk outlineIs there a different mechanism of coarsening of np-metals?
Network restructuring enabled by localized plasticity
• Creating a model np-Au atomic structure
• Coarsening during annealing of np-Au
• Coarsening during deformation of np-Au
• Critical ligament radius below which
coarsening is spontaneous

Surface area change for one pinchoff/collapse event
Change in energy per ligament during pinch-off/collapse given by
dEsurface = [C0p12⇡L� p24⇡R]�dR
surface energy
surface area createdsurface area destroyed
Fraction of ligaments that collapse
extent of collapse of ligaments
If two ligaments collapse to form just one ligament, then this value is 0.74.
Fraction of pinched-off ligaments that do no collapse

Change in energy per ligament during pinch-off/collapse given by
dEsurface = [C0p12⇡L� p24⇡R]�dR
⇢rel = C2
⇣rlrp
⌘2 h1�D2
⇣rlrp
⌘i rl = R
rp = L
dEsurface = 2⇡p1K1
C02p⇢rel
�RdR
K1 ⇡ (C0 � 2p2
p1C
0
2p⇢rel
)where
L ⇡ R
C02p⇢rel
Scaling expression
After substitution
Surface area change for one pinchoff/collapse event
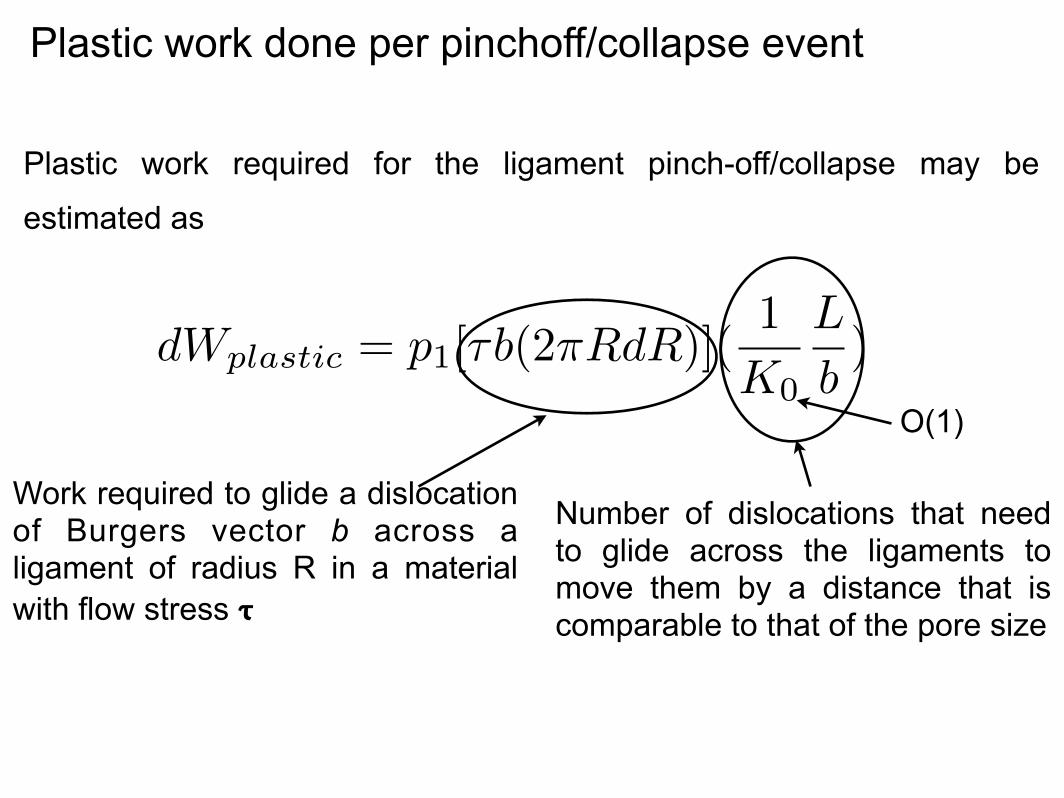
Plastic work required for the ligament pinch-off/collapse may be
estimated as
dWplastic = p1[⌧b(2⇡RdR)](1
K0
L
b)
Work required to glide a dislocation of Burgers vector b across a ligament of radius R in a material with flow stress 𝞃
Number of dislocations that need to glide across the ligaments to move them by a distance that is comparable to that of the pore size
O(1)
Plastic work done per pinchoff/collapse event

Critical radius for spontaneous coarsening by network reconstruction
dEsurface = 2⇡p1K1
C02p⇢rel
�RdR K1 ⇡ (C0 � 2p2
p1C
0
2p⇢rel
)
dWplastic = p1[⌧b(2⇡RdR)](1
K0
L
b)
Coarsening is spontaneous if dWplastic
dR<
dEsurface
dR
dW (R⇤)plasticdR
=dE(R⇤)surface
dR
R⇤ = K�
⌧where K = K0(C0 � 2
p2p1
C0
2p⇢rel)
Network topology

Spontaneous coarsening regime (by plastic deformation)
R⇤ = K�
⌧where K = K0(C0 � 2
p2p1
C0
2p⇢rel)
For Au,
we get
Average ligament radii of real np-Au reported in the literature are all
above this critical value
R⇤ ⇡ 1� 5 nm
⌧ ⇡ 800 MPa� 2.5 GPa
�{111} = 1.25 Jm�2
Assuming K0 = 2, C0 = 0.74 and P2/P1 <<1

Conclusions• Our simulations suggest that coarsening of np-Au may occur by network
restructuring by collapse of neighboring ligaments
– caused by localized plasticity
• Indirect evidence
– densification of np-metals upon annealing
– voids enclosed in ligaments
– critical ligament radius below which restructuring is spontaneous
• Direct evidence required
– high spatio-temporal resolution of x-ray tomography perhaps?