Coarsening evolution of dendritic sidearms: From ...
11
Full length article Coarsening evolution of dendritic sidearms: From synchrotron experiments to quantitative modeling H. Neumann-Heyme a, *, 1 , N. Shevchenko a, **, 1 , Z. Lei a, c , K. Eckert a, c , O. Keplinger a , J. Grenzer a , C. Beckermann b , S. Eckert a a Helmholtz-Zentrum Dresden-Rossendorf (HZDR), 01314, Dresden, Germany b Department of Mechanical and Industrial Engineering, University of Iowa, Iowa City, IA, 52242, USA c TU Dresden, Institute of Process Engineering, 01062, Dresden, Germany article info Article history: Received 7 September 2017 Received in revised form 25 December 2017 Accepted 27 December 2017 Available online 10 January 2018 Keywords: Dendritic solidification Microstructure Coarsening Sidearm detachment X-ray radiography Phase-field model Material properties abstract The local dynamics of dendritic sidearms during coarsening are studied by combining in-situ radiography observations with numerical and analytical models. A flat sample of a Ga-In alloy is partially solidified and then held isothermally in a vertical temperature gradient. The evolving dendritic microstructure is visualized using synchrotron X-ray imaging at the BM20 (ROBL) beamline at ESRF, France. During the coarsening stage, the temporal evolution of the geometrical features of sidebranches is captured by automated image processing. This data is then used to quantify the dynamics of two basic evolution mechanisms for sidebranches: retraction and pinch-off. The universal dynamics of sidearm necks during pinch-off are exploited to determine the product of liquid diffusivity and capillarity length Dd 0 , as a parameter that is crucial in the calibration of quantitative models. By employing an idealized phase-field model for the evolution of a single sidebranch, the behavior of selected sidebranches is reproduced from the experiments in a consistent way. © 2018 Acta Materialia Inc. Published by Elsevier Ltd. All rights reserved. 1. Introduction The solidified microstructure of metal alloys ensues largely from the growth and coarsening of dendrites. During their initial growth into an undercooled melt, dendrites form a characteristic tree-like structure of primary stems and higher-order branches. At a later stage, when the surrounding melt approaches equilibrium, the dendritic structures undergo a slow coarsening process that continuously reduces the number of sidebranches and leads to an increase in the average microstructural length scale. This process is primarily governed by capillarity effects, which cause diffusive material exchange between adjacent structures of different curva- ture. The coarsening of dendritic structures is characterized by transformation of the side-arm morphology present after growth. It typically proceeds by three mechanisms: (i) retraction of small sidebranches towards their parent stem, (ii) pinch-off or detach- ment of sidebranches at the narrow neck with the parent stem, and (iii) coalescence of neighboring sidebranches. The pinch-off of dendrite branches is of particular interest as the resulting dendrite fragments can initiate the growth of equiaxed grains and therefore promote a fine, isotropic microstructure. The underlying detachment mechanism is a capillarity-driven shape instability that leads to a gradual constriction and collapse of the sidearm neck near the junction with the parent stem. Over decades, the observation of microstructure formation has been limited to post-mortem analysis of sectioned samples or microscopic imaging in transparent alloys; however, new X-ray sources and innovative procedures for image analysis have dramatically advanced the in-situ analysis of evolving microstruc- tures in metal alloys starting around the year 2000 [1 ,2]. Initial studies involved the radiographic observation of thin samples (2D projections). More recently, microscopic tomography is used to obtain time-resolved, volumetric data [3e6]. Samples are often placed within a temperature gradient, which dictates the direction of growth during cooling. The orientation of the growth with respect to gravity has a strong effect on the strength of buoyancy- * Corresponding author. ** Corresponding author. E-mail addresses: [email protected] (H. Neumann-Heyme), n.shevchenko@ hzdr.de (N. Shevchenko). 1 Both authors contributed equally. Contents lists available at ScienceDirect Acta Materialia journal homepage: www.elsevier.com/locate/actamat https://doi.org/10.1016/j.actamat.2017.12.056 1359-6454/© 2018 Acta Materialia Inc. Published by Elsevier Ltd. All rights reserved. Acta Materialia 146 (2018) 176e186
Transcript of Coarsening evolution of dendritic sidearms: From ...
lable at ScienceDirect
Acta Materialia 146 (2018) 176e186
Contents lists avai
Acta Materialia
journal homepage: www.elsevier .com/locate/actamat
Full length article
Coarsening evolution of dendritic sidearms: From synchrotronexperiments to quantitative modeling
H. Neumann-Heyme a, *, 1, N. Shevchenko a, **, 1, Z. Lei a, c, K. Eckert a, c, O. Keplinger a,J. Grenzer a, C. Beckermann b, S. Eckert a
a Helmholtz-Zentrum Dresden-Rossendorf (HZDR), 01314, Dresden, Germanyb Department of Mechanical and Industrial Engineering, University of Iowa, Iowa City, IA, 52242, USAc TU Dresden, Institute of Process Engineering, 01062, Dresden, Germany
a r t i c l e i n f o
Article history:Received 7 September 2017Received in revised form25 December 2017Accepted 27 December 2017Available online 10 January 2018
Keywords:Dendritic solidificationMicrostructureCoarseningSidearm detachmentX-ray radiographyPhase-field modelMaterial properties
* Corresponding author.** Corresponding author.
E-mail addresses: [email protected] (H. Neumhzdr.de (N. Shevchenko).
1 Both authors contributed equally.
https://doi.org/10.1016/j.actamat.2017.12.0561359-6454/© 2018 Acta Materialia Inc. Published by
a b s t r a c t
The local dynamics of dendritic sidearms during coarsening are studied by combining in-situ radiographyobservations with numerical and analytical models. A flat sample of a Ga-In alloy is partially solidifiedand then held isothermally in a vertical temperature gradient. The evolving dendritic microstructure isvisualized using synchrotron X-ray imaging at the BM20 (ROBL) beamline at ESRF, France. During thecoarsening stage, the temporal evolution of the geometrical features of sidebranches is captured byautomated image processing. This data is then used to quantify the dynamics of two basic evolutionmechanisms for sidebranches: retraction and pinch-off. The universal dynamics of sidearm necks duringpinch-off are exploited to determine the product of liquid diffusivity and capillarity length Dd0, as aparameter that is crucial in the calibration of quantitative models. By employing an idealized phase-fieldmodel for the evolution of a single sidebranch, the behavior of selected sidebranches is reproduced fromthe experiments in a consistent way.
© 2018 Acta Materialia Inc. Published by Elsevier Ltd. All rights reserved.
1. Introduction
The solidifiedmicrostructure of metal alloys ensues largely fromthe growth and coarsening of dendrites. During their initial growthinto an undercooled melt, dendrites form a characteristic tree-likestructure of primary stems and higher-order branches. At a laterstage, when the surrounding melt approaches equilibrium, thedendritic structures undergo a slow coarsening process thatcontinuously reduces the number of sidebranches and leads to anincrease in the average microstructural length scale. This process isprimarily governed by capillarity effects, which cause diffusivematerial exchange between adjacent structures of different curva-ture. The coarsening of dendritic structures is characterized bytransformation of the side-armmorphology present after growth. Ittypically proceeds by three mechanisms: (i) retraction of small
ann-Heyme), n.shevchenko@
Elsevier Ltd. All rights reserved.
sidebranches towards their parent stem, (ii) pinch-off or detach-ment of sidebranches at the narrow neck with the parent stem, and(iii) coalescence of neighboring sidebranches.
The pinch-off of dendrite branches is of particular interest as theresulting dendrite fragments can initiate the growth of equiaxedgrains and therefore promote a fine, isotropic microstructure. Theunderlying detachment mechanism is a capillarity-driven shapeinstability that leads to a gradual constriction and collapse of thesidearm neck near the junction with the parent stem.
Over decades, the observation of microstructure formation hasbeen limited to post-mortem analysis of sectioned samples ormicroscopic imaging in transparent alloys; however, new X-raysources and innovative procedures for image analysis havedramatically advanced the in-situ analysis of evolving microstruc-tures in metal alloys starting around the year 2000 [1,2]. Initialstudies involved the radiographic observation of thin samples (2Dprojections). More recently, microscopic tomography is used toobtain time-resolved, volumetric data [3e6]. Samples are oftenplaced within a temperature gradient, which dictates the directionof growth during cooling. The orientation of the growth withrespect to gravity has a strong effect on the strength of buoyancy-
H. Neumann-Heyme et al. / Acta Materialia 146 (2018) 176e186 177
driven convection [7]. The resulting solidification conditions affectthe dendrite morphology and the tendency to fragment [7e10].
Flat-sample radiographic solidification studies have addressedthe effects of composition, cooling rate, gradient magnitude andorientation, and natural or forced convection. Additional informa-tion on strains and crystallographic misorientations have beenobtained by means of white-beam X-ray topography [11]. Althoughradiography-based methods allow a relatively large area of thesample to be captured, the limited sample thickness restricts thegrowth of the dendrites and the flow of the melt compared to bulksample conditions [12].
X-ray micro-tomography is able to capture volumetric infor-mation on the microstructure in small bulk samples. The re-strictions in terms of sample size and time resolution are, however,more severe than in radiography. Therefore, tomography hasmainly been useful for observing slow processes in small samples,e.g. during dendrite coarsening on a sub-mm scale [3e6]. None-theless, the availability of three-dimensional images has enabledthe quantification of local and global features of the morphologyand their evolution over time.
For metallic alloys, Aagesen et al. [13] investigated theisothermal pinch-off of rod-like solid structures surrounded byliquidmelt. Such configurations are prone to a Rayleigh-Plateau likeshape instability, where a small local reduction in the cross-sectionof the structure becomes amplified. This mechanism is caused bythe increasing curvature difference between nearby interface re-gions, which induces diffusional transport through the bulk liquid.Shortly before the structure breaks up, the local curvature of theneck approaches infinity. Due to the strong localization of the neckdynamics and geometry, this process takes on a universal, self-similar behavior. During this stage the geometry of the neck ap-proaches a double cone with an opening angle of 80� and the neckdiameter aN follows
aNðtÞ ¼ 1:76�Dd0
�tp � t
��1=3 (1)
where D is the solute diffusivity in the liquid phase, d0 the chemicalcapillary length and tp the time when the pinch-off occurs. Thesetheoretical predictions were confirmed in Ref. [13] by in-situ X-raytomography of Al-Cu samples during isothermal coarsening.
Recently, Neumann-Heyme et al. [14] performed a computa-tional study of the effects of the initial geometry and cooling rate onthe dynamics of sidebranch evolution. The study revealed thatsidearms can only pinch off within a limited range of model pa-rameters. Beyond this interval, coalescence or retraction will occurbefore the sidebranches can detach from the parent stem. The au-thors confirmed that the pinch-off follows the universal dynamicsdescribed in Ref. [13] during a short time interval just before pinch-off. These dynamics were found to be independent of model pa-rameters such as the cooling rate.
In the present work, a radiographic analysis of the growth andcoarsening of dendrites in a low-melting-point Ga-In alloy is pre-sented using the ROBL beamline (BM20) at the European Syn-chrotron Radiation Facility (ESRF, Grenoble). The high spatial andtemporal resolution achieved in the experiments enables impor-tant local geometric features to be accurately captured during thecoarsening stage, and their dynamics to be evaluated quantita-tively. It is then demonstrated that the measured dynamics can bewell reproduced by means of a numerical simulation model of anaxisymmetric sidearm, as first developed in Ref. [14].
A prerequisite for the implementation of the simulation modelis the knowledge of the relevant material parameters, since theyselect the length and time scale of the interface evolution process.On one hand, the use of a Ga-In alloy in solidification experiments
enables simple handling due to its low melting point, but on theother hand, the material properties required for quantitativemodeling are highly uncertain. In particular, the product of thediffusion coefficient and capillary length is difficult to measure byconventional means, but is of utmost importance in solidificationmodels. The present study exploits the universality of the pinch-offbehavior in the form of Eq. (1) as a tool for the direct determinationof Dd0 based on in-situ observations of the neck dynamics coupledwith a simple theoretical analysis. This approach is not restricted toGa-In, but is also applicable to other alloy systems that have notbeen thoroughly characterized.
2. Experimental methods and model description
2.1. Experimental setup
The visualization experiments were performed at the ROBLbeamline (BM20) at ESRF (Grenoble). The experimental setup, cf.Fig. 1a, used here for the solidification experiments was alreadyemployed in previous radiographic investigations carried out bymeans of a microfocus X-ray tube [15,16].
All experiments were conducted using a low-melting-pointhypereutectic Gae25wt%In alloy that was prepared from galliumand indium of 99:99% purity. The low melting point of the alloy(liquidus temperature 25:7 �C) enables the experiments to beimplemented efficiently and flexibly. Furthermore, the GaeIn alloyexhibits a high X-ray contrast between the growing indium den-drites and the interdendritic Ga-rich liquid. A compilation of thematerial properties is provided in Section 2.4.
The alloy was melted and filled into a Hele-Shaw cell made ofPlexiglas with a liquid metal volume of 28� 28� 0:15 mm3. Therectangular observationwindow determined by the width of the X-ray beam was 20� 23 mm2 in size. The Hele-Shaw cell was cooledat the bottom by means of a Peltier cooler, while a second array ofPeltier elements was mounted as a heater on the upper part of thesolidification cell. The distance between the heater and the coolerwas 19 mm. The simultaneous regulation of the power of bothPeltier elements by means of a PID controller unit allowed thecooling rate and the temperature gradient to be adjusted flexiblyduring the process. Three miniaturized K-type thermocouples(<0:1 mm) were attached to the lateral surface of the cell tomonitor the temperature. The accuracy of the temperature controlis ±0:2 K. In the present experiments, a cooling rate of 0:01 K=s anda temperature gradient of � 1 K=mm were applied. The tempera-ture gradient was calculated from the temperature differencemeasured between the thermocouples T1 and T2.
The solidification cell was exposed to a monochromatic X-raybeam with an energy of 28:5 keV. Conventional transmission ra-diographs were obtained by means of a scintillator that provides aresolution of 2 mm and was coupled to an optical magnifier and aPCO 2000 CCD camera with 2048� 2048 pixels (pixel size of0:34� 0:34 mm2). This equipment leads to a field of view of about700� 700 mm. The distance between the detector and sample was20 cm. In order to change the location of the observation window,the position of the solidification cell was manipulated with respectto the X-ray beam by a motorized positioning system with a min-imum translation step of 10 mm. Images were acquired at exposuretimes ranging from 2 to 20 seconds.
Since mainly X-ray scattering experiments have so far beenperformed on the ROBL beamline, the initially available hardwarewas not optimized for imaging. Thus, some initial difficulties withthe illumination conditions of the sample had to be improved inorder to find a good balance between illumination homogeneity,low image noise level, and reasonably low exposure times. Imper-fections of the beam line optics caused by the waviness of the
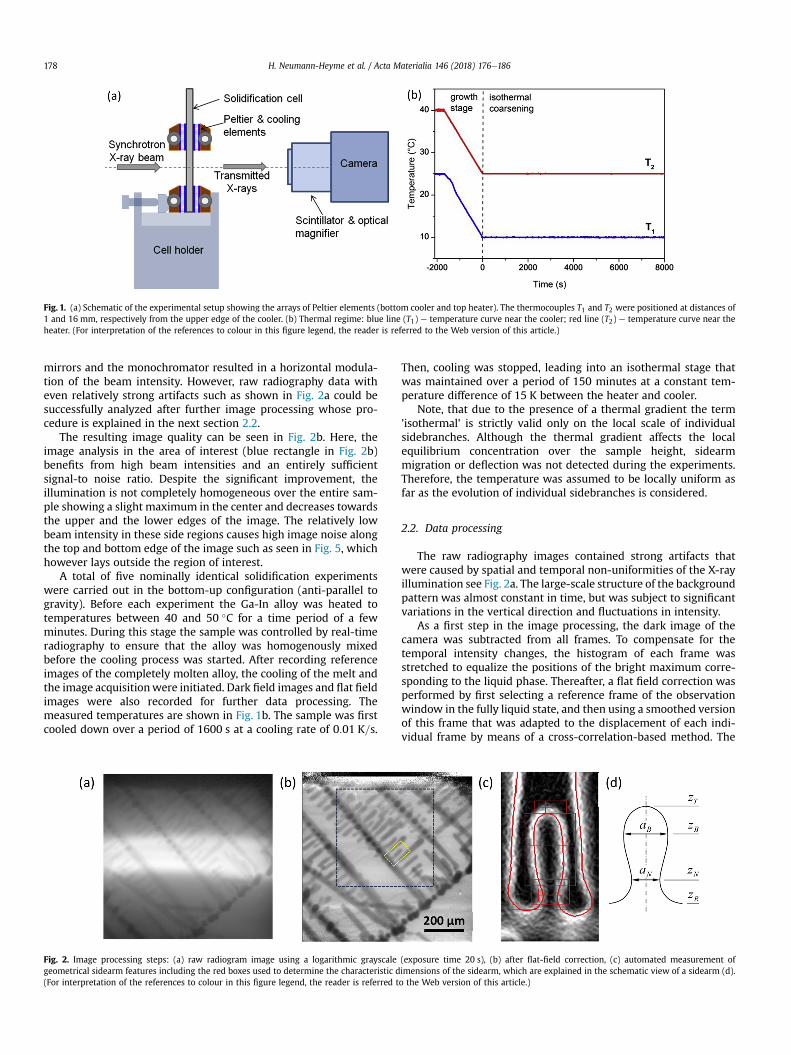
Fig. 1. (a) Schematic of the experimental setup showing the arrays of Peltier elements (bottom cooler and top heater). The thermocouples T1 and T2 were positioned at distances of1 and 16 mm, respectively from the upper edge of the cooler. (b) Thermal regime: blue line (T1) e temperature curve near the cooler; red line (T2) e temperature curve near theheater. (For interpretation of the references to colour in this figure legend, the reader is referred to the Web version of this article.)
H. Neumann-Heyme et al. / Acta Materialia 146 (2018) 176e186178
mirrors and the monochromator resulted in a horizontal modula-tion of the beam intensity. However, raw radiography data witheven relatively strong artifacts such as shown in Fig. 2a could besuccessfully analyzed after further image processing whose pro-cedure is explained in the next section 2.2.
The resulting image quality can be seen in Fig. 2b. Here, theimage analysis in the area of interest (blue rectangle in Fig. 2b)benefits from high beam intensities and an entirely sufficientsignal-to noise ratio. Despite the significant improvement, theillumination is not completely homogeneous over the entire sam-ple showing a slight maximum in the center and decreases towardsthe upper and the lower edges of the image. The relatively lowbeam intensity in these side regions causes high image noise alongthe top and bottom edge of the image such as seen in Fig. 5, whichhowever lays outside the region of interest.
A total of five nominally identical solidification experimentswere carried out in the bottom-up configuration (anti-parallel togravity). Before each experiment the Ga-In alloy was heated totemperatures between 40 and 50 �C for a time period of a fewminutes. During this stage the sample was controlled by real-timeradiography to ensure that the alloy was homogenously mixedbefore the cooling process was started. After recording referenceimages of the completely molten alloy, the cooling of the melt andthe image acquisitionwere initiated. Dark field images and flat fieldimages were also recorded for further data processing. Themeasured temperatures are shown in Fig. 1b. The sample was firstcooled down over a period of 1600 s at a cooling rate of 0:01 K=s.
Fig. 2. Image processing steps: (a) raw radiogram image using a logarithmic grayscalegeometrical sidearm features including the red boxes used to determine the characteristic d(For interpretation of the references to colour in this figure legend, the reader is referred tThen, cooling was stopped, leading into an isothermal stage thatwas maintained over a period of 150 minutes at a constant tem-perature difference of 15 K between the heater and cooler.
Note, that due to the presence of a thermal gradient the term'isothermal' is strictly valid only on the local scale of individualsidebranches. Although the thermal gradient affects the localequilibrium concentration over the sample height, sidearmmigration or deflection was not detected during the experiments.Therefore, the temperature was assumed to be locally uniform asfar as the evolution of individual sidebranches is considered.
2.2. Data processing
The raw radiography images contained strong artifacts thatwere caused by spatial and temporal non-uniformities of the X-rayillumination see Fig. 2a. The large-scale structure of the backgroundpattern was almost constant in time, but was subject to significantvariations in the vertical direction and fluctuations in intensity.
As a first step in the image processing, the dark image of thecamera was subtracted from all frames. To compensate for thetemporal intensity changes, the histogram of each frame wasstretched to equalize the positions of the bright maximum corre-sponding to the liquid phase. Thereafter, a flat field correction wasperformed by first selecting a reference frame of the observationwindow in the fully liquid state, and then using a smoothed versionof this frame that was adapted to the displacement of each indi-vidual frame by means of a cross-correlation-based method. The
(exposure time 20 s), (b) after flat-field correction, (c) automated measurement ofimensions of the sidearm, which are explained in the schematic view of a sidearm (d).o the Web version of this article.)

H. Neumann-Heyme et al. / Acta Materialia 146 (2018) 176e186 179
images before and after flat field correction are compared in Fig. 2aand b. Note that the illumination distribution in the original imagedirectly affects the local noise level in the corrected image.
The quantitative evaluation of geometrical features of individualsidebranches requires an accurate and robust method to determinethe edges of the solid structures in the projected image. For thatpurpose, the analysis followed two different approaches. First, edgedetection was performed by applying a Canny-filter to an image. Toobtain robust results the images were pre-smoothed by Gauss-filtering. However, image noise becomes amplified by the deriva-tive operations involved in the edge detection process. Since thisleads to reduced sensitivity and artificial thinning of the structures,this strategy was not pursued.
The second approach to identify the dendrite contours wasbased on binarizing the image at a distinct gray value threshold toseparate the dark solid structure from the brighter background.This method requires significantly less image smoothing, miti-gating the above-mentioned difficulties. However, choosing anappropriate critical threshold value is difficult when the back-ground illumination is non-uniform. Therefore, the edges wereidentified and measured in multiple steps, where thresholding wasperformed over progressively smaller sub-regions of the image. Inthe first step, the edge was approximately identified within arectangular sub-region that contains the sidearm under consider-ation (yellow selection in Fig. 2b, red contour in Fig. 2c). This stepwas needed to compensate for possible translation of the sidearmstructure between consecutive frames and to determine the verti-cal and horizontal extremum points in the sidearm geometry(Fig. 2d). Based on this information, separate sub-regions wereidentified as indicated by the red rectangles in Fig. 2c. Each of therectangles contains one of the points or distances to be measured,as shown in Fig. 2d. Themost crucial part in this method is selectingthe threshold value for the outer contour of the solid structure.First, a differential indicator of the edge strength was calculated forthe noisy image. Both the gradient magnitude and Laplacian wereapplied. The resulting field was then averaged over each contourline of constant gray value in the original image (“onion rings”). Themaximum among these average values then indicated the grayvalue threshold that gave the best representation of the edgewithin the evaluated image region. The advantage of this method isthat it tolerates high noise levels, as the disturbed edge informationwas only evaluated through an integral quantity.
The application of the gradient magnitude slightly un-derestimates the structure thickness, while a small overestimationwas observedwhen using the image Laplacian. To achieve optimumaccuracy, an appropriate threshold value was defined as theaverage of the gray values that result from these two different edgeindicators.
2.3. Single sidearm model
The evolution of sidebranches as observed in the experimentwas analyzed by a numerical model of a single sidebranch that isdefined by certain geometrical parameters, material properties andthermal conditions. For that purpose, the axisymmetric phase-fieldmodel for binary alloys described in Ref. [14] was employed. Incontrast to [14], where adjacent sidearms are assumed to have thesame length, the focus here is on a situation where the sidearmconsidered is located between two longer sidearms.
By using this simplified axisymmetric model, the sidearmbehavior can be described by a small number of essential param-eters, which allows for a very efficient and general analysis of theproblem. It also provides an intermediate step between a full 3Dmodel and simpler analytical descriptions. The assumptions thatare required in the axisymmetric model impose some limits on the
accuracy of the predictions, which is discussed in more detailbelow.
In the model, the temperature is assumed to be constant, andsolute diffusion through the liquid melt only occurs due to differ-ences in curvature between different regions of the solid-liquidinterface, which is typical for coarsening processes (melt super-saturation is negligibly small). The initial geometry consists of theidealized sidearm shape shown in Fig. 3a. This geometry capturesthe essential geometrical properties of a simple dendrite sidearm:its radius R, length l, and characteristic lateral distance lr to itsneighbors.
The present model assumes quasi-stationary diffusion, since themotion of the interface is slow compared to the relaxation of thediffusion field. This condition is satisfied once the melt concen-tration approaches equilibrium and the characteristic geometriclength scale (in the present case R) is much greater than thecapillary length, i.e. d0=R≪1. Under these circumstances, the usualfree boundary problem of isothermal, binary alloy solidification canbe significantly simplified [14]. First, a scaled supersaturation isintroduced as
U ¼�c� c0l
�R
Dcd0(2)
where c, c0l , Dc, and d0 are the solute concentration, the initialconcentration of the liquid, the miscibility gap, and the capillarylength, respectively. For a linearized phase diagram the miscibilitygap can be expressed by Dc ¼ c0l ð1� kÞ, where k is the partitioncoefficient. Further relationships between these parameters andthe specific conditions in the present experiment are discussedlater in Section 2.4. Length and time are scaled by
xx ¼ R and xt ¼ R3.Dd0 (3)
respectively. Solute diffusion in the melt is then governed by.
V2U ¼ 0 (4)
whereas diffusion in the solid phase is neglected. At the interface,mass conservation and the Gibbs-Thomson condition are given by
Vn ¼ �vnUjþi (5)
and.
Uji ¼ �k (6)
Respectively, where Vn is the interface velocity in the normaldirection n, and k is the local sum of the principal curvatures of theinterface. In these definitions n is pointing towards the liquid phaseand k is positive for a concave solid. The subscript i and superscriptþ denote the interface location and positive normal direction,respectively.
It can be seen that the dimensionless model given by Eqs.(4)e(6) is independent of any material parameters. The model issolely a function of the initial geometry, as shown in Fig. 3a, and theassumption of equilibrium between the solid and liquid phases,which corresponds to an initial value of U ¼ 0 throughout thedomain.
Themodel domain is limited in the longitudinal direction by no-flux boundary conditions at z ¼ 0 and z ¼ lz; respectively, asindicated in Fig. 3a. In contrast to the previous work [14], the radialboundary at r ¼ lr is defined by a fixed value for U that correspondsto the presence of an interface of a given curvature via the Gibbs-Thomson relation, Eq. (6). This models a sidearm that is situated
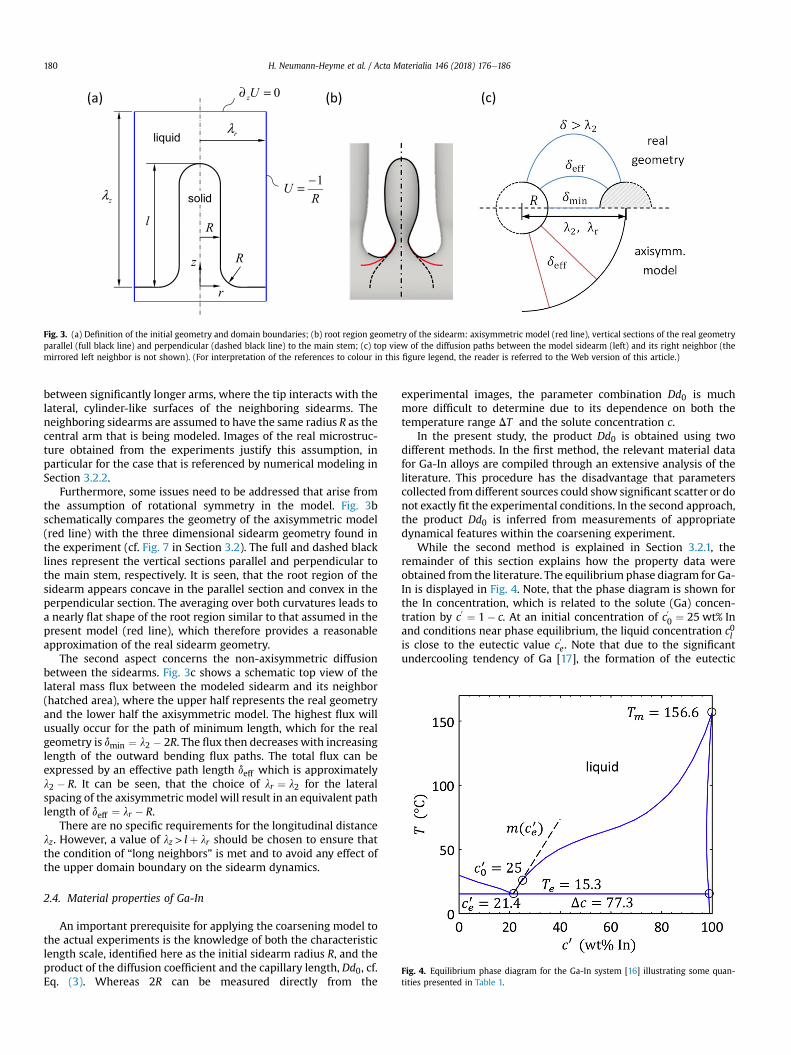
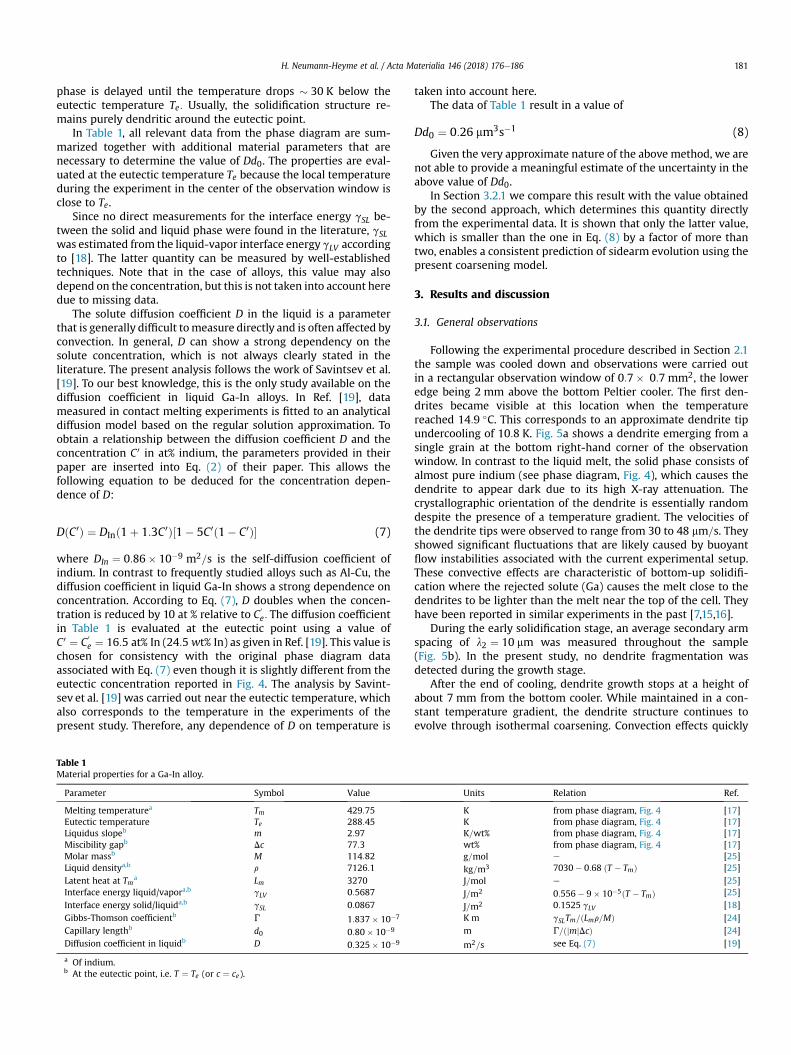
Fig. 3. (a) Definition of the initial geometry and domain boundaries; (b) root region geometry of the sidearm: axisymmetric model (red line), vertical sections of the real geometryparallel (full black line) and perpendicular (dashed black line) to the main stem; (c) top view of the diffusion paths between the model sidearm (left) and its right neighbor (themirrored left neighbor is not shown). (For interpretation of the references to colour in this figure legend, the reader is referred to the Web version of this article.)
Fig. 4. Equilibrium phase diagram for the Ga-In system [16] illustrating some quan-tities presented in Table 1.
H. Neumann-Heyme et al. / Acta Materialia 146 (2018) 176e186180
between significantly longer arms, where the tip interacts with thelateral, cylinder-like surfaces of the neighboring sidearms. Theneighboring sidearms are assumed to have the same radius R as thecentral arm that is being modeled. Images of the real microstruc-ture obtained from the experiments justify this assumption, inparticular for the case that is referenced by numerical modeling inSection 3.2.2.
Furthermore, some issues need to be addressed that arise fromthe assumption of rotational symmetry in the model. Fig. 3bschematically compares the geometry of the axisymmetric model(red line) with the three dimensional sidearm geometry found inthe experiment (cf. Fig. 7 in Section 3.2). The full and dashed blacklines represent the vertical sections parallel and perpendicular tothe main stem, respectively. It is seen, that the root region of thesidearm appears concave in the parallel section and convex in theperpendicular section. The averaging over both curvatures leads toa nearly flat shape of the root region similar to that assumed in thepresent model (red line), which therefore provides a reasonableapproximation of the real sidearm geometry.
The second aspect concerns the non-axisymmetric diffusionbetween the sidearms. Fig. 3c shows a schematic top view of thelateral mass flux between the modeled sidearm and its neighbor(hatched area), where the upper half represents the real geometryand the lower half the axisymmetric model. The highest flux willusually occur for the path of minimum length, which for the realgeometry is dmin ¼ l2 � 2R. The flux then decreases with increasinglength of the outward bending flux paths. The total flux can beexpressed by an effective path length deff which is approximatelyl2 � R. It can be seen, that the choice of lr ¼ l2 for the lateralspacing of the axisymmetric model will result in an equivalent pathlength of deff ¼ lr � R.
There are no specific requirements for the longitudinal distancelz. However, a value of lz > lþ lr should be chosen to ensure thatthe condition of “long neighbors” is met and to avoid any effect ofthe upper domain boundary on the sidearm dynamics.
2.4. Material properties of Ga-In
An important prerequisite for applying the coarsening model tothe actual experiments is the knowledge of both the characteristiclength scale, identified here as the initial sidearm radius R, and theproduct of the diffusion coefficient and the capillary length, Dd0, cf.Eq. (3). Whereas 2R can be measured directly from the
experimental images, the parameter combination Dd0 is muchmore difficult to determine due to its dependence on both thetemperature range DT and the solute concentration c.
In the present study, the product Dd0 is obtained using twodifferent methods. In the first method, the relevant material datafor Ga-In alloys are compiled through an extensive analysis of theliterature. This procedure has the disadvantage that parameterscollected from different sources could show significant scatter or donot exactly fit the experimental conditions. In the second approach,the product Dd0 is inferred from measurements of appropriatedynamical features within the coarsening experiment.
While the second method is explained in Section 3.2.1, theremainder of this section explains how the property data wereobtained from the literature. The equilibrium phase diagram for Ga-In is displayed in Fig. 4. Note, that the phase diagram is shown forthe In concentration, which is related to the solute (Ga) concen-tration by c
0 ¼ 1� c. At an initial concentration of c00 ¼ 25 wt% In
and conditions near phase equilibrium, the liquid concentration c0lis close to the eutectic value c
0e. Note that due to the significant
undercooling tendency of Ga [17], the formation of the eutectic
H. Neumann-Heyme et al. / Acta Materialia 146 (2018) 176e186 181
phase is delayed until the temperature drops � 30 K below theeutectic temperature Te: Usually, the solidification structure re-mains purely dendritic around the eutectic point.
In Table 1, all relevant data from the phase diagram are sum-marized together with additional material parameters that arenecessary to determine the value of Dd0. The properties are eval-uated at the eutectic temperature Te because the local temperatureduring the experiment in the center of the observation window isclose to Te.
Since no direct measurements for the interface energy gSL be-tween the solid and liquid phase were found in the literature, gSLwas estimated from the liquid-vapor interface energy gLV accordingto [18]. The latter quantity can be measured by well-establishedtechniques. Note that in the case of alloys, this value may alsodepend on the concentration, but this is not taken into account heredue to missing data.
The solute diffusion coefficient D in the liquid is a parameterthat is generally difficult tomeasure directly and is often affected byconvection. In general, D can show a strong dependency on thesolute concentration, which is not always clearly stated in theliterature. The present analysis follows the work of Savintsev et al.[19]. To our best knowledge, this is the only study available on thediffusion coefficient in liquid Ga-In alloys. In Ref. [19], datameasured in contact melting experiments is fitted to an analyticaldiffusion model based on the regular solution approximation. Toobtain a relationship between the diffusion coefficient D and theconcentration C0 in at% indium, the parameters provided in theirpaper are inserted into Eq. (2) of their paper. This allows thefollowing equation to be deduced for the concentration depen-dence of D:
DðC0Þ ¼ DInð1þ 1:3C0Þ½1� 5C0ð1� C0Þ� (7)
where DIn ¼ 0:86� 10�9 m2=s is the self-diffusion coefficient ofindium. In contrast to frequently studied alloys such as Al-Cu, thediffusion coefficient in liquid Ga-In shows a strong dependence onconcentration. According to Eq. (7), D doubles when the concen-tration is reduced by 10 at % relative to C
0e: The diffusion coefficient
in Table 1 is evaluated at the eutectic point using a value ofC0 ¼ C
0e ¼ 16:5 at% In (24:5 wt% In) as given in Ref. [19]. This value is
chosen for consistency with the original phase diagram dataassociated with Eq. (7) even though it is slightly different from theeutectic concentration reported in Fig. 4. The analysis by Savint-sev et al. [19] was carried out near the eutectic temperature, whichalso corresponds to the temperature in the experiments of thepresent study. Therefore, any dependence of D on temperature is
Table 1Material properties for a Ga-In alloy.
Parameter Symbol Value
Melting temperaturea Tm 429:75Eutectic temperature Te 288:45Liquidus slopeb m 2:97Miscibility gapb Dc 77:3Molar massb M 114:82Liquid densitya,b r 7126:1Latent heat at Tma Lm 3270Interface energy liquid/vapora,b gLV 0:5687Interface energy solid/liquida,b gSL 0:0867Gibbs-Thomson coefficientb G 1:837� 10�7
Capillary lengthb d0 0:80� 10�9
Diffusion coefficient in liquidb D 0:325� 10�9
a Of indium.b At the eutectic point, i.e. T ¼ Te (or c ¼ ce).
taken into account here.The data of Table 1 result in a value of
Dd0 ¼ 0:26 mm3s�1 (8)
Given the very approximate nature of the above method, we arenot able to provide a meaningful estimate of the uncertainty in theabove value of Dd0.
In Section 3.2.1 we compare this result with the value obtainedby the second approach, which determines this quantity directlyfrom the experimental data. It is shown that only the latter value,which is smaller than the one in Eq. (8) by a factor of more thantwo, enables a consistent prediction of sidearm evolution using thepresent coarsening model.
3. Results and discussion
3.1. General observations
Following the experimental procedure described in Section 2.1the sample was cooled down and observations were carried outin a rectangular observation window of 0:7� 0:7 mm2, the loweredge being 2 mm above the bottom Peltier cooler. The first den-drites became visible at this location when the temperaturereached 14:9 �C. This corresponds to an approximate dendrite tipundercooling of 10:8 K. Fig. 5a shows a dendrite emerging from asingle grain at the bottom right-hand corner of the observationwindow. In contrast to the liquid melt, the solid phase consists ofalmost pure indium (see phase diagram, Fig. 4), which causes thedendrite to appear dark due to its high X-ray attenuation. Thecrystallographic orientation of the dendrite is essentially randomdespite the presence of a temperature gradient. The velocities ofthe dendrite tips were observed to range from 30 to 48 mm=s. Theyshowed significant fluctuations that are likely caused by buoyantflow instabilities associated with the current experimental setup.These convective effects are characteristic of bottom-up solidifi-cation where the rejected solute (Ga) causes the melt close to thedendrites to be lighter than the melt near the top of the cell. Theyhave been reported in similar experiments in the past [7,15,16].
During the early solidification stage, an average secondary armspacing of l2 ¼ 10 mm was measured throughout the sample(Fig. 5b). In the present study, no dendrite fragmentation wasdetected during the growth stage.
After the end of cooling, dendrite growth stops at a height ofabout 7 mm from the bottom cooler. While maintained in a con-stant temperature gradient, the dendrite structure continues toevolve through isothermal coarsening. Convection effects quickly
Units Relation Ref.
K from phase diagram, Fig. 4 [17]K from phase diagram, Fig. 4 [17]K=wt% from phase diagram, Fig. 4 [17]wt% from phase diagram, Fig. 4 [17]g=mol e [25]
kg=m3 7030� 0:68 ðT � TmÞ [25]
J=mol e [25]
J=m2 0:556� 9� 10�5ðT � TmÞ [25]
J=m2 0:1525 gLV [18]K m gSLTm=ðLmr=MÞ [24]m G=ðjmjDcÞ [24]
m2=s see Eq. (7) [19]
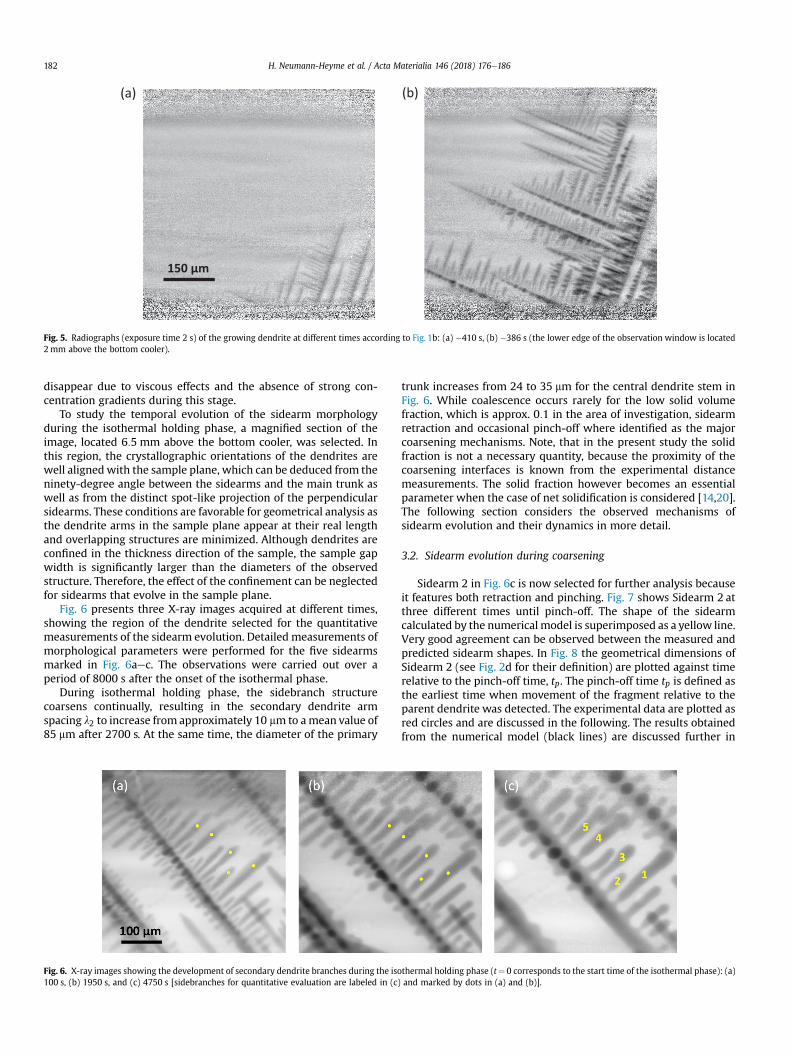
Fig. 5. Radiographs (exposure time 2 s) of the growing dendrite at different times according to Fig. 1b: (a) �410 s, (b) �386 s (the lower edge of the observation window is located2mm above the bottom cooler).
H. Neumann-Heyme et al. / Acta Materialia 146 (2018) 176e186182
disappear due to viscous effects and the absence of strong con-centration gradients during this stage.
To study the temporal evolution of the sidearm morphologyduring the isothermal holding phase, a magnified section of theimage, located 6:5 mm above the bottom cooler, was selected. Inthis region, the crystallographic orientations of the dendrites arewell aligned with the sample plane, which can be deduced from theninety-degree angle between the sidearms and the main trunk aswell as from the distinct spot-like projection of the perpendicularsidearms. These conditions are favorable for geometrical analysis asthe dendrite arms in the sample plane appear at their real lengthand overlapping structures are minimized. Although dendrites areconfined in the thickness direction of the sample, the sample gapwidth is significantly larger than the diameters of the observedstructure. Therefore, the effect of the confinement can be neglectedfor sidearms that evolve in the sample plane.
Fig. 6 presents three X-ray images acquired at different times,showing the region of the dendrite selected for the quantitativemeasurements of the sidearm evolution. Detailed measurements ofmorphological parameters were performed for the five sidearmsmarked in Fig. 6aec. The observations were carried out over aperiod of 8000 s after the onset of the isothermal phase.
During isothermal holding phase, the sidebranch structurecoarsens continually, resulting in the secondary dendrite armspacing l2 to increase from approximately 10 mm to amean value of85 mm after 2700 s. At the same time, the diameter of the primary
Fig. 6. X-ray images showing the development of secondary dendrite branches during the iso100 s, (b) 1950 s, and (c) 4750 s [sidebranches for quantitative evaluation are labeled in (c)
trunk increases from 24 to 35 mm for the central dendrite stem inFig. 6. While coalescence occurs rarely for the low solid volumefraction, which is approx. 0:1 in the area of investigation, sidearmretraction and occasional pinch-off where identified as the majorcoarsening mechanisms. Note, that in the present study the solidfraction is not a necessary quantity, because the proximity of thecoarsening interfaces is known from the experimental distancemeasurements. The solid fraction however becomes an essentialparameter when the case of net solidification is considered [14,20].The following section considers the observed mechanisms ofsidearm evolution and their dynamics in more detail.
3.2. Sidearm evolution during coarsening
Sidearm 2 in Fig. 6c is now selected for further analysis becauseit features both retraction and pinching. Fig. 7 shows Sidearm 2 atthree different times until pinch-off. The shape of the sidearmcalculated by the numerical model is superimposed as a yellow line.Very good agreement can be observed between the measured andpredicted sidearm shapes. In Fig. 8 the geometrical dimensions ofSidearm 2 (see Fig. 2d for their definition) are plotted against timerelative to the pinch-off time, tp. The pinch-off time tp is defined asthe earliest time when movement of the fragment relative to theparent dendrite was detected. The experimental data are plotted asred circles and are discussed in the following. The results obtainedfrom the numerical model (black lines) are discussed further in
thermal holding phase (t¼ 0 corresponds to the start time of the isothermal phase): (a)and marked by dots in (a) and (b)].
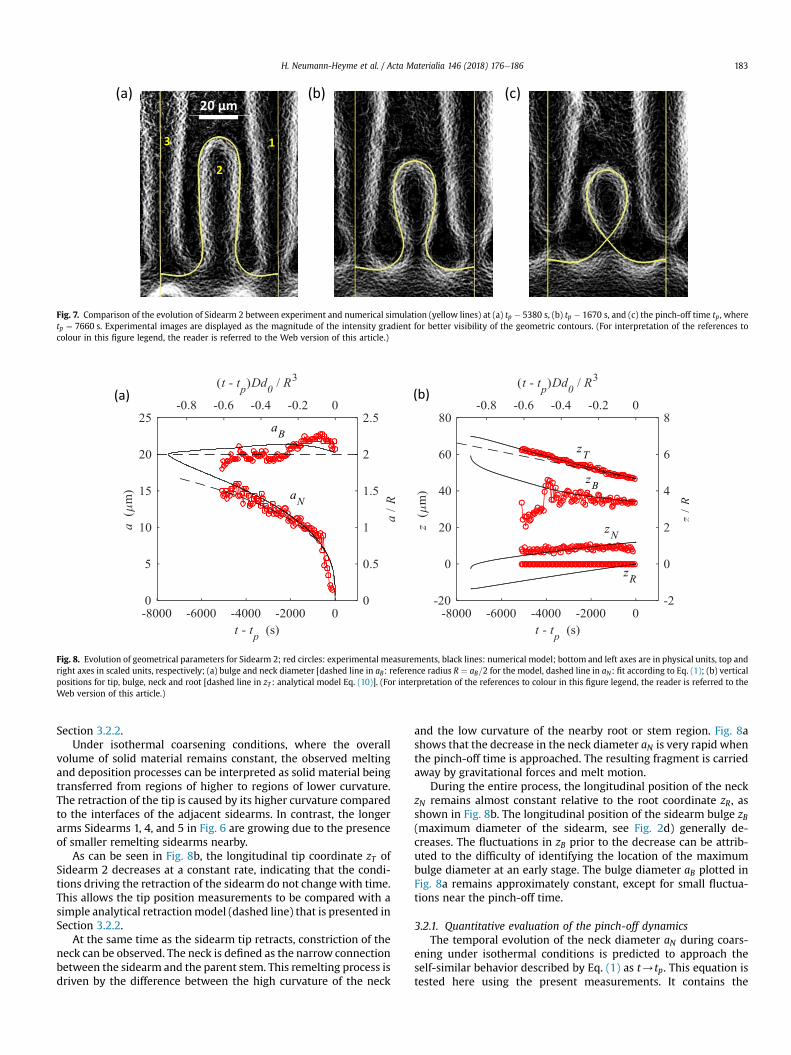
Fig. 7. Comparison of the evolution of Sidearm 2 between experiment and numerical simulation (yellow lines) at (a) tp � 5380 s, (b) tp � 1670 s, and (c) the pinch-off time tp , wheretp ¼ 7660 s. Experimental images are displayed as the magnitude of the intensity gradient for better visibility of the geometric contours. (For interpretation of the references tocolour in this figure legend, the reader is referred to the Web version of this article.)
Fig. 8. Evolution of geometrical parameters for Sidearm 2; red circles: experimental measurements, black lines: numerical model; bottom and left axes are in physical units, top andright axes in scaled units, respectively; (a) bulge and neck diameter [dashed line in aB: reference radius R ¼ aB=2 for the model, dashed line in aN: fit according to Eq. (1); (b) verticalpositions for tip, bulge, neck and root [dashed line in zT : analytical model Eq. (10)]. (For interpretation of the references to colour in this figure legend, the reader is referred to theWeb version of this article.)
H. Neumann-Heyme et al. / Acta Materialia 146 (2018) 176e186 183
Section 3.2.2.Under isothermal coarsening conditions, where the overall
volume of solid material remains constant, the observed meltingand deposition processes can be interpreted as solid material beingtransferred from regions of higher to regions of lower curvature.The retraction of the tip is caused by its higher curvature comparedto the interfaces of the adjacent sidearms. In contrast, the longerarms Sidearms 1, 4, and 5 in Fig. 6 are growing due to the presenceof smaller remelting sidearms nearby.
As can be seen in Fig. 8b, the longitudinal tip coordinate zT ofSidearm 2 decreases at a constant rate, indicating that the condi-tions driving the retraction of the sidearm do not change with time.This allows the tip position measurements to be compared with asimple analytical retractionmodel (dashed line) that is presented inSection 3.2.2.
At the same time as the sidearm tip retracts, constriction of theneck can be observed. The neck is defined as the narrow connectionbetween the sidearm and the parent stem. This remelting process isdriven by the difference between the high curvature of the neck
and the low curvature of the nearby root or stem region. Fig. 8ashows that the decrease in the neck diameter aN is very rapid whenthe pinch-off time is approached. The resulting fragment is carriedaway by gravitational forces and melt motion.
During the entire process, the longitudinal position of the neckzN remains almost constant relative to the root coordinate zR, asshown in Fig. 8b. The longitudinal position of the sidearm bulge zB(maximum diameter of the sidearm, see Fig. 2d) generally de-creases. The fluctuations in zB prior to the decrease can be attrib-uted to the difficulty of identifying the location of the maximumbulge diameter at an early stage. The bulge diameter aB plotted inFig. 8a remains approximately constant, except for small fluctua-tions near the pinch-off time.
3.2.1. Quantitative evaluation of the pinch-off dynamicsThe temporal evolution of the neck diameter aN during coars-
ening under isothermal conditions is predicted to approach theself-similar behavior described by Eq. (1) as t/tp. This equation istested here using the present measurements. It contains the
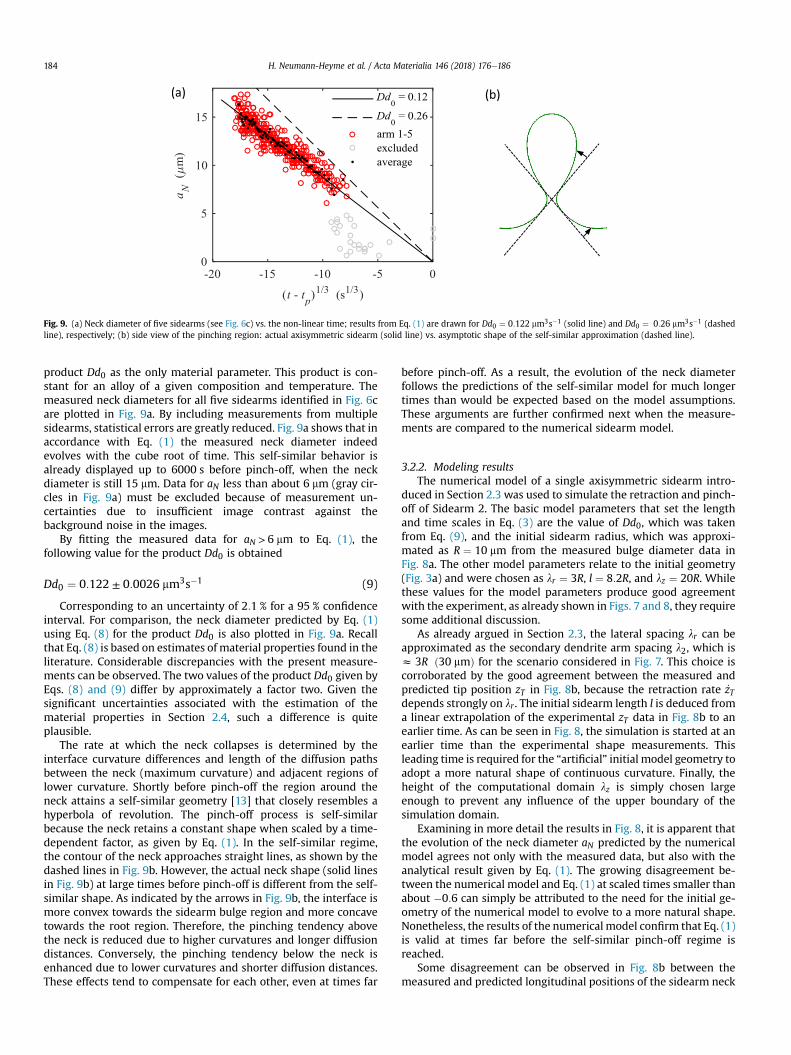
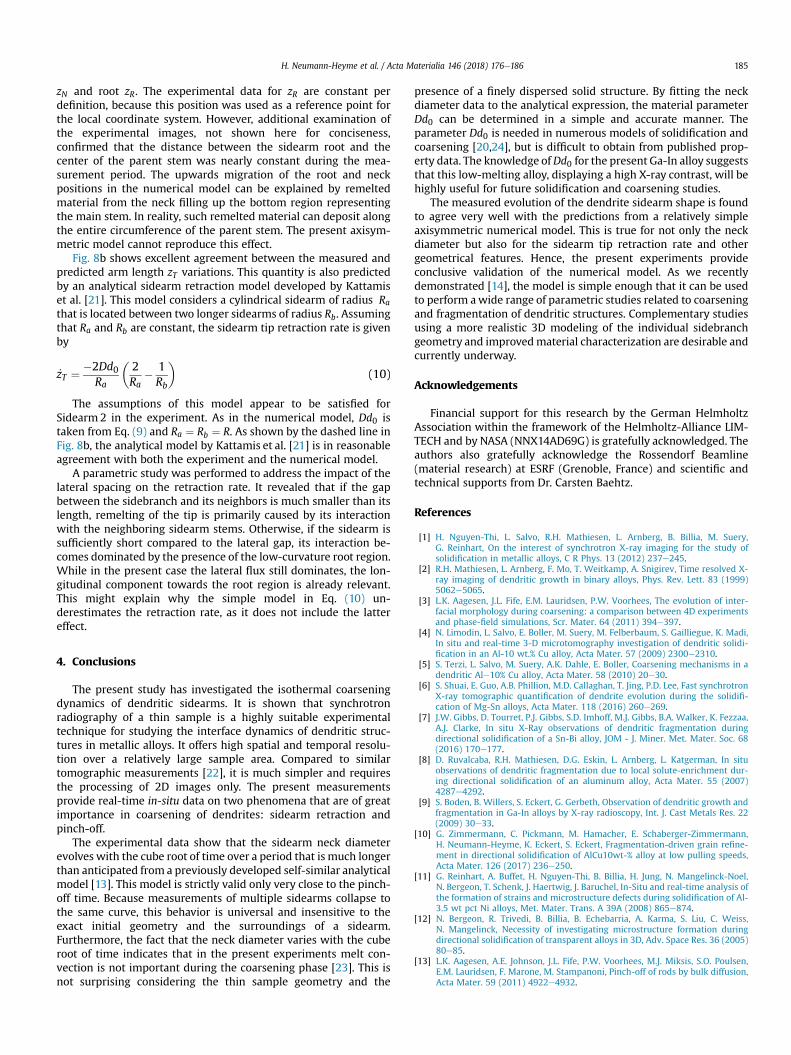
Fig. 9. (a) Neck diameter of five sidearms (see Fig. 6c) vs. the non-linear time; results from Eq. (1) are drawn for Dd0 ¼ 0:122 mm3s�1 (solid line) and Dd0 ¼ 0:26 mm3s�1 (dashedline), respectively; (b) side view of the pinching region: actual axisymmetric sidearm (solid line) vs. asymptotic shape of the self-similar approximation (dashed line).
H. Neumann-Heyme et al. / Acta Materialia 146 (2018) 176e186184
product Dd0 as the only material parameter. This product is con-stant for an alloy of a given composition and temperature. Themeasured neck diameters for all five sidearms identified in Fig. 6care plotted in Fig. 9a. By including measurements from multiplesidearms, statistical errors are greatly reduced. Fig. 9a shows that inaccordance with Eq. (1) the measured neck diameter indeedevolves with the cube root of time. This self-similar behavior isalready displayed up to 6000 s before pinch-off, when the neckdiameter is still 15 mm. Data for aN less than about 6 mm (gray cir-cles in Fig. 9a) must be excluded because of measurement un-certainties due to insufficient image contrast against thebackground noise in the images.
By fitting the measured data for aN >6 mm to Eq. (1), thefollowing value for the product Dd0 is obtained
Dd0 ¼ 0:122 ± 0:0026 mm3s�1 (9)
Corresponding to an uncertainty of 2:1 % for a 95 % confidenceinterval. For comparison, the neck diameter predicted by Eq. (1)using Eq. (8) for the product Dd0 is also plotted in Fig. 9a. Recallthat Eq. (8) is based on estimates of material properties found in theliterature. Considerable discrepancies with the present measure-ments can be observed. The two values of the product Dd0 given byEqs. (8) and (9) differ by approximately a factor two. Given thesignificant uncertainties associated with the estimation of thematerial properties in Section 2.4, such a difference is quiteplausible.
The rate at which the neck collapses is determined by theinterface curvature differences and length of the diffusion pathsbetween the neck (maximum curvature) and adjacent regions oflower curvature. Shortly before pinch-off the region around theneck attains a self-similar geometry [13] that closely resembles ahyperbola of revolution. The pinch-off process is self-similarbecause the neck retains a constant shape when scaled by a time-dependent factor, as given by Eq. (1). In the self-similar regime,the contour of the neck approaches straight lines, as shown by thedashed lines in Fig. 9b. However, the actual neck shape (solid linesin Fig. 9b) at large times before pinch-off is different from the self-similar shape. As indicated by the arrows in Fig. 9b, the interface ismore convex towards the sidearm bulge region and more concavetowards the root region. Therefore, the pinching tendency abovethe neck is reduced due to higher curvatures and longer diffusiondistances. Conversely, the pinching tendency below the neck isenhanced due to lower curvatures and shorter diffusion distances.These effects tend to compensate for each other, even at times far
before pinch-off. As a result, the evolution of the neck diameterfollows the predictions of the self-similar model for much longertimes than would be expected based on the model assumptions.These arguments are further confirmed next when the measure-ments are compared to the numerical sidearm model.
3.2.2. Modeling resultsThe numerical model of a single axisymmetric sidearm intro-
duced in Section 2.3 was used to simulate the retraction and pinch-off of Sidearm 2. The basic model parameters that set the lengthand time scales in Eq. (3) are the value of Dd0, which was takenfrom Eq. (9), and the initial sidearm radius, which was approxi-mated as R ¼ 10 mm from the measured bulge diameter data inFig. 8a. The other model parameters relate to the initial geometry(Fig. 3a) and were chosen as lr ¼ 3R, l ¼ 8:2R, and lz ¼ 20R. Whilethese values for the model parameters produce good agreementwith the experiment, as already shown in Figs. 7 and 8, they requiresome additional discussion.
As already argued in Section 2.3, the lateral spacing lr can beapproximated as the secondary dendrite arm spacing l2, which isz 3R ð30 mmÞ for the scenario considered in Fig. 7. This choice iscorroborated by the good agreement between the measured andpredicted tip position zT in Fig. 8b, because the retraction rate _zTdepends strongly on lr . The initial sidearm length l is deduced froma linear extrapolation of the experimental zT data in Fig. 8b to anearlier time. As can be seen in Fig. 8, the simulation is started at anearlier time than the experimental shape measurements. Thisleading time is required for the “artificial” initial model geometry toadopt a more natural shape of continuous curvature. Finally, theheight of the computational domain lz is simply chosen largeenough to prevent any influence of the upper boundary of thesimulation domain.
Examining in more detail the results in Fig. 8, it is apparent thatthe evolution of the neck diameter aN predicted by the numericalmodel agrees not only with the measured data, but also with theanalytical result given by Eq. (1). The growing disagreement be-tween the numerical model and Eq. (1) at scaled times smaller thanabout �0:6 can simply be attributed to the need for the initial ge-ometry of the numerical model to evolve to a more natural shape.Nonetheless, the results of the numerical model confirm that Eq. (1)is valid at times far before the self-similar pinch-off regime isreached.
Some disagreement can be observed in Fig. 8b between themeasured and predicted longitudinal positions of the sidearm neck
H. Neumann-Heyme et al. / Acta Materialia 146 (2018) 176e186 185
zN and root zR. The experimental data for zR are constant perdefinition, because this position was used as a reference point forthe local coordinate system. However, additional examination ofthe experimental images, not shown here for conciseness,confirmed that the distance between the sidearm root and thecenter of the parent stem was nearly constant during the mea-surement period. The upwards migration of the root and neckpositions in the numerical model can be explained by remeltedmaterial from the neck filling up the bottom region representingthe main stem. In reality, such remelted material can deposit alongthe entire circumference of the parent stem. The present axisym-metric model cannot reproduce this effect.
Fig. 8b shows excellent agreement between the measured andpredicted arm length zT variations. This quantity is also predictedby an analytical sidearm retraction model developed by Kattamiset al. [21]. This model considers a cylindrical sidearm of radius Rathat is located between two longer sidearms of radius Rb. Assumingthat Ra and Rb are constant, the sidearm tip retraction rate is givenby
_zT ¼ �2Dd0Ra
�2Ra
� 1Rb
(10)
The assumptions of this model appear to be satisfied forSidearm 2 in the experiment. As in the numerical model, Dd0 istaken from Eq. (9) and Ra ¼ Rb ¼ R. As shown by the dashed line inFig. 8b, the analytical model by Kattamis et al. [21] is in reasonableagreement with both the experiment and the numerical model.
A parametric study was performed to address the impact of thelateral spacing on the retraction rate. It revealed that if the gapbetween the sidebranch and its neighbors is much smaller than itslength, remelting of the tip is primarily caused by its interactionwith the neighboring sidearm stems. Otherwise, if the sidearm issufficiently short compared to the lateral gap, its interaction be-comes dominated by the presence of the low-curvature root region.While in the present case the lateral flux still dominates, the lon-gitudinal component towards the root region is already relevant.This might explain why the simple model in Eq. (10) un-derestimates the retraction rate, as it does not include the lattereffect.
4. Conclusions
The present study has investigated the isothermal coarseningdynamics of dendritic sidearms. It is shown that synchrotronradiography of a thin sample is a highly suitable experimentaltechnique for studying the interface dynamics of dendritic struc-tures in metallic alloys. It offers high spatial and temporal resolu-tion over a relatively large sample area. Compared to similartomographic measurements [22], it is much simpler and requiresthe processing of 2D images only. The present measurementsprovide real-time in-situ data on two phenomena that are of greatimportance in coarsening of dendrites: sidearm retraction andpinch-off.
The experimental data show that the sidearm neck diameterevolves with the cube root of time over a period that is much longerthan anticipated from a previously developed self-similar analyticalmodel [13]. This model is strictly valid only very close to the pinch-off time. Because measurements of multiple sidearms collapse tothe same curve, this behavior is universal and insensitive to theexact initial geometry and the surroundings of a sidearm.Furthermore, the fact that the neck diameter varies with the cuberoot of time indicates that in the present experiments melt con-vection is not important during the coarsening phase [23]. This isnot surprising considering the thin sample geometry and the
presence of a finely dispersed solid structure. By fitting the neckdiameter data to the analytical expression, the material parameterDd0 can be determined in a simple and accurate manner. Theparameter Dd0 is needed in numerous models of solidification andcoarsening [20,24], but is difficult to obtain from published prop-erty data. The knowledge ofDd0 for the present Ga-In alloy suggeststhat this low-melting alloy, displaying a high X-ray contrast, will behighly useful for future solidification and coarsening studies.
The measured evolution of the dendrite sidearm shape is foundto agree very well with the predictions from a relatively simpleaxisymmetric numerical model. This is true for not only the neckdiameter but also for the sidearm tip retraction rate and othergeometrical features. Hence, the present experiments provideconclusive validation of the numerical model. As we recentlydemonstrated [14], the model is simple enough that it can be usedto perform awide range of parametric studies related to coarseningand fragmentation of dendritic structures. Complementary studiesusing a more realistic 3D modeling of the individual sidebranchgeometry and improvedmaterial characterization are desirable andcurrently underway.
Acknowledgements
Financial support for this research by the German HelmholtzAssociation within the framework of the Helmholtz-Alliance LIM-TECH and by NASA (NNX14AD69G) is gratefully acknowledged. Theauthors also gratefully acknowledge the Rossendorf Beamline(material research) at ESRF (Grenoble, France) and scientific andtechnical supports from Dr. Carsten Baehtz.
References
[1] H. Nguyen-Thi, L. Salvo, R.H. Mathiesen, L. Arnberg, B. Billia, M. Suery,G. Reinhart, On the interest of synchrotron X-ray imaging for the study ofsolidification in metallic alloys, C R Phys. 13 (2012) 237e245.
[2] R.H. Mathiesen, L. Arnberg, F. Mo, T. Weitkamp, A. Snigirev, Time resolved X-ray imaging of dendritic growth in binary alloys, Phys. Rev. Lett. 83 (1999)5062e5065.
[3] L.K. Aagesen, J.L. Fife, E.M. Lauridsen, P.W. Voorhees, The evolution of inter-facial morphology during coarsening: a comparison between 4D experimentsand phase-field simulations, Scr. Mater. 64 (2011) 394e397.
[4] N. Limodin, L. Salvo, E. Boller, M. Suery, M. Felberbaum, S. Gailliegue, K. Madi,In situ and real-time 3-D microtomography investigation of dendritic solidi-fication in an Al-10 wt.% Cu alloy, Acta Mater. 57 (2009) 2300e2310.
[5] S. Terzi, L. Salvo, M. Suery, A.K. Dahle, E. Boller, Coarsening mechanisms in adendritic Ale10% Cu alloy, Acta Mater. 58 (2010) 20e30.
[6] S. Shuai, E. Guo, A.B. Phillion, M.D. Callaghan, T. Jing, P.D. Lee, Fast synchrotronX-ray tomographic quantification of dendrite evolution during the solidifi-cation of Mg-Sn alloys, Acta Mater. 118 (2016) 260e269.
[7] J.W. Gibbs, D. Tourret, P.J. Gibbs, S.D. Imhoff, M.J. Gibbs, B.A. Walker, K. Fezzaa,A.J. Clarke, In situ X-Ray observations of dendritic fragmentation duringdirectional solidification of a Sn-Bi alloy, JOM - J. Miner. Met. Mater. Soc. 68(2016) 170e177.
[8] D. Ruvalcaba, R.H. Mathiesen, D.G. Eskin, L. Arnberg, L. Katgerman, In situobservations of dendritic fragmentation due to local solute-enrichment dur-ing directional solidification of an aluminum alloy, Acta Mater. 55 (2007)4287e4292.
[9] S. Boden, B. Willers, S. Eckert, G. Gerbeth, Observation of dendritic growth andfragmentation in Ga-In alloys by X-ray radioscopy, Int. J. Cast Metals Res. 22(2009) 30e33.
[10] G. Zimmermann, C. Pickmann, M. Hamacher, E. Schaberger-Zimmermann,H. Neumann-Heyme, K. Eckert, S. Eckert, Fragmentation-driven grain refine-ment in directional solidification of AlCu10wt-% alloy at low pulling speeds,Acta Mater. 126 (2017) 236e250.
[11] G. Reinhart, A. Buffet, H. Nguyen-Thi, B. Billia, H. Jung, N. Mangelinck-Noel,N. Bergeon, T. Schenk, J. Haertwig, J. Baruchel, In-Situ and real-time analysis ofthe formation of strains and microstructure defects during solidification of Al-3.5 wt pct Ni alloys, Met. Mater. Trans. A 39A (2008) 865e874.
[12] N. Bergeon, R. Trivedi, B. Billia, B. Echebarria, A. Karma, S. Liu, C. Weiss,N. Mangelinck, Necessity of investigating microstructure formation duringdirectional solidification of transparent alloys in 3D, Adv. Space Res. 36 (2005)80e85.
[13] L.K. Aagesen, A.E. Johnson, J.L. Fife, P.W. Voorhees, M.J. Miksis, S.O. Poulsen,E.M. Lauridsen, F. Marone, M. Stampanoni, Pinch-off of rods by bulk diffusion,Acta Mater. 59 (2011) 4922e4932.

H. Neumann-Heyme et al. / Acta Materialia 146 (2018) 176e186186
[14] H. Neumann-Heyme, K. Eckert, C. Beckermann, Dendrite fragmentation inalloy solidification due to sidearm pinch-off, Phys. Rev. E 92 (2015).
[15] S. Boden, S. Eckert, B. Willers, G. Gerbeth, X-ray radioscopic visualization ofthe solutal convection during solidification of a Ga-30 wt pct in alloy, Met.Mater. Trans. A 39A (2008) 613e623.
[16] N. Shevchenko, S. Boden, G. Gerbeth, S. Eckert, Chimney formation in solidi-fying Ga-25wt pct in alloys under the influence of thermosolutal melt con-vection, Met. Mater. Trans. A 44A (2013) 3797e3808.
[17] T. Anderson, I. Ansara, The GaeIn(galliumeindium) system, J. Phase Equilibria12 (1991) 64e72.
[18] W. Tyson, W. Miller, Surface free energies of solid metals: estimation fromliquid surface tension measurements, Surf. Sci. 62 (1977) 267e276.
[19] P.A. Savintsev, A.A. Akhkubekov, K.A. Getazheev, V.I. Rogov, V.S. Savvin,Determination of diffusion coefficients and activity rates for gallium-indiumsystem by contact melting method, Sov. Phys. J. 53 (1971).
[20] H. Neumann-Heyme, K. Eckert, C. Beckermann, General evolution equation forthe specific interface area of dendrites during alloy solidification, Acta Mater.140 (2017) 87e96.
[21] J.J. Reeves, T.Z. Kattamis, Model for isothermal dendritic coarsening, Scr. Met.Mater. 5 (1971) 223.
[22] J. Zhang, S.O. Poulsen, J.W. Gibbs, P.W. Voorhees, H.F. Poulsen, Determiningmaterial parameters using phase-field simulations and experiments, ActaMater. 129 (2017) 229e238.
[23] H.-J. Diepers, C. Beckermann, I. Steinbach, Simulation of convection andripening in a binary alloy mush using the phase-field method, Acta Mater. 47(1999) 3663e3678.
[24] J.A. Dantzig, M. Rappaz, Solidification, EPFL Press, 2009.[25] W.F. Gale, T.C. Totemeier, Smithells Metals Reference Book, Butterworth-
Heinemann, 2003.