Coalition tax policy
18
Institute for Public Policy Research September 2011 © IPPR 2011 Briefing Kayte Lawton coalition tax policy Institute for Public Policy Research
Transcript of Coalition tax policy
8/3/2019 Coalition tax policy
http://slidepdf.com/reader/full/coalition-tax-policy 1/18
Institute for Public Policy Research
September 2011
© IPPR 2011
Briefing
Kayte Lawton
coalition
tax policy
Institute for Public Policy Research

8/3/2019 Coalition tax policy
http://slidepdf.com/reader/full/coalition-tax-policy 2/18
About the Author
Kayt Lawto is a Senior Research Fellow at IPPR.
About IPPr
IPPR, the Institute for Public Policy Research, is the
UK’s leading progressive thinktank. We produce
rigorous research and innovative policy ideas for a fair,
democratic and sustainable world.
We are open and independent in how we work, and
with ofces in London and the North of England, IPPR
spans a full range of local and national policy debates.
Our international partnerships extend IPPR’s inuence
and reputation across the world.
IPPR
4th Floor
14 Buckingham Street
London WC2N 6DF
T: +44 (0)20 7470 6100
www.ippr.org
Registered charity no. 800065
This paper was rst published in September 2011. © 2011
The contents and opinions expressed in this paper are
those of the author only. They do not necessarily represent
the view of directors or trustees of IPPR.
SMaRt iDEaS fr cHanGE
8/3/2019 Coalition tax policy
http://slidepdf.com/reader/full/coalition-tax-policy 3/18
IPPR | Coalition tax policy
IntroductionOnce again, tax is in the news. A erce debate is raging about the wisdom of the 50 per
cent top rate of income tax, while the Coalition government is committed to raising the
income tax personal allowance to £10,000.
This paper considers the arguments for three specic proposals for reforming the personal
tax system:
increasing the personal allowanceremoving the 50 per cent tax rate on top incomes
introducing a tax on high-value properties (a ‘mansion tax’).
The paper assesses both the economic basis for these proposals and the extent to
which they could promote greater social justice by contributing to a more progressive
tax system. Before discussing the particular merits of the three tax reform proposals, it is
worth briey setting out some general principles of taxation against which we might judge
these proposals. These are outlined in box 1 below.
Box 1: Principles of good taxation
Collection and compliance costs should be kept to a minimum, which is
easier to achieve in a simple and transparent tax system
Broadly, the tax system should treat similar people and activities in the sameway, although this can be difcult to achieve in practice
The negative effects of tax on welfare and efciency, such as deadweight
costs, should be minimised
Source: Maxwell and Vigor (2005); Mirrlees Review (200)
•
•
•
These are general principles which apply, regardless of the particular objectives that
different tax systems try to achieve. In addition, this paper argues that the UK tax
system should have three further goals. First, it should provide a sustainable source of
revenue to fund long-term investment in public services, infrastructure and social security
payments. Sustainability requires a broad tax base with revenue raised from a range of
different economic activities. The risks of relying too heavily on one source of revenue aredemonstrated by the considerable fall in tax receipts following the nancial crash of 2008.
Second, the overall tax system should be as progressive as possible while meeting the
requirements of simplicity, equity, efciency and sustainability. Clearly the balance between
these competing objectives is a matter of political choice, but this paper is based on the
premise that reforms should aim to at least maintain, if not increase, the existing level
of progressivity in the tax system rather than diminish it. This should apply across the
system as a whole; it does not require that every individual tax operates in a progressive
way. Importantly, the point of a progressive tax system is not to create a burden on the
rich; rather, the goal is to use the tax receipts generated from wealthier individuals to
improve the outcomes of the less well-off. Third, the tax system should seek to maximise
tax receipts within the constraints of economic efciency, simplicity and sustainability.
Kenworthy (2011) stresses that the total amount of tax raised can be just as important asthe progressivity of the system, since a progressive system that raises too little will not
provide sufcient resources to properly pursue social justice.
We now turn to an examination of the three tax reform proposals under consideration.
••
•
8/3/2019 Coalition tax policy
http://slidepdf.com/reader/full/coalition-tax-policy 4/18
IPPR | Coalition tax policy2
. Increasing the income tax personal allowancesRaising the personal allowance for income tax to £10,000 has been a agship Liberal
Democrat policy since 2009, when it replaced their previous plan to cut the basic rate of
income tax by 4 percentage points. Raising the personal allowance to £10,000 affects
primarily working-age people (those aged 16 to 64), since people aged 65 and above
already have personal allowances close to or above that level 1.
After the 2010 general election, the £10,000 personal allowance proposal became
Coalition policy (HM Government 2010). There is no timescale for achieving this, withthe 2011 stating that ‘the personal allowance will increase from 2013-14 by at least the
equivalent of the RPI, until the government’s goal of increasing the personal allowance to
£10,000 is achieved’ (HM Treasury 2011: 52). The longer the government takes to raise
the allowance to £10,000, the less value this nominal gure will have in real terms. Liberal
Democrat Treasury Minister, Danny Alexander, has recently said that he would like to see
the allowance raised even further, so that anyone working full time on the minimum wage
would not pay income tax, equivalent to an allowance of around £12,500 2.
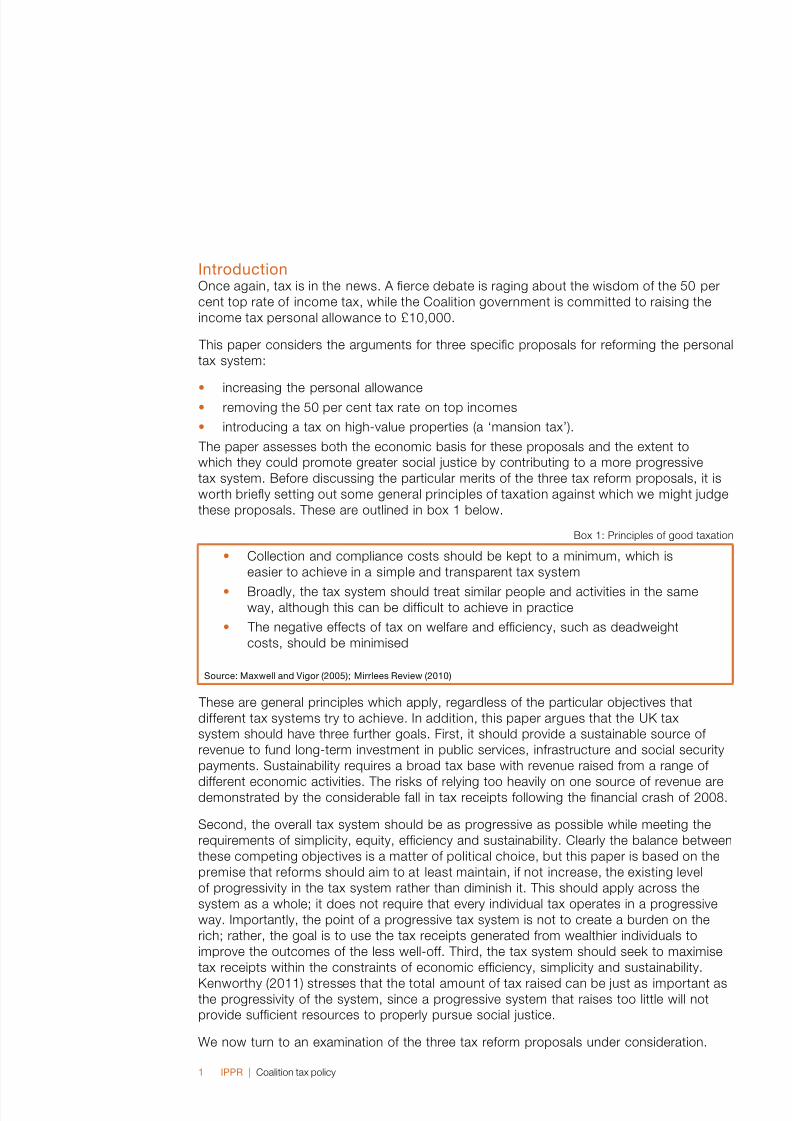
Nevertheless, in line with its commitment in the Coalition agreement, the government
increased the personal allowance by £1,000 to £7,475 in 2011-12, and by a further £630
in 2012-13 so that the allowance in that tax year will stand at £8,105 (HM Treasury 2010).
Table 1 sets out the projected costs of these increases. The total value of the combined
increase for basic rate taxpayers with incomes over £8,105 will be £326 a year in 2012-13, or £6.27 a week (compared to an allowance of £6,475 in 2010-11).
Table 1: Estimated cost of announced increases in the personal allowance
2011-12 2012-13 2013-14
Budget 2010: personal allowance increased by
£1,000 in 2011-12 to £7,475
£3.34bn £3.58bn £3.62bn
Budget 2011: personal allowance increase by
£630 in 2012-13 to £8,105
— £1.05bn £1.21bn
Total cost of combined measures £3.34bn £4.63bn £4.83bn
Source: HM Treasury (20)
In 2011-12, the benet of the increase in the personal allowance to higher rate taxpayers
was offset by a reduction of £2,400 in the basic rate limit – the amount an individual can
earn above the personal allowance before the higher rate of tax applies. Consequently,
higher rate taxpayers did not gain anything. In 2012-13, the basic rate limit will be reduced
by £630, meaning that there will be no change in the higher rate threshold (which is the
sum of the personal allowance and the basic rate limit). Therefore, all taxpayers earning
between £8,105 and £115,000 will gain £48 a year 3.
In 20-2, the personal allowance is £9,940 for individuals aged 65 to 74; and £0,090 for individuals aged75 and over. However, these additional allowances are gradually withdrawn once income exceeds £24,000, sopeople over 65 with incomes above that will level would benet from an increase in the personal allowance.
2 See http://www.newstatesman.com/blogs/the-staggers/20/09/alexander-treasury-chief. The personalallowance would need to be £2,646 in order for a minimum wage worker working 40 hours a week to be liftedout of income tax altogether, on October adult minimum wage rate of £6.08 an hour.
From 200-, the value of the personal allowance is reduced by £ for each £2 of income above £00,000.

8/3/2019 Coalition tax policy
http://slidepdf.com/reader/full/coalition-tax-policy 5/18
IPPR | Coalition tax policy
Table 2: Income tax rates and allowances, 2010-2011 to 2012-13
2010-11 2011-12 2012-13
Personal allowance £6,475 £7,475 £8,105
Basic rate limit £37,400 £35,000 £34,370
Higher rate threshold £43,875 £42,475 £42,475
Additional rate threshold £150,000 £150,000 £150,000
Source: HM Treasury (20)
The Coalition argues that raising the personal allowance achieves two goals. First, it
demonstrates ‘fairness’ by removing many low earners from income tax altogether and
reducing the tax bills of many low and middle income households. The combined changes
to the personal allowance announced by the Coalition government are estimated to take
1.1 million people out of income tax altogether (HM Treasury 2011). Second, the Coalition
argues that a more generous allowance improves work incentives for low earners by
increasing the value of their take-home pay. This dovetails with the Coalition’s benet
reform programme designed to create a simpler means-tested ‘universal credit’ with lower
marginal deduction rates for low earners in receipt of nancial support.
While the policy of raising the personal allowance to £10,000 may appear attractive on these
grounds, there are important criticisms of the progressivity and efciency of such a move.
Raising the allowance is regressive in its impact since it is a broad tax cut that increases
the incomes of wealthier families by a greater proportion than lower income families, on
average. Using the IPPR Tax-Benet Model 4, we have modelled two illustrative increases in
the personal allowance. First, we model the impact of increasing the personal allowance to
£10,000 from £7,475 in 2011-12. Second, we model the impact of increasing the allowance
to £12,500, in line with the aspiration outlined by Danny Alexander. In both cases, we have
assumed that these increases are accompanied by a commensurate reduction in the basic
rate limit, leaving the higher rate threshold unchanged5 , as set out in table 3.
Table 3: Parameters used to model the impact of illustrative increases in the personal allowance
Current 2011-12
system
Modelled system 1 Modelled system 2
Personal allowance £7,475 £10,000 £12,500
Basic rate limit £35,000 £32,475 £29,975
Higher rate threshold £42,475 £42,475 £42,475
Additional rate threshold £150,000 £150,000 £150,000
Annual gain to taxpayer
with earnings above
the modelled personal
allowance and below
£100,000
— £505 £1,005
4 The IPPR Tax-Benet Model uses data from the Family Resources Survey to assess the impact of tax andbenet changes on different types of families.
5 In our modelling, this produces a considerable gain for households in the top income decile. In practice, thiscould be offset by lowering the higher rate threshold.
8/3/2019 Coalition tax policy
http://slidepdf.com/reader/full/coalition-tax-policy 6/18
IPPR | Coalition tax policy4
In both modelled systems, anyone earning less than the existing personal allowance of
£7,475 receives no benet from the increase in the allowance. Those earning between
£7,475 and the modelled personal allowance gain a proportion of the maximum amount
set out in table 3.
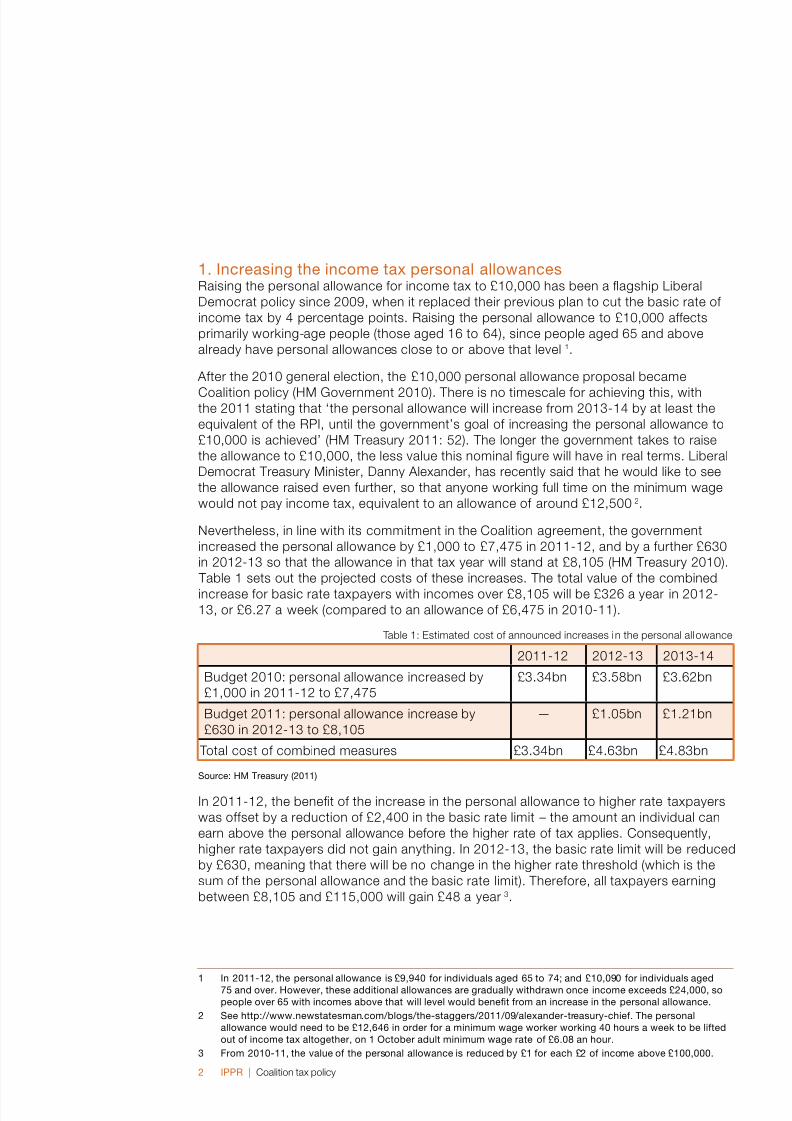
Figures 1 and 2 show the distributional impact of the modelled systems for households,
rather than for individual earners. Household income comes from many sources, including
post-tax earnings from one or more adults, benets and private pensions. In the charts,
the bars show the impact on household income in percentage terms and the line showsthe impact in cash terms.
Figure 1: Distributional impact of raising the personal allowance to £10,000 in 2011-12
Source: Authors’ calculations using the IPPR tax-benet model
On average, households in every income decile gain something from both illustrative
changes. In both cases, the percentage terms gains are lowest for the poorest 10 per cent
of households and rise further up the distribution until the 7th and 8th deciles, then fall for
the richest fth of households. For example, in gure 1, the average gain for households in
the 7th decile are £16 a week, or 2.1 per cent of their income, compared to a gain of £4
for households in the 3rd income decile. The poorest 10 per cent of households gain very
little in both simulations – just 72p a week if the allowance is raised to £10,000; and £1 if
the allowance rises to £12,500. Overall, households in the bottom half of the distribution
(not just the poorest households) do less well than those in the top half of the distribution
in both simulations.
0
5
10
15
20
0.0
0.5
1.0
1.5
2.0
2.5
C h a n g e i n n e t i n c o
m e ( £ )
C h a n g e i n n e t i n c o m e ( % )
Household income decile
8/3/2019 Coalition tax policy
http://slidepdf.com/reader/full/coalition-tax-policy 7/18
IPPR | Coalition tax policy5
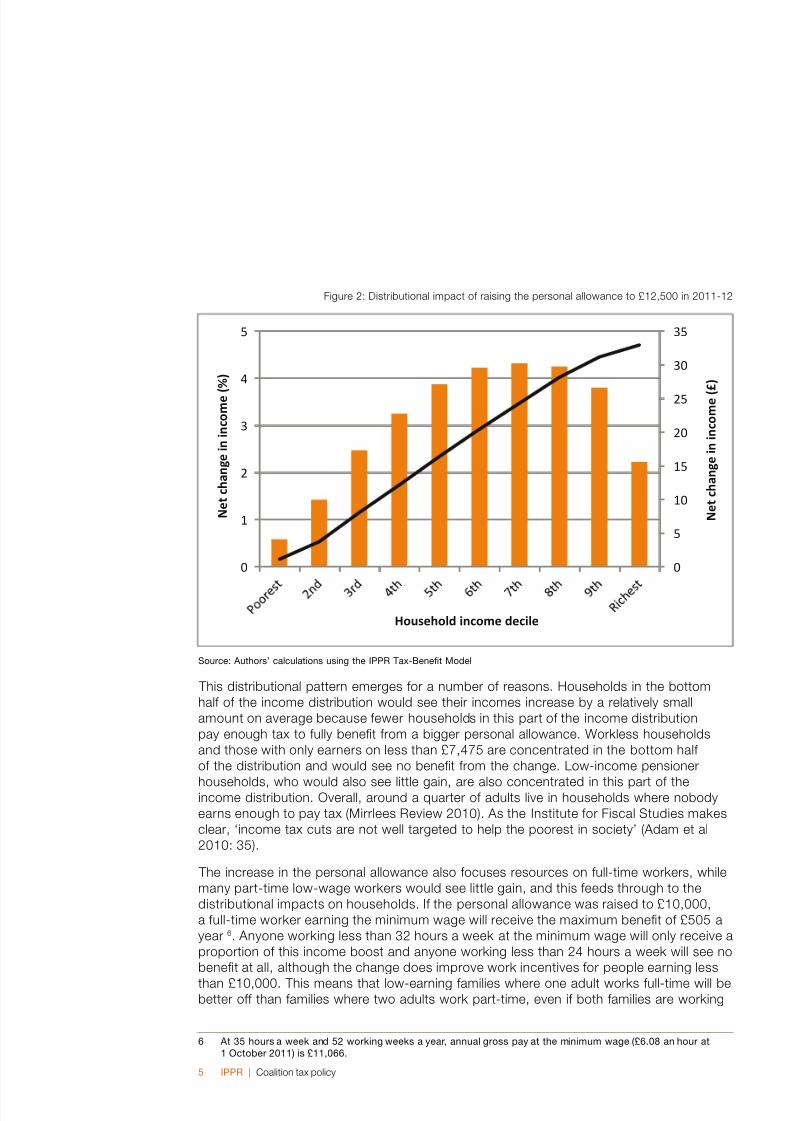
Figure 2: Distributional impact of raising the personal allowance to £12,500 in 2011-12
Source: Authors’ calculations using the IPPR Tax-Benet Model
This distributional pattern emerges for a number of reasons. Households in the bottom
half of the income distribution would see their incomes increase by a relatively small
amount on average because fewer households in this part of the income distribution
pay enough tax to fully benet from a bigger personal allowance. Workless households
and those with only earners on less than £7,475 are concentrated in the bottom half
of the distribution and would see no benet from the change. Low-income pensioner
households, who would also see little gain, are also concentrated in this part of theincome distribution. Overall, around a quarter of adults live in households where nobody
earns enough to pay tax (Mirrlees Review 2010). As the Institute for Fiscal Studies makes
clear, ‘income tax cuts are not well targeted to help the poorest in society’ (Adam et al
2010: 35).
The increase in the personal allowance also focuses resources on full-time workers, while
many part-time low-wage workers would see little gain, and this feeds through to the
distributional impacts on households. If the personal allowance was raised to £10,000,
a full-time worker earning the minimum wage will receive the maximum benet of £505 a
year 6. Anyone working less than 32 hours a week at the minimum wage will only receive a
proportion of this income boost and anyone working less than 24 hours a week will see no
benet at all, although the change does improve work incentives for people earning less
than £10,000. This means that low-earning families where one adult works full-time will bebetter off than families where two adults work part-time, even if both families are working
6 At 5 hours a week and 52 working weeks a year, annual gross pay at the minimum wage (£6.08 an hour at October 20) is £,066.
0
5
10
15
20
25
30
35
0
1
2
3
4
5
N e t c h a n g e i n i n c o m e ( £ )
N e t c h a n g e i n i n c o m e ( % )
Household income decile
8/3/2019 Coalition tax policy
http://slidepdf.com/reader/full/coalition-tax-policy 8/18
IPPR | Coalition tax policy6
the same hours in total. This has important implications for the incentives for part-time
work and for families who would prefer to share work and care responsibilities.
Households further up the income distribution are more likely to be working, have two
earners, and have earners who are taking home more than the modelled higher personal
allowance. They are therefore more likely to see the full benet of the increase in the
personal allowance. A number of these households will benet twice because they have
two workers on earnings above the new personal allowance. There is nothing wrong
with this – having two earners in a household is important for avoiding in-work povertyand enabling work and care to be distributed more evenly within households. There is no
argument for limiting the gains of an increase in the personal allowance to just one earner
(and no practical way to do this without joint assessment).
But these features of the income distribution inevitably mean that raising the personal
allowance is a relatively inefcient way to achieve the policy’s stated goals of taking low
earners out of income tax, improving their work incentives and increasing the take-home
pay of low-to-middle income households. We estimate that the cost of the illustrative
£10,000 allowance modelled above would be approximately £13 billion. The Resolution
Foundation has estimated that two-thirds of the projected cost of increasing the personal
allowance from £7,745 to £8,105 in 2012-13 will be spent on households in the top half
of the income distribution (Whittaker 2011). If similar proportions applied to the change
we have modelled, approximately £8.7 billion worth of tax cuts would accrue to the tophalf of the income distribution. Similarly, the Institute for Fiscal Studies’ analysis of the
original Liberal Democrat’s proposal estimated that only seven per cent of the money
spent increasing the personal allowance would go on taking 3.6 million low earners out of
income tax altogether (Adam et al 2010).
Raising the income tax personal allowance is therefore an untargeted and expensive
way to improve the work incentives of low earners and increase the incomes of low-to-
middle income households. The Coalition is committed to spending approximately £1
billion in 2012-13 on increasing the personal allowance to £8,105. The stated goals of
the Coalition’s personal allowance policy could be better achieved by measures directly
targeted at low-to-middle income working families, with strong limits on gains to families
in the top half of the distribution.
In the June 2010 budget and the October 2010 Comprehensive Spending Review, the
Coalition announced a total of £18 billion cuts in benet and tax credit spending. IPPR
has estimated that half of these cuts will fall on working families, by reducing the value of
tax credits that support the incomes of low-to-middle income families (IPPR 2010). This
will not only reduce the real incomes of many low-to-middle income families but also have
a negative effect on work incentives. Therefore these changes directly contradict both
the goals behind the policy of raising the personal allowance and the Coalition’s welfare
reform programme: increasing work incentives by enabling low earners to keep more of
their earnings before benets and tax credits are withdrawn. The main changes to nancial
support for low-to-middle income working families are set out in box 2.
8/3/2019 Coalition tax policy
http://slidepdf.com/reader/full/coalition-tax-policy 9/18
IPPR | Coalition tax policy7
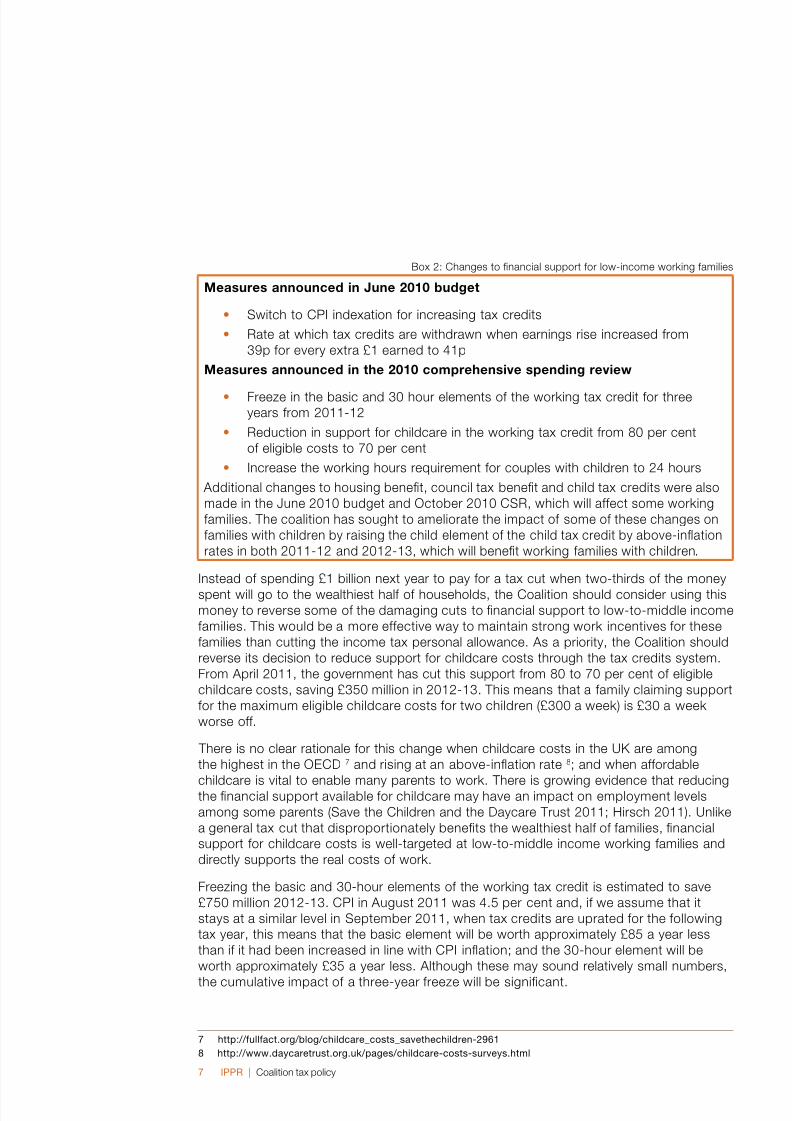
Box 2: Changes to nancial support for low-income working families
Measures announced in June 2010 budget
Switch to CPI indexation for increasing tax credits
Rate at which tax credits are withdrawn when earnings rise increased from
39p for every extra £1 earned to 41p
Measures announced in the 2010 comprehensive spending review
Freeze in the basic and 30 hour elements of the working tax credit for threeyears from 2011-12
Reduction in support for childcare in the working tax credit from 80 per cent
of eligible costs to 70 per cent
Increase the working hours requirement for couples with children to 24 hours
Additional changes to housing benet, council tax benet and child tax credits were also
made in the June 2010 budget and October 2010 CSR, which will affect some working
families. The coalition has sought to ameliorate the impact of some of these changes on
families with children by raising the child element of the child tax credit by above-ination
rates in both 2011-12 and 2012-13, which will benet working families with children.
•
•
•
•
•
Instead of spending £1 billion next year to pay for a tax cut when two-thirds of the money
spent will go to the wealthiest half of households, the Coalition should consider using this
money to reverse some of the damaging cuts to nancial support to low-to-middle income
families. This would be a more effective way to maintain strong work incentives for these
families than cutting the income tax personal allowance. As a priority, the Coalition should
reverse its decision to reduce support for childcare costs through the tax credits system.
From April 2011, the government has cut this support from 80 to 70 per cent of eligible
childcare costs, saving £350 million in 2012-13. This means that a family claiming support
for the maximum eligible childcare costs for two children (£300 a week) is £30 a week
worse off.
There is no clear rationale for this change when childcare costs in the UK are among
the highest in the OECD 7 and rising at an above-ination rate 8; and when affordable
childcare is vital to enable many parents to work. There is growing evidence that reducingthe nancial support available for childcare may have an impact on employment levels
among some parents (Save the Children and the Daycare Trust 2011; Hirsch 2011). Unlike
a general tax cut that disproportionately benets the wealthiest half of families, nancial
support for childcare costs is well-targeted at low-to-middle income working families and
directly supports the real costs of work.
Freezing the basic and 30-hour elements of the working tax credit is estimated to save
£750 million 2012-13. CPI in August 2011 was 4.5 per cent and, if we assume that it
stays at a similar level in September 2011, when tax credits are uprated for the following
tax year, this means that the basic element will be worth approximately £85 a year less
than if it had been increased in line with CPI ination; and the 30-hour element will be
worth approximately £35 a year less. Although these may sound relatively small numbers,
the cumulative impact of a three-year freeze will be signicant.
7 http://fullfact.org/blog/childcare_costs_savethechildren-296
8 http://www.daycaretrust.org.uk/pages/childcare-costs-surveys.html
8/3/2019 Coalition tax policy
http://slidepdf.com/reader/full/coalition-tax-policy 10/18
IPPR | Coalition tax policy8
Freezing these elements of the working tax credit reduces work incentives by lowering
the total income available to low-to-middle income working families relative to out-of-
work benets. As the value of working tax credits are gradually eroded over the next
three years, the relative gains of low-to-mid wage work will diminish. This is particularly
important given the scale of low pay in the UK, and emerging evidence about the
stagnation of low and median earnings in the last decade (Cooke and Lawton 2008;
Plunkett 2011). Financial work incentives are not the only inuence on people’s decision to
work, but they can be particularly important for low-to-middle incomes families and these
policy decisions directly contradict the stated intentions of the government’s other tax andbenet reforms.
In the longer term, the Coalition should reconsider its plans to gradually increase the
personal allowance to £10,000. Although these plans stem from a well-founded concern
to improve living standards and work incentives for low-to-middle income families, our
analysis has shown that using the income tax system to do this is inefcient and costly,
with most of the benets accruing to the wealthiest half of families. The Coalition should
consider alternative mechanisms for helping low-to-middle income families. This should
not be limited to increased spending on tax credits, but should include replacing direct
nancial support for childcare through the tax credit system with free, publicly-funded,
universal childcare and early years education.
2. The 50 per cent additional rate of income tax The additional rate of income tax at 50 per cent on incomes over £150,000 was
introduced by the Labour government in the 2009 budget. The objective was to generate
additional tax revenue from the wealthiest taxpayers to help secure the public nances in
the wake of the fall in tax revenues generated by the recession.
In the 2009 budget, the Treasury estimated that the new tax rate would raise an additional
£1.8 billion in 2011-12, rising to £2.4 billion in 2012-13. The tax applies to around
275,000 individuals, roughly the top one per cent of all income taxpayers. Although this is
a very small proportion of taxpayers, the tax rate levied on this group is important because
their incomes are so large. This means that the tax they pay is out of all proportion with
the size of the group: before the 50 per cent rate was introduced, around a quarter of all
income tax was paid by the top one per cent of taxpayers (Mirrlees chapter 4). This shouldbe seen in the context of very substantial increases in incomes enjoyed by the wealthiest
one per cent of taxpayers over the last three decades and the impact this has had on
levels of economic inequality in the UK (Brewer et al 2008; Bell and Van Reenen 2010).
A number of business leaders and economists have called for the 50 per cent rate to be
abandoned by the Coalition government 9. The Chancellor George Osborne has said he
would like to scrap the tax and has asked HM Revenue and Customs (HMRC) to review
how much additional revenue the tax is generating and report by the end of the 2011-12
tax year 10. Many Liberal Democrats view the 50p rate as an appropriate ‘crisis measure’
but not a long-term part of the UK income tax regime (Newby 2011).
Opponents of the 50 per cent rate make two arguments. First, they argue that the rate
will not raise signicant additional revenue, and could even reduce the overall revenuegenerated from the richest taxpayers. In theory, there is a point at which raising income
tax rates fails to generate additional revenue (or causes revenues to fall) because
9 See http://www.ft.com/cms/s/0/d92b0bc4-d7e9-e0-a5d9-0044feabdc0.html#axzzY0k2LUbG
0 http://www.bbc.co.uk/news/business-45558
8/3/2019 Coalition tax policy
http://slidepdf.com/reader/full/coalition-tax-policy 11/18
IPPR | Coalition tax policy9
individuals respond by either reducing their working hours or effort (or stopping working
altogether); or take steps to reduce their taxable income through illegal tax evasion
measures, or more commonly, legal tax avoidance measures. These could include
contributing more to a pension (although new rules make this hard in practice in the UK)
or charity; designating income as capital gains; or relocating to a country with a more
favourable tax regime. Previous studies have found that high earners are more likely to
respond to increases in the top rate of income tax by investing in avoidance measures,
rather than by reducing their labour supply (Mirrlees Review 2010). There is little evidence
that imposing higher rates of income tax on high earners causes them to cut their workinghours or work less hard.
The highest tax rate that can be imposed before further increases would achieve no
increase in revenue is called the revenue-maximising tax rate. In work for the Mirrlees
Review, Brewer, Saez and Shephard (2010) estimated that the revenue-maximising tax
rate for the top one per cent of taxpayers was 56 per cent. Once national insurance
contributions and indirect taxes have been factored in, this is equivalent to a revenue-
maximising income tax rate of 40 per cent, the rate that high earners were previously
paying on incomes over £150,000 before April 2010. This suggests that raising the top
rate of income tax to 50 per cent will raise no additional revenue – taxpayers affected by
the move will opt to reduce their taxable income to such an extent as to completely offset
(or even outweigh) any additional revenue raised from the new rate.
However, as the Mirrlees Review is careful to point out, “there is no escaping the
uncertainty around the estimate of a 40 per cent revenue-maximising income tax rate”
(Mirrlees Review 2010: 109). The estimates are based on how people adapted to the
changes in the top rate of income tax in the 1980s, the last time that the top rate was
altered. However, the ability of the top one per cent of taxpayers to respond to tax
changes is potentially very different in the 2010s. For example, there are now more
complex tax avoidance products available but more anti-avoidance measures are also
now in place. Differences in the capital gains tax regime and in pension tax relief rates may
make it easier or harder to reduce taxable income. In the 1980s, tax rates were lowered
and the revenue generated from the richest taxpayers increased, suggesting that raising
the top tax rate would have the opposite effect. However, lots of other things changed in
the 1980s which led to increases in top incomes, such as privatisation and the ‘big bang’in the nance sector 11.
Even if nothing has changed since the 1980s, the 40 per cent revenue-maximising income
tax rate was the central estimate, and there was only a two-thirds chance that the true
rate lay somewhere between 33 and 57 per cent, a relatively wide margin. Furthermore,
the top rate of income tax was reduced from 60 to 40 per cent in the 1980s, so we have
no specic observation for how top earners might respond to a 50 per cent rate.
The impact of the one-off payroll tax on bankers’ bonuses levied in 2009-10 may
suggest that additional revenue can be raised by increasing taxes on the incomes of high
earners12. The Treasury originally estimated that this tax would raise £550 million whereas
the nal amount was £1.3 billion. A one-off tax is much easier to avoid, so it could be
considered surprising that it raised more than expected. This may be an indication thatthe revenue benets of a higher top rate of tax cannot be completely wiped out by tax
avoidance measures.
See http://www.guardian.co.uk/commentisfree/2009/apr/20/income-tax-rates
2 See http://touchstoneblog.org.uk/20/04/the-impact-of-the-50p-income-tax-rate/
8/3/2019 Coalition tax policy
http://slidepdf.com/reader/full/coalition-tax-policy 12/18
IPPR | Coalition tax policy0
The best conclusion to draw from the available evidence is that we simply do not know
how taxpayers are responding to the 50 per cent rate, and therefore how much additional
revenue it is raising. It is sensible for HMRC to review the operation of the additional rate of
income tax and publish detailed statistics about the revenue generated after the rate has
been in place for a full tax year. Until then, it is too early to say whether the 50 per cent rate
should be abolished or retained on the grounds of the additional revenue it generates.
HMRC should also investigate the extent to which high earners have responded to the 50p
rate by taking steps to avoid the higher rate of tax. Previous studies suggest that the usualresponse to higher marginal tax rates among high earners is to reduce taxable incomes
rather than labour supply. If it is found that revenues are signicantly below predicted
levels and this is primarily because taxpayers have acted to reduce their income tax liability
through avoidance measures, then this does not necessarily negate the argument for a 50
per cent rate but rather strengthens the argument for additional anti-avoidance measures.
Nevertheless, it may be that there are other ways to raise additional revenues from wealthy
taxpayers beyond the headline rate of income tax. This could include restricting the rate
of tax relief that higher rate taxpayers can claim on pension contributions to the basic
rate, which may generate up to £7 billion a year in additional revenue (Newby 2011). The
previous Labour government planned to limit pension tax relief for higher earners so that
it tapered down to 20 per cent for people earning more than £150,000 a year. This was
overturned by the Coalition, which has instead reduced the annual tax-free allowance forpension contributions considerably from £255,000 to £50,000 and the lifetime allowance
from £1.8 million to £1.5 million (Thurley 2011). This will help to limit the amount of tax
relief that higher earners can claim but still awards them a greater subsidy for pension
saving than is given to basic rate taxpayers.
In the longer term, tax relief on pensions could be replaced with an additional state-funded
pension contribution, since there is little evidence that tax reliefs provide an effective
incentive to save, especially among low and middle earners (Pensions Policy Institute
2004; Dolphin 2011). The Liberal Democrat policy of aligning capital gains and income tax
rates and personal allowances could also be a positive move to remove the incentive to
classify income as capital gains (Newby 2011).
The second argument that opponents of the 50 per cent rate make is that it risks stiinggrowth and job creation. As we have already highlighted, high earners do not tend to
respond to an increase in the top rate of tax by working less hard or stopping working
altogether, so the 50p rate is unlikely to affect the wealth and job creation abilities of the
top one per cent in this way.
Opponents of the 50 per cent rate argue that job creation will be damaged because the
higher tax rate will cause many top earners to relocate to a country with a more favourable
personal tax regime, or it will dissuade such people from moving to the UK. The evidence
base for such assertions is weak. First, research by the High Pay Commission has found
that senior executives are no more mobile than other employees (High Pay Commission
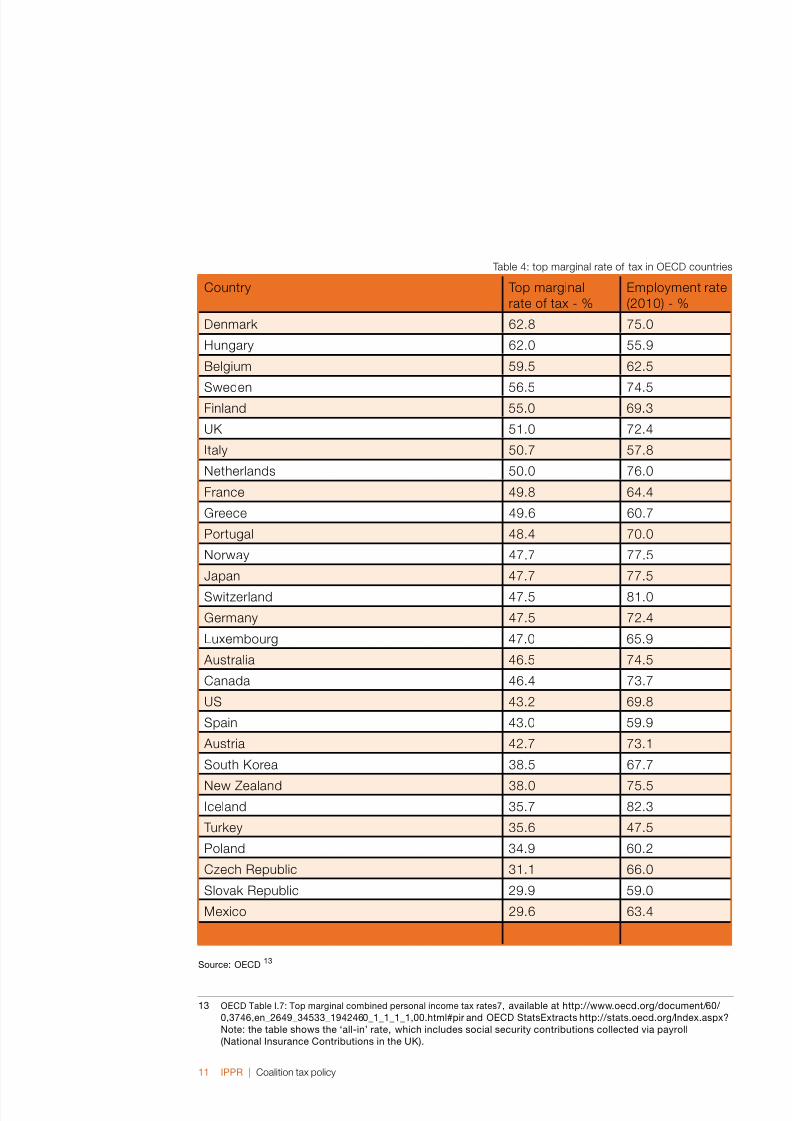
2011). Second, table 4 shows that the tax regime for high earners in the UK is broadly
comparable to those in other OECD countries. Although the UK is towards the top of
the table, ve countries have higher top tax rates and 18 countries have a top rate of
tax above 46 per cent. Table 4 also shows there is no clear relationship between the top
rate of tax and employment rates. Employment is both higher and lower than the UK in
countries which have higher top rates of tax and in those that have a lower top rate.
8/3/2019 Coalition tax policy
http://slidepdf.com/reader/full/coalition-tax-policy 13/18
IPPR | Coalition tax policy
Table 4: top marginal rate of tax in OECD countries
Country Top marginal
rate of tax - %
Employment rate
(2010) - %
Denmark 62.8 75.0
Hungary 62.0 55.9
Belgium 59.5 62.5
Sweden 56.5 74.5Finland 55.0 69.3
UK 51.0 72.4
Italy 50.7 57.8
Netherlands 50.0 76.0
France 49.8 64.4
Greece 49.6 60.7
Portugal 48.4 70.0
Norway 47.7 77.5
Japan 47.7 77.5
Switzerland 47.5 81.0
Germany 47.5 72.4
Luxembourg 47.0 65.9
Australia 46.5 74.5
Canada 46.4 73.7
US 43.2 69.8
Spain 43.0 59.9
Austria 42.7 73.1
South Korea 38.5 67.7
New Zealand 38.0 75.5
Iceland 35.7 82.3
Turkey 35.6 47.5
Poland 34.9 60.2
Czech Republic 31.1 66.0
Slovak Republic 29.9 59.0
Mexico 29.6 63.4
Source: OECD
OECD Table I.7: Top marginal combined personal income tax rates7, available at http://www.oecd.org/document/60/
0,746,en_2649_45_942460____,00.html#pir and OECD StatsExtracts http://stats.oecd.org/Index.aspx?
Note: the table shows the ‘all-in’ rate, which includes social security contributions collected via payroll(National Insurance Contributions in the UK).
8/3/2019 Coalition tax policy
http://slidepdf.com/reader/full/coalition-tax-policy 14/18
IPPR | Coalition tax policy2
The top one per cent of taxpayers are more likely to work in nance and in associated
business services that serve the nance industry, such as corporate law and accountancy
(Bell and Van Reenen 2010; Brewer, Sibieta and Wren-Lewis 2008). It is not clear that
high earners in these sectors invest in activities that would generate shared prosperity and
employment. Relatively few 50p taxpayers are owners of SMEs or mid-sized rms that
may be expected to generate job growth.
Calls for the abandonment of the 50p rate are part of a broader agenda that focuses on
tax cuts, alongside further deregulation and other supply side measures, as stimulantsof economic growth. However, the central problem in the UK economy is that demand is
weak. Unemployment is rising, retail sales are at, and consumer and business condence
is falling. None of these poor economic indicators can be realistically pinned on the 50 per
cent tax rate. The risk is that continued debates about the right rate at which to tax very
high incomes obscures the need for a much broader strategy for growth and investment.
The government should wait until the HMRC review of the operation of the 50 per cent tax
rate is complete before making a decision about the future of the tax rate. HMRC should
publish full details of its review to enable independent scrutiny of the results. Where
possible, HMRC should include an assessment of how much revenue was not collected
due to tax avoidance measures. If the 50 per cent tax rate can be shown to have
generated signicantly less revenue than projected and the majority of this can be shown
to be the result of tax avoidance measures, the Coalition should retain the 50 per cent rateand launch a new package of anti-avoidance measures. In the longer term, the Coalition
should look again at the tax reliefs available to the wealthiest taxpayers.
. Property taxes and the ‘mansion tax’ The uncertainty over the future of the 50p tax rate has revived debate about the Liberal
Democrat’s proposal for a ‘mansion tax’ – a property tax on high-value homes. Business
Secretary Vince Cable has said that if the 50p rate is scrapped it should be replaced by
another tax on wealthy individuals 14. Cable rst announced the ‘mansion tax’ policy at the
Liberal Democrat 2009 spring party conference, proposing a 0.5 per cent annual levy on
property valued at over £1 million, affecting 250,000 homes. The threshold was raised to
£2 million in the Liberal Democrat’s 2010 general election manifesto, after party members
raised concerns about the impact of the policy in marginal seats in the south. The revisedplans were estimated to affect just 70,000 properties and raise approximately £1.7 billion.
The mansion tax policy formed part of Liberal Democrat tax reform plans to create more
‘fairness’ in the tax system, and was one way that the increase in the personal allowance
discussed above was to be funded. Vince Cable also framed the ‘mansion tax’ as a way
to penalise non-productive investment; and address some of the weaknesses of the
council tax regime:
‘We have seen the super-rich pouring their money not into job creating businesses but
into acquiring mansions. And remember too that under our unfair council tax, Messrs
Mittal and Abramovich in their £30m palaces pay the same as a band H family’s home
though their properties may be worth 40 or 50 times as much’ (Vince Cable’s speech to
Liberal Democrat conference 2009)
4 http://www.telegraph.co.uk/nance/personalnance/consumertips/tax/8679485/Vince-Cable-mansion-tax-should-replace-50p-rate.html
8/3/2019 Coalition tax policy
http://slidepdf.com/reader/full/coalition-tax-policy 15/18
IPPR | Coalition tax policy
There is certainly a strong case for reforming the system of property taxation in the UK.
The main broad-based property tax operating in Britain is council tax, which suffers from a
number of weaknesses that suggest it is in need of reform (Mirrlees Review 2010). First, it
is a regressive tax in the sense that the more a property is worth, the less as a proportion
of its value is paid in council tax. Second, the system of council tax bands fails to
sufciently differentiate between homes of different value. The bottom band covers a large
number of properties, while the top band covers properties with hugely different values
– a source of unfairness recognised by Vince Cable. Third, the valuations, carried out in
1991, are so out-of-date that they bear little relation to current property values. Fourth,discounts for second and empty homes encourage the inefcient use of properties. These
weaknesses also contribute to the particular unpopularity of council tax. Adding a very
limited ‘mansion tax’ to a broken council tax system can only be a stop-gap measure until
a more comprehensive review of property taxation is undertaken.
The Mirrlees Review proposed an alternative to council tax that could help to improve the
system of property taxation. A ‘housing services tax’ (HST) would be a at-rate tax levied
on the estimated rental value of both rented and owner-occupied domestic properties
(Mirrlees Review 2010). It would therefore be similar to the system of domestic rates that
operated in Britain until 1991 and still operates in Northern Ireland.
A HST recognises the value of the ‘services’ that we get from living in a house, in the
same way as we get a ‘service’ from any other consumer durable, like a fridge or a car.We pay VAT on the purchase price of a fridge or a car when we buy it which is essentially
a tax on the value that we get from using the fridge or car over its lifetime. No such tax
is levied on the value we get from our home. In fact, the UK is alone in the OECD in
not levying VAT on property construction or sales. Yet because a house has a very long
lifetime, it is difcult to estimate the value of the lifetime services it will offer to residents.
Therefore, an annual charge is more appropriate.
Mirrlees suggests a rate of 0.6 per cent levied annually would raise about the same
amount as council tax currently does, and would be equivalent to a 12 per cent VAT on
the value of housing services. They estimate that, for homes worth less than £250,000,
tax bills would fall, while rising for homes worth more than £250,000.
A HST could also replace stamp duty land tax (SDLT), a badly designed property tax. The SDTL is a transaction tax levied on house purchases, which disincentivises moving
house. It could therefore be adding unnecessary inexibilities to the labour market, and
encouraging people to live in homes that are too large for them. It also has a very odd
structure whereby the tax rate is levied on the whole house value not just the value above
a certain threshold, so it arbitrarily discourages transactions of certain values. There is a
strong case for SDLT to be abandoned and the revenue raised from other sources.
Currently, the asset value of housing remains untaxed for owner-occupiers and a HST
would not address this directly as it is a tax on the consumption value of a home, not its
value as an asset 15. Since capital gains tax is not levied on primary residences, increases
in the asset value of domestic property are not taxed, unlike gains from assets held in
other forms, like equity investments (beyond the tax-free allowance held in ISAs). This
means that someone who rents their home but has built up considerable cash savings
pays income tax on the interest, but someone who bought a property and sells it for a
considerable prot pays no tax on their gains. This seems particularly unfair when the
5 Landlords are taxed on their rental income, although they receive no allowance for ‘normal’ returns.
8/3/2019 Coalition tax policy
http://slidepdf.com/reader/full/coalition-tax-policy 16/18
IPPR | Coalition tax policy4
value of domestic properties has risen in real terms by an average 2.9 per cent a year
since 1975, and although property can be a risky asset, over the last four decades it has
been a source of a signicant and sustained increase in wealth for many people (Mirrlees
Review 2010).
There is no economic justication for setting the threshold for taxing the asset value
of homes at the very high level of £2 million, which captures the asset value of just
the 70,000 most expensive properties. It is clearly a symbolic threshold designed to
demonstrate a desire to increase tax receipts from those most able to pay while placingno additional burden on the vast majority of the electorate. However, this avoids the
important question of how property should be taxed within a progressive, fair and efcient
tax system.
The Coalition should therefore make clear that a ‘mansion tax’ is the rst part of a broader
property tax reform programme. Such a programme would represent a considerable
political challenge, since there is no widespread public acceptance that main residences
are a legitimate basis for taxation. Even more distant on the political horizon is the idea of
taxing the value of land, despite a strong economic case for doing so 16.
Taxes on property, land and other forms of wealth are generally less popular than taxes on
income, and, therefore, attempts to reform wealth taxes tend to be politically unattractive
to governments. Progressives have consistently failed to make a good case for thetaxation of property and other forms of wealth, and have preferred to focus on reforming
income tax and indirect taxation. Yet the weaknesses of the UK’s property tax regime are
so serious that they undermine the fairness, efciency and progressivity of the overall tax
system, and contribute to a tax system that necessarily levies signicant taxes on labour,
while leaving wealth relatively untaxed. This is particularly important as inequalities in
wealth are considerably larger than those in income, and have risen over the last three
decades (National Equality Panel 2010).
There is a strong case for progressives to pursue a programme of reform across the
wealth tax system, including taxes on property, land and inheritances, and for ensuring
the wealth taxes are not limited to the ‘super-rich’ as there is no clear justication for
this. The introduction of a ‘mansion tax’ should be seen as the rst small step in that
process, which is ultimately designed to partly shift the burden of taxation from incometo wealth. Such a broad shift is likely to be progressive, given the very unequal ownership
of property, land and other forms of wealth in the UK. It could also help promote the
more efcient use of resources and achieve greater equity between different groups of
taxpayers.
6 See Maxwell and Vigor (2005) for a full outline of the economic case for taxing land values, but broadly, thecase is that: () the supply of land is fairly limited and not very responsive to price, and so can be taxed at areasonable rate without having any major impact on supply and demand; (2) the ownership and location of landis well-established, and it cannot be moved, so it is easier to work out tax liabilities and harder to avoid them;and () a land value tax captures increases in the value of land result of developments external to the land,which are often paid for by taxpayers.
8/3/2019 Coalition tax policy
http://slidepdf.com/reader/full/coalition-tax-policy 17/18
IPPR | Coalition tax policy5
References Adam S, Brewer M, Browne J and Phillips D (2010) Taxes and Benets: The Parties’
Plans, 2010 Election Brieng Note No. 13 London: Institute for Fiscal Studies
Bell B and Van Reenen J (2010) Bankers’ Pay and Extreme Wage Inequality in the UK
London: Centre for Economic Performance, LSE
Brewer M, Saez E and Shephard A (2010) ‘Means testing and tax rates on earnings’ in
Mirrlees Review Dimensions of Tax Design London: Institute for Fiscal Studies
Brewer M, Sibieta L and Wren-Lewis L (2008) Racing Away? Income inequality and the
evolution of high incomes London: Institute for Fiscal Studies
Cable V (2009) Speech to Liberal Democrats Autumn Conference 2009, speech 21st
September 2009, Bournemouth, available at http://www.libdems.org.uk/speeches.aspx
Cooke G and Lawton K (2008) Working Out of Poverty: A study of the low-paid and the
‘working poor’ London: IPPR
Dolphin T (2011) Designing a Life-course Savings Account: How to help low-to-middle
income families save more London: IPPR
Hirsch D (2011) Childcare Support and the Hours Trap London: Resolution Foundation
HM Government (2010) The Coalition: Our programme for government London: Cabinet Ofce
HM Treasury (2011) Budget 2011 London: HM Treasury
HM Treasury (2010) Budget 2010 London: HM Treasury
IPPR (2010) ‘Half of cuts to benets will hit people in work’ Press release 8 November 2010
Kenworthy L (2011) Progress for the Poor Oxford: Oxford University Press
Mirrlees Review (2010) Tax by Design London: Institute for Fiscal Studies
National Equality Panel (2010) An Anatomy of Economic Inequality in the UK: Report of the
National Equality Panel London: Government Equalities Ofce
Newby D (2011) Tax and the Coalition: Fairness and responsibility? London: CentreForum
Pensions Policy Institute (2004) Tax Relief and Incentives for Private Saving London:
Pensions Policy Institute
Plunkett J (2011) Growth Without Gain? The faltering living standards of people on low-to-
middle incomes London: IPPR
Save the Children and the Daycare Trust (2011) Making Work Pay: The childcare trap
London: Save the Children
Thurley D (2011) Restricting Pension Tax Relief, Standard Note SN/BT 5901 London:House of Commons Library
Whittaker M (2011) Budget 2011: The impact on low-to-middle earners London:
Resolution Foundation

8/3/2019 Coalition tax policy
http://slidepdf.com/reader/full/coalition-tax-policy 18/18
Institute for Public Policy Research
SMaRt iDEaS
for cHanGE