Cloud susceptibility from MODIS Level-3 daily cloud products Lazaros Oreopoulos and Steven Platnick...
20
Cloud susceptibility from MODIS Cloud susceptibility from MODIS Level-3 daily cloud products Level-3 daily cloud products Lazaros Oreopoulos Lazaros Oreopoulos and and Steven Platnick Steven Platnick UMBC’s JCET UMBC’s JCET and and NASA GSFC’s Climate and Radiation Branch NASA GSFC’s Climate and Radiation Branch
-
Upload
owen-spencer -
Category
Documents
-
view
213 -
download
0
Transcript of Cloud susceptibility from MODIS Level-3 daily cloud products Lazaros Oreopoulos and Steven Platnick...

Cloud susceptibility from MODIS Level-3 Cloud susceptibility from MODIS Level-3 daily cloud productsdaily cloud products
Lazaros OreopoulosLazaros Oreopoulosandand
Steven PlatnickSteven Platnick
UMBC’s JCETUMBC’s JCET
and and
NASA GSFC’s Climate and Radiation BranchNASA GSFC’s Climate and Radiation Branch

Sλ =
dRλ (τ λ ,gλ , %ωλ )dN
=∂Rλ
∂τ λ
dτ λ
dre
dredN
+∂Rλ
∂gλ
dgλ
dre
dredN
+∂Rλ
∂ %ωλ
d%ωλ
dre
dredN
+ + –– –– –– ++ – – ++ –– ––
ΔR =
wiFi↑ τ i + Δτ i , gi + Δgi , %ω i + Δ %ω i( )
i∑
μ 0Fe↓
−wiFi
↑ τ i , gi , %ω i( )i
∑μ 0Fe
↓
From a BB RT code:From a BB RT code:
Susceptibility and relative susceptibilitySusceptibility and relative susceptibility
Where Where ΔΔττ, , ΔΔg, g, are due to are due to ΔΔrree (< 0)(< 0) changes arising from changes arising from ΔΔNN (> 0) (> 0) changes changes
under constant LWCunder constant LWC:: Δ %ω
N =3LWC
4ρwπk3re3 ⇒ Δre =re 1−
NN + ΔN
⎛⎝⎜
⎞⎠⎟
1 3⎡
⎣⎢⎢
⎤
⎦⎥⎥=re 1−
1
1+ΔNN
⎛
⎝
⎜⎜⎜
⎞
⎠
⎟⎟⎟
⎡
⎣
⎢⎢⎢
⎤
⎦
⎥⎥⎥
1 3
⇒Δrere
≈−13ΔNN
ΔΔrree determined by specifying either: determined by specifying either:
(1) absolute change in (1) absolute change in N, N, ΔΔNN (e.g., 1 cm (e.g., 1 cm-3-3) susceptibility) susceptibility (2) relative change in (2) relative change in N, N, ΔΔN/N N/N (e.g., 10%) relative susceptibility(e.g., 10%) relative susceptibility

Theoretical calculations (no atmosphere or surface)Theoretical calculations (no atmosphere or surface)
Susceptibility Susceptibility ΔΔNN=1 cm=1 cm-3-3 Relative susceptibility Relative susceptibility ΔΔNN//NN=10%=10%
ΔR ≈4π
9LWCτ
∂R
∂τk 3re
3ΔN ΔR ≈1
3τ
∂R
∂τ
ΔN
N
SZA=60°SZA=60°

Susceptibility from MODISSusceptibility from MODIS
• D3 data provide means of D3 data provide means of ττ and and rree and joint and joint ττ - - rree histograms at 1° histograms at 1°
• Either can be used to calculate broadband unperturbed and perturbed Either can be used to calculate broadband unperturbed and perturbed
(due to (due to ΔΔrree changes) albedos; their difference is susceptibility changes) albedos; their difference is susceptibility
• The albedo is obtained with the aid of a modified version of the BB SW The albedo is obtained with the aid of a modified version of the BB SW
RT code by Chou et al.RT code by Chou et al.
• Atmospheric and surface effects, consistent with retrievals, are includedAtmospheric and surface effects, consistent with retrievals, are included
• Daily susceptibility values are averaged to monthly scalesDaily susceptibility values are averaged to monthly scales
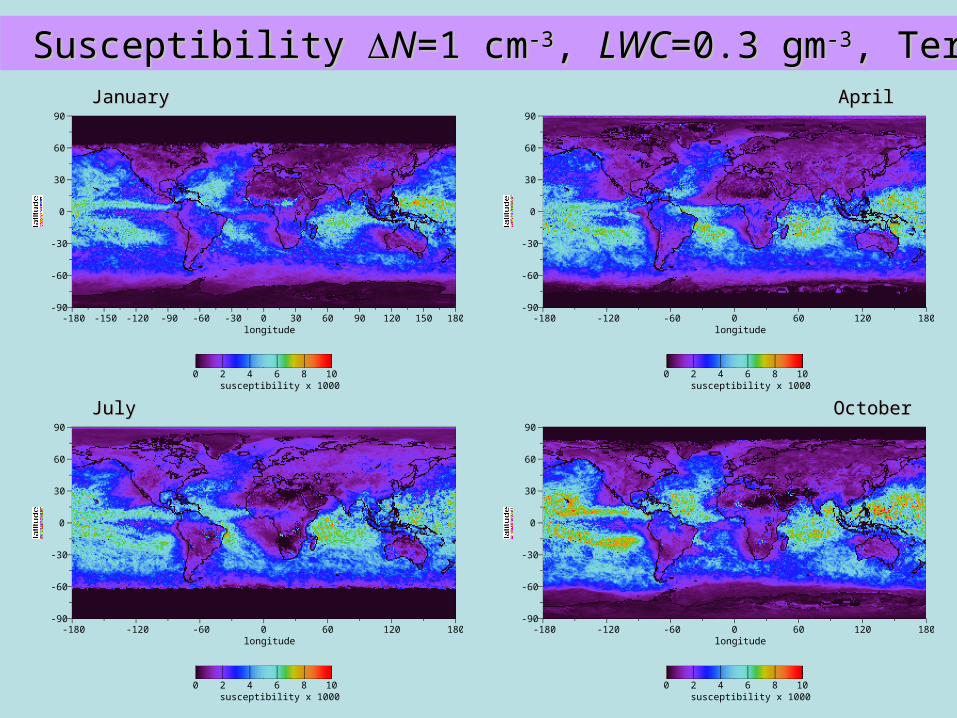
• Susceptibility has been calculated for four months (January, April, July, Susceptibility has been calculated for four months (January, April, July,
October 2005) of Collection 5 Terra and Aqua liquid cloud data October 2005) of Collection 5 Terra and Aqua liquid cloud data
• Here we show results only from joint Here we show results only from joint ττ - - rree histograms histograms
JanuaryJanuary
Susceptibility Susceptibility ΔΔNN=1 cm=1 cm-3-3, , LWCLWC=0.3 gm=0.3 gm-3-3, Terra, TerraAprilApril
JulyJuly OctoberOctober
-180 -150 -120 -90 -60 -30 0 30 60 90 120 150 180
90
60
30
0
-30
-60
-90
longitude
latitude
0 2 4 6 8 10susceptibility x 1000
-180 -120 -60 0 60 120 180
90
60
30
0
-30
-60
-90
longitude
latitude
0 2 4 6 8 10susceptibility x 1000
-180 -120 -60 0 60 120 180
90
60
30
0
-30
-60
-90
longitude
latitude
0 2 4 6 8 10susceptibility x 1000
-180 -120 -60 0 60 120 180
90
60
30
0
-30
-60
-90
longitude
latitude
0 2 4 6 8 10susceptibility x 1000

JanuaryJanuary
Relative susceptibility Relative susceptibility ΔΔNN=10%, Terra=10%, TerraAprilApril
JulyJuly OctoberOctober
-180 -120 -60 0 60 120 180
90
60
30
0
-30
-60
-90
longitude
latitude
0 2 4 6 8relative susceptibility x 1000
-180 -120 -60 0 60 120 180
90
60
30
0
-30
-60
-90
longitude
latitude
0 2 4 6 8relative susceptibility x 1000
-180 -120 -60 0 60 120 180
90
60
30
0
-30
-60
-90
longitude
latitude
0 2 4 6 8relative susceptibility x 1000
-180 -120 -60 0 60 120 180
90
60
30
0
-30
-60
-90
longitude
latitude
0 2 4 6 8relative susceptibility x 1000

-180 -120 -60 0 60 120 180
90
60
30
0
-30
-60
-90
longitude
latitude
0 10 20 30 40 50optical thickness
-180 -120 -60 0 60 120 180
90
60
30
0
-30
-60
-90
longitude
latitude
4 8 12 16 20 24 28effective radius (µm)
-180 -120 -60 0 60 120 180
90
60
30
0
-30
-60
-90
longitude
latitude
0 2 4 6 8 10susceptibility x 1000
-180 -120 -60 0 60 120 180
90
60
30
0
-30
-60
-90
longitude
latitude
0.0 0.2 0.4 0.6 0.8cloud albedoTerra, October 2005Terra, October 2005
Susceptibility correlates with effective radiusSusceptibility correlates with effective radius

-180 -120 -60 0 60 120 180
90
60
30
0
-30
-60
-90
longitude
latitude
0 10 20 30 40 50optical thickness
-180 -120 -60 0 60 120 180
90
60
30
0
-30
-60
-90
longitude
latitude
4 8 12 16 20 24 28effective radius (µm)
-180 -120 -60 0 60 120 180
90
60
30
0
-30
-60
-90
longitude
latitude
0 2 4 6 8relative susceptibility x 1000
-180 -120 -60 0 60 120 180
90
60
30
0
-30
-60
-90
longitude
latitude
0.0 0.2 0.4 0.6 0.8cloud albedo
Relative suscept. correlates with intermediate Relative suscept. correlates with intermediate albedosalbedos
Terra, October 2005Terra, October 2005

0
0.05
0.1
0.15
0.2
0.25
0.3
0 1 2 3 4 5 6 7 8
JanuaryOceanLand
susceptibility x 1000
0
0.02
0.04
0.06
0.08
0.1
0 1 2 3 4 5 6 7 8
April
susceptibility x 1000
0
0.02
0.04
0.06
0.08
0.1
0 1 2 3 4 5 6 7 8
July
susceptibility x 1000
0
0.02
0.04
0.06
0.08
0.1
0 1 2 3 4 5 6 7 8
October
susceptibility x 1000
Susceptibility for continental and marine cloudsSusceptibility for continental and marine clouds
TerraTerra

0
0.02
0.04
0.06
0.08
0.1
0.12
0 1 2 3 4 5 6 7 8
JanuaryOceanLand
relative susceptibility x 1000
0
0.01
0.02
0.03
0.04
0.05
0.06
0 1 2 3 4 5 6 7 8
April
relative susceptibility x 1000
0
0.01
0.02
0.03
0.04
0.05
0.06
0.07
0.08
0 1 2 3 4 5 6 7 8
July
relative susceptibility x 1000
0
0.02
0.04
0.06
0.08
0.1
0 1 2 3 4 5 6 7 8
October
relative susceptibility x 1000
Terra, relative susceptibilityTerra, relative susceptibilityRelative suscept. for continental and marine cloudsRelative suscept. for continental and marine clouds
TerraTerra

0
1
2
3
4
5
-90 -60 -30 0 30 60 90
JanuaryTerraAqua
latitude
0
1
2
3
4
5
-90 -60 -30 0 30 60 90
April
latitude
0
1
2
3
4
5
-90 -60 -30 0 30 60 90
July
latitude
0
1
2
3
4
5
-90 -60 -30 0 30 60 90
October
latitude
Susceptibility, Terra-Aqua zonal contrast Susceptibility, Terra-Aqua zonal contrast

0
1
2
3
4
5
6
7
-90 -60 -30 0 30 60 90
April
latitude
0
1
2
3
4
5
6
7
-90 -60 -30 0 30 60 90
October
latitude
0
1
2
3
4
5
6
7
-90 -60 -30 0 30 60 90
January
TerraAqua
latitude
0
1
2
3
4
5
6
7
-90 -60 -30 0 30 60 90
July
latitude
Relative susceptibility, Terra-Aqua zonal contrast Relative susceptibility, Terra-Aqua zonal contrast

0
0.2
0.4
0.6
0.8
1
1.2
January April July October
global IAE for Δ =1 N cm-3TerraAqua
Month
0
0.5
1
1.5
2
January April July October
global IAE for Δ =10%NTerraAqua
Month
Examples of potential global IAE forcingsExamples of potential global IAE forcings
ΔΔNN=1 cm=1 cm-3-3, , LWC LWC = 0.3 gm= 0.3 gm-3-3 ΔΔNN//NN = 10% = 10%
Susceptibility-cloud fraction relations are important!Susceptibility-cloud fraction relations are important!

SummarySummary
• Susceptibility is a useful concept for identifying regions prone to significant Susceptibility is a useful concept for identifying regions prone to significant IAE radiative perturbations not only due to their proximity to pollution IAE radiative perturbations not only due to their proximity to pollution sources, but also due to the nature of the prevailing clouds under current sources, but also due to the nature of the prevailing clouds under current climate conditions; it therefore provides an additional constraint in cloud climate conditions; it therefore provides an additional constraint in cloud modeling studiesmodeling studies
• A global picture of liquid cloud susceptibility can be obtained from MODIS A global picture of liquid cloud susceptibility can be obtained from MODIS in a straightforward manner with the aid of some RT modelingin a straightforward manner with the aid of some RT modeling
• Significant seasonal variations of susceptibility are observed, consistent Significant seasonal variations of susceptibility are observed, consistent with seasonal shifts in cloud patterns and propertieswith seasonal shifts in cloud patterns and properties
• As expected, marine clouds are more susceptible than continental cloudsAs expected, marine clouds are more susceptible than continental clouds• Morning-afternoon susceptibility differences are relatively smallMorning-afternoon susceptibility differences are relatively small• The current distribution of liquid cloud optical thickness and effective The current distribution of liquid cloud optical thickness and effective
radius, as observed from MODIS, yields ~1.5 Wmradius, as observed from MODIS, yields ~1.5 Wm-2-2 IAE for a uniform 10% IAE for a uniform 10% increase in CDNC under constant LWC conditionsincrease in CDNC under constant LWC conditions

Additional SlidesAdditional Slides

JanuaryJanuary
Absolute susceptibility Absolute susceptibility ΔΔN=1 cmN=1 cm-3-3, Aqua, Aqua
-180 -120 -60 0 60 120 180
90
60
30
0
-30
-60
-90
longitude
latitude
0 2 4 6 8 10susceptibility x 1000
-180 -120 -60 0 60 120 180
90
60
30
0
-30
-60
-90
longitude
latitude
0 2 4 6 8 10susceptibility x 1000
AprilApril
JulyJuly
-180 -120 -60 0 60 120 180
90
60
30
0
-30
-60
-90
longitude
latitude
0 2 4 6 8 10susceptibility x 1000
-180 -120 -60 0 60 120 180
90
60
30
0
-30
-60
-90
longitude
latitude
0 2 4 6 8 10susceptibility x 1000
OctoberOctober
Susceptibility Susceptibility ΔΔNN=1 cm=1 cm-3-3, , LWCLWC=0.3 gm=0.3 gm-3-3, Aqua, Aqua

Relative susceptibility Relative susceptibility ΔΔNN=10%, Aqua=10%, AquaJanuaryJanuary AprilApril
JulyJuly OctoberOctober
-180 -120 -60 0 60 120 180
90
60
30
0
-30
-60
-90
longitude
latitude
0 2 4 6 8relative susceptibility x 1000
-180 -120 -60 0 60 120 180
90
60
30
0
-30
-60
-90
longitude
latitude
0 2 4 6 8relative susceptibility x 1000
-180 -120 -60 0 60 120 180
90
60
30
0
-30
-60
-90
longitude
latitude
0 2 4 6 8relative susceptibility x 1000
-180 -120 -60 0 60 120 180
90
60
30
0
-30
-60
-90
longitude
latitude
0 2 4 6 8relative susceptibility x 1000

-180 -120 -60 0 60 120 180
90
60
30
0
-30
-60
-90
longitude
latitude
0 10 20 30 40 50optical thickness
The impact of cloud fractionThe impact of cloud fraction
-180 -120 -60 0 60 120 180
90
60
30
0
-30
-60
-90
longitude
latitude
4 8 12 16 20 24 28effective radius (µm)
-180 -120 -60 0 60 120 180
90
60
30
0
-30
-60
-90
longitude
latitude
0.0 0.2 0.4 0.6 0.8 1.0liquid cloud fractionTerra, October 2005Terra, October 2005

Impact of using 2D joints instead of meansImpact of using 2D joints instead of means
Aqua, January 2005Aqua, January 2005

Imp
act of a
tmosp
here
Im
pa
ct of atm
osphe
re
and
surfa
ce alb
edo
and
surfa
ce alb
edo
Aq
ua, Ja
nua
ry 20
05A
qua
, Janu
ary 2
005
PPH calculationsPPH calculations