CLOUD CLASSIFICATION AND OBSERVED...
45
CLOUD CLASSIFICATION AND OBSERVED PROPERTIES OF CLOUDS (Supplement to Rogers and Yau, Ch. 5.)
Transcript of CLOUD CLASSIFICATION AND OBSERVED...
CLOUD CLASSIFICATION AND OBSERVED PROPERTIES OF CLOUDS
(Supplement to Rogers and Yau, Ch. 5.)
Sources of material
• Rogers and Yau, Chap. 5
• Wallace and Hobbs, Chap. 5 (pp 215-238), misc. parts of Chap 4.
• Atmosphere (Peterson Field Guide), by V.J. Shaefer and J.Day
• International Cloud Atlas
• Cotton: Dynamics of Clouds and Storms (Academic Press)
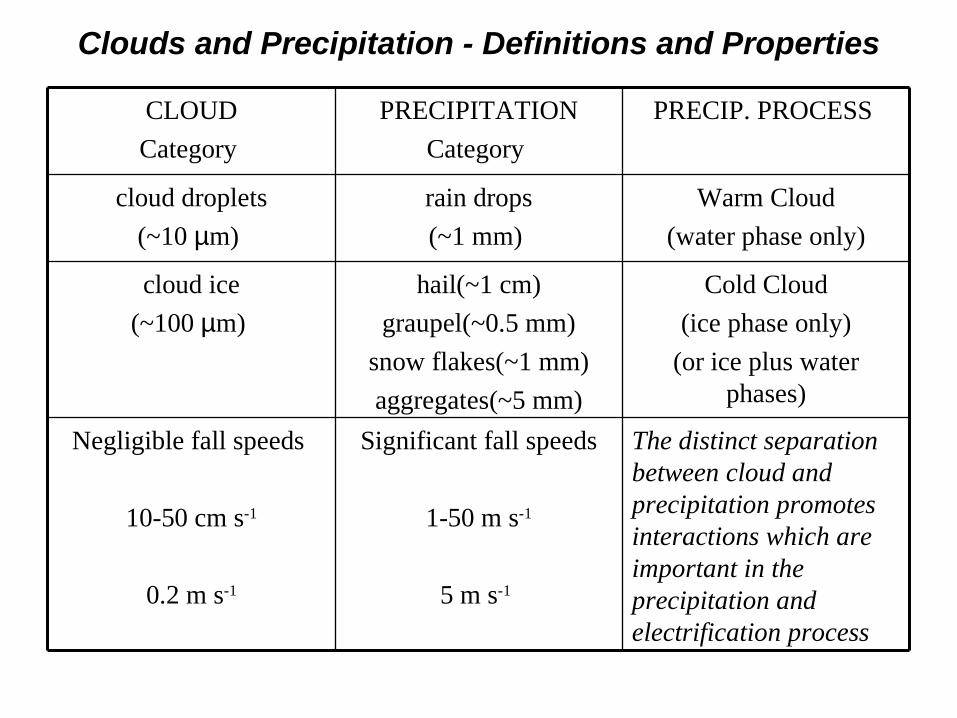
Clouds and Precipitation - Definitions and Properties
The distinct separation between cloud and precipitation promotes interactions which are important in the precipitation and electrification process
Significant fall speeds
1-50 m s-1
5 m s-1
Negligible fall speeds
10-50 cm s-1
0.2 m s-1
Cold Cloud
(ice phase only)
(or ice plus water phases)
hail(~1 cm)
graupel(~0.5 mm)
snow flakes(~1 mm)
aggregates(~5 mm)
cloud ice
(~100 µm)
Warm Cloud
(water phase only)
rain drops
(~1 mm)
cloud droplets
(~10 µm)
PRECIP. PROCESS PRECIPITATION
Category
CLOUD
Category
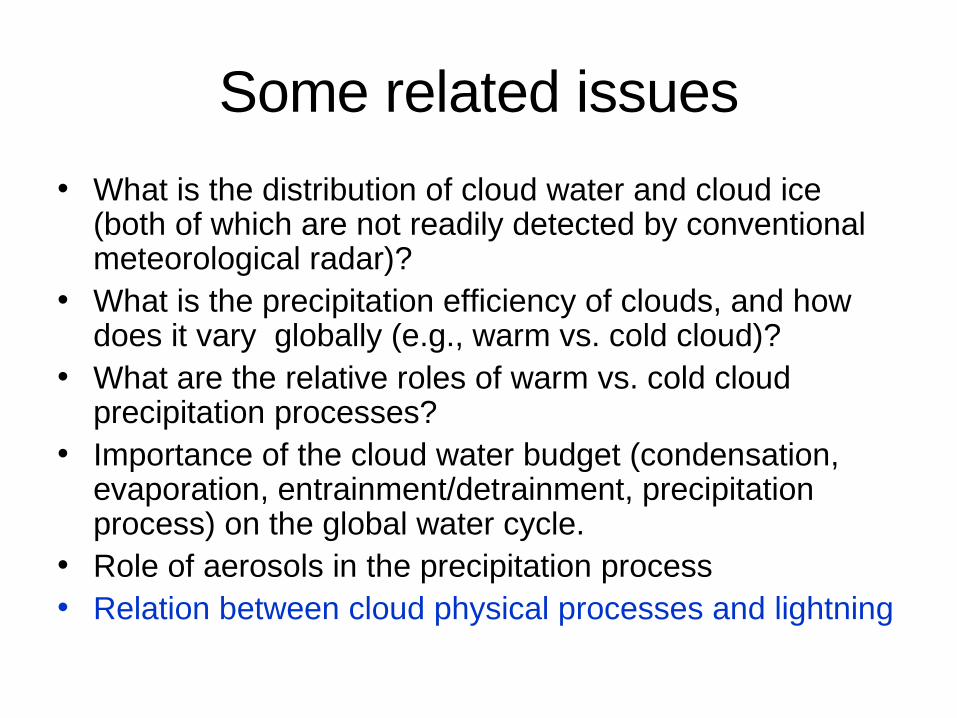
Some related issues
• What is the distribution of cloud water and cloud ice (both of which are not readily detected by conventional meteorological radar)?
• What is the precipitation efficiency of clouds, and how does it vary globally (e.g., warm vs. cold cloud)?
• What are the relative roles of warm vs. cold cloud precipitation processes?
• Importance of the cloud water budget (condensation, evaporation, entrainment/detrainment, precipitation process) on the global water cycle.
• Role of aerosols in the precipitation process• Relation between cloud physical processes and lightning
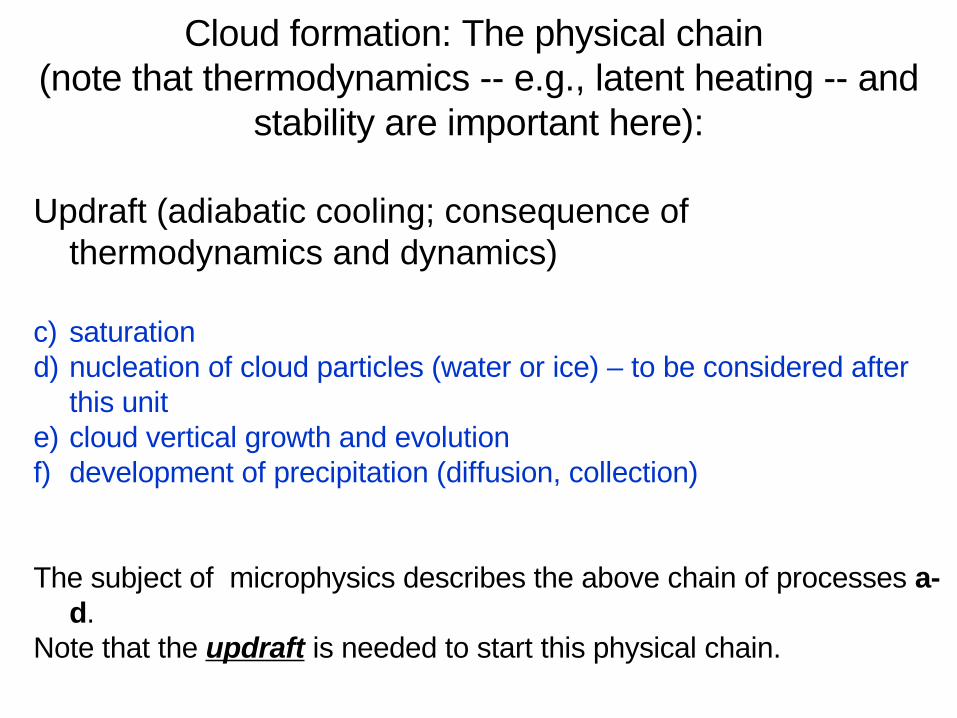
Cloud formation: The physical chain (note that thermodynamics -- e.g., latent heating -- and
stability are important here):
Updraft (adiabatic cooling; consequence of thermodynamics and dynamics)
c) saturation d) nucleation of cloud particles (water or ice) – to be considered after
this unite) cloud vertical growth and evolutionf) development of precipitation (diffusion, collection)
The subject of microphysics describes the above chain of processes a-d.
Note that the updraft is needed to start this physical chain.
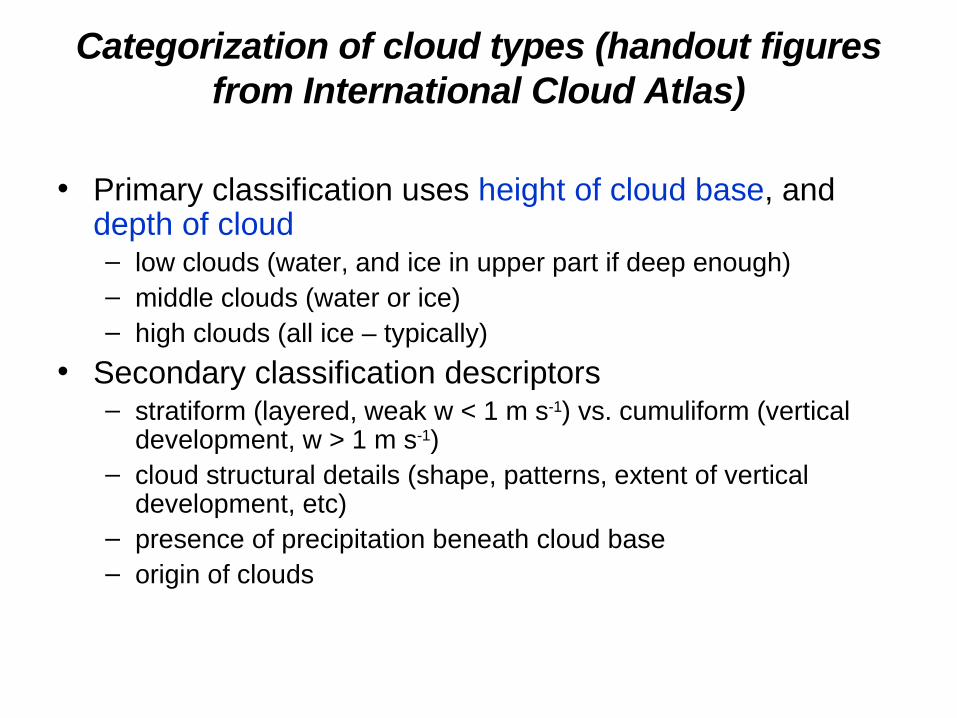
Categorization of cloud types (handout figures from International Cloud Atlas)
• Primary classification uses height of cloud base, and depth of cloud– low clouds (water, and ice in upper part if deep enough)– middle clouds (water or ice)– high clouds (all ice – typically)
• Secondary classification descriptors– stratiform (layered, weak w < 1 m s-1) vs. cumuliform (vertical
development, w > 1 m s-1)– cloud structural details (shape, patterns, extent of vertical
development, etc)– presence of precipitation beneath cloud base– origin of clouds
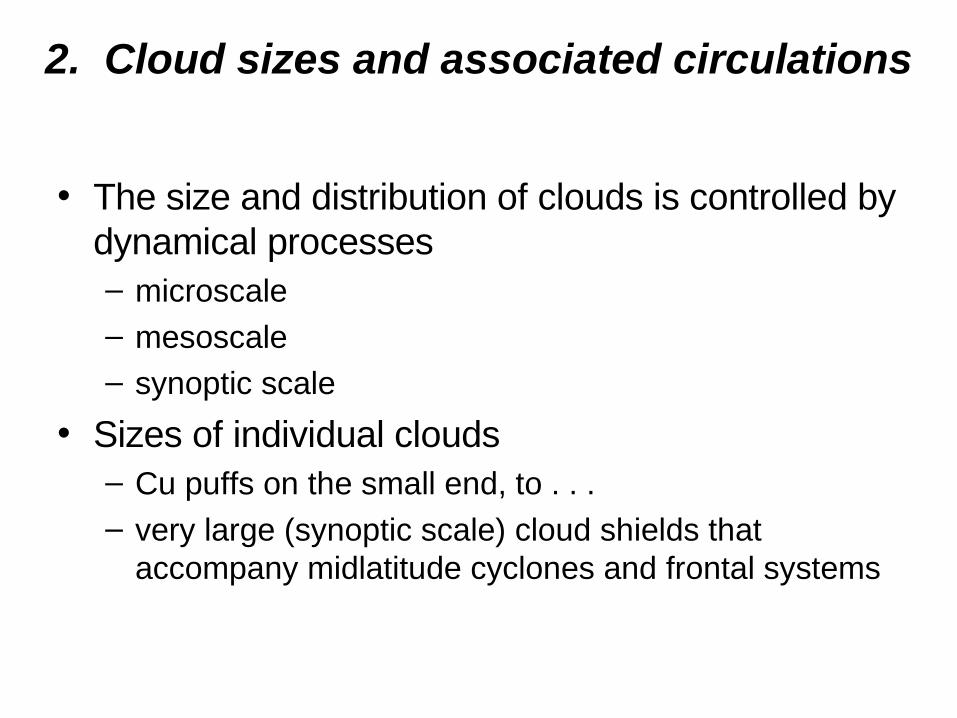
2. Cloud sizes and associated circulations
• The size and distribution of clouds is controlled by dynamical processes – microscale– mesoscale– synoptic scale
• Sizes of individual clouds – Cu puffs on the small end, to . . .– very large (synoptic scale) cloud shields that
accompany midlatitude cyclones and frontal systems
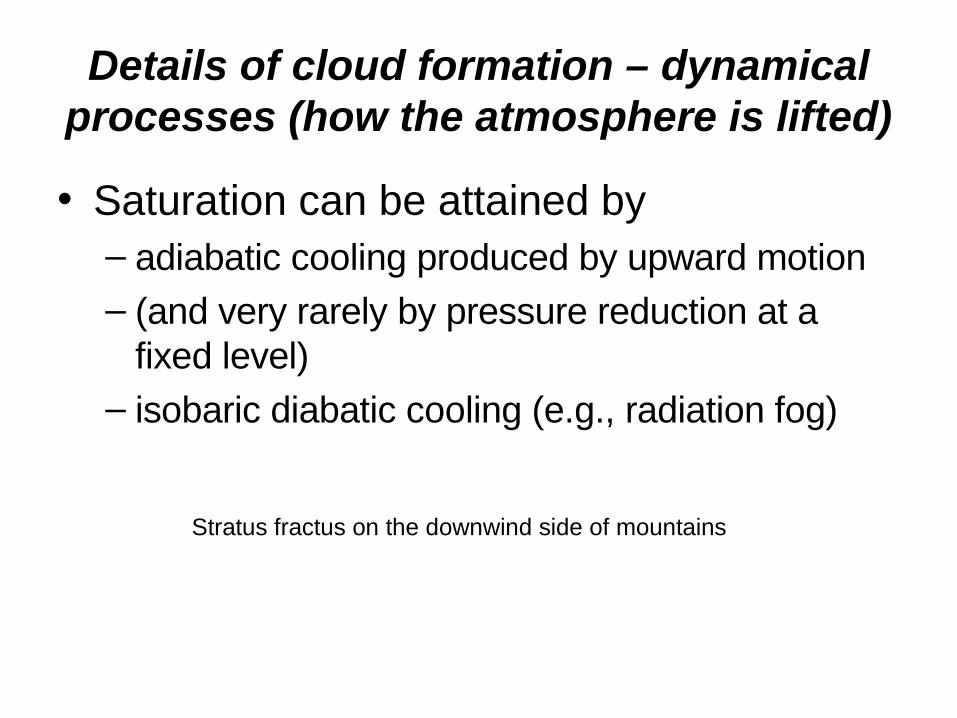
Details of cloud formation – dynamical processes (how the atmosphere is lifted)
• Saturation can be attained by – adiabatic cooling produced by upward motion – (and very rarely by pressure reduction at a
fixed level)
– isobaric diabatic cooling (e.g., radiation fog)
Stratus fractus on the downwind side of mountains
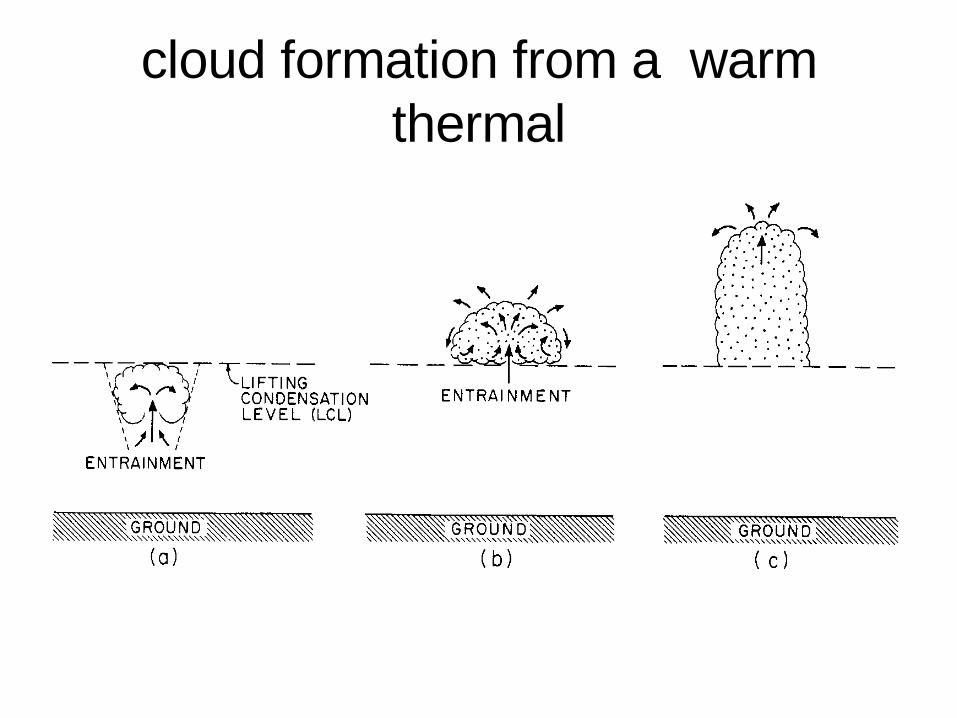
cloud formation from a warm thermal
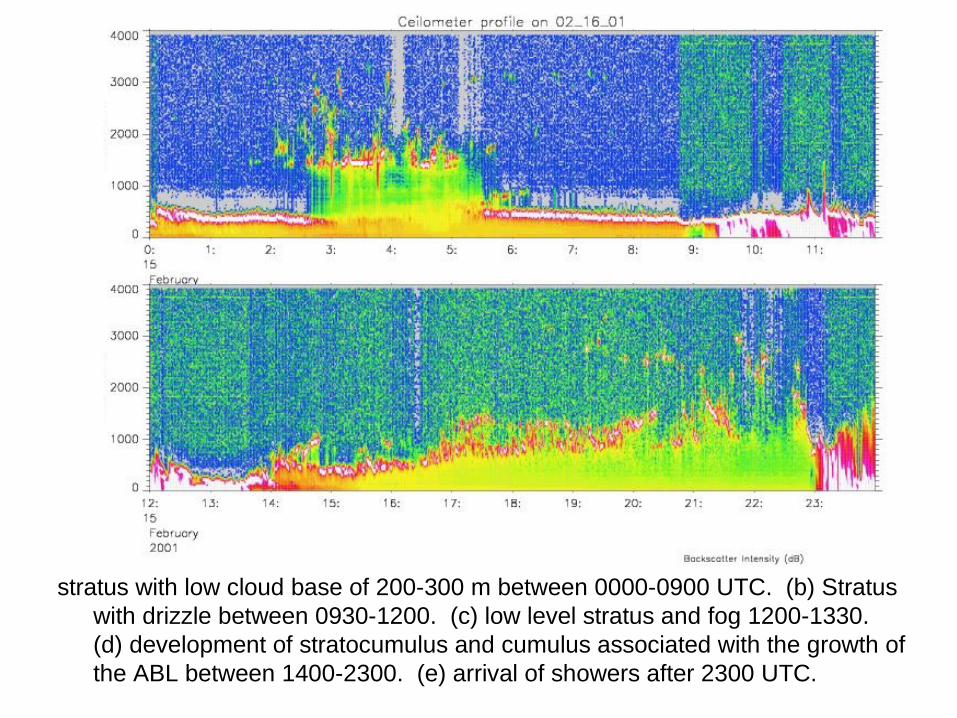
stratus with low cloud base of 200-300 m between 0000-0900 UTC. (b) Stratus with drizzle between 0930-1200. (c) low level stratus and fog 1200-1330. (d) development of stratocumulus and cumulus associated with the growth of the ABL between 1400-2300. (e) arrival of showers after 2300 UTC.
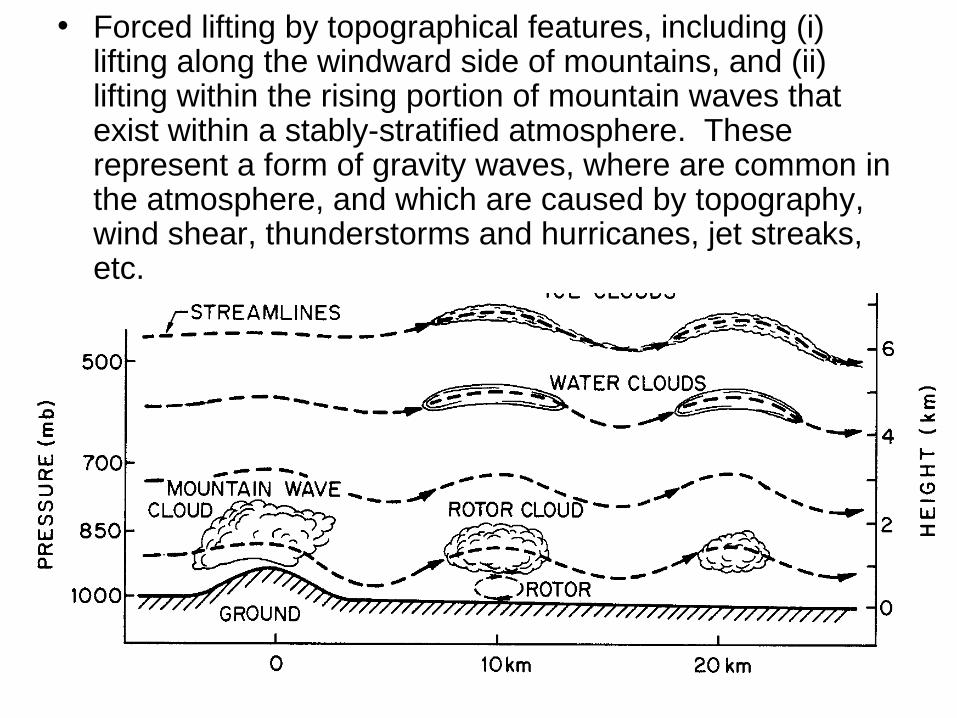
• Forced lifting by topographical features, including (i) lifting along the windward side of mountains, and (ii) lifting within the rising portion of mountain waves that exist within a stably-stratified atmosphere. These represent a form of gravity waves, where are common in the atmosphere, and which are caused by topography, wind shear, thunderstorms and hurricanes, jet streaks, etc.
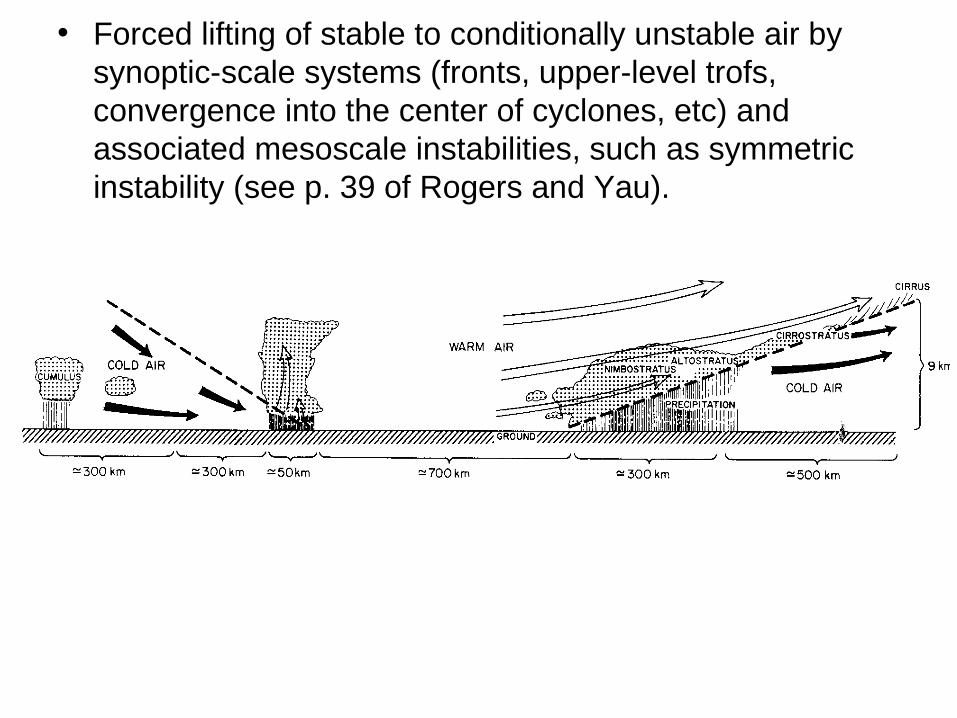
• Forced lifting of stable to conditionally unstable air by synoptic-scale systems (fronts, upper-level trofs, convergence into the center of cyclones, etc) and associated mesoscale instabilities, such as symmetric instability (see p. 39 of Rogers and Yau).
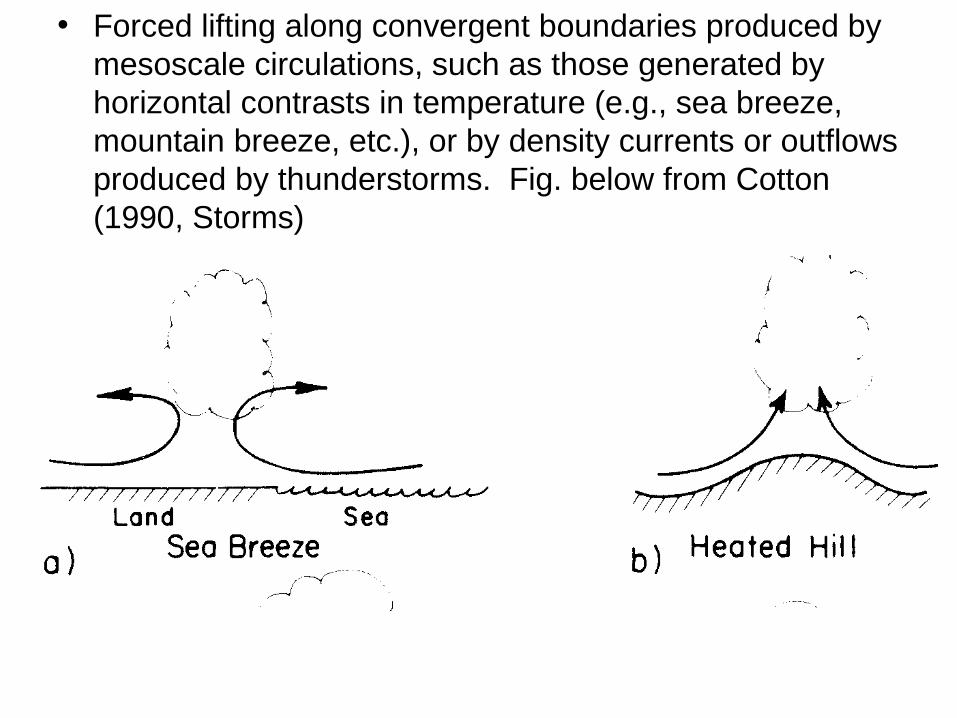
• Forced lifting along convergent boundaries produced by mesoscale circulations, such as those generated by horizontal contrasts in temperature (e.g., sea breeze, mountain breeze, etc.), or by density currents or outflows produced by thunderstorms. Fig. below from Cotton (1990, Storms)
others
• Diabatic cooling provided by emission of LW radiation, or by mixing, at low levels. This process is instrumental in producing low-level stratus clouds and fog.
• Adiabatic cooling produced by (rapid) pressure reduction at some fixed level. Examples are the tornado or funnel cloud, and "wake" orographic clouds.
CLOUD CLASSIFICATION AND OBSERVED PROPERTIES OF CLOUDS
• Go out and observe visual features
• Do you like sunsets?
• Examine the MIPS measurements in detail.
• Maintain a log for one week.
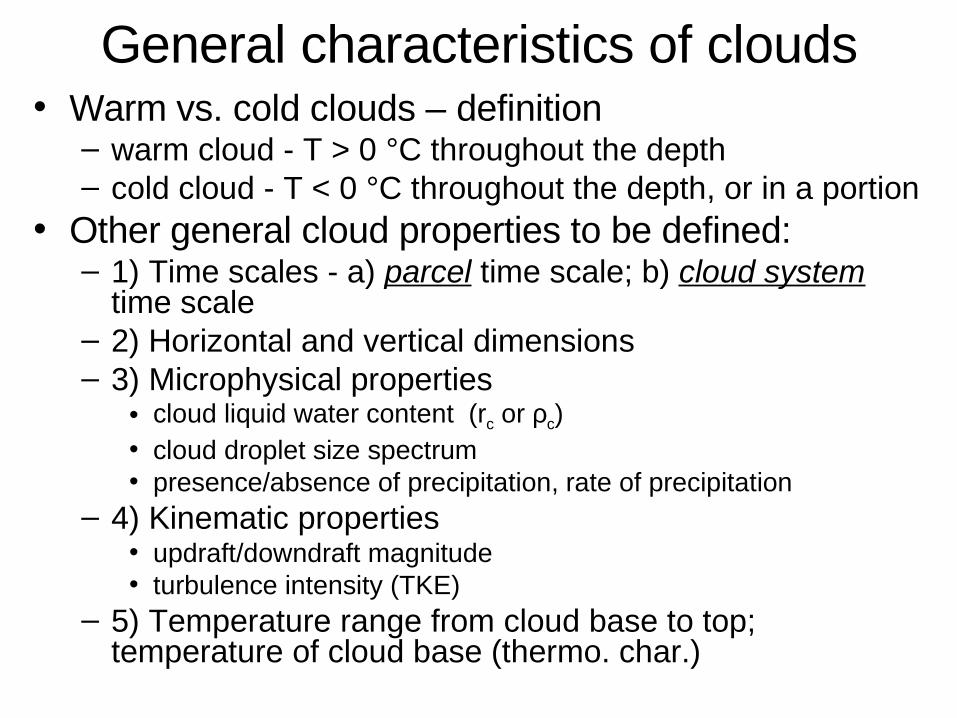
General characteristics of clouds• Warm vs. cold clouds – definition
– warm cloud - T > 0 °C throughout the depth– cold cloud - T < 0 °C throughout the depth, or in a portion
• Other general cloud properties to be defined:– 1) Time scales - a) parcel time scale; b) cloud system
time scale– 2) Horizontal and vertical dimensions– 3) Microphysical properties
• cloud liquid water content (rc or ρc)• cloud droplet size spectrum• presence/absence of precipitation, rate of precipitation
– 4) Kinematic properties• updraft/downdraft magnitude• turbulence intensity (TKE)
– 5) Temperature range from cloud base to top; temperature of cloud base (thermo. char.)
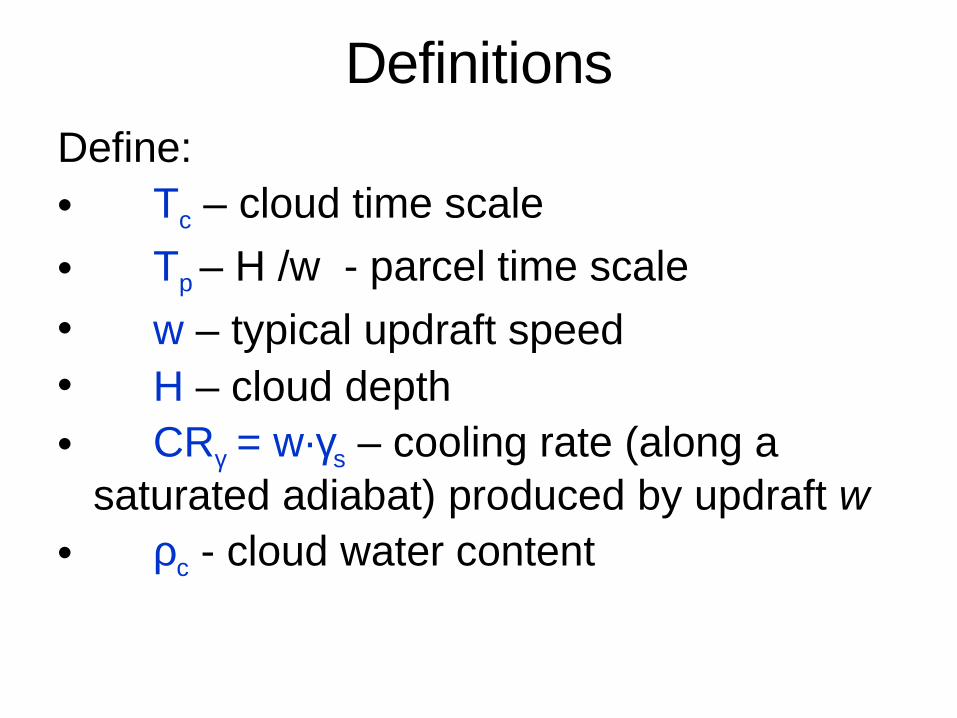
DefinitionsDefine:• Tc – cloud time scale
• Tp – H /w - parcel time scale
• w – typical updraft speed• H – cloud depth• CRγ = w·γs – cooling rate (along a
saturated adiabat) produced by updraft w• ρc - cloud water content
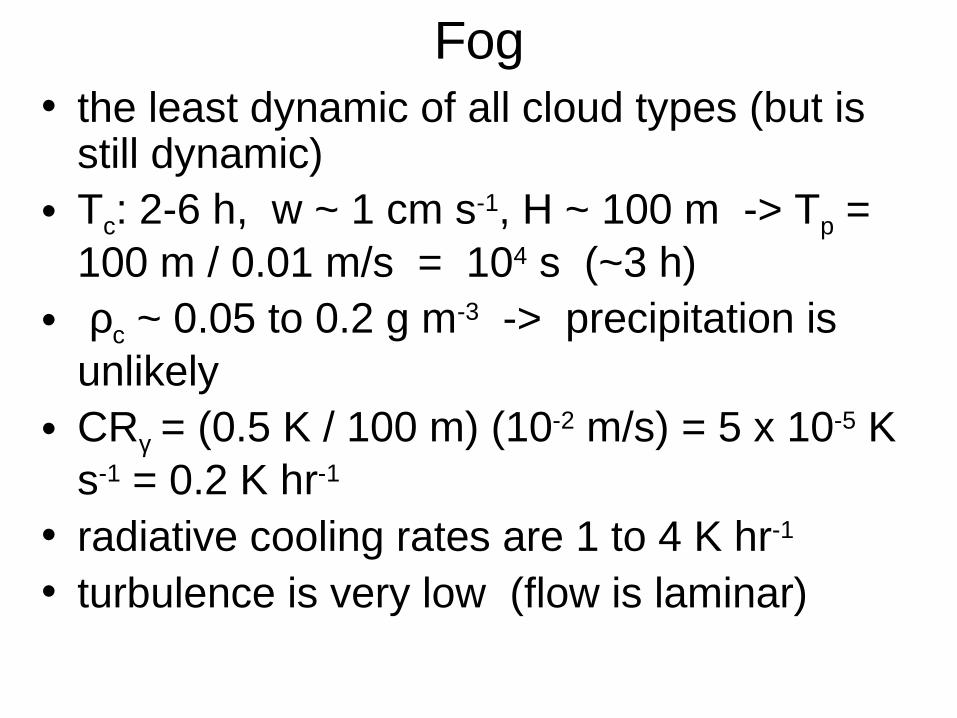
Fog• the least dynamic of all cloud types (but is
still dynamic)• Tc: 2-6 h, w ~ 1 cm s-1, H ~ 100 m -> Tp =
100 m / 0.01 m/s = 104 s (~3 h)• ρc ~ 0.05 to 0.2 g m-3 -> precipitation is
unlikely• CRγ = (0.5 K / 100 m) (10-2 m/s) = 5 x 10⁻⁵ K
s-1 = 0.2 K hr-1
• radiative cooling rates are 1 to 4 K hr-1
• turbulence is very low (flow is laminar)
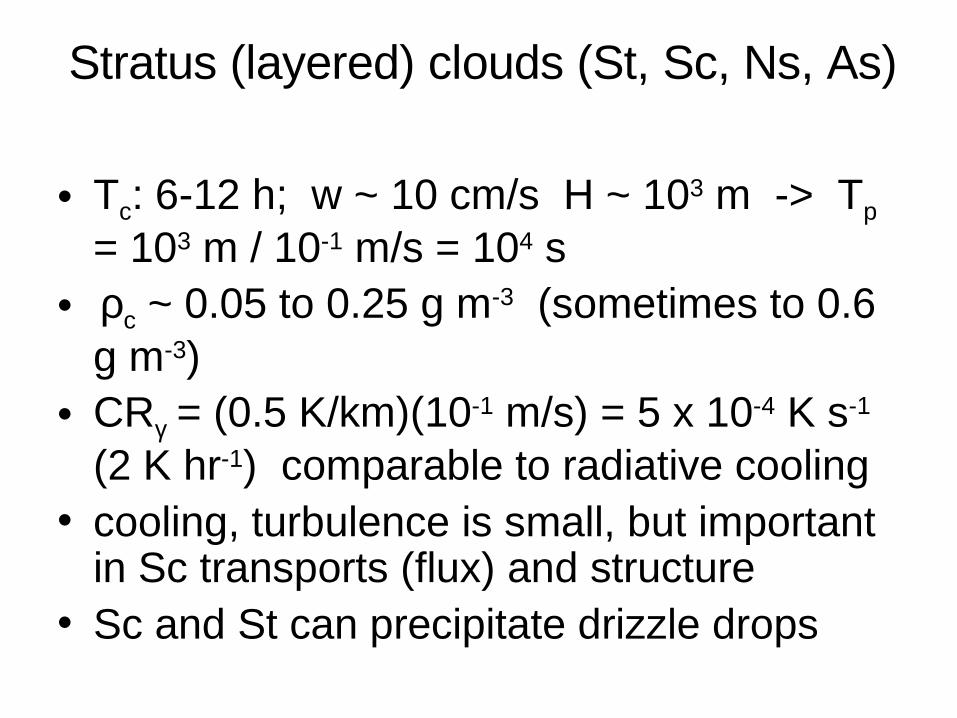
Stratus (layered) clouds (St, Sc, Ns, As)
• Tc: 6-12 h; w ~ 10 cm/s H ~ 103 m -> Tp = 103 m / 10-1 m/s = 104 s
• ρc ~ 0.05 to 0.25 g m-3 (sometimes to 0.6 g m-3)
• CRγ = (0.5 K/km)(10-1 m/s) = 5 x 10⁻⁴ K s-1 (2 K hr-1) comparable to radiative cooling
• cooling, turbulence is small, but important in Sc transports (flux) and structure
• Sc and St can precipitate drizzle drops
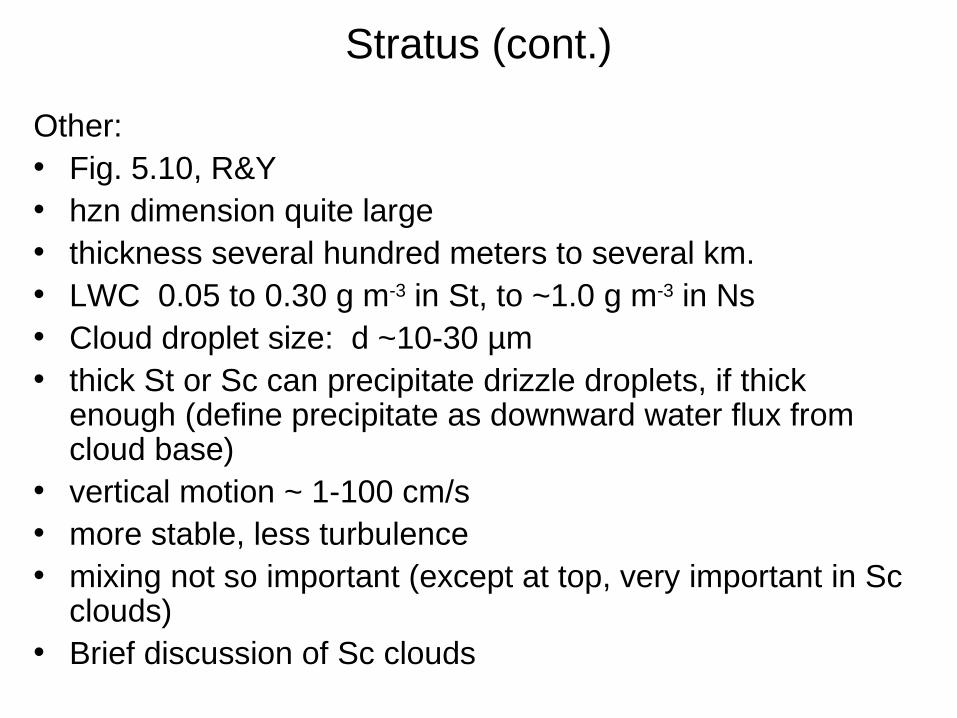
Stratus (cont.)
Other:• Fig. 5.10, R&Y• hzn dimension quite large• thickness several hundred meters to several km.• LWC 0.05 to 0.30 g m-3 in St, to ~1.0 g m-3 in Ns• Cloud droplet size: d ~10-30 µm• thick St or Sc can precipitate drizzle droplets, if thick
enough (define precipitate as downward water flux from cloud base)
• vertical motion ~ 1-100 cm/s• more stable, less turbulence• mixing not so important (except at top, very important in Sc
clouds)• Brief discussion of Sc clouds
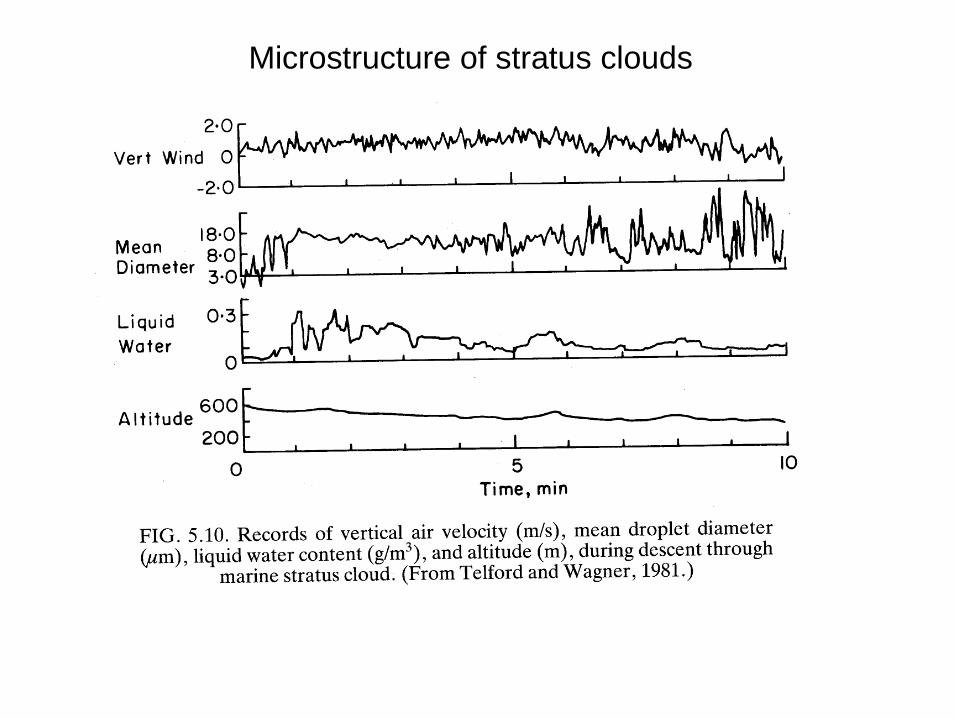
Microstructure of stratus clouds
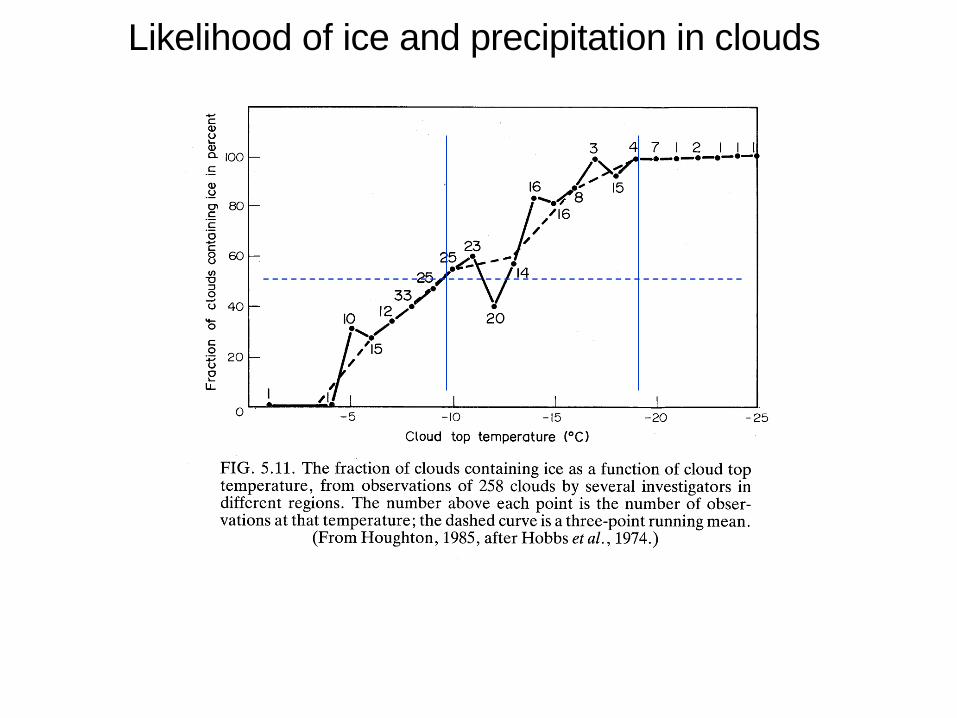
Likelihood of ice and precipitation in clouds
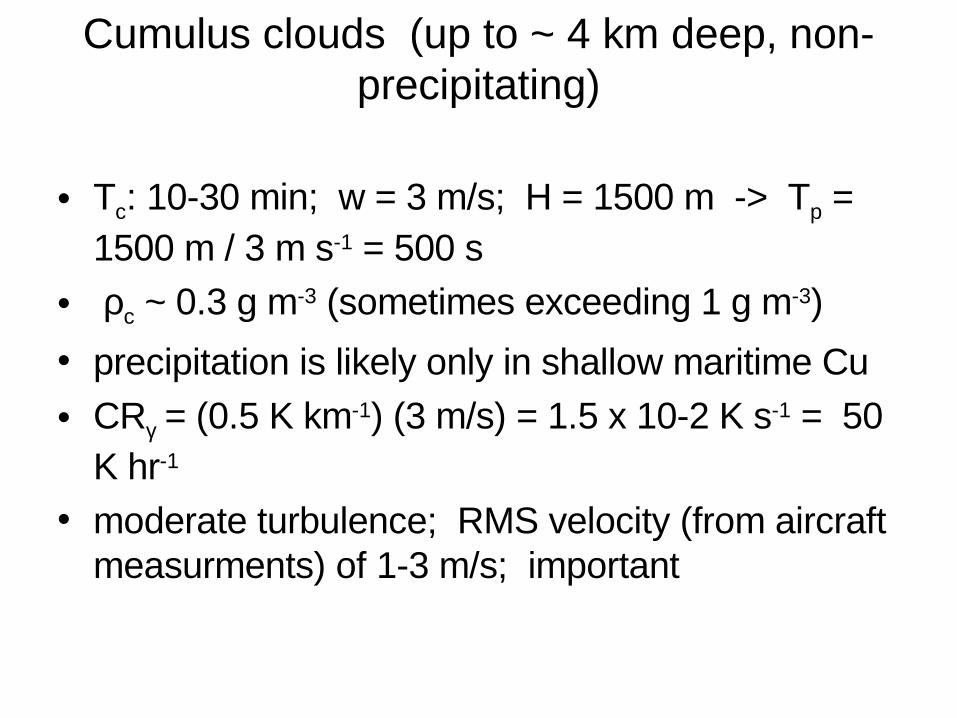
Cumulus clouds (up to ~ 4 km deep, non-precipitating)
• Tc: 10-30 min; w = 3 m/s; H = 1500 m -> Tp = 1500 m / 3 m s-1 = 500 s
• ρc ~ 0.3 g m-3 (sometimes exceeding 1 g m-3)
• precipitation is likely only in shallow maritime Cu
• CRγ = (0.5 K km-1) (3 m/s) = 1.5 x 10⁻² K s-1 = 50 K hr-1
• moderate turbulence; RMS velocity (from aircraft measurments) of 1-3 m/s; important
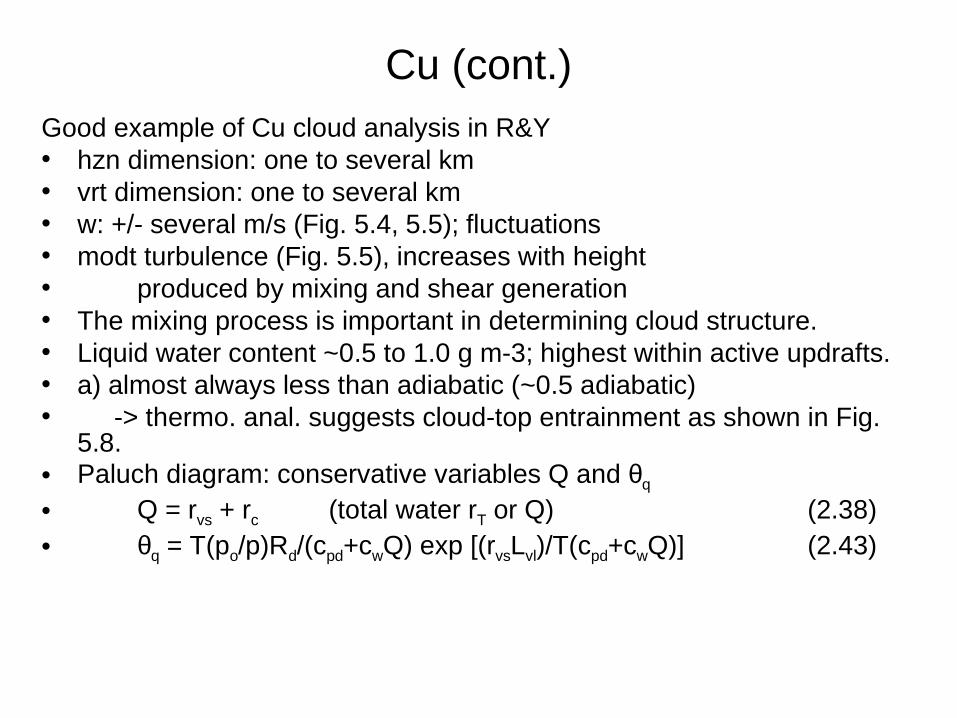
Cu (cont.)Good example of Cu cloud analysis in R&Y• hzn dimension: one to several km• vrt dimension: one to several km• w: +/- several m/s (Fig. 5.4, 5.5); fluctuations• modt turbulence (Fig. 5.5), increases with height• produced by mixing and shear generation• The mixing process is important in determining cloud structure.• Liquid water content ~0.5 to 1.0 g m-3; highest within active updrafts.• a) almost always less than adiabatic (~0.5 adiabatic)• -> thermo. anal. suggests cloud-top entrainment as shown in Fig.
5.8.• Paluch diagram: conservative variables Q and θq
• Q = rvs + rc (total water rT or Q) (2.38)• θq = T(po/p)Rd/(cpd+cwQ) exp [(rvsLvl)/T(cpd+cwQ)] (2.43)
Cu (cont.)b) as cloud vigor increases well beyond several m/s,
adiabatic cloud cores can develop.• Cloud droplet spectra• variation over depth of cloud (Fig. 5.7) - this points
to evolution via the condensation process that we will consider in Chap. 7.
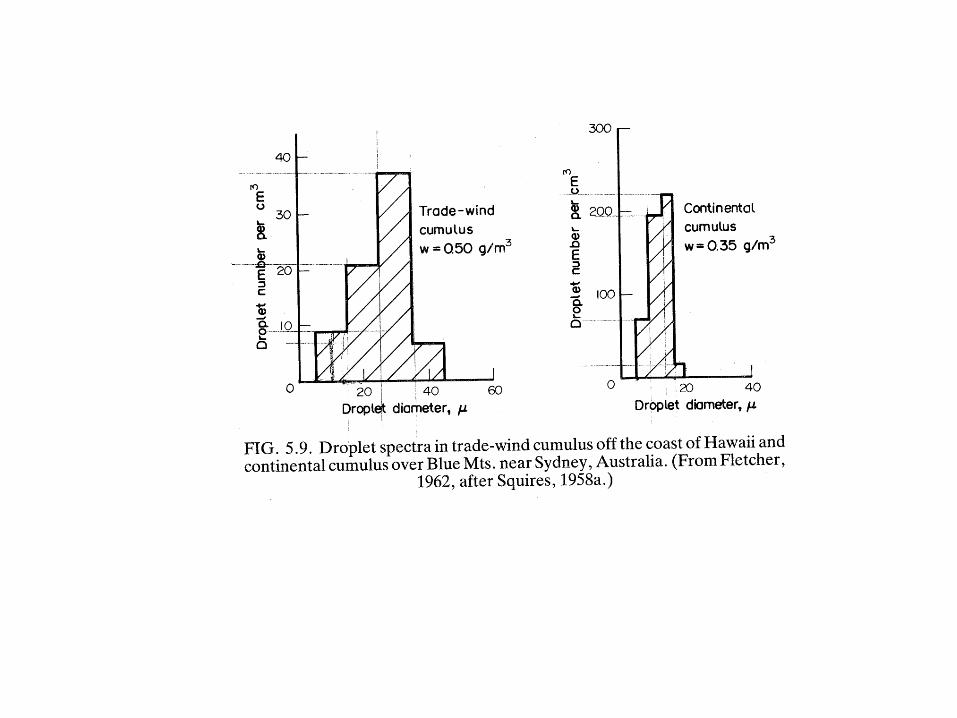
• continental clouds:– d ~ 10-15 mm (Fig. 5.9)– narrow spectra
• maritime clouds– d ~ 25-30 mm – broad spectra - makes maritime Cu more efficient
precip. producers.
QuickTime and aᆰTIFF (Uncompressed) decompressor
are needed to see this picture.
(a) Vertical air velocity (with positive values indicating updrafts and negative values downdrafts), (b) liquid water content, and (c) droplet size spectra at points 1, 2, and 3 in (b), measured from an aircraft as it flew in a horizontal track across the width and about half-way between the cloud base and cloud top in a small, warm, nonraining cumulus cloud. The cloud was about 2 km deep. From Wallace and Hobbs
QuickTime and aᆰTIFF (Uncompressed) decompressor
are needed to see this picture.
(a) Percentage of marine cumulus clouds with indicated droplet concentrations. (b) Droplet size distributions in marine cumulus cloud. (c) Percentage of continental cumulus clouds with indicated droplet concentrations. (d) Dropletsize distributions in a continental cumulus cloud. Note change in ordinate from (b).
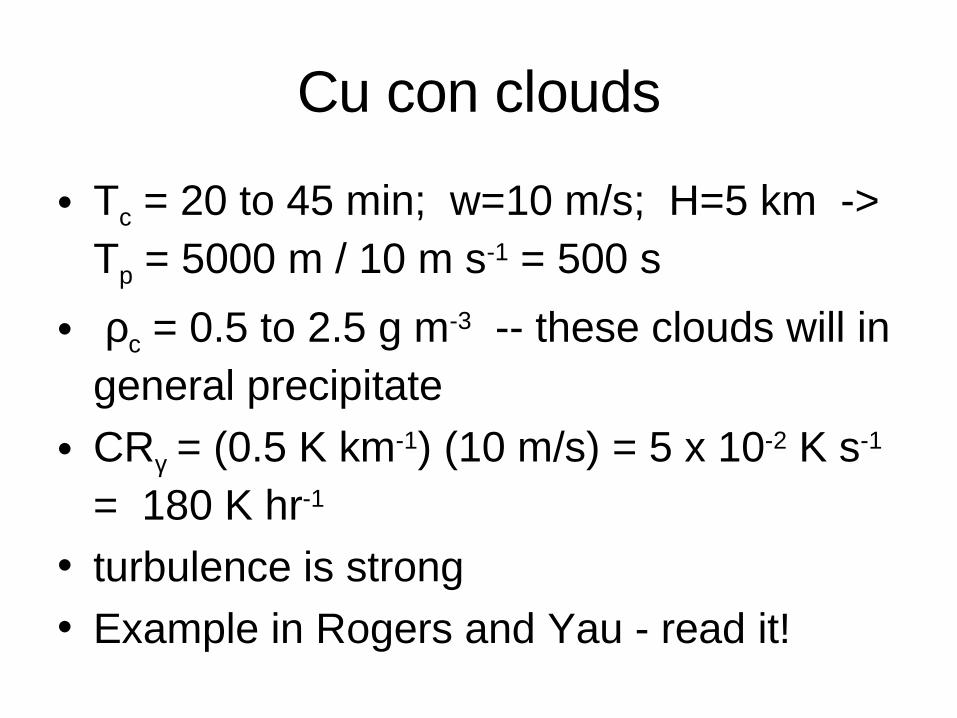
Cu con clouds
• Tc = 20 to 45 min; w=10 m/s; H=5 km -> Tp = 5000 m / 10 m s-1 = 500 s
• ρc = 0.5 to 2.5 g m-3 -- these clouds will in general precipitate
• CRγ = (0.5 K km-1) (10 m/s) = 5 x 10⁻² K s-1 = 180 K hr-1
• turbulence is strong
• Example in Rogers and Yau - read it!
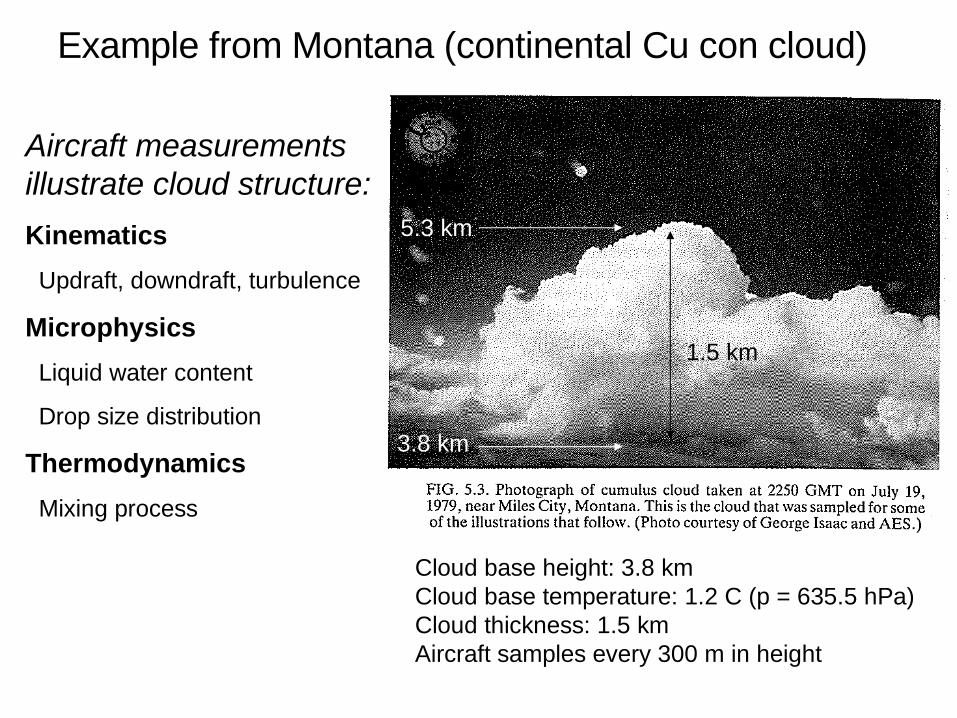
Example from Montana (continental Cu con cloud)
Aircraft measurements illustrate cloud structure:
Kinematics
Updraft, downdraft, turbulence
Microphysics
Liquid water content
Drop size distribution
Thermodynamics
Mixing process
Cloud base height: 3.8 kmCloud base temperature: 1.2 C (p = 635.5 hPa)Cloud thickness: 1.5 kmAircraft samples every 300 m in height
1.5 km
3.8 km
5.3 km
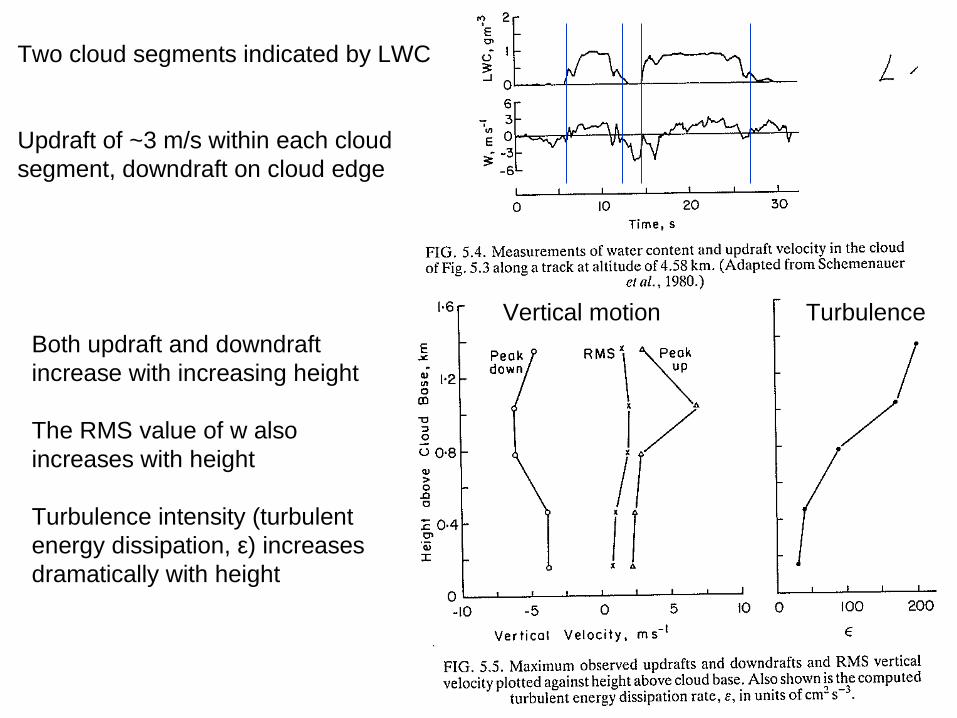
Two cloud segments indicated by LWC
Updraft of ~3 m/s within each cloud segment, downdraft on cloud edge
TurbulenceVertical motionBoth updraft and downdraft increase with increasing height
The RMS value of w also increases with height
Turbulence intensity (turbulent energy dissipation, ε) increases dramatically with height
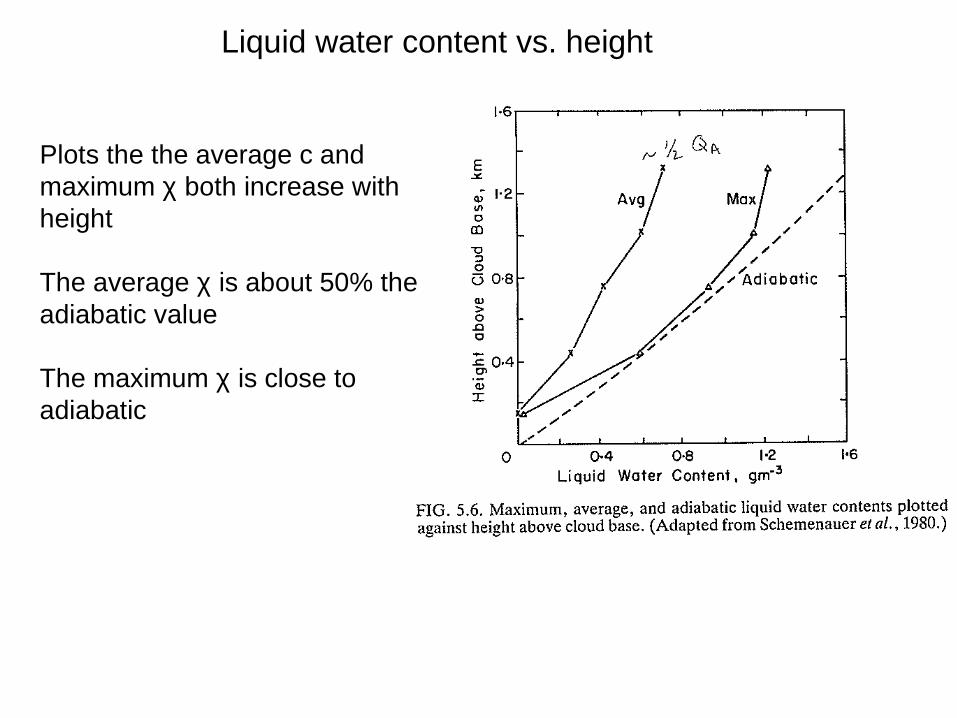
Liquid water content vs. height
Plots the the average c and maximum χ both increase with height
The average χ is about 50% the adiabatic value
The maximum χ is close to adiabatic
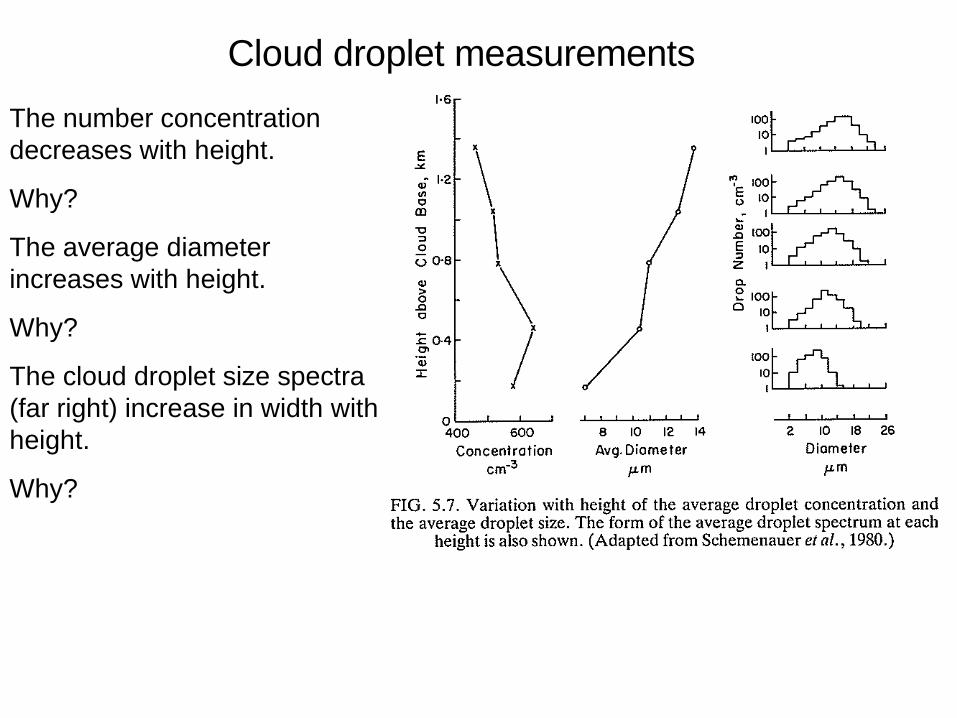
Cloud droplet measurements
The number concentration decreases with height.
Why?
The average diameter increases with height.
Why?
The cloud droplet size spectra (far right) increase in width with height.
Why?
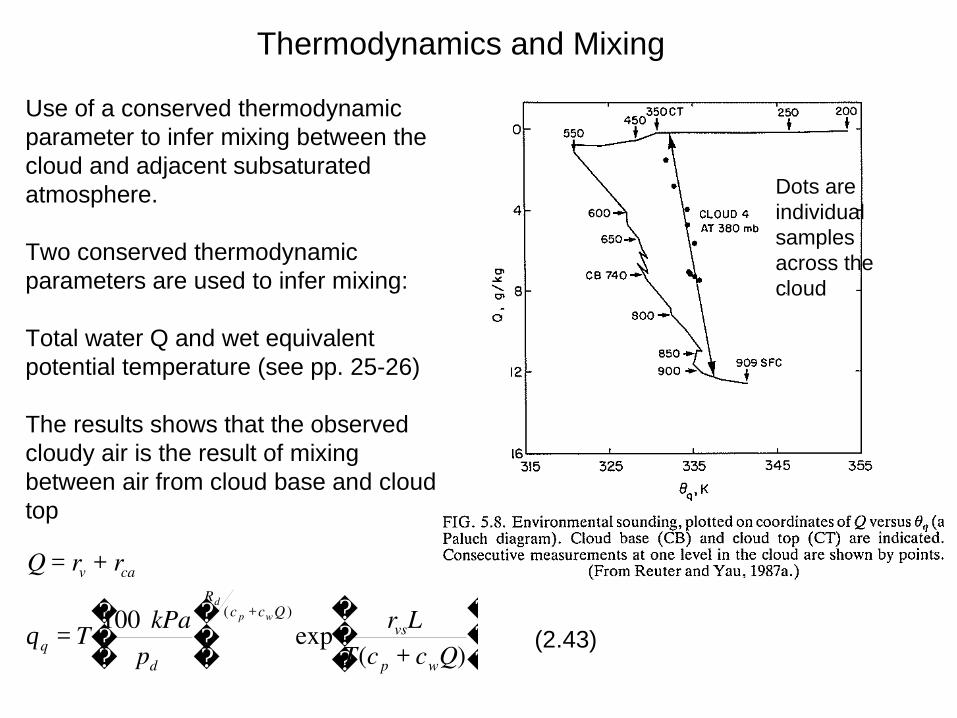
Use of a conserved thermodynamic parameter to infer mixing between the cloud and adjacent subsaturated atmosphere.
Two conserved thermodynamic parameters are used to infer mixing:
Total water Q and wet equivalent potential temperature (see pp. 25-26)
The results shows that the observed cloudy air is the result of mixing between air from cloud base and cloud top
Thermodynamics and Mixing
ä
Q = rv + rca
qq = T 100 kPapd
�
� �
�
� �
Rd(c p +cwQ )
exp rvsLT(c p + cwQ)
�
� �
�
� � (2.43)
Dots are individual samples across the cloud
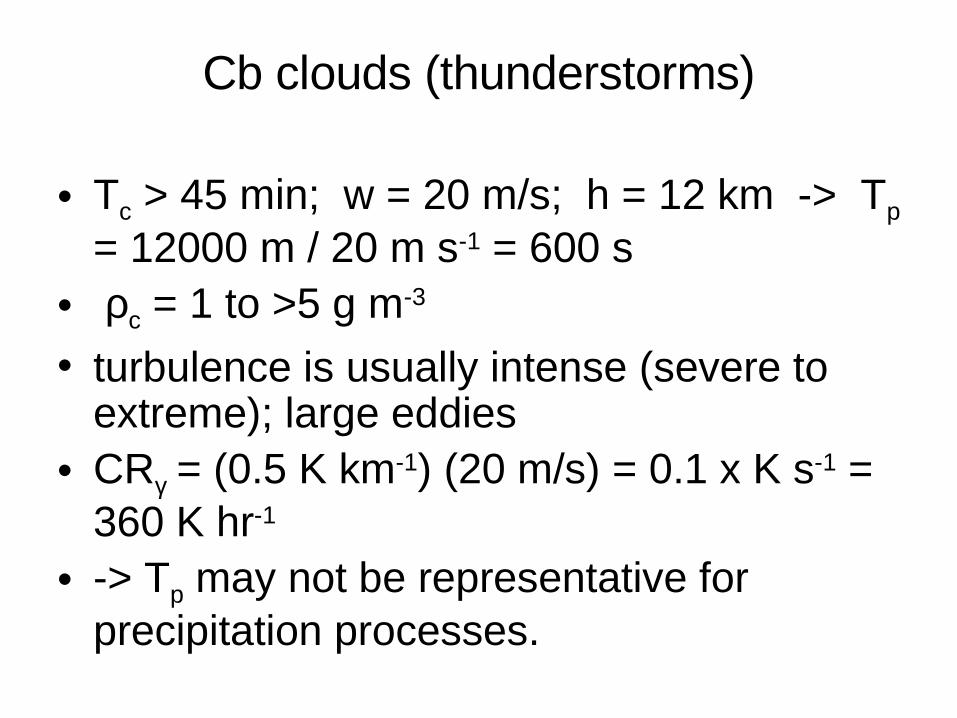
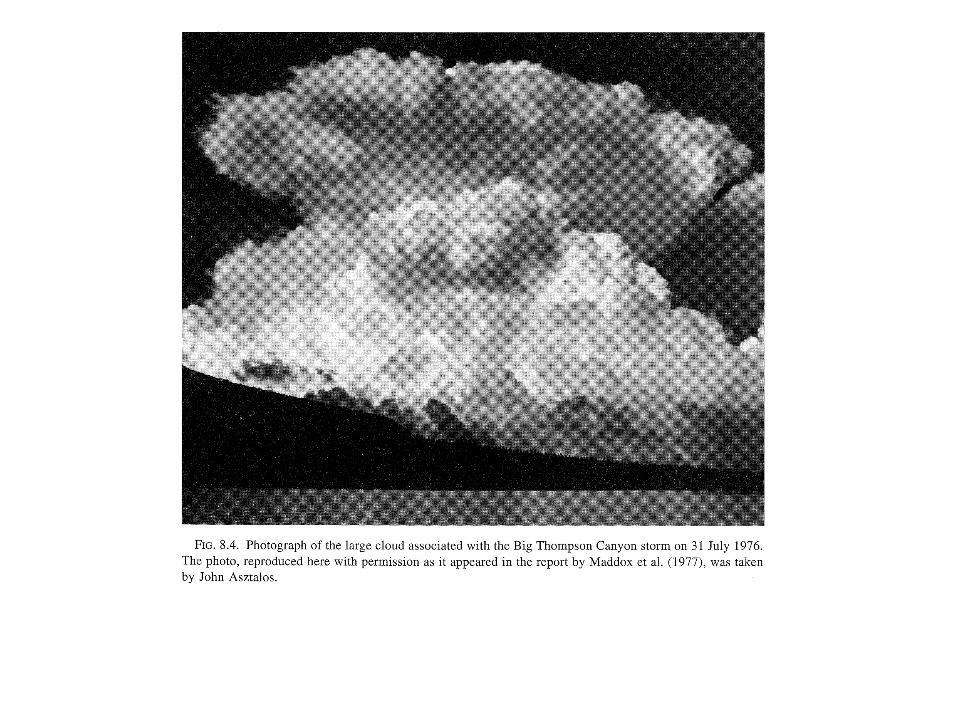
Cb clouds (thunderstorms)
• Tc > 45 min; w = 20 m/s; h = 12 km -> Tp = 12000 m / 20 m s-1 = 600 s
• ρc = 1 to >5 g m-3
• turbulence is usually intense (severe to extreme); large eddies
• CRγ = (0.5 K km-1) (20 m/s) = 0.1 x K s-1 = 360 K hr-1
• -> Tp may not be representative for precipitation processes.
Cb (cont.)• complex dynamics, thermodynamics and
microphysics (very few conservative tracers)
• Note: θq is not conserved since these clouds precipitate
• θe or θw are only approximately conserved (assuming no mixing) in general– (get reduction from melting, increase from freezing)
• presence of ice and water phases complicates thermodynamics, microphysics
• Vigorous (updrafts to >50 m s-1)• Figs. 5.12, 5.13, extra
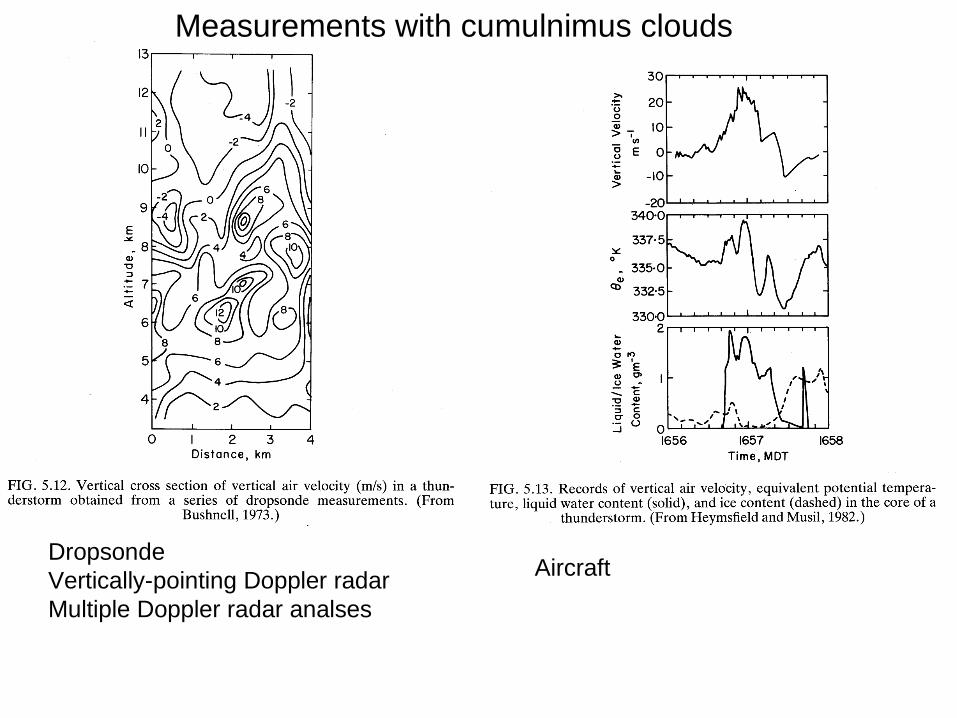
Measurements with cumulnimus clouds
DropsondeVertically-pointing Doppler radarMultiple Doppler radar analses
Aircraft
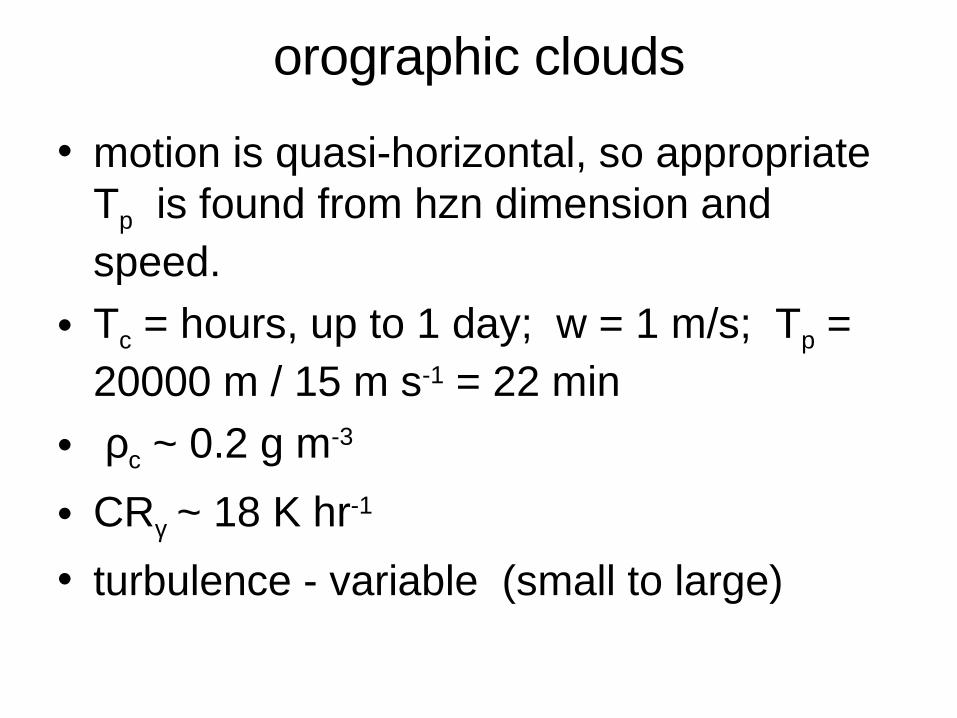
orographic clouds
• motion is quasi-horizontal, so appropriate Tp is found from hzn dimension and speed.
• Tc = hours, up to 1 day; w = 1 m/s; Tp = 20000 m / 15 m s-1 = 22 min
• ρc ~ 0.2 g m-3
• CRγ ~ 18 K hr-1
• turbulence - variable (small to large)
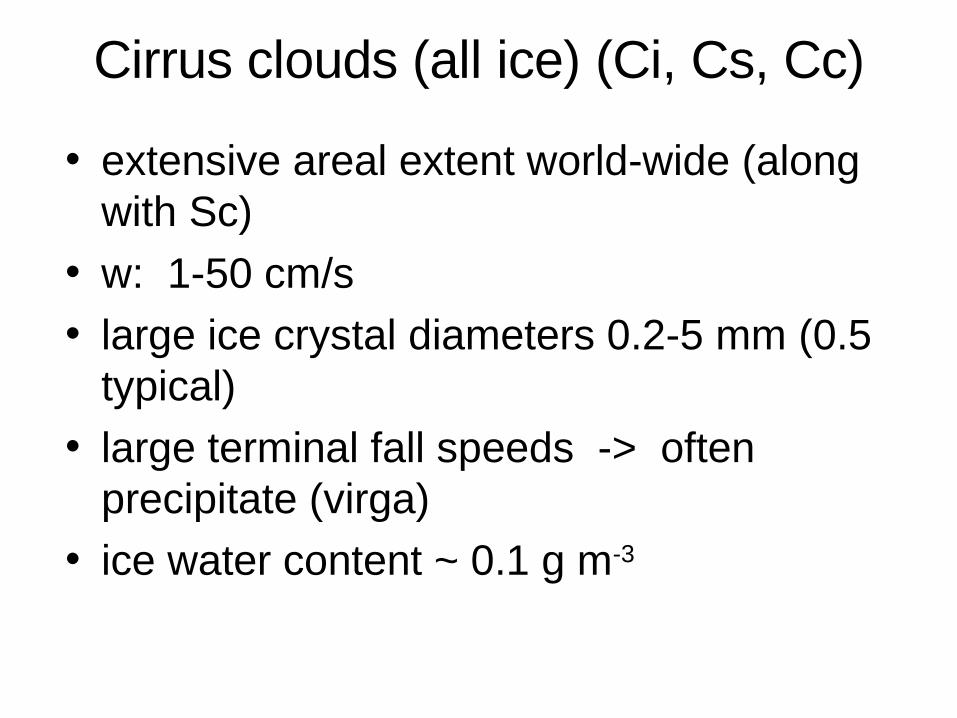
Cirrus clouds (all ice) (Ci, Cs, Cc)
• extensive areal extent world-wide (along with Sc)
• w: 1-50 cm/s• large ice crystal diameters 0.2-5 mm (0.5
typical)
• large terminal fall speeds -> often precipitate (virga)
• ice water content ~ 0.1 g m-3
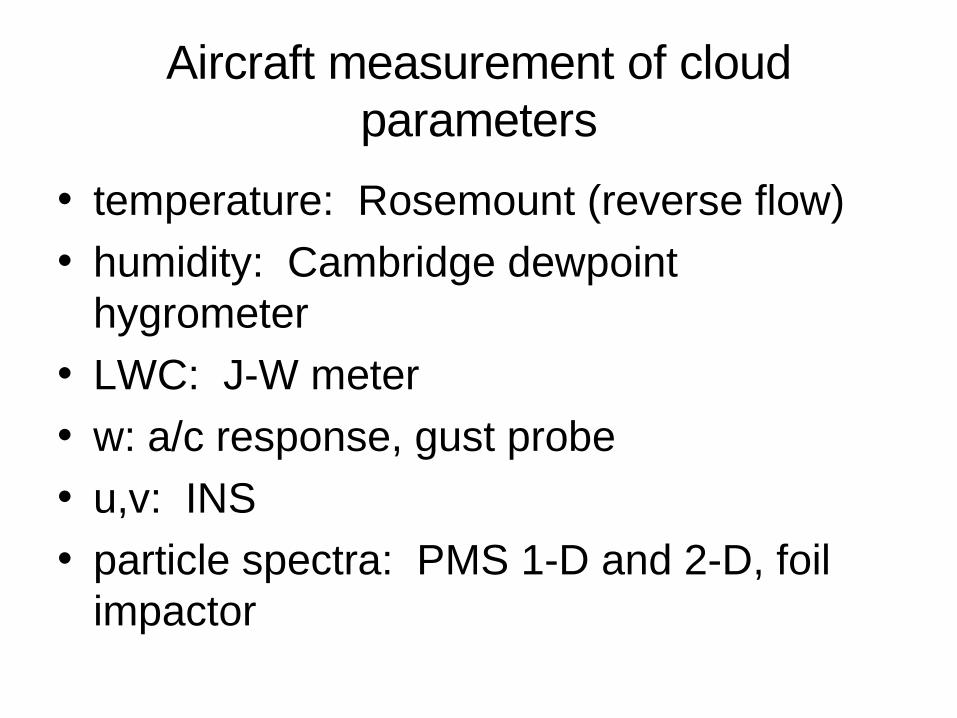
Aircraft measurement of cloud parameters
• temperature: Rosemount (reverse flow)
• humidity: Cambridge dewpoint hygrometer
• LWC: J-W meter
• w: a/c response, gust probe
• u,v: INS
• particle spectra: PMS 1-D and 2-D, foil impactor
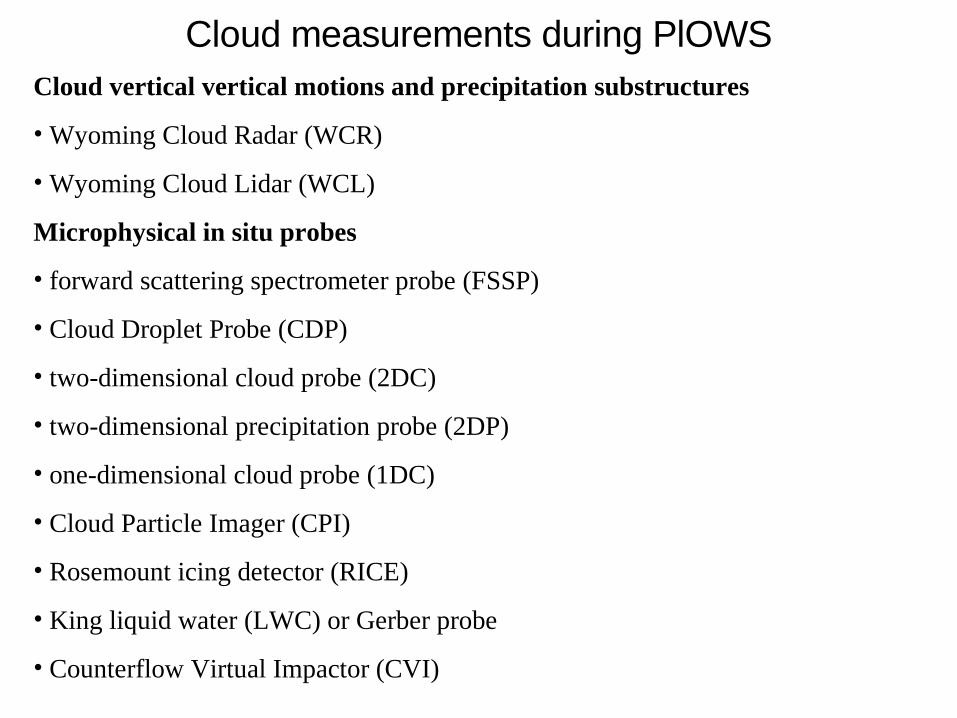
Cloud measurements during PlOWSCloud vertical vertical motions and precipitation substructures
• Wyoming Cloud Radar (WCR)
• Wyoming Cloud Lidar (WCL)
Microphysical in situ probes
• forward scattering spectrometer probe (FSSP)
• Cloud Droplet Probe (CDP)
• two-dimensional cloud probe (2DC)
• two-dimensional precipitation probe (2DP)
• one-dimensional cloud probe (1DC)
• Cloud Particle Imager (CPI)
• Rosemount icing detector (RICE)
• King liquid water (LWC) or Gerber probe
• Counterflow Virtual Impactor (CVI)
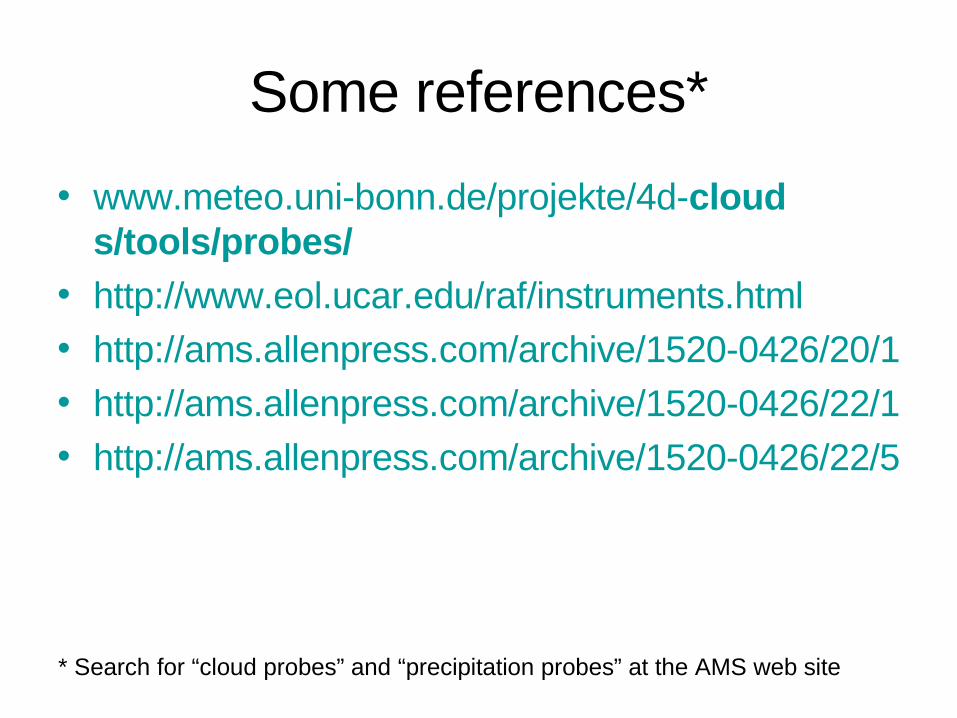
Some references*
• www.meteo.uni-bonn.de/projekte/4d-clouds/tools/probes/
• http://www.eol.ucar.edu/raf/instruments.html• http://ams.allenpress.com/archive/1520-0426/20/1/pdf/i1520-0426-20-1-133.pdf
• http://ams.allenpress.com/archive/1520-0426/22/11/pdf/i1520-0426-22-11-1748.pdf• http://ams.allenpress.com/archive/1520-0426/22/5/pdf/i1520-0426-22-5-528.pdf
* Search for “cloud probes” and “precipitation probes” at the AMS web site
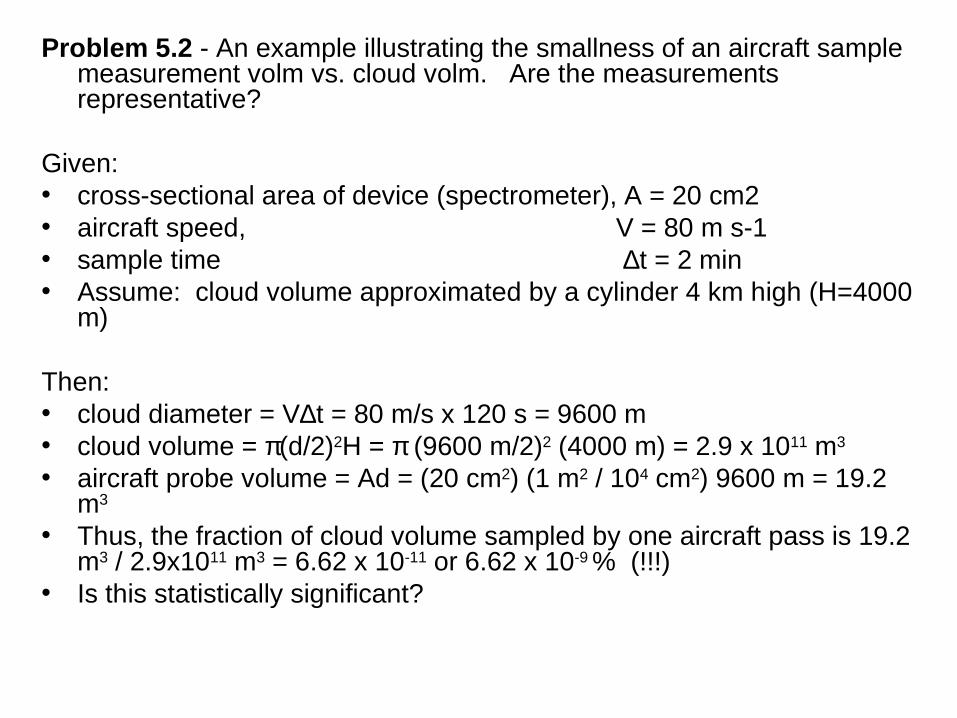
Problem 5.2 - An example illustrating the smallness of an aircraft sample measurement volm vs. cloud volm. Are the measurements representative?
Given:• cross-sectional area of device (spectrometer), A = 20 cm2• aircraft speed, V = 80 m s-1• sample time ∆t = 2 min• Assume: cloud volume approximated by a cylinder 4 km high (H=4000
m) Then:• cloud diameter = V∆t = 80 m/s x 120 s = 9600 m• cloud volume = π(d/2)2H = π (9600 m/2)2 (4000 m) = 2.9 x 10¹¹ m3
• aircraft probe volume = Ad = (20 cm2) (1 m2 / 104 cm2) 9600 m = 19.2 m3
• Thus, the fraction of cloud volume sampled by one aircraft pass is 19.2 m3 / 2.9x10¹¹ m3 = 6.62 x 10⁻¹¹ or 6.62 x 10⁻⁹ % (!!!)
• Is this statistically significant?
Problem assignment
• Read Rogers and Yau, Chap. 5
• Problems 5.1, 5.3, 5.5
• Read Chap. 6