Closing The Achievement Gap For English Language Learners ...
184
University of Central Florida University of Central Florida STARS STARS Electronic Theses and Dissertations, 2004-2019 2008 Closing The Achievement Gap For English Language Learners:a Closing The Achievement Gap For English Language Learners:a Comparison Of Language Arts/esol And One-way Developmental Comparison Of Language Arts/esol And One-way Developmental Bilingual Bilingual Kimberly Marlow University of Central Florida Part of the Educational Leadership Commons Find similar works at: https://stars.library.ucf.edu/etd University of Central Florida Libraries http://library.ucf.edu This Doctoral Dissertation (Open Access) is brought to you for free and open access by STARS. It has been accepted for inclusion in Electronic Theses and Dissertations, 2004-2019 by an authorized administrator of STARS. For more information, please contact [email protected]. STARS Citation STARS Citation Marlow, Kimberly, "Closing The Achievement Gap For English Language Learners:a Comparison Of Language Arts/esol And One-way Developmental Bilingual" (2008). Electronic Theses and Dissertations, 2004-2019. 3569. https://stars.library.ucf.edu/etd/3569
Transcript of Closing The Achievement Gap For English Language Learners ...
University of Central Florida University of Central Florida
STARS STARS
Electronic Theses and Dissertations, 2004-2019
2008
Closing The Achievement Gap For English Language Learners:a Closing The Achievement Gap For English Language Learners:a
Comparison Of Language Arts/esol And One-way Developmental Comparison Of Language Arts/esol And One-way Developmental
Bilingual Bilingual
Kimberly Marlow University of Central Florida
Part of the Educational Leadership Commons
Find similar works at: https://stars.library.ucf.edu/etd
University of Central Florida Libraries http://library.ucf.edu
This Doctoral Dissertation (Open Access) is brought to you for free and open access by STARS. It has been accepted
for inclusion in Electronic Theses and Dissertations, 2004-2019 by an authorized administrator of STARS. For more
information, please contact [email protected].
STARS Citation STARS Citation Marlow, Kimberly, "Closing The Achievement Gap For English Language Learners:a Comparison Of Language Arts/esol And One-way Developmental Bilingual" (2008). Electronic Theses and Dissertations, 2004-2019. 3569. https://stars.library.ucf.edu/etd/3569

CLOSING THE ACHIEVEMENT GAP FOR ENGLISH LANGUAGE LEARNERS: A COMPARISON OF LANGUAGE ARTS/ESOL AND ONE-WAY
DEVELOPMENTAL BILINGUAL PROGRAMS
by
KIMBERLY R. MARLOW B.S. University of Central Florida, 1991 M.A. University of Central Florida, 1994 Ed.S. University of Central Florida, 2004
A dissertation submitted in partial fulfillment of the requirements for the degree of Doctor of Education
in the Department of Educational Research, Technology, and Leadership in the College of Education
at the University of Central Florida Orlando, Florida
Spring Term 2008
Major Professor: Barbara A. Murray

ii
© Kimberly R. Marlow
iii
ABSTRACT
The present study was conducted to investigate two English Language Learner
programs in one Florida county and their implications for student achievement. The
literature review showed that, as students progress through the educational system, the
academic content becomes more and more abstract, forcing students to rely more heavily
on their oral and written communication skills in English. Significant achievement gaps,
sometimes extremely large, were also identified between English-only students and
English Language Learner students. One study highlighted a 46% gap on the 2005
National Assessment of Education Progress (NAEP).
The present study was designed to investigate 23 middle schools in one Florida
county. The focus of the study was on two English Language Learner programs:
Language Arts/ESOL and One-Way Developmental Bilingual Education. A total of 13
schools were identified that had implemented the Language Arts/ESOL program, and 10
middle schools were identified that had implemented the One-Way Developmental
Bilingual Education program. The 2007 FCAT reading mean scale scores for the schools’
7th-grade English Language Learners were compared to those of standard curriculum
students.
For both English Language Learner programs, a statistical significance was found
using t-tests. In addition, FCAT reading Levels 1-5 were investigated. At FCAT Levels
1-3, the Language Arts/ESOL program out-performed the One-Way Developmental
Bilingual Education program. At FCAT Levels 4 and 5, the One-Way Developmental
Bilingual Education program out-performed the Language Arts/ESOL program.

iv
I would like to dedicate this study to my wonderful husband, Bob, who for six years
made sure that I kept studying and writing, all the while providing love, support, and
encouragement. This study would not have been completed without his taking care of the
many activities that needed attention. I would, also, like to dedicate this study to my
loving parents: My mom, Rita, who inspired me to take the first steps to go to college at
the age of 28, and to my dad, Dean, who always knew that I could do it.
v
ACKNOWLEDGMENTS
This dissertation would not have been possible without the help of many people
along the way. I would, first, like to acknowledge Dr. Barbara A. Murray, the Chair of
my Dissertation Committee, who for six years encouraged me to keep going. Her
enthusiasm for English Language Learner students fueled my desire to keep seeking out
information that would help future students who strive to learn English as a second
language. Her excitement over the countless hours and her dedication to help students
kept me focused and disciplined as I studied and wrote.
I would, also, like to acknowledge my Committee members: Dr. Kenneth T.
Murray whose expertise in state and federal law inspired me to keep searching for more
policies and case law that protect English Language Learner students; Dr. Larry C. Holt,
who, as one of my first professors at UCF, was a constant source of encouragement; and
Dr. Walter J. Doherty who was a genuine enthusiast for research on English Language
Learner students.
In addition, I would like to acknowledge Dr. Mary Ann Lynn, whom I met when I
first became interested in the program, and who served as my editor. I would, also, like to
acknowledge my many colleagues who along the way provided answers to the countless
questions that were necessary in the completion of the study. And, finally, I would like to
acknowledge my friends and family who were always there when I needed them despite
my limited time with them over the years.
vi
TABLE OF CONTENTS
LIST OF TABLES........................................................................................................... viii
CHAPTER 1 THE PROBLEM AND ITS CLARIFYING COMPONENTS.................... 1 Introduction............................................................................................................. 1 Background of the Study ........................................................................................ 2 Statement of the Problem........................................................................................ 9 Definitions of Terms ............................................................................................... 9 Delimitations......................................................................................................... 13 Limitations ............................................................................................................ 13 Assumptions.......................................................................................................... 14 Theoretical Framework......................................................................................... 14 Research Questions............................................................................................... 16 Hypotheses............................................................................................................ 17 Methodology......................................................................................................... 18 Organization of the Study ..................................................................................... 19
CHAPTER 2 REVIEW OF LITERATURE.................................................................... 20 Introduction........................................................................................................... 20 Language Acquisition ........................................................................................... 25 Other Influences on Language Acquisition .......................................................... 30 Assessment and Achievement Gap....................................................................... 36
Assessment................................................................................................ 36 Achievement Gap...................................................................................... 40
Bilingual Education .............................................................................................. 46 History of Bilingual Education ................................................................. 46 Identification of English Language Learners............................................ 49 State of Florida Statutes ............................................................................ 51 Bilingual Programs ................................................................................... 52 Basic Mainstream Instruction with Language Arts/ESOL Model............ 55 Home School Basic program/ESOL K-12................................................ 56 ESOL (English for Speakers of Other Languages) Pullout ...................... 57 Immersion ................................................................................................. 57 One-way Developmental Bilingual/ESOL Education .............................. 58 Sheltered Instruction ................................................................................. 60 Structured English Immersion (California Proposition 227) .................... 62 Submersion ............................................................................................... 63 Two-Way Immersion ................................................................................ 64 English as a Second Language Teacher Education and Training ............. 66
Major Federal and State Policy and Case Law ..................................................... 69 Summary ............................................................................................................... 94

vii
CHAPTER 3 METHODOLOGY .................................................................................... 96 Introduction........................................................................................................... 96 Sampling Method.................................................................................................. 97 Data Collection Procedures................................................................................... 97 Instrumentation ..................................................................................................... 98
Instrument Validity and Reliability ........................................................ 100 Research Questions............................................................................................. 104 Hypotheses.......................................................................................................... 105 Procedures........................................................................................................... 106 Summary ............................................................................................................. 109
CHAPTER 4 ANALYSIS OF DATA ........................................................................... 110 Introduction......................................................................................................... 110 Research Questions............................................................................................. 111
Research Question 1 ............................................................................... 111 Research Question 2 ............................................................................... 114 Research Question 3 ............................................................................... 118 Research Question 4 ............................................................................... 137 Research Question 5 ............................................................................... 139
CHAPTER 5 SUMMARY, CONCLUSIONS, AND RECOMMENDATIONS .......... 142 Summary and Discussion of Findings ................................................................ 142
Research Question 1 ............................................................................... 143 Research Question 2 ............................................................................... 144 Research Question 3 ............................................................................... 145 Research Question 4 ............................................................................... 151 Research Question 5 ............................................................................... 152
Conclusions......................................................................................................... 153 Implications for Practice ..................................................................................... 157 Recommendations for Future Research .............................................................. 159
APPENDIX INSTITUTIONAL REVIEW BOARD APPROVAL............................... 161
LIST OF REFERENCES................................................................................................ 163
viii
LIST OF TABLES Table 1 Analysis of Means: Research Question 1 ......................................................... 112
Table 2 Group Statistics: Research Question 1.............................................................. 114
Table 3 Analysis of Means: Research Question 2 ......................................................... 115
Table 4 Group Statistics: Research Question 2.............................................................. 117
1
CHAPTER 1 THE PROBLEM AND ITS CLARIFYING COMPONENTS
Introduction
As a country rich in the tradition of immigration, the United States has historically
been a country full of people who have migrated and settled, hoping for greater
opportunity. The 2000 United States Census provided data that reflected 12.5% of
Americans are from Hispanic or Latino origin. Short and Echevarria (2005) stated that
the 2004-2005 school year included 5.5 million students who were designated as Limited
English Proficient. By 2050, the Latino population was expected to reach 24% and the
Asian population was expected to reach 10% of the total population (Lindholm-Leary,
2003). Lessow-Hurley (2003) stated:
Newcomers to the United States tend to be younger than highly assimilated traditional populations, so schools have felt the impact of population changes in the later part of the 20th century and the beginning of the 21st more rapidly and more dramatically than other social and government institutions. (p. 1) In 2001, the Office of English Language Acquisition of the United States
Department of Education reported more than 4.4 million school children were designated
as English Language Learners (Lessow-Hurley, 2003). Lessow-Hurley cautioned that
exacting the precise number of students who need second language services was difficult
due to the various methods that states used to measure language proficiency and student
needs. Additionally, in the 1995 position paper of the National Association for the
Education of Young Children, this agency reported, “Approximately, 9.9 million of the
estimated 45 million school-age children, more than one in five, live in households in

2
which languages other than English are spoken” (Waggoner qtd. in National Association
for the Education of Young Children, p. 2).
At the time of the present study, the total number of second language student
population was high. For example, approximately 25% of California’s public school K-
12 students were English Language Learner (ELL) students (Lessow-Hurley, 2003).
These data were significant since the public school students in California represented
10% of the total public school students in the United States. Other states with large
numbers of ELLs included Florida, Texas, and New York. Miller, Miller, and Schroth
(1997) stated that the predictions for public school student numbers were ones to which
schools should pay attention. Lindholm-Leary (2003) predicted, “An ever increasing
percentage of students enter school not proficient in English” (p. 1).
Background of the Study
Frequently, children are entering school with little or limited use of the English
language (Green, 2003). Migrant children in the United States have been a fast growing
population, especially in Florida, Texas, and California. These 3 states have functioned as
“sending or home bases” for migrant families as the families move about the remaining
“45 contiguous ‘receiving’ states” (p. 57). Green cited the Urban Institute’s 2000 research
which suggested that there were 650,000 migrant children traveling with their families.
Mexican children constituted the greatest majority who are most frequently in Texas and
California. These children represented diversity in cultures but were tied together by
3
“poverty, inadequate health care, substandard housing, and astonishingly poor
educational achievement” (p. 62).
According to the August 2005 report from the Office of Economic and
Demographic Research, 34% of Florida’s ELL students were born abroad with 66% of
the students born in the United States. These students were born in 273 foreign countries
in addition to the United States and were speakers of approximately 277 different
languages. A total of 58% of these students were born in Cuba, Mexico, Haiti, Colombia,
Venezuela, Jamaica, Peru, and Brazil. Students receiving second language services have
been closely divided with 51% born in the United States and 49% born abroad. Spanish
has been the dominant minority language for students born in the United States and
abroad if they speak a language other than English. This ever-increasing student diversity
has alerted public school personnel that teachers need to acquire the skills necessary to
promote acceptance and to teach students so that they are successful (Miller & Miller,
1997).
Under state and federal requirements to meet the need for high standards of
achievement for second language learners, schools have been challenged with meeting
the language acquisition needs of the student as well as the academic needs of the student
(Bohn & Sleeter, 2000). The No Child Left Behind Act of 2001 required all public school
students to reach high standards of proficiency by 2014 (Abedi & Dietel, 2004).
State tests have shown the gap that English language learning students have with
their academic performance on standardized tests. Sometimes, the gap between ELLs and
English speaking students has been as wide as 20 to 30 percentage points (Abedi &
4
Dietel, 2004). The longitudinal data have shown little improvement across the years.
According to the National Assessment of Educational Progress (NAEP), Latino students
from low socio-economic backgrounds have typically scored two years behind other
students in the fourth grade (White-Clark, 2005). This gap widens by 12th grade, and
these students are nearly four years behind English speaking students. English Language
Learner students may be underestimated by their teachers, and this can affect their
student achievement as well.
High stakes testing can start as early as Head Start, and heavy emphasis on higher
student achievement has created an even bigger gap for English Language Learners. At
the time of the present study, 25 states had graduation requirements that included a high-
stakes test. It was anticipated that other states would follow suit (Bielenberg & Fillmore,
2005). California’s 1.6 million English Language Learners represented one in four
students who were designated as English Language Learners.
Bazron, Osher, and Fleischman (2005) stated that there is a growing body of
evidence that needs to be addressed regarding the cultural and linguistic needs of ELL
students. Ferguson et al. (2001) found:
Successfully including students with so many differences and different ways of learning challenges schools to reinvent themselves as more flexible, creative learning communities that include and are responsive to a full range of human diversity. This newly defined diverse norm replaces the old statistically derived, bellshaped-curve norm that uncompromisingly identifies some students as “inside” and others as “outside.” (p. 1)
Bazron et al. (2005) added that many schools have a tendency to downplay or
ignore the needs and strengths of the increasing second language learning student
5
population. This cultural disconnect can lead to increased discipline problems, inferior
self-concepts, and poor academic achievement (Osher et al. cited in Bazron et al.). Part of
the problem was that teachers have not had the training to help ELL students, and,
sometimes, teachers misinterpreted the behavior because of the cultural differences. The
most powerful approach has been to help teachers to provide a culturally rich classroom
where instruction takes into consideration the cultural value systems of diverse
populations (Bazron et al.).
Despite the success of educating bilingual students in these classrooms, a
stereotype has developed, often alienating the teachers and the students from mainstream
school activities and involvement (Calderon, 1997). In addition to academic remediation,
the remedial label has, also, served to deprive students from high expectations and
educational opportunities. The isolation created by such programming has created an “us
vs. them” mentality among the mainstream teachers and the bilingual teachers wherein
the students are placed at a disadvantage when compared to mainstream education
students (Calderon, p. 2).
When comparing ELL students to native English speakers, the dropout rate has
been higher for ELL students, and significant achievement gaps have been reported on
state and national assessments (Snow & Biancarosa cited in Short & Echevarria, 2004).
Students have had an added challenge of learning English and at the same time
comprehending and applying English to meet the high academic standards that are set in
the nation’s schools. Short and Echevarria cautioned that students could be placed in
6
academic classrooms and expected to complete the work just like English-only speaking
students.
Thomas and Collier (1997b) reported that students who were not yet proficient in
English could perform at or above grade level in mathematics, science, and social studies,
but their English acquisition rate was not as fast as their grasp of other subjects. A typical
English-speaker will gain 10 months of learning in a 10 months time, but ELL students
who have not yet reached full English proficiency can score three or more years below
their current grade level on standardized tests because they cannot demonstrate in English
all that they know. In order to keep pace with mainstream students, ELL students must
make one-and-one-half year’s progress each academic year on the standardized tests.
Green (2003) cited Thomas & Collier’s 2000 study which tracked the academic
progress of ELL students. It was found in this study that when instruction was given in
English only, ELL students took approximately 7 to 10 years of English language
instruction to reach proficiency in language and academic performance. Students who
had 2 to 3 years of schooling in their first language from education in their native country
took about 5 to 7 years to reach the same performance levels. They, also, found that
students who were schooled in successful bilingual programs in the United States usually
took between 4 and 7 years to reach this same proficiency.
Lessow-Hurley (2003) supported the work of Cummins who found that initially
students who learn English as a second language were first in the Cognitive Academic
Language Proficiency (CALP) stage, speaking English without knowing any of the
context-related clues. Later, students entered the Basic Interpersonal Communication
7
Stage (BICS) stage and extract meaning with content and situational clues when they
were speaking English (Lessow-Hurley).
According to Krashen (1997), students who speak a language other than English
for their first language will read and comprehend English more comprehensibly if they
already read in their first language. When literacy was already mastered in the first
language, the language transferred to the second language. Krashen supported a bilingual
education model that was rich in first language support, placing students initially in
English as second language classes, then in sheltered classes with first language support,
and, finally, in mainstream classes. As students advanced, the only subjects taught in the
first language were the most abstract classes in language arts and social studies. When a
student reached full mainstream capability, advanced first language classes were
available as an option.
Krashen (1997) reported that when limited English proficient (LEP) students had
access to books at home and at school, their literacy in their first language transferred to
English, but much of the problem fell on students who had little or no access to books in
the home. Tompkins (2000) stated that access to books in the home promotes literacy, but
many LEP students do have books in their homes. The only English that some students
encounter in a day was at school since they may live in a community that spoke a second
language and live in a family that spoke a language other than English (Krashen).
In a position paper from the National Association for the Education of Young
Children (1995), it was contended:
8
The United States is a nation of great cultural diversity, and our diversity creates opportunities to learn and share both similar and different experience. There are opportunities to learn about people from different backgrounds; the opportunity to foster a bilingual citizenry with skills necessary to succeed in a global economy; and opportunities to share one’s own cherished heritage and traditions with others. (p. 3) Short and Echevarria (2005) believed that public school systems and teachers
performed a disservice for ELL students if these students were all grouped together and
treated the same. Second language learners have come from all over the world and bring
their histories and their cultures with them to the nation’s schools. Some ELL students
have an extensive educational background and perform at or above grade level while
other students may not have ever stepped foot into a classroom.
Since each student brings his or her own history into the classroom, students may
have positive or negative attitudes about school depending upon their own previous
experiences. Some of these students come from high-literacy families and are very
proficient in their native languages. Other students are illiterate in their native language,
making the transition to English more difficult. Teacher sensitivity to each student is one
key to helping each child assimilate into the American way of life while preserving the
student’s home culture (Short & Echevarria, 2005).
Bohn and Sleeter (2000) cautioned that multilingual education is under increasing
danger as the greater educational focus is on the standards movement. They warned, that
in lieu of a standardized curriculum, the educational system will fail to be sensitive to the
many facets of ELL students, forcing pluralism to be marginalized (Bohn & Sleeter).

9
Statement of the Problem
The purpose of the study was to compare the achievement gap between the
Language Arts/ESOL program and the One-Way Developmental Bilingual Education
program as delivered to 7th-grade English Language Learner (ELL) students. A total of
23 middle schools from one large urban Florida county were included in the study.
The researcher anticipated finding differences among the selected middle schools’
ELL and standard curriculum tests scores for the 2007 Florida Comprehensive
Achievement Tests for 7th-grade reading. It was also anticipated that differences would
be found between the schools’ ELL population and standard curriculum population
FCAT achievement level test scores. The National Clearinghouse for English Language
Acquisition (2006) stated that No Child Left Behind’s “spotlight” was on closing the
achievement gap. Abedi and Dietel (2004) stated that historically ELL students have had
low performance scores that were frequently 20 to 30 points lower than their English-
only classmates.
Definitions of Terms
Basic Mainstream Instruction with Language Arts/ESOL Model:
“Comprehensible instruction in all grade level classes through ESOL strategies; strong
language development program; Language Arts through ESOL (Content-based; Sunshine
State Standards; National ESL Standards; Learning Strategies, CALLA Approach). In
secondary schools, Language Arts/ESOL is taught by a different teacher other than the
subject areas teachers.” Program objectives include to “development listening, speaking,
10
reading and grade level writing skills through second language acquisition practices for
LEP” (Orange County Public Schools Multilingual Student Education Services (n.d.a.).
ELL: English Language Learner
ESL: English as a second language.
ESOL: “Means English for Speakers of Other Languages (1) when modifying
instruction, the strategy used to teach limited English proficient students; or (2) when
modifying program, the program funded in the Florida Education Finance Program, listed
under English for Speakers of Other Languages”(2006 Florida Statutes, Title XLVII K-
20 Education Code, Chapter 1003 K-12 Education Code).
FCAT: “The Florida Comprehensive Assessment Test (FCAT) is part of Florida’s
overall plan to increase student achievement by implementing higher standards. The
FCAT, administered to students in Grades 3-11, contains two basic components:
criterion-referenced tests (CRT), measuring selected benchmarks in Mathematics,
Reading, Science, and Writing from the Sunshine State Standards (SSS); and norm-
referenced tests (NRT) in Reading and Mathematics, measuring individual student
performance against national norms” (Retrieved on July 29, 2007, from
http://fcat.fldoe.org/).
Home language or Native Language: “When used with reference to an individual
of limited English proficiency, means the language normally used by such individual or,
in the case of a student, the language normally used by the parents of the student” (2006
Florida Statutes, Title XLVII K-20 Education Code, Chapter 1003 K-12 Education
Code).
11
LEP: “‘Limited English proficient’ or ‘limited English proficiency’ when used
with reference to an individual, means: (a) An individual who was not born in the United
States and whose native language is a language other than English; (b)An individual who
comes from a home environment where a language other than English is spoken in the
home; or (c) An individual who is an American Indian or Alaskan native and who comes
from an environment where a language other than English has had a significant impact on
his or her level of English language proficiency; and (2)Who, by reason thereof, has
sufficient difficulty speaking, reading, writing, or listening to the English language to
deny such individual the opportunity to learn successfully in classrooms where the
language of instruction is English” (2006 Florida Statutes, Title XLVII K-20 Education
Code, Chapter 1003 K-12 Education Code).
One-way Developmental Bilingual Education/ESOL Center: “A center school
serves its own LEP students and also LEP students from schools that do not offer One-
way Developmental Bilingual Education/ESOL services due to insufficient enrollment of
students who speak the same language. Students receive grade level instruction in the
native language and English” (Orange County Public Schools Multilingual Student
Education Services, n.d.b.).
One-Way Developmental Bilingual Education/ESOL Program: “The One Way
Developmental Bilingual Education Program uses two languages for the purpose of
academic instruction consisting of an organized curriculum which includes: Continued
language and literacy development in the primary language; subject matter instruction
through the primary home language; English language acquisition and Language Arts

12
through English to Speakers of Other Languages (ESOL); Content Sheltered Instruction
for intermediate and advanced ESOL levels as a bridge to mainstream instruction. Native
language instruction is provided to avoid loss of grade-level skills while mastery of the
second language is taking place. Well implemented bilingual education programs assist
LEP in developing grade level subject cognitive skills in primary home language that will
gradually transfer into English to a level where they can succeed in an English-only
classroom” (Orange County, IX-51).
Sunshine State Standards (SSS): “The Sunshine State Standards were approved by
the State Board of Education in 1996 to provide expectations for student achievement in
Florida. The Standards approved in 1996 were written in seven subject areas, each
divided into four separate grade clusters (PreK-2, 3-5, 6-8, and 9-12). This format was
chosen to provide flexibility to school districts in designing curriculum based on local
needs. However, as Florida moves toward greater accountability for student achievement
at each grade level, the Sunshine State Standards have been further defined. In the subject
areas of language arts, mathematics, science, and social studies, the Sunshine State
Standards have been expanded to include Grade Level Expectations. These Grade Level
Expectations will eventually become the basis for state assessments at each grade 3-10 in
language arts and mathematics--and may eventually be used in state assessments in
science and social studies” (Retrieved on July 29, 2007, from
www.fldoe.org/bii/curriculum/sss/).
13
Delimitations
This study was delimited to the 23 middle schools in the one Florida county
selected for this study. The population was seventh grade standard curriculum and
seventh grade ELL students. Data were obtained from Florida Department of Education,
as disaggregated and reported by eMetric.net, a San Antonio-based web-based reporting
company.
Limitations
The following limitations of the study were recognized in conducting the
research:
1. Only one county was identified as implementing the One-Way Developmental
Bilingual Education program.
2. The study was conducted in a single county.
3. The study was limited to 23 middle schools within the identified county.
4. The study did not consider the mobility rate of the families, the cultural
backgrounds, socio-economic status, nor the ethnic diversity of the schools as
they related to the English Language Learners.
5. The study did not consider the length of time in the United States, the native
languages of the students, nor the amount of formal schooling in the students’
native countries for the schools’ English Language Learner students.
6. The study did not consider current school climate and culture as it related to
the English Language Learner students.
14
7. The study did not consider the amount of teacher training, the number of years
of teaching service, nor the school and district-based support personnel for the
ESOL teachers.
8. The study did not control for quality of teaching variables nor consistency in
standard curriculum.
Assumptions
The specific assumptions in this study were as follows:
1. The 2007 FCAT reading test was properly administered.
2. Appropriate testing accommodations were provided for the LEP students.
3. Test security was maintained with maximum care.
4. FCAT reading tests were collected appropriately from the testing sites and
delivered in a timely manner to the testing vendor for scoring.
Theoretical Framework
Collier’s (1995) language acquisition concept model is based on her work with
co-researcher Wayne Thomas. This model is based on four components: sociocultural,
linguistic, academic, and cognitive process. These four components are interdependent
and create the foundation for language acquisition. Visually, the concept model is formed
using a prism design with social and cultural processes in the center, connecting and
relating to the other three components. The development of the second language student

15
depends on the relationships of the four components. If one of the components is
neglected, the other three components will suffer the effect.
According to Collier (1995) and central to the student’s language acquisition is
the sociocultural process. The experiences of the student’s past, present, and future in all
contexts of home, school, and community work together to enhance or detract from the
student’s ability to acquire language. Individual student variables which include self-
esteem and anxiety are all at work as the student navigates the language acquisition
process. Community or regional social patterns of perception, prejudice, and
discrimination, also, affect the student’s ability to acquire a second language (Collier,
1995).
Linguistic development involves the student’s ability to process language. The
acquisition of oral and written language includes metalinguistic, paralinguistic, and
formal other subconscious components of language development. The linguistic
development of the student also depends on the formal and informal teaching to which
the student has already been exposed (Collier, 1995). Collier stated, “To assure cognitive
and academic success in a second language, a student’s first language system, oral and
written, must be developed to a high cognitive level at least through elementary-school
years” (p. 3).
The academic development of the student includes all school work in all courses
in grades K-12; e.g., language arts, mathematics, science, and social studies. With each
grade that the student completes, the academic vocabulary increases and builds on the
sociolinguistic and discourse development of each subject area. Collier (1995) stated,

16
“Postponing or interrupting academic development is likely to promote academic failure”
(p. 3). Academic knowledge transfers across languages; therefore, it is important to
continue the student’s academic development in the student’s first language during
second language acquisition (Collier).
Research Questions
The following research questions were used to guide this study:
1. To what extent is there an achievement gap between schools with standard
curriculum students and schools with ELL students in the Language
Arts/ESOL program on the 2007 7th-grade FCAT reading test?
2. To what extent is there an achievement gap between schools with standard
curriculum students and schools with ELL students in the One-Way
Developmental Bilingual Education program on the 2007 7th-grade FCAT
reading test?
3. What is the distribution of schools in the study with standard curriculum
students and schools with ELL students as measured by the mean scale score
in levels 1-5 of the 2007 7th-grade FCAT reading test?
4. To what extent is there an achievement gap between schools with standard
curriculum students and schools with ELL students in the Language
Arts/ESOL program scoring Level 3 or higher on the 2007 7th-grade FCAT
reading test?

17
5. To what extent is there an achievement gap between schools with standard
curriculum students and schools with ELL students in the One-Way
Developmental Bilingual Education program scoring Level 3 or higher on the
2007 7th-grade FCAT reading test?
Hypotheses
In addition, the following research hypotheses were proposed:
H1 : There is an achievement gap between schools with standard curriculum
students and schools with ELL students in the Language Arts/ESOL program.
H2: There is an achievement gap between schools with standard curriculum
students and schools with ELL students in the One-Way Developmental Bilingual
Education program.
H3: There is an achievement gap in the distribution of all schools with standard
curriculum students and all schools with ELL students as measured by the mean scale
score in levels 1-5 of the 7th-grade FCAT reading test.
H4: There is an achievement gap between schools with standard curriculum
students and schools with ELL students in the Language Arts/ESOL program scoring
Level 3 or higher as measured by the 7th-grade FCAT reading test.
H5: There is an achievement gap between schools with standard curriculum
students and schools with ELL students in the One-Way Developmental Bilingual
Education program scoring Level 3 or higher as measured by the 7th-grade FCAT
reading test.

18
Methodology
The study was conducted to investigate the differences of two program delivery
models for English Language Learner (ELL) students as compared to the standard
curriculum students in the 23 middle schools located in one large urban Florida county as
measured by the 2007 FCAT 7th-grade reading test. The study was initiated after being
approved by the Institutional Review Board of the University of Central Florida
(Appendix A).The program delivery models selected for this study were the Language
Arts/ESOL program and the One-Way Developmental Bilingual Education program as
delivered to ELL students as well as the standard curriculum delivered to standard
curriculum students.
The Language Arts/ESOL program used language arts instruction as delivered by
a certified teacher with ESOL endorsement or a certified ESOL teacher who used
comprehensible instruction through ESOL strategies, using the Sunshine State Standards
for Language Arts (Orange County Public Schools Multilingual Student Education
Services, n.d.a.). The One-Way Developmental Bilingual Education program is most
closely identified with bilingual instruction as the content is in English and the student’s
native language (Orange County Public Schools Multilingual Student Education Services,
n.d.b.).
The study targeted schools with 7th-grade ELL students who were receiving
English as a second language support services as well as the schools’ standard curriculum
students using the 2007 Florida Comprehensive Assessment Test (FCAT) reading test
results as the assessment measurement.
19
A total of 23 middle schools were selected for this study. Schools were identified
by the county ESOL contact at the district level or the principal or designee at the school
site.
Seventh Grade 2007 FCAT reading test scores were retrieved from eMetric.net, a
San Antonio, Texas, company which reports disaggregated FCAT data.
The mean scale scores for the 13 schools’ 7th-grade ELL students who
participated in the Language Arts/ESOL program at the selected schools were retrieved
and compared to the schools’ standard curriculum student population scores at the same
schools. An independent t-test was used to test the means.
The mean scale scores for the 10 schools’ 7th-grade ELL students who
participated in the One-Way Developmental Bilingual Education program at the selected
schools were retrieved and compared to the schools’ standard curriculum population
student scores at the same schools. An independent t-test was used to test the means.
Organization of the Study
Chapter 1 has introduced the problem statement and the design components of the
study. Chapter 2 presents a review of relevant literature which supports the problem
statement. Chapter 3 contains the design of the study and details of the population,
instrumentation, and statistical procedures. Chapter 4 reports the analyses of data
collected for the study. Chapter 5 offers a summary and discussion of the results and
findings of the study and their implications and recommendations for future research.
20
CHAPTER 2 REVIEW OF LITERATURE
Introduction
Capp, Passel, Perez-Lopez, and Fix (2003) reported that 47 million people speak a
language other than English. The 2000 Census listed 40 different languages with 11% of
the immigrant population listed as speaking Spanish and about 4% of the total population
listed as speaking “Asian and Pacific Island languages, including two million Chinese-
speakers” (as cited in Capp, Passel, Perez-Lopez & Fix, p. 14).
An important goal of bilingual education has been the promotion of the majority
language and the transfer of skills (Roberts, 1995). Krashen (1999) stated that a solid
bilingual program should provide for instruction in the first language through content
subject matter so that future content delivery in English is comprehensible to students and
they can develop first language literacy.
Feinberg and Morencia (1998) and Genesee (1999) stated that typically bilingual
programs include instruction in the native language arts which provides for literacy
foundation and skill transfer to English. Programs such as these can be transitional to
English-only instruction or developmental language arts and serve to maintain native
language.
Combs, Evans, Fletcher, Parra, and Jimenez (2005) defined Structured English
Immersion (SEI) as English-only instruction with modifications to meet the needs of the
second language learner. Rossell (2005) defined SEI as a self-contained classroom of
primarily English Language Learner (ELL) students with mostly English instruction.
21
Roberts defined SEI as sheltered instruction. Using this definition, classrooms are
comprised primarily of ELL students, and the trained teacher uses second language
acquisition methods in his or her teaching (Rossell, 2005).
Also known as the early exit program (Genesee, 1999), transitional bilingual is
probably the least controversial of all the program models because it uses the student’s
native language initially to promote a transition to English-only classrooms (Lessow-
Hurley, 2003). Genesee (1999) stated that transitional bilingual programs do not aim for
full bilingualism and biliteracy for the students involved in the program. This program
model is based on the premise that the better students perform in early grades, the better
they will perform in the upper grades.
NAEYC and NAECS/SDE (2003), in their joint position statement, declared that
assessment for children should be culturally and linguistically sensitive. They contended
that assessments for young children in some schools “have become mismatched to
children’s cultures or languages, ages, or developmental capacities” (p. 4). Rossell (2005)
found that schools serving over 240 ELL students had lower test scores than schools who
did not serve ELL students.
Historically known as “the melting pot,” families from all over the world have
come to the United States at a rate which demands public schools to service students in
ways that will benefit both the students and their families in their home language. Non-
English speakers have increased to be a greater percentage of school-age children than
ever before. With this higher percentage, a pressing need for greater awareness for
schools to understand and to serve ELL students and their families has emerged.

22
Rothstein (2001) commented, looking at the last 20 years to the present, “1972 to 1995,
despite rapidly accelerating immigration (more Hispanic youths are first-generation
immigrants today than 20 years ago) the Hispanic high school completion rate has crept
upward (from 66% to 70%)” (p. 229). United States Department of Education Secretary
Rod Paige stated that there were 5.5 million Limited English Proficient (LEP) children in
the United States. Many states have over 100 languages other than English spoken as a
first language by their students (Paige, 2004).
Information from the 1990 census showed that approximately 75% of the total
immigration population lived in six states, including Florida and Texas. At the time of the
present study, these six states had well-established communities where the native
languages and English as a Second Language are supported. None of the six states were
included in the top immigration destinations as reported in the 2000 Census, but these
states remained relatively high immigration destinations (Capps, Passel, Perez-Lopez, &
Fix, 2003). Early figures from 2000s provided no indication of declining immigration; in
fact, in the U.S. Current Population Survey, it was concluded that “by March 2002, the
foreign-born population had grown to an estimated 32.5 million” (Capps, Passel, Perez-
Lopez, & Fix, p.4).
The U.S. Department of Education, National Center for Education Statistics,
(2006a) reported that between 1979 and 2004 the number of second language learning
students increased from 3.8 million to 9.9 million, rising from 9 to 19% of all school age
children. During this period, there was an overall increase in student population of 18%,
but the number of “children who spoke a language other than English at home increased
23
by 162 percent” (p. 34). Spanish was also reported as the dominant minority language
spoken in the students’ homes. The student minority population was expected to reach
39% by the year 2020 (Miller, Miller, & Schroth, 1997).
Meyer, Madden, and McGrath (2004) reported for the National Center for
Education Statistics that between 1993-1994 and 1999-2000 the South had an increase in
the second language learner student population from 3.5 to 4.5%. Over one-half of
second language learning students were enrolled in schools that had less than 1% second
language designated students (Meyer, Madden, & McGrath).
Capps, Passel, Perez-Lopez, and Fix (2003) reported for the Urban Institute: In 2000 there were 2.5 million immigrants in the United States (about 8 percent of the total) who had entered since 1980 as refugees or Cuban-Haitian entrants or who had received asylum . . . . Most of this group had already obtained legal permanent residency and many had become citizens. (p. 11) The 2000 Census listed nearly 100 countries of origin for U.S. immigrants. Los
Angeles County and New York City had the greatest diversity in population. The
following is a breakdown of countries and the total percentages represented by
immigrants in the 2000 Census: Mexico at 30%, Asia at 26%, Latin American countries
other than Mexico at 22%, Europe and Canada at 18%, and Africa and other countries at
3% (Capps, Passel, Perez-Lopez, & Fix, 2003).
Capps, Passel, Perez-Lopez, and Fix (2003) reported for the Urban Institute that
despite immigration trends to major, traditional destinations like California and Florida,
the states with the greatest amount of immigration currently included new states such as
Georgia and Tennessee. Hoefer, Rytina, and Campbell (2006) reported for the Office of

24
Homeland Security that approximately 10.5 million unauthorized immigrants lived in the
United States in January 2005 with California, Texas, and Florida accounting for the
states with the greatest percentages of illegal immigrants. An estimated 850,000 illegal
immigrants resided in Florida (p. 1).
According to Smith-Davis (2004), Miami-Dade County, Florida, had received
students from 162 countries. These students spoke several hundred languages and
included immigrants who are moving for a second or third time to a new country. Small
communities were, also, experiencing language minority student population growth as
families were drawn to industrial jobs, e.g., food processing. Many Miami-Dade County
high school graduates had command of the Spanish language but lacked the literacy in
the first language to be successful in international commerce (Feinberg & Morencia,
1998).
Kohler and Lazarin (2007) stated that Hispanics were the second largest group of
students after White students, representing more than 10.9 million students in 2005 in
grades Pre K-12. Among these school-age children were an increasing migrant
population. Frequently, these children have entered school with little or limited use of
English (Green, 2003). In a position paper by the National Association for the Education
of Young Children (1995), it was contended that “the United States is a nation of great
cultural diversity, and our diversity creates opportunities to learn and share both similar
and different experience” (p. 3).
25
Language Acquisition
Some English Language Learner (ELL) students have extensive educational
background and perform at or above grade level while other students may not have ever
stepped foot into a classroom. Since each student brings his or her own history into the
classroom, students may have positive or negative attitudes about school depending upon
their own previous experiences. Some of these students come from high-literacy families
and are very proficient in their native languages. Other students are illiterate in their
native language, making the transition to English more difficult (Short & Echevarria,
2005).
When children learn two or more languages, they gain a greater understanding of
the functions of language (Cummins, n.d.a). Collier (1987) stated that many factors
contribute to each individual’s acquisition of a second language. Some of the factors
include the “learner’s cognitive style, socioeconomic background, [and] formal schooling
in the first language” (p. 1). In addition, Collier and Thomas (1989) stated that
“acquisition of cognitive-academic second language proficiency does not occur quickly
but is a developmental process that takes a significant number of years” (p. 35).
Cummins (n.d.a.) first introduced the BICS and CALP stages of language
acquisition:
The acronyms BICS and CALP refer to a distinction . . . . between basic interpersonal communicative skills and cognitive academic language proficiency. The distinction was intended to draw attention to the very different time periods typically required bys immigrant children to acquire conversational fluency in their second language as compared to grade-appropriate academic proficiency in that language. (p. 1)

26
Cummins further elaborated on BICS and CALP, commenting that much of
language acquisition in the BICS stage is aided by interpersonal context clues such as
facial expressions, gestures, and intonation. These non-linguistic clues are largely
dependent on the linguistic context of the face-to-face interaction. Cummins, also, noted
that “failure to take into account of the BICS/CALP (conversational/academic)
distinction has resulted in discriminatory psychological assessment of bilingual students
and premature exit from language support programs (e.g. bilingual education in the
United States) into mainstream classes” (p. 1).
DiCerbo (2000) noted that there are many factors to slow acquisition, including a
quality education. Collier and Thomas (1989) cautioned that students in transitional
bilingual classes may face a social stigma as well as lower academic standards. Collier
(1987) stated:
It takes language minority students in any type of program a minimum of four years to reach native speakers’ level of school language proficiency and may take as many as eight or more years, depending on age on arrival and type of school program, as well as sociocultural factors and the individual characteristics of each second language acquirer. (p. 8)
Students who have a strong foundation in their native language will develop stronger
second language literacy with skill transfer from the native language to the second
language (Cummins, n.d.a.).
Collier (1987) stated that as students progress through the educational system, the
academic content becomes more and more abstract, forcing students to rely more heavily
on their oral and written communication skills in English. Collier and Thomas (1989)
defined academic English as “a complex network of language and cognitive skills and

27
knowledge required across all content areas for eventual successful academic
performance at secondary and university instruction” (p. 27). Zwiers (2005) defined
academic language “as the set of words and phrases that (1) describe content-area
knowledge and procedures, (2) express complex thinking processes and abstract
concepts, and (3) create cohesion and clarity in written and oral discourse” (p. 60).
Second language learning students have tended to have high school mobility rates
which interfere with student learning, leaving their instruction frequently jumbled and
conflicting (Hopstock, 2003). Many high poverty families have tended to move from
school-to-school at least once a school year (DiCerbo, 2000). DiCerbo stated that lack of
formal schooling in a student’s home country also slows English acquisition as opposed
to students who have had extensive educations in the home country. Krashen (1999)
noted that it appears children from wealthier families, who most likely already have a
foundation in their first language, are much more likely to succeed in school than those
students who do not have caregivers who can provide support. Collier and Thomas
(1989) stated that even the most advantaged second language student will take between 5
and 10 years to learn English and be proficient.
DiCerbo (2000) reported:
The research evidence supports the assertion that when students are not provided with high quality day care and early childhood services, once in school, their academic achievement and limited language proficiencies get cumulatively worse over time, over grade levels, and across subject matter. (p. 4)
Collier and Thomas’ (1989) 1987 and 1988 studies was focused on 2,014 second
language learning students who spoke 75 languages, the majority of whom were from
28
low-socioeconomic homes. Their studies revealed that within one or two years of the
study, the second language learning students reached normative levels with the English-
only students in mathematics. Collier and Thomas (1989) stated that subject area
knowledge in the first language transfers to the second language.
Collier’s 1987 study of 1,548 immigrants to the United States analyzed the length
of time for language acquisition of English when instructed in English only. Collier found
that students between the ages of 8 and 12 years of age were the first group to reach
normative levels in all content areas in 4 to 5 years. These students may have the
advantage of first language skills to transfer to English, and there is enough time left for
them to make-up any lost academic time before high school graduation. Students between
the ages of 5 and 7 took between 5 and 8 years to reach the same levels in all content
areas.
Collier and Thomas (1989) found that students between the ages of 4 and 7 were
“significantly below the appropriate performance level for their length of residence in
comparison to arrivals at ages eight to eleven” (p. 28). Collier and Thomas found that
students who arrive between the ages of 12 and 16 had the lowest scores of all the
students in the study. After six years of instruction, these students still had not reached
academic norms and did not have enough time to get there before high school graduation
with the projected time of 7 to 10 years of instruction from time of arrival.
Collier’s (1987) findings indicated that after puberty there are two significant
problems for students: They are more likely to maintain an accent with their English, and
they may not have enough time left in their public school career to make-up the lost time
29
while spent learning English. Thomas and Collier (1997a) found that bilingually schooled
students who are on grade level in their native language will take from 4 to 7 years to
make the 50th percentile in their second language, English, in the United States. Students
who have 2 to 5 years of education from their native country and who are schooled
wholly in their second language in the United States took from 5 to 7 years to reach the
50th percentile.
DiCerbo (2000) stated that students who are highly proficient in their first
language will more easily acquire a second language. A strong foundation in a student’s
first language transferred to other languages with studies demonstrating that the “reading
process is similar in different languages” (Krashen, 1999, p. 1). A bi-directional skill
transfer exists between the languages, thereby, supporting both the native language and
the second language (Cummins (n.d.b.). When students learn in their native language,
they are learning concepts and skills that will transfer to their second language. Children
can lose their ability to communicate in their native language within 2 to 3 years if not
supported by a second language community (Cummins, n.d.b.).
Cummins (n.d.c.) noted that bilingual students are more proficient at linguistic
processing for they have had to decode and decipher in two different languages, leaving
them more capable to analyze meaning than a monolingual student. Cummins stated,
“Minority children who lack this educational support for literacy development in L1
frequently develop a subtractive form of bilingualism in which L1 skills are replaced by
L2” (p. 6). Cummins reported that no negative consequences came from learning a
second language.
30
Hakuta, Butler, and Witt (2000) studied language acquisition with two data sets
from the San Francisco Bay Area, California, and existing data sets from Canada. The
longitudinal study sought to determine the length of residence for students from the point
of immigration to English mastery. The results of the study showed that even in the most
effective school district in the San Francisco Bay area, known for it success with ELL
students, that the length of time for limited English proficient (LEP) students to reach
English proficiency was between 3 and 5 years. To reach academic English proficiency
ranged between 4 and 7 years. The results showed that the length of time that ELL
students spend in school may not be enough time for them to catch-up with their native
English peers and master academic English.
Tompkins (2000) stated that the components of language (reading, speaking,
writing) fluctuate during acquisition with both informal and formal usage. Language
proficiency has been difficult to define, and no national definition has been established.
Proficiency includes the components of language, including social and academic
acquisition. Fluency is tested in writing, speaking, reading and listening (Wilde, 2006).
All four modes of language must be tested. Since there have been no national standards
for proficiency cut scores, each state has been independent in settling on its own
definition (Wilde).
Other Influences on Language Acquisition
Voltz and Morrow (1999) contended that American society feels oppressive to the
international family. This has been reflected in how culturally diverse families may view

31
the American school system. Smith-Davis (2004) reported that factors such as
immigration stress and acculturative stress may impede parental involvement in
American schools. The National Association for the Education of Young Children (2005)
stated that the issue of culture and heritage should be a consideration in assessment
development. Malave’ (1997) concluded that caregivers can develop their own
bilingualism while supporting their children’s acquisition of a second language; however,
this study also revealed the potential loss of the home language for both the children and
the caregivers.
Stevens and Tollafield (2003) contended that “some parents are immigrants and
cannot read or speak English, much less understand educational jargon” (p. 1). The
National Association for the Education of Young Children and the National Association
of Early Childhood Specialists in State Departments of Education (2003) in their joint
position statement advocated that support should be provided for children and their
families in respect to their cultures. Osterling, Violand-Sanchez, and von Vacano (1999)
stated that when students are learning a second language their parents often feel
disconnected and undervalued, perceiving the second language learning as a
disconnection when parents want to communicate with their children.
The National Association for the Education of Young Children’s (1995) Position
Statement outlined the importance of linguistic and cultural diversity in public schools.
Emphasized was the need for educator sensitivity:
Educators recognize that linguistically and culturally diverse children come to . . . programs with previously acquired knowledge and learning based upon the language used in their home. For young children, the language of the home is the
32
language they have used since birth, the language they use to make and establish meaningful communicative relationships, and the language they use to begin to construct their knowledge and test their learning. The home language is tied to children’s culture, and culture and language communicate traditions, values, and attitudes. (Chang as cited in National Association for the Education of Young Children, 1995, p.1) Scarcella (2003) stated, “Many ELLs who enter these institutes [of higher
learning] lack sufficient academic English language proficiency even when they have
completed their entire elementary and secondary educations in the United States” (p. 2).
Often neglected, the student’s cognitive development has been another important and
critical component for language acquisition. Collier (1995) stated that for too long the
educational system had not cultivated the second language student’s cognitive
development, providing watered down curriculum and limited opportunities to foster
critical thinking skills.
Rubenfeld, Clement, Lussier, Lebrun, and Auger (2006) stated that second
language acquisition depends largely on the student’s confidence. Their work with
Francophone and Anglophone university students revealed that students with high levels
of confidence possessed the skills and experiences necessary to seek an active pursuit of
contact with the second language and to communicate with the student’s second language
community. If their work were applied to younger students, it is likely that the same
pattern for contact would emerge.
Pappamihiel (2001), in a study of Mexican middle school girls, found anxiety is a
factor for second language students in mainstream classes as compared to when they are
in ESOL classes. Anxiety for the girls in mainstream classes was more social anxiety as
33
compared to the academic anxiety in the ESOL classes. Malave (1997) investigated the
linguistic practices in the homes of bilingual children, specifically how the caregivers
promoted and supported two languages for their children.
Gonzalez (2001) examined socioeconomic status and sociocultural factors with
second language students. Gonzalez defined socioeconomic status as:
The home and family structure as an omnibus variable representing numerous sub-variables (e.g., number of siblings, birth order, childrearing practices, value and belief systems held by parents, immigration status of parents, family mobility, and parents’ number of years of U.S. residence). (p. 2) Gonzalez’s (2001) study of recent professional literature on the effect of
socioeconomic status and sociocultural factors on the development of achievement of
English Language Learner (ELL) students revealed a multi-dimensional framework for
language acquisition, including internal factors such as “biological, psychological-
cognitive, social, emotional,” and external factors such as “SES and sociocultural
variables such as family, cultural, and school environments” (p. 23). Lower socio-
economic status students, on average, take longer to master English (Hakuta, Butler, &
Witt, 2000).
Capps, Passel, Perez-Lopez, and Fix (2003) reported that one in four immigrant
children live in a low-income family. Socio-economic status and discrimination
contribute to the low performance rate of certain populations of language minority
students (Feinberg and Morencia, 1998). Voltz and Morrow (1999) stated that
economically struggling families may not have the physical, emotional, and mental
resources available to cultivate relationships with their children’s schools. Capps, Passel,

34
Perez-Lopez, and Fix (2003) reported that food as well as other hardships were more
closely associated with English proficiency than were length of residency or legal status.
Feinberg and Morencia (1998) concluded, “Families--regardless of cultural or socio-
economic group--generally are concerned about the educational well-being of their
children” (p. 4).
Gonzalez’s (2005) used an alternative assessment tool to control for
developmental, linguistic, and cultural variables in a study of second language students
from low, middle, and high socioeconomic backgrounds. This quantitative study revealed
that cultural, linguistic, and socioeconomic status was related to cognitive development.
Important to the study was that socioeconomic status, and not English proficiency, was
what effects cognitive processing and language acquisition. Pearce (2006), in a
quantitative study of Chinese and American students, investigated the cultural and
structural influences on student achievement. Pearce’s results showed that social structure
and cultural factors had a significant impact on student achievement for both groups.
Public school educators have a history of perpetuating a workforce from white,
middle class backgrounds. This alone provides an additional handicap for the second
language learner whose cultural background is dissimilar to the status quo. Lessow-
Hurley (2003) stated:
Linguistic diversity is one simple indicator of the unprecedented cultural diversity in our public schools. But even as classrooms diversify, public school teachers tend to be overwhelmingly white and middle class. And though very few Americans can claim indigenous roots, teachers are most often from highly assimilated backgrounds characterized by mainstream values and mores. (p. 4)

35
Teacher sensitivity to each student is one key to helping each student assimilate into the
American way-of-life while preserving the student’s home culture (Short & Echevarria,
2005).
Lessow-Hurley (2003) stated that there are four basic components to culture:
“What people believe, think, make, and do to adapt to their environment” (p 9). Students
must learn how to manage themselves when faced with the challenges in their own
environments related to society and justice while learning how to effect changes in
society and to make significant contributions to society (Lessow-Hurley).
The Position Statement of the National Association for the Education of Young
Children (1995) stated that educators should accept and encourage the involvement of the
second language student’s family, thereby, supporting the culture of the student and
strengthening the bonds between the school and the family. Parker, Rubalcava, and
Teruel (2005) concluded that the availability of bilingual schools reduced the “negative
impact of a monolingual indigenous mother on her children’s schooling” (p. 73). Titus
(2001) studied New Zealand’s indigenous Maori people and concluded cultural barriers
and racist beliefs were broken down when students learn about different cultures,
including their own, and interact with students from other cultures.
Voltz and Morrow (1999) maintained:
Historically, schools have not served diverse populations well . . . . [and] additionally, culturally diverse families may experience feelings of distrust for school personnel that result from the view that schools are merely extensions of a culture that they find oppressive, and from which they feel alienated. (p. 2)
36
Bazron, Osher, and Fleischman (2005) concluded that there was a growing body of
evidence that needed to be addressed regarding the cultural and linguistic needs of ELL
students. Ferguson et al. (2001) asserted:
Successfully including students with so many differences and different ways of learning challenges schools to reinvent themselves as more flexible, creative learning communities that include and are responsive to a full range of human diversity. This newly defined diverse norm replaces the old statistically derived, bellshaped-curve norm that uncompromisingly identifies some students as “inside” and others as “outside”. (p. 1)
Assessment and Achievement Gap
Assessment
Lazarin (2006) spoke to the limited support provided to states in regard to
language assessment:
Due to a lack of resource and technical assistance from the U.S. Department of Education, most states are using invalid and inappropriate testing instruments to assess ELLs in academic content. These assessments are generally invalid because they were not development for use with ELLs, or because they are being used for a purpose other than for which they were designed. (p. 9)
Lazarin (2006) cited only 13 states as having native language assessments available and
only 11 states that “offer native-language assessments statewide” (p. 10). The National
Association for the Education of Young Children (2005) had earlier reported that the
accountability system lacks the assessment tools and trained professionals for effective
assessment of young English Language Learner (ELL) students.
Abedi (2001) stated that federal and state legislation required the inclusion of
ELL students in wide-scale assessments. Vialpando, Linse, and Yedlin, (2005) defined
37
assessment as “the fair and reliable measurement of student abilities and progress” (p. iv).
Any assessment given in English to ELL students has been viewed as a measure of
English language proficiency and not necessarily only a measure of content
understanding (Menken, 2000; Abedi & Dietel, 2004). Assessment should be a measure
of what students know not a measure of what they do not know (Vialpando, Linse, &
Yedlin, 2005). Menken (2000) stated wide-scale assessments typically have been
attached to high stakes, including graduation.
Academic minimum competency testing began in the 1970s and signaled to
educators and policymakers what should be taught to students (Wilde, 2006). Wide-scale
achievement tests are typically development by professional publishing companies and
are administered to large groups of students at the same time. These tests are used as a
summative measurement of student performance. Wide-scale criterion-based
achievement tests, which are closely aligned to state standards, measure the degree to
which students learn that which they are supposed to learn in a given time (National
Clearinghouse for English Language Acquisition, 2006; Wilde, 2006).
Menken (2000) stated that stakeholders are split between all-English assessment
tests with testing modifications for students and assessment developed especially for ELL
students. Abedi and Dietel (2004) reported that the language demands for ELL students
negatively influence the test results. Menken (2000) stated that modifications are
typically used to level the playing field, but often, the modifications do not meet the
needs of the learner.
38
The National Association for the Education of Young Children and the National
Association of Early Childhood Specialists in State Departments of Education (2003)
stated in their joint position statement that for young bilingual children embedded
assessments and observations provide a fuller picture of the abilities for second language
students. Assessments which take into consideration a student’s culture, home language,
and socioeconomic status, and which have been normed with students who are also ELL
students, would be best.
The National Association for the Education of Young Children (2005) stated that
few assessments for young English Language Learners meet the rigorous standards for
accountability and program evaluation, and, therefore, these students should not be
included in the accountability system. Menken (2000) stated that legislation dictates to
whom the assessments are given and this includes ELL students.
Abedi (2001) stated that National Center for Research on Evaluation, Standards,
and Student Testing (CRESST) research found translating the assessment may not be
successful and that a second language learner should be tested in the primary language of
the student. Abedi stated that it was reported in CRESST research that language
proficiency was a strong component for ELL students who took wide-scale assessments
and whose scores were significantly lower than their English-only classmates. Abdei
reported that CRESST research showed that the performance gap narrows on math items
that do not depend on language ability.
The National Association for the Education of Young Children and the National
Association of Early Childhood Specialists in State Departments of Education (2003)
39
stated that a shared responsibility exists to create assessments that are “developmentally
appropriate, culturally and linguistically responsive” (p. 2). Brisk (2000) stated “language
and culture greatly influence assessment” (p. 2). The National Association for the
Education of Young Children (2005) stated that culturally sensitive assessments should
be used with ELL students. These assessments should not include referents to words and
phrases that ELL students would not readily be familiar to ELL students and should go
beyond mere translation of the English assessment.
Inclusion of ELL students in high-stakes English-only wide-scale assessments
could be beneficial to second language learns, but the benefits are still unclear (Menken,
2000). Second language learner performance depends on the program, the curriculum, the
instruction, the personnel, and the assessment (Brisk, 2000). Abedi (2001) reported that
the National Center for Research on Evaluation, Standards, and Student Testing
(CRESST) research found strong performance indicators in student background,
including language background.
The National Association for the Education of Young Children (2005) stated, “If
an assessment is to be used for program evaluation or accountability purposes, it should
take place in the language and dialect in which the child can best show what he or she
knows and can do” (p. 13). The primary way that states have included ELL students in
the accountability system is to provide them with the same assessment as English-only
students (Menken, 2000). Abedi and Dietel’s (2004) research of approximately 14,000
students found that the removal of ELL students from the LEP (limited English
proficient) designation coincided with a significant performance drop. Although not a
40
claim of causation, Abedi and Dietel found this to be a specific dilemma for ELL
students.
Achievement Gap
Abedi and Dietel (2004) contended that the high demands to move proficient
English Language Learner (ELL) students out of the bilingual category and regularly add
new ELL students who are new and low-performing creates a downward spiral for the
group’s test average. In addition, Abedi and Dietel, noted that out-of-school influences,
also, greatly affect the second language learner’s test score.
Abedi and Dietel (2004) cited that the National Center for Research on
Evaluation, Standards, and Student Testing (CRESST) and the National Assessment of
Educational Progress (NAEP) showed that ELL students consistently scored lower on
assessments than English-only students and other subgroups. The National Assessment of
Educational Progress (NAEP), which has assessed reading and math skills since the
1990s, showed little difference in the achievement scores for Hispanic and white 4th-
grade students on the reading test from 1992 to 2005 (National Center for Education
Statistics, 2006b). For this same time period, “Hispanics scored, on average, 26 points
lower than Whites” (p. 2). Kohler and Lazarin (2007) stated that the data continued to
show that Hispanic education did not match that of non-Hispanics.
Abedi and Dietel (2004) reported that rapid progress students designated as ELL
students, including ELL students who have been in English-only schools for a short
period of time, contribute to the growing achievement gap between ELL students and
41
English-only students. Abedi (2001) stated that the National Center for Research on
Evaluation, Standards, and Student Testing (CRESST) research showed that “the only
accommodation that narrowed the gap between ELL and non-ELL students was linguistic
modification of those test questions with excessive language demands” (p. 2).
First and second generation immigrants have frequently out-performed the district
averages with regard to grade point averages and high school completion rates. Certain
language minority students have performed better than others depending on their country
of origin. Students who have received a positive reception into the United States typically
have performed better than those whose reception has not been positive (Feinberg &
Morencia, 1998). Bazron, Osher, and Fleishman (2005) contended that many schools
have a tendency to downplay or ignore the needs and strengths of the increasing second
language learning student population. This cultural disconnect can lead to increased
discipline problems, inferior self-concepts, and poor academic achievement.
Accountability has two main goals: (a) to hold schools, districts, and states
responsible for meeting the educational standards and (b) to ensure that students are
meeting these standards (Menken, 2000,; National Clearinghouse for English Language
Acquisition, 2006; Vialpando, Linse, & Yedlin, 2005). Genesee, Lindholm-Leary,
Saunders, and Christian (2005) stated that improved education for ELL students is the
key to narrowing the achievement gap and improving ELL student performance.
Abedi and Dietel (2004), studied 30,000 students and found outside-of-school
influences, frequently parent’s level of education and socioeconomic status, influenced
second language student achievement. The study revealed an approximate 15-point

42
achievement gap between second language students whose parents had post-graduate
education and those who had not graduated from high school. Lazarin (2006) reported
that the 2005 National Assessment of Educational Progress (NAEP) showed that 29% of
second language learner eighth graders scored at basic or above achievement levels
compared to the 75% of their non-limited English proficient peers who scored at basic or
above achievement levels.
Abella, Urrutia, and Shneyderman (2005) studied students from 36 schools in
Miami-Dade County, Florida. Using the SAT-9 and the Spanish version, Aprenda-2, their
quantitative study focused on whether or not English-only achievement tests were an
accurate measure of bilingual student mathematics knowledge. Results showed that the
students’ native language literacy was directly related to their English language
achievement scores and that second language students’ overall performance on English-
only achievement tests was not necessarily a valid measure of their content knowledge. In
the Florida 1999-2000 school year “only 2% of tenth grade ELLs in Florida met the
state’s standards in reading/English language arts” (Lazarin, 2006, p. 4). Other states had
a gap from 5 to 60 points when compared to the non-second language learning student
performance (Lazarin).
The Advocates for Children of New York and the New York Immigration
Coalition (2002) investigated the New York City public school drop-out rate for ELL
students. New York State’s graduation requirement has been that all all students pass the
English Language Arts (ELA) Regents test. Performance data for the class of 2001
showed that former ELL students had the highest graduation rate of all students and the
43
lowest drop-out rate. The 2001 data showed that current ELL students had the highest
drop-out rate with a projected drop-out rate of over 50% for the class of 2001.
Escamilla, Chavez, and Virgil’s (2005) study was conducted to investigate teacher
and policymaker perspectives in Colorado regarding language as a problem for Latino
students. The Spanish version of the Colorado Student Assessment Program (CASP), a
criterion-referenced test, has been administered to ELL students or these students have
been exempted from the CASP altogether. In 14 schools, Spanish reading achievement
scores outperformed English reading achievement. A total of 12 of these schools
outperformed the district average (p. 141). Despite this, teacher perceptions contradicted
the results: “All educators involved in the study expressed the view that having heavy
concentrations of Spanish-speaking ELLs equates to having underachieving schools” (p.
142).
Mahon (2006) in a quantitative study investigated the performance of 200
Colorado fourth and fifth grade students on the CASP, the Language Assessment Scales
Oral short form (LAS-O), and the Woodcock-Munoz Language Survey (WMLS).
Schools involved used the transition bilingual program model, pull-out ESL program
model, and the dual language program model. Mahon found that English acquisition was
directly related to English academic achievement, finding “a strong correlation between
CASP scores on English and Spanish reading (r = .73) and English and Spanish writing
(r = .76)” (p. 494).
Parker, Rubalcava, and Teruel (2005) studied poor, rural Mexican students and
the factors relating to their acquisition of English. Their results showed little difference

44
for indigenous bilingual children and non-indigenous bilingual children regarding school
attainment, but mono-lingual Spanish-speaking children showed lower rates of school
attainment than their bilingual peers. Parker, Rubalcava, and Teruel concluded that for
mono-lingual children, learning Spanish was achieved over time and was an indicator of
school success. Only a small fraction of indigenous mono-lingual children failed to
master Spanish. It was found in this empirical study that “children with mono-lingual
indigenous mothers do significantly worse in school than children with Spanish-speaking
mothers, whether bilingual or nonindigenous” (p. 89). They concluded that “bilingual
schools reduce the achievement gap in school enrollment between children with
monolingual indigenous mother and those with Spanish-speaking mothers” (p. 90).
Tompkins (2000) studied the SAT-9 with California students and found that many
bilingual students, especially during testing, were easily distracted by noise and other
environmental factors, possibly due to stress. Native language assessment can be useful
when the student is literate in his native language, but the problem arises when content is
taught in English and the student is required to process information in two languages.
True bilingual assessment would measure how the student responds to content using both
languages. Gomez, Freeman, and Freeman (2005) reported that their study of 50/50 two-
way immersion for Spanish-speaking and English-speaking students resulted in higher
standardized test scores.
The Hispanic Border Leadership Institute investigated five Southwestern states
and reported in 2002 that almost one-third of the population was Latino. In all five states,
there were school districts with over 80% Latino enrollment (Acevedo et al., 2002). Cited

45
in the report was an Arizona court case which judged bilingual classrooms to be
inadequately funded and equipped; and in California, Latinos were frequently tracked
into vocational or terminal programs at the two-year college level. The report noted that
in 2001 Colorado amended the definition of at-risk to include ELL students.
Further noted in the report of the Hispanic Border Leadership Institute (2002) was
the status of teacher preparedness in New Mexico; 50% of the teachers came from out-of-
state and very few were properly trained in second language learner pedagogy. Many of
New Mexico’s probationary schools have experienced high Hispanic enrollment and a
low socio-economic base. With a high drop-out rate, many students have been placed in
remedial classes with few students in honors or advanced classes. Within the last 15
years, the Office of Civil Rights found that eight school districts were not in compliance
with the law providing for ELL students. The report concluded that the majority of
students enrolled in Texas public schools between grades kindergarten and sixth were
Hispanic. Using 2000-2001 data, 31% of Latino students were reported to have graduated
from high school (Acevedo et al., 2002).
A Texas longitudinal study focused on students entering the first grade in 1992-93
(Texas Education Agency Office of Policy Planning and Research, 1998). Despite
remarkable academic improvement in TAAS (presently known as the Texas Assessment
of Knowledge and Skills TAKS) test scores, economically disadvantaged second
language learning students and non-second language learning students performed lower
and experienced higher retention rates than their economically advantaged peers. An
investigation into high performing schools still revealed higher retention rates for second
46
language learning students. An inspection of campus poverty also showed that as campus
percentage of economically advantaged student increased, LEP (limited English
proficient) and non-LEP TASS passing test scores increased. Lazarin (2006) stated that in
the Texas 2001-2002 school year second language learning students in grades 7 to 12
were retained at twice the rate of their non-LEP peers (Texas Education Agency Office of
Policy Planning and Research, 1998).
The research supported the cultural differences among students and the negative
impact teachers can have on the students’ academic success. English Language Learner
students may be underestimated by their teachers, and this can affect their student
achievement as well (White-Clark, 2005). Academic achievement tests for ELL students
can be problematic in that they may know the content but may be unable to respond to
the questions in English. In short, until English mastery is attained, academic tests in
English are a test of English mastery not academic content (Wilde, 2006).
Bilingual Education
History of Bilingual Education
Wiese (2004) stated that “English is a high status tongue in the United States”
(p. 71). Lessow-Hurley (2000) commented that “standard language is the language of the
group in power” (p. 33).
Typically, schools have existed to assimilate newcomers to the United States and
to support the status quo who are already a part of the American way-of-life and
47
education system (Lessow-Hurley, 2003). Examples of second language dominant
schools were apparent in German language schools in Philadelphia in 1694. By the mid-
1800s, “instruction in French in Louisiana, in Spanish in New Mexico,” along with other
languages in other states, “had been explicitly authorized by state and local education
authorities” (Feinberg & Morencia, 1998, p. 2).
Historical significance can be attributed to the Common School movement of the
late 1800s which placed an emphasis on “Americanizing” immigrants in order to make
them responsible American citizens (Weise & Garcia, 1998, p. 2). The largest number of
immigrants arrived during the early 20th century from southern, eastern, and central
Europe. Families struggled for linguistic and cultural power to control the schools
(Ovando, 2003). This increase in immigration gave way to increased nativist fears of
separatism with the only viable solution being a quick assimilation into the American
way-of-life (Wiese & Garcia). The Naturalization Act of 1906 not so surprisingly
expressly stated that to become naturalized US citizens, immigrants must speak English
(Ovando).
History has documented bilingual education in the 19th and early 20th century,
but from 1920 to the mid-1960s, native language instruction was largely absent from
schools due to an anti-German reaction to World War I. This reaction manifested itself
into an anti-immigrant trend felt by the American public. By 1923, 35 states, which had
supported native-language instruction, adopted new legislation requiring that all classes
would be taught in English (Rothstein, 2001).
48
The first half of the 20th century rooted the teaching of immigrant students in a
pursuit of homogeneity, grounded in the “standardization and bureaucratization of urban
schools, the need for national unity during the two world wars, and the desire to
centralize and solidify national gains around unified goals for the country” (Ovando,
2003, p. 5). During this time, many large districts created classes to educate immigrant
students on the American way-of-life in order to prepare them for integration into
mainstream society. The dominant approach to teaching second language students at this
time was submersion or “sink-or-swim” (Ovando, 2003, p. 6).
During the first part of the 20th century, immigrant students were performing
poorly and had a lower graduation rate than that of English speaking students. By the
1920s, Italian students had settled primarily in Boston, Chicago, and New York. These
students scored an average of 85 points on I.Q. tests “compared to an average for native-
born students of about 102” (Rothstein, 2001, p. 220). The poor results of these tests led
to high rates of retention and to the unfortunate labeling of English Language Learner
(ELL) students as retarded. The challenge in New York schools was so severe that its
first special education classes were started. The rationale was based on a 1921 survey
which revealed that one-half of students who might currently be labeled learning disabled
had Italian-born fathers (Rothstein, 2001).
In 1963, the first two-way developmental program experiment established in the
United States was the Coral-Way Project, Miami, Florida. This program was initiated as a
result of the Cubans fleeing Fidel Castro but remaining intent on returning to Cuba to
overthrow the government. Therefore, in an attempt to preserve their children’s native
49
Spanish and to develop their English skills, the Cubans established private bilingual
schools (Thomas & Collier, 1997).
Two-way programs expanded when attention to foreign language for English-only
students increased research on education for language minority students as state and
federal funds were more available (Christian, Howard, & Loeb, 2000). Attention
increased when English-only families wanted their children to be bilingual (Gomez,
Freeman, & Freeman, 2005). For English-only students, the two-way immersion program
was similar to an immersion experience and offered a hopeful climate for improving
relationships among different language speakers (Christian, Howard, & Loeb).
The underlying issue for the United States has been whether the citizens are best
served by a one-culture-one-language approach to citizenry or by an approach that
promotes allegiance to one of the fundamental guiding principles of American
democracy: cultural and linguistic pluralism. Feinberg and Morencia (1998) contended,
“Those who favor the former support language education programs that result in personal
and societal monolingualism; those who favor the latter support programs that result in
personal and societal bilingualism or multilingualism” (p. 2).
Identification of English Language Learners
Abedi (2001) stated that national clarification was needed for universal
identification of English Language Learner (ELL) students. Limited English proficient
(LEP) and language minority have been frequent labels under federal legislation
(Vialpando, Linse, & Yedlin, 2005), but there have been no universally agreed upon
50
standards for identifying limited English proficient (LEP) students (Hopstock, 2003).
Conversely, there have been no uniform standards for agreeing when a LEP student
should be dismissed from second language services. States have identified students by
various labels and have labeled students as language minority based on their country of
origin, home language, or both. English has been listed as the minority language when a
patois or dialect makes standard American English the student’s second language (Smith-
Davis, 2004).
Menken (2000) stated that there has been great variance among the states
regarding identification of ELL students. Abedi and Dietel’s (2004) studies have found
the variety in schools’ identification of limited English proficient (LEP) produced
inconsistent results. One of the stumbling blocks to exacting a precise number of students
who qualify for English as a second language services has been that states differ in how
they measure the need for the service (Lessow-Hurley, 2003). Limited English proficient
students have often been identified during school registration with a language survey that
is filled out by the parents or guardians (Lessow-Hurley).
Students have been generally first identified for limited English proficient (LEP)
testing with a home language survey when they enter school (National Clearinghouse for
English Language Acquisition, 2006). At the point of registration, students are provided
with a home language survey, designed to identify students in need of second language
support. The accepted procedure has three steps: (a) Identify students in need of second
language support using a home language survey, (b) test the student if the home language

51
survey identifies the second as a second language learner, (c) place the student in an
appropriate classroom with second language support (Wilde, 2006).
Osher et al. (2004) stated that with current policy movements to withdraw
language support, it was important that research be conducted with ELL students, who in
large districts serving ELL students, have been disproportionately labeled as special
education students.
State of Florida Statutes
The following policies are included in the 2006 Florida Statutes:
(3) Each district school board shall implement the following procedures:
(a) Develop and submit a plan for providing English language instruction for limited English proficient students to the Department of Education for review and approval. (b) Identify limited English proficient students through assessment.
(c) Provide for student exit from and reclassification into the program.
(d) Provide limited English proficient students ESOL instruction in English and ESOL instruction or home language instruction in the basic subject areas of reading, mathematics, science, social studies, and computer literacy.
(e) Maintain a student plan.
(f) Provide qualified teachers.
(g) Provide equal access to other programs for eligible limited English proficient students based on need.
(h) Provide for parental involvement in the program.
* * *
52
(5) Each district school board's program for limited English proficient students shall be evaluated and monitored periodically.
(6) The State Board of Education shall adopt rules for the purpose of implementing this section. (Title XLVII K-20 Education Code, Chapter 1003 K-12 Education Code, p. 177).
Bilingual Programs
Rothstein (2001) defined bilingual as:
A preferred strategy for the last 20 years, [that] aims to teach academic subjects to immigrant children in their native languages (most often Spanish), while slowly and simultaneously adding English instruction . . . . further, the theory goes, teaching immigrants in their native language values their family and community culture and reinforces their sense of self-worth, thus making their academic success more likely. (p. 218)
Successful bilingual programs build second language literacy and foster students’
cultures which lead to increased student achievement (Brisk, 2000). Hopstock (2003)
reported that there are a number of common usage labels, e.g., bilingual classes, ESL
classes:
Research and observation indicate that there is very wide variability in the types of services being offered under each of those labels. There are “bilingual classes” in which there is virtually no native language use, ESL classes that do and do not include content instruction, and structured immersion classes with varying levels of adaptation for LEP students. (p. 6)
Roberts (1995) cautioned that there has been an inconsistency in program labeling
which contributes to the lack of uniform program components. Roberts continued that the
variables for teacher training, number of students and amount of time in the program, as
well as languages, ages, and grades all contribute to making each program unique. The
field of bilingual teaching has lacked consistent program labeling and teaching standards
53
(Bruce et al., 1997). Ferguson et al. (2001) asserted that unifying a system is made
difficult by the sheer demands that are placed on schools and teachers: “Too often, the
task overload many educators experience can turn important and fundamental changes
into small, quick fixes that change little” (p. 2). Schools have a class-centered approach
to limited English proficient (LEP) instruction (Hopstock, 2003). Within an English as a
second language (ESL) classroom, a Spanish-speaking student may be receiving
instruction in two languages while a Vietnamese student receives instruction in only
English. Thomas and Collier (2002) contended, that when English Language Learner
(ELL) students were assigned to segregated, remedial programs, they did not close the
achievement gap. Instead, the achievement gap only widened over time.
Ma (2002) posited that researchers have shown there is no one single bilingual
program that is best or most effective. Research reviewed revealed that several types of
bilingual programs may be effective with bilingual students. Ma stated, “This lack of
agreement among researchers is in part the result of wide-ranging differences in
implementation essentials, such as teacher quality” (p. 6).
Glenn (2002) stated that in European schools a “reception class” has been
provided for students who are past the age of starting school (p. 30). Younger children
are appropriately placed in mainstream kindergarten classes. The focus on the “reception
class” is the laying and building of the second language, supporting the belief that with a
solid foundation in the second language that academic success will occur over time.
Krashen (1999) stated that the goals of a bilingual program are “the development
of academic English and school success, and. . . the development of the heritage
54
language” (p. 1). The development of the heritage (first language) leads to an
appreciation of the student’s native culture (Krashen, 2005). A good foundation in a
student’s first language leads to better English language acquisition (Krashen, 1999).
Krashen (2005) stated that there are “two pillars” to bilingual education (p. 166).
The first pillar is the student’s background knowledge which helps the student to
understand the context of the English that he/she reads or hears. The second pillar is to
build literacy in the first language, since first language literacy is a “short cut to
developing literacy in the second language” (Krashen, p. 166).
Sunshine State TESOL of Florida’s Position Statement on Bilingual Education
(2005) stated that the issue at large for Florida’s increasing language minority students is
the lack of bilingual education and instruction in Florida schools. The Position Paper of
the Sunshine State TESOL contended that despite “the small number of bilingual
programs being implemented in various counties, bilingual education remains largely
invisible in the state” (p. 1).
The 2006 Florida Statutes supported the 2005 Sunshine State TESOL statement
with the following language: “Instruction in the English language shall be provided to
limited English proficient students. Such instruction shall be designed to develop the
student's mastery of the four language skills, including listening, speaking, reading, and
writing, as rapidly as possible” (Title XLVII K-20 Education Code, Chapter 1003 K-12
Education Code).

55
Basic Mainstream Instruction with Language Arts/ESOL Model
The Basic Mainstream Instruction with Language Arts/ESOL (English for
speakers of Other Languages) Model provides for content area instruction and English
language proficiency while providing a strong academic focus on language acquisition.
Limited English proficient (LEP) students from the same grade level are grouped together
for their grade level English class (Orange County Public Schools Multilingual Student
Education Services, n.d.a).
In the Basic Mainstream Instruction with Language Arts/ESOL model, there has
been a strong language component to facilitate language acquisition and a dedicated,
challenging, interactive curriculum, as well as linguistic and academic objectives (Ortiz,
2003). “In secondary schools, students receive Language Arts/ESOL from an ESOL
teacher and content classes from a certified teacher in their home school” (Orange
County Public Schools Multilingual Student Education Services, n.d.b). State of Florida
certification requirements for middle school teachers who desire to teach LEP students
are English/Language Arts certification with ESOL endorsement, ESOL certification, or
appropriate foreign language with ESOL endorsement (Orange County Public Schools
Multilingual Student Education Services, n.d.b).
English as a second language classes are classes instructed in the use of English
with little or no support in the student’s native language (Northwest Regional Educational
Laboratory Research Review, Winter 1995). This class is typically only taught at certain
times of the school day; the rest of the day the student is in “regular (or submersion)
instruction, an immersion program, or a bilingual program” (p. 7). Thomas and Collier
56
(1989) stated that when a bilingual teacher is not available or when there are too many
different languages in one school, English as a Second Language (ESL) classes are a
good alternative and should begin as early as possible for students.
Components of the Basic Mainstream Instruction with Language Arts/ESOL
program in Florida include: comprehensible instruction, Cognitive Academic Language
Learning Approach (CALLA), language development, and language arts/ESOL (Orange
County Public Schools Multilingual Student Education Services, n.d.b).
Home School Basic program/ESOL K-12
Basic Mainstream Instruction with Language Arts/ESOL program model for
Orange County, Florida, has been defined for elementary school parents, using the
Orange County Public Schools (OCPS) Parent Notification of Eligibility for Placement in
Programs for Students Learning English as a Second Language (n.d.b.). This program has
been defined as: “The students receive instruction of linguistic and grade level academic
skills in the homeroom classroom with students who are native speakers of English.”
Elementary schools are required to provide information to the parents on alternative
placement at a school(s) which offers instruction using the sheltered bilingual program
which is also known as the One-Way Developmental Bilingual Education program.
The OCPS Basic Mainstream Instruction Language Arts/ESOL Program Guide
English states: “In elementary schools, this model is only implemented in schools with
very small numbers of Language Enriched Pupils (LEP) where Bilingual Education
57
and/or Sheltered Instruction Models are clearly not feasible.” In schools where
appropriate, the LEP students are grouped together in the same classroom.
The OCPS pamphlet continues: “The elementary teacher in this model has a dual
responsibility, ESOL teacher and grade level teacher.”
ESOL (English for Speakers of Other Languages) Pullout
Roberts (1995) stated that in this model students are “pulled out” to receive
second language services (p. 373). Thomas and Collier (2002) stated that English as
second language teachers serve as resources to the mainstream classrooms. Typically,
students are “pulled out” of language arts classes (Roberts). Students worked with the
resource teacher for one period per day in the Collier and Thomas (2002) study. ESOL
pullout programs have mainstream classrooms with a small supplemental class to the
mainstream classroom. The ESOL Pullout delivery model has an assimilation goal to
mainstream minority language students (Rossell, 2005). This model was used by
elementary schools which do not have sufficient numbers of ELL students to allow for
the implementation of another program (Thomas and Collier).
Immersion
The immersion program model should be used for majority speakers who are
learning a foreign language and who seek academic proficiency and general
communication skills in the minority language (Genesee, 1999). Originally, immersion is
a Canadian second language program model (Cummins, n.d.b.; Lessow-Hurley, 2003;
58
Roberts, 1995). Roberts stated that in Canada, the majority English students were
learning French; hence, the model promoted bilingualism and biliteracy and was
pluralistic. But when the minority language student is immersed in the majority language,
the model is assimilationistic. Lessow-Hurley commented that “immersion programs
seem to work best when speakers of a majority language are immersed in a minority
language” (p. 39). Genesee (1999) stated that immersion programs are frequently
misunderstood and used as an option for English Language Learners. Results from the
Thomas and Collier (2002) studies showed that students who were enrolled in immersion
classes “showed large decreases in reading and math achievement by Grade 5” (p. 326).
Genesee cautioned, “Those who use results from immersion programs to argue against
first language instruction for English Language Learners misunderstand immersion and
are misapplying immersion approaches to a population for which they are not and never
were intended” (p 30). Characteristics of the immersion model include:
(a) a bilingual teacher who delivers instruction in the majority language but can
understand the minority language, (b) majority language modified for comprehensible
instruction and (c) language arts instruction delivered in the student’s native language
(Lessow-Hurley).
One-way Developmental Bilingual/ESOL Education
One-way Developmental Bilingual/ESOL Education is also known as Transitional
Bilingual, Bilingual or One-Way Developmental Bilingual. Orange County Public
Schools, Florida, defines One-way Developmental Bilingual Education as:
59
A home school [or center school] that has a sufficient number . . . LEP students who speak the same language and provides them with One Way Developmental Bilingual Education/ESOL services. Students receive grade level instruction in the native language and in English (Orange County Public Schools Multilingual Student Education Services, n.d.a.).
This program model serves as a bridge to English-only classes (Genesee, 1999;
Roberts, 1995). A successful transitional program must have a bilingual teaching staff
and bilingual teaching materials (Genesee). Thomas and Collier (2002) defined
developmental bilingual programs as providing a strong grade-level appropriate
education in Spanish throughout the primary years, gradually increasing the use of
English each year until 50% of the content is delivered in English. Thomas and Collier’s
2002 results of a one-way developmental program in Maine showed an 8.5% influence on
student reading achievement, overcoming the effects of poverty.
Developmental bilingual programs vary as to the “amount of native language
instruction provided and the duration of the program” (Northwest Regional, Winter 1995,
p. 6). The transitional bilingual program begins with content classes in the native
language, English as second language (ESL) classes, and mainstream electives or specials
(Genesee, 1999; Roberts, 1995). Developmental bilingual education models are
frequently found in schools with a significant number of ELL students especially if the
native languages number one or two. This model is pluralistic but does not aim for full
bilingualism.
Genesee (1999) stated that the transitional program model features included: (a)
effective minority language instruction for a solid academic foundation, (b) academic
instruction in English as a second language (ESL) and English practice in non-threatening
60
ways, (c) certified bilingual teachers, (d) proficiency in the minority language, (e) on
grade-level achievement, (f) advanced English proficiency, (g) continuing sheltered
English instruction, (h) accurate and ongoing assessments and rigorous curriculum, (i)
social interaction with majority students and (j) increased parental involvement.
In Thomas and Collier’s (1997a) longitudinal study, it was found that students in
one-way bilingual classes “out perform their counterparts being schooled in well-
implemented monolingual classes, as they reach the upper grades of elementary school”
(p. 15). Thomas and Collier also stated that these students continued their educational
gains into the secondary grades even when the program was not offered at the secondary
level. In their 2002 study, Thomas and Collier reported that informal observations on
reading achievement of students in a developmental bilingual program showed that these
students were out-performing students enrolled in second language content classes
without first language support.
Thomas and Collier’s (2002) studies showed that students enrolled in the 90-10
one-way developmental program had reached the 34th percentile by the 5th grade.
Genesee (1999) stated, “Schools must, therefore, provide additional support early on for
students who manifest academic difficulties or signs of falling behind in their first
language or in their oral English development to ensure early success” (p. 20).
Sheltered Instruction
Sheltered instruction uses English as the instructional language for the academic
courses. These classes are mostly comprised of English Language Learners, but
61
scheduling and small numbers may necessitate English Language Learners and native
speakers scheduled together in the same class. In this model, students are taught in
English with instructional modifications using the standard curriculum. Modifications for
the second language students are implemented in order to meet the language acquisition
needs of the English Language Learners (Genesee, 1999). Rossell (2005) stated that
many programs labeled as “bilingual programs” were really sheltered programs since
most of the instruction is in English.
The sheltered instruction model “provides for the simultaneous development of
subject area instruction and English language proficiency” (Ortiz, 2003, slide 17). With
this model, students are instructed in English with a native language translation. Students
from diverse backgrounds and different languages can be included in the sheltered
classroom, and this contributes to the overall success of this program model. Some of the
goals of this model include to “attain high levels of linguistic skills in English through
ESOL . . . . [and to] develop high levels of cross-cultural understanding” (Ortiz, 2003,
slide 19).
Students in this model must have equal access to all grade-level textbooks and
materials, bilingual dictionaries, and “qualified bilingual paraprofessionals that speak the
native language to the students” (Ortiz, 2003, slide 20). The sheltered model is a program
model which can easily fit into a school’s master schedule as well as provide meaningful
academic instruction for LEP students. Sheltered instruction is frequently found in
secondary schools (Rossell, 2005). Krashen (1999) stated that a gradual exit bilingual
62
program works best for second language students who exit the program via sheltered
subject matter classes.
Structured English Immersion (California Proposition 227)
The structured English immersion program is a program where the instruction is
delivered in English with modifications to vocabulary and instructional pace (Northwest
Regional, Winter, 1995). Combs, Evans, Fletcher, Parra, and Jimenez (2005) defined
Structured English Immersion (SEI) as English-only instruction with modifications to
meet the needs of the second language learner. Rossell (2005) defined SEI as a self-
contained classroom of primarily ELL students with mostly English instruction. Roberts
(1995) defined SEI as sheltered instruction. Classrooms are comprised primarily of ELL
students, and the trained teacher uses second language acquisition methods in his or her
teaching (Rossell).
Rossell (2005) stated that California schools adopted two structured immersion
programs after the Proposition 227 was mandated. California’s Proposition 227 is the
initiative to end bilingual instruction. The California legislation limits special English
instruction to one year. During this one-year period, instruction is delivered through the
student’s first language. After this one-year period, the student is immersed in English-
only classes (Feinberg & Morencia, p. 2).
Ma (2002) reported that in 1998 Californians voted for the currently used
structured English immersion program for use with bilingual students in pubic schools.
Spearheaded by businessman, Ron Unz, Proposition 227 sought to eliminate bilingual
63
instruction and replace current program models with one year of English language
instruction for bilingual students before placing them in mainstream classrooms. Arizona
voted for a similar bilingual approach in 2002.
Ma (2002) stated that California and Arizona had adopted “Unz Initiatives” that
limited the teaching of English to LEP students to one year. Ma stated that the results of
research clearly indicated that one year of English instruction was not enough
instructional time to prepare bilingual students for the mainstream classroom and not the
success Unz claimed. Everyday basic English communication was not enough English
acquisition for the academic English classrooms where content is daily taught in English.
Submersion
The submersion approach has placed students in a regular classroom setting with
English-only instruction without any native language instructional support (Northwest
Regional, Winter 1995). Placing students in the submersion classroom can be more
closely associated with “sink or swim” for the students (Lessow-Hurley, 2003, p. 40).
Rossell (2005) defined “sink-or-swim” as a mainstream classroom with no support for
ELL students.
The goal of submersion is the assimilation into the mainstream culture for ELL
students (Roberts, 1995). This is a subtractive approach to bilingual education in that the
first language is not supported. Lau v. Nichols (1974) found this method of instruction to
be unconstitutional (as cited in Northwest Regional, Winter 1995). Roberts stated that
this appeared to be a predominant approach in the United States to teaching English as a
64
second language. It was Rossell’s (2005) belief that mainstream classes appeared to be
more practical for schools, and that there was no significant research that indicated this to
be a harmful situation for ELL students.
Two-Way Immersion
Wu and Bilash (1998) defined two-way immersion or dual-language education as
a program which brings students together who speak two languages. Two-way
immersion, also known as enriched education, Two-way bilingual (Gomez, Freeman, &
Freeman, 2005; Roberts, 1995) and developmental bilingual (Roberts) seeks to promote
the studying of the native language as well as English with students having classes in
both languages. Roberts defined maintenance bilingual programs as programs for ELL
students with equal emphasis on English and the native language. This program model
places high academic achievement first and language acquisition second (Genesee, 1999).
The delivery model has a pularistic goal to develop the bilingualism and the bi-literacy in
both languages for majority and minority students. Two-way immersion program models
include instruction in English and the minority language, solidifying minority language
literacy for the limited English proficient (LEP) students and foreign language instruction
for the English-only students (Christian, Howard, & Loeb, 2000; Weise, 2004).
Two-way immersion programs provide for content area instruction and language
instruction in both languages (Christian, Howard, & Loeb, 2000). Two-way immersion
develops “full proficiency in the first language and high levels of proficiency in the
second language” (Genesee, 1999; Gomez, Freeman, & Freeman, 2005, p. 146). Collier
65
and Thomas (1989) found that the two-way immersion program was the most successful
program since this program promoted the first language along with English.
Two-way immersion has mainly been used in elementary schools, but some
schools have developed a K-12 model (Gomez, Freeman, & Freeman, 2005). Optimally,
instruction is in one language for an extended period of the day with academic instruction
in both languages and non-English used 50% of the time (Genesee, 1999). Many
elementary schools use the 90/10 instructional model where the minority language is used
for 90% of the time in early elementary grades, gradually increasing English over time,
and balancing at the 50/50 model (Christian, Howard, & Loeb, 2000; Gomez, Freeman,
& Freeman). The 50/50 model begins with an equal amount of time spent speaking each
language (Gomez, Freeman, & Freeman). Attrition at the upper grade levels is usually
apparent, resulting in unbalanced student numbers (Christian, Howard, & Loeb). Two-
way immersion is still a viable possibility even with unbalanced student numbers
(Gomez, Freeman, & Freeman).
The components of the two-way immersion model include: English added as the
student continues to develop his or her native language and monolingual English speakers
learn a new language through the experience (Lessow-Hurley, 2003). Genesee (1999)
stated that two-way immersion programs include: (a) integration of students in the
minority and majority language, (b) program duration should be four to six years, (c)
assessment is focused on mastery, (d) equal status provided to speakers of both languages
and (e) classrooms are comprised of 50% native speakers and 50% English Language
Learners.

66
De Jong (2004) found that despite significant differences in students in two-way
immersion and developmental bilingual programs, they needed at least four years for the
development of productive academic English skills. It was also determined in this
quantitative study that a possible “plateau” exists for English Language Learners which
may slow the process of learning English (p. 104). Gomez, Freeman, and Freeman (2005)
found in their study that students in a 50/50 two-way immersion for Spanish-speaking
and English-speaking students reported higher standardized test scores.
English as a Second Language Teacher Education and Training
Teachers do not have adequate training to help English Language Learner (ELL)
students, and sometimes teachers misinterpret behavior because of the cultural
differences. The most powerful approach is helping teachers to provide a culturally rich
classroom where instruction takes into consideration the cultural value systems of diverse
populations (Bazron, Osher, & Fleishman, 2005). According to Azzam (2004), fewer
than 13% of the teachers have professional development to aid them with the teaching of
ELL students. This number is high in lieu of No Child Left Behind and the impact of high
stakes testing and accountability.
A 1998 National Center for Education Statistics survey of teachers revealed that
only 17% of the teachers who taught English Language Learners were totally prepared to
teach. One-third of the teachers were somewhat prepared and 33% of the teachers were
moderately prepared (as cited in White-Clark, 2005). Due to a lack of teacher training,
some teachers have resorted to less effective instructional methods to meet the needs of
67
the English Language Learners due to the lack of skills, knowledge, and pedagogy that
teachers need in order to be equipped to teach these students (White-Clark).
Miller, Strosnider, and Dooley (2000) contended that the teaching population was
becoming increasingly homogeneous while the student population was becoming
increasingly heterogeneous. They reported that white/non-Hispanic teachers make-up
87% of the education workforce compared to 66% of the student population.
Lessow-Hurley (2003) asserted that public school teachers tended to be white and
middle class, and very few Americans can claim their cultural roots. Some teachers state
they have no culture. Teachers potentially can have little understanding of the second
language student’s struggle for assimilation into the English speaking classroom,
expecting more than the students can produce and placing ELL students at the same
ability level as English-only students (Short & Echevarria, 2004).
Smith-Davis (2004) reported a widespread concern regarding educators who lack
a second language as well as the linguistic and cultural understanding for language
minority students. Feinberg and Morencia (1998) stated, “Mainstream teachers must
therefore learn the skills and strategies needed to teach these students and become
familiar with the resources that can assist them” (p. 2). When teachers are monolingual
and depend on language minority paraeducators for interpretation between the students
and the teacher, teachers do not understand what the paraeducator is saying to students
nor can monolingual teachers evaluate student responses (Smith-Davis, 2004).
Miller, Strosnider, and Dooley (2000) expanded the 1997 Evans, Torrey, Newton
study to include all facets of diversity, including marginalized and disenfranchised
68
groups. They stated that the sheer nature of 21st century public schools demanded
multicultural training and diversity training.
Miller, Strosnider, and Dooley (2000) reported that the definition of diversity and
details of diversity training varied greatly from state-to-state. Some states merely required
evidence of training while others listed specific courses, number of semester hours and
specific field experiences needed. Only 39% of the states provided a comprehensive
explanation of their required training and experiences. Advocates for Children of New
York and the New York Immigration Coalition (2002) stated that there was a lack of
qualified, bilingual or English as a second language (ESL) teachers. Often, ELL students
were reportedly taught by uncertified teachers.
Courses or partial preparation experiences have not been found to have a
significant impact on preparing teachers to enter the field and have often been found to be
inadequate (Miller, Strosnider, & Dooley, 2000). Villegas and Lucas (2002) stated that
the typical teacher preparation program had one or two courses on multiculturalism and
that these courses were often optional. Additionally, teacher preparation programs have
not always met the requirements for the teaching of minority language students, forcing
school districts with the greatest need for ESL teachers to depend more and more on
native language paraeducators in the classrooms (Smith-Davis, 2004).
Miller, Strosnider, and Dooley (2000) reported in their national study that 67% of
the states required some kind of diversity training for teachers to obtain an initial teaching
license. Of the participating states, 37% looked at each individual teacher to make a
determination and 51% reported that there must be some kind of evidence of
69
multicultural training for state teacher education programs to be approved. Nine states did
not require any diversity or multicultural training for program approval.
Diversity and multicultural requirements for the preparation of teachers varied
among the states. Although 34 states (67%) had the same licensure requirements, 6 (12%)
were found to have varying requirements. Some states had an extensive requirement for
one content area/grade level of teaching and none for another area of teaching such as
elementary (Miller, Strosnider, & Dooley, 2000).
According to Azzam (2004), fewer than 13% of the teachers had professional
development to aid them with the teaching of ELL students. Caldreon (1997) contended
that weakness in bilingual professional staff development designs and delivery can create
student failure and program criticism. Until only recently, language minority students
have been delegated to bilingual teachers depriving other teachers of an enriching,
cultural experience. In Combs, Evans, Fletcher, Parra, and Jimenez’s (2005) qualitative
study of second language elementary students in Loma Vista, Arizona, it was determined
that sheltered English instruction teachers are mainly uninformed of the instructional
model and that staff training had been disorganized.
Major Federal and State Policy and Case Law
One of the earliest protections for ESOL students is Amendment XIV of the
United States Constitution, Section 1, which stated that all persons who are born or
naturalized in the United States shall not be denied the privileges of an American citizen.
Feinberg and Morencia (1998) commented, “There are no constitutional language rights

70
per se other than the First Amendment guarantee of freedom of speech. Language-
minority students are, however, protected by a prohibition against discrimination on the
basis of national origin” (p. 5).
Amendment XIV of the US Constitution, Section 1, (1866) specifically states that
all persons who are born or naturalized in the United States shall not be denied the
“privileges or immunities of citizens of the United States; nor shall any state deprive any
person of life, liberty, or property, without the due process of law; nor deny to any person
within its jurisdiction the equal protection of the laws.”
Although most frequently cited as a case representing the disparity between black
and white children, this case has served as an important landmark case for all minorities.
In the case of Brown et al., v. Board of Education of Topeka et al., argued on December
9, 1952, before the Supreme Court of the United States and decided on May 17, 1954, the
court was presented an appeal representing four cases involving black children who were
denied access to public schools attended by white children under the laws of segregation.
These cases came on appeals from the states of Kansas, South Carolina, Virginia,
and Delaware and were grouped together in a class action suit. In the Kansas case, the
appellants were black children who brought suit against Kansas “to enjoin enforcement of
a Kansas statute which permits, but does not require, cities of more than 15,000
population to maintain separate school facilities for Negro and white students Kan. Gen.
Stat. sec. 72-1724 (1949)” (p. 5). The lower court found that the “Negro and white
schools involved had been equalized, or were being equalized with respect to buildings,
curricula, qualifications and salaries of teachers, and other tangible factors” (p. 1). The

71
District Court found for the appellant in this matter, stating that segregation “has a
detrimental effect on Negro children, but denied relief on the ground that the Negro and
white schools were substantially equal with respect to buildings . . . . and educational
qualifications of teachers” (p. 5). The appeal came forward based on the Fourteenth
Amendment, the existing racial segregation, and the views of the appellants, who saw the
Amendment as their basis for appeal based on existing laws permitting segregation.
The Court further stated, “The equal protection clause of the Fourteenth
Amendment prohibits states from maintaining racially segregated schools” (p. 3). Here
the justices sided with the appellants who believed the schools had violated the
Fourteenth Amendment. This became part of the foundation for the court’s opinion. The
lower court cited Plessy v. Ferguson, 163 U.S. 537 (1986), which supported the “separate
but equal” doctrine and provides Blacks and whites equality in public education but at
separate but equal facilities. The justices concluded that this separation “has no place in
the field of public education” (p.3). The justices stated that it was not solely the
equalization of buildings, curricula, transportation but the totality of the effect on children
who were segregated in public schools. The justices concluded:
Today, education is perhaps the most important function of state and local governments . . . . It is the very foundation of good citizenship. Today it is a principal instrument in awakening the child to cultural values, in preparing him for later professional training, and in helping him to adjust normally to his environment . . . . Such an opportunity, where the state has undertaken to provide it, is a right which must be made available to all on equal terms. (p. 11)
The justices further stated:
Does segregation of children in public schools solely on the basis of race, even though the physical facilities and other ‘tangible’ factors may be equal, deprive
72
the children of the minority group of equal educational opportunities? We believe that it does. (p. 11) When the federal government enacted the 1965 Immigration Act, the doors to the
United States opened for more Asian and Latin Americans to enter the United States
(Molesky, cited in Ovando, 2003). By the mid-1960s “there were indications that the
federal government was ready to become involved” in public education (Congress, 1997,
p. 1). Two major pieces of legislation forever impacted the future of bilingual education:
the Civil Rights Act of 1964 (PL 88-352) and the Bilingual Education Act of 1968 (Title
VII of the Elementary and Secondary Education Act).
Title VI of the Civil Rights Act of 1964, Nondiscrimination in Federally Assisted
Programs, laid the foundation which specifically protects ESL students who are enrolled
in schools that receive federal assistance. The opening lines of the Civil Rights Act of
1964 set forth its intent which includes among others “to authorize the Attorney General
to institute suits to protect constitutional rights in public facilities and public education, to
extend the Commission on Civil Rights, to prevent discrimination in federally assisted
programs” (p. 1). This Act authorized and provided protection for students enrolled in
public schools and established one of the primary premises for future litigations and
subsequent laws. With this Act, the US Congress “set a minimum standard for the
education of language minority students with Title VI” (Weise & Garcia, 1998, p. 3).
Title VI Section 601 of the Civil Rights Act of 1964 mandated:
No person in the United States shall, on the ground of race, color, or national origin, be excluded from participation in, be denied the benefits of, or be subjected to discrimination under any program or activity receiving Federal financial assistance. (p. 12)
73
Section 602 of Title VI of the Civil Rights Act of 1964 authorized Section 601
and set forth the due process for agencies that receive federal assistance. Section 603 of
Title VI provided for withdrawal of federal financial assistance to schools and/or districts
that violate Section 602. Specifically, Section 603, detailed that in a case of action the
penalty will be “terminating or refusing to grant or to continue financial assistance upon
a finding of failure to comply with any requirement imposed pursuant to section 602” (p.
13).
Weise and Garcia (1998) commented on the Johnson (1963-1969)
administration’s “war on poverty”:
The “war on poverty” legislation was largely based on the cultural deprivation theory or culture of poverty theory, which dominated educational psychology. Instead of genetic inferiority, environmental factors were viewed as the main reasons for the underachievement of minority children. In theory, specific types of attitudes, language styles, work values, and other behaviors dampened the abilities necessary to overcome poverty. This implicitly encouraged a subtractive form of bilingual education, where the native language and culture were not viewed as resources to build on, but as barriers to overcome. (p. 5) In 1967, Texas Senator Yarborough, with Senate Bill 428, proposed the
amendment of the Elementary and Secondary Education Act, recommending the creation
of a new section, Title VII, which later became known as the Bilingual Education Act.
Originally attacked by members of Congress for the bill’s limited linguistic scope, the bill
eventually was broadened to include funding for schools with poor non-English speaking
students (Congress, 1997). Nunez-James (2002) stated that the original intent of the
Bilingual Education Act, protected in New Mexico’s Bilingual Multicultural Education
74
Act (1973), assured the students’ cultural and linguistic backgrounds will be preserved in
their academic educations.
Title VII, also known as the Bilingual Education Act of 1968, created a
framework for federal funds to schools who served students with limited English
proficiency but was terrifically unclear “about whether the goal of the program should be
a rapid transition to instruction in English or a slower approach allowing the maintenance
of the child’s native language and customs” (Congress, 1997, p. 4). For the first time
though, the federal government sought to “build upon students’ home cultures, languages,
and prior experiences in such a way that they could start learning without first being
proficient in English” (Ovando, 2003, p. 8).
One effect of the Bilingual Education Act of 1968 was that “14 states had enacted
statutes that permitted bilingual programs, and 13 others passed legislation that mandated
them” (Escamilla, 1989, p. 2). To give proper credit to the Bilingual Education Act, one
must also note the reauthorizations of 1974, 1978, 1984, 1988, 1994 (Wiese & Garcia,
1998), its eventual death on January 8, 2002, and rebirth as Title III of No Child Left
Behind.
In 1968, the last year of the Johnson administration, the Department of Health,
Education, and Welfare issued general Title VI guidelines to the 1964 Civil Rights Act
which held “school systems …responsible for assuring that students of a particular race,
color, or national origin are not denied the opportunity to obtain the education generally
obtained by other students in the system” (Lyons, 1990, p. 70).
75
The Office of Civil Rights, inspected and followed up on these 1968 guidelines
with a memorandum, providing specific direction to school districts (Lyons, 1990, p. 70).
In his May 25, 1970, Memorandum, Pottinger, Director of the Office of Civil Rights, sent
by the Department of Health, Education, and Welfare to School Districts with More Than
Five Percent National Origin-Minority Group Children cited as its subject: Identification
of Discrimination and Denial of Services on the Basis of National Origin. The
memorandum specifically addressed Title VI of the Civil Rights Act of 1964, stating
“that there be no discrimination on the basis of race, color or national origin in the
operation of any federally assisted programs” (p. 1).
Pottinger (1970) declared in the memorandum that, under Title VI compliance,
reviews in school districts with large Spanish-surnamed populations revealed common
practices that had the effect of denying services to this population of students. The letter
continued by directing districts not to place ESOL students in dead-end curriculum
classes and to adequately notify language minority parents of school activities. The
memorandum also addressed the potential need for notification and communication with
ESOL parents to be in a language other than English.
Further, Pottinger (1970) directed that when language was the barrier for national-
origin minority students to effectively participate in the educational program, the district
“must take affirmative steps to rectify the language deficiency in order to open its
instructional program to those students” (p. 1).
In addition, the Pottinger memorandum (May 25, 1970) directed districts to take
affirmative steps to rectify the language deficiency in instruction programs for language

76
minority students and directed districts to not label ESOL students as retarded based on
their English proficiency. The second directive simply stated that “school districts must
not assign national origin-minority group students to classes for the mentally retarded”
based on their proficiency with the English language (p. 1).
The third directive in Pottinger’s (1970) memorandum provided that any ability
grouping of national-origin minority students used by schools based on language needs
“must be designed to meet such language skill needs as soon as possible and must not
operate as an educational dead-end or permanent track” (p. 1). The forth directive
instructed that “school districts have the responsibility to adequately notify national
origin-minority group parents of school activities which are called to the attention of
other parents” (Pottinger, p. 1). The directive continued that notification and
communication with parents of English Language Learner (ELL) students may need to be
in a language other than English (Pottinger, p. 1).
Concluding the memorandum, Pottinger (1970) directed school districts to
examine their current practices for compliance; and if compliance problems were
determined, they were to notify the Office of Civil Rights and to indicate the steps they
were taking to remedy any compliance issue. In closing, Pottinger mandated that
effective with the date of the Memorandum, the aforementioned areas of concern were to
be directed to the regional Office for Civil Rights as part of the school districts’
compliance responsibilities.
In the United States Supreme Court appeal Lau v. Nichols (1974), a San Francisco
Neighborhood Legal Assistance Service, on behalf of a group of Chinese students, filed a
77
class action suit against the San Francisco Unified School District and sought relief under
the Fourteenth Amendment. The suit alleged that of the 2,856 Chinese-speaking students
in San Francisco, “about 1,000 are given a supplemental course in the English
Language,” leaving approximately 1,800 students who were not provided supplemental
English (Blocker et al., n. d., p. 18). The court found that the district had failed to provide
the students with adequate instruction to overcome the language barrier. It was further
determined by the Court that districts had the responsibility to help students overcome
their language disadvantage.
Justice Douglas stated, “Where inability to speak and understand the English
language excludes. . . the district must take affirmative steps to rectify the language
deficiency in order to open its instructional program to these students” (Blocker et al.,
n.d., p. 4). The Court found that the district had failed to provide the students with
adequate instruction to overcome the language barrier. The Court stated, “There is no
equality of treatment merely by providing students with the same facilities, text books,
teachers, and curriculum; for the students who do not understand English are effectively
foreclosed from any meaningful education” (Blocker et al., n.d., p. 5).
In this case, the Court “held that school programs conducted exclusively in
English denied equal access to education to students who spoke other languages”
(Escamilla, 1989, p. 2). It was further determined by the Court that districts had the
responsibility to help students overcome their language disadvantage. But the Court
failed when it “directed only that all students who do not speak English be served in some
meaningful way. It stopped short of making bilingual education an absolute requirement”

78
(Escamilla, p. 2). The Lau decision did not describe the content or method of
instructional delivery, but instead, left open to interpretation the board range of
possibilities for educating limited English proficiency students (Ovando, 2003). The Lau
decision provided some relief for second language learning students but did not provide
for an established pedagogical or methodical foundation.
Despite the fact that the Lau decision raised the nation’s consciousness to see the
need for bilingual education and “abolished the sink-or-swim practice,” clearly, as of
1974, districts were not complying with earlier legislation (Ovando, 2003, p. 9).
Therefore, it was necessary to make the guidelines clearer and more specific as evidenced
by the creation of the Equal Educational Opportunity Act of 1974. The Memorandum of
May 25, 1970, and the Lau decision were put into legislation as an amendment to the
1974 Elementary and Secondary Education Act of 1965, Section 1703. Named the Equal
Educational Opportunities Act of 1974, districts were directed to include national
minority-origin students in the school experience and to not impede their education. The
Act compelled all schools, not just those receiving federal funds, to comply (Ovando,
2003).
The Equal Educational Opportunity Act of 1974 specifically addressed in Part 2,
Unlawful Practices, and Section 1703, Denial of equal educational opportunity
prohibited. The Equal Educational Opportunity Act of 1974 implicitly stated that no state
shall deny educational access to any student based on national origin, that there was to be
no deliberate segregation of second language learning students based on their national
origin status, that schools should take affirmative steps to insure that there was no dual

79
educational system for second language learning students, and that students would not be
assigned to schools that were not close to them based on their second language learning
status.
On the heels of the Lau decision and the Equal Education Opportunity Act, the
Ford administration (1974-1977) recognized the critical need for Title VI compliance
when an investigation revealed that many districts were not providing any services for
second language learning students. Organizing a massive Title VI enforcement program,
the Department of Health, Education, and Welfare initiated a massive effort “by
developing ‘remedial’ rather than ‘compliance’ guidelines for districts not in compliance
with Title VI under Lau” (Lyons, 1990, p. 72).
The effort, known as The Lau Remedies, mandated specified methods and
approaches to identifying and evaluating second language learning students, determining
appropriate instructional methods, evaluating the second language learning student’s
readiness for mainstream, and determining the professional standards by which the
teachers would be measured (Lyons, 1990, p. 72). Furthermore, The Lau Remedies
commanded that “bilingual education should be implemented in all school districts with
at least 20 ELLs who represent the same language” (Ovando, 2003, p. 10). The Lau
Remedies created a framework that “redirected school districts to provide strong versions
of bilingual education for language-minority students to enable them to become bilingual,
biliterate, and bicultural” (Ovando, 2003, p. 10).
In the US District Court of Appeals, the case of Otero, et al. v. Mesa County
Valley School District No. 51, et al. (1977) was remanded back to a lower court to decide
80
whether or not County Valley School District No. 51 had discriminatory hiring practices
with regard to Mexican-Americans. The suit originally was brought on behalf of nine
Mexican-American school children who attended public school in District No. 51. The
suit alleged that District No. 51 had discriminated against the Appellants “on the basis of
race and national origin in connection with both the curriculum offered the students and
in connection with the employment practices of the school district in the hiring of
teachers and supporting personnel” (p. 2). The trial court found in favor of the
defendants, stating that there was no right under the Fourteenth Amendment to a
bicultural education program, citing there was not a significant number of Mexican-
American students with “substantial English language problems which to any real degree
inhibited their educational achievement” (p. 2). In this matter, the court found that the
plaintiff had not brought suit under the Lau-Serna doctrine and Serna v. Portales
Municipal.
The trial Court found that the plaintiffs, as school-aged children, did not have a
standing to bring suit regarding the hiring practices of the defendants; that they did not
establish a prima facie case showing discrimination; that even with a prima facie case, the
defendants’ case substantially upheld their hiring practices; and that even if the plaintiffs
prevailed, the defendants already had an effective affirmative action plan in place to
increase their Mexican-American employees (Otero, et al. v. Mesa County Valley School
District No. 51, et al., 1977).
The appellants alleged that the disproportionately low number of Mexican-
American personnel had “an adverse effect upon the educational opportunity afforded the

81
Mexican-American pupil” (Otero, et al. v. Mesa County Valley School District No. 51, et
al., 1977, p. 3). The appeals court believed that the students did hold a personal stake in
the case. Despite the loss regarding bilingual-bicultural curriculum, the appeals court
stated that the trial court did not have a basis to deny the claim for discriminatory hiring
and found the lower court’s findings insufficient. This judgment was vacated and
remanded with directions that the trial court make new findings and conclusions with
respect to the matter of discriminatory hiring practices.
In the case of Certain Named and Unnamed Non-citizen Children and Their
Parents v. Texas (1980), On Application to Vacate Stay, a class action suit was brought
on behalf of school-aged children who were “undocumented alien children and their
parents” (p. 1). The trial court ruled that the Texas Education Code prohibited “the use of
state funds to educate alien children who are not ‘legally admitted’ to the United States”
and had enjoined all “school districts within Texas from denying a free public education
to any child, otherwise eligible, due to the child’s immigration status” (p. 1). Therefore,
“The plaintiff appealed to an individual Justice of the United States Supreme Court, as
Circuit Justice, to vacate the stay” (p. 1).
In this case, Justice J. Powell granted the application to vacate the stay pending
appeal. The trial court held that the state law prohibiting the education of illegal alien
children violated equal protection under the Fourteenth Amendment and thus “prohibited
state education officials in all school districts within the state from denying a free public
education to any child, otherwise eligible, due to the child’s immigration status” (Certain
Named and Unnamed Non-citizen Children and Their Parents v. Texas, 1980, p. 2).
82
Justice Powell stated he believed that the harm weighed most heavily on the
undocumented alien children and that a Supreme Court decision would be most probable.
Justice Powell indicated that the State’s estimate of the involved children had
been 120,000, but the trial court rejected that figure for a more tenable one at 20,000:
“The District Court concluded that ‘the great majority of the undocumented children . . . .
are or will become permanent residents of this country’” (Certain Named and Unnamed
Non-citizen Children and Their Parents v. Texas, 1980, p. 4).
The court found that Texas statute 21.301 “effectively denied an education to the
plaintiff children. Although they could attend school upon payment of tuition, the court
further found that such payment is beyond the means of their families” (Certain Named
and Unnamed Non-citizen Children and Their Parents v. Texas, 1980, p. 4). The trial
court found direction in the Equal Protection Clause “which extends protection to persons
within a State’s jurisdiction, and ruled that a state law which purports to act on any
person residing within the State is subject to scrutiny under the Clause” (Certain Named
and Unnamed Non-citizen Children and Their Parents v. Texas, 1980, p. 4).
The Court continued that the applicants presented a convincing argument that the
children would suffer if the stay was not vacated. Undocumented alien children had not
been able to attend school since 1975 when the aforementioned statute was enacted.
Justice Powell stated:
The harm caused these children by lack of education needs little elucidation. Not only are the children consigned to ignorance and illiteracy they also are denied the benefits of association in the classroom with students and teachers of diverse backgrounds. Instead, most of the children remain idle, or are subjected prematurely to physical toil, conditions that may lead to emotional and behavioral

83
problems. (Certain Named and Unnamed Non-citizen Children and Their Parents v. Texas, 1980, p. 7) The Justice stated that the absence of an additional year of education while
litigation continued would do more harm to the many children in need of an education.
The State argued that vacating the stay would place a financial burden on the existing
pupil expenditure. In addition, the State contended that placing more bilingual students in
the Texas education system would put a strain on the current resources in order to be in
compliance with state and federal policies. According to filed affidavits, Houston
Independent School District No. 3 would be the only district to suffer stress when the
children were allowed to attend school. Justice Powell concluded that the most harm
would be done to the children and he vacated the stay (Certain Named and Unnamed
Non-citizen Children and Their Parents v. Texas, 1980).
The judge in an Arizona case, Flores v. Arizona (2001), found that the bilingual
programs were inadequately funded, that too many students existed in any one classroom,
that not there were not sufficient resources, and that teachers were under qualified (as
cited in Acevedo et al., 2002).
Castaneda v. Pickard (1981), a Texas appeal to the United States Court of
Appeals, Fifth Circuit, Unit A, marked another appeal which was affirmed in part and
reversed in part and remanded. The plaintiffs were Mexican-American children and their
parents who were representative of a larger group. They alleged that the Raymondville
Independent School District had engaged in discrimination by segregating language
minority students into a school with dead-end curriculum programs, resulting in student
84
labeling. The court’s decision stated that, although second language students are educated
and grouped together, they could not be labeled and placed in dead-end curriculum
programs (Blocker et al. (n.d.).
The Raymondville Independent School District had a history of ability grouping.
Labels for elementary, junior, and high schools were “high,” “average,” and “low”
(Blocker et al., n.d., p. 34). The Court acknowledged language grouping:
Practice which actually groups children on the basis of their language ability and then identified these groups not by description of their language ability but with a general ability label is, clearly has the effect of perpetuating the stigmas of inferiority originally imposed on Spanish speaking children by past practices of discrimination. (p. 37)
It was further stated:
RISD had in the past segregated and discriminated against Mexican-American students and that, as yet, RISD has failed to establish a unitary system in which all vestiges of this earlier unlawful segregation have been eliminated because the virtually 100% Mexican-American school, L.C. Smith, is a product of this earlier unlawful policy of segregation. (p. 32)
In the consolidated appeal of School Board v. United States Department of
Education, St. John the Baptist Parish School Board v. United States Department of
Education, St. Bernard Parish School Board v. United States Department of Education,
and St. Charles Parish School Board v. United States Department of Education (1987)
the United States Court of Appeals rendered an Opinion on an appeal from the district
court. The basis for these cases were the orders from the United States Department of
Education to repay grant monies received under Title VII of the Elementary and
Secondary Act known as the Bilingual Education Act of 1968.
85
The Opinion by Circuit Judge Politz stated that the Bilingual Education Act
provided for grant funding to enhance the learning for ELL students who are, also,
limited English proficient. Judge Politz quoted Congress by citing the following
definitions for language minority students:
The terms “limited English proficiency” and “limited English proficient” when used with reference to individuals means--(A) individuals who were not born in the United States or whose native language is a language other than English; (B) individuals who come from environments where a language other than English is dominant, as further defined by the Secretary by regulation.
* * *
And who, by reason thereof, have sufficient difficulty speaking, reading, writing, or understanding the English language to deny such individuals the opportunity to learn successfully in classrooms where the language of instruction is English . . . . 20 U.S.C. sec. 3223(a)(1) (School Board v. United States Department of Education, St. John the Baptist Parish School Board v. United States Department of Education, St. Bernard Parish School Board v. United States Department of Education, and St. Charles Parish School Board v. United States Department of Education, 1987, p. 2)
Students who were classified as limited English proficient must have came from a home
where a language other than English was the dominant language. As a result of this
exposure, they experienced a learning hurdle when performing in English-only classes.
These students qualified for language enhancement programs as envisioned by Congress
(School Board v. United States Department of Education, St. John the Baptist Parish
School Board v. United States Department of Education, St. Bernard Parish School
Board v. United States Department of Education, and St. Charles Parish School Board v.
United States Department of Education, 1987).
The four Louisiana parishes named in School Board v. United States Department
of Education, St. John the Baptist Parish School Board v. United States Department of
86
Education, St. Bernard Parish School Board v. United States Department of Education,
and St. Charles Parish School Board v. United States Department of Education (1987)
were initially awarded grants under Title VII to be used for limited English proficient
students. This appeal presented a unique look at the New Orleans area of Louisiana.
St. Bernard Parish was a group of islands off the coast of New Orleans whose
principal language was Spanish “with a dialect reflecting Acadian, French, Portuguese,
and Creole influences” (School Board v. United States Department of Education, St. John
the Baptist Parish School Board v. United States Department of Education, St. Bernard
Parish School Board v. United States Department of Education, and St. Charles Parish
School Board v. United States Department of Education, 1987, p. 4). St. Bernard Parish
used standard measurements for students who qualified for bilingual education, including
speaking Spanish, living in a Spanish-speaking community, and performance below the
6th stanine. St. Bernard Parish also included Anglo students who fell below the 6th
stanine as a way to classify them as limited English proficient. St. Bernard’s application
was approved for the fiscal years 1979, 1980, 1981 (p. 4). The supporting data were
reported to the “National Bilingual Resource Center, Lafayette, Louisiana, which
conducted assessments of bilingual programs” (p. 4).
Tangipahoa Parish, located in southeast Louisiana, had an Italian heritage.
Tangipahoa’s programs were designed to meet the bilingual education needs of 556
qualifying students in the fourth, fifth, and sixth grades. Tangipahoa used identification
measures in line with St. Bernard and was awarded grants for the fiscal years 1979, 1980,
and 1981. The Court stated, “During this time the Department of Education conducted

87
on-site reviews and annual evaluations” (School Board v. United States Department of
Education, St. John the Baptist Parish School Board v. United States Department of
Education, St. Bernard Parish School Board v. United States Department of Education,
and St. Charles Parish School Board v. United States Department of Education, 1987, p.
5). Tangipahoa was reviewed and found to be in compliance.
St. John the Baptist Parish, located north of New Orleans and divided by the
Mississippi River, was settled by 18th century French, and many residents list French as
their first language. Similar to the above parish, St. John the Baptist Parish used
comparable indicators for limited English proficient students, and their grants as well
were funded for the fiscal years 1979, 1980, and 1981. During this time, federal
education investigations were conducted on-site and evaluations praised the program
(School Board v. United States Department of Education, St. John the Baptist Parish
School Board v. United States Department of Education, St. Bernard Parish School
Board v. United States Department of Education, and St. Charles Parish School Board v.
United States Department of Education, 1987).
St. Charles Parish, located east of St. John the Baptist Parish and divided by the
Mississippi River as well, had many Cajun residents. The Court explained, “Cajun is a
phonetic corruption of Acadian” (School Board v. United States Department of
Education, St. John the Baptist Parish School Board v. United States Department of
Education, St. Bernard Parish School Board v. United States Department of Education,
and St. Charles Parish School Board v. United States Department of Education, 1987, p.
5). In 1977, St. Charles Parish submitted a grant application to enhance the language

88
skills of the Cajun students. Grant approval was awarded from 1977 to 1981 to help
kindergarten to third grade students in three targeted elementary schools. Federal officials
in this case, as well, inspected the program and found it to be meeting its objectives.
Between late 1980 and 1981, the United States Department of Education
conducted extensive investigations into each of the four parish bilingual programs. In late
spring of 1982, the Educational Appeal Board issued letters of non-compliance to all four
parishes, demanding repayment of the following amounts: St John $765,603; St. Bernard
$753,205; Tangipahoa $572,054; and St. Charles $477,100.29 (School Board v. United
States Department of Education, St. John the Baptist Parish School Board v. United
States Department of Education, St. Bernard Parish School Board v. United States
Department of Education, and St. Charles Parish School Board v. United States
Department of Education, 1987, p 7). In Analysis for Tangipahoa, St. John and St.
Bernard Parishes, the Court found that the Educational Appeal Board had “erred legally
when it held that an audit was not required” (p. 8). The Court concluded “that Congress
would not have used the word audit in Title VII if it had not intended an audit
requirement” (p. 9).
The Court, also, found “the Department concedes that in the hundreds of final
audit determination letters it had issued, including several in Louisiana, it had never
before issued a final audit determination without first conducting an audit” (School Board
v. United States Department of Education, St. John the Baptist Parish School Board v.
United States Department of Education, St. Bernard Parish School Board v. United
States Department of Education, and St. Charles Parish School Board v. United States

89
Department of Education, 1987, p. 9). The Court continued that three parishes did not
have an opportunity to explain the results of the abbreviated investigations, which were
conducted without notice, stating that what appeared apparent may have needed further
explanation. Therefore, the Court granted the petitions for Tangipahoa, St. Bernard, and
St. John the Baptist parishes, “remanding to the Department with instructions to
reconsider the matter, and if it decides to proceed against these three parishes, that proper
audits be first made” (p. 11). With regard to St. Charles Parish, the Court found that an
audit did take place, and it was ordered: “St. Charles, specifically, that it should be
required to repay only funds expended in a manner clearly inconsistent with the Act”
(p. 11). The petitions for review for all four parishes were granted, subject to the reasons
set forth.
In Florida, on behalf of the League of United Latin American Citizens (LULAC),
META (Multicultural Education Training Advocacy, Inc.) brought suit against the State
of Florida by filing League of United Latin American Citizens (LULAC), et al. v. Florida
Board of Education and Florida Department of Education, et al. (1990), in the US
District Court for the Southern District of Florida, Miami Division. The suit was settled
out-of-court, resulting in a settlement agreement wherein Florida’s 67 school districts
were required to comply.
The Settlement Agreement provided for equal access for limited English
proficient (LEP) students to all instructional programs and services and provided a
structure for comprehensible instruction. The Settlement Agreement placed the
responsibility on the districts to comply with federal and state laws that govern the
90
education of limited English proficient students and required districts to submit annual
reports. The Agreement directed that three home language questions be asked at the time
of registration to determine if LEP services testing is necessary. Included in the
Agreement was the direction that limited English proficient students receive classes in
intensive English language instruction and basic subject areas, comparable to non-LEP
classes, and that no limited English proficient student be subjected to discipline for the
use of a language other than English (League of United Latin American Citizens
(LULAC) et al. v. Florida Board of Education and Florida Department of Education, et
al. 1990).
The Agreement provided for equal access for limited English proficient students
to all instructional programs and services as well as provided a structure for
comprehensible instruction. Further, the Agreement did not place any new requirements
or restrictions on Florida public schools; instead, the Agreement placed the responsibility
on the districts to comply with already existing federal and state laws that govern the
education of limited English proficient students. The Agreement allowed for the court to
retain “jurisdiction for the purpose of overseeing implementation of the agreement”
(League of United Latin American Citizens (LULAC) et al. v. Florida Board of Education
and Florida Department of Education, et al. 1990, p. 1). With this monitoring process in
place, Florida in 1992 created the “Office of Multicultural Student Language Education
within the Division of Public Schools to ensure full compliance with the Decree” (League
of United Latin American Citizens (LULAC) et al. v. Florida Board of Education and
Florida Department of Education, et al. 1990, p. 1). At the time of the present study, the
91
Florida Department of Education was required to submit an annual report indicating
compliance with the Agreement by public schools.
On August 14, 1990, the settlement agreement was entered into by the above
parties. The terms of the Agreement (encapsulated) were as follows:
1. The Settlement Agreement was entered into to resolve a dispute between the
parties regarding the issue of federal and state compliance for the Defendant.
2. The Settlement Agreement applied to all parties, including employees, agents,
etc.
3. The State, acting for the Defendants, had the obligation to set standards for
Florida school districts to comply with federal and state regulations.
Defendants issued emergency regulations to be followed by the Settlement
Agreement on or before November 14, 1990.
4. The Defendants for a period of five years agreed to submit to the Plaintiff’s
counsel an annual report.
5. The parties agreed to bargain in good faith as to the amount of attorney’s fees
the Defendants will pay the Plaintiffs.
6. Enforcement for violations was explicitly set forth.
The final settlement agreement between the parties was divided into six sections.
Section I addressed the Identification and Assessment of limited English proficient (LEP)
students. Among other items, this section stated that at the start of the 1990-1991 school
year, all potential limited English proficient students would be provided a home language
92
survey, either on the registration form or another form, which would include the
following questions:
1. Is a language other than English used in the home?
2. Does the student have a first language other than English?
3. Does the student most frequently speak a language other than English?
Also, students who qualified for second language services were to be tested (League of
United Latin American Citizens (LULAC) et al. v. Florida Board of Education and
Florida Department of Education, et al., 1990, p. 6).
Section II, Equal Access to Appropriate Programming, detailed the academic
opportunities to be afforded second language learner students. This included, among
other items, equal access to “intensive English language instruction and instruction in
basic subject matter areas of math, science, social studies, computer literacy” which was
to be understandable to the student and comparable with non-LEP classes (League of
United Latin American Citizens (LULAC) et al. v. Florida Board of Education and
Florida Department of Education, et al., 1990, p. 9). Section III, Equal Access to
Appropriate Categorical and Other Programs for LEP Students, granted LEP students the
right to participate and to benefit from programs and assistance already in place or that
would be in place in the future. Included in Section III was Discipline, which specifically
stated, “The Florida Department of Education shall issue and monitor standards to assure
that no national origin minority or limited English proficient student is subjected to any
disciplinary action because of their use of a language other than English” (p. 18).
93
Section IV related to Personnel and detailed certification and inservice training
teachers were required to have in order to teach limited English proficient students.
Section V, Monitoring Issues, stated that the Florida Department of Education was
charged with monitoring the districts for compliance. Section VI, Outcome Measures, set
forth that a progress monitoring system must be in place by the Florida Department of
Education (League of United Latin American Citizens (LULAC) et al. v. Florida Board of
Education and Florida Department of Education, et al., 1990).
Signed on January 8, 2002, by President George W. Bush, No Child Left Behind
created the Office of English Language Acquisition, Language Enhancement, and
Academic Achievement for Limited-English-Proficient Students and mandated an
educational reform (cited in Crawford, 2002, p. 2). No Child Left Behind (NCLB)
specifically addressed second language students in Title III. Here the federal government
set forth the Declaration of Rights for Parents of English Language Learners Under No
Child Left Behind. For limited English Proficient (LEP) students, these guidelines
included learning core academic subjects at the same level as English speakers, the right
to accept or deny LEP placement, annual testing for assessment for language acquisition,
and the right to have students reach their greatest academic potential among others
(Paige, 2004).
The National Association for Bilingual Education (NABE) wrote a position paper
on the NCLB. NABE recounted that in 2001 it had supported NCLB in what it believed
to be a means to promote high standards and increased attention to limited English
proficient (LEP) students. In theory, the NCLB Act of 2001 mandated a rigorous
94
curriculum, staffed with qualified teachers for ELL students since sanctions were now
tied to student outcomes (Lazarin, 2006). No Child Left Behind required that 95% of
ELL students who were eligible be tested with the appropriate approved state academic
achievement test. These data were then to be disaggregated (Wilde, 2006).
Linn (2005, Summer), writing for the National Center for Research on Evaluation,
Standards, and Student Testing (CRESST), stated that there is a fundamental problem
with the NCLB and the requirement that by 2014 all students reach English proficiency.
Linn for CRESST stated that currently, there is no established definition of “proficiency”
to use with NCLB. Abedi and Dietel (2004) stated, “For a goal to be within reach of all
schools [by 2014], at least one school should have already attained it. To date we have
yet to see a school with a sizeable ELL population that meets the 2014 NCLB
requirements” (p. 5).
Summary
This chapter has been used to present a review of literature and related research.
The review was organized to address the theoretical framework, outside influences on
language acquisition, the achievement gap, bilingual programs, language acquisition, and
major federal and state case law and policies. In addition to several English Language
Learner program models, the program models for the present study were introduced.
Literature on the achievement gap established a foundation for this study. Chapter 3
reviews in detail the methodology of the study. The analysis of the data is presented in

95
Chapter 4. Chapter 5 contains a summary and discussion of the findings and implications
of the study.
96
CHAPTER 3 METHODOLOGY
Introduction
This chapter contains the methods and procedures used to conduct the study.
Detailed information regarding the sampling method, data collection, instrumentation,
research questions, and hypotheses are presented. The study initially called for the
participation of 26 southern Florida counties. A total of 6 schools were to be selected
from each district, 3 schools using the Language Arts/ESOL program and 3 schools using
the One-Way Developmental Bilingual Education program. Each program was to be
measured using the schools’ standard curriculum FCAT reading mean scale scores and
the schools’ FCAT reading mean scale scores for the English Language Learner (ELL).
The design called for a total of 156 Florida schools.
Further investigation revealed that the district ELL student populations were
extremely small in most of the counties. Therefore, the study was expanded to all 67
District English Speakers of Other Languages (ESOL) contacts for English Language
Learners (ELL). Emails were sent to each district contact to determine whether the
Language Arts/ESOL program and/or the One-Way Developmental Bilingual Education
program were implemented with the county’s ELL student population. Response was
relatively low with only 28 county contacts responding and overwhelmingly reporting
that their counties either mainstreamed their ELL students or required their teachers to be
English Speakers of Other Languages (ESOL) certified or endorsed.
97
Based on these responses, the researcher narrowed the study to one large urban
Florida district which historically has implemented both the Language Arts/ESOL
program and the One-Way Developmental Bilingual Education program for the district’s
ELL student population.
Sampling Method
A convenience sample was selected, using the one identified large, urban
district’s middle schools. In this study, no schools were identified. The researcher found
10 middle schools of the 32 in the district that implemented the One-Way Developmental
Bilingual Education program model in the 2006-2007 school year. The remaining schools
were investigated regarding their English Language Learner (ELL) programs. A total of
13 middle school principals or their designees responded that their schools implemented
the Language Arts/ESOL program for their English Language Learner (ELL) students.
Charter schools, alternative schools, K-8 schools, and exceptional education schools were
excluded from this study.
Data Collection Procedures
Data were collected for the 2007 Florida Comprehensive Assessment Test
(FCAT) reading test for seventh grade as reported to the Florida Department of
Education. Disaggregated data were made available at www.fcatresults.com/demog by
eMetric, a San Antonio, Texas, state-approved vendor, who provided web-based
reporting for large-scale high stakes tests. Standard student FCAT reading mean scale
98
scores by school and ELL FCAT reading mean scale scores by school were used in this
study.
Specific school reports were run from www.fcatresults.com/demog which
included: the size of each school’s total 7th-grade population, the number of standard
curriculum students in the seventh grade for each school, and the number of ELL students
in the seventh grade for each school. The FCAT data obtained for the school reports from
eMetric also included: percentage of students at each FCAT reading achievement level
and the percentage of students at Level 3 and above. The FCAT data for each school’s
standard curriculum students as well as the data for either the Language Arts/ESOL
program students, or the One-Way Developmental Bilingual Education program students
were analyzed.
The results from the 2007 7th-grade FCAT reading test were generated and used
as the data for comparison scores between the schools’ standard curriculum and ELL
mean scale scores.
Instrumentation
The Florida Comprehensive Assessment Test (FCAT) was a criterion-referenced
reading test, first administered in 1998 to Florida students. The test was designed to
measure individual student achievement of the Florida curriculum benchmarks, the
Sunshine State Standards. The Sunshine State Standards (SSS) were adopted in 1996
with the expectation that Florida public school teachers would teach the Sunshine State
Standards for reading (Florida Department of Education, 2007a). In 2000, Florida 7th-
99
grade students took a field-test version of the FCAT reading test. Since 2002, Florida
students in grades 3-10 have taken a grade-level appropriate version of the FCAT reading
test (Human Resources Research Organization, 2002).
Items on the 7th-grade FCAT reading test were 100% multiple-choice (Orr, n.d.).
Each multiple choice item was worth 1 point and was chosen from a possible 3 or 4
choices per test item (Assessment and School Performance, Florida Department of
Education, 2007).
Using the 2002 FCAT reading test, scores were divided into five achievement
levels, and four reporting cluster categories were developed for reading. Overall
performance score reports and performance category sub scores were reported (Human
Resources Research Organization, 2002). The cluster categories for seventh grade were:
“(a) Words and Phrases in Context; (b) Main Idea, Plot, and Purpose; (c) Comparisons
and Cause/Effect; and (d) Reference and Research” (Human Resources Research
Organization, 2002, p. 3; Florida Department of Education, 2005). The total points
possible for each reporting cluster were as follows: Words and Phrases in Context, 6;
Main Idea, Plot, and Purpose, 22; Comparisons and Cause/Effect, 17; and Reference and
Research, 6 (Florida Department of Education, 2007b).
Five achievement levels were developed ranging from Level 1 to Level 5.
Level 3 for reading was described as:
This student has partial success with the challenging content of the Sunshine State Standards, but performance is inconsistent. A student scoring in Level 3 answers many of the test questions correctly but is generally less successful with questions that are the most challenging. (Florida Department of Education, 2007a, p. 1)
100
“Level 3 indicates that a student’s performance is on grade level” (Florida
Department of Education, Accountability, Research, and Measurement, 2007, p. 18).
The mean scale scores for each student were reported from 100 (as the lowest
possible score) to 500 as the highest possible score. The 7th-grade 2007 FCAT reading
cut scores were as follows: Level 1: 100-266; Level 2: 267-299; Level 3: 300-343;
Level 4: 344-388; and Level 5: 389-500 (Florida Department of Education, 2007a, p. 2).
Instrument Validity and Reliability
According to the Florida Comprehensive Assessment Test Summary of Tests and
Designs (2005), the reading test has been linked to the Florida Sunshine State Standards.
The number of test items on the 7th-grade FCAT reading test was 50-55 items. The test
was administered over a 120 minute period. The average words per reading passage was
600 words with a range of 300-1100 words per passage. A total of 40% of the FCAT
reading test was literature-based, and 60% of the test was informational text-based
(Florida Department of Education, 2005). Content categories with an approximate
percentage of raw score points included: Words and Phrases in Context, 15-20%; Main
Idea, Plot, and Purpose, 30-55%; Comparisons and Cause/Effect, 15-25%; and Reference
and Research, 10-30%. Items for the 2007 FCAT reading test were classified using a
model based on Webb’s cognitive classification system. The percentages of cognitive
complexity for the 7th-grade 2007 FCAT reading test were as follows: low cognitive
complexity, 15-25%; moderate cognitive complexity, 50-70%; and high cognitive
101
complexity, 15-25%. Performance test items typically were found in the moderate and
high complexity ranges.
Tests items were initially drafted by education professionals, forwarded on to the
contractor for “critical content and editorial review,” and returned to the Florida
Department of Education Test Development Center (Human Resources Research
Organization, 2002, p. 4). Items were then subjected to reviews by committees for
“(1) content, sensitivity/bias, match to benchmark, and FCAT style; (2) community
sensitivity committees; (3) bias committees, with representatives from a variety of
cultural backgrounds; and (4) content committees” (p. 4).
In 2002, the FCAT underwent its psychometric analyses. Schools representing the
regions, diversity, and achievement of Florida’s students were selected from across the
state. Only standard curriculum students were involved in the analyses. English Language
Learner (ELL) students with two years or less time in an ELL program were excluded
(Human Resources Research Organization, 2002). In 2007, only ELL students with less
than one year in an ELL program were exempt from the FCAT. In 2007, ELL students
with more than one year qualified for testing accommodations for the FCAT (Assessment
and School Performance, Florida Department of Education, 2007).
One set of comparison scores formed the group of “total population group, which
included all students with FCAT records for March 2002,” and one set of comparison
scores formed the standard curriculum students (Human Resources Research
Organization, 2002, p. 8). Both groups included those who attempted but did not receive
a FCAT score due to failing the criteria. These groups formed the basis for comparisons

102
for gender and ethnicity distributions for the calibration sample (Human Resources
Research Organization, 2002).
The calibration sample for 7th-grade reading consisted of 5,243 students. Included
were the following subgroups: Asian, 120; African-American, 1450; Hispanic, 737;
American Indian, 21; multi-racial, 78; and white, 2,824. The calibration sample was
compared to the 7th-grade reading Total Standard Curriculum group which included the
following subgroups of students: Asian, 3,434; African-American, 38,721; Hispanic,
30,218; American Indian, 470; multi-racial, 1,877; and white, 87,857. The “total
population” group consisted of the following subgroups of students: Asian, 3,845;
African-American students, 46,967; Hispanic, 39,188; American Indian, 549; multi-
racial, 2,133; and white, 101,743 (Human Resources Research Organization, 2002).
Mean scores for the calibration sample for white students were 319.16 compared
to Hispanic students at 294.43. The all scored standard curriculum students mean scores
were 294.57 for the Hispanic students and 322.20 for the white students (Human
Resources Research Organization, 2002).
In testing difficulty and using 43 items, results from the 2002 item analysis for the
7th-grade FCAT reading test for p-values “should show that items vary in difficulty, but
should not be too high (above .90) or too low (near chance, .025) for multiple choice
items” (Human Resources Research Organization, 2002, p. 25). Results of the test for
p-values for seventh grade revealed a median percentile of .630 for item difficulty and a
maximum of .901 (p. 25). A Pearson correlation test was used to show the relationship
103
between FCAT reading items and FCAT reading raw scores and did not show a negative
correlation. The test revealed a minimum of .060 and a maximum of .533.
Item response theory scaling procedures used a Theta scale. By using this scale,
FCAT scores could be reported on the 100 to 500 scale. The “process involved (1)
repeating anchor items from previous tests in the 2002 FCAT test” and “(2) applying the
Stocking/Lord, 1983, procedure” (Human Resources Research Organization, 2002,
p. 34). The procedures equated scores to the original scores from the 2002 7th-grade
FCAT reading test. Since 2002, this procedure has been used each year with different
items (Human Resources Research Organization, 2002).
The Q1 statistic (chi-square) was used as an index to measure how well the
observed FCAT levels of achievement matched the expected student performance FCAT
scores. “The Q1 statistic may be used as an index for how well theoretical item curves
match observed item responses. Q1 uses student achievement scores in combination with
estimated item parameters to compute expected performance levels on each item”
(Human Resources Research Organization, 2002, p. 39).
Cronbach’s alpha test was employed to show reliability on raw scores only and
resulted in total alpha of .909 for the 7th-grade reading test (Human Resources Research
Organization, 2002, p. 50). The Livingston and Lewis method of cross-tabulation of the
true score versus the observed score was also used in a 5 x 5 test (p. 57). In addition,
accuracy and consistency tests were used to show that the true status was the accurate
conditional level for each FCAT achievement level (Human Resources Research
Organization, 2002).
104
Research Questions
In this study, schools with 7th-grade standard curriculum students, English
Language Learners (ELL) students in the Language Arts/ESOL program, and ELL
students in the One-Way Developmental Bilingual Education program were compared.
The study was guided by the following research questions:
1. To what extent is there an achievement gap between schools with standard
curriculum students and schools with ELL students in the Language
Arts/ESOL program on the 2007 7th-grade FCAT reading test?
2. To what extent is there an achievement gap between schools with standard
curriculum students and schools with ELL students in the One-Way
Developmental Bilingual Education program on the 2007 7th-grade FCAT
reading test?
3. What is the distribution of schools in the study with standard curriculum
students and schools with ELL students as measured by the mean scale score
in levels 1-5 of the 2007 7th-grade FCAT reading test?
4. To what extent is there an achievement gap between schools with standard
curriculum students and schools with ELL students in the Language
Arts/ESOL program scoring Level 3 or higher on the 2007 7th-grade FCAT
reading test?
5. To what extent is there an achievement gap between schools with standard
curriculum students and schools with ELL students in the One-Way

105
Developmental Bilingual Education program scoring Level 3 or higher on the
2007 7th-grade FCAT reading test?
Hypotheses
In addition, the following research hypotheses were proposed:
H1 : There is an achievement gap between schools with standard curriculum
students and schools with ELL students in the Language Arts/ESOL program.
H2: There is an achievement gap between schools with standard curriculum
students and schools with ELL students in the One-Way Developmental Bilingual
Education program.
H3: There is an achievement gap in the distribution of all schools with standard
curriculum students and all schools with ELL students as measured by the mean scale
score in levels 1-5 of the 7th-grade 2007 FCAT reading test.
H4: There is an achievement gap between schools with standard curriculum
students and schools with ELL students in the Language Arts/ESOL program scoring
Level 3 or higher as measured by the 7th-grade 2007 FCAT reading test.
H5: There is an achievement gap between schools with standard curriculum
students and schools with ELL students in the One-Way Developmental Bilingual
Education program scoring Level 3 or higher as measured by the 7th-grade 2007 FCAT
reading test.
106
Procedures
This study included a convenience sample of 23 middle schools. The middle
school principals were contacted by email to verify the use of the Language Arts/ESOL
program or the One-Way Developmental Bilingual Education program for English
Language Learners (ELL) in their schools. A total of 10 schools were identified as having
the One-Way Developmental Bilingual Education program (Orange County Public
Schools, n.d., p. V-15). An additional 13 schools were verified as having implemented
the Language Arts/ESOL program. The total number of middle schools used for this
study was 23.
The data for the 2007 FCAT reading test for seventh grade was retrieved from
www.fcatresults.com/demog. Disaggregated data for the 7th-grade FCAT reading results
for the schools were requested. These requested data included school data for standard
curriculum students and ELL students for each of the 23 schools.
The computer program, SPSS Version 13.0 for Windows, was used for tabulating
the data. The variables selected for this study included one dependent variable with three
groups. This dependent variable had three groups of FCAT reading mean scale scores:
the FCAT reading mean scale scores for each school’s standard curriculum students, the
FCAT reading mean scale scores for each school’s Language Arts/ESOL program
students, and the FCAT reading mean scale scores for each school’s One-Way
Developmental Bilingual Education program students. For Research Questions 1, 2, 4,
and 5 only, two groups of the dependent variables were used in each question.
107
For this study, the independent variable had three levels. The levels represented
the program type: The standard curriculum, the Language Arts/ESOL program, and the
One-Way Developmental Bilingual Education program. For Research Questions 1, 2, 4,
and 5 only, two levels of the independent variable were used in each question.
For Research Question 1, the independent variable had two levels and represented
the schools’ ELL program type: the standard curriculum and the Language Arts/ESOL
program. The dependent variable had two groups which were the schools’ FCAT mean
scale scores for the standard curriculum students and the schools’ FCAT mean scale
scores for the Language Arts/ESOL program students.
For Research Question 2, the independent variable had two levels and represented
the schools’ program type: the standard curriculum and the One-Way Developmental
Bilingual Education program. The dependent variable had two groups which were the
schools’ FCAT mean scale scores for the standard curriculum students and the schools’
FCAT mean scale scores for the One-Way Developmental Bilingual Education program
students.
The descriptive statistics for Research Questions 1 and 2 included tests for
frequency distribution which included frequency distribution, histogram, and boxplot.
The measures of central tendency tests included the mean, median, mode. Tests of
variability included the range, standard deviation, variance, and range (Shavelson, 1988).
In Research Question 3, the dependent variable had three groups which were the
schools’ FCAT mean scale scores for the standard curriculum students, the schools’ mean
scale scores for the One-Way Developmental Bilingual Education program students, and
108
the schools’ mean scale scores for the Language Arts/ESOL program students. The
independent variable had three levels for the programs: The standard curriculum, the
One-Way Developmental Bilingual Education program, and the Language Arts/ESOL
program.
For Research Question 3, descriptive statistics were used to measure the
differences among the programs and included tests for frequency distribution which
included frequency distribution, histogram, and boxplot. The measures of central
tendency tests included mean, median, mode. Tests of variability included the range,
standard deviation, variance, and range.
For Research Question 4, the independent variable had two levels and represented
the schools’ program type: the schools’ standard curriculum and the schools’ Language
Arts/ESOL program. The dependent variable had two groups which were the schools’
FCAT mean scale scores for the standard curriculum students and the schools’ FCAT
mean scale scores for the Language Arts/ESOL program students.
For Research Question 5, the independent variable had two levels and represented
the schools’ program type: the standard curriculum and the One-Way Developmental
Bilingual Education program. The dependent variable had two groups which were the
schools’ FCAT mean scale scores for the schools’ standard curriculum students and the
schools’ FCAT mean scale scores for the One-Way Developmental Bilingual Education
program students.
The descriptive statistics for Research Questions 4 and 5 included tests for
frequency distribution which included frequency distribution, histogram, and boxplot.

109
The measures of central tendency tests included the mean, median, mode, and tests of
variability included the range, standard deviation, variance, and range (Shavelson, 1988).
The inferential statistics tests for Research Questions 1 and 2 included the
independent t-test. The independent t-test measured “whether a difference between the
means of two samples is significant” (Frankel & Wallen 2000, p. 258; Shavelson, 1988).
Lomax (2001) stated, “Two samples are independent when the method of sample
selection is such that those individuals selected for sample 1 do not have any relationship
to those individuals selected for sample 2” (p. 121).
Summary
This chapter presented the methods and procedures employed in conducting a
quantitative study with schools’ with ELL programs and standard curriculum as
measured by the 7th-grade 2007 FCAT reading test. This chapter contained a description
of the population, the sampling method, and detailed information regarding the FCAT
instrument. Provided also were the research questions, hypotheses, and a description of
the statistical procedures used in analyzing the data.
Chapter 4 contains the presentation of the data analysis. Chapter 5 will use these
results to inform conclusions and implications of the study regarding the achievement gap
between schools’ standard curriculum students and English Language Learner students.

110
CHAPTER 4 ANALYSIS OF DATA
Introduction
The purpose of the study was to investigate the Language Arts/ESOL program
and the One-Way Developmental Bilingual Education program to determine if one of the
programs for English Language Learner (ELL) students closed the achievement gap more
closely than the other when measured against standard curriculum students at the same
schools. Five research questions and five hypotheses guided the data analyses.. Included
in this chapter are the findings of the statistical tests conducted in response to the research
questions and hypotheses formulated for the study.
The data used for this study was the 7th-grade 2007 FCAT reading mean scale
scores for each of the 23 schools in the study. The FCAT data for the schools’ ELL
students and standard curriculum students were generated by eMetric, a state-approved
vendor who reported disaggregated data at www.fcatresults.com/demog.. The data for
Research Questions 1 and 2 were reported in FCAT mean scale scores for the schools
based on the number of standard curriculum students and ELL students. The data for
Research Questions 3, 4, and 5 were reported in percentages based on the total number of
standard curriculum students and ELL students in the schools. These data were then used
in the generation of descriptive and inferential statistics. Variables of particular interest to
the study were the 7th-grade 2007 FCAT reading mean scale scores for the schools who
participated in the standard curriculum and either the Language Arts/ESOL program or
One-Way Developmental Bilingual Education program.
111
Research Questions
Research Question 1
To what extent is there an achievement gap between schools with standard curriculum students and schools with ELL students in the Language Arts/ESOL program on the 2007 7th-grade FCAT reading test?
Measures of central tendency served to represent pictures of the data that
researchers may interpret to see the distribution of the raw data. The statistical procedures
employed in this study provided pictures of the raw data for the Language Arts/ESOL
program implemented in 13 of the schools as well as the standard curriculum for each of
the schools.
The first measures of central tendency were the mean, median, and mode. The
tests provided data on the schools’ Language Arts/ESOL program and the schools’
standard curriculum in each of these schools. The mean for the Language Arts/ESOL
program was an FCAT mean scale score of 277.3077 compared to the FCAT mean scale
score of 327.3077 for the standard curriculum students. This test showed a 50-point
difference on the 7th-grade FCAT reading mean scale scores with the schools’ standard
curriculum students scoring higher than the schools’ Language Arts/ESOL program
students. These results are displayed in Table 1.
The median for the schools’ Language Arts/ESOL program students was a FCAT
mean scale score of 280.00 compared to that of the standard curriculum students’ FCAT
mean scale score of 330.00. This, again, showed a 50-point difference on the schools’
FCAT mean scale scores.
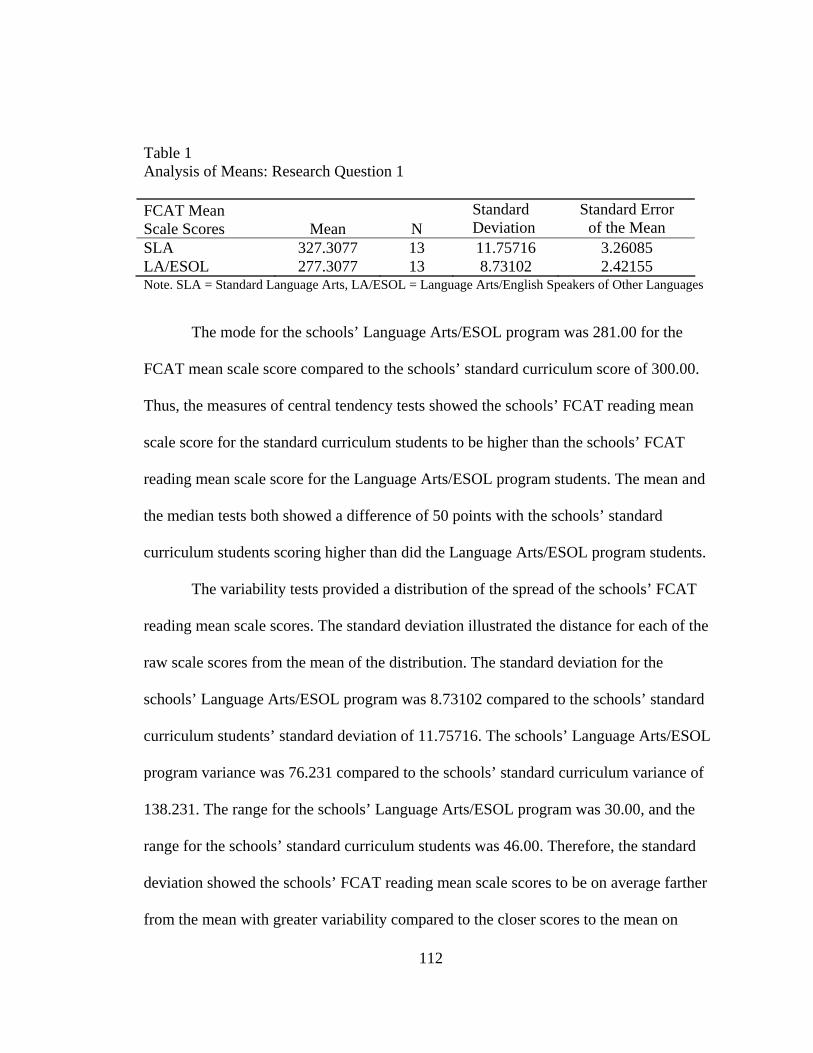
112
Table 1 Analysis of Means: Research Question 1 FCAT Mean Scale Scores Mean N
Standard Deviation
Standard Error of the Mean
SLA 327.3077 13 11.75716 3.26085 LA/ESOL 277.3077 13 8.73102 2.42155 Note. SLA = Standard Language Arts, LA/ESOL = Language Arts/English Speakers of Other Languages
The mode for the schools’ Language Arts/ESOL program was 281.00 for the
FCAT mean scale score compared to the schools’ standard curriculum score of 300.00.
Thus, the measures of central tendency tests showed the schools’ FCAT reading mean
scale score for the standard curriculum students to be higher than the schools’ FCAT
reading mean scale score for the Language Arts/ESOL program students. The mean and
the median tests both showed a difference of 50 points with the schools’ standard
curriculum students scoring higher than did the Language Arts/ESOL program students.
The variability tests provided a distribution of the spread of the schools’ FCAT
reading mean scale scores. The standard deviation illustrated the distance for each of the
raw scale scores from the mean of the distribution. The standard deviation for the
schools’ Language Arts/ESOL program was 8.73102 compared to the schools’ standard
curriculum students’ standard deviation of 11.75716. The schools’ Language Arts/ESOL
program variance was 76.231 compared to the schools’ standard curriculum variance of
138.231. The range for the schools’ Language Arts/ESOL program was 30.00, and the
range for the schools’ standard curriculum students was 46.00. Therefore, the standard
deviation showed the schools’ FCAT reading mean scale scores to be on average farther
from the mean with greater variability compared to the closer scores to the mean on

113
average for the schools’ Language Arts/ESOL program. The range confirmed that the
schools’ FCAT reading mean scale cores for the Language/Arts program students were
closer together than the schools’ FCAT reading mean scale scores for the standard
curriculum students.
The frequency table revealed how often a FCAT mean scale score occurred and
the spread of the scores. For the schools’ Language Arts/ESOL program, each FCAT
mean scale score occurred once for all scores except at 281 where two schools had this
FCAT mean scale score. The lowest FCAT mean scale score was 258, and the highest
FCAT mean scale score was 288.. The frequency table for the schools’ standard
curriculum revealed no identical mean scale scores with all FCAT mean scale scores
being reported only once. The lowest FCAT mean scale score for the schools’ standard
curriculum was 300, and the highest FCAT mean scale score was 346.
The boxplot for the schools’ Language Arts/ESOL program showed three outliers
at 258, 265, and 270 with the balance of the scores clustered between 274 and 288. The
boxplot for the schools’ standard curriculum showed one outlier at 300 and one outlier at
346 with the balance of the scores between 315 and 340. The histogram provided yet
another picture of raw data. The results of the histogram for the schools’ Language
Arts/ESOL program showed 7 schools clustered between FCAT mean scale scores of 280
and 290. These results compared to the schools’ FCAT mean scale scores for the standard
curriculum showed 9 schools clustered between FCAT mean scale scores of 320 and 340.
Therefore, the results of the boxplot and the histogram showed significantly lower FCAT
mean scale scores for the schools’ Language Arts/ESOL program students. One school
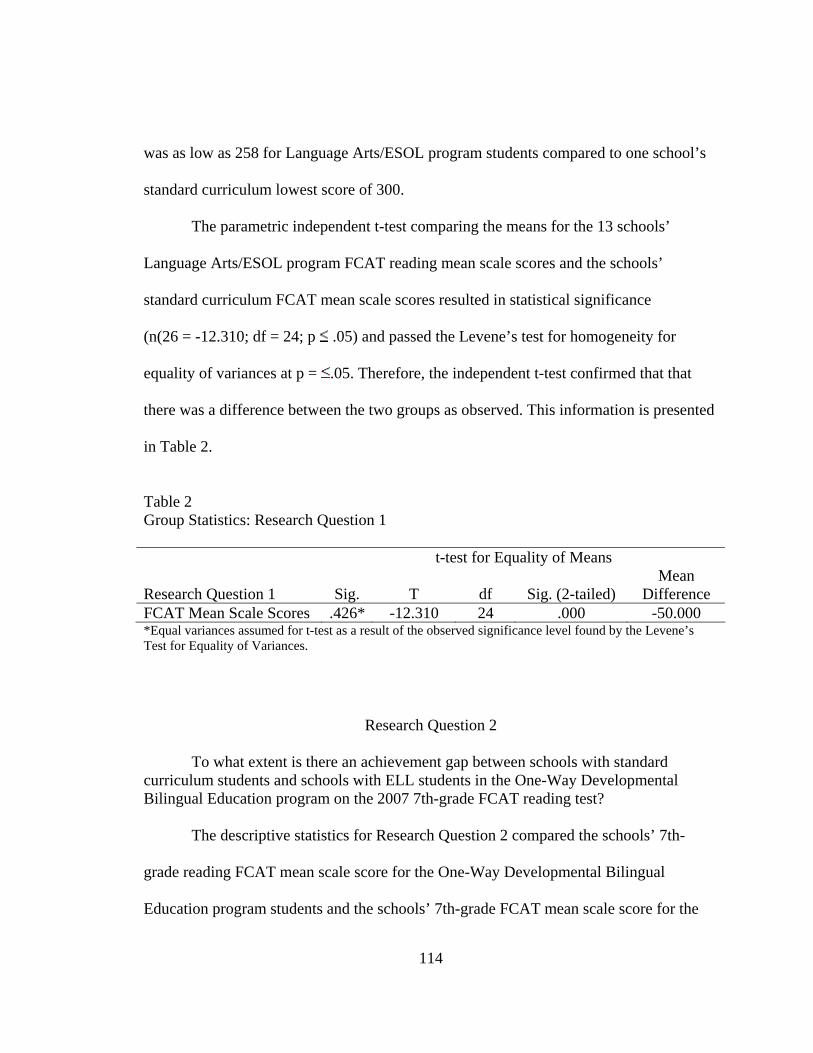
was as low as 258 for Language Arts/ESOL program students compared to one school’s
standard curriculum lowest score of 300.
The parametric independent t-test comparing the means for the 13 schools’
Language Arts/ESOL program FCAT reading mean scale scores and the schools’
standard curriculum FCAT mean scale scores resulted in statistical significance
(n(26 = -12.310; df = 24; p .05) and passed the Levene’s test for homogeneity for
equality of variances at p = .05. Therefore, the independent t-test confirmed that that
there was a difference between the two groups as observed. This information is presented
in Table 2.
Table 2 Group Statistics: Research Question 1 t-test for Equality of Means
Research Question 1 Sig. T df Sig. (2-tailed) Mean
Difference FCAT Mean Scale Scores .426* -12.310 24 .000 -50.000 *Equal variances assumed for t-test as a result of the observed significance level found by the Levene’s Test for Equality of Variances.
Research Question 2
To what extent is there an achievement gap between schools with standard curriculum students and schools with ELL students in the One-Way Developmental Bilingual Education program on the 2007 7th-grade FCAT reading test?
The descriptive statistics for Research Question 2 compared the schools’ 7th-
grade reading FCAT mean scale score for the One-Way Developmental Bilingual
Education program students and the schools’ 7th-grade FCAT mean scale score for the
114

115
standard curriculum students. The mean for the schools’ One-Way Developmental
Bilingual Education program was 261.00 compared to the schools’ standard curriculum
FCAT mean scale score of 312.30.with a difference of 51.30 between the two. These
results are displayed in Table 3.
Table 3 Analysis of Means: Research Question 2 FCAT Mean Scale Scores Mean N
Standard Deviation
Standard Error of the Mean
SLA 312.30 10 16.938 5.356 OWDB 261.00 10 13.728 4.341 Note. SLA = Standard Language Arts, OWDB = One-Way Developmental Bilingual
The median FCAT mean scale score for the schools’ One-Way Developmental
Bilingual Education program was 256.00 compared to the schools’ standard curriculum
FCAT mean scale score of 313.00 with a difference of 57 between the two. The modes
showed a FCAT mean scale score of 249.00 for the schools’ One-Way Developmental
Bilingual Education program and a FCAT mean scale score of 282.00 for the schools’
standard curriculum. Thus, the mean and the median scores for the schools’ One-Way
Developmental Bilingual Education program students were on average significantly
lower with as much as a 60.30 point difference. These results are displayed in Table 3.
The standard deviation for the schools’ One-Way Developmental Bilingual
Education program was 13.72751, and the standard deviation for the schools’ standard
curriculum was 16.93812. The variance for the schools’ One-Way Developmental
Bilingual Education program was 188.444 compared to the schools’ standard curriculum
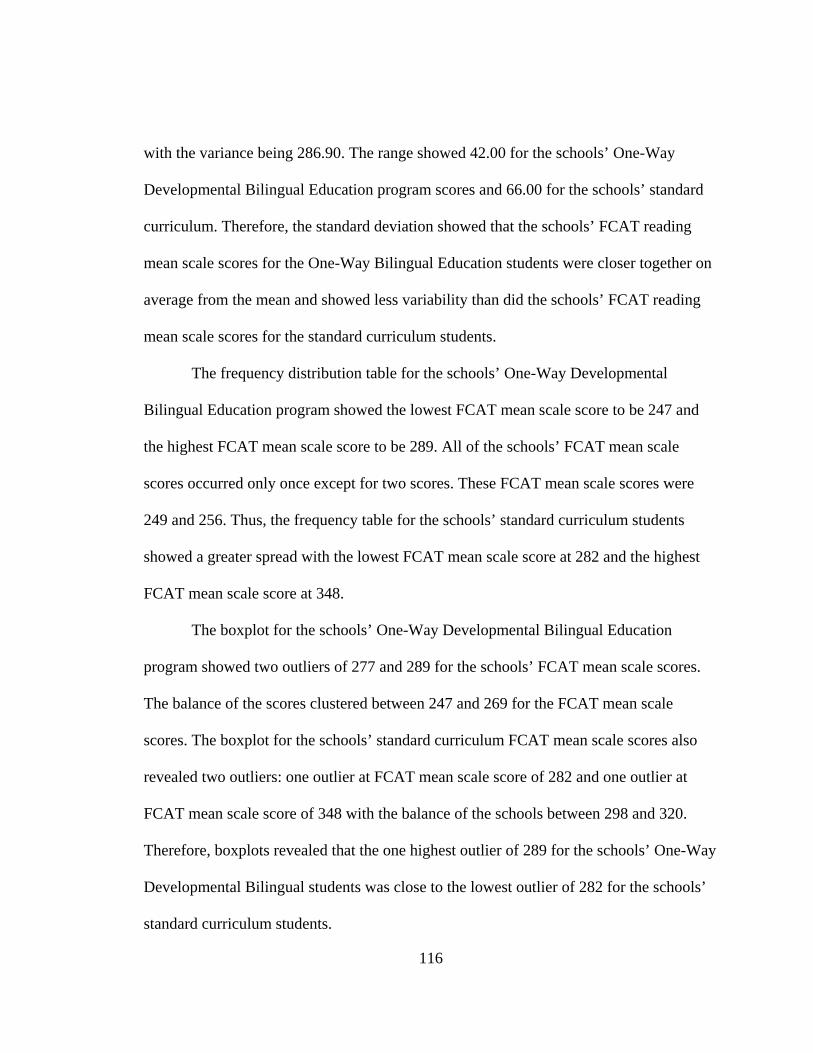
116
with the variance being 286.90. The range showed 42.00 for the schools’ One-Way
Developmental Bilingual Education program scores and 66.00 for the schools’ standard
curriculum. Therefore, the standard deviation showed that the schools’ FCAT reading
mean scale scores for the One-Way Bilingual Education students were closer together on
average from the mean and showed less variability than did the schools’ FCAT reading
mean scale scores for the standard curriculum students.
The frequency distribution table for the schools’ One-Way Developmental
Bilingual Education program showed the lowest FCAT mean scale score to be 247 and
the highest FCAT mean scale score to be 289. All of the schools’ FCAT mean scale
scores occurred only once except for two scores. These FCAT mean scale scores were
249 and 256. Thus, the frequency table for the schools’ standard curriculum students
showed a greater spread with the lowest FCAT mean scale score at 282 and the highest
FCAT mean scale score at 348.
The boxplot for the schools’ One-Way Developmental Bilingual Education
program showed two outliers of 277 and 289 for the schools’ FCAT mean scale scores.
The balance of the scores clustered between 247 and 269 for the FCAT mean scale
scores. The boxplot for the schools’ standard curriculum FCAT mean scale scores also
revealed two outliers: one outlier at FCAT mean scale score of 282 and one outlier at
FCAT mean scale score of 348 with the balance of the schools between 298 and 320.
Therefore, boxplots revealed that the one highest outlier of 289 for the schools’ One-Way
Developmental Bilingual students was close to the lowest outlier of 282 for the schools’
standard curriculum students.
The histogram for the schools’ One-Way Developmental Bilingual Education
program showed six of the schools clustered between FCAT mean scale score 247 and
256. The histogram for the schools’ standard curriculum revealed a spread of FCAT
mean scale scores from 282 to 348 with seven of the schools’ FCAT mean scale scores
between 305 and 320. Therefore, the histogram confirmed the previous statistical tests
showing significantly higher FCAT reading mean scale scores for the schools’ standard
curriculum students
The parametric independent t-test comparing the means for the 10 schools’ One-
Way Developmental Bilingual Education program FCAT reading mean scale scores and
the same 10 schools’ standard curriculum mean scale scores resulted in statistical
significance (n(10 = 7.411; df = 18; p .05) and passed Levene’s test for homogeneity
for equality of variances at p .05. Thus, the independent t-test confirmed that there was
a difference in the two groups as observed. These results are displayed in Table 4.
Table 4 Group Statistics: Research Question 2 t-test for Equality of Means
Research Question 2 Sig. T df Sig. (2-tailed) Mean
Difference FCAT Mean Scale Scores .983* 7.441 18 .000 51.300 *Equal variances assumed for t-test as a result of the observed significance level found by the Levene’s Test for Equality of Variances.
117
118
Research Question 3
What is the distribution of schools in the study with standard curriculum students and schools with ELL students as measured by the mean scale score in levels 1-5 of the 7th-grade FCAT reading test?
FCAT mean scale scores have been clustered in levels from 1 to 5 for reporting
purposes at the state level. Level 3 has been determined by the state of Florida to be on
grade level. The scores at each level have been reported in percentages dependent on the
number of English Language Learners and standard curriculum students in each school.
In response to Research Question 3, the clustered scores for the schools’ Language
Arts/ESOL program students, the schools’ One-Way Developmental Bilingual Education
program students, or the schools’ standard curriculum students were compared at each
level. First, the schools’ Laguage Arts/ESOL program and the schools’ standard
curriculum were compared at each level. Then, the schools’ One-Way Developmental
Bilingual Education Program and standard curriculum were compared at each level.
FCAT Reading Level 1: Language Arts/ESOL Program and Standard Curriculum
At FCAT reading Level 1 the descriptive statistics for the schools’ Language
Arts/ESOL program FCAT mean scale scores showed the mean at .3323 and the schools’
standard curriculum FCAT mean scale scores at .0808 for a difference of .2515. The
median score for the schools’ Language Arts/ESOL program FCAT mean scale score was
.33 and the schools’ standard curriculum FCAT mean scale score was .07 for a difference
of .260. The mode score for the schools’ Language Arts/ESOL program FCAT mean
scale score was .36, and the mode for the schools’ standard curriculum FCAT mean scale
119
score was .05. Therefore, the results of these statistics showed a far greater percentage of
schools’ Language Arts/ESOL program students scoring at FCAT reading Level 1 as
compared to the schools’ standard curriculum students.
The standard deviation for the schools’ Language Arts/ESOL program FCAT
mean scale scores was .06597, and the standard deviation for the schools’ standard
curriculum FCAT mean scale scores was .04462. The variance for the schools’ Language
Arts/ESOL program FCAT mean scale scores was .004 compared to the schools’
standard curriculum FCAT mean scale scores at .002. The range for the schools’
Language Arts/ESOL program FCAT mean scale scores was .21, and the range for the
schools’ standard curriculum FCAT mean scales scores was .17. Thus, the standard
deviation for the schools’ Language Arts/ESOL program FCAT mean scale scores
showed more variability and a greater spread of scores than did the schools’ FCAT mean
scale scores for the standard curriculum students.
The frequency table for the schools’ Language Arts/ESOL program FCAT mean
scale scores showed a distribution of scores from .24 to .45 with one score at each point
except for two schools at .36. The frequency table for the schools’ standard curriculum
FCAT mean scale scores revealed a spread of scores from .03 to .20 with one score at
each point except for two schools at .08 and four schools at .05.
The boxplot revealed, for the schools’ Language Arts/ESOL program, FCAT
mean scale scores between .45 and .24 and indicated no clustering. The spread of scores
was equal on the boxplot except for one outlier at .45. The boxplot for the schools’
standard curriculum FCAT mean scale scores were clustered between .03 and .13 except
120
for one outlier at .20. The histogram for the schools’ Language Arts/ESOL program
FCAT mean scale scores confirmed the frequency table, showing an equal spread of
scores from .24 to .45 with two schools at .36. The histogram for the schools’ standard
curriculum FCAT mean scale scores confirmed the frequency table showing four schools
at .05 and two schools at .08 with a spread of scores from .03 to .20. Therefore, the
schools’ FCAT reading mean scale scores for the standard curriculum students showed
schools all reporting low percentages of Level 1 scores, none higher than .20. In
comparing the schools’ Language Arts/ESOL program scores for all 13 schools, FCAT
mean scale scores were reported significantly higher, ranging between .24 and .45.
FCAT Reading Level 1: One-Way Developmental Bilingual Education Program and Standard Curriculum Continuing with percentages of FCAT reading Level 1, the schools’ One-Way
Developmental Bilingual Education program FCAT mean scale score was .505, and the
FCAT mean scale score for the schools’ standard curriculum was .160 with a difference
of .345. The median score for the schools’ One-Way Developmental Bilingual Education
program FCAT mean scale scores was .5550, and the median FCAT mean scale score for
the schools’ standard curriculum was .130. This showed a difference of .425. The mode
FCAT mean scale score for the schools’ One-Way Developmental Bilingual Education
program FCAT mean scale scores was .56, and the mode FCAT mean scale score for the
schools’ standard curriculum was .13. Thus, the mean for the schools’ FCAT mean scale
121
scores for the One-Way Developmental students at.505 was greater than the schools’
standard curriculum students.
The standard deviation for the schools’ One-Way Developmental Bilingual
Education program FCAT mean scale scores was .10763, and the standard deviation for
the schools’ standard curriculum FCAT mean scale scores was .8124. The variance for
the schools’ One-Way Developmental Bilingual Education program mean scale scores
was .012, and the variance for the schools’ One-Way Developmental Bilingual Education
program mean scale scores was .007. The range for the schools’ One-Way
Developmental Bilingual Education program mean scale scores was .32, and the range
for the schools’ standard curriculum mean scale scores was .29. Thus, the standard
deviation for the schools’ FCAT reading mean scale scores for the One-Way
Developmental Bilingual Education students showed greater variability. On average,
scores were spread farther from the mean than the schools’ FCAT reading mean scale
scores for the standard curriculum students.
The frequency table for the schools’ One-Way Developmental Bilingual
Education program mean scale scores showed a spread of scores from .31 to .63 with
three schools at .56. The frequency table for the schools’ standard curriculum FCAT
mean scale scores showed a distribution of scores from .03 to .32 with one score at each
point and three schools at .13.
The boxplot for the schools’ One-Way Developmental Bilingual Education
program showed FCAT mean scale scores clustered between .45 and .63 with two
outliers at .31 and .34. The boxplot for the schools’ standard curriculum FCAT mean
122
scale scores showed the mean scale scores clustered between .11 and .25 with two
outliers at .03 and .32. Thus, the highest outlier for the schools’ standard curriculum
students at .32 was close to the lowest outlier for the schools’ One-Way Developmental
Bilingual Education program students at .31. This showed a significantly greater
percentage of schools in FCAT Level 1 for the One-Way Developmental Bilingual
Education program students than for the standard curriculum students.
The histogram for the schools’ One-Way Developmental Bilingual Education
program FCAT mean scale scores confirmed the frequency distribution showing a spike
in the scores with three schools at .56. The balance of the schools’ One-Way
Developmental Bilingual Education program FCAT mean scale scores were between .31
and .63. The histogram for the schools’ standard curriculum showed an equal distribution
of scores with a spike at .13. The histogram for the schools’ FCAT reading mean scale
scores for the One-Way Developmental Bilingual Education program confirmed the
boxplot. This showed a greater spread of scores with one school as high as .63 compared
to the schools’ FCAT reading mean scale scores for the standard curriculum students.
FCAT Reading Level 2: Language Arts/ESOL Program and Standard Curriculum
The descriptive statistics for FCAT reading Level 2 for the schools’ Language
Arts/ESOL program FCAT mean scale scores showed the mean at .3215 and the schools’
standard curriculum FCAT scale score mean at .2315 with a difference of .09. The
median scale score for the schools’ Language Arts/ESOL program FCAT mean scale
scores was .3200, and the median score for the schools’ standard curriculum FCAT mean

123
scale scores was .1800 with a difference of .014. The mode for the schools’ Language
Arts/ESOL program was .28 compared to the schools’ standard curriculum at .14. Thus,
the Level 2 mean scores for the schools began to close the achievement gap with only a
.09 difference for the schools.
The standard deviation for the schools’ Language Arts/ESOL program FCAT
mean scale scores was .09864, and the standard deviation for the schools’ standard
curriculum FCAT mean scale scores was .15027. The variance for the schools’ Language
Arts/ESOL program was .010, and the variance for the schools’ standard curriculum was
.010. The range in the schools’ Language Arts/ESOL program FCAT mean scale scores
was .34, and the range in the schools’ standard curriculum FCAT mean scale scores was
.023. Therefore, the standard deviation for the schools’ standard curriculum students
showed a greater variability of scores at FCAT reading Level 2 than did that of the
schools’ standard curriculum students.
The frequency table for the schools’ Language Arts/ESOL program FCAT mean
scale scores showed a spread of scores from .16 to .50. Only one school was reported at
.16, .22, .24, and .32. Three schools were reported at .28. Two schools were reported at
each point for .33, .37, and .50. The frequency table for the schools’ standard curriculum
FCAT mean scale scores showed a greater distribution of scores between .14 and .70.
Scores were reported evenly at each point except for three schools at .14 and two schools
at .26.
The boxplot for the schools’ Language Arts/ESOL program FCAT mean scale
scores showed three outliers. Two outliers were at .50 and one outlier was at .16. The
124
balance of the scores were between .22 and .37. The boxplot for the schools’ standard
curriculum showed one outlier at .70 with the balance of the schools between .14 and .30.
The histogram for the schools’ Language Arts/ESOL program FCAT mean scale scores
confirmed the frequency table showing a distribution of scores from .16 to .50 with three
schools spiking at .28. The histogram for the schools’ standard curriculum FCAT mean
scale scores revealed three schools at .14, and two schools at .26 with the balance of the
schools between .14 and .70. Therefore, the schools’ Language Art/ESOL program
students were significantly lower than the schools’ standard curriculum students with one
school’s standard curriculum students scoring as high as .70 at Level 2.
FCAT Reading Level 2: One-Way Developmental Bilingual Education Program and Standard Curriculum The descriptive statistics for the schools’ One-Way Developmental Bilingual
Education program FCAT mean scale scores showed a mean of .231 compared to that of
the schools’ standard curriculum at .225, a difference of .006. The median score for the
schools’ One-Way Developmental Bilingual Education program FCAT mean scale scores
was .250, and the median score for the schools’ standard curriculum FCAT mean scale
scores was .225, showing a difference of .025. The mode score for the schools’ One-Way
Developmental Bilingual Education program FCAT mean scale scores was .26, and the
mode score for the schools’ standard curriculum FCAT mean scale scores was .22.
Therefore, the FCAT mean scale scores for the schools’ standard curriculum students and
125
the One-Way Developmental Bilingual Education program students were closer together
at FCAT reading Level 2 than at FCAT reading Level 1.
The standard deviation for the schools’ One-Way Developmental Bilingual
Education program FCAT mean scale scores was .03957, and the standard deviation for
the schools’ standard curriculum FACT mean scale scores was .06770. The variance for
the schools’ One-Way Developmental Bilingual Education program FCAT mean scale
scores was .002, and the variance for the schools’ standard curriculum was .005. The
range for the schools’ One-Way Developmental Bilingual Education program FCAT
mean scale scores was .11, and the range for the schools’ standard curriculum FCAT
mean scale scores was .25. Thus, the standard deviation for the schools was greater for
the standard curriculum and showed more variability than did the scores of the One-Way
Developmental Bilingual Education program.
The frequency table for the schools’ One-Way Developmental Bilingual
Education program FCAT mean scale scores revealed a spread of scores from .16 to .27
with one school at each point except for two schools at .25 and three schools at .26. The
frequency table for the schools’ standard curriculum FCAT mean scale scores had an
equal distribution of scores between .09 and .34 with two schools at .22. The histogram
confirmed the frequency tables, showing a greater spread of scores for the schools’
standard curriculum students.
The boxplot for the schools’ One-Way Developmental Bilingual Education
program FCAT mean scale scores revealed four outliers between .16 and .22. The
balance of the scores clustered between .25 and .27. The boxplot for the schools’ standard
126
curriculum FCAT mean scale scores showed one outlier at .09 and one outlier at .34 with
the balance of the scores clustering between .16 and .28. Therefore, nine of the schools’
One-Way Developmental Bilingual Education program scores fell within the same range,
between .16 and .26, as did those of eight of the schools’ standard curriculum students.
FCAT Reading Level 3: Language Arts/ESOL Program and Standard Curriculum
The descriptive statistics for FCAT reading Level 3 for the schools’ Language
Arts/ESOL program FCAT mean scale scores showed a mean scale score at .2900, and
the schools’ standard curriculum FCAT mean scale score mean at .4023 with a difference
of .1123. The median for the schools’ Language Arts/ESOL program FCAT mean scale
scores was .3000, and the median for the schools’ standard curriculum FCAT mean scale
scores was .4000, with a difference of .1000. The mode score for the schools’ Language
Arts/ESOL program FCAT mean scale scores was .31, and the mode score for the
schools’ standard curriculum FCAT mean scale scores was .38. This indicated that the
means for the schools’ standard curriculum students on average were significantly higher
at .4023 than that of the schools’ Language Arts/ESOL program students at .29.
The standard deviation for the schools’ Language Arts/ESOL program FCAT
mean scale score was .10512, and the standard deviation for the schools’ standard
curriculum was .03004. The variance for the schools’ Language Arts/ESOL program
FCAT mean scale scores was .011. The variance for the schools’ standard curriculum
mean scale scores was .001. The range for the schools’ Language Arts/ESOL program
FCAT mean scale scores was .40, and the range for the schools’ standard curriculum
127
FCAT mean scale scores was .10. Thus, the standard deviation for the schools’ Language
Arts/ESOL program students had a greater variability of scores than the schools’ standard
curriculum students.
The frequency distribution table for the schools’ Language Arts/ESOL program
FCAT mean scale scores showed a wide spread of scores from .10 to .50 with one school
at each point except for two schools at .31. The frequency table for the schools’ standard
curriculum FCAT mean scale scores showed a closer spread of scores between .36 and
.46 with three schools at .38, two schools at .41, and two schools at .42.
The boxplot for the schools’ Language Arts/ESOL program FCAT Mean scale
scores showed three outliers at .10, .17, and .50. The remaining scores were between .21
and .41. The boxplot for the schools’ standard curriculum FCAT mean scale scores
showed a tighter clustering of scores between .37 and .46. The histogram confirmed the
frequency table for the schools’ Language Arts/ESOL program FCAT mean scale scores
showed an equal spread of scores between .10 and .50 except for the two schools at .31.
The histogram for the schools’ standard curriculum FCAT mean scale scores showed a
closer clustering of scores between .36 and .46 with a spike for three schools at .38. The
results of both statistical tests showed a greater spread of scores for the schools’
Language Arts/ESOL program students from .10 to .50 . One school school’s Language
Arts/ESOL program students scored at a higher at .50 of Level 3 students than other
schools’ standard curriculum students. The highest mean scale score in the standard
curriculum group was .46.
128
FCAT Reading Level 3: One-Way Bilingual Education Program and Standard Curriculum
The mean scale score for the schools’ One-Way Developmental Bilingual
Education program FCAT mean scale scores was .2250, and the mean scale score for the
schools’ standard curriculum FCAT mean scale scores was .3740 with a difference of
.1490 between the two. The median scale score for the schools’ One-Way Developmental
Bilingual Education program FCAT mean scale scores was .2200, and the median scale
score for the schools’ standard curriculum FCAT mean scale scores was .3750 . The
mode for the schools’ One-Way Developmental Bilingual Education program FCAT
mean scale scores was .18, and the mode for the schools’ standard curriculum FCAT
mean scale scores was .36. Thus, the schools’ standard curriculum FCAT mean scale
scores for Level 3 students were greater than were those for the One-Way Developmental
Bilingual Education program students.
The standard deviation for the schools’ One-Way Developmental Bilingual
Education program FCAT mean scale scores was .04950, and the standard deviation for
the schools’ standard curriculum FCAT mean scale scores was .05190. The variance for
the schools’ One-Way Developmental Bilingual Education program FCAT mean scale
scores was .002, and the variance for the schools’ standard curriculum FCAT mean scale
scores was .003. The range for the schools’ One-Way Developmental Bilingual
Education program FCAT mean scale scores was .15. The range for the schools’ standard
curriculum FCAT mean scale scores was .20. Therefore, the schools’ standard curriculum

129
students, on average, had a greater variability of scores to the mean than did the schools’
One-Way Developmental Bilingual Education program students.
The frequency table for the schools’ One-Way Developmental Bilingual
Education program FCAT mean scale scores revealed a spread of scores from .16 to .31
with two schools at .18 and .22. The frequency table for the schools’ standard curriculum
FCAT mean scale scores revealed a higher spread of scores between .25 and .45. Three
points were reported with two schools. The three points were .36, .37, and .39.
The boxplot for the schools’ One-Way Developmental Bilingual Education
program FCAT mean scale scores showed a fair clustering of scores between .18 and .28
with two outliers at .16 and .31. The boxplot for the schools’ standard curriculum FCAT
mean scale scores revealed a tight clustering of scores between .36 and .39 with three
outliers at .25, .42, and .45. The boxplot for the schools’ One-Way Developmental
Bilingual Education program students showed seven schools with percentages lower
between .16 and .24 compared to the lowest schools’ standard curriculum percentage at
Level 3 at .25.
The histogram for the schools’ One-Way Developmental Bilingual Education
program FCAT mean scale scores supported the frequency table showing a spread of
scores from .16 to .31 with two schools spiking at the two points. The points were .18 and
.22. The histogram for the schools’ standard curriculum FCAT mean scale scores showed
a higher distribution of scores between .25 and .45.
130
FCAT Reading Level 4: Language Arts/ESOL Program and Standard Curriculum The descriptive statistics for FCAT reading Level 4 revealed a mean score of
.0500 for the schools’ Language Arts/ESOL program FCAT mean scale scores and a
mean score of .2446 for the schools’ standard curriculum FCAT mean scale scores for a
difference of .1946. The schools’ Language Arts/ESOL program FCAT mean scale score
median score was .0600, and the schools’ standard curriculum FCAT mean scale score
median was .2700 with a difference of .2100. The mode score for the schools’ Language
Arts/ESOL program FCAT mean scale scores was .0200, and the mode score for the
schools’ standard curriculum FCAT mean scale scores was .2700. The mode score for the
schools’ Language Arts/ESOL program FCAT mean scale scores was the lowest score.
Thus, the mean for the schools’ standard curriculum students was significantly higher at
.2446 than was the mean for the schools’ Language Arts/ESOL program students at .05.
The standard deviation for the schools’ Language Arts/ESOL program FCAT
mean scale scores was .03291, and the standard deviation for the schools’ standard
curriculum FCAT mean scale scores was .05607. The variance for the schools’ Language
Arts/ESOL program FCAT mean scale scores was .001 compared to the variance for the
schools’ standard curriculum FCAT mean scale scores at .003. The range for the schools’
Language Arts/ESOL program FCAT mean scale scores was .09, and the range for the
schools’ standard curriculum FCAT mean scale scores was .21. Therefore, the standard
deviation for the schools’ standard curriculum students, on average, had a greater
variability of scores from the mean than did the standard deviation for the Language
Arts/ESOL program students.
131
The frequency table for the schools’ Language Arts/ESOL program FCAT mean
scale scores revealed a fairly tight distribution of scores between .00 and .09. Two
schools were reported at each point at.00, .06, .07 and three schools at .each point at 02,
and .08,. The frequency table for the schools’ standard curriculum FCAT mean scale
scores showed a greater distribution of scores between .11 and .32 with two schools at .18
and five schools at .27.
The boxplot for the schools’ Language Arts/ESOL program FCAT mean scale
scores revealed a clustering of scores between .09 and .06 with five outliers between .02
and .00. The boxplot for the schools’ standard curriculum FCAT mean scale scores
showed a clustering of scores between .24 and .32 with three outliers. The outliers
were.18 and .11. The histogram for the schools’ Language Arts/ESOL program FCAT
mean scale scores showed a tight distribution of scores between .00 and .09 with three
schools at .02 and .08. The histogram for the schools’ standard curriculum FCAT mean
scale scores showed a greater spread of scores between .11 and .32 with five schools
spiking at .27. The results of both the boxplot and the histogram showed all 10 schools
for the Language Arts/ESOL program at FCAT reading Level 4 at .09 or lower.
However, there was a spike with five schools at .27 for the students in the standard
curriculum.

132
FCAT Reading Level 4: One-Way Developmental Bilingual Education Program and Standard Curriculum The schools’ One-Way Developmental Bilingual Education program FCAT mean
scale score mean was .0590, and the schools’ standard curriculum FCAT mean scale
score mean was .1790 revealing a difference of .1200. The median scale score for the
schools’ One-Way Developmental Bilingual Education program FCAT mean scale scores
was .0300 compared to the schools’ standard curriculum FCAT median scale score at
.1900 for a difference of .1600. The mode for the schools’ One-Way Developmental
Bilingual Education program FCAT mean scale score was .01 with more than one mode
and the smallest reported. The mode for the schools’ standard curriculum FCAT mean
scale scores was .08..Thus, the mean of the scores for the schools’ standard curriculum
students at .1790 was significantly higher than the mean for the schools’ One-Way
Developmental Bilingual Education program students at .059.
The standard deviation for the schools’ One-Way Developmental Bilingual
Education program FCAT mean scale scores was .07415 compared to the schools’
standard curriculum FCAT mean scale scores which was .07852. The variance for the
schools’ One-Way Developmental Bilingual Education FCAT mean scale scores was
.005, and the variance for the schools’ standard curriculum FCAT mean scale scores was
.006. The range for the schools’ One-Way Developmental Bilingual Education program
FCAT mean scale scores was .23, and the range for the schools’ standard curriculum
FCAT mean scale scores was .24. Therefore, the standard deviation for the schools’ One-
Way Developmental Bilingual Education program students and the schools’ standard
133
curriculum students were close in variability at Level 4 despite the higher mean for the
schools’ standard curriculum students.
The frequency table for the schools’ One-Way Developmental Bilingual
Education program FCAT mean scale scores showed a distribution of scores between .00
and .23 with two schools at .01 and .03. The frequency table for the schools’ standard
curriculum FCAT mean scale scores showed a greater distribution of scores between .08
and .32 with one school at each point except .08 where two schools were positioned.
The boxplot for the schools’ One-Way Developmental Bilingual Education
program FCAT mean scale scores showed a tight clustering of scores between .00 and .07
with two outliers at .15 and .23. The boxplot for the schools’ standard curriculum FCAT
mean scale scores showed a clustering of scores between .16 and .24 with three outliers at
.08, .09, and .32. The histogram for the schools’ One-Way Developmental Bilingual
Education program FCAT mean scale scores confirmed the frequency table with schools
between .00 and .23 and two schools at .01 and .03. The frequency table for the schools’
standard curriculum FCAT mean scale scores revealed two schools at .08 and the balance
of the schools equally distributed from .09 to .32. The results of both the boxplot and the
histogram showed two of the schools’ One-Way Developmental Bilingual Education
program students at .15 and .23 which were within the range of the schools’ standard
curriculum students at FCAT reading Level 4.
134
FCAT Reading Level 5: Language Arts/ESOL Program and Standard Curriculum The descriptive statistics for FCAT reading Level 5 mean was .0038 for the
schools’ Language Arts/ESOL program and .0908 for the schools’ standard curriculum
for a difference of .087. The median for the schools’ Language Arts/ESOL program
FCAT mean scale scores was .000, and the median for the schools’ standard curriculum
FCAT mean scale scores was .090 . The mode for the schools’ Language Arts/ESOL
program FCAT mean scale scores was .00, and the mode for the schools’ standard
curriculum FCAT mean scale scores was .06. Therefore, since all of the percentages for
the schools’ standard curriculum students were above 0.00, the mean for the standard
curriculum students was higher at .0908 compared to .0038 for the schools’ Language
Arts/ESOL program students at FCAT reading Level 5.
The standard deviation for the schools’ Language Arts/ESOL program FCAT
mean scale scores was .01121, and the standard deviation for the schools’ standard
curriculum FCAT mean scale scores was .03774. The variance for the schools’ Language
Arts/ESOL program FCAT mean scale scores was .000, and the variance for the schools’
standard curriculum FCAT mean scale scores was .001. The range for the schools’
Language Arts/ESOL program FCAT mean scale scores was .04, and the range for the
schools’ standard curriculum FCAT mean scale scores was .14. Thus, the schools’
standard curriculum student scores had a greater variability on average from the mean
than did those of the schools’ Language Arts/ESOL program students.
The frequency table for the schools’ Language Arts/ESOL program FCAT mean
scale scores revealed a small grouping of schools between .00 and .04 with five of the

135
schools reporting students at Level 5. The frequency table for the schools’ standard
curriculum showed a distribution of scores from .02 to .16. Three schools were reported
at .06, two schools were reported at each point at .08, .09, and .12.
The boxplot for the schools’ Language Arts/ESOL program FCAT mean scale
scores showed 11 schools at .00 and one school at .01 with one outlier at .04. The boxplot
for the schools’ standard curriculum FCAT mean scale scores revealed a clustering of
scores between .06 and .12 with three outliers at .02, .14, and .16. The histogram for the
schools’ Language Arts/ESOL program FCAT mean scale scores showed 11 schools at
.00, and one school at .01, and one school at .04. The histogram for the schools’ standard
curriculum FCAT mean scale scores showed schools between .02 and .16. There was a
spike at .06 with three schools. Thus, the one outlier at .04 for the schools’ Language
Arts/ESOL program was higher than one of the schools’ standard curriculum at .02 for
FCAT reading.
Level 5: One-Way Developmental Bilingual Education Program and Standard Curriculum The mean for the schools’ One-Way Developmental Bilingual Education program
FCAT mean scale scores was .004, and the mean for the schools’ standard curriculum
FCAT mean scale scores was .090 for a difference of .086. The median for the schools’
One-Way Developmental Bilingual Education program FCAT mean scale scores was
.000, and the median for the schools’ standard curriculum FCAT mean scale scores was
.0550 for a difference of .0550. The mode for the schools’ One-Way Developmental
136
Bilingual Education program FCAT mean scale scores was .000, and the mode for the
schools’ standard curriculum FCAT mean scale scores was .05. Thus, the mean for the
schools’ standard curriculum students was significantly higher at .090 than the mean of
.004 for the schools’ One-Way Developmental Bilingual Education program students.
The standard deviation for the schools’ One-Way Developmental Bilingual
Education program FCAT mean scale scores was .00516, and the standard deviation for
the schools’ standard curriculum FCAT mean scale scores was .08781. The variance for
the schools’ One-Way Developmental Bilingual Education program FCAT mean scale
scores was .000, and the variance for the schools’ standard curriculum FCAT mean scale
scores was .008. The range for the schools’ One-Way Developmental Bilingual
Education program FCAT mean scale scores was .010, and the range for the schools’
standard curriculum FCAT mean scale scores was .28. Therefore, the standard deviation
for the schools’ One-Way Developmental Bilingual Education program students was
significantly lower than that derived for the standard curriculum students.
The frequency table for the schools’ One-Way Developmental Bilingual
Education program FCAT mean scale scores showed six schools at .000 and four schools
at .01. The frequency table for the schools’ standard curriculum FCAT mean scale scores
revealed a spread of scores from .02 to .30 with two schools at .05 and .08.
The boxplot for the schools’ One-Way Developmental Bilingual Education
program FCAT mean scale scores showed the majority of schools at .000 with six
schools and four schools at .01. The boxplot for the schools’ standard curriculum FCAT
mean scale scores revealed 11 of the schools between .02 and .08. There were two

137
outliers at .19 and .30. The histogram for the schools’ One-Way Developmental Bilingual
Education program FCAT mean scale scores showed the majority of schools at .00 and
four schools at .01. The histogram for the schools’ standard curriculum FCAT mean scale
scores showed a greater distribution of scores. Scores were evenly spread from .02 to .30
with two schools at .05 and .08. Therefore, both the boxplot and the histogram confirmed
that all of the 10 schools’ standard curriculum students were .02 or above with one school
at .30. Therefore, there were significantly high scores for the standard curriculum
compared to all of the schools’ One-Way Developmental Bilingual Education program
students at .01 or 0.0.
Research Question 4
To what extent is there an achievement gap between all schools with standard curriculum students and schools with ELL students in the Language Arts/ESOL program scoring Level 3 or higher on the 2007 7th-grade FCAT reading test?
The descriptive statistics for Question 4 showed a mean score of .3462 for the
schools’ Language Arts/ESOL program students scoring Level 3 or higher and .7331 for
the schools’ standard curriculum students scoring Level 3 or higher for a difference of
.3869. The median for the schools’ Language Arts/ESOL program students scoring Level
3 or higher was .3600 compared to .7600 for the schools’ standard curriculum students
scoring Level 3 or higher with a difference of .04. The mode for the schools’ Language
Arts/ESOL program students scoring Level 3 or higher was .36, and the mode for the
schools’ standard curriculum students scoring Level 3 or higher was .76. Thus, the mean
138
was significantly higher for the schools’ standard curriculum students than for the
schools’ Language Arts/ESOL program students.
The standard deviation for the schools’ Language Arts/ESOL program students
scoring Level 3 or higher was .11155 compared to the schools’ standard curriculum
students scoring Level 3 or higher at .10283. The variance for the schools’ Language
Arts/ESOL program students scoring Level 3 or higher was .012, and the variance for the
schools’ standard curriculum students scoring Level 3 or higher was .011. The range for
the schools’ Language Arts/ESOL program students scoring Level 3 or higher was .46
compared to the schools’ standard curriculum students scoring Level 3 or higher at .41.
Therefore, the schools’ standard curriculum students were closer to the mean on average
than the schools’ Language Arts/ESOL program students.
The frequency table for the schools’ Language Arts/ESOL program students
scoring Level 3 or higher revealed a spread of scores between .10 and .56 with two
schools reported at .33 and four schools reported at .36. The frequency table for the
schools’ standard curriculum students scoring Level 3 or higher showed schools between
.50 and .91 with three schools reported at .76.
The boxplot for the schools’ Language Arts/ESOL program students scoring
Level 3 or higher showed a cluster of scores between .33 and .46 with one outlier each at
.10, .23, .25 and .56. The boxplot for the schools’ standard curriculum students scoring
Level 3 or higher revealed a tight cluster of schools between .71 and .82 with three low
outliers at .50, .62, and .63, and one high outlier at .91. The histogram for the schools’
Language Arts/ESOL program students scoring Level 3 or higher showed a cluster of

139
schools between .33 and .39. The histogram for the schools’ standard curriculum students
scoring Level 3 or higher showed a tight cluster of scores between .71 and .82. Therefore,
the histogram and boxplot showed that the schools’ standard curriculum students scored
significantly higher at Level 3 or above with 9 of the schools scoring within 5.5 plus or
minus percentage points of 76.5% compared to the schools’ Language Arts/ESOL
program students with percentages at Level 3 or higher no greater than .56.
Research Question 5
To what extent is there an achievement gap between schools with standard curriculum students and schools with ELL students in the One-Way Developmental Bilingual Education program scoring Level 3 or higher on the 2007 7th-grade FCAT reading test?
The descriptive statistics for Question 5 for the schools’ One-Way Developmental
Bilingual Education students scoring Level 3 or higher FCAT mean scale scores revealed
a mean of .266 and a mean of .614 for the schools’ FCAT mean scale scores for the
standard curriculum students scoring Level 3 or higher for a difference of .348. The
median for the schools’ One-Way Developmental Bilingual Education students scoring
Level 3 or higher FCAT mean scale scores revealed a median of .240, and the schools’
standard curriculum students scoring Level 3 or higher FCAT mean scale scores had a
median of .640 for a difference of .40. The mode for the schools’ One-Way
Developmental Bilingual Education program students scoring Level 3 or higher FCAT
mean scale scores was .19 compared to the schools’ standard curriculum students scoring
Level 3 or higher with a mode of .64. Thus, the mean for the schools’ standard
140
curriculum students at .614 indicated a greater percentage at Level 3 or higher than the
schools’ One-Way Developmental Bilingual Education program students at .266.
The standard deviation for the schools’ One-Way Developmental Bilingual
Education program students scoring Level 3 or higher FCAT mean scale scores was
.08720, and the schools’ standard curriculum students scoring Level 3 or higher FCAT
mean scale score was .13591. The variance for the schools’ One-Way Developmental
Bilingual Education program students scoring Level 3 or higher was .008, and the
variance for the schools’ standard curriculum students scoring Level 3 or higher was
.018. The range for the schools’ One-Way Developmental Bilingual Education program
students scoring Level 3 or higher was .25 compared to the schools’ standard curriculum
students scoring Level 3 or higher at .52. Therefore, the standard deviation for the
schools’ One-Way Developmental Bilingual Education program students were, on
average, closer to the mean than the schools’ standard curriculum students.
The frequency table revealed for the schools’ One-Way Developmental Bilingual
Education program students scoring Level 3 or higher scores between .19 and .44 with all
schools scoring at each point except for three schools at .19. The frequency table for the
schools’ standard curriculum students scoring Level 3 or higher revealed scores between
.35 and .87 with one school at each point except .64 with two schools.
The boxplot for the schools’ One-Way Developmental Bilingual Education
program students scoring Level 3 or higher showed schools clustered between .19 and .29
and revealed two outliers at .39 and .44. The boxplot for the schools’ standard curriculum
students scoring Level 3 or higher showed schools clustered between .49 and .68 with
141
two outliers at .35 and .87. The histogram for the schools’ One-Way Developmental
Bilingual Education program students scoring Level 3 or higher showed seven of the
schools clustered between FCAT mean scale scores of .21 and .44 with a spike in schools
at .19. The histogram for the schools’ standard curriculum students who scored Level 3 or
higher revealed a spread of FCAT mean scale scores with seven of the schools’ FCAT
mean scale scores between .35 and .87 with a spike of two schools at .64. Thus, the
boxplot and histogram for the schools’ standard curriculum students showed one
significantly high outlier at .87 and one significantly low outlier at .35 compared to the
highest the school’s One-Way Developmental Bilingual Education program students at
.44.
142
CHAPTER 5 SUMMARY, CONCLUSIONS, AND RECOMMENDATIONS
The purpose of the study was to compare two English Language Learner (ELL)
second language programs, the Language Arts/ESOL program and the One-Way
Developmental Bilingual Education program. These programs were designed to assist
ELL students acquire English as a second language. The 2007 FCAT reading mean scale
scores for 7th graders for the schools who implemented these programs for their ELL
students were compared against the standard curriculum students 2007 FCAT reading
mean scale scores in the same schools. Data were collected from eMetric.net, a San
Antonio web-based state-approved reporting vendor.
Summary and Discussion of Findings
The present study added to the body of research on the academic achievement of
two groups of students. Based on 2007 FCAT reading scores, it was found that there was
a statistical difference between the achievement of ELL students in second language
programs when compared to that of standard curriculum students.
Five research questions formed the basis for this study. A summary and
discussion of the findings for each question are presented in this chapter, also, included
are implications for practice and recommendations for future research.
143
Research Question 1
To what extent is there an achievement gap between schools with standard curriculum students and schools with ELL students in the Language Arts/ESOL program on the 2007 7th-grade FCAT reading test?
A comparison between the 13 schools’ Language Arts/ESOL program students
2007 FCAT reading mean scale scores for 7th-grade and the schools’ standard curriculum
students’ 2007 FCAT reading mean scale scores for 7th-grade were examined and were
found to have a statistically significant difference using an independent t-test.
The mean descriptive test proved a wide margin of difference for the schools that
participated in these curriculum programs with a 50 point difference for the FCAT mean
scale score between the Language Arts/ESOL program students and the standard
curriculum students, with the standard curriculum students scoring higher. The frequency
table and the boxplot showed the greatest margins of difference with as much as an 88
point difference among the 13 schools in the study when comparing the highest scoring
school’s standard curriculum students and the lowest scoring school’s Language
Arts/ESOL program students.
These comparisons suggested that the ELL students enrolled in the Language
Arts/ESOL program scored significantly lower than did the standard curriculum students
on the 2007 FCAT reading test for seventh graders. Thus, the present study supported the
research that English achievement tests were a measure of English proficiency and “not
necessarily a measure of content knowledge” (Menken, 2000, p. 5).
144
Research Question 2
To what extent is there an achievement gap between schools with standard curriculum students and schools with ELL students in the One-Way Developmental Bilingual Education program on the 2007 7th-grade FCAT reading test?
The comparison between the 10 schools’ 7th-grade 2007 FCAT reading mean
scale scores for the One-Way Developmental Bilingual Education program students and
the schools’ 7th-grade 2007 FCAT reading mean scale scores for the standard curriculum
students were analyzed. The comparison between the schools’ FCAT mean scale scores
proved statistically significant using an independent t-test.
The descriptive test of the mean showed a difference of 51.3 between the schools’
One-Way Developmental Bilingual Education students and the standard curriculum
students, with the standard curriculum students scoring higher. The frequency distribution
table and the boxplot showed an even greater difference of 101 points on the schools’
FCAT mean scale scores for the two groups when comparing the highest scoring school’s
standard curriculum students and the lowest scoring school’s One-Way Developmental
Bilingual Education program students.
These differences suggested that the ELL students enrolled in the One-Way
Developmental Bilingual Education program scored significantly lower than did the
standard curriculum students. The findings in the present study supported the work of
Collier and Thomas (1989) and Collier (1987) who reported that acquisition of a second
language does not occur quickly but occurs over time as concepts become more abstract.
145
Research Question 3
What is the distribution of schools in the study with standard curriculum students and schools with ELL students as measured by the mean scale score in levels 1-5 of the 7th-grade FCAT reading test?
This research question was analyzed using descriptive statistics for each of the 5
reporting levels for the 7th-grade 2007 FCAT reading test. Clustered scores were
reported in percentages at each FCAT reading level. Research Question 3 was used to
examine two groups of scores for each reporting level at a time. The percentages for the
schools’ Language Arts/ESOL program students and the schools’ standard curriculum
students at each level were analyzed. In addition, the schools’ percentages for the One-
Way Developmental Bilingual Education program students and the schools’ standard
curriculum students at each FCAT level were analyzed.
FCAT Reading Level 1 For FCAT reading Level 1, the mean descriptive statistic was used to compare the
schools’ Language Arts/ESOL program students and the schools’ standard curriculum
students. This resulted in a greater percentage of ELL students scoring at Level 1. The
frequency table and the boxplot showed a lower percentage of the schools’ standard
curriculum students at Level 1 and a greater percentage of the schools’ Language
Arts/ESOL program students at Level 1.
The mean descriptive statistic compared the schools’ One-Way Developmental
Bilingual Education program students and the schools’ standard curriculum students.
This resulted in a greater percentage of the One-Way Developmental Bilingual Education

146
program students scoring at Level 1. The frequency table and boxplot confirmed the
descriptive statistics and showed a lower percentage of the schools’ standard curriculum
students at Level 1 and a greater percentage of the schools’ One-Way Developmental
Bilingual Education Program students at Level 1.
The mean for the schools’ Language Arts/ESOL program students at .3323
compared to the mean for the schools’ One-Way Developmental Bilingual Education
program students at .5050 showed more students in the One-Way Developmental
Bilingual Education program scoring at Level 1. Both ELL programs for the schools had
greater means at FCAT Level 1 than did the schools’ standard curriculum students.
FCAT Reading Level 2 For FCAT reading Level 2, the mean descriptive statistic was compared for the
schools’ Language Arts/ESOL program students and the schools’ standard curriculum
students. This resulted in a greater percentage of ELL students scoring at Level 2. The
frequency table and the boxplot showed a closing of the achievement gap when compared
to the number of ELL students and standard curriculum students at FCAT reading Level
2. A majority of schools’ standard curriculum students and schools’ Language
Arts/ESOL program students had percentages below .30. The groups at Level 2 were
beginning to become more similar in scores with .16 reported for one school’s Language
Arts/ESOL program students and .14 reported for one school’s standard curriculum
students.
147
The mean descriptive statistic compared the schools’ One-Way Developmental
Bilingual Education program students and the schools’ standard curriculum students and
resulted in a greater percentage for the One-Way Developmental Bilingual Education
program students at FCAT reading Level 2. The achievement gap here, also, was
beginning to close. The frequency table and boxplot showed a clustering of 5 of the 13
schools between .25 and .26 for the schools’ One-Way Developmental Bilingual
Education Program students at Level 2. The schools’ standard curriculum students,
although revealing a greater distribution between .09 and .34, had two schools at .22.
The mean for the for the schools’ Language Arts/ESOL program students at .3215
compared to the mean for the for the One-Way Developmental Bilingual Education
program students at .2310 showed a greater percentage of ELL students at Level 2 when
compared to schools’ standard curriculum students. Despite the higher FCAT percentages
for both groups, the FCAT mean scale scores were closer for the schools’ ELL students
and the schools’ standard curriculum students.
FCAT Reading Level 3
For FCAT reading Level 3, the mean descriptive statistic for the schools’
Language Arts/ESOL program students and for the schools’ standard curriculum students
resulted in a greater percentage of standard curriculum students scoring at Level 3. The
frequency table and the boxplot for the schools’ Language Arts/ESOL program students
showed a larger distribution of scores from .10 to .50 compared to the tighter clustering
for the schools’ standard curriculum students between .36 and .46. At FCAT Level 3, the
148
scores for the Language Arts/ESOL program indicated a widening of the achievement
gap with a significantly greater percentage of the schools’ standard curriculum students at
FCAT reading Level 3.
The mean descriptive statistic compared the schools’ One-Way Developmental
Bilingual Education program students and the schools’ standard curriculum students.
This resulted in a greater percentage for the standard curriculum students at Level 3. The
frequency table and the boxplot showed both groups resulted in the schools’ scores
clustering together; however, the One-Way Developmental Bilingual Education program
remained lower with percentages clustering between .16 and .22.
The mean for the schools’ Language Arts/ESOL program students was at .290
compared to the mean for the One-Way Developmental Bilingual Education program
students at .2250. This resulted in a greater percentage of ELL students in the Language
Arts/ESOL program at Level 3. A significantly greater percentage of standard curriculum
students scored at Level 3 when compared to the schools with either program.
FCAT Reading Level 4
For FCAT reading Level 4, the mean descriptive statistic compared the schools’
Language Arts/ESOL program students and the schools’ standard curriculum students.
This resulted in a greater percentage of standard curriculum students scoring at FCAT
reading Level 4. The frequency table and the boxplot for the schools’ Language
Arts/ESOL program students showed all schools at .09 or below compared to the schools’
149
standard curriculum students whose scores ranged between .11 and .32 with a tight
clustering of mean scores between .27 and .32.
The mean descriptive statistic was also compared for the schools’ One-Way
Developmental Bilingual Education program students and the schools’ standard
curriculum students. This resulted in a greater percentage of the standard curriculum
students at FCAT reading Level 4. The frequency table and the boxplot showed the
schools’ One-Way Developmental Bilingual Education program students with 6 of the 13
schools’ means between .00 and .03.
The mean for the schools’ Language Arts/ESOL program students was .050
compared to the mean of .059 for the schools’ One-Way Developmental Bilingual
Education program students and indicated a greater percentage of schools’ One-Way
Developmental Bilingual Education program students at FCAT reading Level 4. When
compared to the schools’ standard curriculum students at FCAT reading Level 4, the
achievement gap for the two programs continued to widen with a greater percentage
reported for the schools’ standard curriculum students. Of the two programs, more
schools’ One-Way Developmental Bilingual Education program students scored at FCAT
reading Level 4 than did students in the Language Arts/ESOL program schools.
FCAT Reading Level 5
For FCAT reading Level 5, the mean descriptive statistic compared the schools’
Language Arts/ESOL program and the standard curriculum students. The result was more
schools’ standard curriculum students scoring at this level. The frequency table and the
150
boxplot for the schools’ Language Arts/ESOL students showed 2 of the 13 schools at .01
and .04 compared to one school’s standard curriculum students at .16.
The mean descriptive statistic compared the schools’ One-Way Developmental
Bilingual Education program students and the schools’ standard curriculum students.
This resulted in a greater percentage for the schools’ standard curriculum students scoring
at FCAT Level 5. The frequency table and boxplot showed an even greater widening of
the achievement gap. All of the schools’ One-Way Developmental Bilingual Education
program students at Level 5 had means between .00 and .01 compared to the schools’
standard curriculum student means as high as .30 for one school.
The mean for the set of scores for the schools’ Language Arts/ESOL program
students at .0038 compared to the mean for the schools’ One-Way Developmental
Bilingual Education program students at .0040 was significantly lower than the schools’
standard curriculum students. More schools’ with One-Way Developmental Bilingual
Education program students scored at FCAT reading Level 5 than schools’ with
Language Arts/ESOL program students.
The results of the present study supported the research that successful bilingual
programs develop biliteracy and lead to academic achievement (Brisk, 1999). In addition,
the research of Krashen (1997) supported first language instruction and literacy which
transfers to second language literacy.
151
Research Question 4
To what extent is there an achievement gap between all schools with standard curriculum students and schools with ELL students in the Language Arts/ESOL program scoring Level 3 or higher on the 2007 7th-grade FCAT reading test?
The descriptive statistics compared FCAT Level 3 or higher percentages for the
schools’ Language Arts/ESOL students and the schools’ standard curriculum students
and revealed a greater number of schools’ standard curriculum students scoring at Level
3 or higher. Six of the schools’ Language Arts/ESOL program students mean percentages
were between .33 and .36 with one school as high as .56. This was compared to the
schools’ standard curriculum students with one school as low as .50 and one school as
high as .91. The achievement gap at Level 3 or higher was considerably wider between
the schools’ standard curriculum students and the schools’ Language Arts/ESOL program
students.
The present study supports the work of Abella, Urrutia, and Shneyderman (2005)
who reported on significant achievement gaps for students in Miami-Dade County,
Florida. The results of their study showed that in Miami-Dade schools the English
version of standardized tests did not necessarily accurately measure content mastery for
ELL students.

152
Research Question 5
To what extent is there an achievement gap between schools with standard curriculum students and schools with ELL students in the One-Way Developmental Bilingual Education program scoring Level 3 or higher on the 2007 7th-grade FCAT reading test?
A comparison of FCAT reading Level 3 or higher percentages for the schools’
One-Way Developmental Bilingual Education program students and the schools’
standard curriculum students resulted in more schools’ standard curriculum students
scoring at FCAT reading Level 3 or higher. The frequency table and boxplot showed
percentages for the schools’ One-Way Developmental Bilingual Education program
students with scores as high as .44 compared to the schools’ standard curriculum students
whose percentages were as high as .87. Thus, the achievement gap was widened
significantly between schools’ standard curriculum students scoring at Level 3 or higher
when compared to the schools’ One-Way Developmental Bilingual Education program
students.
Research Question 5 addressed the achievement gap regarding FCAT reading
scores at Level 3 or higher between ELL students and standard curriculum students.
Results showed significant differences between the groups. The results of the present
study have been supportive of the work of Lazarain (2006) and the 2005 NAEP
assessment wherein it was found that “29% of eighth-grade ELLs scored at or above the
basic achievement level in reading, compared to 75% of non-ELLs” (p. 2).
153
Conclusions
This study showed significant differences in English as a second language
programs in schools. The Language Arts/ESOL program proved to prepare English
Language Learner (ELL) students for FCAT achievement better than did the One-Way
Developmental Bilingual Education program. Although the FCAT was only one measure
of a student’s success, at the time of the present study, it was the indicator that held
students and schools accountable for on-grade-level achievement (Level 3 or higher) in
the state of Florida.
The independent t- tests in Research Questions 1 and 2 showed a stronger
statistical significance between the schools’ Language Arts/ESOL program students and
the schools’ standard curriculum students than between the schools’ One-Way
Developmental Bilingual Education program students and the schools’ standard
curriculum students. Therefore, the Language Arts/ESOL program closed the gap more
closely than did the One-Way Developmental Bilingual Education program when
compared to the schools’ standard curriculum students.
Research Question 3 examined the five FCAT achievement levels for 7th-grade
reading. For FCAT Level 1, the Language Arts/ESOL program clearly out performed the
One-Way Developmental Bilingual Education program when comparing the mean
averages for the two groups. When investigating FCAT Level 2, the Language
Arts/ESOL program continued to move more students into this achievement level with
more students scoring at FCAT Level 2 than did the One-Way Developmental program
students.

154
Research Question 3, also, examined FCAT Level 3. The mean averages for the
two program groups were closer together at Level 3. This suggested that ELL students
may have had a more complete grasp of the English language when compared to standard
curriculum students scoring at FCAT Level 1 and FCAT Level 2. This, also, suggested
that ELL students may have been successful on the FCAT reading test regardless of the
program in which they were enrolled.
Both programs appeared to close the achievement gap when measured against
standard curriculum students. When the two programs groups were compared to one
another at FCAT Level 4 and Level 5, the One-Way Developmental Bilingual Education
program was more successful in closing the gap than was the Language Arts/ESOL
program. When measured against the standard curriculum students, the spike in ELL
students scoring at FCAT Level 3, as well as those students found in both FCAT Level 4
and FCAT Level 5, suggested that students in both language programs did benefit in
closing the achievement gap when measured against standard curriculum students.
At FCAT reading Level 4 and Level 5, an interesting phenomenon occurred. The
means for both ELL program groups were more similar at FCAT Levels 4 and 5 than at
FCAT Levels 1, 2, or 3.
Research Questions 4 and 5 examined FCAT Level 3 or higher 2007 FCAT
reading mean scale scores for the schools in the study. The state of Florida has grouped
the Level 3, 4, and 5 scores together and returned a percentage to the schools based on
the school’s tested population. For both programs, the schools’ standard curriculum
students out-performed the schools’ ELL students. One school’s Language Arts/ESOL
155
program students percentage was as high as .56 compared to one school’s One-Way
Developmental Bilingual Education program at .44, the highest score for this program.
Again, schools whose students were enrolled in the Language Arts/ESOL program out-
performed the schools with students enrolled in the One-Way Developmental Bilingual
Education program. This appeared to aid in closing the achievement gap.
The researcher found, in the literature for ELL students, that many labels exist to
represent ELL students. At the time of the present study, the researcher experienced a
change in the Florida label from English Speakers of Other Languages (ESOL) to English
Language Learner (ELL). The researcher believes that the wide-spread inconsistent
labeling of ELL students adds to the confusion of identifying and properly serving these
students.
The state of Florida has one of the top ELL populations in the nation. The
researcher believes that due to the mobility of the ELL students that many students have
been either wrongly identified or have not been identified at all. In completing the study,
the researcher found many counties to have a limited number of ELL students who
participated in the 2007 FCAT reading test for seventh grade. This was true in the
southern most counties of Florida, which historically have been areas for migrant workers
and their families. This raises a concern as to whether all students were appropriately
afforded the opportunity to take the FCAT.
If, at the time of a student’s registration in a school, the state-required Home
Language Survey were not provided to the student’s parent or guardian; if the parent or
guardian were coached on how to answer the questions; if the placement tests were not
156
properly administered; or if the students were not coded properly in the state mainframe
computer system, the student would not receive the second language support that is
required by the state. The inconsistencies in school and county practices may have added
to the difficulty in locating schools with ELL students who have taken the 2007 FCAT
reading test.
The state of Florida has provided a window of opportunity wherein the FCAT
must be administered to all students who are present on test days along with make-up
days. Typically, district officials have determined which test is administered on which
day including, make-up tests within the state’s testing window. If an ELL student was
absent during the test day and the make-up day, the test could not be counted for the
school’s grade. Given the political competitiveness of school grades and the mobility of
many ELL students, the researcher believes that these students may not have been given
the FCAT. Therefore, the current data may not accurately reflect the number of ELL
students.
In completing the study, the researcher found that the 67 Florida counties that
were contacted did not have consistent program labeling. Many counties identified their
ELL students as “mainstreamed” despite the number of ELL students in the county.
Many district officials who did respond added little to no information as to what extent
their ELL student population was supported and were uninformed about the two ELL
programs in the present study. Over half of the county officials contacted did not respond.
This led the researcher to believe that the ELL student population, again, may not have
been properly identified and may not be receiving adequate second language support.
157
Despite the research of Thomas and Collier (2002, 1997a), the One-Way
Developmental Bilingual Education program was found in only one of the 67 counties.
Given the difficulty in locating other counties that offered the One-Way Developmental
Bilingual Education program, the researcher had some concern as to whether the one
county in the present study was providing the best program for the ELL populations in
the schools which offer the programs. The present research supports the Language
Arts/ESOL program as being more effective in closing the achievement gap when
measured against the One-Way Developmental Bilingual Education program but raises
questions regarding students who test at FCAT Levels 4 and 5.
Implications for Practice
The findings of this study relate to program decision-makers and the education of
ELL students in important ways to close the achievement gap for ELL students.
1. Supporting the work of The National Association for the Education of Young
Children (2005), the present study suggested that ELL students should be
tested in their native language. The FCAT has only been available in English
and may not accurately measure an ELL student’s reading achievement. ELL
students would benefit if the State Department of Education officials would
investigate the languages in the state and work toward native language
assessment for the FCAT.
2. Meeting the unique needs of the ELL student requires program decision-
makers to look more closely at the second language programs implemented in

158
schools and more closely match the programs with the schools’ student
population in order to close the achievement gap between the English-only
students and the ELL students.
3. The present study suggested that care should be taken by program decision-
makers for the implementation of the Language Arts/ESOL program and the
One-Way Developmental Bilingual Education program in order to ensure
quality and equity of education across the programs as a means to close the
achievement gap with standard curriculum students.
4. FCAT test preparation should be fully investigated by school officials in
order to fully support ELL students in FCAT test preparation in an effort to
level the playing field between ELL students and standard curriculum students
and, thereby, aid in closing the achievement gap.
5. To ensure equitable instruction across the programs, the present study
suggests that on-going training for English for Speakers of Other Languages
(ESOL) teachers be required in order to keep abreast of the changes and to
close the achievement gap. Schools should share best practices and current
research in the field of education for ELL students.
6. Following the work of Collier (1995) and her language acquisition concept
model, district administrators as program decision-makers should allow more
local control by school principals in order to achieve the best program for
each school’s student population. The sociocultural, linguistic, academic, and
cognitive processes are central to the Collier model, and schools should take
159
great care to ensure that these needs are met for the ELL student in order to
facilitate language acquisition and close the achievement gap.
Recommendations for Future Research
Results of the literature reviewed and the findings of this study revealed a need to
investigate the curricular programs in which ELL students were enrolled. The results of
the present study showed that there were great opportunities for further research in the
closing of the achievement gap for ELL students and English-only students.
1. Randomized longitudinal studies should be implemented to follow students
from one grade to another grade in order to show content knowledge growth
and to track individual student data. Native language mastery, number of
years of education in the student’s native country, and current educational
growth from year-to-year should be considered.
2. The current study should be expanded to allow for greater investigation into
the practices of the schools for the education of ELL students, including an
investigation into the standardization of one school’s program implementation
to another school’s program implementation.
3. Future studies should include individual student data, thus expanding the
study to allow for a greater number of participants in the study and to include
in future studies the ability to track a student’s individual progress in English
acquisition from year-to-year in order to discover the long-term effects on
closing the achievement gap.
160
4. Future studies should include qualitative data and quantitative data for
investigation into the practices of teachers and school administrators as well
as an in depth analysis of the cultural aspects of the schools which are charged
with educating ELL students.
5. Future studies should invstigate actual curricula content and curricula
consistency among classrooms and programs with regard to instructional
delivery, including contact time with students, teaching methodology, and
time on actual content.
6. Future studies should include two second language models in states with
native language criterion-referenced state tests.
7. Future studies should explore the efficacy of offering FCAT in Spanish as
well as other students’ native languages.
8. Future studies should explore the Equal Protection Clause of the Fourteenth
Amendment to the U.S. Constitution as it relates to ELL students and the
public school education experience as well as state-required assessments.
9. Future Florida studies should explore the validity of the required Florida ELL
program exit tests for ELL students who test above grade level at FCAT
Levels 4 and 5 and should investigate why ELL students who are above grade
level according to the FCAT reading test are still classified as ELL students.

161
APPENDIX INSTITUTIONAL REVIEW BOARD APPROVAL
162
163
LIST OF REFERENCES Abedi, J. (2001, Summer). Assessment and accommodations for English language
learners: Issues and recommendations. Policy Brief 4. National Center for Research on Evaluation, Standards, and Student Testing, University of California, Los Angeles.
Abedi, J., & Dietel, R. (2004). Challenges in the no child left behind act for
English-language learners. Phi Delta Kappan, 85, 782-785. Abella R., Urrutia, J., & Shneyderman, A. (2005). An examination of the validity of
English-language achievement test scores in an English language learner population. Bilingual Research Journal, 29(1), 127-144.
Acevedo, B. A., et al. (2002). A comprised commitment; society’s obligation and failure
to serve the nation’s largest growing population: A report on the educational experience of Latinos in five western states. Hispanic Border Leadership Institute. Tempe, AZ: Arizona State University.
Advocates for Children of New York and the New York Immigration Coalition. (2002).
Creating a formula for success: Why English language learner students are dropping out of school, and how to increase graduation rates. New York, NY: Robert Sterling Clark Foundation, Inc. (ERIC Document Reproduction Service No. ED467109).
Assessment and School Performance, Florida Department of Education. (2007).
Understanding FCAT reports, State of Florida: Tallahassee, FL. Azzam, A. (2004). A look at language learning. Educational Leadership, 62(4), 7. Bazron, B., Osher, D., & Fleischman, S. (2005). Creating culturally responsive schools.
Educational Leadership, 62(4), 83-84.
Bielenberg, B., & Fillmore L. W. (2005). The English they need for the test. Educational Leadership, 62(4), 45-49.
Bilingual Education Act of 1968, Title VII of the Elementary Secondary Education Act (as cited in Congress; Escamilla, Nunez; James; Tangipahoa Parish School Board v. United States Department of Education, St. John the Baptist Parish School Board v. United States Department of Education, St. Bernard Parish School Board v. United States Department of Education, and St. Charles Parish School Board v. United States Department of Education, 821 F.2d 1022; & Wiese, A, & Garcia, E. E).

164
Blocker, R., Manuel, D., Lawson, J., Ortiz, T., Pereira, E., Rassel, M., et al. (n.d.). The legal rights of language enriched pupils (LEP) in Florida. Orange County Public Schools: Orange County, FL.
Bohn, A. P, & Sleeter, C. E. (2000). Multicultural education and the standards
movement: A report from the field. Phi Delta Kappan, 82(2), 156-159. Brown et al., v. Board of Education of Topeka et al., 347 U.S. 483 (1954). Building on our strengths: Linguistic and cultural diversity in the early grades. (2000).
Classroom Leadership(4). Bush, G.W. (2001). No Child Left Behind. Department of Education. Washington, DC:
Office of the Secretary. ERIC Reproduction Document No. ED447808. Brisk, M. E. (2000). Quality bilingual eduction: Defining success. Presented at the
Symposium on Language Policy Bar Ilam University, Israel, November 1999. Northeast and Islands Regional Educational Laboratory, The Education Alliance at Brown University. RI: Providence.
Bruce, K. L., Lara-Alecio, R., Parker, R. I., Hasbrouck, J. E., Weaver, L., & Irby, B.
(1997). Inside transitional bilingual classrooms: Accurately describing the language learning process [Electronic version]. Bilingual Research Journal 21(2 & 3).
Calderon, M. (1997). Staff development in multilingual multicultural schools. (Report
No. EDO-UD-97-5). Washington, D.C.: Office of Educational Research and Improvement. (ERIC Document Reproduction Service No. EDD00036)
Capps, R., Passel, J. S., Perez-Lopez, D., & Fix, M. (2003). The new neighbors: A users’
guide to data on immigrants in U.S. communities. Baltimore, MD: Urban Institute for the The Annie E. Casey .
Castaneda v. Pickard (as cited in Orange County Public Schools., n.d.). Certain Named and Unnamed Non-citizen Children and Their Parents v. Texas, 448 U.S. 1327 (1980). Chang’s book (as cited in National Association for the Education of Young Children,
1995). Christian, D., Howard, E., & Loeb, M. (2000). Bilingualism for all: Two-way immersion
education in the United States. Theory into Practice, 39(4), 258-266.

165
Civil Rights Act of 1964 PL 88-352 (1964).
Collier, V. (1987). The effect of age on acquisition of a second language for school. National Clearinghouse for Bilingual Education Occasional Papers in Bilingual Education. No. 2 .
Collier V. (1995). Acquiring a second language for school. Directions in Language & Education. [Electronic version.] National Clearinghouse for Bilingual Education. (14).
Collier, V., & Thomas, W.P. (1989). How quickly can immigrants become proficient in school English? The Journal of Educational Issues of Language Minority Students, 5, 26-38.
Combs, M. C., Evans C., Fletcher, T., Parra, E., & Jimenez, A. (2005). Bilingualism for the children: Implementing a dual-language program in an English-only state. Educational Policy, 19(5), 701-728.
Congress enacts bilingual education act, 1968. (1997). DISCovering US History, Gale Research. Reproduced in History Resource Center. Farmington Hills, MI: Gale Group.
Crawford, James. (2002). The bilingual education act 1968-2002 [Electronic version].
Retr Retrieved October 11, 2004 from http://ourworld.compuserve.homepages/JWCRAWFORD/T7obit.html
Cummins, J. (n.d.a). BICS and CALP. Retrieved January 27, 2007, from
http://www.iteachilearn.com/cummins/immersion2000.html Cummins, J. (n.d.b). Bilingual children’s mother tongue: Why is it important for
education. Retrieved January 27, 2007, from http://www.iteachilearn.com/cummins
Cummins, J. (n.d.c). Immersion education for the millennium: What we have learned
from 30 years of research on second language immersion. Retrieved January 27, 2007, from http://www.iteachilearn.com/cummins/immersion2000.html
de Jong, E. J. (2002). L2 proficiency development in a two-way and a developmental
bilingual program. NABE Journal of Research and Practice, 2(1), 77-108. DiCerbo, P. A. (Ed). (September 2000). Lessons from research: What is the length of
time it takes limited English proficient students to acquire English and succeed in an all-English classroom? National Clearinghouse for Bilingual Education Issue Brief, 5, 1-15.
166
Early childhood curriculum, assessment, and program evaluation. (2003). Joint position statement of the National Association for the Education of Young Children and the National Association of Early Childhood Specialists in State Departments of Education. Position statement adopted November, 2003.
eMetric. San Antonio, TX. www.eMetric.net Equal Educational Opportunity Act, (as cited in Ovando, C. J.). Escamilla, K. (1989). A brief history of bilingual education in Spanish. ERIC Digest.
Charleston, WV: ERIC Clearninghouse on Rural Education and Small Schools, Appalachia Schools. (ERIC Document Reproduction Service No. ED308055)
Escamilla, K., Chavez, L., & Vigil P. (2005). Rethinking the “gap:” High stakes testing
and Spanish-speaking students in Colorado. Journal of Teacher Education, 56(2), 132-144.
Evans, Torrey, Newton’s study (as cited in Miller, Strosnider, and Dooley, 2000). Feinberg, R. C., & Morencia, C. C. (1998). Bilingual education: an overview. Social
Education, 62(7), 427-431. Retrieved November 3, 2003, from the FirstSearch database.
Ferguson, D., Ralph, G., Meyer, G., Lester, J., Droege, C., Guojonsdottir, H, et al.
(2001). Designing personalized learning for every student. Alexandria, VA: ASCD.
www.fcat.fldoe.org/. Retrieved July 29, 2007.
www.fldoe.org/bii/curriculum/sss/. Retrieved July 29, 2007.
Flores v. Arizona (as cited in Acevedo, et al., 2002). Florida Department of Education. (2005). Florida Comprehensive Assessment: Test
summary of tests and design. (2005). www.fcat.fldoe/org/pdf/fc05designsummary.pdf. Retrieved April 29, 2007.
Florida Department of Education. (2006). Cognitive complexity classification of FCAT
SSS test items. Retrieved July 29, 2007 from http://fcat.fldoe.org/pdf/cog_complexity-fv31.pdf
Florida Department of Education. (2007a). FCAT achievement levels. Retrieved April
29, 2007 from www.fcat.fldoe.org/pdf/fcAchievementLevels.pdf.
167
Florida Department of Education. (2007b). FCAT reading 2007 grade 7 content focus. Retrieved November 20, 2007, from www.fcat.fldoe.org/fccontentfocus.asp
Florida Department of Education Accountability, Research, and Measurement. (2007).
Assessment and accountability briefing book: State of Florida. Florida Statutes. (2006). Title XLVII K-20 Education Code, Chapter 1003 K-12
Education Code.
Frankel, J. R., Wallen, N. E. (2000). How to design and evaluate research in education. McGraw Hill: Boston.
Genesee, F. (1999). Program alternatives for linguistically diverse students. University of California at Santa Cruz: Center for Research on Education, Diversity, & Ecellence.
Genesee. F., Lindholm-Leary, K., Saunders, W., & Christian, D. (2005). English
language learners in US schools: An overview of research findings. Journal of Eeducation for Students Placed at Risk, 10(4), 363-385.
Glenn, C. L. (2002). One language or two? Principal, 28-31. Gomez, L., Freeman, D., & Freeman, Y. (2005). Dual Language education: A promising 50-50 model. Bilingual Research Journal, 29(1), 145-164. Gonzalez, V. (2001). The role of socioeconomic and sociocultural factors in language
minority children’s development: an ecological research view. [Electronic version.] Bilingual Research Journal, 25(1 & 2).
Gonzalez, V. (2005). Cultural, linguistic, and socioeconomic factors influencing
monolingual and bilingual children’s cognitive development. In V. Gonzalez & J. Tinajero (Eds.), Review of Research and Practice Volume 3. (pp. 67-104). New Jersey: Lawrence Erlbaum Associates, Publishers.
Green, P. E. (2003). The undocumented: Educating the children of migrant workers in
America. Bilingual Research Journal, 27(1), 51-71.
Hakuta, K., Butler, Y. G., Witt, D. (2000). How long does it take English learners to attain proficiency? (University of California Linguistic Minority Research Institute. Policy Report 2000-1). Stanford University. Chicago, IL: Spencer Foundation. (ERIC Document Reproduction Service No. ED443275)
168
Hoefer, M., Rytina, N, & Campbell, C. (2006). Estimates of the unauthorized immigrant population residing in the United States: January 2005. Population Estimates, Office of Immigration Statistics Policy Directorate, Homeland Security.
Hood, L. (2003). Immigrant students, urban high schools: the challenge continues. New
York: Carnegie Corporation of New York. Hopstock, Paul J. (2003). Descriptive study of services to LEP students and LEP students
with disabilities: Issues in studying learning outcomes for LEP students. Office of English Language Acquisition U.S. Department of Education: National Center for Educational Outcomes, University of Minnesota.
Human Resources Research Organization and Harcourt Educational Measurement.
(2002). Florida comprehensive assessment test (FCAT) for reading and mathematics: Technical report for test administrations of FCAT 2002. VA: Alexandria and TX: San Antonio.
Immigration and Nationality Act of 1965 (as cited in Ovando, C. J.). Kohler, A. D., & Lazarin, M. (2007). Hispanic Education in the United States. Statistical
Brief No 8. National Council of LaRaza. Washington, D.C. Krashen, S. (1997). Why bilingual education? Charleston, WV: Office of Educational
Research and Improvement. (ERIC Document Reproduction Service No. ED403101).
Krashen, S. (1999). Bilingual education: arguments for and (bogus) arguments against.
Georgetown University Roundtable on Languages and Linguistics. Presented May 6, 1999.
Krashen, S. (2005). Let’s tell the public the truth about bilingual education. In V.
Gonzalez & J. Tinajero (Eds.), Review of Research and Practice Volume 3. (p. 165-173). New Jersey: Lawrence Erlbaum Associates, Publishers.
Lau v. Nichols (as cited in Blocker, R., Manuel, D., Lawson, J., Ortiz, T., Pereira, E.,
Rassel, M., et al.). Lau Remedies, The. (as cited in Ovando, 2003 and Lyons, 1990). Lau-Serna doctrine (as cited in Otero et al. v. Mesa County Valley School District No.
51, et al., 1977).
169
Lazarin, Melissa. (2006). Improving assessment and accountability for English language learners in the No Child Left Behind Act. Issue Brief No. 16. National Council of La Raza. Washington, D.C.
League of United Latin American Citizens (LULAC) et al. v. Florida Board of Education and Florida Department of Education, et al. (1990). Order and Settlement Agreement. Retrieved July 22, 2007 from http://www.fldoe.org/aala/lulac.asp
Lessow-Hurley, J. (2000). The foundations of dual language. New York: Longman.
Lessow-Hurley, J. (2003). Meeting the needs of second language learners: An educator’s guide. Alexandria, Virginia: ASCD.
Lindhom-Leary, K. (2004). The rich promise of two-way immersion. Educational
Research, 62(4), 56-59. Linn, R. (2005 Summer). Fixing the NCLB accountability system. Policy Brief of the
National Center for Research on Evaluation, Standards, and Student Testing. Lomax, R. G. (2001). An introduction to statistical concepts for education and
behavioral sciences. Lawrence Erlbaum Associates: Mahway, NJ. Lyons, J. J. (1990). The past and future decisions of federal bilingual-education policy.
The Annals of the American Academy, 508, 66-80. Ma. J. (2002) What works for the children? What we know and what we don’t know
about bilingual education. Cambridge, MA: Civil Rights Project, Harvard University. (ERIC Document Reproduction Service No. ED467092)
Mahon, E. (2006). High-stakes testing and English language learners: Questions of
validity. Bilingual Research Journal, 30(2), 479-497. Malave`, L. (1997). Parent characteristics: Influence in the development of bilingualism
in young children. NYSABE Journal, 12, 15-42. Menken, Kate. (2000, September). What are the critical issues in wide-scale assessments
of English language learners? Issue Brief., 6, 3-9. National Clearinghouse for Bilingual Education, Office of Bilingual Education and Minority Languages Affairs. Washington, D.C. (ERIC Reproduction Service No. ED450595)
170
Meyer, D., Madden, D., & McGrath, D. (2004). English language learner students in U.S. public schools: 1994-2000. National Center for Education Statistic Issue Brief. U.S. Department of Education Institute of Education Sciences. Washington, D.C.: U.S. Government Printing Office. Retrieved April 22, 2007, from www.http//:nces.ed.gov/programs/quarterly/vol_6/6_3/3_4.asp
Miller, K., Strosnider, R., & Dooley, E. (2000). States’ requirements for teachers’
preparation for diversity [Electronic version]. Multicultural Education, 8(2), 15-18.
Miller, S., Miller, K., & Schroth, G. (1997). Teacher perceptions of multicultural training
in preservice programs. Journal of Instructional Psychology, 24(4), 222-333. National Association Bilingual Education (2001). Position Paper. National Association for the Education of Young Children. (1995). Responding to
linguistic and cultural diversity recommendations for effective early childhood education: A position statement. Washington, DC.: Author.
National Association for the Education of Young Children. (Summer 2005). Screening
and assessment of young English-language learners: Supplement to the NAEYC position statement on early childhood curriculum, assessment and program evaluation. Washington, DC: Author.
National Association for the Education of Young Children and the National Association
of Early Childhood Specialists in State Departments of Education. (2003). Early childhood curriculum, assessment, and program evaluation: Building an effective, accountable system in programs for children birth through age 8. Position statement with expanded resources. Washington, DC: Author.
National Clearinghouse for English Language Acquisition (2006). Resources about
assessments and accountability for ELLs. Washington, D.C. Retrieved fromJanuary 7, 2007. http://www.ncela.gwu.edu/resabout/assessment/index.html
Northwest Regional Educational Laboratory Research Review. (Winter 1995). No
Author. [Electronic version]. NW Education. Retrieved March 10, 2007, from www.nwrel.org/nwedu/winter_95/page32.html
Nunez-James, M. (2002). Bilingual education and identify debates in New Mexico:
Constructing and contesting nationalism and ethnicity. Journal of the Southwest, 44(1), 61-78.
171
Office of Economic & Demographic Research, Florida Legislature. (August, 2005). Characteristics of students by place of birth & language spoken in the home: Florida Public School Grades K-12 2003-04 School Year. Tallahassee, FL: Florida Legislation.
Orange County Pubic Schools. (n.d.). Revisions to the district LEP plan 2004-2007. Orange County Public Schools Multilingual Student Education Services (n.d.a.). Basic
mainstream instruction language arts/ESOL program guide English [Brochure]. Orange County, FL: Author.
Orange County Public Schools Multilingual Student Education Services (n.d.b.). Parent
notification of eligibility for placement in programs for students learning English as a second language [Notification letter]. Orange County, FL: Author.
Orr, C. (n.d). What every teacher should know about FCAT. Florida Department of
Education Assessment and Evaluation Services. Retrieved July 29, 2007 from http://fcat.fldoe.org/pdf/fcatguid.pdf
Ortiz, T. (2003). Program delivery models overview: Presentation for administrators.
PowerPoint. Orlando, FL: Orange County Public Schools Multilingual Student Education Services.
Osher, D., Cartledge, G., Oswald, D., Sutherland, K., Artiles, A., Coutinho, M. (2004)
Cultural and linguistic compentency and disproportionate representation. In Rutherford, R. B. Jr., Quinn, M. M., & Mather, S. R. (Eds.) Handbook of Research in Emotional and Behavioral Disorders. New York: The Guilford Press.
Osterling, J. P., Violand-Sanchez, E., von Vacano, M. (1999). Educational Leadership, October, p. 64-68.
Otero, et al. v. Mesa County Valley School District No. 51, et al. 568 F.2d 1312 (1977). Ovando, C. J. (2003). Bilingual education in the United States: Historical development and current issues. Bilingual Research Journal, 27(1), 1-23. Paige, Rod. (2004). Secretary Paige announces new policies to help English language
learners: States, school districts will have greater flexibility to assist limited English proficient students. United States Department of Education Press Release.
Pappamihiel, N. E. (2001). Moving from the ESL classroom into the mainstream: An
investigation of English language anxiety in Mexican girls. Bilingual Research Journal, 25(1 & 2), 1-8.
172
Parker, S. W., Rubalcava, L., & Teruel, G. (2005). Schooling inequality and language barriers. Economic Development and Cultural Change. University of Chicago.
Pearce, R. (2006). Effects of cultural and social structural factors on the achievement of
White and Chinese American students at school transition points. American Educational Research Journal, 43(1), 75-101.
Plessy v. Ferguson (as cited in Brown et al., v. Board of Education of Topeka et al.). Pottinger, J. S. (May 25, 1970). Director, Office of Civil Rights. Memorandum, sent by
the Department of Health, Education, and Welfare to School Districts with More Than Five Percent National Origin-Minority Group Children.
Roberts, C. A. (1995). Bilingual education program models: A framework for
understanding. The Bilingual Research Journal, 19(3 & 4), 369-378. Rossell, C. (2004-2005). Teaching English through English. Educational Leadership,
62(4), 32-39. Rothstein, R. (1998). Bilingual education: The controversy. [Electronic version]. Phi
Delta Kappan, 70(9). Retrieved April 22, 2007. www.pdkintl.org/kappan/krot9805.htm
Rothstein, R. (2001). Bilingual education. The Jossey-Bass Reader on School Reform.
San Francisco, CA: Jossey-Bass, Inc. Rubenfeld, S., Clement, R., Lussier, D., Lebrun, M., & Auger, R. (2006). Second
language learning and cultural representations: Beyond competence and identity. Language Learning, 56(4), 609-632.
Scarcella, R. (2003). Academic English: a conceptual framework. The Uniersity of
California Linguistic Minority Research Institute Technical Report 2003-1. University of California, Irvine.
Serna v. Portales Municipal (as cited in Otero, et al. v. Mesa County Valley School
District No. 51, et al.) Shavelson, R. J. (1988). Statistical reasoning for the behavioral sciences. Allyn and
Bacon, Inc.: Needham Heights, MA. Short, D., & Echevarria, J. (2005). Teacher skills to support English language learners.
Educational Leadership, 62(4), 9-13.

173
Smith-Davis, J. (2004). The world of immigrant student. Principal Leadership, 4(7), 4-49.
Snow and Biancarosa. (as cited in Short & Echevarria, 2004). Stevens, B.A., & Tollafield, A. (2003). Classroom practice: Creating comfortable and productive parent/teacher conferences. Kappan, 84(7), 521-524. Sunshine State TESOL of Florida. (2005). Position statement on bilingual education.
Retreived January 27, 2007, from http://www.clas.ufl.edu/users/rthompso/advocacybilingualed.html
Tangipahoa Parish School Board v. United States Department of Education, St. John the
Baptist Parish School Board v. United States Department of Education, St. Bernard Parish School Board v. United States Department of Education, and St. Charles Parish School Board v. United States Department of Education, 821 F.2d 1022 (1987).
Texas Education Agency Office of Policy Planning and Research. (1998). Academic
achievement of elementary students with limited English proficiency in Texas public schools. Autstin, TX: Author. (ERIC Document Reproduction Service No. ED431567)
Texas statute 21.301 (as cited in Certain Named and Unnamed Non-citizen Children and
Their Parents v. Texas, 1980). Thomas, W. P., & Collier, V. P. (1997a). School effectiveness for language minority
students. Washington, DC: The George Washington University National Clearinghouse for Bilingual Education.
Thomas, W. P., & Collier, V. P. (1997b). Two languages are better than one. Educational
Leadership, 55, 23-26. Thomas, W. P., & Collier, V. P. (2002). A National study of school effectiveness for
language minority students’ long-term academic achievement. Washington, DC: Center for Research on Education, Diversity & Excellence.
Titus, D. (2001). High stakes down under for indigenous peoples: Learning from Maori
education in New Zealand: An outsiders perspective. Paper presented at the annual meeting of the National Association for Multicultural Education Eleventh Annual International Conference. NV: Las Vagas. (ERIC Reproduction Document Service No. ED465721)
174
Tompkins, J. C. (2000). SAT 9 fairness to Hispanic ELLs: an examination of the common problems Hispanic English language learners face when taking the annual Stanford 9 test in California. An opinion paper. Dominican University of California. CA: San Rafael (ERIC Reproduction Document Service No. ED449199)
United States Census. (2000). Retrieved November 7, 2004, from www.census.gov United States Constitution, Amendment XIV, Section 1 (1866). Retrieved July 22, 2007
from http://archives.gov/national-archives-experience/charters/constitution_Amendments_11-27.htm
United States Department of Education, National Center for Education Statistics (2006a).
The Condition of Education 2006: Indicator 7, Language minority school-age children. NCES 2006-071, Washington, D.C.: U.S. Government Printing Office.
United States Department of Education, National Center for Education Statistics (2006b).
The Condition of Education 2006: Indicator 14, Trends in the achievement gaps in reading and mathematics. NCES 2006-071, Washington, D.C.: U.S. Government Printing Office.
Vialpando, J., Linse, C., & Yedlin, J. (2005). Educating English language learners:
Understanding and using assessment. National Council of LaRaza and The Education Alliance at Brown University. RI: Providence.
Villegas, A. M., & Lucas, T. (2002). Preparing culturally responsive teachers: rethinking
the gap. Journal of Teacher Education. 53, (1), 20-32. Voltz, D. L. & Morrow, S. H. (1999). Enhancing collaborative partnerships with
culturally diverse families [Electronic version]. Classroom leadership, 2(7). White-Clark, R. (March/April, 2005). Training teachers to succeed in a multicultural
Climate [Electronic version]. Principal (Reston, Va.), 84(4), 40-44. Wiese, A. (2004). Bilingualism and biliteracy for all? Unpacking two-way immersion at
second grade. Language and Education, 18(1), 69-92. Wiese, A, & Garcia, E. E. (1998). The bilingual education act: Language minority
students and equal educational opportunity [Electronic version]. Bilingual Research Journal, 22(1).
175
Wilde, J. (Last updated October 25, 2006). Resources about assessment and accountability for ELLs: A resource guide from the National Clearinghouse for English Language Acquisition. Washington, DC.: The George Washington University Graduate School of Education and Human Development. Retrieved March 3, 2007. http://www.ncela.gwu.edu/resabout/assessment /intro/# accountability
Wilson VanVoohis, C., & Levonian Morgan, B. (n.d.) Statistical rules of thumb: What
we don’t want to forget about sample sizes. University of Wisconsin: La Crosse. Wu, J., & Bilash, O. (1998). Empowering minority students through bilingual education,
a multifunctional English-Chinese bilingual program in western Canada. Bilingual Research Journal, 22(2, 3, &4), 103-125.
Zwiers, J. (2004-2005). The third language of academic English. Educational
Leadership, 62(4), 60-63.