English Language Learners and Math Achievement: … Language Learners and Math Achievement: ... What...
92
English Language Learners and Math Achievement: A Study of Opportunity to Learn and Language Accommodation Technical Report 702 Jamal Abedi, Mary Courtney, Seth Leon, Jenny Kao, and Tarek Azzam CRESST/UCLA November 2006 National Center for Research on Evaluation, Standards, and Student Testing (CRESST) Center for the Study of Evaluation (CSE) Graduate School of Education & Information Studies University of California, Los Angeles GSE&IS Building, Box 951522 Los Angeles, CA 90095-1522 (310) 206-1532
Transcript of English Language Learners and Math Achievement: … Language Learners and Math Achievement: ... What...
English Language Learners and Math Achievement:
A Study of Opportunity to Learn and Language Accommodation
Technical Report 702
Jamal Abedi, Mary Courtney, Seth Leon,
Jenny Kao, and Tarek Azzam CRESST/UCLA
November 2006
National Center for Research on Evaluation, Standards, and Student Testing (CRESST) Center for the Study of Evaluation (CSE)
Graduate School of Education & Information Studies University of California, Los Angeles
GSE&IS Building, Box 951522 Los Angeles, CA 90095-1522
(310) 206-1532
Copyright 2006 The Regents of the University of California Project 4.2 Validity of Assessment and Accommodation for English Language Learners Jamal Abedi, Project Director The work reported herein was supported under the National Research and Development Centers, PR/Award Number R305B960002, as administered by the Institute of Educational Sciences (IES), U.S. Department of Education. The findings and opinions expressed in this report are those of the author(s) and do not reflect the positions or policies of the National Research and Development Centers, the Institute of Educational Sciences (IES), or the U.S. Department of Education.
TABLE OF CONTENTS
Abstract.................................................................................................................................... 1 Introduction ............................................................................................................................ 2 Literature Review................................................................................................................... 4
What is OTL? .......................................................................................................................4 Measuring OTL ...................................................................................................................4 OTL and Student Achievement ........................................................................................5 Teacher Experience and Knowledge................................................................................6 OTL and ELL Issues............................................................................................................7 Peer and Classroom Ability...............................................................................................8 The Need for OTL Research ..............................................................................................9 Language Factors in the Testing of ELL Students........................................................10 Accommodations ..............................................................................................................12 Objectives ...........................................................................................................................16 Research Questions...........................................................................................................18
Methodology......................................................................................................................... 21 Participants ........................................................................................................................21 The Participating Teachers ..............................................................................................24 Three Levels of Participation...........................................................................................25 Instruments and Measures ..............................................................................................27 Pre-experimental Trials ....................................................................................................28 The Instruments ................................................................................................................28 Data Collection and Procedures .....................................................................................37 Analysis Plan .....................................................................................................................40 Null Hypotheses ...............................................................................................................44
Results.................................................................................................................................... 46 I. OTL / Accommodation / Language Effects On Math Performance .....................46 II. Language Proficiency and Opportunity To Learn ..................................................59 III. Class Participation OTL (Students Observed Sample)..........................................66
Summary and Discussion ................................................................................................... 70 Opportunity to Learn .......................................................................................................70 Validity and Effectiveness of the Test Accommodations............................................72 Opportunity to Learn and Accommodations ...............................................................73 Language Proficiency and Opportunity to Learn ........................................................73 Class Participation & Performance of ELL and Non-ELL Students ..........................74 Implications .......................................................................................................................75 Limitations and Suggestions for Future Research .......................................................76
References ............................................................................................................................. 78

ENGLISH LANGUAGE LEARNERS AND MATH ACHIEVEMENT:
A STUDY OF OPPORTUNITY TO LEARN AND LANGUAGE
ACCOMMODATION1
Jamal Abedi, Mary Courtney, Seth Leon, Jenny Kao, and Tarek Azzam CRESST/ University of California, Los Angeles2
Abstract
This study investigated the interactive effects between students’ opportunity to learn (OTL) in the classroom, two language-related testing accommodations, and English language learner (ELL) students and other students of varying language proficiency, and how these variables impact mathematics performance. Hierarchical linear modeling was employed to investigate three class-level components of OTL, two language accommodations, and ELL status. The three class-level components of OTL were: (1) student report of content coverage; (2) teacher content knowledge; and (3) class prior math ability (as determined by an average of students’ Grade 7 math scores). A total of 2,321 Grade 8 students were administered one of three versions of an algebra test: a standard version with no accommodation, a dual-language (English and Spanish) test version accommodation, or a linguistically modified test version accommodation. These students’ teachers were administered a teacher content knowledge measure. Additionally, 369 of these students were observed for one class period for student-teacher interactions. Students’ scores from the prior year’s state mathematics and reading achievement tests, and other background information were also collected.
Results indicated that all three class-level components of OTL were significantly related to math performance, after controlling for prior math ability at the individual student level. Class prior math ability had the strongest effect on math performance. Results also indicated that teacher content knowledge had a significant differential effect on the math performance of students grouped by a quick reading proficiency measure, but not by students’ ELL status or by their reading achievement test percentile ranking. Results also indicated that the two language accommodations did not impact students’ math
1 We thank CRESST co-director Joan Herman and Professor Alison Bailey for their suggestions for the study’s observation component and CRESST staff member Danna Schacter for her work as project assistant. Dessa Kaye, Joelle Dobrow and Bonny Davison kept the valid data pouring in from the classrooms. Jose Antonio Orozco, Ana Eligia Murcia and Gerardo Luzuriaga collaborated on the Spanish translation of the math test. We are also grateful to Becky, Lea, Cathy, Cynthia, Danna, Ree and Kathy for processing the 100,000+ pages of data for this study. Wade Contreras and Fred Moss contributed their valuable publishing skills. 2 Jamal Abedi is now at the University of California, Davis.
1
performance. Additionally, results suggested that, in general, ELL students reported less content coverage than their non-ELL peers, and they were in classes of overall lower math ability than their non-ELL peers.
While it is understandable why a student’s performance in seventh grade strongly determines the content she or he receives in eighth grade, there is some evidence in this study that students of lower language proficiency can learn algebra and demonstrate algebra knowledge and skills when they are provided with sufficient content and skills delivered by proficient math instructors in a classroom of students who are proficient in math.
Introduction
The inception of the No Child Left Behind (NCLB) Act of 2001 has heightened the national educational agenda’s emphasis on academic achievement. The primary goal of NCLB is to raise the achievement of all students; in other words, to leave no child behind. Consequently, the legislation has mandated reporting for subgroups of students that have traditionally fallen behind (Abedi, 2004). One of these subgroups includes students with limited English proficiency (LEP)3. According to the summary report on the Survey of the States’ Limited English Proficient [LEP] Students, over 4.5 million LEP students were enrolled in public schools during the 2000-2001 school year (Kindler, 2002). LEP students have reportedly grown approximately 105%, while the general school population has only grown 12% (Kindler, 2002). In the state of California alone, approximately 1.6 million, or 25%, of the students are considered English learners (Gándara, Maxwell-Jolly, & Driscoll, 2005). Given the growth of English language learners (ELL students), attention to their educational achievement is not only expected, but very much warranted. Thus, any research that sheds light on their achievement and seeks to improve their learning is beneficial.
Mathematics achievement is a subject area of particular concern in this nation. While the percentage of Grade 8 students scoring at or above “Proficient” in the 2005 National Assessment of Educational Progress (NAEP) grew slightly from the year 2000, it was still only 30% (Perie, Grigg, & Dion, 2005). Seventy-one percent of Grade
3 In this report, we use both limited English proficient (LEP) and English language learner (ELL) to refer to students whose level of English language proficiency is not at a level where they are able to fully participate in an English-only instructional environment. Although we prefer the term ELL as a more positive alternative to LEP, which connotes a deficient or “limiting” condition, LEP is used in legislation and often used in research. In cases where we reference other researchers, we choose to retain their original terminology. Otherwise, we use the term ELL wherever possible.
2
8 ELL students scored “Below Basic” as compared to 30% of non-ELL students (Perie et al., 2005).
ELL students have historically lagged behind their English proficient peers in all content areas. The literature suggests that this performance gap is explained by parent education level, poverty, and the challenge of second language acquisition (Hakuta, Butler, & Witt, 2000; Moore & Redd, 2002). The gap is particularly wide in academic subjects that are high in language demand. Thus, one important challenge in assessing ELL students is knowing whether the language of the test instruments interferes with measuring content knowledge and skills in a reliable and valid way.
It is possible that some annual yearly progress reporting required by NCLB for ELL students may not be valid. While NCLB requires that English learners be tested under accommodated conditions, as necessary, individual states are often left with the decisions of which assessments and accommodations to use. Research findings should be the basis for decisions regarding the choice and use of accommodations. Therefore, for more valid assessments of ELL students, continued accommodation study is essential to determine which accommodations are effective and do not compromise assessment validity. Similarly, while it is critical that ELL students receive appropriate accommodations to ensure that assessment outcomes accurately reflect what they know and can do, it is also necessary to examine whether these students have had adequate opportunity to learn the material they are being tested on.
Some education advocates have argued that determining whether students have had adequate exposure to learning is a necessary prerequisite to interpreting test scores. For instance, Starratt (2003) argued that an accountability system that fails students is a system that needs to first address the issue of opportunity to learn. He argued that when English learners “fail,” they are actually being victimized by the accountability agenda. Starratt contended that the education community needs to make sure students have had adequate opportunity to learn for fear of making unjust judgments about their performance.
Our study therefore seeks to explore both whether ELL students have had similar opportunity to learn as their non-ELL peers and how student performance might differ between two types of language-related accommodation on a math test. By comparing student performance on accommodated test versions, surveying the content of algebra classes, surveying the use of two language-related
3
accommodations, measuring the content knowledge of teachers, and examining prior math ability at the classroom level, we hope to discern some modifiable reasons for performance differences. The following review of literature will first discuss the concept of opportunity to learn, then the use of testing accommodations for ELL students.
Literature Review
What is OTL?
Opportunity to learn (OTL) was coined by John Carroll in the early 1960s, and was initially meant to indicate whether students had sufficient time and received adequate instruction to learn (Carroll, 1963; Tate, 2001). Over the decades, escalating demands for accountability and higher standards of student performance have led to renewed interest in the concept, encouraging researchers to expand conceptual frameworks beyond time and quality of instruction (Brewer & Stacz, 1996; McDonnell, 1995; Porter, 1991; Smithson, Porter, & Blank, 1995; Stevens, 1996).
In their review of literature, Stevens, Wiltz, and Bailey (1998) identified four OTL variables most prevalent in research: content coverage, content exposure, content emphasis, and quality of instructional delivery. Content coverage, which has been used most often as an indicator for OTL, refers to the actual coverage of core curriculum specific to a particular grade level or subject area. Content exposure refers to the amount of time teachers allocate to covering the content. Content emphasis refers to the emphasis given to certain topics that are part of the core curriculum. Quality of instructional delivery refers to how teachers present lessons that enable students to understand what is being taught. In preparation for the present study, pilot research explored student participation and teacher-student interaction as aspects of OTL (Abedi, Herman, Courtney, Leon, & Kao, 2004). Other researchers have also included attention to instructional strategies and quality of instructional resources, which refer to both materials and teacher preparation (Herman, Klein, & Abedi, 2000).
Measuring OTL
A recent review of instrumentation literature (Colker, Toyama, Trevisan, & Haertel, 2003) revealed that common OTL measurement tools include teacher/student surveys; teacher logs; classroom observation/taping; analysis and ratings of class behaviors, teacher assignments, curriculum/resources/lesson plans;
4
and archival data. Questionnaires and surveys appear to be the most common means of probing OTL (Collie-Patterson, 2000; Firestone, Camilli, Yurecko, Monfils, & Mayrowetz, 2000; Gamoran, Porter, Smithson, & White, 1997; McDonnell, Burstein, Ormseth, Catterall, & Moody, 1990; Muthen et al., 1995; Snow-Renner, 1998; Yoon & Resnick, 1998; Winfield, 1993).
As Colker et al. (2003) noted, however, there has been a movement away from simply measuring instructional strategies, and instead, an increasing concern over how instruction shapes cognitive demand. Subsequently, recent research on instructional content also probes level of cognitive demand (Porter, 2002). Such research expands the notion of OTL into a deeper construct.
OTL and Student Achievement
Studies on OTL have found a positive relationship between curriculum and student achievement, particularly with curricula that require higher-level skills (Wiley & Yoon, 1995). Gau (1997) examined the distribution and the effects of OTL (teachers’ mathematical knowledge, content level of instruction, and school math resources) on mathematics achievement by drawing data from the National Education Longitudinal Study of 1998. Results revealed that various kinds of opportunities to learn mathematics are associated with student mathematics achievement, and opportunities are unequally distributed among different categories of schools.
Another study on OTL and mathematics achievement (Collie-Patterson, 2000) involved Grade 12 students from six public and six private schools in New Providence, Bahamas. Four components of OTL were examined: teacher, student, school, and classroom characteristics. A significant relationship between the first three components and OTL were found. The fourth component, classroom characteristics, was not related to OTL, but all four were significantly related to mathematics achievement.
In a study using data from the Third International Mathematics and Science Study (TIMSS), Webster, Young, and Fisher (1999) examined 13-year-old students from Australia, Canada, England, and the United States, and found that in all four countries, the more exposure students have to learning, the more successful they were likely to be on assessments. This suggests that reduced OTL leads to poorer test performance. Wang and Goldschmidt (1999) confirmed this among 2,443 middle school immigrant and other LEP students. In examining math achievement and
5
growth over three years, results indicated that being in less demanding courses coincided with poorer performance.
Furthermore, differential opportunities have been found in regards to content topics. Studies have found that some classes had more access to some content topics than others (Herman & Klein, 1996; Snow-Renner, 1998, 2001). Findings from the TIMSS revealed a fragmented curriculum across the United States (Schmidt, Houang, & Cogan, 2002; Schmidt & McKnight, 1997). These suggested that other countries may have higher mathematics achievement as a result of having more focused and coherent curriculum.
Teacher Experience and Knowledge
Teachers play a central role in students’ learning. Hill, Rowan, and Ball (2005) noted that researchers often measured teachers’ knowledge with proxy variables, such as courses taken, degrees attained, or results from basic skills tests.
Past research showed disproportionate numbers of minority students with mathematics teachers who have less than three years teaching experience (Gross, 1993). Additionally, there seemed to be a political process determining what teachers are assigned to which classrooms, and a tendency for less experienced teachers to end up with lower-level math classes (Gross, 1993; Oakes, 1992)—classes where many ELL students tend to be concentrated.
Analyses of fraction instruction in 21 elementary school classrooms signaled the importance of teachers’ knowledge for problem-solving curricula to be beneficial (Gearhart et al., 1999). Goertz (1994) found that Grade 8 mathematics teachers who have participated in at least 16 hours of in-service training in math or in the teaching of math are more likely to report using non-traditional instructional practices.
Gau (1997) found mixed results when correlating teachers’ math knowledge with student achievement. While their mathematics degree level was positively related to student achievement, time spent on professional development was negatively related. In the area of teacher certification, there is ongoing debate on the effect on learning of different certification types and teachers with subject-specific training (see Darling-Hammond, Berry, & Thoreson, 2001; Goldhaber & Brewer, 2000, 2001). Boscardin et al. (2005) however, found a significant positive relationship between teacher expertise and student performance in English and algebra. Teacher expertise was defined specifically as expertise and knowledge within content areas
6
covered in the standards and the district assessments, rather than overall expertise in the subject area.
Hill et al. (2005) cautioned against using teacher experience and degrees attained as a proxy for teachers’ knowledge, citing that they do not adequately reflect teacher knowledge. Hill and colleagues therefore developed an instrument to measure teachers’ mathematics content knowledge, specifically knowledge for teaching (Hill, Schilling, & Ball, 2004). They argued that previous research on teacher content knowledge is not yet sufficient for the area of mathematics. However, previous research does distinguish between knowledge of content versus knowledge of curriculum (or lesson structure). Consequently, their instrument sought to fill this gap in research, and part of their middle school instrument was utilized in the present study. Using this instrument, Hill et al. (2005) found that teachers’ mathematical content knowledge for teaching positively predicted first- and third-grade students’ mathematics achievement gains. The authors contended that such findings have practical implications for professional development.
OTL and ELL Issues
In a four-year project locating and analyzing schools with exemplary science and mathematics programs for middle school LEP students, Minicucci (1996) found that these schools gave LEP students access to stimulating science and mathematics curricula with instruction in either the students’ primary language or in English using sheltered language techniques. This suggested that concepts of reform in curriculum and instruction can be effectively used with LEP students in learning science and English, and help overcome barriers in teaching them science and math.
In our pilot study (Abedi et al., 2004) we observed that, as compared with their non-ELL peers, English language learners spoke less often in algebra class and were less often called on by teachers. As part of a research project on English learners’ academic achievement, Boscardin, Aguirre-Muñoz, Chinen, Leon, and Shin (2004) queried teachers’ level of content coverage in language arts. Results indicated that higher levels of content coverage in both writing and literary analyses were associated with higher performance for all students, including English learners, in a Grade 6 language arts assessment.
An article serving as practical recommendations for educators argued that students’ actual level of English proficiency has an enormous impact on their opportunity to learn (Williams, 2001). Since academic language takes even longer to
7
learn than survival English, Williams made specific suggestions on how teachers in of all subjects can help their ELL students: draw connections between similar cognates in English and Spanish for Spanish-speaking students; use scaffolding with visual imagery; emphasize written skills as much as oral skills; read aloud every day; avoid idioms; speak clearly; promote diversity; and avoid making assumptions about student understanding.
Among ethnic minority students in general, studies have consistently found poorer performance in mathematics achievement (Gross, 1993; Kim & Hocevar, 1998). Ethnic minority students also tend to have less social capital, and the relationship between OTL and socioeconomic disadvantages has been addressed in the literature (English, 2002; Kozol, 1992; Lubienski & Shelley, 2003; Thompson, 2002). Ethnic minority students often have less exposure to instruction and receive less content coverage (Masini, 2001). Past research has found dramatic under-representation in higher-level math courses, and over-representation in lower level mathematics courses among ethnic minority students (Gross, 1993; Oakes, 1990, 1992). Gross (1993) noted that teachers of low-ability classes tend to emphasize drill and practice, rather than higher-thought processes, which are emphasized by teachers of high-ability courses. Gamoran et al. (1997) found lower mathematics achievement among high school students in general track classes as compared to those in college-preparatory classes. It seems that the practice of ability grouping and tracking denies students opportunities to learn. This impact could be further compounded for students who are ELL, who tend to be channeled into less demanding courses (Wang & Goldschmidt, 1999).
Peer and Classroom Ability
As aforementioned, there is a tendency for teachers with less experience to be assigned to lower-level classrooms (Gross, 1993; Oakes, 1992), and for ELL students to be channeled into such courses (Wang & Goldschmidt, 1999), and for teachers of low-ability classes to emphasize drill and practice rather than higher-thought processes (Gross, 1993). This can have implications for students’ level of opportunity to learn and is important to consider when grouping students into classrooms based on ability.
A study in England found that higher-performing secondary school students make more progress in mathematics when grouped with peers of similar ability,
8
while students of lower ability make more progress in mixed-ability classes (Ireson, Hallam, Hack, Clark, & Plewis, 2002).
However, the practice of grouping students into classrooms by their “ability” has not been without controversy (Rubin & Noguera, 2004). Oakes (1992) criticized ability grouping—also referred to as tracking—for its effectiveness and equity. Higher-performing students may benefit from the grouping, but lower-ability students are receiving the same curriculum at a slower speed, so that they are perpetually trying to “catch up.” Critics argued that the practice of tracking has led to inequity since specific racial, ethnic, and economic groups tend to be relegated to the lower tracks (Rubin & Noguera, 2004).
Related to this concept is classic social development theory. Vygotsky (1978) believed that learning occurred through social interaction. In other words, according to Vygotsky, a student is more likely to achieve a task “in collaboration with more capable peers” (p. 86) than alone. When considering the practice of ability grouping, Vygotsky’s theory comes to mind, and one might contemplate the relationship between such a practice and students’ level of opportunity to learn.
The Need for OTL Research
Researchers of OTL have argued for the use of OTL as a research concept for standards based-reform (Fritzberg, 2001; Guiton & Oakes, 1995; McDonnell, 1995; Porter, 1995; Ysseldyke, Thurlow, & Shin, 1995). The attention to OTL has prompted researchers to seek methods of improving learning opportunities (Fritzberg, 2001; Gau, 1997) with some specifically focusing on mathematics achievement (Tate, 1995; Wood, 2001).
Herman et al. (2000) suggested that OTL data can serve as an indicator for progress, verify that students from diverse backgrounds have had the same level of opportunity to meet expected standards, and provide feedback to schools on curricula, course offerings, materials, and resource allocation. Porter (1993) outlined three possible uses of OTL standards: (a) to serve as a basis for school-by-school accountability; (b) to provide an indicator system; and (c) to present a clearer vision of challenging curriculum and pedagogy. Schwartz (1995) suggested areas in which OTL strategies can be implemented: access to courses, curriculum, extra time, teacher competence, school resources, school environment and culture, and ancillary services. The general consensus is that assessing students’ opportunity to learn can also give insight into differences prevalent in student achievement.
9
Despite the array of studies and reports on OTL, there seems to be a dearth of those focusing specifically on English language learners. Previous reports concerning ELL students often discussed equal educational opportunities in terms of civil rights and having equal access to instruction and services (Serpa, 2001; Short, 2000). Additionally, other articles discussing increasing learning opportunities for ELL students are non-research-oriented and serve as practical recommendations for educators (Padron, 1999; Stanford Working Group, 1993; Williams, 2001).
Research on English language learners is especially pertinent as the ELL population continues to increase rapidly. Consequently, any research seeking to improve the quality of teaching and learning for ELL students is advantageous. Based on the lack of ELL-related studies on OTL, we were interested in exploring this avenue. However, we recognize that ELL students come into the classroom with an inherent disadvantage—lack of English language proficiency. One could argue that this reduces their learning opportunities from the start. However, OTL variables such as content coverage and quality of instructional delivery are external and controllable. Therefore, teaching approaches and classroom practices can be amended to meet the needs of ELL students. Consequently, investigating whether ELL students receive the same opportunity to learn as their non-ELL counterparts can potentially contribute to improving classroom practices.
Language Factors in the Testing of ELL Students
Given the climate of heightened accountability in education, researchers have contended the importance of both language and cultural factors in the testing of ELL students (Geisinger, 2003; Solano-Flores & Trumbull, 2003; Tippeconnic & Faircloth, 2002). The Standards for Educational and Psychological Testing underscored that for “all test takers, any test that employs language is, in part, a measure of their language skills” (American Educational Research Association [AERA], American Psychological Association [APA], & National Council on Measurement in Education [NCME], 1999, p. 91). Thus, if certain students have not yet sufficiently acquired language skills, they may not be able to adequately demonstrate their knowledge in a content-based assessment.
Research has suggested that language factors that are unrelated to the construct being measured could affect the validity of assessments, particularly for English language learners (Abedi, 2002; Abedi, Leon, & Mirocha, 2003). This may partly explain why there are persistent achievement gaps between ELL students and their
10
non-ELL counterparts. In their review of research, Abedi, Hofstetter, and Lord (2004) found that students’ language background is highly related to test performance. In particular, experimental studies conducted at CRESST have demonstrated that (1) ELL test scores are substantially lower than those of non-ELL students; and (2) the linguistic complexity of test items may threaten the validity and reliability of contest-based assessments, particularly for ELL students (Abedi, 2002; Abedi & Hejri, 2004; Abedi & Lord, 2001).
Studies have suggested that ELL students have more difficulty responding to test items that are linguistically complex (Abedi & Lord, 2001). Students may have trouble interpreting vocabulary, or misinterpret words literally (Duran, 1989; Garcia, 1991). They may also perform less well on tests because they read more slowly (Mestre, 1988). Additionally, there is a distinction between basic interpersonal communications skills (BICS) and cognitive academic language proficiency (CALP) (Bailey & Butler, 2003; Cummins, 2000). Students may score high in BICS, but low in CALP. Some researchers have argued that it takes five to seven years before an English language learner acquires adequate CALP (Cummins, 1984, 1989). Researchers contend that academic success requires sufficient academic language proficiency (Bailey & Butler, 2003).
Imbens-Bailey and Castellon-Wellington (1999), in their analyses of mathematics and science subsections of third- and eleventh-grade standardized content assessments, found that two-thirds of the items included general vocabulary considered uncommon or used in an atypical manner. One-third of the items included complex or unusually constructed syntactic structures. To accurately assess knowledge within content areas, students must comprehend what the items are asking and understand the response choices. The purpose of content-based standardized achievement tests is to measure students’ knowledge of specific content areas, not to test non-content vocabulary.
The linguistic complexity of test items, as a source of construct-irrelevant variance, may affect the construct validity of assessments (Abedi, 2006; Haladyna & Downing, 2004; Messick, 1994). The Standards for Educational and Psychological Testing noted: “Test use with individuals who have not sufficiently acquired the language of the test may introduce construct-irrelevant components to the testing process…Therefore it is important to consider language background in developing, selecting, and administering tests and in interpreting test performance.” (AERA, APA, & NCME, 1999, p. 91). Studies have shown that reducing the unnecessary
11
linguistic complexity of test items helps improve the performance of ELL students without compromising the validity of the assessment (Abedi & Lord, 2001; Abedi, Lord, Hofstetter, & Baker, 2000; Kiplinger, Haug, & Abedi, 2000; Maihoff, 2002). Reducing unnecessary linguistic complexity is a form of testing accommodation, also referred to as linguistic modification.
Accommodations
Testing accommodations, or simply accommodations, are meant to assist students of specific limitations in order to “level the playing field” with mainstream students. Accommodations are strategies intended to reduce threats to validity of test scores. In the case of ELL students, whose limitations are with language, accommodation strategies that address their specific needs can help make tests more fair for them. Students’ performance in content-based assessments, such as mathematics and science, can be confounded by language, which is considered irrelevant to the construct. In other words, a test should gauge their knowledge of the content, not their language ability. Accommodations can help ELL students demonstrate their content knowledge by reducing the confounding of language. Accommodations are not intended to give ELL students an unfair advantage over students not receiving accommodated assessments (Abedi, Courtney, & Leon, 2003a; see also Abedi, Hofstetter, & Lord, 2004 for more information on accommodations for ELL students).
Accommodations can either refer to specific modifications to the test itself, or modifications to the test procedure. For example, modifications to a test may include:
• assessment in the students’ home language
• modification of linguistic complexity
• embedding glossaries into the test for non-content vocabulary
Modifications to the test procedure include:
• allowing extended time for the test
• having the test administrator read directions aloud
• allowing administration by a familiar test administrator
(Rivera, Stansfield, Scialdone, & Sharkey, 2000).
12
Accommodation research has not always yielded positive results. For instance, providing translated assessments can introduce other complications (Hambleton, 2001). Some accommodations may actually provide an unfair advantage to those not receiving one. Furthermore, accommodations must not only be effective and valid, they must also be feasible. Abedi, Courtney, Mirocha, Leon, and Goldberg (2005) found that bilingual dictionaries were cumbersome and not always useful to students, and that commercially-published English dictionaries sometimes provided information on what the test was asking students to recall. Brown (1999) found no significant differences when offering students two different test versions (original and “plain language”). Consequently, research that identifies accommodations that are effective, valid, and feasible is needed.
Below we describe two language-related accommodation strategies that involve modifications to the test, and are investigated in the present study: (a) dual-language test versions; and (b) linguistic modification.
Dual-language Test Versions. One method of accommodation is administering assessments in students’ home language. However, there are many concerns over the use of native language testing. Namely, translating a test can make the instrument easier or harder in another language, and some cultural phrases and idioms can be difficult to translate (Hambleton, 2001). Solano-Flores, Trumbull, and Nelson-Barber (2002) contended that test translation suffers from serious theoretical, methodological, and practical limitations relating to culture and word sensitivity. They suggested developing assessments in two language versions concurrently. Other researchers have examined the use of dual-language tests, which involves test booklets that contain original English items with corresponding items translated in students’ home language, such as on facing pages.
Duncan, del Río Parent, Chen, Ferrara, and Johnson (2002) found that Spanish-speaking LEP students appreciated having dual-language booklets. Their study involved approximately 400 eighth-grade students from 10 schools with high Latino populations. Eighth-grade mathematics test items from NAEP were translated into Spanish by translators who were mathematics assessment experts and were familiar with Latino cultures. The dual-language test booklet contained Spanish versions of test items on the left-hand pages, and English versions of the items on the right-hand pages. Quantitative analyses indicated psychometric equivalence between the dual-language and English-only test booklets. During focus group sessions (n=68), Spanish-speaking students reported that it was helpful to have both languages on
13
one page to use as a comprehension check. Students felt that they were better able to demonstrate what they knew by having the questions available in two languages. Eighty-five percent of students responding to a questionnaire reported the dual-language test as being “useful” or “very useful.” Furthermore, students given the dual-language test booklet preferred the dual-language format over a Spanish-only format, and strongly preferred the dual-language format over having an English-only test booklet with a bilingual dictionary. However, despite the preference, no differences in test performance were detected (see also Duncan et al., 2005).
Sireci and Khaliq (2002) explored psychometric properties of a dual-language version of a fourth-grade mathematics test, which was given as part of a state-mandated testing program. To allow for greater confidence in drawing conclusions, multiple statistical methods were applied to evaluate the equivalence of English and English-Spanish versions of a statewide mathematics assessment. Results suggested slight structural differences across the two versions of the test, which may be in part because of the performance differences of the studied groups. The authors asserted that use of dual-language test booklets deserves further study.
Linguistic Modification. Linguistic modification of test items can be defined as modifying the language of the test text to reduce linguistic complexity while maintaining the construct of the test. Other researchers refer to this as linguistic simplification4 (Rivera & Stansfield, 2004). Assessments that are linguistically modified may facilitate students’ negotiation of language barriers. This may be accomplished by shortening sentences, removing unnecessary expository material, using familiar or frequently used words, using grammar considered more easily understood (such as present tense) and using concrete rather than abstract formats (Abedi, Lord, & Plummer, 1997). See Appendix C for a description of linguistic features that may affect comprehension.
The LEP Consortium of the Council of Chief State School Officers (CCSSO) State Collaborative on Assessment and Student Standards gave seven recommendations for improving accessibility of text material (Kopriva, 2000). Table
4 We recognize the term “linguistic simplification” used by other researchers in the literature. However, we prefer the term “linguistic modification” since “simplification” can have the connotation of “dumbing down” a test. We contend that the linguistic structures of test items are not necessarily simplified, but rather, modified to reduce or eliminate factors that can interfere with comprehension and are irrelevant to the construct. Sometimes, modified test items can contain more words and/or sentences than the original items, in order to reduce the number of complex linguistic features.
14
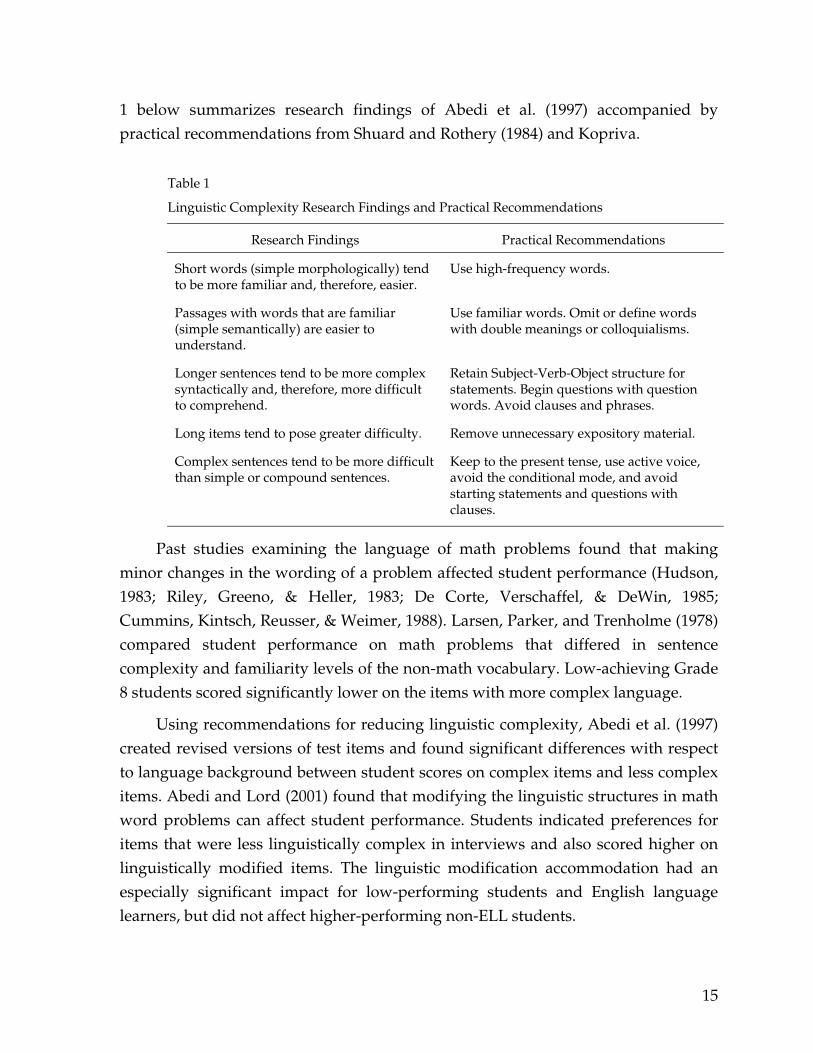
1 below summarizes research findings of Abedi et al. (1997) accompanied by practical recommendations from Shuard and Rothery (1984) and Kopriva.
Table 1
Linguistic Complexity Research Findings and Practical Recommendations
Research Findings Practical Recommendations
Short words (simple morphologically) tend to be more familiar and, therefore, easier.
Use high-frequency words.
Passages with words that are familiar (simple semantically) are easier to understand.
Use familiar words. Omit or define words with double meanings or colloquialisms.
Longer sentences tend to be more complex syntactically and, therefore, more difficult to comprehend.
Retain Subject-Verb-Object structure for statements. Begin questions with question words. Avoid clauses and phrases.
Long items tend to pose greater difficulty. Remove unnecessary expository material.
Complex sentences tend to be more difficult than simple or compound sentences.
Keep to the present tense, use active voice, avoid the conditional mode, and avoid starting statements and questions with clauses.
Past studies examining the language of math problems found that making minor changes in the wording of a problem affected student performance (Hudson, 1983; Riley, Greeno, & Heller, 1983; De Corte, Verschaffel, & DeWin, 1985; Cummins, Kintsch, Reusser, & Weimer, 1988). Larsen, Parker, and Trenholme (1978) compared student performance on math problems that differed in sentence complexity and familiarity levels of the non-math vocabulary. Low-achieving Grade 8 students scored significantly lower on the items with more complex language.
Using recommendations for reducing linguistic complexity, Abedi et al. (1997) created revised versions of test items and found significant differences with respect to language background between student scores on complex items and less complex items. Abedi and Lord (2001) found that modifying the linguistic structures in math word problems can affect student performance. Students indicated preferences for items that were less linguistically complex in interviews and also scored higher on linguistically modified items. The linguistic modification accommodation had an especially significant impact for low-performing students and English language learners, but did not affect higher-performing non-ELL students.
15
Studies using items from NAEP compared student scores on actual NAEP items with parallel modified items in which the math task and math terminology were retained but the language was simplified. One study (Abedi, Lord, & Hofstetter, 1998) of 1,394 Grade 8 students in schools with high enrollments of Spanish speakers showed that modification of the language of the items contributed to improved performance on 49% of the items; the students generally scored higher on shorter problem statements. Another study (Abedi et al., 2000) tested 946 Grade 8 students in math with different accommodations including modified linguistic structures, provision of extra time, and provision of a glossary. Among the different options, only the linguistic modification accommodation narrowed the score gap between ELL and non-ELL students.
Another study (Abedi & Lord, 2001) of 1,031 Grade 8 students found small but significant score differences of students in low- and average-level math classes. Among the linguistic features that appeared to contribute to the differences were low-frequency vocabulary and passive-voice verb constructions (see Abedi et al., 1997, for discussion of the nature of and rationale for the modifications).
Abedi et al. (2003a) investigated 1,854 Grade 4 students and 1,594 Grade 8 students from 40 school sites using NAEP science items. Although no performance differences were seen in Grade 4 for the linguistic modification accommodation, differences were seen for Grade 8. The linguistically modified test version increased the performance of ELL students, but did not affect the performance of non-ELL students given the same accommodation.
Other studies have also employed language modification of test items. Rivera and Stansfield (2001; 2004) compared student performance on regular and simplified Grades 4 and 6 science items. Although the small sample size did not show significant differences in scores for ELL students, the study did demonstrate that linguistic simplification did not affect the scores of non-ELL students, indicating that linguistic simplification is not a threat to score comparability.
Objectives
The literature summarized above suggests that there is much need to examine the teaching and learning of English language learners, especially in the area of mathematics achievement. As discussed earlier, ELL students may not be able to adequately demonstrate their knowledge in content-based assessments because of language limitations. Providing testing accommodations gives them the ability to
16
demonstrate their knowledge; however, accommodations must be rigorously examined for validity and effectiveness.
Furthermore, it is imperative that we first determine whether ELL students have had adequate opportunity in the classroom to learn the content they are being measured on before interpreting test scores. Specifically, content coverage, teacher content knowledge, and classroom groupings by prior ability are areas worthy of investigation. Although much research and discussion exists on the concept of opportunity to learn, little exists that focus specifically on English language learners. The present study seeks to fill this gap in the literature.
The goals of this study, therefore, were to examine English language learners and other lower language ability students and their more fluent peers in Grade 8 algebra classes:
• to measure teacher content knowledge, course content OTL and prior math ability at the classroom level;
• to compare the effect on math performance of three class-level OTL measures: content coverage, teacher content knowledge, and prior math ability;
• to compare any OTL effects on ELL and non-ELL students, as well as on students of varying levels of English language proficiency;
• to survey course content and examine the instruction of ELL students in classrooms representing a range of ELL density;
• to consider the links between instruction and assessment and the role of accommodation in each;
• to further identify language-related accommodations that reduce the performance gap between ELL and non-ELL students without altering the construct being measured;
• to examine these language-related accommodations’ relationship with OTL
• to examine the validity of these two language-related accommodations for their use in large-scale assessments;
17
The design of this study was informed by findings from earlier CRESST accommodation studies. The results of these studies on accommodations suggested the following:
1. Translation of assessment into students’ home language did not help in reducing the performance gap between ELL and non-ELL when the students’ home language was not the language of instruction (Abedi, Lord, & Hofstetter, 1998).
2. The use of an English dictionary raised concerns over the validity of accommodation since recipients of dictionary accommodations had the advantage of having access to content-related terms. In addition to validity concerns, there were feasibility issues in using a dictionary as a form of accommodation (Abedi, Courtney, Mirocha, Leon, & Goldberg, 2005).
3. The use of a glossary of non-content terms raised the performance level of ELL students only when extra time was also allotted (Abedi, Lord, Hofstetter, et al., 2000).
4. The use of a customized dictionary (presenting the dictionary definitions of non-content terms) helped ELL students’ performance (Abedi, Lord, Boscardin, & Miyoshi, 2000).
5. Among the accommodations tested, the linguistic modification of test items was the most effective accommodation in reducing the performance gap between ELL and non-ELL students without altering the construct being measured (Abedi et al., 1998; Abedi, Lord, Hofstetter, et al., 2000; Abedi, Courtney, & Leon, 2003b).
The results of our pilot study on math content OTL and student participation OTL for ELL students (Abedi, Herman, Courtney, Leon, & Kao, 2004) suggest:
1. ELL students reported less opportunity to learn than non-ELL students, even when they were in the same classroom.
2. Even when controlling for initial math ability, classroom self-reported OTL was related to performance on a standards-based test.
3. ELL students’ level of participation in class (measured by the number of times they raised their hands) was less than non-ELL students. Even when they raised their hands, they did not get their teacher’s attention as often.
Research Questions
This study was guided by several research questions. They can be grouped into these broad categories:
18
• questions on the three class-level components of opportunity to learn (OTL)—as indicated by measures of content coverage, teacher content knowledge and student prior math ability—and the impact of OTL on math performance for ELL and non-ELL students and students of varying language proficiency;
• questions related to the validity and effectiveness of the two test accommodations, and the relationship between the accommodations and math performance, and OTL for ELL and non-ELL students and students of varying language proficiency; and
• questions on the levels of class participation of ELL and non-ELL students and any relationship with test performance (Students Observed sample).
The research questions relating to ELL students and their non-ELL classmates are also analyzed by a grouping system that divides student participants into other categories. We refer to them as students with “varying language proficiency” which is explained in the next section.
The questions are:
I. OTL /Accommodation/Language Proficiency Effects
1. Do the three class-level components of OTL impact students’ math performance?
2. Do the three class-level components of OTL differentially impact the math performance of students with varying language proficiency?
3. Do the dual-language test version and linguistic modification accommodations improve students’ math performance?
4. Do the dual-language test version and linguistic modification accommodations differentially impact the math performance of students with varying language proficiency?
5. Do the three class-level components of OTL differentially impact students who received the dual-language test version accommodation?
6. Do the three class-level components of OTL differentially impact students who received the linguistic modification accommodation?
II. Language Proficiency and Opportunity to Learn
7. Do students of varying language proficiency receive the same level of OTL?
19
a. Do ELL students receive the same level of OTL as compared to non-ELL students?
b. Do students who scored lower on the TIMER test receive the same level of OTL as compared to students who scored higher on the TIMER test?
c. Do students in the lower CAT/6 reading percentile ranking receive the same level of OTL as compared to students in the higher CAT/6 reading percentile ranking?
III. Class Participation OTL (Students Observed Sample)
8. Are there any differences between ELL and non-ELL students in the level of class participation/teacher-student interaction?
9. Is there a relationship between students’ class participation and their math performance?
20
Methodology
Participants
A total of 21 rural and urban schools in the southern half of California participated in the study between February and July 2005. Each of the schools in the sample followed a curriculum that required algebra study in Grade 8 and enrolled a large number of ELL students. In these schools, 51 teachers and one to two classes of their students participated in the study. In the 98 algebra classes tested, there were 2,367 Grade 8 students who took the math test. Grade 8 students were chosen because Grade 8 participates in NAEP assessments.
A large sample of ELL students with their non-ELL classmates was needed because the sample not only would be divided into comparison groups by ELL status, but would be further broken down by which version of the algebra test was taken. In order to feasibly collect data from a sample large enough for the desired hierarchical linear modeling (HLM) analysis methods, schools with large populations of ELL students in Grade 8 were recruited for the study.
The participating schools enrolled low and medium socioeconomic status (SES) students with many Grade 8 ELL students who spoke Spanish as their home language. The non-ELL5 population at the schools possessed similar background characteristics. Eligibility for free or reduced lunch program was used as a proxy for determining SES. The lunch program data indicated that more than three-fourths of the student body qualified for a free or reduced lunch in all but three of the participating schools. Table 2 presents Hispanic ethnicity, English learner, and school lunch program participation percentages in the schools that participated in the study.
School, teacher, and student participation was strictly voluntary. A maximum of two classes per teacher could participate in the study. Classes with high, medium, and low enrollments of ELL students were selected so that a variety of classes could be represented. Selection of observed classes was random. A single classroom observation could take place in one of a teacher’s participating classes. Only one teacher declined an observation when asked.
5 The English-only (EO) students, initially fluent English proficient (IFEP), and the re-designated fluent English proficient (RFEP) students are referred to as non-ELL students.
21
Table 2
Hispanic Ethnicity, English Learner, and Lunch Program Participation Percentages in Participating Schools (Fall 2004 Data)
Participating school
Grade span
Enrollment (to nearest hundred)
Hispanic ethnicity %
English learners %
Lunch program participation %a
1 6-8 2,900 94.3 45.6 88.2
2 6-8 2,100 90.6 38.2 86.2
3 6-8 2,500 65.9 47.9 87.3
4 6-8 1,500 58.2 34.4 77.7
5 6-8 1,600 79.8 43.5 78.7
6 6-8 1,700 47.8 14.6 44.0
7 K-8 500 87.1 37.6 87.4
8 6-8 2,000 57.9 21.2 69.8
9 6-8 1,300 77.4 43.5 77.7
10 4-12 1,800 34.4 8.3 37.8
11 6-8 3,000 88.3 59.0 96.5
12 6-8 2,200 97.1 45.1 81.5
13 6-8 2,600 82.0 50.8 85.4
14 K-8 2,200 87.4 61.4 90.9
15 6-8 1,300 91.8 61.2 85.5
16 6-8 1,000 93.9 61.5 93.5
17 6-8 800 93.4 59.5 77.9
18 6-8 700 95.2 46.0 82.2
19 6-8 1,000 88.9 35.9 92.1
20 6-8 1,000 87.4 48.2 100.0
21 7-8 700 86.4 25.3 84.5
a Lunch program percentage based on unofficial enrollment total figures used for free and reduced price meal calculations.
22
Of the total sample of 2,367 students, 50.2% were female and 49.8% were male (gender data missing for 82 students). When asked which languages they spoke before they started going to school, 62.5% of the students chose Spanish as one of their home languages. The information gathered from school student data revealed that 712 (31.9%) were ELL and 1520 (68.1%) were non-ELL. The data on 135 students’ level of English language development (ELD) was missing. On average, there were 24 students per classroom on the day that math tests were administered.
Classes varied in the percentage of ELL students enrolled and gender balance. A 3 x 2 Chi Square analysis revealed that this was a significant difference, x2 (2, N = 2,285) = 10.77, p = .005. When the sample of classes was grouped by percentage of ELL students into three clusters of classes, the result (Table 3) shows that in classes with fewer ELL students per class, there were more females enrolled. This suggests that more of the females in our sample of Grade 8 algebra classes had been re-designated as English proficient or had begun their schooling as proficient in English.
Table 3
Gender Frequency by ELL Composition of Class
Class Composition Males Females Totals
66% or more ELL students 15.6% (178) 11.5% (132) 20.9% (478)
33 to 66% ELL students 27.9% (317) 26.3% (302) 34.2% (782)
Fewer than 33% ELL students 56.5% (643) 62.2% (713) 44.9% (1025)
Total 100.0% (1138) 100.0% (1147) 100.0% (2285)
Note. There are 82 missing cases where gender was not in the school records.
Participating students’ scores from the California Achievement Tests, Sixth Edition (CAT/6), a norm-referenced test, were accessed for their prior school year in Grade 7, in the reading and math subject areas. For the students included in the analysis of the total sample, the score means grouped by ELL status are presented in Table 4.
23
Table 4
Student Participants’ Grade 7 CAT/6 Reading and Math Performance by ELL Status
CAT/6 Reading CAT/6 Math ELL status
Mean N SD Mean N SD
Non-ELL 41.9259 1360 24.35159 42.5449 1356 24.11797
ELL 20.1893 648 16.31586 22.3243 642 20.32207
Total 34.9113 2008 24.30384 36.0476 1998 24.82836
Note. Not all students took the CAT/6, so the total numbers are less than 2,367. Any ELD Level 1 students were very likely exempt from taking the CAT/6.
Nearly 30% of the non-ELL students scored in the bottom quartile (below 25th NPR) on the CAT/6 reading assessment. Sixty-four percent of the non-ELL students scored below the national median (50th NPR) on the CAT/6 reading.
The students had fairly stable school enrollment histories, with 53.2% having attended only one elementary school and one middle school or one eight-year elementary school. As for the others, 25.3% had also attended one additional school and 11.7% two additional schools. Those having attended five or more schools made up 9.8% of the sample. Most of the students (87%) had started school in either preschool or kindergarten (288 missing responses). While 75.8% (291 missing responses) reported having lived in the United States all their lives, 81.6% of the students reported that they were born in the United States (291 missing). [In the pilot study, some students explained that they spent some of their early years living with family members in another country.]
Because the total percentage of ethnic Hispanic students in the sample population is greater than 80%, the results of this study may be generalized to similar situations where non-ELL students of Hispanic ethnicity comprise the majority of the comparison group, but may not be generalizable to other situations.
The Participating Teachers
Initially, we planned to only test students from one class per teacher, but it was not feasible to recruit twice as many teacher volunteers in order to have a large enough sample of students for the HLM analyses. Thus, in some cases two of a teacher’s classroom participated in the study. The 51 participating teachers’ had professional teaching experience ranging from 2 to 25-plus years with a continuum
24
of training, credential, and educational backgrounds. Of the participating teachers, 22 had education beyond a bachelor’s degree, 41 had earned a greater-than-temporary teaching credential (out of 50 respondents), and 30 were single-subject math credentialed (out of 48 respondents). More than two-thirds had at least six years of teaching experience, and nearly 60% had at least six years experience teaching ELL students. Of the total respondents, 26 held an undergraduate math degree and 14 had earned a graduate degree in math.
Three Levels of Participation
Student and teacher participants varied in their levels of participation in the study. Figure 1 illustrates the three levels of participation. The total participating students were the 2,367 eighth graders in 98 classes who took the math and reading tests with accommodations. There were 50 of their 51 teachers who completed a
Total number of participants who provided math data Accommodations Tested (100%) n=2,367
Teacher Content Knowledge Measured (98%) n=2321
Students Observed (15.6%) n=369
Figure 1. Divisions in Sample Population
Note: Some non-math data were missing for some students, so sample sizes for each analysis vary from the raw totals listed. The description of each analysis provides the net total sampled.
questionnaire and brief content knowledge test; therefore, we studied a slightly smaller group of students (2,321 eighth graders in 96 classes) when considering their teacher’s math content knowledge. These students’ Grade 7 CAT/6 math and reading performance from the prior year is presented in Table 5 by ELL status.
25
Table 5
Grade 7 CAT/6 Reading and Math Performance for Students Whose Teacher Fully Participated in the Study by ELL Status
CAT/6 Reading CAT/6 Math ELL status
Mean N SD Mean N SD
Non-ELL 41.90 1,333 24.321 42.49 1,329 24.139
ELL 20.24 632 16.342 22.41 626 20.479
Total 34.94 1,965 24.278 36.06 1,955 24.859
Note. Not all students took the CAT/6 so the total numbers are less than 2,321. Any ELD Level 1 students were very likely exempt from taking the CAT/6.
In the course of observing 34 classes in 17 of the schools, we selected at least a dozen students per class to observe in the classroom. This created a smaller participant group. The sample size of observed students decreased when we culled out those students who had not taken the math test (369 remaining). Of these, 51.1% were female and 48.9% were male (gender data missing on 17 students). When asked which languages they spoke before they started going to school, 63.4% of the observed students chose Spanish as one of their home languages.
The information gathered from the school’s student data reveals that 241 (68.7%) observed students were ELL and 110 (31.3%) were non-ELL (ELD data was missing on 18 students). Of the 35 observed classes, 19 contained mostly non-ELL students (0 to 33 percent ELL students), 6 of them contained mostly ELL students (66 to 100 percent ELL students), and 10 were a more even mix of ELL and non-ELL students (34 to 65 percent ELL students).
For the students included in the class observation analyses, Grade 7 CAT/6 reading and math score means, grouped by ELL status, are presented in Table 6.
The school enrollment, starting year, and U.S. residency histories of the students in this smaller sample were representative of the larger population sample.
26
Table 6
Grade 7 CAT/6 Reading and Math Performance for Observed Students by ELL Status
CAT/6 Reading CAT/6 Math ELL status
Mean N SD Mean N SD
Non-ELL 44.25 225 25.088 46.11 224 23.817
ELL 19.77 105 15.384 21.01 107 17.935
Total 36.46 330 25.175 38.00 331 24.999
Note. Not all students took the CAT/6 so the total numbers are less than 369. Any ELD Level 1 students were very likely exempt from taking the CAT/6.
Instruments and Measures
In a 2003 pilot study, we developed and validated instruments to measure OTL content coverage for teacher and student input. At that time we also obtained measures of student-teacher interactions through classroom observation. For details on the pilot study validation of the content OTL measurement instruments as well as the observation outcome, please refer to the CRESST report, Abedi, Herman, Courtney, Leon, and Kao (2004), “Creating and Validating an Instrument for Classroom-Level Opportunity to Learn.” More recently, in a pre-experimental phase of this study, the instruments and protocols were tested, revised, re-tested and validated. One of the most significant revisions was the expansion of the content OTL measure administered to students. It contained less formal language, examples related to the content areas listed, and algebra terminology glossaries on each page.
The 2003 pilot study did not utilize language accommodation in the math testing. A math test word problem in English inherently covers multiple constructs, including math knowledge and English language reading proficiency. To reduce the non-intended construct of measuring English language reading proficiency, the effect of differences in student ability can be reduced by providing an accommodation that specifically addresses language, including the “passive” accommodation of reducing the test item language load. In this way, an assessment better measures subject matter knowledge, such as math ability. Our choices for attempting to reduce language load were a dual-language test version and a linguistically modified test version.
27
Pre-experimental Trials
To help field-test the math and OTL instruments, 13 intact classes of Grade 8 students and their seven teachers at three schools volunteered to participate in pre-experimental testing during the first two months of 2005. Four of these classes participated in two early rounds of class observation. After the protocol was modified, four classes at another school volunteered for one class observation each. For purposes of validating the math test, one of these classes consisted of high-achieving, high-SES, non-ELL students, and four other classes consisted of above-average to high-achieving non-ELL students (many initially fluent or re-designated as fluent in English) in a low-SES school. Data from the pre-experimental sample of students and teachers are not included in the analyses described in this report.
The Instruments
The instrument packets, observation protocols and school data collection were part of ten measures based on data from a variety of instruments and protocols, which are listed here in brief:
•
•
•
•
•
•
•
•
Math Performance Measure: Measured student performance in pre-algebra and early algebra; the three test forms measured a dual-language test version accommodation and a linguistic modification accommodation version against the standard form. English Reading Proficiency Measure: We developed a reading efficiency instrument called TIMER which comprised of brief fluency and word recognition tests. Content Coverage OTL Measure: Students and teachers reported which math topics were covered so far that school year. Teacher Content Knowledge Measure: Collected data on teachers’ math content knowledge and knowledge-of-students-and-content. Classroom Accommodation Use Measure: Surveyed teacher use of accommodation practices in classroom teaching and assessment. Class Prior Math Ability OTL: Participating schools provided participants’ Grade 7 CAT/6 math scores. The class mean of these scores was our measure of prior ability at the classroom level. Student Background Data: Collected English language development (ELD) information, gender, home language, and ethnicity from school records. Collected data on student language background characteristics from students. Teaching Background Data: Collected data on teacher education and experience.
28
•
•
•
State Reading Test Scores: Participating schools provided Grade 7 CAT/6 reading scores. These scores helped us validate the TIMER test and provide another means of creating comparison groups. Teacher Observation: Two observers per observed classroom quantified and qualified teaching behaviors using a protocol. Teacher-Student Interaction Observation: Two observers per observed classroom quantified the level of student-initiated and teacher-initiated interactions using a protocol.
In the pages that follow are details about these measures.
Math performance measure. We defined performance in math as the total score on a 30-item algebra test compiled for this study. This test contained items designed to assess skill in and understanding of material from the first two quarters in the two-year algebra curriculum (e.g., simplifying expressions and solving equations). Most questions were selected from released items from the California Standards Test, the National Assessment of Educational Progress (NAEP) and the Third International Math and Science Study (TIMSS). The items represented the objectives stated in the California Content Standards for the first half of the course and the concepts and skills addressed in the standards-based curriculum. In addition, items representing prerequisite skills from the seventh-grade standards were included. (See Appendix A for California Content Standards and math test details.)
There were three versions of the test to incorporate the accommodations—standard (no accommodation), dual-language version, and linguistically modified version—which were administered by trained members of the research team. In the dual-language form, both English and Spanish texts were presented side-by-side. Two translators, representing Mexican and Central American backgrounds and both proficient in mathematics, created two separate translations for a professional bilingual editor to compile into an optimum version. For the linguistically modified form, the original test items were modified by a CRESST researcher and linguistic modification trainer. Three highly qualified math teachers, one a state test developer and researcher, one a teacher of math test preparation, and the third a district math coach, compared the original and modified versions to ensure that the construct of the items had not changed. Their suggestions were incorporated into the final version. All items were in the same order in each form, though, to discourage cheating, they were grouped on the pages in a variety of ways to give the appearance of being in varying order.
29
Students were given 40 minutes to complete the test. A math testing protocol guided the researcher through the administration of the math test and the student OTL questionnaire.
As an estimate of the reliability of the test, the internal consistency coefficient (alpha) was computed. For the 32 questions the alpha was .830 (N=2,367). The correlation between the math scores and CAT/6 math scores was .692 (n=1,998).
English reading proficiency measure. In this study, participating students were grouped by their school-assigned ELL designation. In additional analyses, we grouped students by their performance on TIMER, a quick reading proficiency measure that we developed. TIMER provides a current indicator of each student’s English reading proficiency level with a language fluency test score and a word recognition test score. It was designed to provide a measure with wide distribution for both ELL and non-ELL students. TIMER also serves to provide a reading measure for all student research participants when student academic records are missing. Additionally, reading proficiency is a critical component of language proficiency, and we were interested in exploring any between-groups differences beyond ELL designation.
In order to divide participating students into low-, medium-, and high-reading-proficiency levels, we first created a reading proficiency factor comprised of the language fluency test score and the word recognition test score, using confirmatory factor analysis. We created a categorical variable from that latent factor with three categories: highest third, medium third, and lowest third, to distinguish levels of reading proficiency.
The TIMER instrument gauges the current reading ability of both ELL and non-ELL students in the shortest time possible in a large-group setting. One part consists of 10 items that require students to fill in a blank with the most suitable word. Each item tests for correct selection of words from the same part of speech. Nouns, verbs, adjectives and adverbs are represented by the ten items. The other part of the TIMER instrument asks students to identify English words from a checklist of 75 words and non-words. The nonsense words contain phonemes used in English words. Two forms of the test were administered in each classroom to vary the presentation of the ten fluency items. The test appeared in the same booklet as the student background questionnaire. Both instruments were administered by the classroom teacher, usually prior to the math testing day, using a scripted testing protocol.
30
This English reading proficiency battery was validated using data from previous ELL accommodation studies (Abedi, Courtney, & Leon, 2003b). For the TIMER reading instrument, the reliability coefficient (internal consistency) for the 10-item fluency measure was .758 (N=2,384) and for the 75 word recognition items, the internal consistency was .955 (N=2,384). Students’ scores from the state reading test (CAT/6) were also collected to validate the TIMER test. The TIMER test’s latent factor6 correlation to the CAT/6 reading test was .505 (N=1,937). In examining the two parts of the TIMER reading instrument, the word recognition measure’s correlation to the fluency measure was .439 (N=2,372).
Both parts were analyzed for correlation to CAT/6 reading, as well as students’ ELL designation. It should first be noted that the ELL designation’s correlation to the CAT/6 reading test was -.390 (N=2,170). The fluency measure’s correlation to the CAT/6 reading test was .488 (N=1,946). The fluency measure’s correlation to ELL status was -.374 (N=2,180). The word recognition measure’s correlation to the CAT/6 reading test was .365 (N=1,937). The word recognition measure’s correlation to ELL status was -.282 (N=2,170). This negative correlation indicates that ELL students performed lower on the test.
Tables 7 and 8 illustrate the validation for the TIMER test in this study. The majority of ELL students (57.3%) scored in the bottom third while just 12.8% of ELL students scored in the top third. Conversely, less than 20% of non-ELL students scored in the bottom third. A 3 x 2 Chi Square analysis revealed that the association between TIMER level and ELL status was significant, x2 (2, N = 1,996 = 319.58, p = .000). Sakoda’s adjusted contingency coefficient c* =.520 revealed that the association explains over half of the maximum possible variation.
6 We created a latent variable which is the common shared variation between the word recognition and the fluency measures.
31
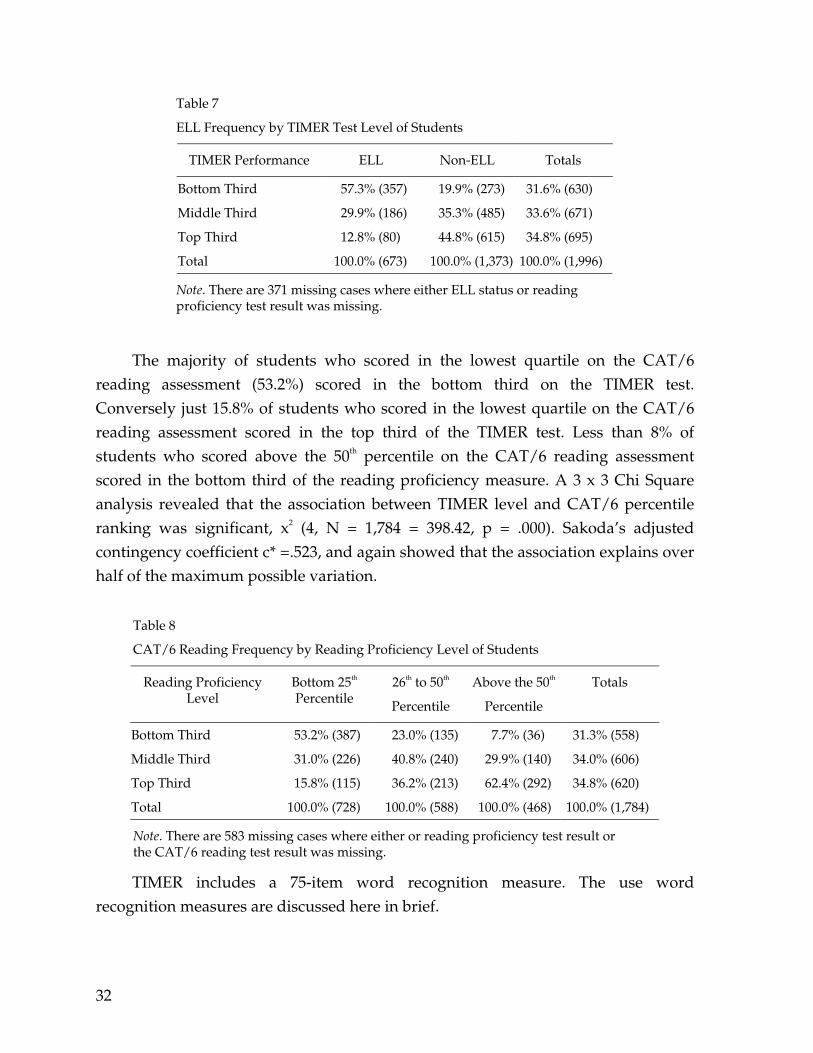
Table 7
ELL Frequency by TIMER Test Level of Students
TIMER Performance ELL Non-ELL Totals
Bottom Third 57.3% (357) 19.9% (273) 31.6% (630)
Middle Third 29.9% (186) 35.3% (485) 33.6% (671)
Top Third 12.8% (80) 44.8% (615) 34.8% (695)
Total 100.0% (673) 100.0% (1,373) 100.0% (1,996)
Note. There are 371 missing cases where either ELL status or reading proficiency test result was missing.
The majority of students who scored in the lowest quartile on the CAT/6 reading assessment (53.2%) scored in the bottom third on the TIMER test. Conversely just 15.8% of students who scored in the lowest quartile on the CAT/6 reading assessment scored in the top third of the TIMER test. Less than 8% of students who scored above the 50th percentile on the CAT/6 reading assessment scored in the bottom third of the reading proficiency measure. A 3 x 3 Chi Square analysis revealed that the association between TIMER level and CAT/6 percentile ranking was significant, x2 (4, N = 1,784 = 398.42, p = .000). Sakoda’s adjusted contingency coefficient c* =.523, and again showed that the association explains over half of the maximum possible variation.
Table 8
CAT/6 Reading Frequency by Reading Proficiency Level of Students
Reading Proficiency Level
Bottom 25th Percentile
26th to 50th
Percentile
Above the 50th
Percentile
Totals
Bottom Third 53.2% (387) 23.0% (135) 7.7% (36) 31.3% (558)
Middle Third 31.0% (226) 40.8% (240) 29.9% (140) 34.0% (606)
Top Third 15.8% (115) 36.2% (213) 62.4% (292) 34.8% (620)
Total 100.0% (728) 100.0% (588) 100.0% (468) 100.0% (1,784)
Note. There are 583 missing cases where either or reading proficiency test result or the CAT/6 reading test result was missing.
TIMER includes a 75-item word recognition measure. The use word recognition measures are discussed here in brief.
32
Measuring students’ word recognition can serve as a quick and easy alternative to assessing reading proficiency. In one second or less, a sight word is recognized without pausing to break it into parts (phonemic decoding). Once students have a large vocabulary of sight words, they are free to concentrate on constructing the meaning of text (Gough, 1996). Since word recognition is central to the reading process (Chard, Simmons, & Kameenui, 1998), word recognition tests may help determine reading levels. Although comprehensive reading assessments tend to be more valid in determining reading ability, word recognition tests still provide a valid estimate of student ability and are able to be given in a shorter period of time than comprehensive assessments.
Vocabulary checklists are a type of word recognition test that have been used by various researchers (Read, 2000). The Eurocentres Vocabulary Size Test (EVST) (Meara & Buxton, 1987; Meara & Jones, 1988) has been used to estimate the vocabulary size of ELL students by using a graded sample of words covering numerous frequency levels. This test also uses non-words to provide a basis for adjusting the test takers’ scores if they appear to be overstating their vocabulary knowledge. Because the EVST is administered by computer, some have viewed it as an efficient and accurate placement procedure, able to assign students to levels with minimal effort (Read, 2000).
EVST and other checklist tests can give a valid estimate of the vocabulary size of most ELL students (Read, 2000). Exceptions, however, include learners at low levels of proficiency, and individual learners whose pattern of vocabulary acquisition has been unconventional. Despite these concerns, Meara (1996) expressed optimism that the problems with checklist tests can be overcome and that they can provide satisfactorily reliable estimates of vocabulary size. The great attraction of the checklist format is how simple it is, both for its construction and for the test takers to respond. Its simplicity means that a large number of words can be covered within the testing time available, which is important for achieving the sample size necessary for making a reliable estimate (Read, 2000).
In a previous study, we paired a Language Assessment Scales (LAS) fluency subscale with our own word recognition test, similar to the one used in the present study, and found it to be useful and feasible to implement (Abedi, Courtney, & Leon, 2003b).
33
Content coverage OTL instruments. Based on the California content standards for the two-year algebra course and some important prerequisites, we identified pre-algebra and algebra knowledge and skill areas prescribed in the first half of Grade 8. To analyze the effect of OTL on math performance, we narrowed these curricular content/skill areas to 20 that are represented in the algebra test items that we used for measuring students’ algebra knowledge in this study.
As a result, all participating students completed a 10-minute questionnaire on their opportunity to learn math content and skills in Grade 8. This student questionnaire was administered at the end of the math test. The questions asked if the students had studied the concepts and skills in the math areas we tested, had practiced mathematical thinking in particular activities, and had found their math lessons clear and equitable. Twenty of the items measured the 20 math content and skill areas from the California Grade 8 math standards for first half of the school year (n=2,367). Three similar items were also included, which asked if the students had learned math concepts that are not covered until high school. If any students answered “yes” to two or three of these questions, their responses were not included in the class mean7.
The math content coverage areas reflected in the test’s items were analyzed for their correlation to the math items score (n=2,367). The correlation of individual student-reported content coverage with the total math items score was .278. The correlation of mean student content coverage in class with the math score was .441.
Most of the participating teachers completed a teacher survey packet, usually on the day of math testing. In the survey, teachers completed a checklist for each class of students tested, indicating which of the 20 math knowledge and skill areas we listed had been covered so far in the school year. Also listed was one calculus topic. The correlation of teacher-reported math content and skill coverage with individual-student-reported content coverage was .131. The correlation of teacher–reported math content and skill coverage with student-reported class mean content and skill coverage was .328. The correlation of teacher-reported content coverage with the math items score was .162. The student report of OTL was more highly correlated to our outcome measure.
7 To measure the care of the responses to the math content lists, each questionnaire contained topics that were too advanced to have been taught.
34
The teacher-reported math content and skill coverage measure had a maximum possible score of twenty content and skill areas. The distribution of scores for this measure was negatively skewed (skewness= -1.13, std. err=.247) with teachers in 82 of the 95 classes (86.3 percent) with reporting between 16 and 20 content and skill areas being covered. This distribution also exhibited a positive kurtosis (kurtosis= 2.86, std. err=.490). The lack of normality in the teacher-reported math content and skill coverage distribution may explain the lower then expected correlations to the student-reported class content coverage.
Class content OTL measure. Students in the same class period with the same teacher are assumed to be exposed to much the same math and algebra content during the school year. For this reason, we consider the OTL content coverage measure to be a class-level measure. In our 2003 pilot study, we perceived a strong relationship between the class-level student response to each content/skill area in our survey and performance on the math measure. Once again, within each class, content OTL was measured by computing the mean student response to each content/skill area in the survey described above. (For example, “Find the slope of a line” would receive a score of 0.50 if 50% of the students in that particular class responded that they had studied it in Grade 8. Student content/skill area OTL scores could therefore range from 0 to 1.) A total class-level OTL measure was computed as the sum of the scores of these 20 areas. Thus, the total class-level OTL measure for a class would be 20 if all of the students’ agreed that all 20 content/skill areas had been taught. Therefore, our class-level OTL measure is a class-level variable and ranges from 0 to 20. By combining student responses within a class we feel we set a more reliable measure than using individual responses.
Teacher content knowledge measure. The teacher content knowledge measure is based on each teacher’s performance on eight math questions (17 items) that measure math content knowledge and knowledge-of-students-and-content. These questions, attached to the teacher survey, were obtained from the University of Michigan’s “Content Knowledge for Teaching Mathematics Measures,” (CKT-M) and were used with permission (see also Hill, Rowan, & Ball, 2005; Hill, Schilling, & Ball, 2004). The reliability coefficient (Cronbach’s Alpha) was .773, n=50. The correlation between the content knowledge measure with our math outcome was .096. (The relationship between the content knowledge measure and the math outcome becomes stronger when variables such as initial math ability are accounted for.) In comparing the content knowledge measure with the rest of the questionnaire
35
instrument, the content knowledge measure was only significantly related to the teacher survey response of “never giving multiple choice tests.”
Classroom accommodation use measure: In the teacher survey, teachers were asked about their classroom teaching and assessment use of language accommodation for ELL students, such as sheltered English, extra time, or glossary/dictionary use. They were also asked about several common accommodations for students with disabilities, which was not used in the analyses for the present report.
Class prior math ability OTL: Participating schools provided participants’ CAT/6 math scores from the previous year (Grade 7). The California Achievement Tests, Sixth Edition, is a norm-referenced test which was administered for Grades 2 through 11. The class mean of these math scores was our measure of prior ability at the classroom level.
Student background data. An 8-item questionnaire was used to collect data pertaining to students’ language background, such as country of origin, length of time in the U.S., and language other than English spoken in the home. It also asked students to check off math topics they studied in Grades 1 through 7. Administering the student questionnaire took about five minutes, depending on the students’ reading ability. Each school provided the ELL designation, gender, home language and ethnicity of each participating student.
Teaching background data. The data on teaching background is based on self-reported data (in the teacher survey) of a teacher’s educational background and teaching experience. However, there was not a significant relationship between training, certification or teaching experience and teacher performance on the content knowledge measure.
State reading assessment scores. Participating schools provided Grade 7 CAT/6 reading scores. These scores were used to validate the TIMER reading proficiency measure. They were also used to provide comparison groups based on percentile rankings, which we describe in the Methodology section of this report.
Teacher observation. Fifty minutes of instruction time8 was observed once by two researchers to gather qualitative and quantitative information, primarily about
8 When a class met in 2-hour blocks, the observers followed the protocol for 50 to 60 minutes of the period.
36
the instruction methods. Both observers tracked teacher activity quantitatively and rated features of the class and instructor on a protocol form. The observation protocol and instrument was developed with the aid of reading/ELL specialists and piloted in four classrooms. The protocol (shown in Appendix B) was designed for observers to note the general classroom condition (e.g., location of classroom, temperature, and desk arrangements), teaching tools (e.g., overhead projectors, computers, textbook, handouts, etc.), and teaching style (e.g. responsive, respectful, in control, etc.). In addition, the protocol allowed observers to note teaching strategies used in the instruction of ELL students (speaking slowly, allow time for questions, define vocabulary explicitly, etc.). Each time a teacher or student displayed a protocol-related behavior (e.g., student raised hand, teacher called on student, teacher defined vocabulary word, etc.), the observer would note it on the protocol sheet. At the end of each class period, the instances of each “behavior” were totaled. The scores for a type of behavior ranged from 0 to 5+, so the maximum score per behavior could be “5 and above.” In addition, a few qualitative assessments were made about the teacher’s style and manner, but did not prove meaningful in OTL analyses.
Student-teacher interaction observation. During the class observation, both observers noted five specific student-teacher interactions of six or more students on a copy of the seating chart. The observation protocol and instrument was developed as described in the previous paragraph.
Data Collection and Procedures
There were four independent sources of data: 1) accommodation, math (algebra) performance, quick reading proficiency, and content OTL data were obtained from the students; 2) additional content OTL data, as well as teacher content knowledge data, were obtained from teachers; 3) student background (including ELL status) and standardized test data (including prior CAT/6 scores) were obtained from each school; and 4) teacher and student interactions and classroom behavior were quantified by two observers. The order of collection was usually 1) class observation, if any; 2) student reading and background data; 3) student math and OTL data, plus teacher math and OTL data; and 4) data from student records. For each class tested, a teacher received a $50 gift certificate for a major retail store (Target or Barnes & Noble). For each class observed, they received
37
another certificate. Each of the school sites had a host/coordinator to whom the project presented an honorarium.
Classroom Observation. The observation phase was used to explore participation opportunities of both ELL and non-ELL students. For example, one may speculate that due to language limitations, ELL students may not feel comfortable participating in class discussion. To examine this assumption, classroom observations were conducted in 35 classrooms. During the observations, observers would note each student-initiated interaction, times when a student in our sample called out an answer, raised a hand, or asked a question. One may also speculate that if reticent students do initiate an interaction, they may not attract the teacher’s attention. So, in addition, observers noted each teacher-initiated interaction, times when the teacher called on a student in our sample or continued the interaction beyond the first question. However, collecting personality inventories was beyond the scope of this study.
The 35 observed classes were visited once for 50 minutes by two CRESST researchers during the second semester of the school year. (When a class period was more then 50 minutes, only the first 50 minutes of instruction were observed.) Observations were conducted using a structured protocol for the completion of a tally sheet of behaviors related to OTL and sheltered English-teaching strategies, as well as a seating grid on which to tally five student-teacher interactions for a sample of the students present. Also noted were the classroom environment, teaching attributes, the teachers’ interaction style with students, the communication of expectations for student learning and work, and the rigor of the lesson tasks (grade appropriateness and the extent to which procedural versus conceptual understanding were emphasized).
For the observations, the two observers performed similar functions from opposite vantage points in the classroom. As class began, each observer would randomly select at least six students (three boys and three girls in an assortment of seating locations visible to that observer) to observe during the class period and record type and frequency of participation. They also observed the teacher when the teacher was the focus of activity. The observers did not know the ELL status of any of the students, nor was it apparent from most Grade 8 students’ outward appearance or manner at the schools selected for the study. Later, just prior to the data analysis phase, the observed students’ ELL status was matched with the student observation data.
38
For purposes of inter-rater reliability, both observers sometimes selected two of the same students for comparison. An important limitation was that an observer could not accurately record whether a particular selection of students responded or not in a choral answer. Using audio/video equipment or conducting multiple day observations was not possible and beyond the scope of the present study.
Student background data collection and reading proficiency measurement. The student background questionnaire and reading proficiency measure (TIMER test) were administered by the classroom teachers using a scripted protocol prior to the day of math testing. The questionnaire administration took about five minutes, depending on the students’ reading ability. The 7-minute reading proficiency battery was streamlined for 10-minute administration.
Math performance, accommodation and content OTL data collection. Ninety-eight classes, with an average of 24 students per class, were tested between February and July 2005. The 2,367 participating students received a 40-minute algebra test (32 questions drawn from existing NAEP and TIMSS items) with an OTL questionnaire attached. All participating teachers completed a 30-minute teacher questionnaire with a content knowledge test attached. We tested the language accommodation of math test items by administering three forms of the math test: standard, dual-language and linguistically modified versions. The test versions had similar appearances, were pre-collated for almost equal distribution in each of the classes, and were distributed randomly by the test administrators who often were assisted by teacher and/or student volunteers. There was no mention of the test versions in the test administrator’s script. It was not unusual for an “English-only” student to receive a dual-language version of the test, yet it did not elicit any comments from the students.
In the OTL questionnaire attached to the math test, students selected the math subject areas that they had been taught from a glossed list and replied to a few other OTL questions. Teachers were also asked to provide information on the math content taught in the first semester.
The algebra tests and OTL questionnaires were administered by CRESST researchers. Teachers were not allowed to help students with either measure.
Student record data collection. Schools provided the math achievement scores for our use to control for initial math ability at both the student and class level.
39
Schools also provided reading achievement scores, ELL designation, gender, home language and ethnicity of most participating students.
Analysis Plan
This study used classroom-level variables to investigate the research questions. We conceptualized teacher content knowledge as a class-level variable. Because the number of classes per teacher ranged from one to two, classes were nested under teachers. Teacher effects were estimated. Using class as the unit of analysis seemed reasonable since the OTL instrument examines content coverage at the classroom level. However, teacher and classroom effects were confounded.
Using class as the unit of analysis, we performed correlational analyses between class-level teacher variables (e.g., class-level teacher reports of content taught) and student (within-class) variables. In addition to teacher and student class-level variables, we also used student-level variables (e.g., student background and reports of content taught) in some of the analyses. For the analyses of student background questions, we created composite variables of clusters of questions, i.e., questions that conceptually group together. In some cases these composite variables were constructed using a latent-variable modeling approach.
In this study, we used simple correlation and regression analyses and Hierarchical Linear Modeling (HLM) since there was no plan to infer any cause-and-effect relationships between classroom OTL and student academic performance in math. For this reason, analyses plans that may help define a causal relationship such as path analyses were not utilized in this study. Here, we describe the analyses for each of the research questions in this study in brief.
HLM was used to answer Research Questions #1 through 6. For the purposes of reporting, we have termed “varying language proficiency9” to signify three different comparison groups. A separate HLM model was employed for each of these indicators of language proficiency. The first model used student ELL status as an indicator. ELL and non-ELL students were compared. The second model used 9 While we have termed “varying language proficiency” to refer to students who scored in various levels of the reading proficiency measure (TIMER test) and the CAT/6 reading test, this is solely for the purposes of reporting. This is not meant to advocate for the use of reading measures as a sole means of measuring language proficiency. Since we were limited in our access to recent language proficiency measures of the student participants, and because we believe that reading proficiency is a critical component of language proficiency, we felt that conducting analyses based on reading measures can potentially provide some additional insight.
40
students’ scores on our TIMER test as an indicator of language proficiency. Students were grouped by performance into thirds: bottom third, middle third, and top third. The third model used students score on the CAT/6 reading test as an indicator of language proficiency. The research questions are again, as follows:
1. Do the three class-level components of OTL impact students’ math performance?
2. Do the three class-level components of OTL differentially impact the math performance of students with varying language proficiency?
3. Do the dual-language test version and linguistic modification accommodations improve students’ math performance?
4. Do the dual-language test version and linguistic modification accommodations differentially impact the math performance of students with varying language proficiency?
5. Do the three class-level components of OTL differentially impact students who received the dual-language test version accommodation?
6. Do the three class-level components of OTL differentially impact students who received the linguistic modification accommodation?
In Questions #2 and #4, “varying language proficiency” should be understood, for the purposes of this report, as one of the three indicators as aforementioned, based on the respective model. For example, Do the three class-level components of OTL differentially impact the math performance of ELL students as compared to non-ELL students? Do the three class-level components of OTL differentially impact the math performance of students who scored in the bottom third of the TIMER test as compared to students who scored in the top third of the TIMER test? Do the three class-level components of OTL differentially impact the math performance of students who scored in the 25th percentile and below of the Grade 7 CAT/6 reading test, as compared to students who scored above the 50th percentile in the Grade 7 CAT/6 reading test?
To answer Research Question #7 (Do students of varying language proficiency receive the same level of OTL?), we computed and compared mean OTL, which included student class mean content coverage, the teacher content knowledge measure, and overall class prior math ability. We compared the means of these three measures using a simple analysis of variance with each of the three language
41
proficiency indicators. We ran one-factor ANOVA to test if the means are different where the factor is ELL status with three separate class-level OTL outcome variables. We produced an effect size (Eta squared) to inform the magnitude of effect, i.e., how large the difference was between students in varying language proficiency categories. In separate analyses, we grouped the participating classes by their enrollment: majority ELL, majority non-ELL and balanced mix.
In response to Research Question #8 (Are there any differences between ELL and non-ELL students in the level of class participation/teacher-student interaction?), we compared descriptive means in an analysis of variance with one factor (ELL status) to see if there were differences between ELL and non-ELL students’ levels of participation. The five types of participation measured are represented in the five outcome measures.
For Research Question #9 (Is there a relationship between students’ class participation and their math performance?), we performed HLM analyses. The five class participation measures were combined into two composite measures of classroom participation (student initiated participation and teacher initiated participation).
Rating linguistic complexity. To rate the linguistic complexity of math test items prior to more specific analyses of student performance on accommodated instruments, we have found it useful to group language features into the four categories listed below, as conducted in previous studies (see Abedi, Courtney, & Leon, 2003a). If a feature listed under a category is present in the test item (in the stated quantity), a point is tallied in that category for the test item. The most readable items score a 0 and the most complex score a 4. The four categories are:
• Sentence Length and/or Complexity
• Long or Multiple Modifiers
• Unfamiliar Predicates
• Multiple Unfamiliar Words
The CRESST rating guide and list of linguistic modification concerns are contained in Appendix C.
Except for strictly computational problems, the language of math test items can range from a simple command with a conditional clause (“Find x if 2x=6.”) to infinite combinations of language features. Three CRESST researchers proficient in
42
parts of speech rated the math test items used in this study, using the rating method described above.
The resulting ratings were analyzed, and the two most experienced of the three raters were found to be the most consistent. Their scores were averaged to create ratings for each item in its original and linguistically modified forms.
Of the 32 items, 9 were considered to have undergone meaningful linguistic modification. Most of the math items contained little or no language complexity—or, in some cases, no language. It was determined that nine of the items were noticeably modified. Specifically, when the change in rating from standard to modified version was one point or greater, the item was considered meaningfully modified. In order to isolate the modification effect, these nine items were analyzed separately as a subsection. The descriptive statistics for this subsection by ELL status and accommodated version are presented in Table 9.
43
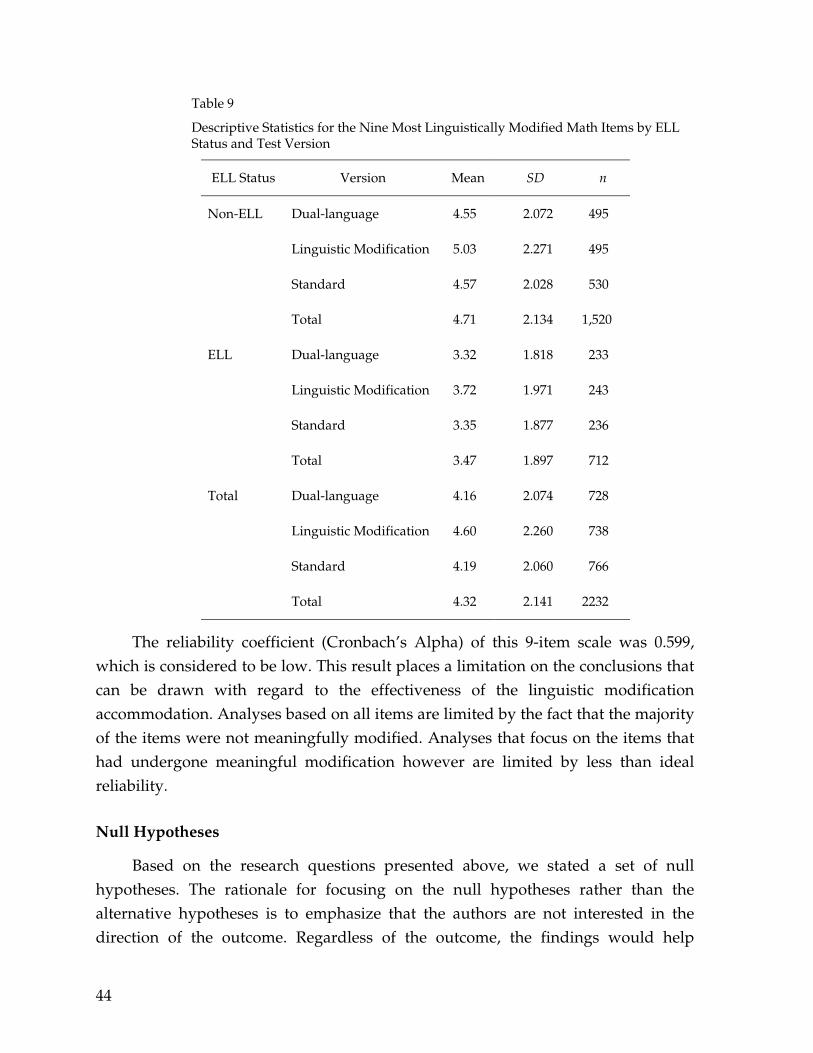
Table 9
Descriptive Statistics for the Nine Most Linguistically Modified Math Items by ELL Status and Test Version
ELL Status Version Mean SD n
Non-ELL Dual-language 4.55 2.072 495
Linguistic Modification 5.03 2.271 495
Standard 4.57 2.028 530
Total 4.71 2.134 1,520
ELL Dual-language 3.32 1.818 233
Linguistic Modification 3.72 1.971 243
Standard 3.35 1.877 236
Total 3.47 1.897 712
Total Dual-language 4.16 2.074 728
Linguistic Modification 4.60 2.260 738
Standard 4.19 2.060 766
Total 4.32 2.141 2232
The reliability coefficient (Cronbach’s Alpha) of this 9-item scale was 0.599, which is considered to be low. This result places a limitation on the conclusions that can be drawn with regard to the effectiveness of the linguistic modification accommodation. Analyses based on all items are limited by the fact that the majority of the items were not meaningfully modified. Analyses that focus on the items that had undergone meaningful modification however are limited by less than ideal reliability.
Null Hypotheses
Based on the research questions presented above, we stated a set of null hypotheses. The rationale for focusing on the null hypotheses rather than the alternative hypotheses is to emphasize that the authors are not interested in the direction of the outcome. Regardless of the outcome, the findings would help
44
research and practice in standardized testing and would provide information on effective instruction for ELL students. Following are these research hypotheses, which are grouped into three separate sets based on the methods of analyses:
I. OTL / Accommodation / Language Effects On Math Performance
H01: The three class-level components of OTL do not impact students’ math performance.
H02: The three class-level components of OTL do not differentially impact the math performance of students with varying language proficiency.
H03: The dual-language test version and linguistic modification accommodations do not improve students’ math performance.
H04: The dual-language test version and linguistic modification accommodations do not differentially impact the math performance of students with varying language proficiency.
H05: The three class-level components of OTL do not differentially impact the math performance students who received the dual-language test version accommodation.
H06: The three class-level components of OTL do not differentially impact the math performance students who received the linguistic modification accommodation.
II. Language proficiency and Opportunity To Learn
H07: Students of varying language proficiency do not receive the same level of OTL.
III. Class Participation
H08: There are no differences between ELL and non-ELL students in the level of class participation/teacher-student interaction.
H09: There is no relationship between students’ class participation and their math performance.
45
Results
The following pages details our results in three separate subsections by the research questions, as discussed earlier. Based on the intricacies of the analyses, descriptions of methods are retained in this section along with the results to facilitate reporting and ease of comprehension.
I. OTL / Accommodation / Language Effects On Math Performance
Three separate HLM models were performed to examine the effects of three class-level components of opportunity to learn, two language-related testing accommodations, and varying student language proficiency on math performance (Research Questions #1 through 6). As discussed earlier, the first model used student ELL status as an indicator of language proficiency. The second model used students’ score on our TIMER test as an indicator. The third model used students’ percentile ranking on the CAT/6 reading test (from the prior year) as an indicator. Class-level OTL was measured by student report of content coverage, teacher content knowledge, and student prior math ability OTL. Also as described earlier, this involved validating quantitative measures of teacher content knowledge, utilizing quantitative measures of content OTL, and collecting prior year CAT/6 math scores. Students took one of three test versions, standard (no accommodation), dual language, and linguistically modified.
All main effects and two-way interactions between class-level OTL, type of test accommodation, and student language proficiency were included in each of the three models. Research Questions #1 through 6 again, are as follows:
1. Do the three class-level components of OTL impact students’ math performance?
2. Do the three class-level components of OTL differentially impact the math performance of students with varying language proficiency?
3. Do the dual-language test version and linguistic modification accommodations improve students’ math performance?
4. Do the dual-language test version and linguistic modification accommodations differentially impact the math performance of students with varying language proficiency?
46
5. Do the three class-level components of OTL differentially impact students who received the dual-language test version accommodation?
6. Do the three class-level components of OTL differentially impact students who received the linguistic modification accommodation?
HLM Model Using ELL Status As an Indicator of Language Proficiency (Model 1)
Level 1 comprised of 1,927 students. Students’ prior math ability, form of test accommodation, and ELL status were used to model math performance. The standard form of test administration served as the reference group for the accommodated forms and therefore is not explicitly annotated. At level 2, each of the 92 classes’ intercept and slopes were predicted by the three class-level components of opportunity to learn.
Thus, the level 1 model had seven coefficients for each student: the intercept (B0), the dual-language test version accommodation slope (B1), the linguistic modification accommodation slope (B2), the dual-language interaction with ELL status slope (B3), the linguistic modification interaction with ELL status slope (B4), the ELL status slope (B5), and the prior math ability slope (B6) as shown below:
The level 1 model is:
Y = B0 + B1*(DUAL) + B2*(LMOD) + B3*(ELLDUAL) + B4*(ELLMOD) + B5*(ELL) + B6*(CAT6MATH) + R
DUAL represents the dual-language test version; LMOD is the linguistic modification accommodation version; ELLDUAL is the dual-language interaction with ELL status; ELLMOD is the linguistic modification interaction with ELL status; ELL represents ELL status, and CAT6MATH is prior math ability as determined by students’ Grade 7 CAT/6 math scores.
At level 2, the intercept, the dual-language test version slope, the linguistic modification version slope, and the ELL status slope are modeled as functions of the three OTL measures. The level 2 model is:
B0 = G00 + G01*(SCONTENT) + G02*(CKTM) + G03*(MEANCAT6) + U0
B1 = G10 + G11*(SCONTENT) + G12*(CKTM) + G13*(MEANCAT6)
B2 = G20+ G21*(SCONTENT) + G22*(CKTM) + G23*(MEANCAT6)
B3 = G30
47
B4 = G40
B5 = G50+ G51*(SCONTENT) + G52*(CKTM) + G53*(MEANCAT6)
B6 = G60
SCONTENT represents the mean of student report of content coverage; CKTM is teacher content knowledge (as demonstrated on the CKT-M measure); and MEANCAT6 is the mean class prior math ability (measured by CAT/6 math).
In this model, all three measures of class-level OTL had a significant relationship (p<.01) to the intercept of the math performance outcome measure (Research Question #1). This indicates that high levels of OTL were associated with improved math performance when we controlled for prior math ability, ELL status and test accommodation at the student level. We produced an effect size (Beta) to inform the magnitude of the effect of each classroom OTL measure. Prior class math ability had a large effect on student performance (Beta=.427). The prior ability level of a class had more than twice the effect on performance on our math test than either classroom content coverage or teacher content knowledge.
While all three class-level OTL components were significantly associated with math performance, overall they did not have a differential impact on ELL students (Research Question #2). In other words, both ELL and non-ELL students benefited similarly from the three class-level OTL components. In addition, the main effects of student ELL status, and accommodated test version did not predict math performance after controlling for student-level prior math ability and OTL (Research Question #3). As expected student-level prior math ability was significantly related to math performance (p<.01) with a strong effect size (Beta=.552).
There was also no significant relationship between the three class-level OTL components and the accommodated test versions (Research Questions #5 and 6). Students taking all three versions of the test benefited similarly from the three OTL measures.
Table 10 outlines the results.
48
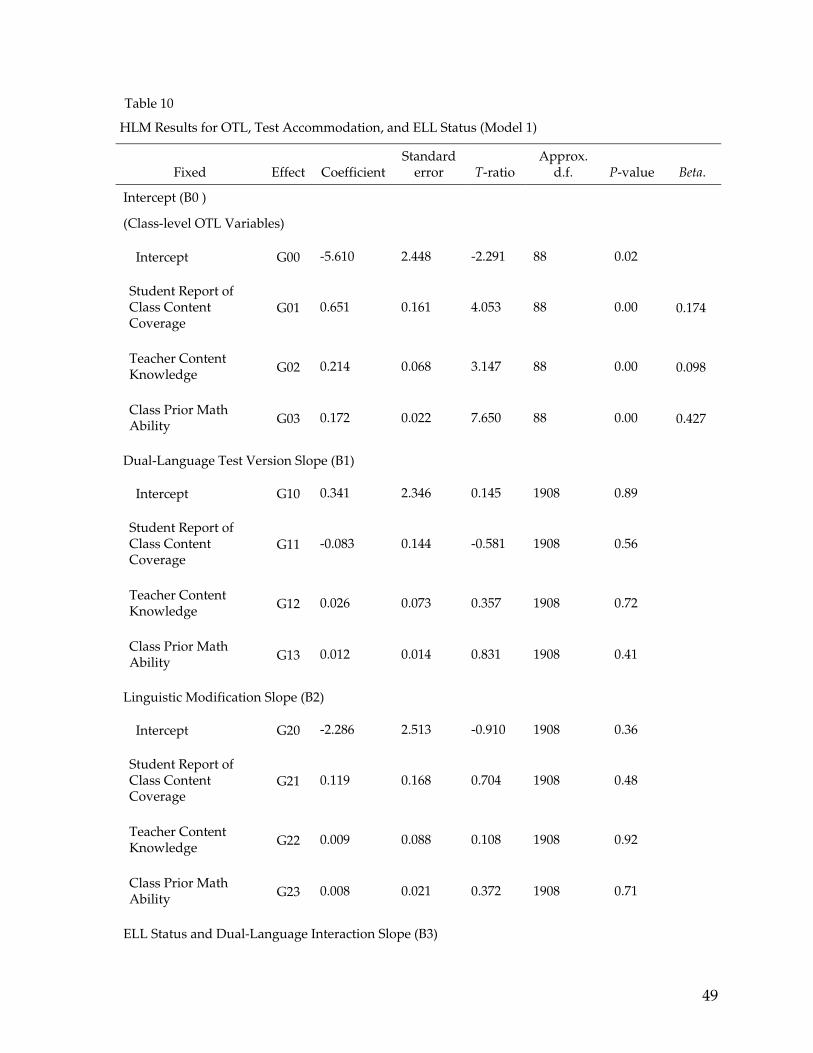
Table 10
HLM Results for OTL, Test Accommodation, and ELL Status (Model 1)
Fixed Effect Coefficient Standard
error T-ratio Approx.
d.f. P-value Beta.
Intercept (B0 )
(Class-level OTL Variables)
Intercept G00 -5.610 2.448 -2.291 88 0.02
Student Report of Class Content Coverage
G01 0.651 0.161 4.053 88 0.00 0.174
Teacher Content Knowledge G02 0.214 0.068 3.147 88 0.00 0.098
Class Prior Math Ability G03 0.172 0.022 7.650 88 0.00 0.427
Dual-Language Test Version Slope (B1)
Intercept G10 0.341 2.346 0.145 1908 0.89
Student Report of Class Content Coverage
G11 -0.083 0.144 -0.581 1908 0.56
Teacher Content Knowledge G12 0.026 0.073 0.357 1908 0.72
Class Prior Math Ability G13 0.012 0.014 0.831 1908 0.41
Linguistic Modification Slope (B2)
Intercept G20 -2.286 2.513 -0.910 1908 0.36
Student Report of Class Content Coverage
G21 0.119 0.168 0.704 1908 0.48
Teacher Content Knowledge G22 0.009 0.088 0.108 1908 0.92
Class Prior Math Ability G23 0.008 0.021 0.372 1908 0.71
ELL Status and Dual-Language Interaction Slope (B3)
49
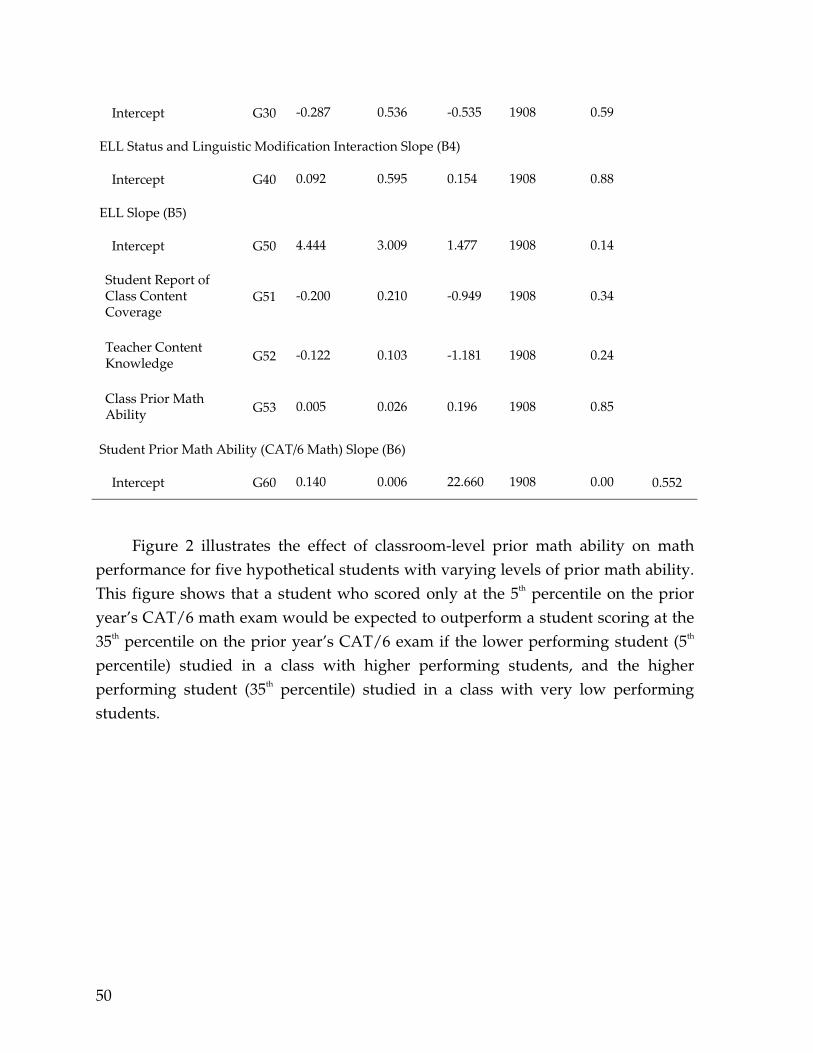
Intercept G30 -0.287 0.536 -0.535 1908 0.59
ELL Status and Linguistic Modification Interaction Slope (B4)
Intercept G40 0.092 0.595 0.154 1908 0.88
ELL Slope (B5)
Intercept G50 4.444 3.009 1.477 1908 0.14
Student Report of Class Content Coverage
G51 -0.200 0.210 -0.949 1908 0.34
Teacher Content Knowledge G52 -0.122 0.103 -1.181 1908 0.24
Class Prior Math Ability G53 0.005 0.026 0.196 1908 0.85
Student Prior Math Ability (CAT/6 Math) Slope (B6)
Intercept G60 0.140 0.006 22.660 1908 0.00 0.552
Figure 2 illustrates the effect of classroom-level prior math ability on math performance for five hypothetical students with varying levels of prior math ability. This figure shows that a student who scored only at the 5th percentile on the prior year’s CAT/6 math exam would be expected to outperform a student scoring at the 35th percentile on the prior year’s CAT/6 exam if the lower performing student (5th percentile) studied in a class with higher performing students, and the higher performing student (35th percentile) studied in a class with very low performing students.
50
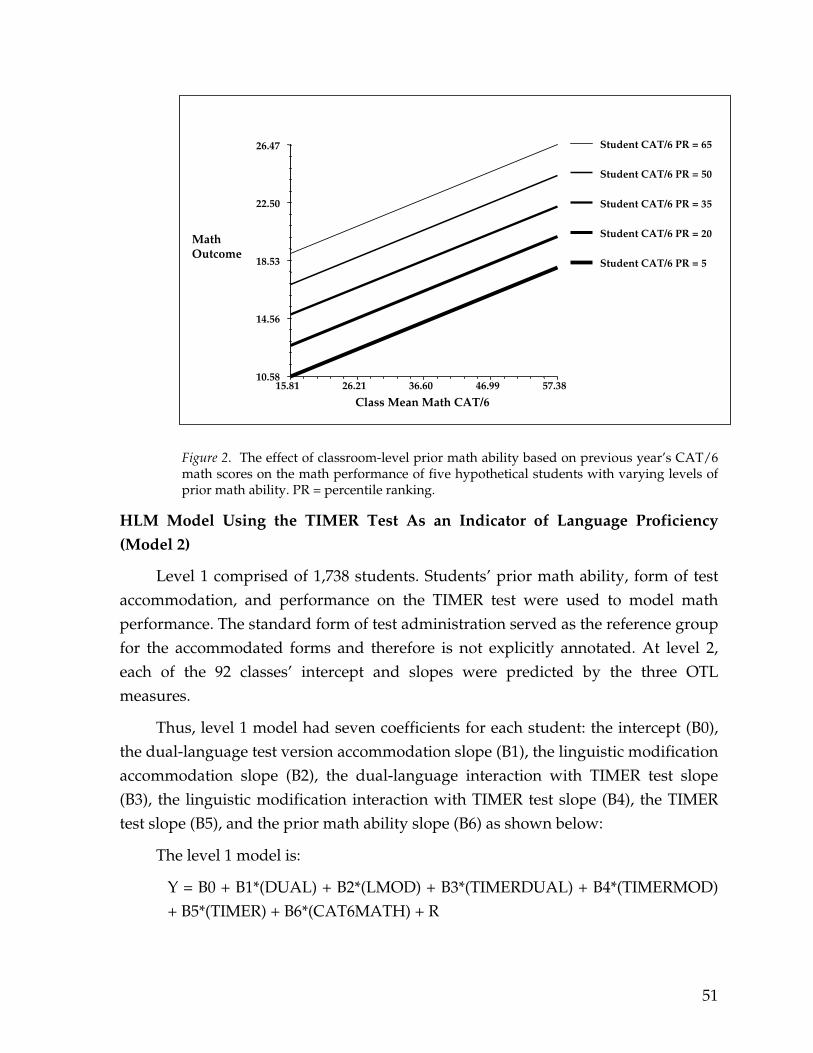
10.58
14.56
18.53
22.50
26.47
Math Outcome
15.81 26.21 36.60 46.99 57.38
Class Mean Math CAT/6
Student CAT/6 PR = 65
Student CAT/6 PR = 50
Student CAT/6 PR = 35
Student CAT/6 PR = 20
Student CAT/6 PR = 5
Figure 2. The effect of classroom-level prior math ability based on previous year’s CAT/6 math scores on the math performance of five hypothetical students with varying levels of prior math ability. PR = percentile ranking.
HLM Model Using the TIMER Test As an Indicator of Language Proficiency
(Model 2)
Level 1 comprised of 1,738 students. Students’ prior math ability, form of test accommodation, and performance on the TIMER test were used to model math performance. The standard form of test administration served as the reference group for the accommodated forms and therefore is not explicitly annotated. At level 2, each of the 92 classes’ intercept and slopes were predicted by the three OTL measures.
Thus, level 1 model had seven coefficients for each student: the intercept (B0), the dual-language test version accommodation slope (B1), the linguistic modification accommodation slope (B2), the dual-language interaction with TIMER test slope (B3), the linguistic modification interaction with TIMER test slope (B4), the TIMER test slope (B5), and the prior math ability slope (B6) as shown below:
The level 1 model is:
Y = B0 + B1*(DUAL) + B2*(LMOD) + B3*(TIMERDUAL) + B4*(TIMERMOD) + B5*(TIMER) + B6*(CAT6MATH) + R
51
DUAL represents the dual-language test version; LMOD is the linguistic modification accommodation version; TIMERDUAL is the dual-language test version interaction with the TIMER test score; TIMERMOD is the linguistic modification accommodation interaction with the TIMER test score; TIMER represents the score on the TIMER test, and CAT6MATH is prior math ability as determined by students’ Grade 7 CAT/6 math scores.
At level 2, the intercept, the dual-language test version slope, the linguistic modification version slope, and the TIMER test score slope are modeled as functions of the three OTL measures. The level 2 model is:
B0 = G00 + G01*(SCONTENT) + G02*(CKTM) + G03*(MEANCAT6) + U0 B1 = G10 + G11*(SCONTENT) + G12*(CKTM) + G13*(MEANCAT6) B2 = G20+ G21*(SCONTENT) + G22*(CKTM) + G23*(MEANCAT6) B3 = G30 B4 = G40 B5 = G50+ G51*(SCONTENT) + G52*(CKTM) + G53*(MEANCAT6) B6 = G60
SCONTENT represents the mean of student report of content coverage; CKTM is teacher content knowledge (as demonstrated on the CKT-M measure); and MEANCAT6 is the mean class prior math ability (measured by CAT/6 Math).
The results from this model were similar to those the prior model. All three measures of class-level OTL had a significant relationship (p<.01) to the intercept of the math performance outcome measure (Research Question #1). This indicates that high levels of classroom OTL were associated with improved math performance when we controlled for prior math ability, test accommodation, and TIMER test scores at the student level. Again, we produced an effect size (Beta) to inform the magnitude of the effect of each significant finding. Prior class math ability and student-level prior math ability both had a large effect on student performance (Beta=.441 and .564 respectively).
Table 11 outlines the results.
52
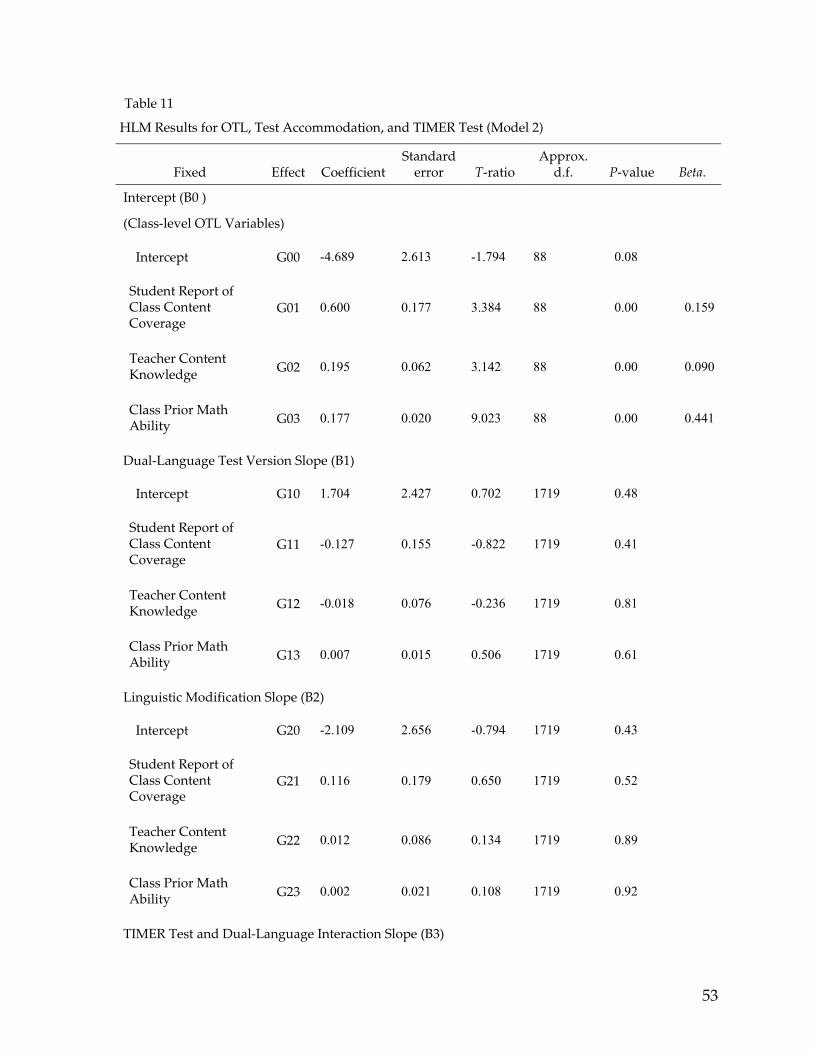
Table 11
HLM Results for OTL, Test Accommodation, and TIMER Test (Model 2)
Fixed Effect Coefficient Standard
error T-ratio Approx.
d.f. P-value Beta.
Intercept (B0 )
(Class-level OTL Variables)
Intercept G00 -4.689 2.613 -1.794 88 0.08
Student Report of Class Content Coverage
G01 0.600 0.177 3.384 88 0.00 0.159
Teacher Content Knowledge G02 0.195 0.062 3.142 88 0.00 0.090
Class Prior Math Ability G03 0.177 0.020 9.023 88 0.00 0.441
Dual-Language Test Version Slope (B1)
Intercept G10 1.704 2.427 0.702 1719 0.48
Student Report of Class Content Coverage
G11 -0.127 0.155 -0.822 1719 0.41
Teacher Content Knowledge G12 -0.018 0.076 -0.236 1719 0.81
Class Prior Math Ability G13 0.007 0.015 0.506 1719 0.61
Linguistic Modification Slope (B2)
Intercept G20 -2.109 2.656 -0.794 1719 0.43
Student Report of Class Content Coverage
G21 0.116 0.179 0.650 1719 0.52
Teacher Content Knowledge G22 0.012 0.086 0.134 1719 0.89
Class Prior Math Ability G23 0.002 0.021 0.108 1719 0.92
TIMER Test and Dual-Language Interaction Slope (B3)
53
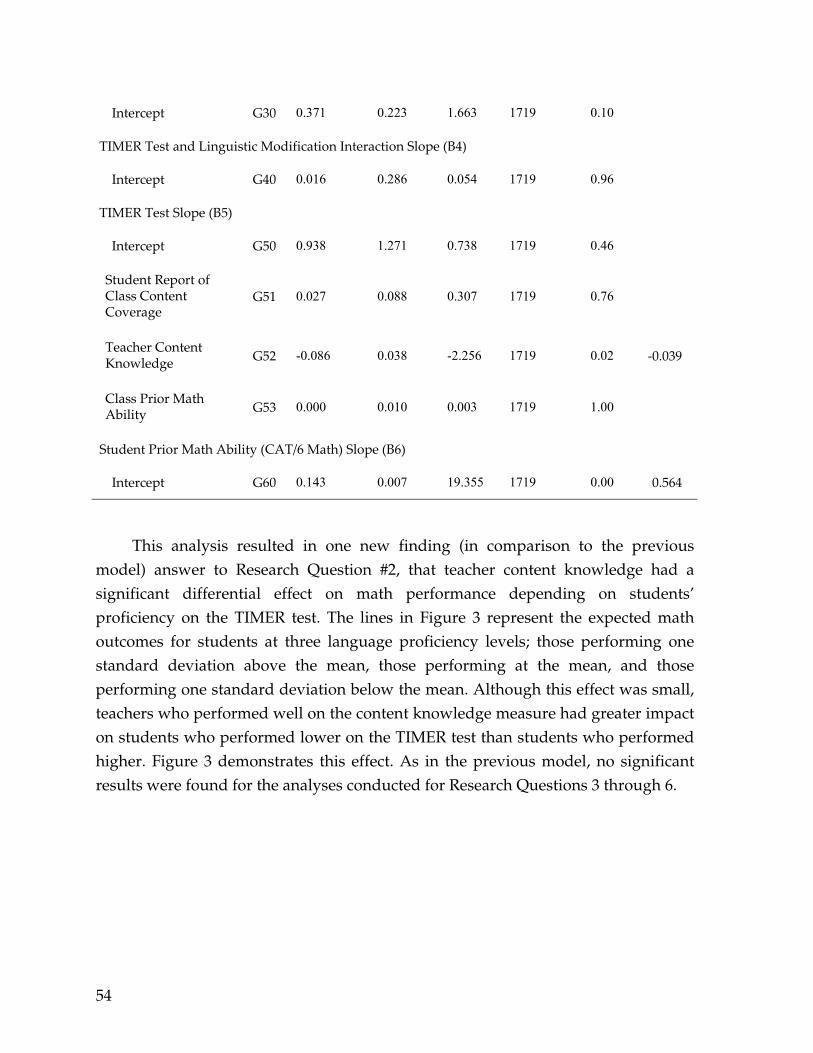
Intercept G30 0.371 0.223 1.663 1719 0.10
TIMER Test and Linguistic Modification Interaction Slope (B4)
Intercept G40 0.016 0.286 0.054 1719 0.96
TIMER Test Slope (B5)
Intercept G50 0.938 1.271 0.738 1719 0.46
Student Report of Class Content Coverage
G51 0.027 0.088 0.307 1719 0.76
Teacher Content Knowledge G52 -0.086 0.038 -2.256 1719 0.02 -0.039
Class Prior Math Ability G53 0.000 0.010 0.003 1719 1.00
Student Prior Math Ability (CAT/6 Math) Slope (B6)
Intercept G60 0.143 0.007 19.355 1719 0.00 0.564
This analysis resulted in one new finding (in comparison to the previous model) answer to Research Question #2, that teacher content knowledge had a significant differential effect on math performance depending on students’ proficiency on the TIMER test. The lines in Figure 3 represent the expected math outcomes for students at three language proficiency levels; those performing one standard deviation above the mean, those performing at the mean, and those performing one standard deviation below the mean. Although this effect was small, teachers who performed well on the content knowledge measure had greater impact on students who performed lower on the TIMER test than students who performed higher. Figure 3 demonstrates this effect. As in the previous model, no significant results were found for the analyses conducted for Research Questions 3 through 6.
54
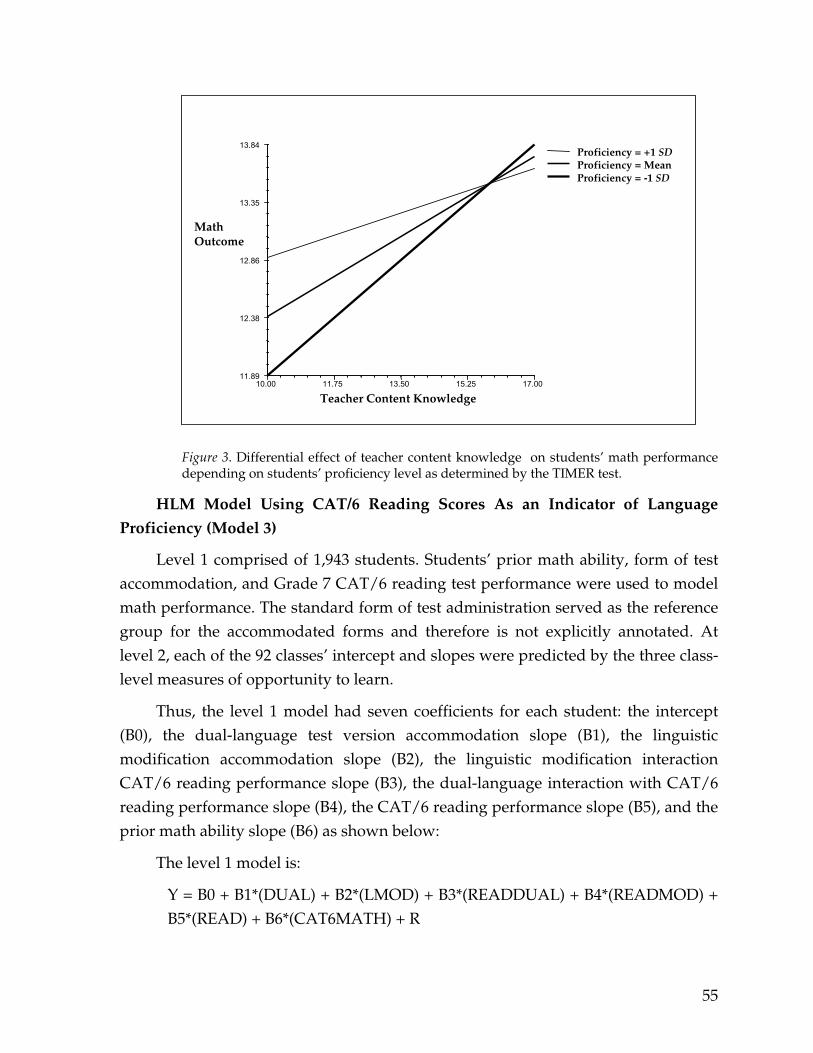
11.89
12.38
12.86
13.35
13.84
Math Outcome
10.00 11.75 13.50 15.25 17.00
Teacher Content Knowledge
Proficiency = +1 SDProficiency = MeanProficiency = -1 SD
Figure 3. Differential effect of teacher content knowledge on students’ math performance depending on students’ proficiency level as determined by the TIMER test.
HLM Model Using CAT/6 Reading Scores As an Indicator of Language
Proficiency (Model 3)
Level 1 comprised of 1,943 students. Students’ prior math ability, form of test accommodation, and Grade 7 CAT/6 reading test performance were used to model math performance. The standard form of test administration served as the reference group for the accommodated forms and therefore is not explicitly annotated. At level 2, each of the 92 classes’ intercept and slopes were predicted by the three class-level measures of opportunity to learn.
Thus, the level 1 model had seven coefficients for each student: the intercept (B0), the dual-language test version accommodation slope (B1), the linguistic modification accommodation slope (B2), the linguistic modification interaction CAT/6 reading performance slope (B3), the dual-language interaction with CAT/6 reading performance slope (B4), the CAT/6 reading performance slope (B5), and the prior math ability slope (B6) as shown below:
The level 1 model is:
Y = B0 + B1*(DUAL) + B2*(LMOD) + B3*(READDUAL) + B4*(READMOD) + B5*(READ) + B6*(CAT6MATH) + R
55
Where DUAL represents the dual-language test version; LMOD is the linguistic modification accommodation version; READDUAL is the dual-language interaction with CAT/6 reading performance; READMOD is the linguistic modification interaction with CAT/6 reading performance; READ represents the CAT/6 reading performance, and CAT6MATH is prior math ability as measured by the CAT/6 math test.
At level 2, the intercept, the dual-language test version slope, the linguistic modification version slope, and the reading proficiency slope were modeled as functions of the three OTL measures. The level 2 model is:
B0 = G00 + G01*(SCONTENT) + G02*(CKTM) + G03*(MEANCAT6) + U0
B1 = G10 + G11*(SCONTENT) + G12*(CKTM) + G13*(MEANCAT6)
B2 = G20+ G21*(SCONTENT) + G22*(CKTM) + G23*(MEANCAT6)
B3 = G30
B4 = G40
B5 = G50+ G51*(SCONTENT) + G52*(CKTM) + G53*(MEANCAT6)
B6 = G60 SCONTENT represents the mean of student report of content coverage; CKTM is teacher content knowledge (as demonstrated on the CKT-M measure); and MEANCAT6 is the mean class prior math ability (measured by CAT/6 Math).
The results from this model were again very similar to those the first model which used ELL status. All three measures of class-level OTL had a significant relationship (p<.01) to the intercept of the math performance outcome measure (Research Question #1). This indicates that high levels of class-level OTL were associated with improved math performance when we controlled for prior math ability, test accommodation, and CAT/6 reading performance at the student level. Again, we produced an effect size (Beta) to inform the magnitude of the effect of each significant finding. Prior class math ability and student-level prior math ability both had a large effect on student performance (Beta=.443 and .536 respectively). No significant results were found from the analyses conducted for Research Questions 2 through 6.
Table 12 outlines the results.
56
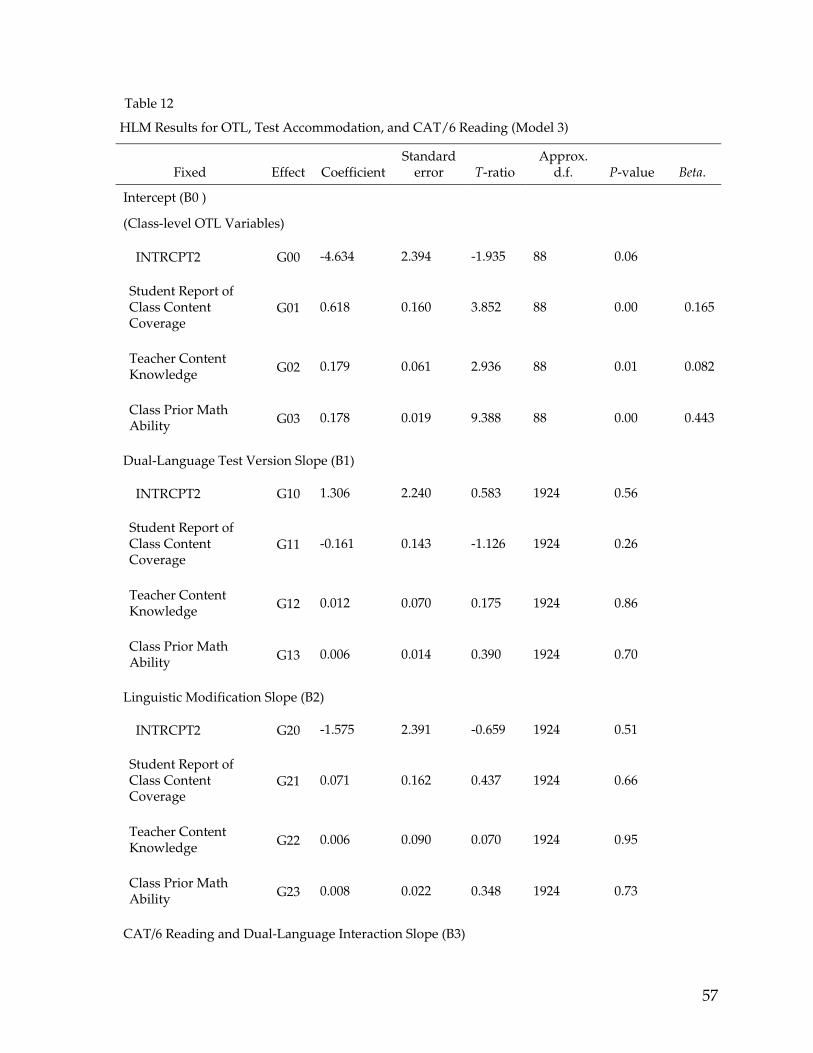
Table 12
HLM Results for OTL, Test Accommodation, and CAT/6 Reading (Model 3)
Fixed Effect Coefficient Standard
error T-ratio Approx.
d.f. P-value Beta.
Intercept (B0 )
(Class-level OTL Variables)
INTRCPT2 G00 -4.634 2.394 -1.935 88 0.06
Student Report of Class Content Coverage
G01 0.618 0.160 3.852 88 0.00 0.165
Teacher Content Knowledge G02 0.179 0.061 2.936 88 0.01 0.082
Class Prior Math Ability G03 0.178 0.019 9.388 88 0.00 0.443
Dual-Language Test Version Slope (B1)
INTRCPT2 G10 1.306 2.240 0.583 1924 0.56
Student Report of Class Content Coverage
G11 -0.161 0.143 -1.126 1924 0.26
Teacher Content Knowledge G12 0.012 0.070 0.175 1924 0.86
Class Prior Math Ability G13 0.006 0.014 0.390 1924 0.70
Linguistic Modification Slope (B2)
INTRCPT2 G20 -1.575 2.391 -0.659 1924 0.51
Student Report of Class Content Coverage
G21 0.071 0.162 0.437 1924 0.66
Teacher Content Knowledge G22 0.006 0.090 0.070 1924 0.95
Class Prior Math Ability G23 0.008 0.022 0.348 1924 0.73
CAT/6 Reading and Dual-Language Interaction Slope (B3)
57
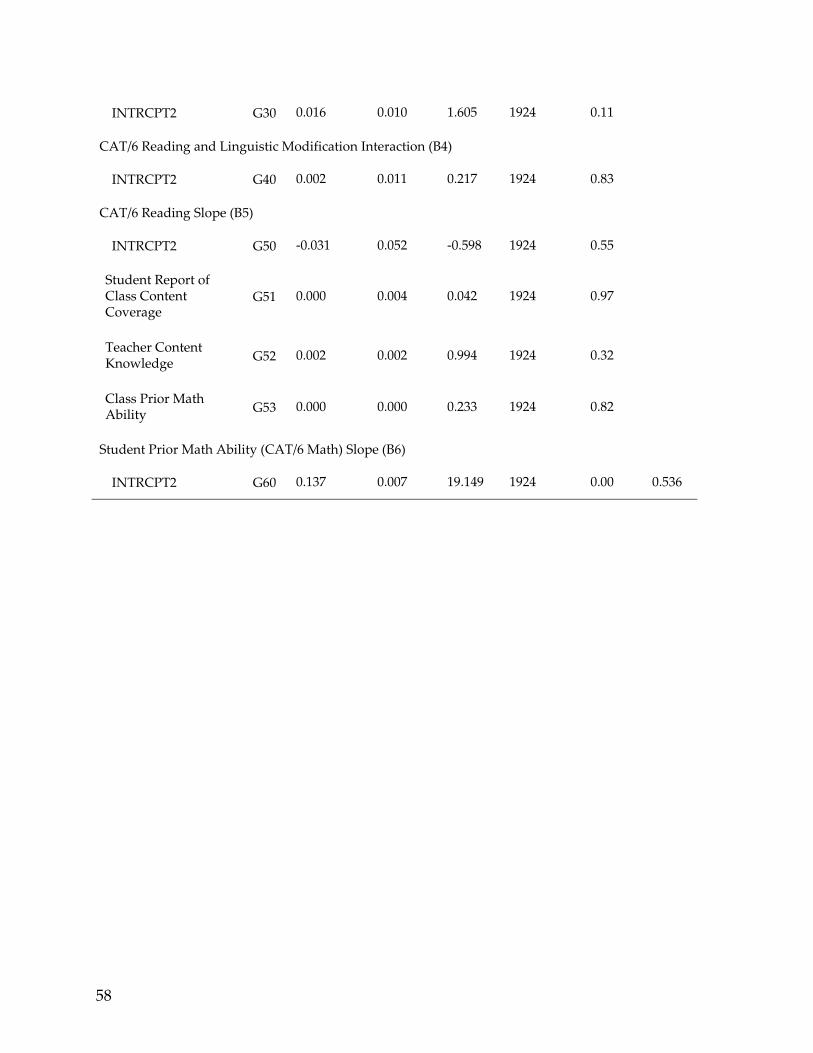
INTRCPT2 G30 0.016 0.010 1.605 1924 0.11
CAT/6 Reading and Linguistic Modification Interaction (B4)
INTRCPT2 G40 0.002 0.011 0.217 1924 0.83
CAT/6 Reading Slope (B5)
INTRCPT2 G50 -0.031 0.052 -0.598 1924 0.55
Student Report of Class Content Coverage
G51 0.000 0.004 0.042 1924 0.97
Teacher Content Knowledge G52 0.002 0.002 0.994 1924 0.32
Class Prior Math Ability G53 0.000 0.000 0.233 1924 0.82
Student Prior Math Ability (CAT/6 Math) Slope (B6)
INTRCPT2 G60 0.137 0.007 19.149 1924 0.00 0.536
58
II. Language Proficiency and Opportunity To Learn
Three sets of analyses were performed to examine the relationship between student language proficiency and math performance. As in the analyses for the previous research questions, we investigated three class-level OTL measures and three different means of creating student subgroups based on language proficiency10.
Research Question #7: Do students of varying language proficiency receive the same level of OTL?
a) ELL status (ELL or non-ELL)
b) TIMER test indicators (bottom third, middle third, top third)
c) CAT/6 reading performance indicators (25th percentile and below, 26th to 50th percentile, Above 50th percentile)
To answer Research Question #7a (Do ELL students receive the same level of OTL as compared to non-ELL students?), we computed and compared mean OTL, which included student class mean content coverage, the teacher content knowledge outcome (teacher demonstration of content knowledge), and students’ prior math ability at the classroom level. We compared the means of these three measures using a simple analysis of variance and found significant differences on all three. (See Table 13 and 14.) We ran one-factor MANOVA (Table 14) to test if the means are different where the factor is ELL status with three separate OTL outcome variables. We produced an effect size (Eta squared) to inform the magnitude of effect, i.e., how large the difference was between ELL and non-ELL students. In general, ELL students were in classes with less content coverage, with teachers who demonstrated less content knowledge, and with classmates whose prior math ability was low.
10 As previously mentioned, conducting analyses with the TIMER test, which can be perceived as a reading proficiency measure, and with CAT/6 reading test scores, does not mean that we advocate their use as sole measures of language proficiency. However, due to the limited available data, and due to our belief that meaningful insight can still be gathered, we separated our analyses and our discussion by these indicators of “language proficiency.” We have termed them all as indicators of language proficiency for the purposes of this report only.
59
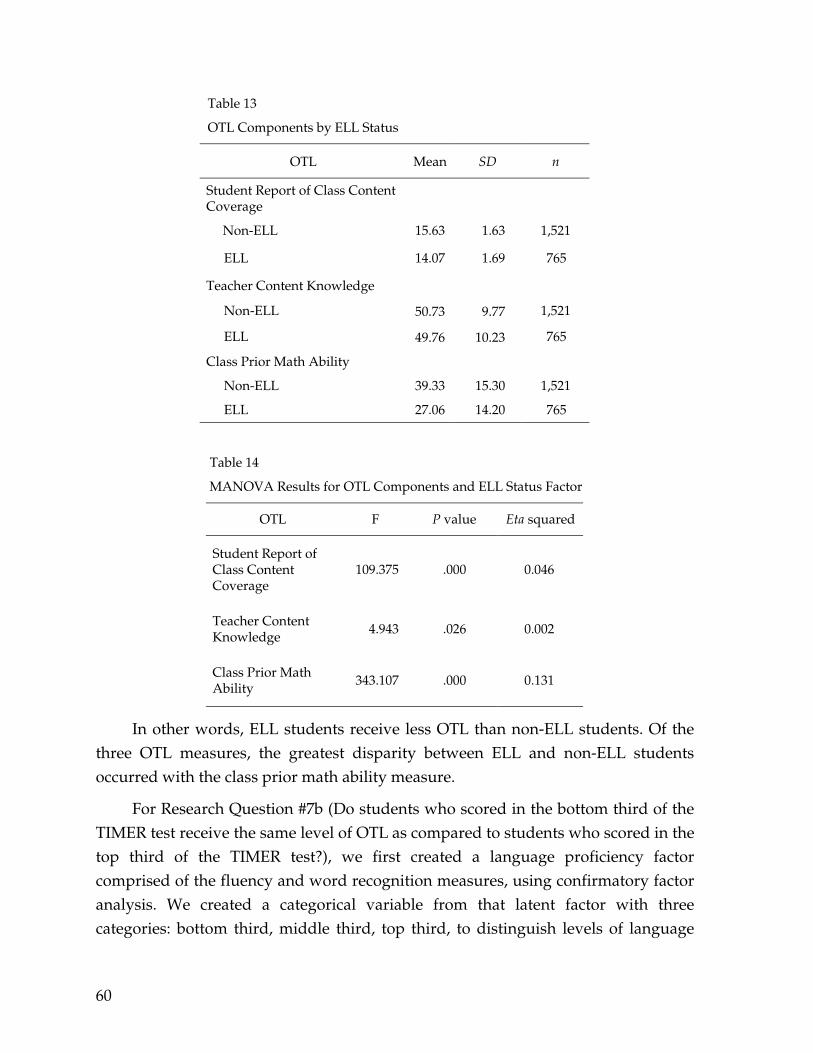
Table 13
OTL Components by ELL Status
OTL Mean SD n
Student Report of Class Content Coverage
Non-ELL 15.63 1.63 1,521
ELL 14.07 1.69 765
Teacher Content Knowledge
Non-ELL 50.73 9.77 1,521
ELL 49.76 10.23 765
Class Prior Math Ability
Non-ELL 39.33 15.30 1,521
ELL 27.06 14.20 765
Table 14
MANOVA Results for OTL Components and ELL Status Factor
OTL F P value Eta squared
Student Report of Class Content Coverage
109.375 .000 0.046
Teacher Content Knowledge
4.943 .026 0.002
Class Prior Math Ability 343.107 .000 0.131
In other words, ELL students receive less OTL than non-ELL students. Of the three OTL measures, the greatest disparity between ELL and non-ELL students occurred with the class prior math ability measure.
For Research Question #7b (Do students who scored in the bottom third of the TIMER test receive the same level of OTL as compared to students who scored in the top third of the TIMER test?), we first created a language proficiency factor comprised of the fluency and word recognition measures, using confirmatory factor analysis. We created a categorical variable from that latent factor with three categories: bottom third, middle third, top third, to distinguish levels of language
60
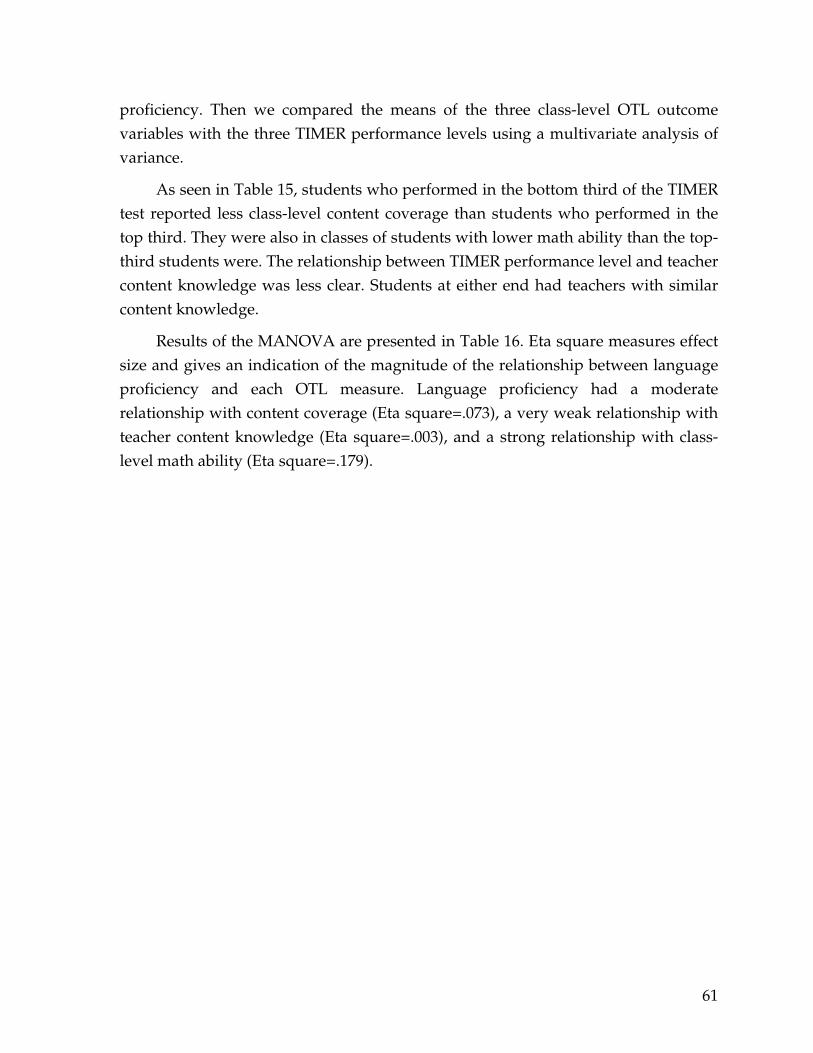
proficiency. Then we compared the means of the three class-level OTL outcome variables with the three TIMER performance levels using a multivariate analysis of variance.
As seen in Table 15, students who performed in the bottom third of the TIMER test reported less class-level content coverage than students who performed in the top third. They were also in classes of students with lower math ability than the top-third students were. The relationship between TIMER performance level and teacher content knowledge was less clear. Students at either end had teachers with similar content knowledge.
Results of the MANOVA are presented in Table 16. Eta square measures effect size and gives an indication of the magnitude of the relationship between language proficiency and each OTL measure. Language proficiency had a moderate relationship with content coverage (Eta square=.073), a very weak relationship with teacher content knowledge (Eta square=.003), and a strong relationship with class-level math ability (Eta square=.179).
61
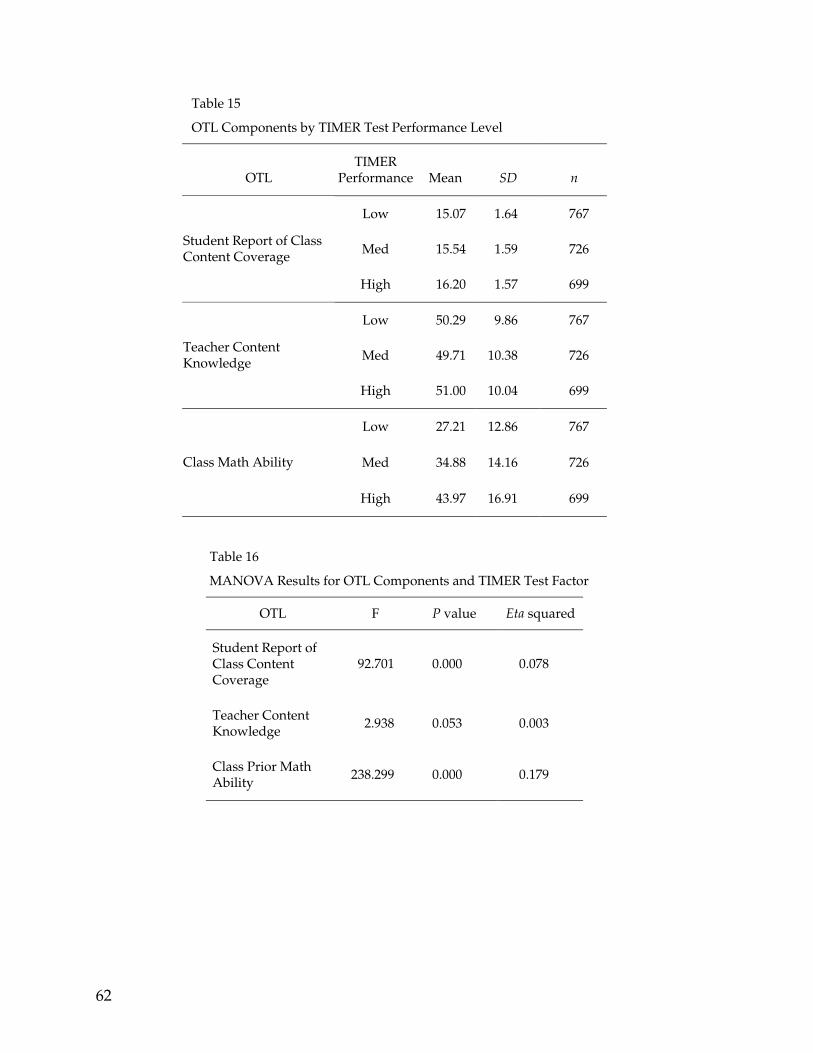
Table 15
OTL Components by TIMER Test Performance Level
OTL TIMER
Performance Mean SD n
Low 15.07 1.64 767
Med 15.54 1.59 726 Student Report of Class Content Coverage
High 16.20 1.57 699
Low 50.29 9.86 767
Med 49.71 10.38 726 Teacher Content Knowledge
High 51.00 10.04 699
Low 27.21 12.86 767
Med 34.88 14.16 726 Class Math Ability
High 43.97 16.91 699
Table 16
MANOVA Results for OTL Components and TIMER Test Factor
OTL F P value Eta squared
Student Report of Class Content Coverage
92.701 0.000 0.078
Teacher Content Knowledge 2.938 0.053 0.003
Class Prior Math Ability
238.299 0.000 0.179
62

For Research Question #7c (Do students who scored in the lower CAT/6 reading percentile ranking receive the same level of OTL as compared to students who scored in the higher CAT/6 percentile ranking), we created a categorical variable with three categories: 25th percentile and below, 26th to 50th percentile, and above 50th percentile, to distinguish levels of performance. Then we compared the means of the three OTL outcome variables with the three performance levels using a multivariate analysis of variance.
As seen in Table 17, students in the lower CAT/6 reading percentile ranking reported less class-level content coverage than students in the higher ranking. Also, they were in classes of students with lower math ability than students in the higher ranking were. There was also a significant relationship (p<.05) between CAT/6 reading performance and teacher content knowledge, however, the effect size was negligible.
Results of the MANOVA are presented in Table 18. Eta square measures effect size and gives an indication of the magnitude of the relationship between reading performance and each OTL measure. Reading performance has a relatively strong relationship with content coverage (Eta square=.138), a negligible relationship with teacher content knowledge (Eta square=.003), and a strong relationship with class-level math ability (Eta square=.263).
63
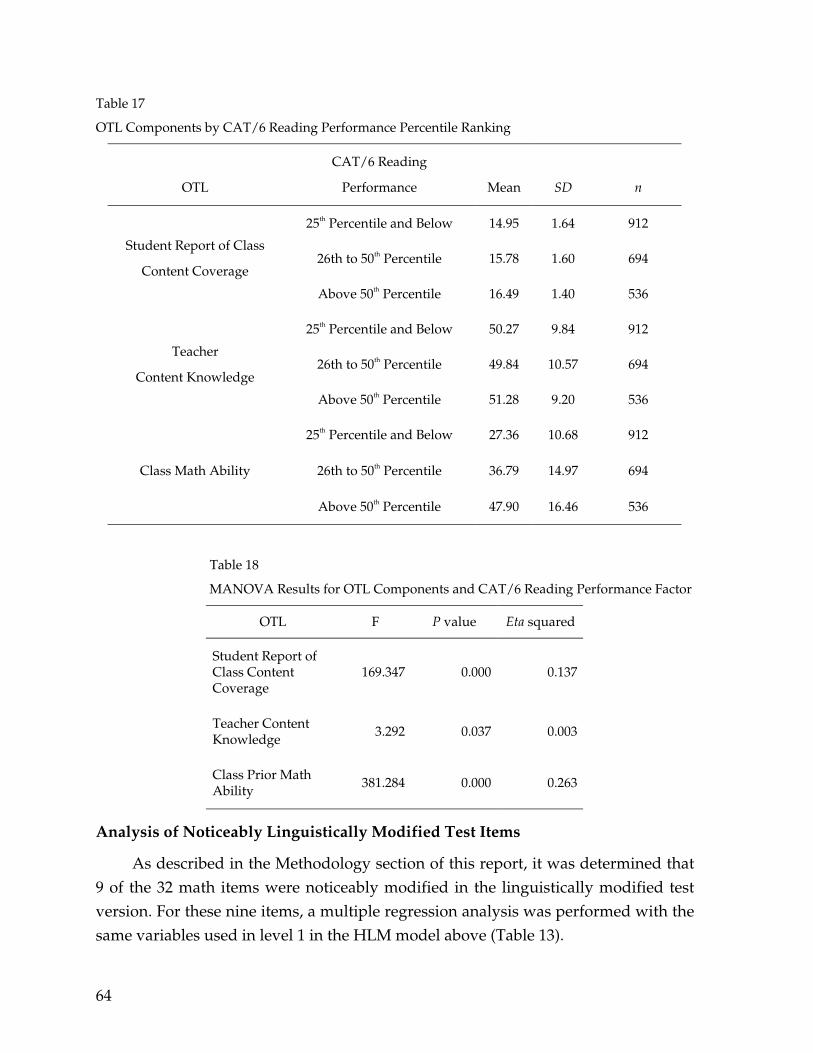
Table 17
OTL Components by CAT/6 Reading Performance Percentile Ranking
OTL
CAT/6 Reading
Performance Mean SD n
25th Percentile and Below 14.95 1.64 912
26th to 50th Percentile 15.78 1.60 694 Student Report of Class
Content Coverage
Above 50th Percentile 16.49 1.40 536
25th Percentile and Below 50.27 9.84 912
26th to 50th Percentile 49.84 10.57 694 Teacher
Content Knowledge
Above 50th Percentile 51.28 9.20 536
25th Percentile and Below 27.36 10.68 912
26th to 50th Percentile 36.79 14.97 694 Class Math Ability
Above 50th Percentile 47.90 16.46 536
Table 18
MANOVA Results for OTL Components and CAT/6 Reading Performance Factor
OTL F P value Eta squared
Student Report of Class Content Coverage
169.347 0.000 0.137
Teacher Content Knowledge
3.292 0.037 0.003
Class Prior Math Ability
381.284 0.000 0.263
Analysis of Noticeably Linguistically Modified Test Items
As described in the Methodology section of this report, it was determined that 9 of the 32 math items were noticeably modified in the linguistically modified test version. For these nine items, a multiple regression analysis was performed with the same variables used in level 1 in the HLM model above (Table 13).
64
The regression model is:
Y = B0 + B1*(DUAL) + B2*(LMOD) + B3*(ELLDUAL) + B4*(ELLMOD) + B5*(ELL) + B6*(CAT6MATH) + R
DUAL represents the dual-language test version; LMOD is the linguistic modification accommodation version; ELLDUAL is the dual-language interaction with ELL status; ELLMOD is the linguistic modification interaction with ELL status; ELL represents ELL status, and CAT6MATH is prior math ability as measured by the CAT/6 math test.
Results of the multiple regression in Table 19 indicate that the main effect of the linguistic modification of the nine items was significant (p=0.015). Neither the main effect of ELL status nor the interaction between ELL status and linguistic modification was significant. These results indicate that the linguistic modification accommodation on those items was effective (or beneficial) both for ELL and non-ELL students. Since non-ELL students also benefited from the accommodation, the issue of validity arises. However, 64% of the non-ELL students in the sample scored, scored below the national median (50th National Percentile Rank [NPR]) on the CAT/6 reading assessment. Nearly 30% of the non-ELL students scored in the bottom quartile (below 25th NPR) on the same test. It is not surprising then, that a linguistic modification would benefit both the ELL and non-ELL students in the study. Whether it would affect high-performing non-ELL students remains to be determined.
65
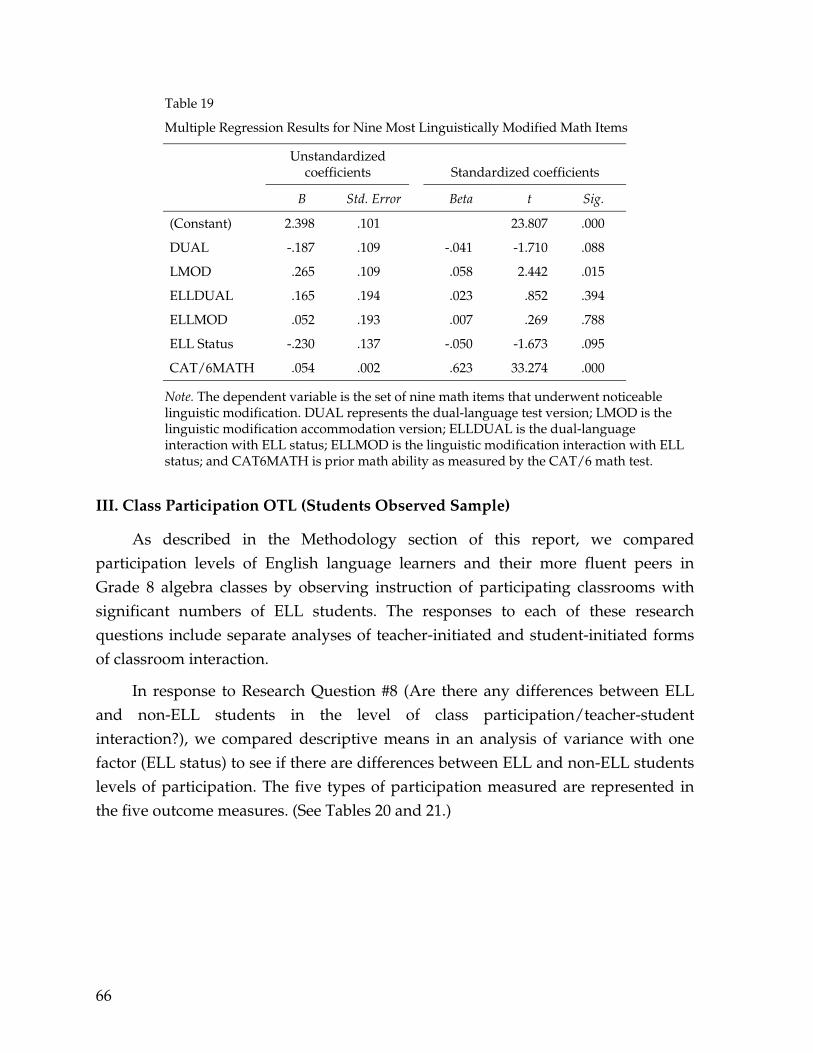
Table 19
Multiple Regression Results for Nine Most Linguistically Modified Math Items
Unstandardized
coefficients Standardized coefficients
B Std. Error Beta t Sig.
(Constant) 2.398 .101 23.807 .000
DUAL -.187 .109 -.041 -1.710 .088
LMOD .265 .109 .058 2.442 .015
ELLDUAL .165 .194 .023 .852 .394
ELLMOD .052 .193 .007 .269 .788
ELL Status -.230 .137 -.050 -1.673 .095
CAT/6MATH .054 .002 .623 33.274 .000
Note. The dependent variable is the set of nine math items that underwent noticeable linguistic modification. DUAL represents the dual-language test version; LMOD is the linguistic modification accommodation version; ELLDUAL is the dual-language interaction with ELL status; ELLMOD is the linguistic modification interaction with ELL status; and CAT6MATH is prior math ability as measured by the CAT/6 math test.
III. Class Participation OTL (Students Observed Sample)
As described in the Methodology section of this report, we compared participation levels of English language learners and their more fluent peers in Grade 8 algebra classes by observing instruction of participating classrooms with significant numbers of ELL students. The responses to each of these research questions include separate analyses of teacher-initiated and student-initiated forms of classroom interaction.
In response to Research Question #8 (Are there any differences between ELL and non-ELL students in the level of class participation/teacher-student interaction?), we compared descriptive means in an analysis of variance with one factor (ELL status) to see if there are differences between ELL and non-ELL students levels of participation. The five types of participation measured are represented in the five outcome measures. (See Tables 20 and 21.)
66
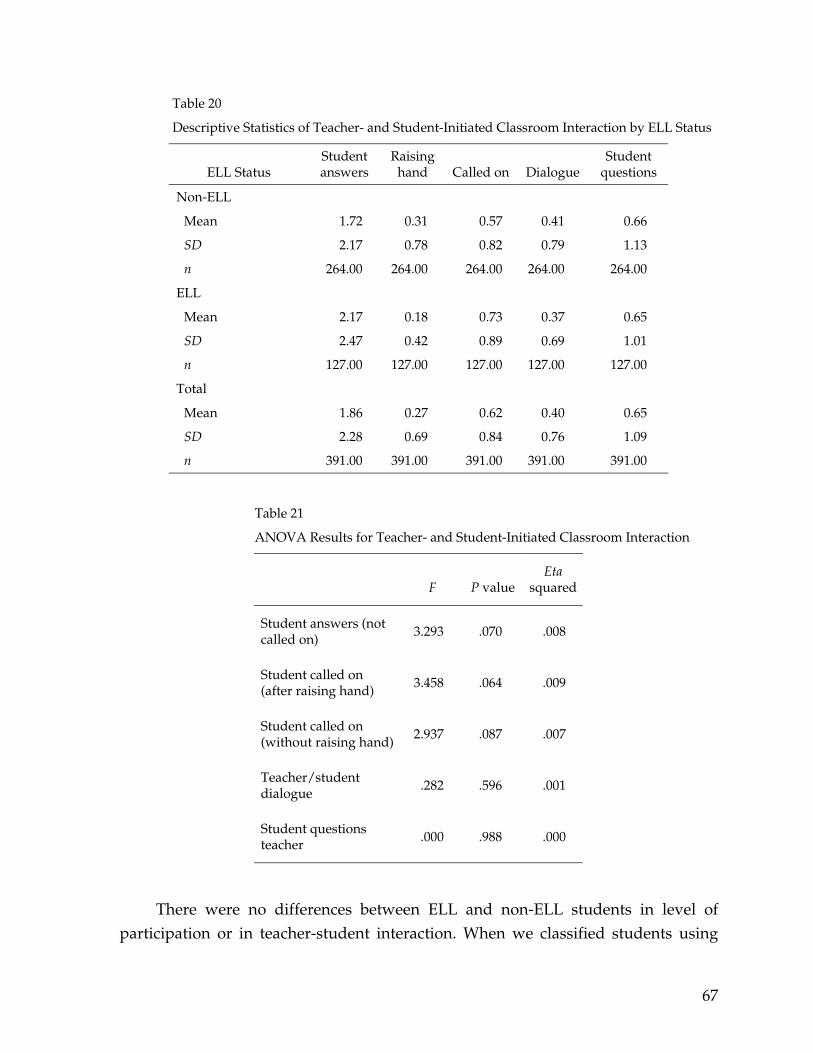
Table 20
Descriptive Statistics of Teacher- and Student-Initiated Classroom Interaction by ELL Status
ELL Status
Student answers
Raising hand
Called on
Dialogue
Student questions
Non-ELL
Mean 1.72 0.31 0.57 0.41 0.66
SD 2.17 0.78 0.82 0.79 1.13
n 264.00 264.00 264.00 264.00 264.00
ELL
Mean 2.17 0.18 0.73 0.37 0.65
SD 2.47 0.42 0.89 0.69 1.01
n 127.00 127.00 127.00 127.00 127.00
Total
Mean 1.86 0.27 0.62 0.40 0.65
SD 2.28 0.69 0.84 0.76 1.09
n 391.00 391.00 391.00 391.00 391.00
Table 21
ANOVA Results for Teacher- and Student-Initiated Classroom Interaction
F P value Eta
squared
Student answers (not called on) 3.293 .070 .008
Student called on (after raising hand) 3.458 .064 .009
Student called on (without raising hand)
2.937 .087 .007
Teacher/student dialogue
.282 .596 .001
Student questions teacher .000 .988 .000
There were no differences between ELL and non-ELL students in level of participation or in teacher-student interaction. When we classified students using
67
TIMER test results, again there were no differences in level of participation or in teacher-student interaction.
In response to Research Question #9 (Is there a relationship between students’ class participation and their math performance?) we performed HLM analyses. (See Table 22.) The HLM model examined the effects of student-initiated class participation, teacher-initiated class participation, and students’ prior math performance on student math performance.
Student-initiated class participation was counted under three conditions:
1) A student answered a question without being called on
2) A student was called on after raising a hand
3) A student questioned the teacher without being prompted
Teacher-initiated class participation was counted under two conditions:
1) The teacher called on a student who had not raised a hand
2) The teacher continued a dialogue with a student
Level 1 comprised of 331 students. Student-initiated class participation, teacher-initiated class participation, and prior math ability were used to model math performance. At level 2, each of the 34 classes’ intercepts were predicted by the mean class prior math ability.
Thus, the level 1 model had four coefficients for each student: the intercept (B0), the student initiated class participation, slope (B1), the teacher initiated class participation (B2), and the prior math ability slope (B3) as shown below:
The level 1 model is:
Y = B0 + B1*(STUDINIT) + B2*(TEACHINIT) + B3*(CAT6MATH) + R
At level 2, the intercept is modeled as a function of the class level mean prior math performance. The level-2 model is:
B0 = G00 + G01* *(MEANCAT6) + U0
B1 = G10
B2 = G20
B3 = G30
Table 22 details the class participation model results.
68
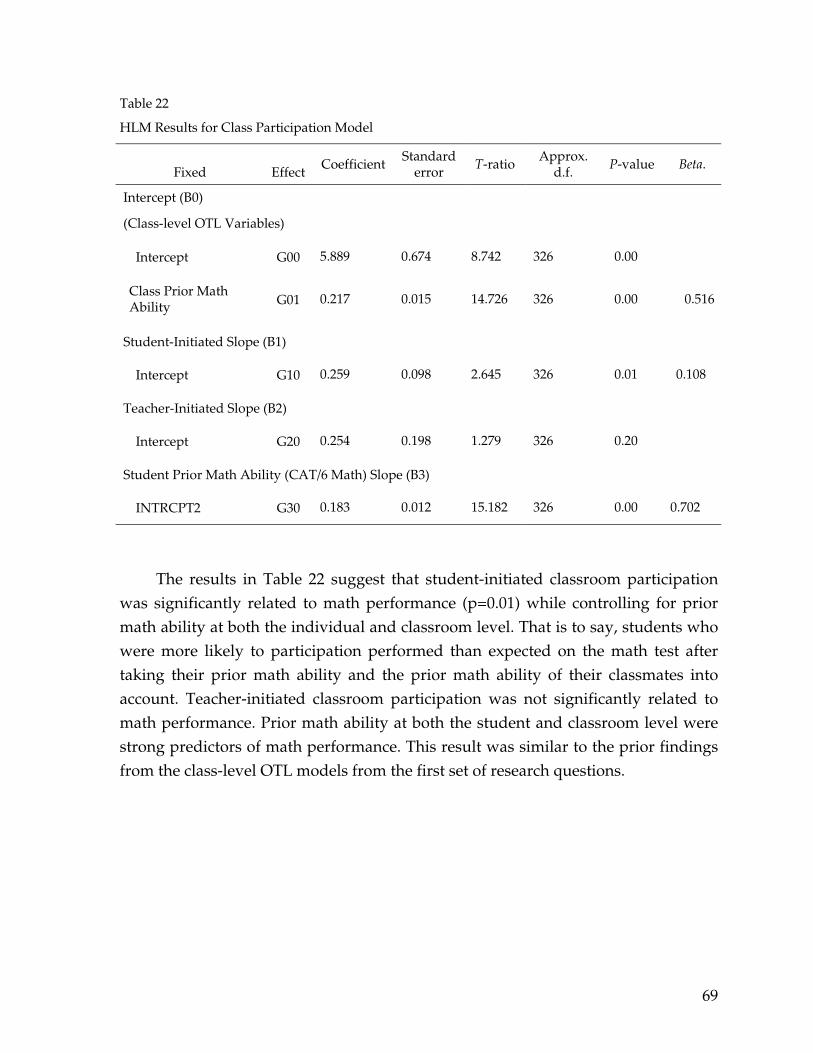
Table 22
HLM Results for Class Participation Model
Fixed Effect Coefficient Standard error T-ratio Approx.
d.f. P-value Beta.
Intercept (B0)
(Class-level OTL Variables)
Intercept G00 5.889 0.674 8.742 326 0.00
Class Prior Math Ability G01 0.217 0.015 14.726 326 0.00 0.516
Student-Initiated Slope (B1)
Intercept G10 0.259 0.098 2.645 326 0.01 0.108
Teacher-Initiated Slope (B2)
Intercept G20 0.254 0.198 1.279 326 0.20
Student Prior Math Ability (CAT/6 Math) Slope (B3)
INTRCPT2 G30 0.183 0.012 15.182 326 0.00 0.702
The results in Table 22 suggest that student-initiated classroom participation was significantly related to math performance (p=0.01) while controlling for prior math ability at both the individual and classroom level. That is to say, students who were more likely to participation performed than expected on the math test after taking their prior math ability and the prior math ability of their classmates into account. Teacher-initiated classroom participation was not significantly related to math performance. Prior math ability at both the student and classroom level were strong predictors of math performance. This result was similar to the prior findings from the class-level OTL models from the first set of research questions.
69
Summary and Discussion
Nine research questions guided the literature review, instrument development, sampling of students, data collection, data analyses, and reporting for this study. These questions were arranged into three sets. The first set (Research Questions #1 to 6) focused on class-level components of opportunity to learn (OTL); the impact of OTL on math performance for ELL and non-ELL students and students of varying language proficiency levels; the validity and effectiveness of the accommodations used in this study; and the impact of OTL on students receiving accommodations; The second set (Question #7a to 7c) focused on the interaction between students’ level of English language proficiency and opportunity to learn. The last set of questions (Questions #8 and 9) examined the differences between ELL and non-ELL students’ participation in the classroom, and the relationship of participation with students’ math performance.
Opportunity to Learn
The first research question asks if the three class-level components of OTL that we examined in this study impact students’ math performance. The three class-level OTL measures were: (1) the class mean of student report of content coverage, (2) a measure of teacher content knowledge, and (3) the mean class prior math ability. We conceptualized teacher content knowledge as a class-level variable and did not sample more than two classrooms per teacher to reduce teacher-level effects. The students’ prior math ability at the class level served as an OTL variable since a high-performing environment is likely to motivate all students in that environment to work harder and perform better. In addition, the prior math ability at the student level was used as a covariate.
Analyses were conducted separately for ELL and non-ELL students to explore the possible differential impact of OTL on ELL and non-ELL students based on the English language development levels provided by the school. In addition to grouping students by ELL status (i.e., ELL or non-ELL), we also grouped them by their score on our TIMER test, and by their CAT/6 reading test performance. We used additional language proficiency groupings since not all ELL students may be classified as such, and not all non-ELL students may be fully English proficient. Additionally, we did not have access to recent measures of English proficiency for all students sampled in this study, and we believed the additional groupings could still provide some insight. Thus, the score from our TIMER test served as a rough
70
measure of reading proficiency, which is a critical component of language proficiency, especially in the context of taking a multiple-choice test. While there were limitations on the construct and content validity of this measure, it was uniform across the subjects who participated in the study. As discussed in the instrument section of this report, reliability and validity of this test for both ELL and non-ELL students were at the acceptable level. Based on the cut scores established on the TIMER overall latent score, we grouped student performance into thirds: bottom, middle, and top.
The results of HLM analyses indicated that all three class-level OTL measures were significantly related to mathematics performance. Results indicated that high levels of content coverage, class prior ability, and teacher content knowledge were associated with improved math performance when we controlled for prior math ability at the student level. From these results, it is possible that a student with a lower score in Grade 7 on the CAT/6 math exam would, in Grade 8, outperform a higher-scoring student—if the former studied in a class with higher-performing students, and the latter were in a class with very low-performing students. Our results indicated that the ability level of a class has more than twice the effect on performance on math outcome than either content coverage or teacher content knowledge.
These findings have major implications for ELL students with respect to opportunity to learn and educational practices. As indicated above, class prior math ability level was a very strong predictor of students’ math performance. Unfortunately, as the literature suggests, ELL students are traditionally placed in lower-performing classrooms (Wang & Goldschmidt, 1999). One might also consider issues as addressed in the literature related to equity in ability grouping (Oakes, 1992; Rubin & Noguera, 2004).
Research Question #2 asks: “Do the three class-level components of OTL differentially impact the math performance of students with varying language proficiency?” Students grouped by ELL status, by TIMER scores (bottom, middle, and top thirds), and CAT/6 reading percentile rankings were compared on the three class-level OTL components. Results indicated that teachers who performed well on the content knowledge measure had greater impact on students who performed lower on the TIMER test as compared to students who performed higher on the TIMER test. This differential impact however, was not seen when students were grouped by ELL status or CAT/6 reading percentile rankings.
71
Validity and Effectiveness of the Test Accommodations
We also examined the validity and effectiveness of two language-related testing accommodations: (1) dual-language test versions; and (2) linguistic modification of test items. Research Question #3 asks: “Do the dual-language test version and linguistic modification accommodations improve students’ math performance?” No significant results were found for Research Question #3.
Question #4 asked whether the two accommodations differentially impacted the math performance of students with varying language proficiency. Results indicated that the two accommodations did not affect the overall performance of students with varying language proficiency. In examining the math test items, we observed, however, that the linguistic modification accommodation could not meaningfully be applied to all math items because many of them contained little or no English language complexity, and in some cases, no English language. But when the nine math items that were noticeably modified in the linguistically modified test version were isolated and analyzed separately as a subsection, the modified items benefited both ELL and non-ELL students. It is not surprising that in this study linguistic modification would benefit both ELL and non-ELL students in a sample where nearly 30% of the non-ELL students scored in the bottom quartile (below 25th NPR) and sixty-four percent scored below the national median (50th NPR) on the CAT/6 reading assessment. However, any time that non-ELL students also benefit from an accommodation, the issue of validity may be a concern. It must also be noted that the nine linguistically modified math items contained low reliability.
With respect to the dual-language test version accommodation, the results of our analyses did not show significant improvement on ELL student performance using this accommodation. That is, students who received the dual-language test version performed the same as those receiving the standard math test. This finding confirms previous research on dual-language testing, which found that while students preferred a dual-language format, no differences were detected in their performance (Duncan et al., 2002, 2005). When the accommodation test results were analyzed using the TIMER test and CAT/6 reading performance groupings, the results also indicated that the main effect of a test booklet’s language accommodation was not related to overall performance.
72
Opportunity to Learn and Accommodations
Research Question #5 asked: “Do the three class-level components of OTL differentially impact students who received the dual-language test version accommodation?” The results of analyses did not show any interaction between the three OTL measures and dual-language test version results. This is mainly due to the fact that the dual-language test did not show a major impact on student performance outcomes.
Similarly, Question #6 asked: “Do the three class-level components of OTL differentially impact students who received the linguistic modification accommodation?” Results of analyses for this question were also not significant. That is, there was no interaction between OTL variables and the linguistic modification accommodation.
Language Proficiency and Opportunity to Learn
Research Question #7 asks if students with varying levels of English language proficiency receive the same level of OTL. To respond to this research question, analyses were conducted based on the three indicators used in this study: (1) students’ ELL status, (2) their performance on TIMER and (2) their performance on state reading assessment (CAT/6). Research questions #7a through 7c correspond to each of these criteria, respectively.
To answer Research Question #7a (Do ELL students receive the same level of OTL as compared to non-ELL students?), we computed and compared mean OTL across ELL subgroups. The same three class-level OTL measures investigated earlier were included: student class mean report of content coverage, the teacher content knowledge outcome (teacher demonstration of content knowledge), and students’ prior math ability at the classroom level. Findings indicated that in general, ELL students were in classes with less content coverage, with teachers who demonstrated less content knowledge, and with classmates whose prior math ability was low. In other words, ELL students appear to receive less OTL than non-ELL students. However, content coverage results must be interpreted with caution, since these are based on students’ reports. Of the three OTL measures, the greatest disparity between ELL and non-ELL students occurred with the class prior math ability measure.
73
For Research Question #7b, we compared students who scored lower on the TIMER test with students who scored higher. The results indicated that students with lower scores on TIMER reported less class-level content coverage and were in classes of students with lower math ability than the students who scored higher. The relationship between language proficiency, as determined by the TIMER score, and teacher content knowledge was less clear. Students who scored at either end (lower or higher) had teachers with similar content knowledge.
For Research Question #7c, we compared students who scored in lower percentile rankings on the CAT/6 reading with students who scored higher. The results indicated that students with lower CAT/6 reading performance reported less class-level content coverage and were in classes of students with lower math ability than students with higher CAT/6 reading performance. There was no significant relationship between CAT/6 reading performance and teacher content knowledge.
Class Participation & Performance of ELL and Non-ELL Students
Two research questions were raised about class participation and performance: Question #8: “Are there any differences between ELL and non-ELL students in the level of class participation/teacher-student interaction?” and Question #9: “Is there a relationship between students’ class participation and their math performance?”
With respect to Question #8, there were no differences between ELL and non-ELL students in their level of participation or in teacher-student interaction. When we grouped students by TIMER test results, again there were no differences in level of participation or in teacher-student interaction. As for students’ class participation and their math performance (Question #9), students who were more likely to initiate participation tended to score slightly higher on the math test than students who were not as likely to initiate participation, even after controlling for individual and class prior math ability. Teacher-initiated participation was not significantly related to math performance. Prior math ability at both the student and classroom level were strong predictors of math performance, similar to the findings for the first set of research questions. It must be noted, however, that due to low inter-rater reliability of observational data, and other limitations to the observation process, the results of this section must be interpreted with caution.
In addition to the nine research questions presented above, this study investigated the validity of ELL status assignment by comparing the ELL dichotomy
74
(ELL versus non-ELL) that is determined by the school based on students’ level of English proficiency. As discussed earlier, we used the TIMER test as a measure of reading proficiency, and as a proxy for language proficiency. Once again, while we understand the limitations of this test as a measure of language proficiency, we wanted to use a criterion that is independent of criteria used by schools to designate students as ELL.
For this analysis, we established cut scores around the TIMER score for creating two levels of reading proficiency: (1) the bottom third, and (2) the top third. The ELL status code and our classification based on TIMER were compared. The results suggested that while there was a significant relationship between the designation assigned by the schools’ ELL status system and our classification of language proficiency, there are other variables affecting the ELL status code as determined by schools.
Implications
Results of this study provide some insight into whether ELL students have had the adequate opportunity to learn the material they are being tested on. For instance, all three class-level OTL components were significantly related to mathematics performance for all students. Teachers who scored well on the mathematics content knowledge measure (one of the three class-level OTL components) had a greater impact on students who scored lower on the TIMER test than students who scored higher. Results also indicated a strong relationship between class prior math ability and performance on our algebra test. This warrants further investigation for classroom practices in ability grouping. While not all of our analyses showed significant results, some of the findings indicate that ELL students’ OTL is worthy of consideration and further investigation.
Results from the accommodations analyses suggest that perhaps using linguistically modified test items or a dual-language test version as accommodations may not be adequate or effective for Grade 8 algebra tests. Results from language proficiency and OTL analyses suggest that students with lower levels of language proficiency report less content coverage. While this may seem to indicate that ELL students and other students with lower language proficiency receive less content coverage, the results must be interpreted with caution, since the relationship is not causal.
75
Finally, while it is understandable why a student’s performance in Grade 7 would determine the content she or he receives in Grade 8, we believe some of the results of this study provide some evidence that certain low-performing students can learn algebra and demonstrate algebra knowledge and skills given the right circumstances. Thus, when considering educational practices for ELL students and other potentially low-performing subgroups, one might examine a holistic picture of classroom, teachers, and peers.
Limitations and Suggestions for Future Research
There are several limitations to this study. First, this study was not able to investigate the varying levels of opportunity to learn over a longer time period, which could have a compounding effect on students’ individual educational experiences. Also, this study was not able to query students’ motivation, which is critical to students’ opportunity to learn. In other words, students may have the opportunity to learn, but must also be motivated to take that opportunity. Future research should examine opportunity to learn longitudinally, and query motivation.
Additionally, research on linguistic modification as an accommodation may provide more insight in other content subjects such as science, which contain more linguistically modifiable items and can therefore be examined with opportunity to learn and ELL students. The algebra test used in the present study, as previously indicated, contained few linguistically modifiable items and demonstrated low reliability between items that were linguistically modified.
The observation component of this study was also limited. Using observation as a means of collecting data is already considered to be limited in terms of reliability. Additionally, our observation was not able to utilize video or audio recording data to further interpret the classroom interactions. Classrooms were also only observed once each. Furthermore, some classroom interactions may not necessarily be deemed as indicators of opportunity to learn. Teachers and students asking questions or speaking aloud, for instance, can be interpreted as personality characteristics not related to opportunity to learn, and without personality inventories, we were not able to disentangle such factors. Therefore, findings from the observation portion of this study must be interpreted as preliminary. Future studies should utilize observation studies in depth to further probe opportunity to learn in the classroom.
76
Data with a greater number of teachers, more teacher-level variables (such as years of teaching experience, credential level, etc.) could be used in models similar to the ones we ran with the CKT-M results. Further examination of student background variables, such as the number of years studying in the United States, is worth pursuing. Future studies should also expand upon the operational definitions of class-level OTL, such as employing other means to measure content coverage aside from student report. More importantly, follow-up studies should be conducted to examine the effects of classroom-level prior content knowledge. The impact of such variables on student performance raises major concerns about adequate opportunity to learn for all students.
77
References
Abedi, J. (2002). Standardized achievement tests and English language learners: Psychometrics issues. Educational Assessment, 8(3), 231-257.
Abedi, J. (2004). The No Child Left Behind Act and English language learners: Assessment and accountability issues. Educational Researcher, 33(1), 4-14.
Abedi, J. (2006). Language issues in item-development. In S. M. Downing & T. M. Haladyna (Eds.), Handbook of Test Development (pp. 377-398). Mahwah, NJ: Erlbaum.
Abedi, J., Courtney, M., & Leon, S. (2003a). Effectiveness and validity of accommodations for English language learners in large-scale assessments (CSE Tech. Rep. No. 608). Los Angeles: University of California, National Center for Research on Evaluation, Standards, and Student Testing.
Abedi, J., Courtney, M., & Leon, S. (2003b). Research-supported accommodation for English language learners in NAEP (CSE Tech. Rep. No. 586). Los Angeles: University of California, National Center for Research on Evaluation, Standards, and Student Testing.
Abedi, J., Courtney, M., Mirocha, J., Leon, S., & Goldberg, J. (2005). Language accommodation for English language learners in large-scale assessments: Bilingual dictionaries and linguistic modification (CSE Tech. Rep. No. 666 ). Los Angeles: University of California, National Center for Research on Evaluation, Standards, and Student Testing.
Abedi, J., & Hejri, F. (2004). Accommodations in the National Assessment of Educational Progress for students with limited English proficiency. Applied Measurement in Education, 17(4), 371-392.
Abedi, J., Herman, J. L., Courtney, M., Leon, S., & Kao, J. C. (2004). English language learners and math achievement: A study on classroom level opportunity to learn. Los Angeles, University of California, National Center for Research on Evaluation, Standards, and Student Testing.
Abedi, J., Hofstetter, C., & Lord, C. (2004). Assessment accommodations for English language learners: Implications for policy-based empirical research. Review of Educational Research, 74(1), 1-28.
Abedi, J., Leon, S., & Mirocha, J. (2003). Impact of student language background on content-based performance: Analyses of extant data (CSE Tech. Rep. No. 603). Los Angeles: University of California, National Center for Research on Evaluation, Standards, and Student Testing.
78

Abedi, J., & Lord, C. (2001). The language factor in mathematics tests. Applied Measurement in Education, 14(3), 219-234.
Abedi, J., Lord, C., Boscardin, C. K., & Miyoshi, J. (2000). The effects of accommodations on the assessment of LEP students in NAEP (CSE Tech. Rep. No. 537). Los Angeles: University of California, National Center for Research on Evaluation, Standards, and Student Testing.
Abedi, J., Lord, C., & Hofstetter, C. (1998). Impact of selected background variables on students’ NAEP math performance (CSE Tech. Rep. No. 478). Los Angeles: University of California, National Center for Research on Evaluation, Standards, and Student Testing.
Abedi, J., Lord, C., Hofstetter, C., & Baker, E. (2000). Impact of accommodation strategies on English language learners’ test performance. Educational Measurement: Issues and Practice, 19(3), 16-26.
Abedi, J., Lord, C., & Plummer, J. (1997). Language background as a variable in NAEP mathematics performance (CSE Tech. Rep. No. 429). Los Angeles: University of California, Center for the Study of Evaluation/National Center for Research on Evaluation, Standards, and Student Testing.
American Educational Research Association, American Psychological Association, & National Council on Measurement in Education. (1999). Standards for educational and psychological testing. Washington, DC: American Educational Research Association.
Bailey, A. L., & Butler, F. A. (2003). An evidentiary framework for operationalizing academic language for broad application to K-12 education: A design document. (CSE Tech. Rep. No. 611). Los Angeles: University of California, National Center for Research on Evaluation, Standards, and Student Testing.
Boscardin, C. K., Aguirre-Muñoz, Z., Chinen, M., Leon, S., & Shin, H. S. (2004). Consequences and validity of performance assessment for English learners: Assessing opportunity to learn (OTL) in Grade 6 language arts (CSE Report No. 635). Los Angeles: University of California, National Center for Research on Evaluation, Standards, and Student Testing.
Brewer, D. J., & Stacz, C. (1996). Enhancing opportunity to learn measures in NCES data. Santa Monica, CA: RAND.
Brown, P. B. (1999). Findings of the 1999 plain language field test (Publication T-99-013.1). Inclusive Comprehensive Assessment Systems Project. Newark, DE: Delaware Education Research and Development Center.
79
Carroll, J. B. (1963). A model of school learning. Teachers College Record, 64(8), 723-733.
Chard, D. J., Simmons, D. C., & Kameenui, E. J. (1998). Word recognition: Research bases. In D. C. Simmons & E. J. Kameenui (Eds.), What reading research tells us about children with diverse learning needs: Bases and basics (pp. 141-167). Mahwah, NJ: Erlbaum.
Colker, A. M., Toyama, Y., Trevisan, M., & Haertel, G. (2003, April). Literature review of instructional sensitivity and opportunity to learn studies. Paper presented at the annual meeting of the American Educational Research Association, Chicago, IL.
Collie-Patterson, J. M. (2000, November). The effects of four selected components of opportunity to learn on mathematics achievement of Grade 12 students in New Providence, Bahamas. Paper presented at the annual meeting of the Mid-South Educational Research Association, Bowling Green, KY.
Cummins, D. D., Kintsch, W., Reusser, K., & Weimer, R. (1988). The role of understanding in solving word problems. Cognitive Psychology, 20, 405-438.
Cummins, J. (1984). Bilingualism and special education. San Diego, CA: College Hill Press.
Cummins, J. (1989). Empowering minority students. Sacramento: California Association for Bilingual Education.
Cummins, J. (2000). Language, power and pedagogy: Bilingual children in the crossfire. Clevedon, England: Multilingual Matters, Ltd.
Darling-Hammond, L., Berry, B., & Thoreson, A. (2001). Does teacher certification matter? Evaluating the evidence. Educational Evaluation and Policy Analysis, 23(1), 57-77.
De Corte, E., Verschaffel, L., & DeWin, L. (1985). Influence of rewording verbal problems on children’s problem representations and solutions. Journal of Educational Psychology, 77(4), 460-470.
Duncan, T. G., del Río Parent, L., Chen, L., Ferrara, S., & Johnson, E. (2002, April). Study of a dual-language test booklet in 8th grade mathematics. Paper presented at the annual meeting of the American Educational Research Association, New Orleans, LA.
Duncan, T. G., del Río Parent, L., Chen, W.-H., Ferrara, S., Johnson, E., Oppler, S., & Shieh, Y.-Y. (2005). Study of a dual-language test booklet in eighth-grade mathematics. Applied Measurement in Mathematics, 18(2), 129-161.
80
Duran, R. P. (1989). Assessment and instruction of at-risk Hispanic students. Exceptional Children, 56(2), 154-158.
English, F. W. (2002). On the intractability of the achievement gap in urban schools and the discursive practice of continuing racial discrimination. Education and Urban Society, 34(3), 298-311.
Firestone, W. A., Camilli, G., Yurecko, M., Monfils, L., & Mayrowetz, D. (2000). State standards, socio-fiscal context and opportunity to learn in New Jersey. Educational Policy Analysis Archives, 8(35), 1068-2341.
Fritzberg, G. J. (2001). From rhetoric to reality: Opportunity-to-learn standards and the integrity of American public school reform. Teacher Education Quarterly, 28(1), 169-187.
Gamoran, A., Porter, A. C., Smithson, J., & White, P. A. (1997). Upgrading high school mathematics instruction: Improving learning opportunities for low-achieving, low-income youth. Educational Evaluation and Policy Analysis, 19(4), 325-338.
Gándara, P., Maxwell-Jolly, J., & Driscoll, A. (2005). Listening to teachers of English language learners: A survey of California teachers’ challenges, experiences, and professional development needs. Santa Cruz, CA: The Center for the Future of Teaching and Learning. Retrieved May 19, 2005, from http://www.cftl.org/documents/2005/listeningforweb.pdf
Garcia, G. E. (1991). Factors influencing the English reading test performance of Spanish-speaking Hispanic children. Reading Research Quarterly, 26(4), 371-391.
Gau, S. (1997, March). The distribution and the effects of opportunity to learn on mathematics achievement. Paper presented at the annual meeting of the American Educational Research Association, Chicago, IL.
Gearhart, M., Saxe, G. B., Seltzer, M., Schlackman, J., Ching, C. C., Nasir, N., Fall, R., Bennett, T., Rhine, S., & Sloan, T. F. (1999). Opportunities to learn fractions in elementary mathematics classrooms. Journal for Research in Mathematics Education, 30(3), 286-315.
Geisinger, K. F. (2003). Testing students with limited English proficiency. In J. Wall & G. R. Walz (Eds.), Measuring up: Assessment issues for teachers, counselors, and administrators (pp. 147-159). Greensboro, NC: CAPS Press.
81
Goertz, M. E. (1994). Opportunity to learn: Instructional practices in eighth-grade mathematics: Data from the 1990 NAEP trial state assessment (CPRE Research Report Series No. 32). New Brunswick, NJ: Consortium for Policy Research in Education.
Goldhaber, D. D., & Brewer, D. J. (2000). Does teacher certification matter? High school teacher certification status and student achievement. Educational Evaluation and Policy Analysis, 22(2), 129-145.
Goldhaber, D. D., & Brewer, D. J. (2001). Evaluating the evidence on teacher certification: A rejoinder. Educational Evaluation and Policy Analysis, 23(1), 79-86.
Gough, P. B. (1996). How children learn to read and why they fail. Annals of Dyslexia, 46, 3-20.
Gross, S. (1993). Early mathematics performance and achievement: results of a study within a large suburban school system. Journal of Negro Education, 62(3), 269-287.
Guiton, G., & Oakes, J. (1995). Opportunity to learn and conceptions of educational equality. Educational Evaluation and Policy Analysis, 17(3), 323-336.
Hakuta, K., Butler, Y. G., & Witt, D. (2000). How long does it take English learners to attain proficiency? Santa Barbara: University of California Linguistic Minority Research Institute.
Haladyna, T. M., & Downing, S. M. (2004). Construct-irrelevant variance in high-stakes testing. Educational Measurement: Issues and Practice, 23(1), 17-27.
Hambleton, R. K. (2001). The next generation of the ITC test translation and application guidelines. European Journal of Psychological Assessment, 17(3), 164-172.
Herman, J. L., & Klein, D. C. D. (1996). Evaluating equity in alternative assessment: An illustration of opportunity-to-learn issues. Journal of Educational Research, 89(4), 246-256.
Herman, J. L., Klein, D. C. D., & Abedi, J. (2000). Assessing students’ opportunity to learn: teacher and student perspectives. Educational Measurement: Issues and Practice, 19(4), 16-24.
Hill, H. C., Rowan, B., & Ball, D. B. (2005). Effects of teachers’ mathematical knowledge for teaching on student achievement. American Educational Research Journal, 42(2), 371-406.
82
Hill, H. C., Schilling, S. G., & Ball, D. B. (2004). Developing measures of teachers’ mathematics knowledge for teaching. The Elementary School Journal, 105(1), 11-30.
Hudson, T. (1983). Correspondences and numerical differences between disjoint sets. Child Development, 54, 84-90.
Imbens-Bailey, A., & Castellon-Wellington, M. (1999, September). Linguistic demands of test items used to assess ELL students. Paper presented at the annual conference of the National Center for Evaluation, Standards, and Student Testing (CRESST), Los Angeles, CA.
Ireson, J., Hallam, S., Hack, S., Clark, H., & Plewis, I. (2002). Ability grouping in English secondary school: Effects on attainment in English, mathematics, and science. Educational Research and Evaluation: An International Journal on Theory and Practice, 8(3), 299-318.
Kim, S., & Hocevar, D. (1998). Racial differences in eighth-grade mathematics: achievement and opportunity to learn. Clearing House, 71(3), 175-178.
Kindler, A. L. (2002). Survey of the states’ limited English proficient students & available educational programs and services, 2000-2001 Summary Report. Washington DC: National Clearinghouse for English Language Acquisition and Language Instruction Educational Programs.
Kiplinger, V. L., Haug, C. A., & Abedi, J. (2000, April). Measuring math – not reading – on a math assessment: A language accommodations study of English language learners and other special populations. Presented at the annual meeting of the American Educational Research Association, New Orleans, LA.
Kopriva, R. (2000). Ensuring accuracy in testing for English language learners. Washington, DC: Council of Chief State School Officers.
Kozol, J. (1992). Savage inequalities: Children in American’s schools. New York: HarperPerennial.
Larsen, S. C., Parker, R. M., & Trenholme, B. (1978). The effects of syntactic complexity upon arithmetic performance. Educational Studies in Mathematics, 21, 83-90.
Lubienski, S. T., & Shelley, M. C. (2003, April). A closer look at US mathematics instruction and achievement: Examinations of race and SES in a decade of NAEP data. Paper presented at the annual meeting of the American Educational Research Association, Chicago, IL.
83
Maihoff, N. A. (2002, June). Using Delaware data in making decisions regarding the education of LEP students. Paper presented at the Council of Chief State School Officers 32nd Annual National Conference on Large-Scale Assessment, Palm Desert, CA.
Masini, B. R. (2001, April). Race differences in exposure to algebra and geometry among U.A. eighth-grade students. Paper presented at the annual meeting of the American Educational Research Association, Seattle, WA.
McDonnell, L. M. (1995). Opportunity to learn as a research concept and policy instrument. Educational Evaluation and Policy Analysis, 17(3), 305-322.
McDonnell, L. M., Burstein, L., Ormseth, T., Catterall, J. M., & Moody, D. (1990). Discovering what schools really teach: Designing improved coursework indicators (CSE Tech Rep. No. 338). Los Angeles: University of California, Center for the Study of Evaluation.
Meara, P. (1996). The dimensions of lexical competence. In G. Brown, K. Malmkjaer, & J. Williams (Eds.), Performance and competence in second language acquisition (pp. 35-53). Cambridge, UK: Cambridge University Press.
Meara, P., & Buxton, B. (1987). An alternative to multiple choice vocabulary test. Language Testing, 4, 142-154.
Meara, P., & Jones, G. (1988). Vocabulary size as a placement indicator. In P. Grunwell (Ed.), Applied linguistics in society (pp. 80-87). London: Centre for Information on Language Teaching and Research.
Messick, S. (1994). The interplay of evidence and consequences in the validation of performance assessments. Educational Researcher, 23(2), 13-23.
Mestre, J. P. (1988). The role of language comprehension in mathematics and problem solving. In R. R. Cocking & J. P. Mestre (Eds.), Linguistic and cultural influences on learning mathematics (pp. 200-220). Hillsdale, NJ: Erlbaum.
Minicucci, C. (1996). Learning science and English: How school reform advances scientific learning for limited English proficient middle school students (Educational Practice Report No. 17). Santa Cruz: University of California, National Center for Research on Cultural Diversity and Second Language Learning.
Moore, K. A., & Redd, Z. (2002). Children in poverty: Trends, consequences, and policy options (Research Brief No. 2002-54). Washington, DC: Child Trends, Inc.
84
Muthen, B., Huang, L., Jo, B., Khoo, S., Goff, G. N., Novak, J., & Shih, J. (1995). Opportunity-to-learn effects on achievement: analytical aspects. Los Angeles: University of California, National Center for Research on Evaluation, Standards, and Student Testing.
No Child Left Behind Act of 2001, Pub. L. No. 107-110, 115 Stat. 1425 (2002).
Oakes, J. (1990). Multiplying inequalities: The effects of race, social class, and tracking on opportunities to learn mathematics and science (Report No. NSF-R-3928). Washington, D.C.: National Science Foundation.
Oakes, J. (1992). Can tracking research inform practice? Technical, normative, and political considerations. Educational Researcher, 21(4), 12-21.
Padron, Y. (1999). Improving opportunities and access to mathematics learning in the early years. In J. Copley (Ed.), Mathematics in the early years (pp. 191-197). Reston, VA: National Council of Teachers in Mathematics.
Perie, M., Grigg, W., & Dion, G. (2005). The nation’s report card: Mathematics 2005 (NCES 2006-453). Washington, DC: U.S. Department of Education, National Center for Education Statistics, U.S. Government Printing Office.
Porter, A. C. (1991). Creating a system of school process indicators. Educational Evaluation and Policy Analysis, 13(1), 13-29.
Porter, A. C. (1993). Opportunity to learn (Brief No. 7). University of Wisconsin-Madison, Center on Organization and Restructuring of Schools.
Porter, A. C. (1995). The uses and misuses of opportunity-to-learn standards. Educational Researcher, 24(1), 21-27.
Porter, A. C. (2002). Measuring the content of instruction: Uses in research and practice. Educational Researcher, 31(7), 3-14.
Read, J. (2000). Assessing vocabulary. New York: Cambridge University Press.
Riley, M. S., Greeno, J. G., & Heller, J. I. (1983). Development of children’s problem-solving ability in arithmetic. In H. P. Ginsburg (Ed.), The development of mathematical thinking (pp. 153-196). New York: Academic Press.
Rivera, C., & Stansfield, C. W. (2001, April). The effects of linguistic simplification of science test items on performance of limited English proficient and monolingual English-speaking students. Paper presented at the annual meeting of the American Educational Research Association, Seattle, WA.
85
Rivera, C. & Stansfield, C. W. (2004). The effect of linguistic simplification of science test items on score comparability. Educational Assessment, 9(3-4), 79-105.
Rivera, C., Stansfield, C. W., Scialdone, L., & Sharkey, M. (2000). An analysis of state policies for the inclusion and accommodation of English language learners in state assessment programs during 1998-1999. Arlington, VA: The George Washington University, Center for Equity and Excellence in Education.
Rubin, B. C., & Noguera, P. A. (2004). Tracking detracking: Sorting through the dilemmas and possibilities of detracking in practice. Equity & Excellence in Education, 37(1), 92-101.
Schmidt, W. H., Houang, R. T., & Cogan, L. S. (2002). A coherent curriculum: The case of mathematics. American Educator, 26(2), 10-26, 47.
Schmidt, W. H., & McKnight, C. C. (1997). A splintered vision: An investigation of U.S. science and mathematics education. Dordrecht, NL: Kluwer.
Schwartz, W. (1995). Opportunity to learn standards: Their impact on urban students (ERIC/CUE Digest No. 110, Report No. EDO-UD-95-7). New York, NY: ERIC Clearinghouse on Urban Education. (ERIC Document Reproduction Service No. ED389816)
Serpa, F. A. (2001). Limited-English-proficient students in Maine: An assessment of equal educational opportunities. Maine Advisory Committee to the U.S. Commission on Civil Rights.
Short, D. J. (2000). The ESL standards: Bridging the academic gap for English language learners (ERIC Digest Report No. EDO-FL-00-13). Washington, DC: ERIC Clearinghouse on Languages and Linguistics. (ERIC Document Reproduction Service No. ED447728)
Shuard, H., & Rothery, A. (Eds.). (1984). Children reading mathematics. London: J. Murray.
Sireci, S. G., & Khaliq, S. N. (2002). An analysis of the psychometric properties of dual-language test forms (Center for Educational Assessment Research Report No. 458). Amherst, MA: School of Education, University of Massachusetts, Amherst.
Smithson, J. L., Porter, A. C., & Blank, R. K. (1995). Describing the enacted curriculum: Development and dissemination of opportunity to learn indicators in science education. Washington, DC: Council of Chief State School Officers.
86
Snow-Renner, R. (1998, April). Mathematics assessment practices in Colorado classrooms: Implications about variations in capacity and students’ opportunities to learn. Paper presented at the annual meeting of the American Educational Research Association, San Diego, CA.
Snow-Renner, R. (2001, April). What is the promise of large-scale classroom practice measures for informing us about equity in student opportunities-to-learn? An example using the Colorado TIMSS. Paper presented at the annual meeting of the American Educational Research Association, Seattle, WA.
Solano-Flores, G., & Trumbull, E. (2003). Examining language in context: The need for new research and practice paradigms in the testing of English-language learners. Educational Researcher, 32(2), 3–13.
Solano-Flores, G., Trumbull, E., & Nelson-Barber, S. (2002). Concurrent development of dual-language assessments: An alternative to translating tests for linguistic minorities. International Journal of Testing, 2(2), 107-129.
Stanford Working Group (1993, June). Federal education programs for limited English proficient students: A blueprint for the second generation. Palo Alto, CA: Stanford University, School of Education.
Starratt, R. J. (2003). Opportunity to learn and the accountability agenda. Phi Delta Kappan, 85(4), 298-303.
Stevens, F. I. (1996, April). The need to expand the opportunity to learn conceptual framework: Should students, parents, and school resources be included? Paper presented at the annual meeting of the American Educational Research Association, New York, NY.
Stevens, F. I., Wiltz, L., & Bailey, M. (1998). Teachers’ evaluations of the sustainability of opportunity to learn (OTL) assessment strategies. A national survey of classroom teachers in large urban school districts. Philadelphia, PA: Temple University, Laboratory for Student Success/Center for Research in Human Development and Education.
Tate, W. (1995). Mathematics communication: Creating opportunities to learn. Teaching Children Mathematics, 1(6), 344-349, 369.
Tate, W. (2001). Science education as a civil right: Urban schools and opportunity-to-learn considerations. Journal of Research in Science Teaching, 38(9), 1015-1028.
Thompson, F. T. (2002). Student achievement, selected environmental characteristics, and neighborhood type. Urban Review, 34(3), 277-292.
87
88
Tippeconnic, J. W., III, & Faircloth, S. C. (2002). Using culturally and linguistically appropriate assessments to ensure that American Indian and Alaska Native students receive the special education programs and services they need (EDO-RC-02-8). Charleston, WV: ERIC Clearinghouse on Rural Education and Small Schools.
Vygotsky, L. S. (1978). Mind in society: The development of higher psychological processes. Cambridge, MA: Harvard University Press.
Wang, J., & Goldschmidt, P. (1999). Opportunity to learn, language proficiency, and immigrant status effects on mathematics achievement. Journal of Educational Research, 93(2), 101-111.
Webster, B. J., Young, D. J., & Fisher, D. L. (1999, April). Gender and socioeconomic equity in mathematics and science education: a comparative study. Paper presented at the annual meeting of the American Educational Research Association, Montreal, Quebec, Canada.
Wiley, D. E., & Yoon, B. (1995, April). Teacher reports on opportunity to learn: Analyses of the 1993 California Learning Assessment System (CLAS). Paper presented at the annual meeting of the American Educational Research Association, San Francisco, CA.
Williams, J. A. (2001). Classroom conversations: Opportunities to learn for ESL students in mainstream classrooms. Reading Teacher, 54(8), 750-757.
Winfield, L. F. (1993). Investigating test content and curriculum content overlap to assess opportunity to learn. Journal of Negro Education, 62(3), 288-310.
Wood, T. (2001). Teaching differently: Creating opportunities for learning mathematics. Theory into Practice, 40(2), 110-117.
Yoon, B., & Resnick, L. B. (1998). Instructional validity, opportunity to learn and equity: New standards examinations for the California mathematics renaissance (CSE Tech. Rep. No. 484). Los Angeles, CA: National Center for Research on Evaluation, Standards, and Student Testing.
Ysseldyke, J., Thurlow, M., & Shin, H. (1995). Opportunity-to-learn standards (Policy Directions No. 4). Minneapolis: University of Minnesota, National Center on Educational Outcomes.